system-wide ecological indicators for everglades restoration
TRANSCRIPT
1
2010 Report
System-wide Ecological Indicators for
Everglades Restoration
ii
This Document
The South Florida Ecosystem Restoration Task Force Authorized by Congress, the South Florida Ecosystem Restoration Task Force (Task Force) brings together the federal, state, tribal, and local agencies involved in restoring and protecting the Everglades. The role of the in-tergovernmental Task Force is to facilitate the coordination of the myriad conservation and restoration efforts being planned and implemented. It provides a forum for the participating agencies to share information about their restoration projects, resolve conflicts, and report on progress. The Task Force has established a suite of system-wide ecological indicators to assess current ecosystem health and provide a means to track ecosystem response to restoration. This suite of system-wide ecological indicators was developed specifically to provide a big picture view of restoration, and the ecosystem’s health and re-sponse, for the Task Force and Congress.
Report Purpose Studies have shown that by identifying a limited number of focal conservation targets and their key ecological attributes, we can improve the successful use and interpretation of ecological information for managers and pol-icy makers and enhance decision-making. The purpose of this report is to provide a synopsis of highly technical and complex topics in a manner that is easy to read and interpret. The target audiences of the report are the lay reader and decision makers. We hope that this synopsis will further the understanding and appreciation of the Everglades and its restoration, and provide policy makers science information in a form that will be useful to them in making important restoration decisions. This report should provide the reader with a straightforward un-derstanding of the most important problems in Everglades restoration as told to us through the science of the suite of eleven system-wide ecological indicators. Cover photograph courtesy of Dr. William Perry, Everglades National Park.
iii
Table of Contents
Executive Summary .................................................................................................................... iv
Background .................................................................................................................................. 1
Indicator Overview ....................................................................................................................... 6
Fish and Macroinvertebrates ....................................................................................................... 8
Wading Birds (Wood Stork and White Ibis) ............................................................................... 12
Wading Birds (Roseate Spoonbill) ............................................................................................. 14
Florida Bay Submersed Aquatic Vegetation .............................................................................. 18
Florida Bay Algal Blooms ........................................................................................................... 20
Crocodilians (American Alligators and Crocodiles) .................................................................... 24
Oysters ...................................................................................................................................... 26
Periphyton & Epiphyton ............................................................................................................. 28
Juvenile Pink Shrimp ................................................................................................................. 30
Lake Okeechobee Nearshore Zone ........................................................................................... 32
Invasive Exotic Species ............................................................................................................. 34
Literature Cited .......................................................................................................................... 38
Principal Scientists ..................................................................................................................... 39
iv
Executive Summary
E cological indicators are used to communicate information about ecosystems and the impact
human activity has on them. Ecosystems are com-plex and ecological indicators can help describe them in simpler terms. For example, the total number of different fish species found in an area can be used as an indicator of biodiversity. There are many different types of indicators. They can be used to reflect a variety of aspects of ecosys-tems, including biological, chemical, and physical. Due to this diversity, the development and selection of ecological indicators is a complex process. National indicators for pollution (for example the ozone index one sees on the daily news) and the economy (for example the gross domestic product reported daily in the news as the measure of national income and output) have been used for decades to convey complex scientific and economic principles and data into easily understandable concepts. Many ecological restoration initiatives globally and nationally are either currently using or developing ecological indicators to assist them in grading eco-logical conditions. A few of the larger US restoration programs that are developing and using ecological indicators include Chesapeake Bay, Maryland; San Francisco Bay-Delta-River System, California; Yel-lowstone National Park, Montana; Columbia River, Oregon; and the South Florida Ecosystem Restora-tion Program. Indicators make understanding an ecosystem possi-ble in terms of management, time, and costs. For example, it would be far too expensive, perhaps even impossible, to count every animal and plant in the Everglades to see if the restoration was a success. Instead, a few indicator species can be monitored in a relatively few locations to determine the success of the restoration. Indicators can be developed to evalu-ate very specific things or regions, or to evaluate broad system-wide aspects of an ecosystem.
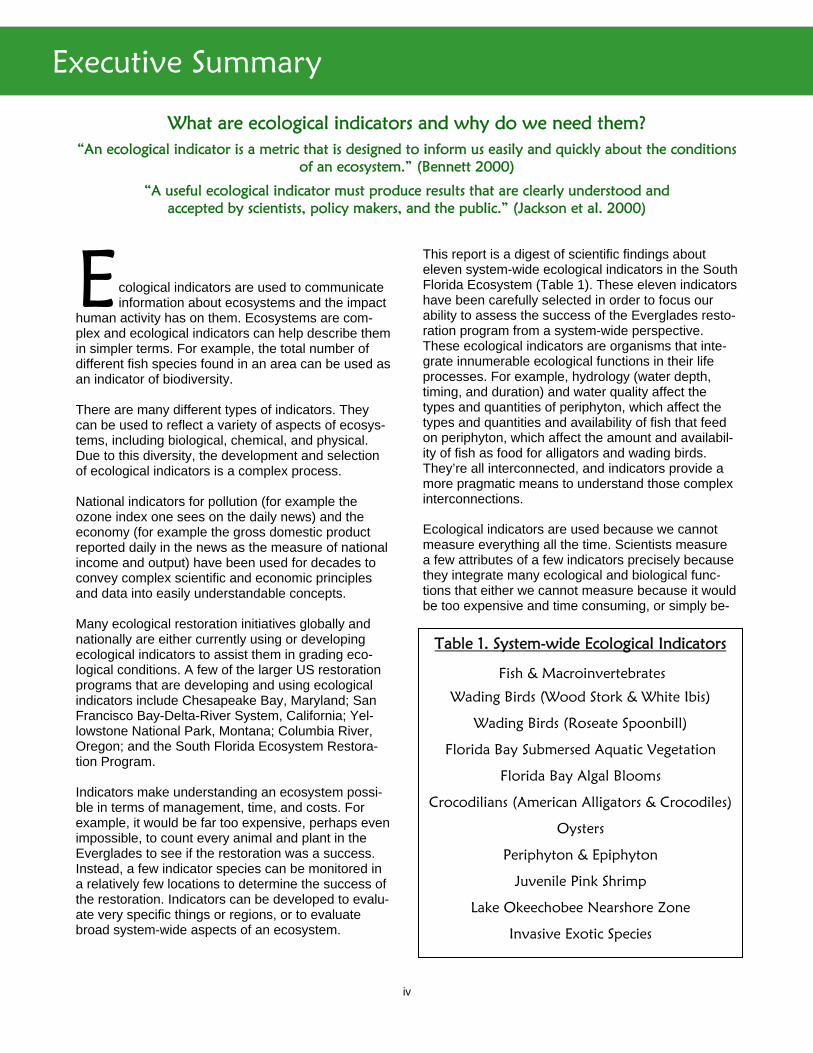
This report is a digest of scientific findings about eleven system-wide ecological indicators in the South Florida Ecosystem (Table 1). These eleven indicators have been carefully selected in order to focus our ability to assess the success of the Everglades resto-ration program from a system-wide perspective. These ecological indicators are organisms that inte-grate innumerable ecological functions in their life processes. For example, hydrology (water depth, timing, and duration) and water quality affect the types and quantities of periphyton, which affect the types and quantities and availability of fish that feed on periphyton, which affect the amount and availabil-ity of fish as food for alligators and wading birds. They’re all interconnected, and indicators provide a more pragmatic means to understand those complex interconnections. Ecological indicators are used because we cannot measure everything all the time. Scientists measure a few attributes of a few indicators precisely because they integrate many ecological and biological func-tions that either we cannot measure because it would be too expensive and time consuming, or simply be-
What are ecological indicators and why do we need them?
“An ecological indicator is a metric that is designed to inform us easily and quickly about the conditions of an ecosystem.” (Bennett 2000)
“A useful ecological indicator must produce results that are clearly understood and accepted by scientists, policy makers, and the public.” (Jackson et al. 2000)
Table 1. System-wide Ecological Indicators
Fish & Macroinvertebrates
Wading Birds (Wood Stork & White Ibis)
Wading Birds (Roseate Spoonbill)
Florida Bay Submersed Aquatic Vegetation
Florida Bay Algal Blooms
Crocodilians (American Alligators & Crocodiles)
Oysters
Periphyton & Epiphyton
Juvenile Pink Shrimp
Lake Okeechobee Nearshore Zone
Invasive Exotic Species

v
Executive Summary, continued
cause some things are too difficult to measure. Thus—through measuring more simple aspects of the lives of key organisms—we are able to take into account the innumerable biogeochemical and envi-ronmental processes they integrate and, through more simple and affordable research and monitoring, we can begin to understand how indicators may re-spond to ecosystem drivers and stressors such as rainfall, hydrology, salinity, water management, nutri-ents, and exotic species.
What the System-wide Ecological Indi-cators Collectively Tell Us about the Everglades… The Really Big Picture These indicators are key organisms that we know (through research and monitoring) respond to envi-ronmental conditions in ways that allow us to meas-ure their responses in relation to restoration activities. Because of this, we also may see similar ecological responses among indicators. This logical agreement among indicators—a collective response, if you will—could help us understand how drivers and stressors act on more than one indicator and provides a better system-wide awareness of the overall status of resto-ration as reflected in the ecological responses of these indicators. The more indicators that collectively respond to the drivers and stressors, the stronger the signal that the underlying problem is ubiquitous to the system and is affecting the fundamental ecological and biological nature of the Everglades ecosystem. Fixing these things is key to fixing the Everglades. The big picture findings below stem from these col-lective responses and are clustered according to the organisms that responded to environmental condi-tions similarly. For example, while Spoonbills, Alliga-tors, and Periphyton may appear to be unrelated, they are directly related through their biological and ecological responses to environmental drivers. The following are the big picture findings that were common to more than one indicator, and to large, important regions of the natural system. Water management and water structures still matter the most. As shown by many of the indica-tors, the regions of the Everglades that are most in-sulated or removed from the effects (actions or im-pacts) of water management and water management structures appear to be relatively more stable ecol-ogically and biologically and generally are the most
amenable to the sustenance and restoration of Ever-glades species. Conversely those regions that are most impacted by water releases (management) and water management structures are the most erratic and unstable hydrologically and ecologically and the most unfavorable for Everglades species. Where improvements in water management op-erations have been implemented, improvements for some species have been documented. Water management targets in the central and southern Ev-erglades marshes were closer to hydrological targets this reporting period than in the last six years. Result-ing water management improvements in Taylor Slough have shown improvements in the Fish and Macroinvertebrates (e.g., crayfish) indicator for the region. However, scientists are documenting in-creased nutrient concentrations in upper Taylor Slough as a result of the movement of nutrients into upper Taylor Slough with the added water flow as shown by the Periphyton indicator. As restoration efforts continue, the science learned from updated indicator reports should be used to help managers and scientists determine how to evaluate potential benefits and impacts of different restoration alterna-tives. Wading Bird populations (specifically White Ibis) have shown substantial improvements in both timing of nesting, production of young, and increase in Ibis “super colony” occurrence. When water man-agement and nature work together to provide for more “natural” abundance and distribution of water, some Everglades species respond positively. While water levels were generally lower than predicted by rainfall, water management provided for a consistent dry-down with virtually no rapid reversals in water levels in the central and southern marshes during this reporting period. This provided for good conditions for Wading Birds (Wood Storks and White Ibis) and aquatic prey availability. Where no improvements in water management operations have been implemented, species tar-gets continued to remain low or decline. Most of the indicators show no substantial change from the previous report. These indicators are either stable, but well below target levels, or are still showing a de-cline away from targets. Oysters, Roseate Spoonbills (northeast regions of Florida Bay), Pink Shrimp, Sub-mersed Aquatic Vegetation (Transition Zones), and Alligators and Crocodiles (all regions except Loxahat-chee), all clearly show that water management op-erations and the availability of water during both the wet and dry seasons continue to be the limiting fac-

vi
Executive Summary, continued
tors for species sustainability and recovery. Excess (too much) water at the wrong times and in the wrong places, or insufficient (too little) water most of the time in most areas, along with rapid reversals in wa-ter (either during marsh flooding or draining) are still causing most of the indicators to continue to remain unchanged and below targets overall. This continues to be the situation throughout most of the Ever-glades. Phosphorus continues to be a serious concern. Periphyton shows that areas near water manage-ment structures are higher in phosphorus than areas farther removed from structures. Movement of phos-phorus into some southern areas that have been relatively free of phosphorus pollution is resulting in the documentation of increased impacts, as seen by the increase in nutrient concentrations in upper Tay-lor Slough. Water flows are key to the restoration of the Everglades, but more water with too much phos-phorus continues to be one of the main problems complicating the need for more water.
There is still too little water everywhere in the dry season, most areas have way too little water in the wet season while some impounded areas have way too much water in the wet season; the timing of water releases is still causing large problems. All the indicators, including the additional metrics evaluated in the Restoration Coordination and Verification (RECOVER) System Status Report that are not reported here, clearly show that the Ever-glades ecosystem is still not getting enough water, and that in many locations that water is subject to management operations that cause serious harm to the ecosystem and the indicators by either piling wa-ter in areas that should not be so wet, or drying areas that need water. Oysters and Lake Okeechobee Nearshore Zone clearly show negative impacts from water management actions that cause rapid changes in water volume and in timing of water releases. Cur-rent water management practices have not demon-strated “good” hydrological conditions to occur over multiple successive years across the entire land-scape, a situation that is essential to the sustenance and recovery of the indicator species, particularly Wading Birds, Crocodilians, Pink Shrimp, Fish, and Oysters.
Many ecosystem components and species across the Everglades have the capacity to be resilient (although resilience is not explicitly measured). For some large regions of the Ever-
glades, both variability in natural environmental con-ditions and water management operations have worked synergistically together this past reporting cycle with indicators in some regions showing good recovery and generally green stoplights in those re-gions: Roseate Spoonbill (northwest Florida Bay Colonies), Wading Birds (Wood Storks and White Ibis, headwaters and estuarine areas), Florida Bay Submersed Aquatic Vegetation (Central Bay Re-gions), and Fish and Macroinvertebrates (Taylor Slough fish populations; macroinvertebrates in Water Conservation Area 3 and Taylor Slough). This shows clearly the potential resilience of these ecosystem components and how rapidly species will take advan-tage of “good” conditions in the ecosystem, espe-cially if those conditions are “good” consistently and consecutively over a number of years.
Predominant Themes The really big predominant themes we can discern from the collective responses of these indicators in-clude the following: Due to water management not delivering enough
water, and also draining needed water away, the Everglades, as a whole, is not getting nearly enough water in either the wet or dry seasons and the southern portions of the Everglades sys-tem are most affected in this regard.
Water management often causes extremes, and
reversals, in water levels in both the wet and dry seasons in the natural system—either too wet or too dry—as water is moved around for human consumption and flood protection. Both of these hydrological extremes have caused deterioration of the natural system.
The Everglades have been polluted with phos-
phorus, the effects are worst in the northern parts of the system where most of the nutrients are entering, and care must be taken to avoid ex-tending that pollution to unimpacted areas.
All of these major problems, and more, are reflected in the preponderance of red and yellow stoplights in the individual stoplight reports. Over the past two years, four restoration project groundbreakings have occurred. As such, we would not yet expect to see a preponderance of system-wide trends moving to-wards more yellow and green stoplights at this time.

1
Background
A ny method of communicating complex sci-entific issues and findings to non-scientists
must: 1) be developed with consideration for the spe-cific audience, 2) be transparent as to how the sci-ence was used to generate the summary findings, 3) be reasonably easy to follow the simplified results back through the analyses and data to see a clear and unambiguous connection to the information used to roll-up the results, 4) maintain the credibility of the scientific results without either minimizing or distort-ing the science, and 5) should not be, or appear to be, simply a judgment call (Norton 1998, Dale and Beyeler 2001, Niemi and McDonald 2004, Dennison et al. 2007). In reviewing the literature on communi-cating science to non-scientists we realized that the system of communication we developed for this suite of system-wide ecological indicators must be effec-tive in quickly and accurately getting the point across to our audience in order for our information to be used effectively (Rowan 1991, 1992, Dunwoody 1992, Weigold 2001, Thomas et al. 2006, Dennison et al. 2007). This suite of system-wide ecological indicators has been developed specifically to provide a mountaintop view of restoration for the South Florida Ecosystem Restoration Task Force (Task Force) and Congress. The approach we used to select these indicators fo-cused on individual indicators that integrated numer-ous physical, biological, and ecological properties, scales, processes, and interactions to try to capture that sweeping mountaintop view. Based on the avail-able science, we made the underlying assumption that these indicators integrated many additional eco-logical and biological functions that were not or could not be measured and thus provided an assessment of innumerable ecological components that these indicators integrated in their life processes. Having too many indicators is recognized as one of the more important problems with using and commu-nicating them (National Research Council 2000, Par-rish et al. 2003). Identifying a limited number of focal conservation targets and their key ecological attrib-utes improves the successful use and interpretation of ecological information for managers and policy makers and enhances decision making (Schiller et al. 2001, Parrish et al. 2003, Dennison et al. 2007). The Task Force (see: www.sfrestore.org), estab-lished by section 528(f) of the Water Resources De-
velopment Act (WRDA) of 1996 consists of 14 mem-bers. There are seven federal, two tribal, and five state and local government representatives. The main duties of the Task Force are to provide a coor-dinating organization to help harmonize the activities of the agencies involved with Everglades restoration. The Task Force requested that the Science Coordi-nation Group (a team of scientists and managers) develop a small set of system-wide ecological indica-tors (Table 1) that will help them understand in the broadest terms how the ecosystem, and key compo-nents, are responding to restoration and manage-ment activities via implementation of the Comprehen-sive Everglades Restoration Program (CERP) (see:www.evergladesplan.org), guided by the RE-COVER team (see: http://www.evergladesplan.org/pm/recover/recover.aspx), and other non-CERP res-toration teams and projects (see: www.sfrestore.org). The CERP and RECOVER programs are and will be monitoring many additional aspects of the ecosys-tem, including such things as: rare and endangered species, mercury, water levels, water flows, storm-water releases, dissolved oxygen, soil accretion and loss, phosphorus concentrations in soil and water, algal blooms in Lake Okeechobee, hydrologic sheet flow, increased spatial extent of flooded areas through land purchases, percent of landscape inun-dated, tree islands, salinity, and many more. The set of indicators included here are a subset from a larger
Table 1. System-wide Ecological Indicators
Fish & Macroinvertebrates
Wading Birds (Wood Stork & White Ibis)
Wading Birds (Roseate Spoonbill)
Florida Bay Submersed Aquatic Vegetation
Florida Bay Algal Blooms
Crocodilians (American Alligators & Crocodiles)
Oysters
Periphyton & Epiphyton
Juvenile Pink Shrimp
Lake Okeechobee Nearshore Zone
Invasive Exotic Species
2
Background, continued
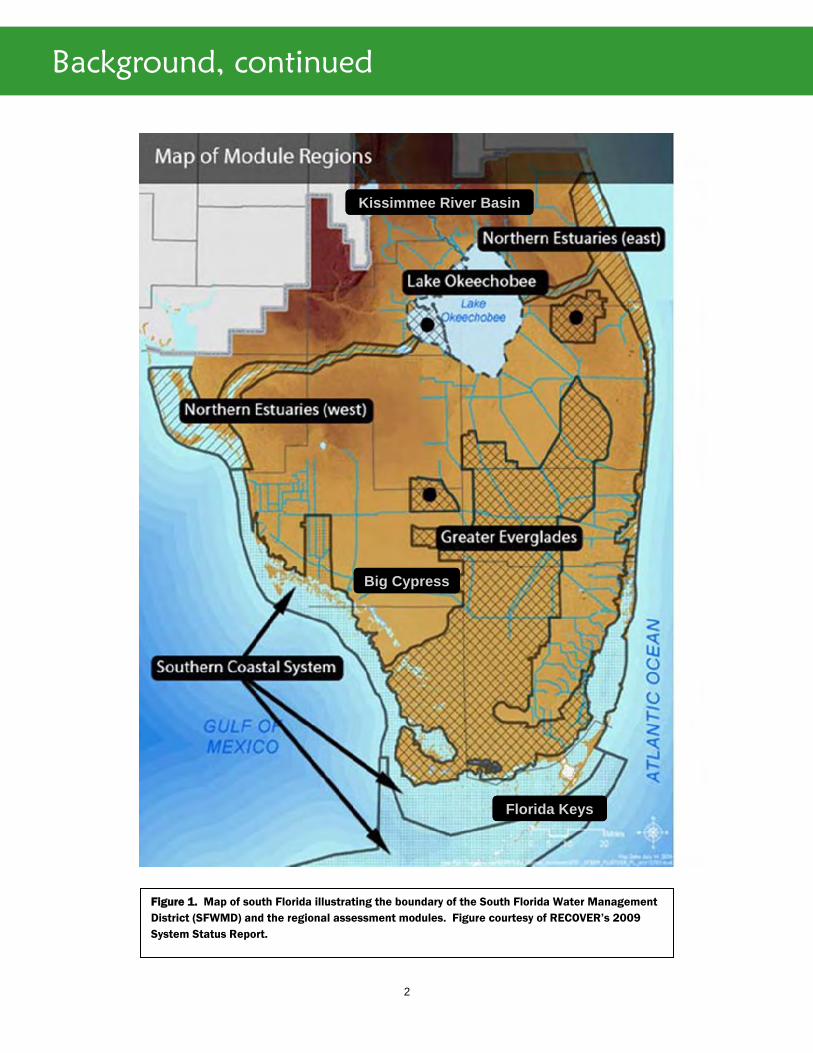
Figure 1. Map of south Florida illustrating the boundary of the South Florida Water Management District (SFWMD) and the regional assessment modules. Figure courtesy of RECOVER’s 2009 System Status Report.
Florida Keys
Kissimmee River Basin
Big Cypress

3
Figure 2. The suite of system-wide ecological indi-cators was chosen based upon their collective abil-ity to comprehensively reflect ecosystem response in terms of space and time. For example, Periphy-ton responds to change very rapidly at both small and large spatial scales while Crocodilians respond more slowly to change and at larger spatial scales. As indicators, they “cover” different aspects of the ecosystem. The system-wide ecological indicators collectively “cover” the ecosystem in terms of re-sponse to change over space and time. This figure is an illustration of how individual indi-cators may interrelate and respond to restoration in terms of space and time. This figure uses six indica-tors as an example and is not meant to precisely represent the exact spatial and temporal interac-tions of the system-wide ecological indicators.
Background, continued
monitoring and assessment program. They are in-tended to provide a system-wide, big-picture ap-praisal of restoration. Many additional indicators have been established that provide a broader array of pa-rameters. Some of these are intended to evaluate sub-regional elements of the ecosystem (e.g., individ-ual habitat types), and others are designed to evalu-ate individual CERP projects (e.g., water treatment areas). This combination of indicators will afford man-agers information for adjusting restoration activities at both large and small scales. Our goal has been to develop a suite of indicators composed of an elegant few (Table 1) that would achieve a balance among: feasibility of collecting in-formation, sufficient and suitable information to accu-rately assess ecological conditions, and relevance for communicating the information in an effective, credi-ble, and persuasive manner to decision makers. For the purposes of this set of indicators, "system-wide" is characterized by both the physiographic and eco-logical elements that include: the boundary of the South Florida Water Management District and as-sessment modules (Figure 1), and the ecological links among key organisms (see Wetlands special issue 2005 for examples of the Conceptual Ecologi-cal Models (CEM)) (Figure 2). In addition, these indicators will help evaluate the ecological changes resulting from the implementation of the restoration projects and provide information and context by which to adapt and improve, add, re-place, or remove indicators as new scientific informa-tion and findings become available. Indicator re-sponses will also help determine appropriate system operations necessary to attain structural and func-tional goals for multiple habitat types among varying components of the Everglades system. Using a suite of system-wide ecological indicators (Table 1) to present highly aggregated ecological information requires indicators that cover the spatial and temporal scales and features of the ecosystem they are intended to represent and characterize (Table 2). While individual indicators can help deci-sion makers adaptively manage at the local scale or for particular restoration projects, collectively, indica-tors can help decision makers assess restoration at the system scale. We chose stoplights to depict indicator status. There are many different methods that are being used to communicate scientific information in easier-to-
understand formats. We evaluated numerous meth-ods and ideas on organizing and communicating complex science and found many helpful ideas. We also noted that most methods were, in the end, still quite complex, and it took more information and ex-planation to understand the method than we felt made sense if the goal was to make things easier to understand. Therefore, we chose to use one of the most clear-cut and universally understood symbols—the stoplight—with a simple and straightforward find-ings page to provide a reasonable context for the stoplights.

4
Background
Table 2. List of South Florida Ecosystem Features
Landscape Characteristics
Hydropatterns Hydroperiods Vegetation Pattern and Patchiness Productivity Native Biodiversity Oligotrophy (low in nutrients) Pristine-ness Intactness (connectivity/spatial extent) Trophic Balance Habitat Balance/Heterogeneity
Trophic Constituents and Biodiversity
Primary Producers (autotrophs - organisms that obtain energy from light or inorganic com-pounds; and detritus - dead organic material)
Primary Consumers (herbivores and detritivores - animals that eat plants or detritus) Secondary Consumers (animals that feed upon herbivores and detritivores) Tertiary Consumers (animals that feed upon secondary consumers)
Physical Properties
Water Quality Water Management (i.e., when, where, and how much water is moved) Invasive Exotic Species Salinity Nutrients (e.g., Nitrogen, Phosphorus, Sulphur) Contaminants (e.g., pesticides, pharmaceutical chemicals, mercury) Soils
Ecological Regions (see Figure 1)
Greater Everglades Southern Coastal System Northern Estuaries Big Cypress Kissimmee River Basin Lake Okeechobee Florida Keys
Temporal Scales (see Figure 2)
Indicators that respond rapidly to environmental changes (e.g., periphyton) Indicators that respond more slowly to environmental changes (e.g., crocodilians)

5
Background
Stoplight Format Our integrated summary uses colored traffic light symbols that have a message that is instantly recog-nizable, easy to comprehend, and is universally un-derstood. We used this stoplight restoration report card communication system as a common format for all eleven indicators to provide a uniform and harmo-nious method of rolling-up the science into an un-complicated synthesis. This report card effectively evaluates and presents indicator data to managers, policy makers, and the public in a format that is easily understood, provides information-rich visual ele-ments, and is uniform to help standardize assess-ments among the indicators in order to provide more of an apples-to-apples comparison that managers and policy makers seem to prefer (Schiller et al. 2001, Dennison et al. 2007). Research and monitoring data are used to develop a set of metrics for each indicator that can be used as performance measures (for example, the number of alligators per square kilometer) for the indicator, and to develop targets (for example, 2.7 alligators per square kilometer) that can be used to link indicator performance to restoration goals. These metrics and targets are different for each indicator. The stoplight colors are determined for each indicator using 3 steps. First, the ecological status of the indicator is determined by analysis of quantifiable data collected for each performance measure for each indicator (for example, the data might show that on average there are 0.75 alligators per square kilometer). The status of each performance measure is then compared to the restoration targets for the indicators (for example, our target for restoration might be 2.7 alligators per square kilometer). The level of performance is then compared to the thresholds for success or failure in meeting the targets and a stoplight color is assigned (for example, 0.75 alligators per square kilometer indicates a low number of alligators compared to the target of 2.7 per square kilometer and might result in a red stoplight being assigned for this performance measure). These numbers are used for example pur-poses only. All of the stoplights were developed directly from the scientific data and the colors of the stoplights—red, yellow, or green—were determined using clear crite-ria from the results of the data. The performance measures and targets for each indicator are also de-scribed in great detail in the assessments. Because the report is purposely short and succinct, it was not possible to provide information on the approaches used for each indicator in determining thresholds for
the individual colors. However, the assessments clearly show how the scientific findings relate directly to the color of the stoplights, providing a transpar-ency from empirical field data to summary data and graphics and then to the stoplight color. Future ac-tivities by stoplight indicator scientists will include updating data to present condition, examining needed adjustments in the stoplights, and an analy-sis of the stoplight sensitivity to change in environ-mental condition allowing the scientists to know how quickly the stoplights will respond to improved envi-ronmental conditions.
Further Indicator Details This 2010 Report includes a stoplight/key summary status report for each indicator. For more detailed information on these indicators please refer to the Special Issue of Ecological Indicators: Indicators for Everglades Restoration (2008), the Indicators for Restoration Report (2006) available online at www.sfrestore.org, and the RECOVER System Status Report (SSR) which addresses the overall status of the ecosystem relative to system-level hy-potheses, performance measures, and restoration goals. The 2009 SSR provides an integrated assess-ment of RECOVER’s Monitoring and Assessment Plan (MAP) and non-MAP data, spans multiple spa-tial scales, and in some cases decades worth of in-formation. Because of the broad intergovernmental coordination, the SSR incorporates elements of the stoplight indicator update and provides the detailed underlying, data, theory, and analysis used in this report. The 2009 SSR is available on an interactive web page that allows managers, stakeholders, and scientists with varying interests and degrees of tech-nical expertise to easily find the information they need (http://www.evergladesplan.org/pm/ssr_2009/ssr_main.aspx#). This combination of indicator re-ports will provide managers with information they need to adjust restoration activities at both large and small scales.
Stoplight Color Legend
Red Substantial deviations from restoration targets creating severe negative condition that merits action.
Yellow Current situation does not meet restora-tion targets and merits attention.
Green Situation is good and restoration goals or trends have been reached. Continuation of management and monitoring effort is essential to maintain and be able to as-sess “green” status.
6
Indicator Overview
Why these organisms are important as ecological indicators for system-wide assessment of restoration.
Fish & Macroinvertebrates They are critical as a food for predators such as wading birds and alligators. Their density and community composition are correlated with hydrology. They integrate the effects of hydrology in all their life stages. The positive or negative trends of this indicator relative to hydrological changes permit an assessment of
positive or negative trends in restoration.
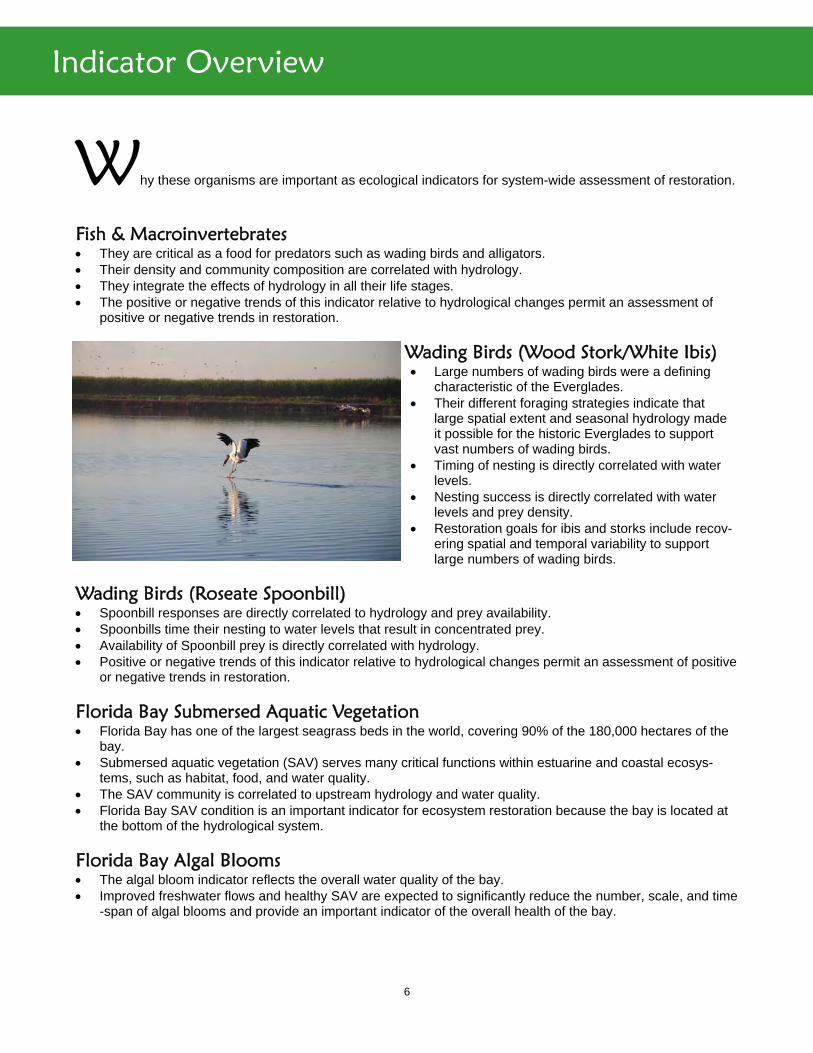
Wading Birds (Wood Stork/White Ibis) Large numbers of wading birds were a defining
characteristic of the Everglades. Their different foraging strategies indicate that
large spatial extent and seasonal hydrology made it possible for the historic Everglades to support vast numbers of wading birds.
Timing of nesting is directly correlated with water levels.
Nesting success is directly correlated with water levels and prey density.
Restoration goals for ibis and storks include recov-ering spatial and temporal variability to support large numbers of wading birds.
Wading Birds (Roseate Spoonbill) Spoonbill responses are directly correlated to hydrology and prey availability. Spoonbills time their nesting to water levels that result in concentrated prey. Availability of Spoonbill prey is directly correlated with hydrology. Positive or negative trends of this indicator relative to hydrological changes permit an assessment of positive
or negative trends in restoration.
Florida Bay Submersed Aquatic Vegetation Florida Bay has one of the largest seagrass beds in the world, covering 90% of the 180,000 hectares of the
bay. Submersed aquatic vegetation (SAV) serves many critical functions within estuarine and coastal ecosys-
tems, such as habitat, food, and water quality. The SAV community is correlated to upstream hydrology and water quality. Florida Bay SAV condition is an important indicator for ecosystem restoration because the bay is located at
the bottom of the hydrological system.
Florida Bay Algal Blooms The algal bloom indicator reflects the overall water quality of the bay. Improved freshwater flows and healthy SAV are expected to significantly reduce the number, scale, and time
-span of algal blooms and provide an important indicator of the overall health of the bay.
7
Indicator Overview, continued
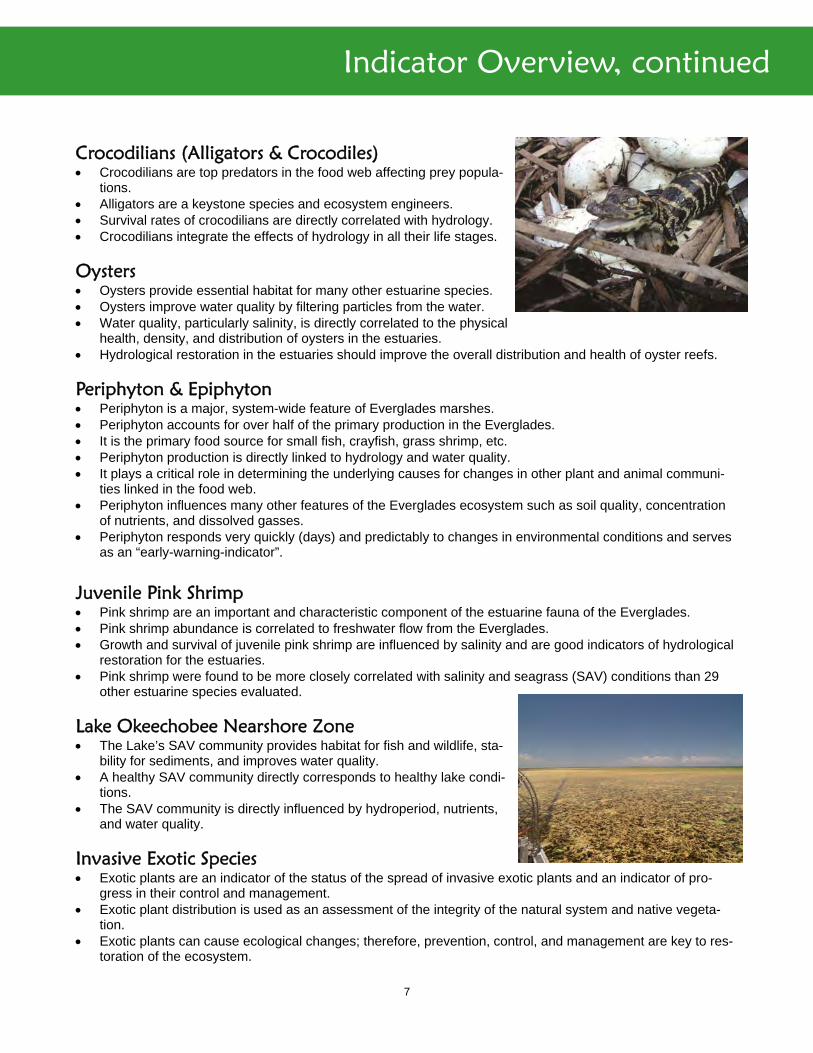
Crocodilians (Alligators & Crocodiles) Crocodilians are top predators in the food web affecting prey popula-
tions. Alligators are a keystone species and ecosystem engineers. Survival rates of crocodilians are directly correlated with hydrology. Crocodilians integrate the effects of hydrology in all their life stages.
Oysters Oysters provide essential habitat for many other estuarine species. Oysters improve water quality by filtering particles from the water. Water quality, particularly salinity, is directly correlated to the physical
health, density, and distribution of oysters in the estuaries. Hydrological restoration in the estuaries should improve the overall distribution and health of oyster reefs.
Periphyton & Epiphyton Periphyton is a major, system-wide feature of Everglades marshes. Periphyton accounts for over half of the primary production in the Everglades. It is the primary food source for small fish, crayfish, grass shrimp, etc. Periphyton production is directly linked to hydrology and water quality. It plays a critical role in determining the underlying causes for changes in other plant and animal communi-
ties linked in the food web. Periphyton influences many other features of the Everglades ecosystem such as soil quality, concentration
of nutrients, and dissolved gasses. Periphyton responds very quickly (days) and predictably to changes in environmental conditions and serves
as an “early-warning-indicator”.
Juvenile Pink Shrimp Pink shrimp are an important and characteristic component of the estuarine fauna of the Everglades. Pink shrimp abundance is correlated to freshwater flow from the Everglades. Growth and survival of juvenile pink shrimp are influenced by salinity and are good indicators of hydrological
restoration for the estuaries. Pink shrimp were found to be more closely correlated with salinity and seagrass (SAV) conditions than 29
other estuarine species evaluated.
Lake Okeechobee Nearshore Zone The Lake’s SAV community provides habitat for fish and wildlife, sta-
bility for sediments, and improves water quality. A healthy SAV community directly corresponds to healthy lake condi-
tions. The SAV community is directly influenced by hydroperiod, nutrients,
and water quality.
Invasive Exotic Species Exotic plants are an indicator of the status of the spread of invasive exotic plants and an indicator of pro-
gress in their control and management. Exotic plant distribution is used as an assessment of the integrity of the natural system and native vegeta-
tion. Exotic plants can cause ecological changes; therefore, prevention, control, and management are key to res-
toration of the ecosystem.

8
Fish & Macroinvertebrates
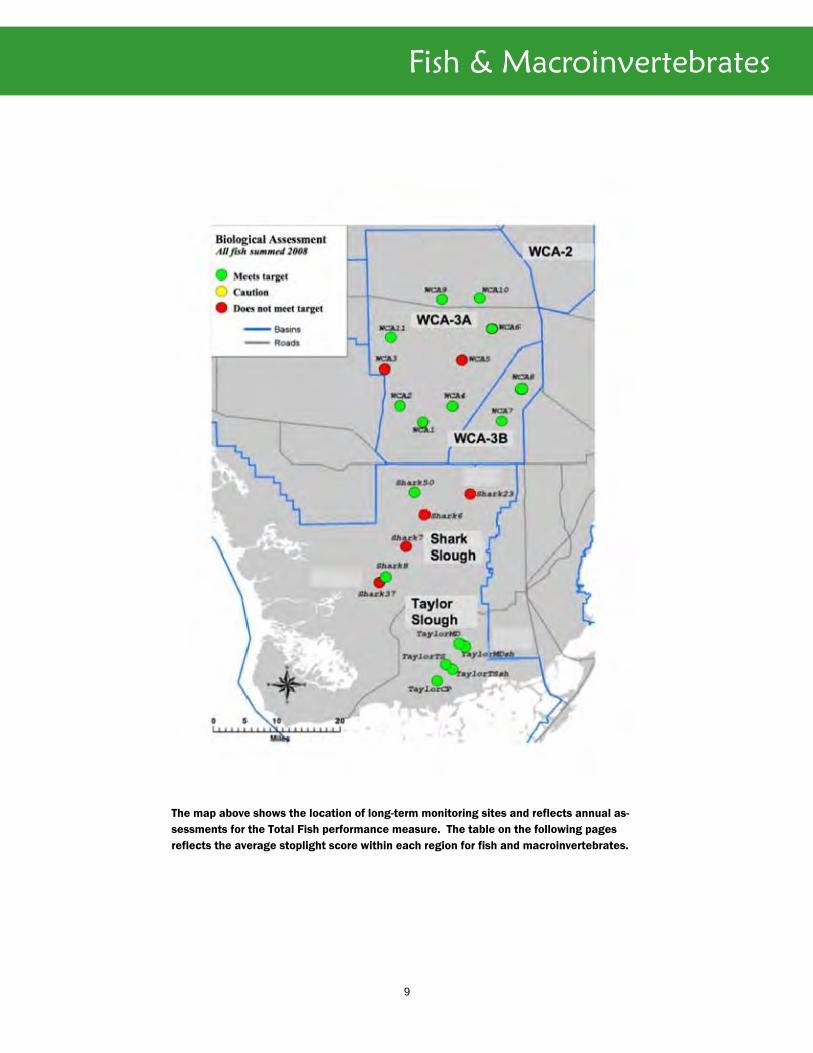
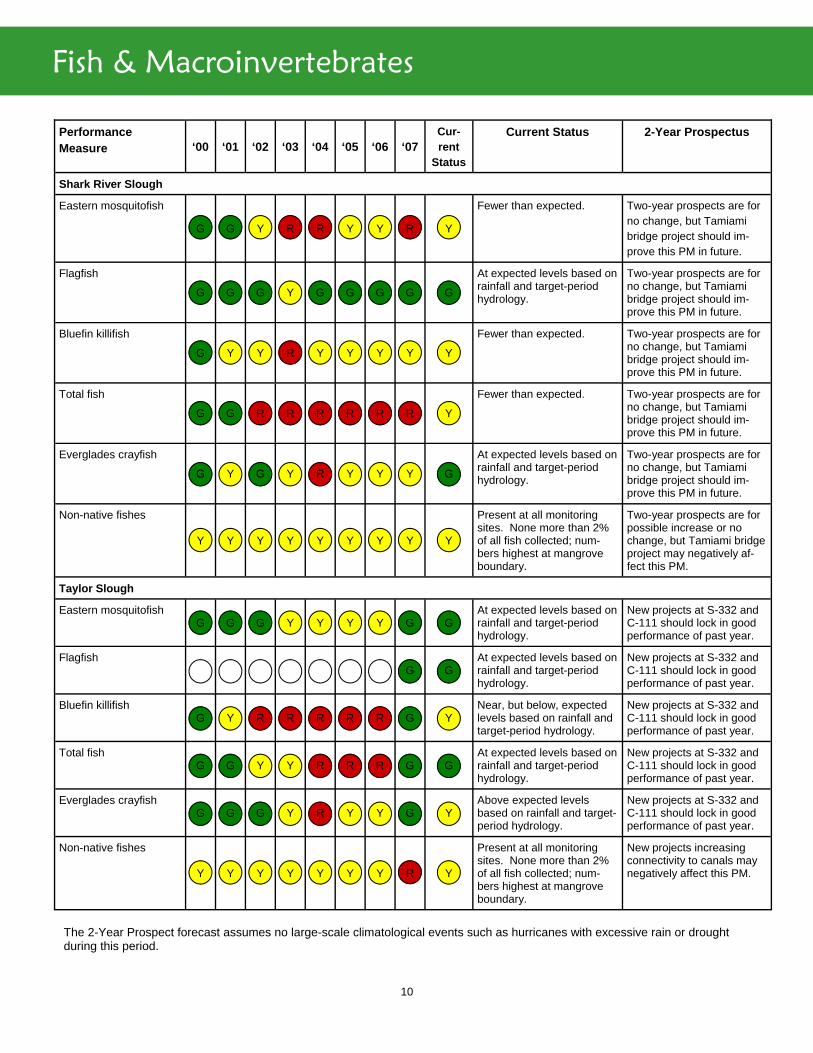
Summary Findings In 2008, four of six monitoring sites in central Shark River Slough did not meet restoration targets (red) because of drier conditions than expected based on rainfall1. The net effect was one of concern (yellow) for the region. These conditions resulted from fewer fish that prefer wetter conditions than expected, but levels of drought-tolerant species were consistent with expectations. Water management is causing drier conditions than would be expected based on the amount of rainfall and water depth patterns in the baseline hydrological period of 1993 through 1999.
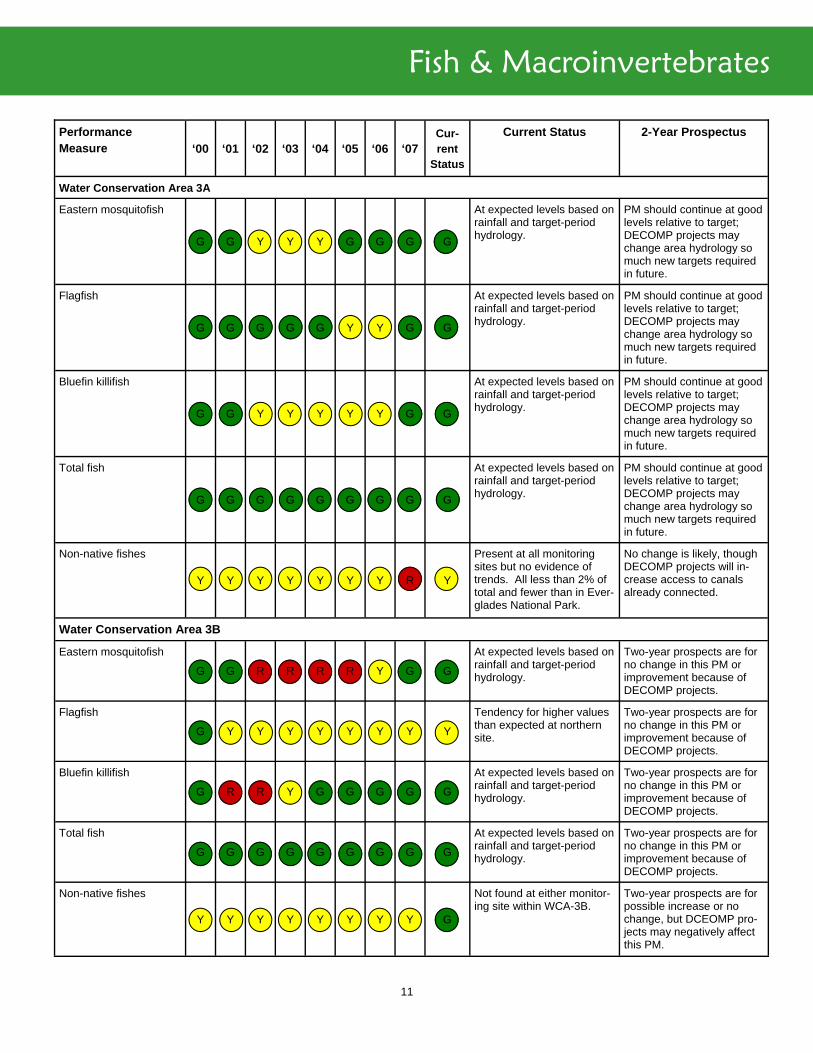
After several years of concern in Taylor Slough, all indicators except non-native fish were within desir-able ranges. Results were mixed in WCA-3A, where two sites yielded fewer fish than expected based on rainfall, but seven others were within desired ranges, as were both monitoring sites in WCA-3B. This long-term monitoring program indicates that water man-agement was closer to targets in 2007 and 2008 than in years 2001 through 2006. Monitoring data indicate that non-native taxa continue to be most common at edge habitats, though widespread in Everglades marshes, and their frequency may be increasing in Taylor Slough. This trend should receive further at-tention.
1The target hydrological years for this assessment include 1993-1999. Forecasting models (statistical models derived by cross-validation methodology) that link regional rainfall to surface water-depth at the monitoring sites were used to model hydrology. Alternative hydrological model outputs, such as those derived by the Natural System Model, generally yield longer target hydroperiods than used here leading to more frequent impacts.
Key Findings 1. All of the sites coded red for fish density resulted
from fewer fish than expected based on observed rainfall, and most are in Shark River Slough.
2. Taylor Slough showed an improvement in 2007 and 2008 compared to previous years (2001-2006).
3. Results were mixed in WCA-3A, though the over-all assessment is acceptable (green). There was evidence of more frequent drying than expected from observed rainfall in the western area. Ever-glades crayfish were infrequently collected in WCA-3A in the baseline period and afterwards.
4. There were no systematic deviations from rainfall-based expectations in WCA-3B for all fish summed.
5. Non-native fish are generally 2% or fewer of the fishes collected at all monitoring sites. However, higher numbers, particularly of Mayan cichlids, have been noted at the mangrove edge of Shark River Slough and Taylor Slough, in the Rocky Glades, and in canals in general. In 2008 moni-toring sites were added downstream from the C-111 canal in the ENP panhandle, and non-native taxa at times exceeded the 2% cutoff at those sites. There appears to be an increasing trend of non-native taxa in Taylor Slough; several species were present including Mayan cichlids, swamp eels, and spiny eels.
9
Fish & Macroinvertebrates
The map above shows the location of long-term monitoring sites and reflects annual as-sessments for the Total Fish performance measure. The table on the following pages reflects the average stoplight score within each region for fish and macroinvertebrates.
10
Fish & Macroinvertebrates
Performance Measure ‘00 ‘01 ‘02 ‘03 ‘04 ‘05 ‘06 ‘07
Cur-rent
Status
Current Status 2-Year Prospectus
Shark River Slough
Eastern mosquitofish
G G Y R R Y Y R Y
Fewer than expected. Two-year prospects are for no change, but Tamiami bridge project should im-prove this PM in future.
Flagfish
G G G Y G G G G G
At expected levels based on rainfall and target-period hydrology.
Two-year prospects are for no change, but Tamiami bridge project should im-prove this PM in future.
Bluefin killifish
G Y Y R Y Y Y Y Y
Fewer than expected. Two-year prospects are for no change, but Tamiami bridge project should im-prove this PM in future.
Total fish
G G R R R R R R Y
Fewer than expected. Two-year prospects are for no change, but Tamiami bridge project should im-prove this PM in future.
Everglades crayfish
G Y G Y R Y Y Y G
At expected levels based on rainfall and target-period hydrology.
Two-year prospects are for no change, but Tamiami bridge project should im-prove this PM in future.
Non-native fishes
Y Y Y Y Y Y Y Y Y
Present at all monitoring sites. None more than 2% of all fish collected; num-bers highest at mangrove boundary.
Two-year prospects are for possible increase or no change, but Tamiami bridge project may negatively af-fect this PM.
Eastern mosquitofish G G G Y Y Y Y G G
At expected levels based on rainfall and target-period hydrology.
New projects at S-332 and C-111 should lock in good performance of past year.
Flagfish G G
At expected levels based on rainfall and target-period hydrology.
New projects at S-332 and C-111 should lock in good performance of past year.
Bluefin killifish G Y R R R R R G Y
Near, but below, expected levels based on rainfall and target-period hydrology.
New projects at S-332 and C-111 should lock in good performance of past year.
Total fish G G Y Y R R R G G
At expected levels based on rainfall and target-period hydrology.
New projects at S-332 and C-111 should lock in good performance of past year.
Everglades crayfish G G G Y R Y Y G Y
Above expected levels based on rainfall and target-period hydrology.
New projects at S-332 and C-111 should lock in good performance of past year.
Non-native fishes
Y Y Y Y Y Y Y R Y
Present at all monitoring sites. None more than 2% of all fish collected; num-bers highest at mangrove boundary.
New projects increasing connectivity to canals may negatively affect this PM.
Taylor Slough
The 2-Year Prospect forecast assumes no large-scale climatological events such as hurricanes with excessive rain or drought during this period.
11
Fish & Macroinvertebrates
Performance Measure ‘00 ‘01 ‘02 ‘03 ‘04 ‘05 ‘06 ‘07
Cur-rent
Status
Current Status 2-Year Prospectus
Water Conservation Area 3A
Eastern mosquitofish
G G Y Y Y G G G G
At expected levels based on rainfall and target-period hydrology.
PM should continue at good levels relative to target; DECOMP projects may change area hydrology so much new targets required in future.
Flagfish
G G G G G Y Y G G
At expected levels based on rainfall and target-period hydrology.
PM should continue at good levels relative to target; DECOMP projects may change area hydrology so much new targets required in future.
Bluefin killifish
G G Y Y Y Y Y G G
At expected levels based on rainfall and target-period hydrology.
PM should continue at good levels relative to target; DECOMP projects may change area hydrology so much new targets required in future.
Total fish
G G G G G G G G G
At expected levels based on rainfall and target-period hydrology.
PM should continue at good levels relative to target; DECOMP projects may change area hydrology so much new targets required in future.
Non-native fishes
Y Y Y Y Y Y Y R Y
Present at all monitoring sites but no evidence of trends. All less than 2% of total and fewer than in Ever-glades National Park.
No change is likely, though DECOMP projects will in-crease access to canals already connected.
Eastern mosquitofish
G G R R R R Y G G
At expected levels based on rainfall and target-period hydrology.
Two-year prospects are for no change in this PM or improvement because of DECOMP projects.
Flagfish
G Y Y Y Y Y Y Y Y
Tendency for higher values than expected at northern site.
Two-year prospects are for no change in this PM or improvement because of DECOMP projects.
Bluefin killifish
G R R Y G G G G G
At expected levels based on rainfall and target-period hydrology.
Two-year prospects are for no change in this PM or improvement because of DECOMP projects.
Total fish
G G G G G G G G G
At expected levels based on rainfall and target-period hydrology.
Two-year prospects are for no change in this PM or improvement because of DECOMP projects.
Non-native fishes
Y Y Y Y Y Y Y Y G
Not found at either monitor-ing site within WCA-3B.
Two-year prospects are for possible increase or no change, but DCEOMP pro-jects may negatively affect this PM.
Water Conservation Area 3B
12
Wading Birds (Wood Stork & White Ibis)
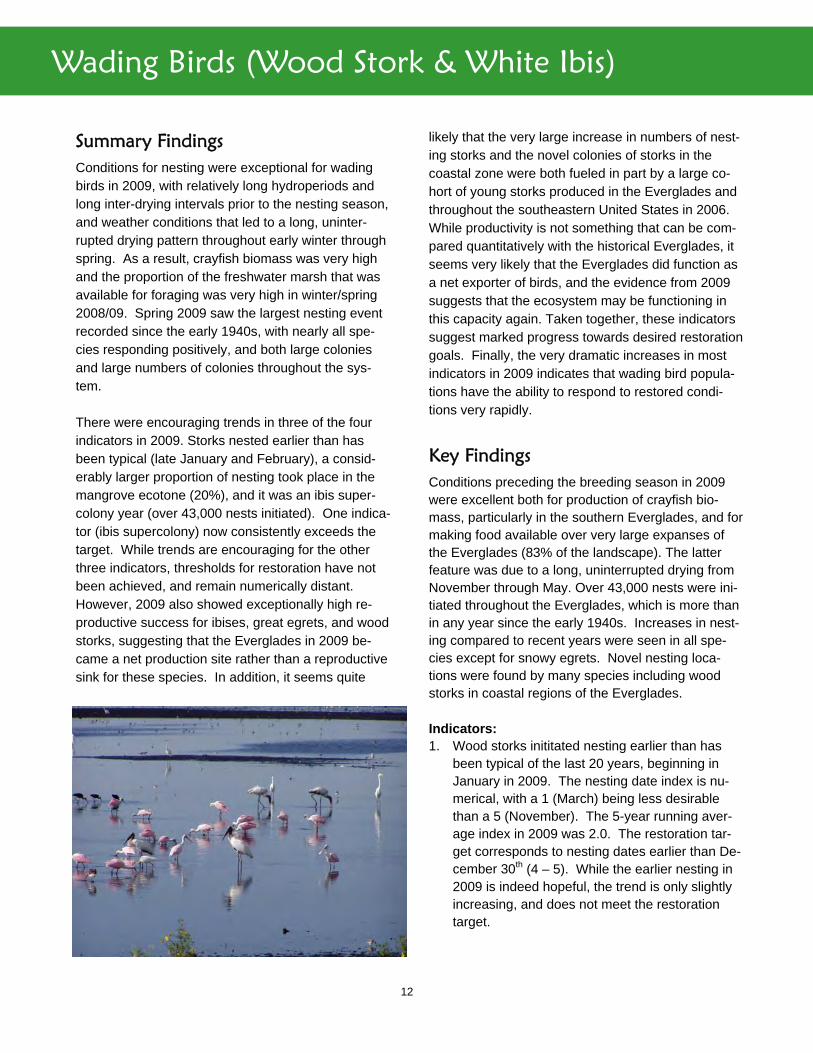
Summary Findings Conditions for nesting were exceptional for wading birds in 2009, with relatively long hydroperiods and long inter-drying intervals prior to the nesting season, and weather conditions that led to a long, uninter-rupted drying pattern throughout early winter through spring. As a result, crayfish biomass was very high and the proportion of the freshwater marsh that was available for foraging was very high in winter/spring 2008/09. Spring 2009 saw the largest nesting event recorded since the early 1940s, with nearly all spe-cies responding positively, and both large colonies and large numbers of colonies throughout the sys-tem. There were encouraging trends in three of the four indicators in 2009. Storks nested earlier than has been typical (late January and February), a consid-erably larger proportion of nesting took place in the mangrove ecotone (20%), and it was an ibis super-colony year (over 43,000 nests initiated). One indica-tor (ibis supercolony) now consistently exceeds the target. While trends are encouraging for the other three indicators, thresholds for restoration have not been achieved, and remain numerically distant. However, 2009 also showed exceptionally high re-productive success for ibises, great egrets, and wood storks, suggesting that the Everglades in 2009 be-came a net production site rather than a reproductive sink for these species. In addition, it seems quite
likely that the very large increase in numbers of nest-ing storks and the novel colonies of storks in the coastal zone were both fueled in part by a large co-hort of young storks produced in the Everglades and throughout the southeastern United States in 2006. While productivity is not something that can be com-pared quantitatively with the historical Everglades, it seems very likely that the Everglades did function as a net exporter of birds, and the evidence from 2009 suggests that the ecosystem may be functioning in this capacity again. Taken together, these indicators suggest marked progress towards desired restoration goals. Finally, the very dramatic increases in most indicators in 2009 indicates that wading bird popula-tions have the ability to respond to restored condi-tions very rapidly.
Key Findings Conditions preceding the breeding season in 2009 were excellent both for production of crayfish bio-mass, particularly in the southern Everglades, and for making food available over very large expanses of the Everglades (83% of the landscape). The latter feature was due to a long, uninterrupted drying from November through May. Over 43,000 nests were ini-tiated throughout the Everglades, which is more than in any year since the early 1940s. Increases in nest-ing compared to recent years were seen in all spe-cies except for snowy egrets. Novel nesting loca-tions were found by many species including wood storks in coastal regions of the Everglades. Indicators: 1. Wood storks inititated nesting earlier than has
been typical of the last 20 years, beginning in January in 2009. The nesting date index is nu-merical, with a 1 (March) being less desirable than a 5 (November). The 5-year running aver-age index in 2009 was 2.0. The restoration tar-get corresponds to nesting dates earlier than De-cember 30th (4 – 5). While the earlier nesting in 2009 is indeed hopeful, the trend is only slightly increasing, and does not meet the restoration target.
13
Wading Birds (Wood Stork & White Ibis)
2. The proportion of nesting birds occurring in the headwaters/ecotone in 2009 was 21.1%. This is a considerable increase over the average of 8.1% over the last ten years. There were also a number of novel colonies in the coastal zone, which suggests that conditions there were gener-ally favorable, and independent of effects of col-ony fidelity. This is a considerable uptick in the nearly flat trend of the last 10 years. However, the goal of 70% or greater of the birds nesting in the coastal zone remains distant.
3. The ratio of ibis and stork nests to great egret nests in 2009 (3.5:1) is still far below the 30:1 characteristic of predrainage conditions. In addi-tion, there has been only a slight increase over the average of the last ten years (2.97), espe-cially compared with the target ratio.
4. The frequency of exceptionally large ibis nesting events has improved dramatically since the late 1990s, and the mean interval between these events has changed from over 40 years to less than three in most recent years. The large nest-ing of ibises in 2009 (43,415 nesting pairs) easily qualified as a supernormal nesting, bringing the five-year running average to 1.20. Recent re-search strongly supports the hypothesis that the change is due to increased production and avail-ability of prey, particularly crayfish, to ibises. Re-stored conditions are expected to result in an average interval of 1.45 years. This indicator of restored conditions therefore appears to have been met.
PERFORMANCE MEASURE
LAST STATUS
CUR-RENT
STATUS CURRENT STATUS
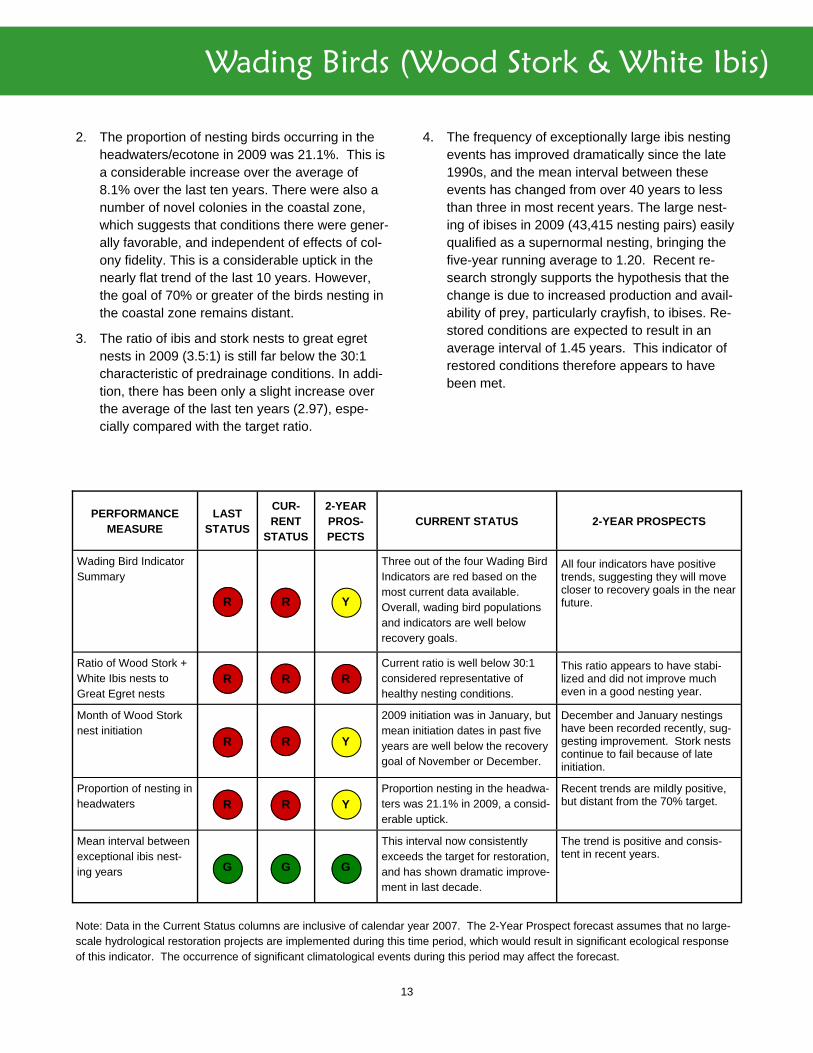
Wading Bird Indicator Summary
R R
Three out of the four Wading Bird Indicators are red based on the most current data available. Overall, wading bird populations and indicators are well below recovery goals.
Ratio of Wood Stork + White Ibis nests to Great Egret nests
R R Current ratio is well below 30:1 considered representative of healthy nesting conditions.
Month of Wood Stork nest initiation
R R
2009 initiation was in January, but mean initiation dates in past five years are well below the recovery goal of November or December.
Proportion of nesting in headwaters R R
Proportion nesting in the headwa-ters was 21.1% in 2009, a consid-erable uptick.
Mean interval between exceptional ibis nest-ing years G G
This interval now consistently exceeds the target for restoration, and has shown dramatic improve-ment in last decade.
2-YEAR PROS-PECTS
Y
R
Y
Y
G
2-YEAR PROSPECTS
All four indicators have positive trends, suggesting they will move closer to recovery goals in the near future.
This ratio appears to have stabi-lized and did not improve much even in a good nesting year.
December and January nestings have been recorded recently, sug-gesting improvement. Stork nests continue to fail because of late initiation.
Recent trends are mildly positive, but distant from the 70% target.
The trend is positive and consis-tent in recent years.
Note: Data in the Current Status columns are inclusive of calendar year 2007. The 2-Year Prospect forecast assumes that no large-scale hydrological restoration projects are implemented during this time period, which would result in significant ecological response of this indicator. The occurrence of significant climatological events during this period may affect the forecast.

14
Wading Birds (Roseate Spoonbill)
Summary Findings Roseate spoonbill nesting results in Florida Bay indi-cate that conditions in Florida Bay and Taylor Slough are still unable to support colonies with target num-bers of spoonbills bay-wide. The colonies in the northwestern portion of the bay seem to be doing well and have been stable both in numbers and nest success for the last 10 years. However, the total numbers in the northwest part of the bay are rela-tively low and numbers bay-wide are still not meeting targets. Northeastern bay colonies and bay-wide numbers continue to decline. There have been im-provements, however, in water management opera-tions that have allowed for favorable climatic condi-tions to result in four consecutive successful nesting cycles for both the northwest and northeast parts of the bay. The chicks hatched in these four nesting cycles should start reaching sexual maturity and this may result in an upturn in the number of nests. The spoonbill performance measures are expected to further improve after proposed changes to the South Dade Conveyance System (SDCS) (i.e., Mod Waters and the C-111 Spreader Canal Phase 1) are com-pleted.
Key Findings 1. Northeastern Florida Bay is in need of immediate
action in order keep spoonbill numbers from con-tinuing to decline. Although the northeast colo-nies have performed well over the last four years, the average productivity in this region is still well below production rates observed in the north-western colonies. The number of nests in the northeastern bay remained very low in 2007 with only 90 nests out of a target of 688 nests in this region.
2. Taylor Slough and the C-111 basin remain less productive than under historic conditions based on prey fish data.
3. There were 433 nests bay-wide in 2009. This was well below the target of 1258 nests. Bay-wide and northeastern nest numbers continue to decline but might begin to increase in the next
few years as chicks hatched during the last four successful cycles reach the age of reproduction.
4. Number of nests and nest production continue to exceed targets in northwestern Florida Bay. Data suggest this is probably because this area is less affected by water management and provides a more stable habitat condition.
5. The northeastern Florida Bay colonies forage in estuaries that rely on water from Taylor Slough (see map). Their continued failure to meet resto-ration targets indicates that water timing, quan-tity, and distribution in Taylor Slough and north-eastern Florida Bay are not meeting criteria nec-essary for proper estuary function in these loca-tions.

15
Wading Birds (Roseate Spoonbill)
Location of all known spoonbill nesting colonies within Florida Bay (blue ovals) and prey fish sampling sites in the Taylor Slough and C-111 Basin foraging grounds (red triangles). Colonies are grouped into five regions of the bay based on important foraging grounds for the colonies. Arrows from each region indicate the primary foraging ground. Colors of colonies and prey sampling sites are based on stoplight scores for various performance measures.

16
Wading Birds (Roseate Spoonbill)
Zone/ Performance Measure
LAST STATUS
CUR-RENT
STATUS
2-YEAR PROS-PECTS
CURRENT STATUS 2-YEAR PROSPECTS
Total Number of Nests
Number of nests in FL Bay (5-year mean)
Y Y R
The target number of nests for the whole bay is 1,258. The 5-year mean number of nests was 433 or 34% of target. This indicates that the FL Bay spoonbill population is not recovering.
The 5-year trend of the mean has declined from 41% to 34% and is ap-proaching the 33% threshold which would change the stoplight from yellow to red. Based on the trend, we expect this to happen within 2 years, how-ever, four consecutive years of nesting success may prevent this from occur-ring.
Nesting Location
Number of nests in NE FL Bay (5-year mean)
R R R
The target number of nests is 688. The 5-year mean number of nests was 90 nests or 13% of target, indicating that the NE FL Bay spoonbill popula-tion is in jeopardy.
Although 4 consecutive successful years may result in recruitment into the nesting population, thereby reversing the downward trend, it is unlikely to increase numbers sufficiently within the next 2 years to change this metric.
Number of nests in NW FL Bay (5-year mean)
G G G
The target for the number of nests in NW FL Bay is 210. The average num-ber of nests for the last five years was 222, exceeding the target.
The 5-year trend for the number of nests has been above 210 for most of the last 10 years indicating that the NW colonies are doing well. There is no expected reason for this to change in the next 2 years.
Number of nests in SW FL Bay (5-year mean)
No data is being collected in the SW estuaries.
No data is being collected in the SW estuaries.
Nesting Location Overall
R R R
The overall score for nesting location is the lowest of the three component scores. In this case the number of nests in NE FL Bay is red therefore the overall score is red.
Until the C-111 canal is managed so as to not disrupt spoonbill foraging grounds, the declining trend will con-tinue. Although there are plans to rectify this situation, it is highly unlikely to occur within 2 years.
The Last Status column reflects data prior to 2007.
The Current Status column reflects data collected in the 2006-2007 nesting cycle.
The 2-Year Prospect forecast assumes that no large scale hydrological restoration projects are implemented during this time period which would result in significant ecological response of this indicator. The occurrence of significant climatological events during this period may affect the forecast.

17
Wading Birds (Roseate Spoonbill)
Zone/ Performance Measure
LAST STATUS
CUR-RENT
STATUS
2-YEAR PROS-PECTS
CURRENT STATUS 2-YEAR PROSPECTS
Nesting Production and Success
Chick Production in NE FL Bay
R Y Y
The 5-year mean of NE production was 1.22 chicks/nest (c/n). This is above the success threshold of 1c/n but below the overall target of 1.38 c/n based on pre-SDCS conditions.
Greater sensitivity to the spoonbill nesting cycle by water managers has resulted in greater nesting success during years with favorable climatic conditions. This sensitivity is expected to continue increasing the 2 year pro-spectus from red to yellow.
Chick Production in NW FL Bay
Y G G
Nest production of >1 c/n in NW FL Bay is being maintained. In 2007, the 5-year mean of NW colonies produc-tion was 1.50 chicks per nest indicat-ing that the NW continues to perform well and is currently greater than Pre-SDCS NE colonies.
The trend has been above average production in 4 of the last 5 years indi-cating that the NW colonies continue to be highly productive.
Percent successful years in NE FL Bay
R Y Y
In NE FL Bay, 6 of the last 10 years have been successful at >1 c/n. Cur-rent conditions are well below restora-tion targets.
Greater sensitivity to the spoonbill nesting cycle by water managers has increased the possibility of nesting success during favorable climatic con-ditions.
Percent successful years in NW FL Bay G G G
In NW FL Bay, spoonbills have been successful 8 of the last 10 years.
The trend is increasing and there is no expected reason for this to change in the next 2 years.
Overall Nest Pro-duction and Suc-cess
R Y Y
The overall score for nesting success is the lowest score of the four compo-nent metrics. In this case, both the nesting success and nesting produc-tion in NE FL Bay are yellow. There-fore the overall score is red.
The greater sensitivity to the spoonbill nesting cycle by water managers has increased the possibility of nesting success during favorable climatic con-ditions, however, until the C-111 Spreader Canal Project is completed, there will still be limitations on main-taining favorable conditions resulting in a prospectus of yellow.
Prey Fish Community NE FL Bay
Prey Community Structure NE FL Bay
R R R
Prey fishes classified as freshwater species made up less than 3% of the total catch at the sampled spoonbill foraging sites in NE FL Bay. The tar-get is 40% suggesting that the prey base for nesting spoonbills remains very low.
Freshwater flows into Taylor Slough are not expected to increase for at least the next 2 years. As a result spoonbills will most likely continue to be unsuccessful in NE FL Bay.
The Last Status column reflects data prior to 2007.
The Current Status column reflects data collected in the 2006-2007 nesting cycle.
The 2-Year Prospect forecast assumes that no large scale hydrological restoration projects are implemented during this time period which would result in significant ecological response of this indicator. The occurrence of significant climatological events during this period may affect the forecast.
18
Florida Bay Submersed Aquatic Vegetation
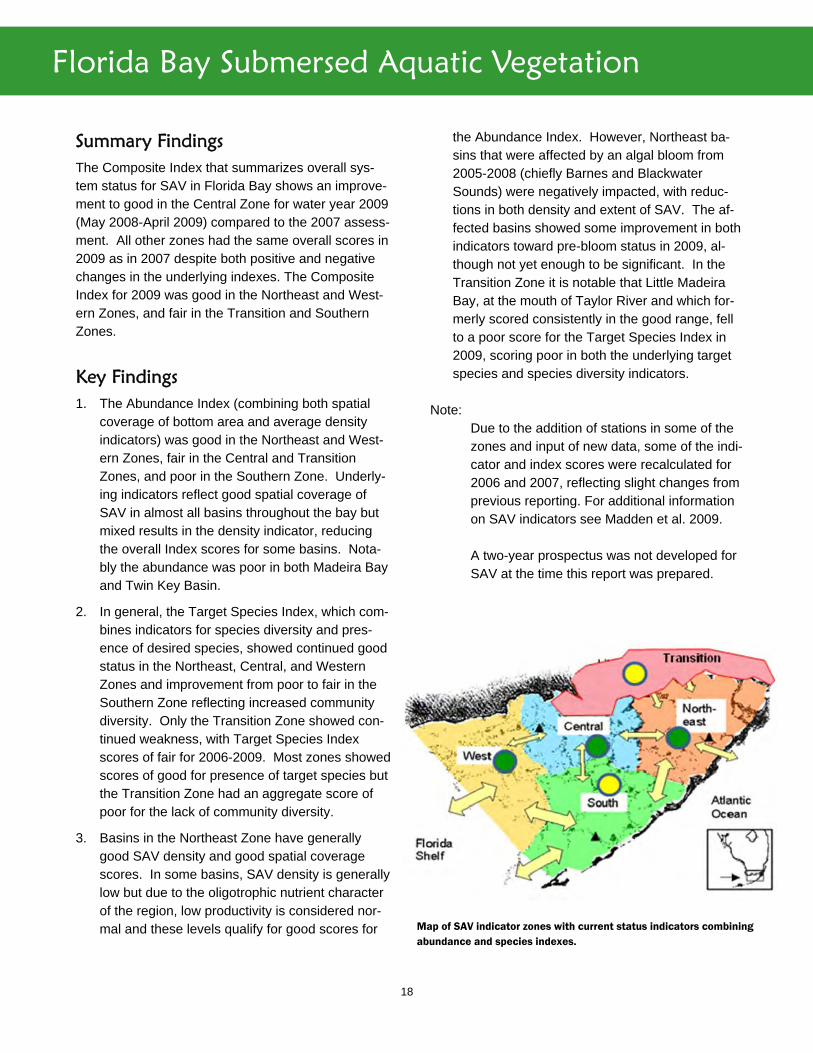
Summary Findings The Composite Index that summarizes overall sys-tem status for SAV in Florida Bay shows an improve-ment to good in the Central Zone for water year 2009 (May 2008-April 2009) compared to the 2007 assess-ment. All other zones had the same overall scores in 2009 as in 2007 despite both positive and negative changes in the underlying indexes. The Composite Index for 2009 was good in the Northeast and West-ern Zones, and fair in the Transition and Southern Zones.
Key Findings 1. The Abundance Index (combining both spatial
coverage of bottom area and average density indicators) was good in the Northeast and West-ern Zones, fair in the Central and Transition Zones, and poor in the Southern Zone. Underly-ing indicators reflect good spatial coverage of SAV in almost all basins throughout the bay but mixed results in the density indicator, reducing the overall Index scores for some basins. Nota-bly the abundance was poor in both Madeira Bay and Twin Key Basin.
2. In general, the Target Species Index, which com-bines indicators for species diversity and pres-ence of desired species, showed continued good status in the Northeast, Central, and Western Zones and improvement from poor to fair in the Southern Zone reflecting increased community diversity. Only the Transition Zone showed con-tinued weakness, with Target Species Index scores of fair for 2006-2009. Most zones showed scores of good for presence of target species but the Transition Zone had an aggregate score of poor for the lack of community diversity.
3. Basins in the Northeast Zone have generally good SAV density and good spatial coverage scores. In some basins, SAV density is generally low but due to the oligotrophic nutrient character of the region, low productivity is considered nor-mal and these levels qualify for good scores for
the Abundance Index. However, Northeast ba-sins that were affected by an algal bloom from 2005-2008 (chiefly Barnes and Blackwater Sounds) were negatively impacted, with reduc-tions in both density and extent of SAV. The af-fected basins showed some improvement in both indicators toward pre-bloom status in 2009, al-though not yet enough to be significant. In the Transition Zone it is notable that Little Madeira Bay, at the mouth of Taylor River and which for-merly scored consistently in the good range, fell to a poor score for the Target Species Index in 2009, scoring poor in both the underlying target species and species diversity indicators.
Note: Due to the addition of stations in some of the
zones and input of new data, some of the indi-cator and index scores were recalculated for 2006 and 2007, reflecting slight changes from previous reporting. For additional information on SAV indicators see Madden et al. 2009.
A two-year prospectus was not developed for
SAV at the time this report was prepared.
Map of SAV indicator zones with current status indicators combining abundance and species indexes.
19
Florida Bay Submersed Aquatic Vegetation
Zone/Performance Measure
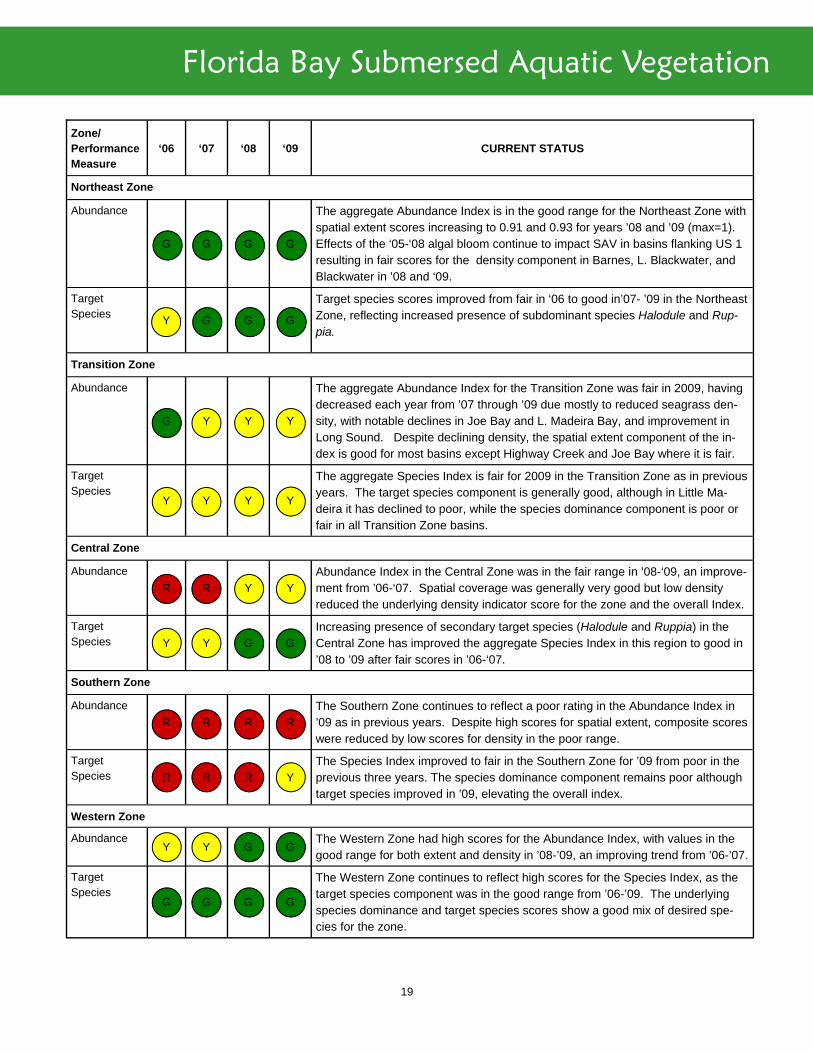
‘06 ‘07 ‘08 ‘09 CURRENT STATUS
Northeast Zone
Abundance
G G G G
The aggregate Abundance Index is in the good range for the Northeast Zone with spatial extent scores increasing to 0.91 and 0.93 for years ’08 and ’09 (max=1). Effects of the ‘05-‘08 algal bloom continue to impact SAV in basins flanking US 1 resulting in fair scores for the density component in Barnes, L. Blackwater, and Blackwater in ’08 and ‘09.
Target Species
Y G G G
Target species scores improved from fair in ‘06 to good in’07- ’09 in the Northeast Zone, reflecting increased presence of subdominant species Halodule and Rup-pia.
Transition Zone
Abundance
G Y Y Y
The aggregate Abundance Index for the Transition Zone was fair in 2009, having decreased each year from ’07 through ’09 due mostly to reduced seagrass den-sity, with notable declines in Joe Bay and L. Madeira Bay, and improvement in Long Sound. Despite declining density, the spatial extent component of the in-dex is good for most basins except Highway Creek and Joe Bay where it is fair.
Target Species
Y Y Y Y
The aggregate Species Index is fair for 2009 in the Transition Zone as in previous years. The target species component is generally good, although in Little Ma-deira it has declined to poor, while the species dominance component is poor or fair in all Transition Zone basins.
Central Zone
Abundance
R R Y Y
Abundance Index in the Central Zone was in the fair range in ’08-‘09, an improve-ment from ’06-‘07. Spatial coverage was generally very good but low density reduced the underlying density indicator score for the zone and the overall Index.
Target Species Y Y G G
Increasing presence of secondary target species (Halodule and Ruppia) in the Central Zone has improved the aggregate Species Index in this region to good in ’08 to ’09 after fair scores in ’06-‘07.
Southern Zone
Abundance
R R R R
The Southern Zone continues to reflect a poor rating in the Abundance Index in ’09 as in previous years. Despite high scores for spatial extent, composite scores were reduced by low scores for density in the poor range.
Target Species R R R Y
The Species Index improved to fair in the Southern Zone for ’09 from poor in the previous three years. The species dominance component remains poor although target species improved in ’09, elevating the overall index.
Abundance Y Y G G
The Western Zone had high scores for the Abundance Index, with values in the good range for both extent and density in ’08-’09, an improving trend from ’06-’07.
Target Species
G G G G
The Western Zone continues to reflect high scores for the Species Index, as the target species component was in the good range from ’06-’09. The underlying species dominance and target species scores show a good mix of desired spe-cies for the zone.
Western Zone
20
Florida Bay Algal Blooms
Summary Findings Elevated nutrients from the active 2005 hurricane season resulted in algal blooms in many sub-regions of the southern coastal system (SCS) in 2006 and 2007. These blooms have since subsided and many sub-regions returned to green condition in 2008. This may have been in part due to the drought lower-ing freshwater flow and thus nutrient loading to the SCS during 2008. As the drought lessens and rainfall increases, it is expected that more sub-regions may receive a yellow condition. If water flows to the SCS are improved and there is not significant hurricane activity, this indicator could return to predominantly green for all sub-regions. If water flows do not im-prove, many areas will be predominantly yellow.
Key Findings 1. The majority of sub-regions assessed had signifi-
cant algal bloom activity in 2006 that appears to have been predominantly influenced by the ac-tive 2005 hurricane season aggravated for east-ern Florida Bay by road construction on US-1.
2. The majority of sub-regions assessed had chloro-phyll-a and algal blooms rated as good (green).
3. The sub-regions assessed where chlorophyll-a was higher than the median do not appear to be indicative of long-term negative trends.
4. Overall excess nutrients (eutrophic expressions) were geographically minimal and appear to be explainable from existing phenomenological con-ditions of hurricane activity exacerbated by road construction along US-1 in Barnes, Manatee, and Blackwater Sounds (BMB).
5. If water flows are improved, the SCS water qual-ity could improve and the magnitude and fre-quency of algal blooms could diminish.
6. Monitoring of BMB was critical to detect and quantify the impacts of road construction along US-1. This short duration disturbance resulted in a multi-year algal bloom that as of 2008 had not returned to background conditions.
7. Although the BMB algal bloom lasted several years, there is the possibility that its ecological consequences, including the loss of benthic graz-ers, could last for decades and leave the area more susceptible to future algal blooms.
8. Monitoring long-term consequences of nutrient releases into the SCS from both natural (e.g., hurricanes) and human causes (e.g., road con-struction) and their interactions with hydrological restoration (e.g., more freshwater flow into the SCS, particularly Florida Bay) are critical to con-tinuing the evaluation and assessment of restora-tion.

21
Florida Bay Algal Blooms
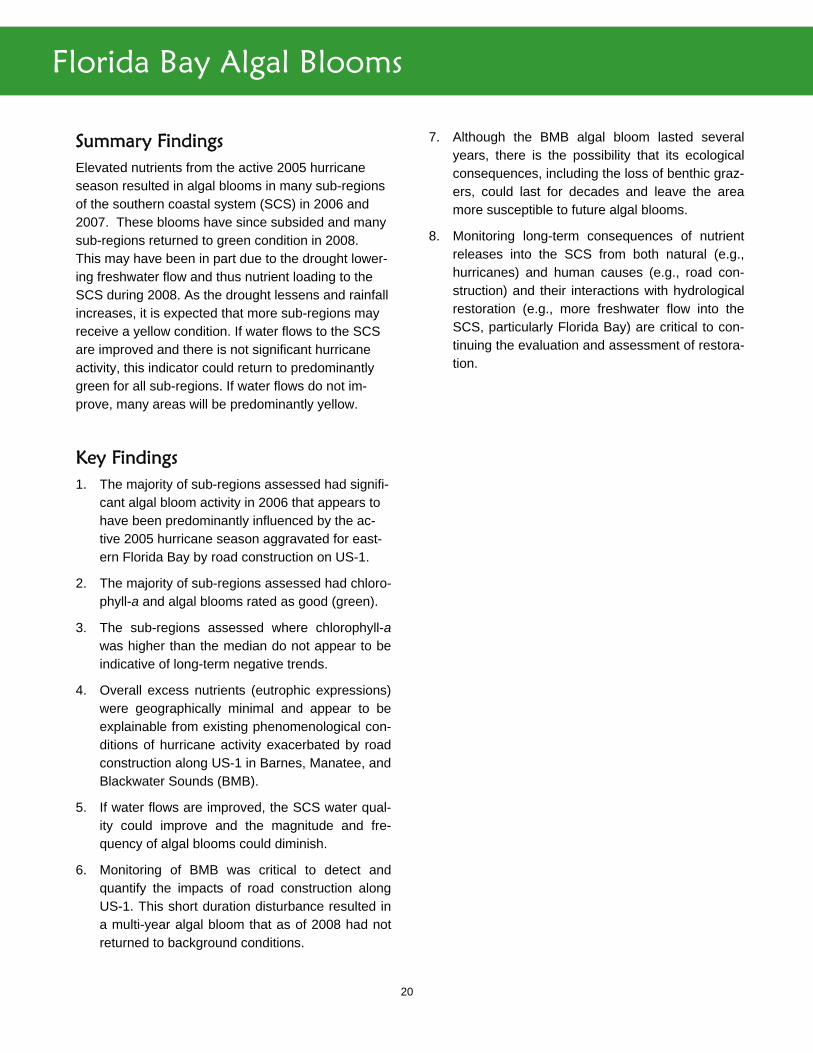
Map of the SCS with stoplight ratings by sub-region.
22
Florida Bay Algal Blooms
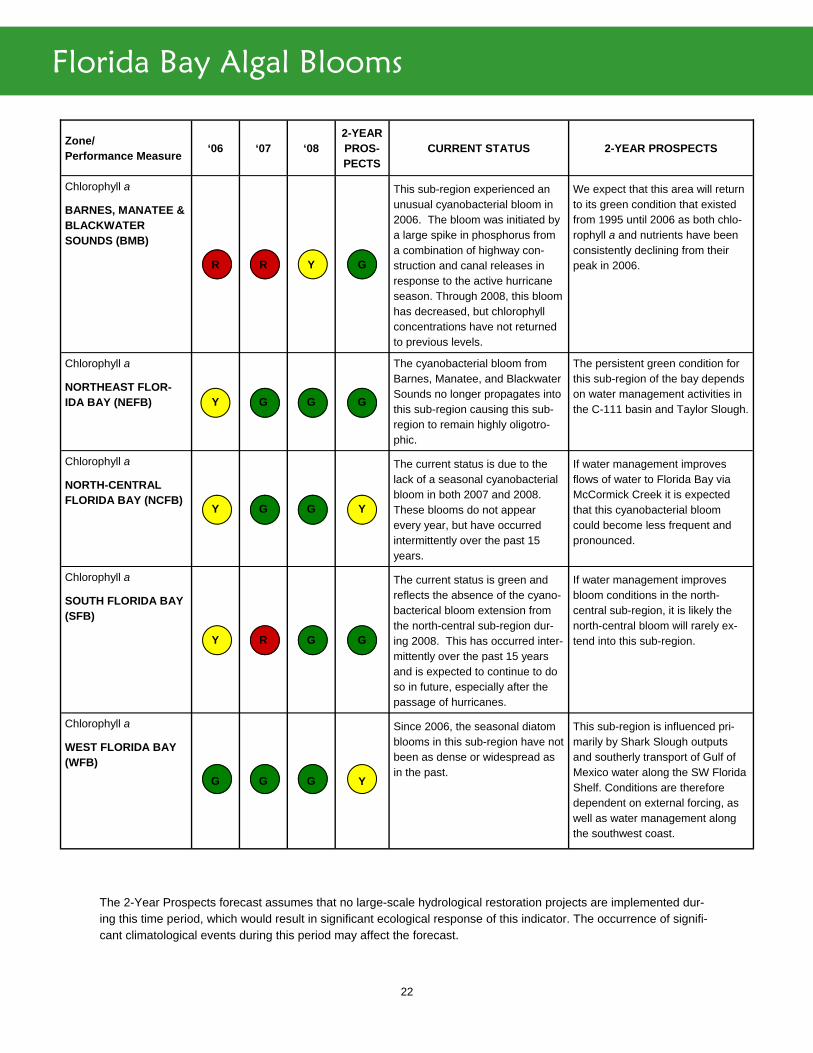
Zone/ Performance Measure
‘06 ‘07 ‘08 2-YEAR PROS-PECTS
CURRENT STATUS 2-YEAR PROSPECTS
Chlorophyll a
BARNES, MANATEE & BLACKWATER SOUNDS (BMB)
R R Y G
This sub-region experienced an unusual cyanobacterial bloom in 2006. The bloom was initiated by a large spike in phosphorus from a combination of highway con-struction and canal releases in response to the active hurricane season. Through 2008, this bloom has decreased, but chlorophyll concentrations have not returned to previous levels.
We expect that this area will return to its green condition that existed from 1995 until 2006 as both chlo-rophyll a and nutrients have been consistently declining from their peak in 2006.
Chlorophyll a
NORTHEAST FLOR-IDA BAY (NEFB) Y G G G
The cyanobacterial bloom from Barnes, Manatee, and Blackwater Sounds no longer propagates into this sub-region causing this sub-region to remain highly oligotro-phic.
The persistent green condition for this sub-region of the bay depends on water management activities in the C-111 basin and Taylor Slough.
Chlorophyll a
NORTH-CENTRAL FLORIDA BAY (NCFB)
Y G G Y
The current status is due to the lack of a seasonal cyanobacterial bloom in both 2007 and 2008. These blooms do not appear every year, but have occurred intermittently over the past 15 years.
If water management improves flows of water to Florida Bay via McCormick Creek it is expected that this cyanobacterial bloom could become less frequent and pronounced.
Chlorophyll a
SOUTH FLORIDA BAY (SFB)
Y R G G
The current status is green and reflects the absence of the cyano-bacterical bloom extension from the north-central sub-region dur-ing 2008. This has occurred inter-mittently over the past 15 years and is expected to continue to do so in future, especially after the passage of hurricanes.
If water management improves bloom conditions in the north-central sub-region, it is likely the north-central bloom will rarely ex-tend into this sub-region.
Chlorophyll a
WEST FLORIDA BAY (WFB)
G G G Y
Since 2006, the seasonal diatom blooms in this sub-region have not been as dense or widespread as in the past.
This sub-region is influenced pri-marily by Shark Slough outputs and southerly transport of Gulf of Mexico water along the SW Florida Shelf. Conditions are therefore dependent on external forcing, as well as water management along the southwest coast.
The 2-Year Prospects forecast assumes that no large-scale hydrological restoration projects are implemented dur-ing this time period, which would result in significant ecological response of this indicator. The occurrence of signifi-cant climatological events during this period may affect the forecast.
23
Florida Bay Algal Blooms
Zone/ Performance Measure
‘06 ‘07 ‘08 2-YEAR PROS-PECTS
CURRENT STATUS 2-YEAR PROSPECTS
Chlorophyll a
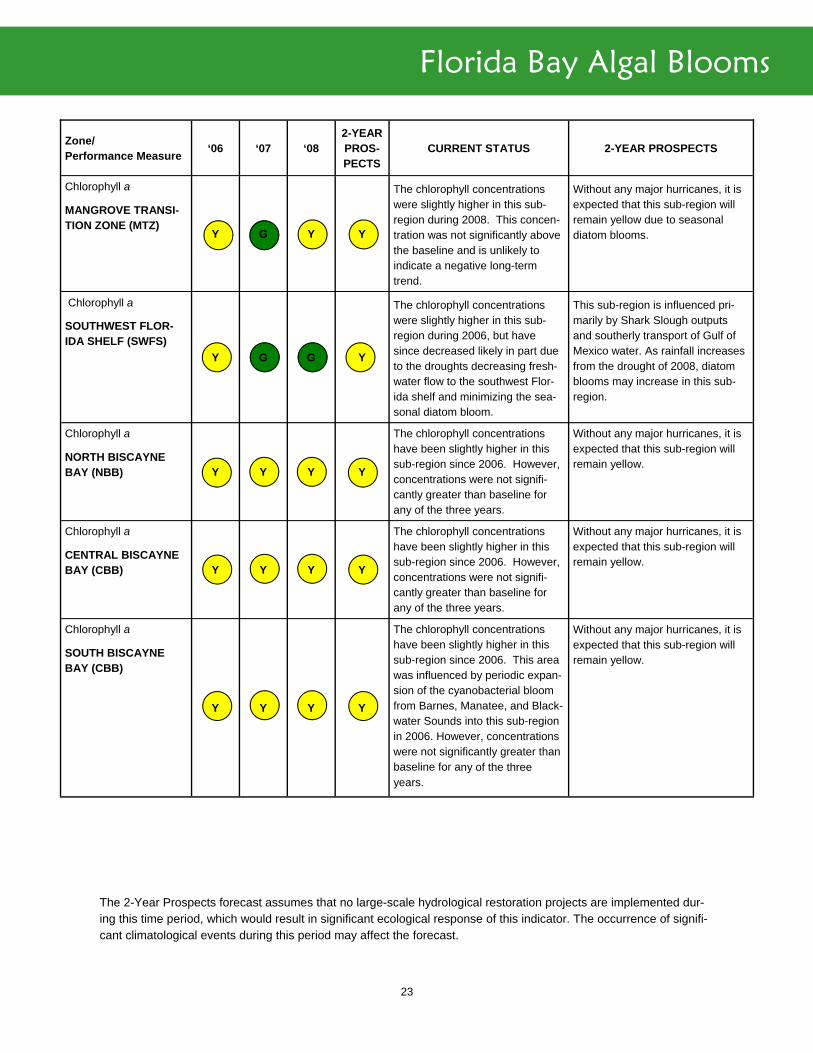
MANGROVE TRANSI-TION ZONE (MTZ)
Y G Y Y
The chlorophyll concentrations were slightly higher in this sub-region during 2008. This concen-tration was not significantly above the baseline and is unlikely to indicate a negative long-term trend.
Without any major hurricanes, it is expected that this sub-region will remain yellow due to seasonal diatom blooms.
Chlorophyll a
SOUTHWEST FLOR-IDA SHELF (SWFS)
Y G G Y
The chlorophyll concentrations were slightly higher in this sub-region during 2006, but have since decreased likely in part due to the droughts decreasing fresh-water flow to the southwest Flor-ida shelf and minimizing the sea-sonal diatom bloom.
This sub-region is influenced pri-marily by Shark Slough outputs and southerly transport of Gulf of Mexico water. As rainfall increases from the drought of 2008, diatom blooms may increase in this sub-region.
Chlorophyll a
NORTH BISCAYNE BAY (NBB) Y Y Y Y
The chlorophyll concentrations have been slightly higher in this sub-region since 2006. However, concentrations were not signifi-cantly greater than baseline for any of the three years.
Without any major hurricanes, it is expected that this sub-region will remain yellow.
Chlorophyll a
CENTRAL BISCAYNE BAY (CBB) Y Y Y Y
The chlorophyll concentrations have been slightly higher in this sub-region since 2006. However, concentrations were not signifi-cantly greater than baseline for any of the three years.
Without any major hurricanes, it is expected that this sub-region will remain yellow.
Chlorophyll a
SOUTH BISCAYNE BAY (CBB)
Y Y Y Y
The chlorophyll concentrations have been slightly higher in this sub-region since 2006. This area was influenced by periodic expan-sion of the cyanobacterial bloom from Barnes, Manatee, and Black-water Sounds into this sub-region in 2006. However, concentrations were not significantly greater than baseline for any of the three years.
Without any major hurricanes, it is expected that this sub-region will remain yellow.
The 2-Year Prospects forecast assumes that no large-scale hydrological restoration projects are implemented dur-ing this time period, which would result in significant ecological response of this indicator. The occurrence of signifi-cant climatological events during this period may affect the forecast.
24
Crocodilians (Alligators & Crocodiles)
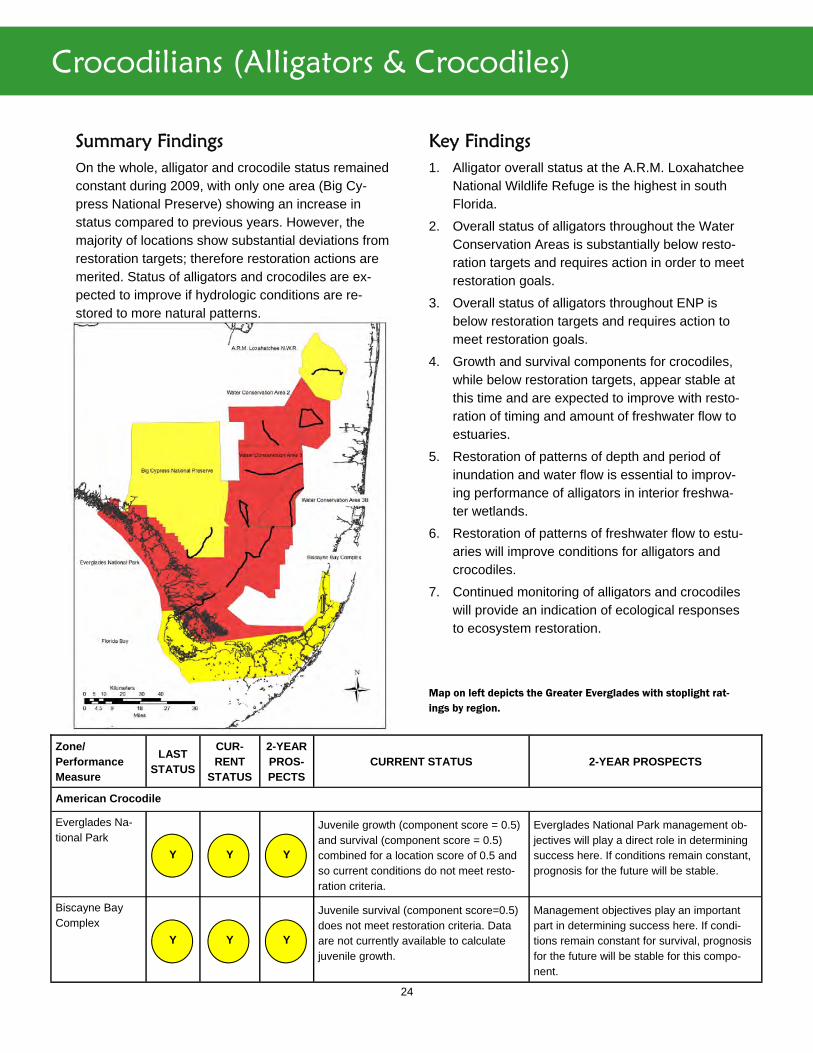
Map on left depicts the Greater Everglades with stoplight rat-ings by region.
Key Findings 1. Alligator overall status at the A.R.M. Loxahatchee
National Wildlife Refuge is the highest in south Florida.
2. Overall status of alligators throughout the Water Conservation Areas is substantially below resto-ration targets and requires action in order to meet restoration goals.
3. Overall status of alligators throughout ENP is below restoration targets and requires action to meet restoration goals.
4. Growth and survival components for crocodiles, while below restoration targets, appear stable at this time and are expected to improve with resto-ration of timing and amount of freshwater flow to estuaries.
5. Restoration of patterns of depth and period of inundation and water flow is essential to improv-ing performance of alligators in interior freshwa-ter wetlands.
6. Restoration of patterns of freshwater flow to estu-aries will improve conditions for alligators and crocodiles.
7. Continued monitoring of alligators and crocodiles will provide an indication of ecological responses to ecosystem restoration.
Summary Findings On the whole, alligator and crocodile status remained constant during 2009, with only one area (Big Cy-press National Preserve) showing an increase in status compared to previous years. However, the majority of locations show substantial deviations from restoration targets; therefore restoration actions are merited. Status of alligators and crocodiles are ex-pected to improve if hydrologic conditions are re-stored to more natural patterns.
Zone/Performance Measure
LAST STATUS
CUR-RENT
STATUS
2-YEAR PROS-PECTS
CURRENT STATUS 2-YEAR PROSPECTS
American Crocodile
Everglades Na-tional Park
Y Y Y
Juvenile growth (component score = 0.5) and survival (component score = 0.5) combined for a location score of 0.5 and so current conditions do not meet resto-ration criteria.
Everglades National Park management ob-jectives will play a direct role in determining success here. If conditions remain constant, prognosis for the future will be stable.
Biscayne Bay Complex
Y Y Y
Juvenile survival (component score=0.5) does not meet restoration criteria. Data are not currently available to calculate juvenile growth.
Management objectives play an important part in determining success here. If condi-tions remain constant for survival, prognosis for the future will be stable for this compo-nent.

25
Crocodilians (Alligators & Crocodiles)
Zone/Performance Measure
LAST STATUS
CUR-RENT
STATUS
2-YEAR PROS-PECTS
CURRENT STATUS 2-YEAR PROSPECTS
American Alligator
A.R.M. Loxahat-chee National Wildlife Refuge
Y Y Y
Relative density (component score = 0.67) and body condition (component score = 0.5) combined for a location score of 0.59 and so current conditions do not meet restoration criteria, signifying that this area needs further attention.
A.R.M. Loxahatchee National Wildlife Refuge and management objectives play an impor-tant part in determining success here. If con-ditions remain constant, prognosis for the future will be stable.
Water Conserva-tion Area 2A
R R R
Relative density (component score = 0) and body condition (component score = 0.5) combined for a location score of 0.25 and so current conditions are below res-toration criteria.
With the stable body condition and low rela-tive density of alligators observed here, status will remain substantially below resto-ration objectives.
Water Conserva-tion Area 3A
R R R
Relative density in two of the three loca-tions within WCA-3A is low (northern and central areas) and higher (yellow) in the southern area; body condition scores are yellow in all three areas. The combined score of both components for the overall area is 0.39, which is well below restora-tion criteria.
The southern area of WCA-3A has the high-est status (yellow), and can be used as a reference for conditions in the northern and central areas (both currently red).
Water Conserva-tion Area 3B
R R R
Relative density (component score = 0.17) and body condition (component score = 0.5) combined for a location score of 0.34 and so current conditions are below restoration criteria.
With the stable body condition and low rela-tive density of alligators observed here, status will remain substantially below resto-ration objectives.
Everglades Na-tional Park
R R R
Relative density in all three locations within ENP is low (red). Body condition is higher (yellow) in Shark Slough, north-east Shark Slough and estuarine areas. The combined score of these two compo-nents for the overall area, and alligator hole occupancy in the inaccessible areas, is 0.37, which is well below restoration criteria.
Everglades National Park management ob-jectives will play a direct role in determining success here. If conditions remain as they currently are, restoration goals will not be met.
Big Cypress National Pre-serve
R Y Y
Relative density (component score = 0.17) and body condition (component score = 0.67) combined for a location score of 0.42 and so current conditions do not meet restoration criteria. The change in status reflects availability of data to detect trends.
Big Cypress National Preserve management objectives will play a direct role in determin-ing success here. If conditions remain con-stant, prognosis for the future will be stable.
The Last Status column reflects data prior to and inclusive of calendar year 2006. The Current Status column reflects data inclusive of calendar years 2005-2009. The 2-Year Prospects column is based on the following assumption: there will be no changes in water management from the date of the current status assessment.

26
Oysters
Summary Findings On the whole, Eastern oyster status remained con-stant up to 2010. It should be cautioned that the du-ration of monitoring for this species in the estuaries is relatively short (4-9 years) and hence trend data should be treated with caution while inferring status of this indicator. Continuing monitoring will yield data to make trend and status assessments in the coming years and will strengthen the confidence of the status. Current conditions in the Caloosahatchee Es-tuary show deviations from restoration targets, there-fore restoration actions are merited. For example, relatively dry years during the past three years has resulted in higher disease prevalence and increased predation and mortality of juvenile oysters and spat recruitment. Status of oysters is expected to improve if hydrologic conditions are restored to more natural patterns.
Key Findings 1. Preliminary results suggest that oyster status in
most of the Northern Estuaries remains stable. It should be cautioned that insufficient data exists for the Southern Coastal System to infer trends and make statistical comparisons.
2. There is too much freshwater inflow into the Ca-loosahatchee and St. Lucie estuaries in the sum-mer months and too little freshwater inflow into
the estuary in the winter months, disrupting natu-ral patterns and estuarine conditions. The oysters in both of these estuaries are still being impacted by this unnatural water delivery pattern. Too much freshwater impacts reproduction, larval recruitment, survival, and growth. Too little fresh-water impacts the survival of oysters due to higher disease prevalence and intensity of Perkinsus marinus and predation; this appears to be occurring in the Lake Worth Lagoon.
3. Overall status of oysters in all of the Northern Estuaries is below restoration targets and re-quires action in order to meet restoration goals.
4. Oyster responses and populations in the North-ern Estuaries are below targets and may be in danger of declines under current salinity levels. Growth rates and recovery rates for abundances suggest that oyster index scores could be ex-pected to increase given proper hydrologic condi-tions through restoration.
5. Restoration of natural patterns (less freshwater flows in the summer and more freshwater flows in the winter) along with substrate enhancement (addition of cultch) is essential to improving per-formance of oysters in the estuaries.
Continued monitoring of oysters in the Northern Estu-aries and Southern Coastal System will provide an indication of ecological responses to ecosystem res-toration and the ability to distinguish between re-sponses to restoration and natural variation.
The last status column reflects data collected prior to calendar year 2000. The current status column reflects data collected between calendar years 2000 – 2009. The 2-year prospects column uses the following assumption: there will be no changes in the water management from the date of the current status assessment.

27
Oysters
Zone/Performance Measure
LAST
STATUS
CUR-RENT
STATUS CURRENT STATUS
Eastern Oyster
Caloosahatchee Estuary
Y
The oysters in the Caloosahatchee Estu-ary are still being impacted by too much freshwater in summer and too little fresh-water in the winter. Too much freshwater impacts reproduction, larval recruitment, survival, and growth, while too little fresh-water impacts the survival of oysters due to higher disease prevalence and inten-sity of Perkinsus marinus and predation. For example, the past 3 years have been dry years resulting in higher P. marinus prevalence values in oysters. Current conditions do not meet restoration crite-ria, signifying that this area needs further attention.
St. Lucie Estuary - North
Y
The oysters in the St. Lucie River Estuary are being impacted annually by too much freshwater, especially in late summer. Oysters in the North and South Fork are consistently rated as failing. In the central portion of the estuary, densities reached caution level in the last three years. Re-duced condition and recruitment are typi-cal. Oysters are capable of growth only during brief periods of improved condi-tions. Current conditions do not meet restoration criteria, signifying that this area needs further attention.
St. Lucie Estuary - South
R
St. Lucie Estuary - Central Y
Loxahatchee Estuary - North
Y
The oysters in the Loxahatchee Estuary are still being impacted by some periods of too much freshwater in summer and too little freshwater in the winter. Current conditions do not meet restoration crite-ria, signifying that this area needs further attention. Although abundances are rising slightly, extended periods of high salinity result in increased prevalence and intensity of disease and reduced condition and reproduction.
Loxahatchee Estuary - South
R
Lake Worth La-goon
Y
The oysters in the Lake Worth Lagoon are still being impacted by some periods of insufficient freshwater, especially dur-ing winter months. Current conditions do not meet restoration criteria, signifying that this area needs further attention. Although abundances are rising slightly, extended periods of high salinity result in increased prevalence and intensity of disease and reduced condition and repro-duction.
Lostman’s River (Southern Coastal System)
Y
2-YEAR PROS-PECTS
Y
Y
R
Y
Y
R
Y
Y
2-YEAR PROSPECTS
Management objectives for regulating fresh-water inflows play an important part in deter-mining oyster success in the Caloosa-hatchee Estuary. If conditions remain con-stant, prognosis for the future will be stable. However, if dry conditions were to persist, it will result in higher disease prevalence and predation of oyster spat and will result in decrease in oyster index score (from yellow to red). If the hydrological conditions remain the same, we do not expect to see an im-provement in oyster responses in this estu-ary.
Management objectives for regulating fresh-water inflows play an important part in deter-mining oyster success in the St. Lucie Estu-ary. If conditions remain at or below optimal salinities, prognosis for the future will be continued decline of existing oyster popula-tions. The oyster index score will drop from a mix of yellow (cautionary) and red (failing), depending on location, to red (failing).
If current conditions persist, increased dis-ease and predation combined with reduced condition, growth, and reproductive output will result in declines in the oyster index score, with the overall score falling to red (failing).
If current conditions persist, increased dis-ease and predation combined with reduced condition, growth, and reproductive output will result in declines in the oyster index score, with the overall score falling to red (failing).

28
Periphyton & Epiphyton
Summary Findings Many of the sites coded as “altered” (red) are near the peripheral canals surrounding the wetlands, or in drainages downstream of canal inputs (see map).
In WCA-1, canals deliver above-ambient concentra-tions of both nutrients and calcium carbonate, caus-ing changes in periphyton quality, including increased Total Phosphorus (TP) from nutrient enrichment and reduced organic content from calcium carbonate in-puts.
In WCA-2A, long-term delivery of above-ambient Phosphorus (P) in canal inputs has caused enrich-ment cascades throughout most of the system. This is most severe in the northeast portion of this wet-land, where monospecific cattail stands predominate, precluding periphyton sampling.
Enrichment in central WCA-3A, noted in 2005 and 2006, was less pronounced in 2007, while signals of enrichment were noted near the peripheral canals.
Shark River and Taylor Sloughs have remained rela-tively free of enrichment or hydrologic modifications in the sampled areas, although enrichment has been noted downstream of the S-12 structures on the Ta-miami Trail (Shark Slough) and near the S-332 struc-tures and C-111 canal (Taylor Slough).
Key Findings 1. A total of 11% of sites had “altered” periphyton
TP levels. This was lower than observed in 2006 (26%) and 2005 (25%) due primarily to a reduction in the number of altered sites in WCA-3A. This reduction may be due to depleted canal flows into WCA-3A during this relatively dry year.
2. A total of 14% of sites were coded yellow for pe-riphyton TP, and were located in similar locations to those detected in 2005 and 2006, primarily downstream of canal inputs.
3. A total of 55% and 39% of sites were coded yel-low or higher for biomass and species composi-
tion (not shown), primarily loss of biomass and native species in response to P enrichment.
4. Continued input of above-ambient P concentra-tions will both increase severity of enrichment effects near canals and cause these effects to continue to cascade downstream of inputs.
5. Increased input of water through restorative pro-jects may increase periphyton development in areas formerly dry, but if accompanied by above-ambient P concentrations, cascading P effects are expected.
The map shows the location of long-term monitoring sites and reflects annual assessments for the Total Phosphorus (quality) performance measure. The table on the right re-flects the average stoplight score within each region for bio-mass, quality, and composition.

29
Periphyton & Ephiphyton
aEach wetland basin is scored with a red, yellow, or green symbol for each indicator, based on the proportion of sites falling within these catego-ries in assessment (yellow if > 25% of sites are coded yellow or red; red if > 50% of the sites are red). Biomass = ash-free dry mass (gmS2), quality = total phosphorus content (mg gS1), and community composition = diatom similarity (%). bData in the Current Status column for the periphyton indicator reflect data inclusive of calendar year 2007.
Zone/Performance Measurea
2005 STATUS
2006 STATUS
2007 STATUS
2-YEAR PROS-PECTS
CURRENT STATUSb 2-YEAR PROSPECTS
WCA-1
Biomass Y Y Y Y
Periphyton shows enrich-ment near canals and calcareous mat biomass has increased at some sites due to calcite input from canals.
If canal impacts remain low, status should remain same; increased inputs may cause further enrich-ment and calcification of mats.
Quality Y Y Y Y
Composition Y Y Y Y
WCA-2A
Biomass Y Y Y Y Periphyton TP and com-
position continue to reflect high P input to this wet-land, particularly down-stream of water flow struc-tures.
If canal P inputs remain above ambient, more sites will be enriched, further damaging pe-riphyton structures and biomass.
Quality R Y R Y
Composition Y Y Y Y
WCA-3A
Biomass Y Y Y Y This area has received
some low-level P enrich-ment, particularly near canals. Evidence was less pronounced in this drier year.
If canal P inputs remain above the protective criterion, status will rea-main similar or perhaps worsen over time.
Quality Y Y Y Y
Composition Y Y Y Y
Shark River Slough (SRS)
Biomass Y Y Y Y
Shark River Slough has received low-level P en-richment for decades, reflected in biomass, qual-ity, and composition, par-ticularly downstream of the S-12 structures.
Increased flow through culverts and Tamiami Trail modifications may encourage periphyton in dry areas, but above-ambient P inputs will cause negative change.
Quality Y Y Y Y
Composition G Y Y Y
Biomass G G G G Taylor Slough has re-
mained relatively unim-pacted to the interior due to low levels of distur-bance and low P inputs, except near the S-332 control structures.
Periphyton production may incrase with in-creased water delivery to TS, but quality could be threatened if poor quality water continues to drain through the eastern boundary of ENP.
Quality G G G G
Composition
G G G G
Taylor Slough (TS)
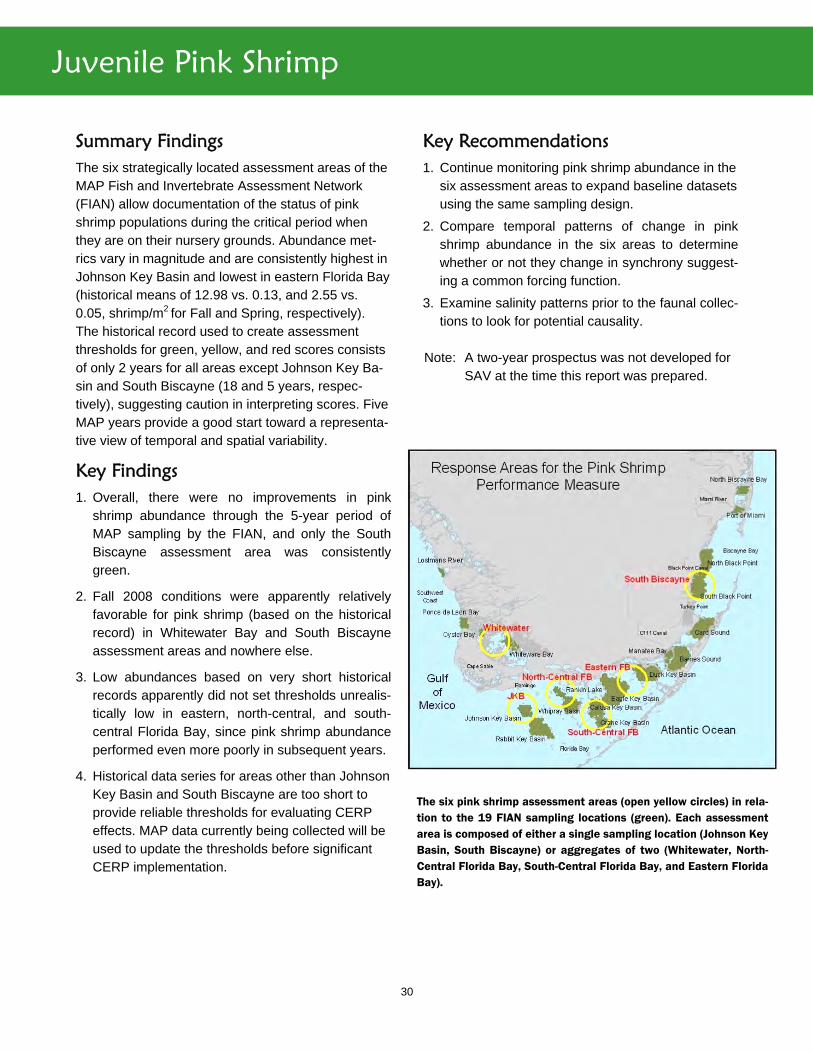
30
Juvenile Pink Shrimp
Summary Findings The six strategically located assessment areas of the MAP Fish and Invertebrate Assessment Network (FIAN) allow documentation of the status of pink shrimp populations during the critical period when they are on their nursery grounds. Abundance met-rics vary in magnitude and are consistently highest in Johnson Key Basin and lowest in eastern Florida Bay (historical means of 12.98 vs. 0.13, and 2.55 vs. 0.05, shrimp/m2 for Fall and Spring, respectively). The historical record used to create assessment thresholds for green, yellow, and red scores consists of only 2 years for all areas except Johnson Key Ba-sin and South Biscayne (18 and 5 years, respec-tively), suggesting caution in interpreting scores. Five MAP years provide a good start toward a representa-tive view of temporal and spatial variability.
Key Findings 1. Overall, there were no improvements in pink
shrimp abundance through the 5-year period of MAP sampling by the FIAN, and only the South Biscayne assessment area was consistently green.
2. Fall 2008 conditions were apparently relatively favorable for pink shrimp (based on the historical record) in Whitewater Bay and South Biscayne assessment areas and nowhere else.
3. Low abundances based on very short historical records apparently did not set thresholds unrealis-tically low in eastern, north-central, and south-central Florida Bay, since pink shrimp abundance performed even more poorly in subsequent years.
4. Historical data series for areas other than Johnson Key Basin and South Biscayne are too short to provide reliable thresholds for evaluating CERP effects. MAP data currently being collected will be used to update the thresholds before significant CERP implementation.
Key Recommendations 1. Continue monitoring pink shrimp abundance in the
six assessment areas to expand baseline datasets using the same sampling design.
2. Compare temporal patterns of change in pink shrimp abundance in the six areas to determine whether or not they change in synchrony suggest-ing a common forcing function.
3. Examine salinity patterns prior to the faunal collec-tions to look for potential causality.
Note: A two-year prospectus was not developed for
SAV at the time this report was prepared.
The six pink shrimp assessment areas (open yellow circles) in rela-tion to the 19 FIAN sampling locations (green). Each assessment area is composed of either a single sampling location (Johnson Key Basin, South Biscayne) or aggregates of two (Whitewater, North-Central Florida Bay, South-Central Florida Bay, and Eastern Florida Bay).
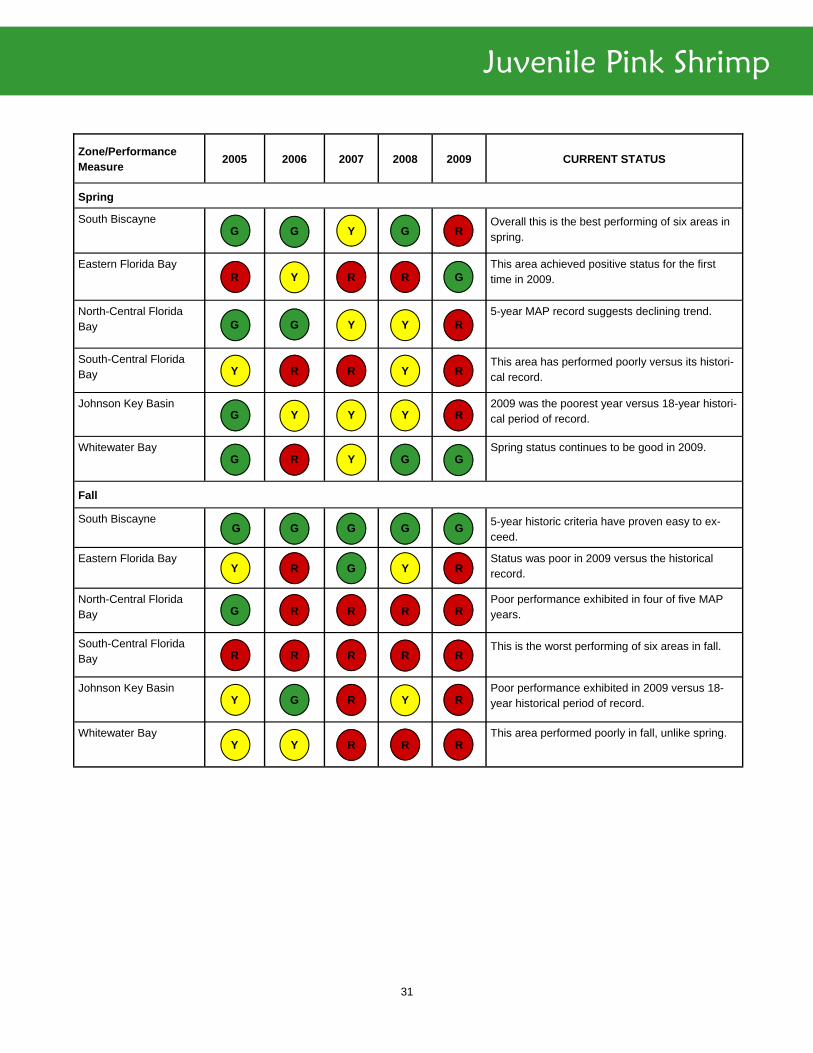
31
Juvenile Pink Shrimp
Zone/Performance Measure
2005 2006 2007 2008 2009 CURRENT STATUS
Spring
South Biscayne G G Y G R
Overall this is the best performing of six areas in spring.
Eastern Florida Bay R Y R R G
This area achieved positive status for the first time in 2009.
North-Central Florida Bay G G Y Y R
5-year MAP record suggests declining trend.
South-Central Florida Bay Y R R Y R
This area has performed poorly versus its histori-cal record.
Johnson Key Basin G Y Y Y R
2009 was the poorest year versus 18-year histori-cal period of record.
Whitewater Bay G R Y G G
Spring status continues to be good in 2009.
South Biscayne G G G G G
5-year historic criteria have proven easy to ex-ceed.
Eastern Florida Bay Y R G Y R
Status was poor in 2009 versus the historical record.
North-Central Florida Bay G R R R R
Poor performance exhibited in four of five MAP years.
South-Central Florida Bay R R R R R
This is the worst performing of six areas in fall.
Johnson Key Basin Y G R Y R
Poor performance exhibited in 2009 versus 18-year historical period of record.
Whitewater Bay Y Y R R R
This area performed poorly in fall, unlike spring.
Fall

32
Lake Okeechobee Nearshore Zone
Summary Findings A prolonged drought during 2007–2008 resulted in historically low lake stages and dry conditions across most of the nearshore region that previously con-tained vascular SAV. During this period when lake stage was significantly lower than the long-term mean stage over the past several decades, previ-ously SAV-dominated areas inshore became domi-nated by emergent and terrestrial plants. Lake stage then increased during the fall of 2008 and was within the desired stage envelope during 2009. SAV re-sponded by recolonizing these areas, increasing in areal coverage relative to that in 2007, with total acres increasing by approximately 64%, from 28,180 acres in 2007 to roughly 46,418 acres in 2009. The vascular SAV taxa which saw dramatic increases in areal coverage during this reporting period were coontail (Ceratophyllum demersum), Hydrilla (Hydrilla verticillata), and southern naiad (Najas guadalupen-sis). Each of these SAV taxa increased in areal cov-
erage by >1000% from 2008 to 2009. The increase in peppergrass (Potamogeton illinoensis) was more modest (459%) from 2008 to 2009, while eelgrass (Vallisneria americana) areal coverage decreased by 31%. The target of at least 40,000 acres of SAV with >50% coverage by vascular SAV was achieved dur-ing summer 2009, as vascular SAV accounted for approximately 66% of the total SAV coverage. Chara areal coverage was similar over the past two years, ranging from 28,515 acres in 2008 to 25,278 acres in 2009 and thus has remained similar to pre-hurricane coverage observed during the summer of 2004. As the terrestrial and emergent plants in the inshore por-tion of the nearshore region become less dominant under lake stages which currently are higher than those observed during 2007–2008, SAV may con-tinue to recolonize these areas if a viable SAV seed bank is still present and the lake remains in the de-sired lake stage envelope of 12.5 – 15.5 feet above mean sea level.
Map of Lake Okeechobee with SAV densities in the nearshore region for 2009.

33
Lake Okeechobee Nearshore Zone
Key Findings 1. Total SAV coverage increased by approximately
64% from 2007 to 2009. If the lake continues to remain in the stage envelope considered favorable for SAV growth, and disturbance events such as hurricanes and droughts are infrequent, SAV cov-erage may continue to increase.
2. Chara spp. areal coverage has remained at ap-proximately pre-hurricane levels although the loca-tion of beds is offshore relative to its previous dis-tribution prior to the prolonged drought of 2007–08. Chara probably will not recolonize its previous range until emergent and terrestrial plant densities markedly decrease.
3. Dramatic increases in areal coverage were ob-served for several vascular SAV taxa during this reporting period. Coontail increased from 477 acres in 2008 to 12,489 acres in 2009, while Hy-drilla increased from 1,150 acres to 15,816 acres, and southern naiad increased from 1,208 acres to 13,500 acres. Peppergrass increased from 247 acres to 1,380 acres during the past 2 years, while eelgrass coverage changed little (9,405 acres in 2008 to 6,497 acres in 2009) and remained similar to that prior to the 2004 hurricanes (roughly 8,200 acres). Hydrilla and peppergrass areal coverage
are still somewhat lower than they were during the summer of 2004 (Hydrilla – 24,500 acres, pepper-grass – 6,700 acres), although at their present rate of expansion, they may exceed 2004 cover-age during summer, 2010.
4. Seedbank studies were conducted to assess whether viable vascular SAV seeds existed in the nearshore region but farther offshore from where vascular plants typically have been observed over the past decade. The areas where sediment was collected for these seedbank studies were located just offshore from where the inshore emergent and terrestrial plants became dominant in 2007. The study results suggested that very few viable seeds were located further offshore relative to where SAV had been found prior to the hurricanes in 2004.
5. Maintaining the lake within the recommended stage envelope as often as possible, which the current lake operating schedule should assist in doing, is important for the continued reestablish-ment and maintenance of the vascular SAV com-munity. Maintaining this range of lake stages also should continue to reduce the densities of emer-gent and terrestrial vegetation in the inshore areas of the lake, thereby enabling SAV to recolonize areas where it previously was found.
Zone/Performance
LAST STATUS
2-YEAR PROSPECTS
CURRENT STATUS
Submersed Aquatic Vege-tation Areal Coverage
NEARSHORE REGION
R
G
SAV coverage, especially vascular plant coverage, has increased since 2007. Chara spp. coverage has remained relatively constant over the past 2 years. Vascular plant cover-age dramatically increased for Cera-tophyllum, Hydrilla, Najas, and Pota-mogeton over the past 2 years, Val-lisneria coverage decreased slightly. Vascular SAV accounted for ap-proximately 27,931 total acres or 66% of total SAV.
CURRENT STATUS
G
2-YEAR PROSPECTS
The SAV response to reflooding upon the return to desired lake stages has been positive to date. As long as the lake remains within the desired lake stage envelope, it is anticipated that SAV areal coverage will continue to increase or at least remain similar to that observed dur-ing summer, 2009. Implementation of the LORRS 2008 lake regulation schedule should mitigate in favor of a downward shift in lake stages that might favor SAV expansion.
aThe previous status was based on peak 2007 (August) SAV areal coverage and targets of 40,000 acres of total SAV coverage, with at least 50% being comprised of vascular plants. bThe current status column is based on peak 2009 (August) SAV areal coverage and targets of 40,000 acres of total SAV coverage, with at least 50% being comprised of vascular plants. CThe assumptions being used for the 2-Year Prospects Column are that here will be no large changes in the lake regulation schedule operations from the date of the current status assessment and SAV will continue to expand into formerly occupied inshore areas.

34
Invasive Exotic Species
Summary Findings All modules have control programs for high priority invasive plant species on public lands, where pro-gress continues for some species such as melaleuca. Brazilian pepper and Old World climbing fern con-tinue to be serious invaders in most modules, al-though some localized progress is documented. However, decreasing funding trends threaten to re-verse progress as maintained areas become re-infested. Land managers continue to detect new non-indigenous species, and often lack information on distribution and control methods. Invasive plant man-agement on private lands remains deficient in all modules, ensuring continued invasion vulnerability to conservation lands. The Greater Everglades Module remains the only region with a systematic monitoring program for established species and there is some progress toward developing an early detection moni-toring network there. Other modules have insufficient monitoring programs for tracking invasive species.
Key Findings 1. Control of invasive plants is successful for a few
species, but only on public lands.
2. Biological control of melaleuca continues to be an important component of integrated pest man-agement for this species. Three agents are now well-established and melaleuca reduction is documented.
3. New insects have been released for several other serious invasive plants, and other agents are in development for release within 1-2 years. Significant progress towards implementation of the CERP biological control project is likely to further successes in biological control throughout south Florida.
4. Most of the modules have significant invasive exotic plant problems, which are affecting natural areas and altering natural habitats and proc-esses. In most cases, invasive plant populations are not being systematically monitored.
5. Reduced funding for control is a serious threat to management success to date. Land managers are concerned that previously restored areas may become re-infested if resources limit active maintenance control.
6. Monitoring programs to assess the trends in inva-sive exotic plants only cover the Greater Ever-glades Module and for only six high-priority spe-cies.
7. Monitoring that would identify new species or new distributions for existing species only covers portions of the Greater Everglades module, the other modules are not sufficiently monitored. Therefore, the ability to determine where and when new species arrive and establish is very limited.
8. Due to the scale of the problem, new species are becoming established, leaving the overall control picture mixed.
9. While good progress has been made with a num-ber of species, we are still unable to control many exotic plant species faster than they are invading and spreading. It is important to get ahead of the exotic plant invasion rate. Control and prevention programs would have to be expanded in order to do that.

35
Invasive Exotic Species

36
Invasive Exotic Species
Zone/Performance Measure
LAST STATUS
CURRENT STATUS
2-YEAR PROS-PECTS
CURRENT STATUS 2-YEAR PROSPECTS
KISSIMMEE RIVER
Y Y R
The Good: Many priority invasive spe-cies are successfully managed, al-though some difficult-to-control species continue to threaten restoration goals. Successful control programs for water hyacinth, water lettuce, and melaleuca. A new biological control agent for water hyacinth becoming established.
The Bad: Old World climbing fern distri-bution is expanding, and it is proving difficult to stay ahead of its spread. Many non-indigenous species occur in this region, for which little is known about their control, distribution, and potential invasiveness.
Little is known about many of the spe-cies that occur in this region, yet some are very serious weeds in other parts of world; rehydrated wetlands providing new habitat for aquatic species includ-ing hydrilla; new control programs show promise but many species lack effective programs.
LAKE OKEE-CHOBEE
Y Y Y
The Good: Existing control programs provide sustained maintenance control for many species, including melaleuca, and floating aquatic weeds, which is key in restoration efforts.
The Bad: New arrivals to Florida, such as tropical water grass and Wright’s nutrush, will likely continue to appear and pose new management problems; continued disturbance of littoral zone may increase chances of new invasions.
Continuation of successful control pro-grams are needed to keep species in check. Lapses in control efforts will re-sult in serious reinvasions of many spe-cies threatening region. Difficulties con-trolling torpedograss and West Indian marsh grass are a concern.
NORTHERN ESTUAR-IES—EAST COAST
Y Y Y
The Good: Progress with melaleuca, Brazilian pepper, and Australian pine, but infestations remain on adjacent pri-vate lands; a second biocontrol release for Old World climbing fern is showing promise. The Bad: Other species increasing, most not included in indicator monitoring programs; little known about many in-vaders.
Successes on public lands with several species are largely offset by increases in numerous new species; potentially serious invaders exist for which little is known about biology or spread; pro-gress in biocontrol expected.
NORTHERN ESTUAR-IES—WEST COAST
Y Y Y
The Good: Much progress made with melaleuca, Brazilian pepper, and Aus-tralian pine, but significant infestations remain on private lands. The Bad: Other species gaining foot-hold and most not included in any indi-cator monitoring program; little known about many invaders and not able to assess their status in an objective or repetitive way.
Successes on public lands with several species are offset by increases in new species; other species localized but numerous; potentially serious invaders exist for which little is known about biol-ogy or spread; monitoring programs needed to improve control.

37
Invasive Exotic Species
Zone/Performance Measure
LAST STATUS
CURRENT STATUS
2-YEAR PROS-PECTS
CURRENT STATUS 2-YEAR PROSPECTS
BIG CY-PRESS
R Y Y
The Good: Good control of melaleuca and Australian pine; aggressive control program for Brazilian pepper and Old World climbing fern underway. System-atic monitoring program in place.
The Bad: Two potentially serious invad-ers, crested floating heart and cogon-grass, are present in module; control efforts for cogongrass ineffective.
Exotic populations decreasing signifi-cantly on publicly-owned areas; many species still localized.
GREATER EVER-GLADES
Y R R
The Good: Integrated control of me-laleuca, Brazilian pepper, Old World climbing fern, and other species con-tinue in Water Conservation Areas. Sys-tematic monitoring program underway. No new serious invaders detected. The Bad: Brazilian pepper and Old World climbing fern still widespread in other areas and appear to be expand-ing; still several other species present with little or no control effort or efficacy.
The ability to maintain current control of priority species is threatened by declin-ing resources. Biological controls for Old World climbing fern and Brazilian pepper are needed for successful con-trol; ongoing monitoring efforts are im-proving management decision-making and tracking; other species still local-ized.
SOUTHERN ESTUARIES
Y Y Y
The Good: Control programs under way for many years; significant control achieved for Australian pine. Successful early detection and rapid response of a newly detected mangrove invader.
The Bad: Several new species inva-sions and possible effects unclear; most of Florida Bay not included in any moni-toring program. Latherleaf, a serious invader of rare habitats along the south-ern coast of the park, continues to ex-pand.
Numerous new invasive species that are not included in a systematic control or monitoring program and are serious unknowns.
FLORIDA KEYS
Y G G
The Good: Much progress made on Australian pine, sickle bush, laurel fig, and other priority species. Well-developed management programs in place. Progress in developing region-wide early detection/rapid response network.
The Bad: Populations of some priority species on private lands remain uncon-trolled; continued use of some invasive species in private landscapes; potential expansion of Guinea grass a concern.
Significant control programs in place; progress on many species evident, con-tinued monitoring and control needed to prevent reinvasions and new introduc-tions.

38
References
Literature Cited Bennett, James P. 2000. Ecological Indicators for the Nation: Committee to Evaluate Indicators for Monitoring Aquatic and
Terrestrial Environments, National Research Council, National Academy Press, Washington, DC. 180 p., ISBN 0-309-06845-2.
Dale, V.H. and S.C. Beyeler. 2001. Challenges in the development and use of ecological indicators. Ecological Indicators 1, 3-10.
Dennison, W.C., T.R. Lookingbill, T.J.B. Carruthers, J.M. Hawkey, and S.L. Carter. 2007. An eye-opening approach to de-veloping and communicating integrated environmental assessments. Frontiers in Ecological Environments 5, 307-314.
Dunwoody, S. 1992. The media and public perceptions of risk: How journalists frame risk stories. In D.W. Bromley, Seger-son, Kathleen (Ed.), The social response to environmental risk. Policy formulation in an age of uncertainty. 75-100. Boston.
Jackson, L.E., J.C. Kurtz, and W.S. Fisher (Eds.). 2000. Evaluation guidelines for ecological indicators. EPA/620/R-99/005. U.S. Environmental Protection Agency, Office of Research and Development, Research Triangle Park, NC. 107p.
Madden, C. J., D. T. Rudnick, A. A. McDonald, K. M. Cunniff, J. W. Fourqurean. 2009. Ecological indicators for assessing and communicating seagrass status and trends in Florida Bay. Ecological Indicators 9S (2009) S68–S82.
Niemi, G.J. and McDonald, M.E., 2004. Ecological indicators. Annual Review of Ecology, Evolution, and Systematics 35, 89-111.
Norton, B.G. 1998. Improving ecological communication: the role of ecologists in environmental policy formation. Ecological Applications. 8: 350-364.
Parrish, J.D., D.R. Braun, and R.S. Unnasch. 2003. Are we conserving what we say we are? Measuring ecological integrity within protected areas. Bioscience, September 2003; Vol. 53, No. 9, pp. 851-860.
Rowan, K.E. 1991. When simple language fails: Presenting difficult science to the public. Journal of Technical Writing and Communication 21, 369-382.
Rowan, K.E. 1992. Strategies for enhancing comprehension of science. In: Lewenstein, B.V., (Ed.) When Science meets the Public. American Association fo rthe Advancement of Science, Washington, DC.
Schiller, A., C.T. Hunsaker, M.A. Kane, A.K. Wolfe, V.H. Dale, G.W. Suter, C.S. Russell, G. Pion, M.H. Jensen, and V.C. Konar. 2001. Communicating ecological indicators to decision makers and the public. Conservation Ecology 5(1):19. http://www.consecol.org/vol5/iss1/art19/.
Weigold, M.F. 2001. Communicating Science: A Review of the Literature. Science Communication 23, 164-193.
Additional Information RECOVER Monitoring and Assessment Plan: http://www.evergladesplan.org/pm/recover/recover_map_2009.aspx
RECOVER System Status Report: http://www.evergladesplan.org/pm/ssr_2009/ssr_main.aspx#
System-wide Ecological Indicators for Everglades Restoration, 2008 Report: http://www.sfrestore.org/scg/documents/2008_System-wideIndicatorsReport.pdf

39
Principal Scientists
Principal Indicator Scientist
Indicator Email Phone
Joe Boyer Florida Bay Algal Blooms [email protected] 305-348-4076
Joan Browder Pink Shrimp [email protected] 305-261-4270
Peter Frederic White Ibis and Wood Stork [email protected] 352-846-0565
Evelyn Gaiser Periphyton [email protected] 305-348-6145
Jerry Lorenz Roseate Spoonbill [email protected] 305-852-5318
Chris Madden Florida Bay SAV [email protected] 561-682-4647
Frank Mazzotti Crocodilians [email protected] 954-577-6304
LeRoy Rodgers Invasive Exotic Species [email protected] 561-682-2773
Andy Rodusky Lake Okeechobee Nearshore [email protected] 561-682-4566
Joel Trexler Fish and Macroinvertebrates [email protected] 305-348-1966
Aswani Volety Oysters [email protected] 239-590-7216
1