early warning system 2008
DESCRIPTION
ÂTRANSCRIPT
Annual Report – 2008web edition

Bosnia and HerzegovinaUnited Nations Development Programme
EARLY WARNING SYSTEMAnnual Report – 2008
Although publication of this Report is supported by the UnitedNations Development Programme (UNDP) the opinions statedherein do not necessarily reflect the official position of theUnited Nations Development Programme (UNDP)
Assistant Resident Representative: Armin SIRČO Project Coordinator: Tarik ZAIMOVIĆ; Mersiha ĆURČIĆReview by: Peter van RUYSSEVELDT, Deputy ResidentRepresentative; Armin SIRČO, Assistant Resident RepresentativeEditors: Tarik ZAIMOVIĆ; Desmond MAURERAuthors: Dina DURAKOVIĆ M.A.; Adnan EFENDIĆ M.Sc.Aleksandar DRAGANIĆ M.A.; Ivan BARBALIĆ M.A.Fahrudin MEMIĆ; Edin ŠABANOVIĆ M.Sc.Translation: Desmond MAURERCover design: Tamara KORENDTP & Layout: Samira SALIHBEGOVIĆ

3
Annual Report 2008
CONTENTS
FOREWORD..................................................................................................................................................................................5
Executive Summary ............................................................................................................................................................7
I POLITICAL STABILITY IN BIH ....................................................................................................................................................15
1. A year of political instability and profound institutional crisis ....................................................................................15
2. SAA signed, but lack of follow-up produces strong international criticism ..................................................................16
3. Public pessimism prevails..............................................................................................................................................18
4. Support for European integration high ........................................................................................................................18
5. Support for the SNSD down..........................................................................................................................................19
II INSTITUTIONAL STABILITY IN BiH............................................................................................................................................21
1. Gridlock at BiH and FBiH levels reflect pervasive political crisis ..................................................................................21
2. Ethnic groups differ significantly over government institutions ..................................................................................22
3. Support for OHR split on ethnic lines ..........................................................................................................................24
III ECONOMIC STABILITY IN BiH ................................................................................................................................................27
1. Industrial production up ..............................................................................................................................................28
2. Unemployment still a major macro-economic problem ..............................................................................................28
3. Retail prices up significantly over year, as Central Bank of BiH reserves fall ................................................................29
4. Trade deficit at worrying level ......................................................................................................................................30
5. The public see economy as doing poorly. ....................................................................................................................30
6. BiH institutions are too costly and time-consuming and getting more so ..................................................................33
IV THE BUSINESS ENVIRONMENT IN BiH ..................................................................................................................................35
1. Economic situation worsens during 2008 ....................................................................................................................35
2. Idle capacity in every second company.........................................................................................................................36
3. Financial indicators for Bosnian companies getting worse. ..........................................................................................36
4. Inefficient government, unfair practices, and the high tax burden hamper private sector operations ......................37
5. High direct and indirect costs of domestic institutions ................................................................................................38
V INCOMES AND SOCIAL WELFARE............................................................................................................................................41
1. Fewer households without income during 2008 ..........................................................................................................43
2. Public expectations subject to various influences during 2008....................................................................................44
3. Purchasing power and living standards unchanged through 2008 ..............................................................................47
4. Social protection and minimum living standards largely unchanged ..........................................................................50
VI SOCIAL INCLUSION ................................................................................................................................................................53
1. Some aspects of social inclusion ..................................................................................................................................53
2. Minority and majority samples share same views on the economy ............................................................................56
3. Pessimism over the political situation ..........................................................................................................................58
4. Ethnic identity and citizenship in conflict for most ......................................................................................................59
VII ETHNIC RELATIONS ..............................................................................................................................................................61
1. The Ethnic Stability Index..............................................................................................................................................61
2. Exploitation of ethnic divisions in political life continues ............................................................................................62
3. Reported discrimination falls over year as a whole......................................................................................................63
4. Support for refugee return recovers ............................................................................................................................63
5. Measures of social distance between ethnic groups improve......................................................................................64
6. Separatism and Nationalism ........................................................................................................................................65
VIII PUBLIC AND PERSONAL SECURITY ......................................................................................................................................69
1. The Security Stability Index ..........................................................................................................................................69
2. Concern over public safety issues at beginning in the year fades as year goes on ......................................................70
3. Rates fall for most crimes, for most categories of the population ..............................................................................71

2008% I quarter II quarter III quarter IV quarter
Political stability indicators
Politically speaking, the situation in BiH is getting worse � -14 -17 � 0.9 � 12.4
Would emigrate � -3.4 -4 � 3.4 � -1.2
View EU membership with hope � 8.9 1.8 � -7.4 � -3.5
Think EU membership is important for political stability in BiH � 1.8 -1.3 � -1.8 � 0
Support the process of joining the EU � 4.5 -2.7 � -1.6 � 0.3
Institutional approval ratings
Confidence in Presidency � 4.3 -3.1 � 0.2 � 1.9
Confidence in Council of Ministers � 4.9 -4.3 � 1.4 � 2.9
Confidence in FBiH Parliament � 5.9 -5.2 � 2 � 0.5
Confidence in FBiH Government � 6.6 -5.6 � 1 � 2.8
Confidence in RS National Assembly � -1.6 -4.7 � 1.3 � 2.4
Confidence in RS Government � -2.4 -4.3 � 1 � 2.2
Confidence in OHR � -0.3 -6.5 � 2.6 � 2.7
Confidence in EU � -0.3 -3.5 � 0.6 � 5.5
Economic and fiscal stability indicators
Industrial production � 6 � 6 � 7 � 8
Unemployment � 2 � 2 � 8 � 3
Retail prices � 6 � 7 � 8 � 8
Foreign reserves � 30 � � �
Balance of trade � 5 � 2 � 1 �
Incomes and social welfare indicators
Average wages � 7 � 4 � 1 � 3
Consumer basket/average wage � � 1.5 � �
Average pension � 7 � 7 � 1 � 6
Minimum pension � 15 � 2 � 2 � 2
Average pension/average wage � � � � 3
Would emigrate � 10 � 10 � 10 �
Would protest over low income � � 5 � 7 �
Households with < 500 KM a month � 7 � 10 � � 15
Ethnic relations indicators
Human rights violations related to ethnicity (reported) � -3.5 � 1.6 � -0.1 � 0.7
Accept return by refugees and displaced � 2.5 � -1.5 � -5 � 4.8
Willing to share country with other ethnic groups � 0.5 � 1.5 � -0.4
Strong pride in being citizen of BiH � -3.9 � -5.3 � -2.8 � 0.6
Concern that war might break out again � -5 � -10 � 6.6 � 4.5
Public support for ethnic parties � -1.2 � 3.9 � 8.3 � -10
Security indicators
Illegal behaviour by police � -3.9 � 1.8 � -4.3 � 1
Level of crimes against property and person(reported by our sample) � 1 � 3.9 � -0.1 � -1.4
Number of requests for police assistance � -1.9 � 0.3 � 0.9 � -0.8
Public satisfaction with police assistance � -9.3 � -30
4
Ann
ual R
epor
t 200
8

5
Annual Report 2008
FOREWORD
As 2008 closes behind us and the Early Warning System project finishes its eight year of monitoring publicopinion in the key areas of politics, the economy, social security, ethnic relations, and public safety, we arestruck by the degree to which the situation has remained unchanged over the past several years. The list ofmost important current issues remains much the same, including as it does:
- the process of integration with Europe and the various associated reform processes,
- the continued failure to revise the post-Dayton settlement in a way that is acceptable to therepresentatives of all three constitutive peoples, while guaranteeing political stability and effectivegovernment,
- the establishment of local ownership of and responsibility for the political process.
One may, certainly, add to this list the worsening economic situation and the potential impact of the globalcrisis. In the foreword to last year’s annual report we pointed out the extent to which the political situationhere has benefited in recent years from an economic cushion. We warned that this could not be expected tobe the case for much longer. It is clearly no longer the case. As the economy shifts from a cushioning to anexacerbating role, we may expect the structural incapacity of the Bosnian political system agreed at Dayton tobecome increasingly clear. Dayton probably represented the best deal possible at the time and it did end a war.What is more, some of the compromises achieved at Dayton continue to be necessary. But some elements ofthe agreement have served their function and there is a need to move beyond them. Dayton must be builtupon in such a way that citizenship and not nationality becomes the structuring principle.
Armin Sirčo
Assistant Resident Representative,
UNDP BiH

EXECUTIVE SUMMARYAs we enter the new year, with the global economy in the throes of crisis, the promise of a new
geopolitical order on the horizon, and the American neo-conservative establishment that has dominatedUS and so World foreign policy over the past eight years set to be replaced by “pragmatic idealism” and“smart power,” there are unfortunately signs, particularly for Bosnia-Herzegovina, that this maynonetheless be a case of “Ring out the old, ring in more of the same.”
Signs that this may be the case include continued political gridlock and continued use of radical andethnically divisive rhetoric, as the mandate of the Office of the High Representative was extended with allpowers intact and the European Union presented another critical progress report. There have beenreports that government finances are facing difficulties, particularly in the Federation. This is unlikely tobe helped by the removal of customs on EU goods. This does not provide a particularly favourable politicalenvironment for dealing with the economic crisis, whose impact will only be the worse, given the alreadyhigh (real) unemployment rate, the degree of unused capacity in the economy, and the role played ineconomic activity by casual or part-time or temporary labour. The prospect of public dissatisfactionincreasing as we enter the spring and finer weather seems realistic.
As the graph makes clear, there has been no major change in overall stability in Bosnia andHerzegovina over the year. In fact, it has improved, recovering fairly steadily from the low in November2007. The main Stability Index thus increased from 57 points at the end of 2007 to 59 in both the first twoquarters of 2008 and to 60 in both the third and fourth quarter. The individual indices are, as usual, mixed,but with the exception of the Ethnic Stability Index generally show an upward trend in the early part ofthe year and no change in the second half. It is worth noting that while the ethnic, economic, and socialstability indices suffered a low in November 2007, from which they have since been recovering, thePolitical Stability Index underwent its collapse in mid-2008. While it has recovered somewhat in the latterhalf of the year, that recovery is relatively weak.
This should not be taken to mean that the situation has been improving. Just that it has not beengetting even worse since these various lows. Our indices are indices of stability in the various areas, notof health. There was an objective boost to stability in all areas during the second two quarters of the year,following the signing of the Stabilization and Association Agreement with the EU. That the indicesstagnated in the latter half of the year is due to the fact that signing the SAA has been followed by littleif any further progress, and the EU and the international community more widely have becomeincreasingly impatient and explicit in their criticism of domestic politicians, on the one hand, whileincreased spending on public salaries and transfers has taken the edge off the significant inflation thatmarked the beginning of the year and the economic indicators suggest a time lag in the impact of the
BH Stability IndicesGraph 1
7
Annual Report 2008

global economic crisis, which has begun to affect business but has yet to impinge fully on the publicconsciousness, on the other.
As the following six graphs make clear, the current modest upward turn in the indices does not offersignificant grounds for optimism. The graphs show the trends in the indices (taken as annual averages) since
BiH Political Stability Index and trendlineGraph 3
The BiH Stability Index and trendlineGraph 2
BiH Social Stability Index and trendlineGraph 5Trends in the Economic Stability Index
for BiH
Graph 4
BiH Ethnic Stability Index and trendlineGraph 7
BiH Security Stability Index and trendlineGraph 6
8
Ann
ual R
epor
t 200
8

2000. It is clear that only the Ethnic Stability Index follows an essentially positive pattern. The others for themost part improved considerably in the early years of the decade, then entered a decline in 2002 thatgathered pace in 2004-2005 as both the economic and political situation worsened. There was a modest rallyin 2006, after which the downward momentum was restored. The final upward turn in the BiH Stability Indexis clearly due to the relative health of the economic and social welfare indicators, which can hardly beexpected to continue. Given the intractability of the political situation and the impact of the global financialand economic crisis, it is difficult to see how the downward movement evident since 2001 will not continue.
Turning now to the individual sections of our report, 2008 was clearly a year of political instability andprofound institutional crisis. Our Political Stability Index fell to its lowest recorded level in the secondquarter (48 points) and, as the above graph shows, the average for the year was also the lowest yet, at 50.5points. This was in spite of the fact that the year saw an apparent culmination of two years of negotiationand political drama over the signing of the Stabilisation and Association Agreement the European Union.Legislation for police reform was finally passed and the country was able to proceed with finalising the SAA.It was, however, the last country in the region to do so. Moreover, the aftermath has proven anything butsmooth. Through most of the year politicians proved incapable or unwilling to move ahead with theobligations involved in signing, in particular moving forward on constitutional reform. Instead, nationalistrhetoric was ramped up and divisions came increasingly to the fore both between and within the entities.
The pattern of divisive rhetoric was maintained, not least because of the local elections held inOctober. The results of these elections changed little in the balance of power, though it was clear thatboth the SNSD and the SBiH lost ground to more moderate partners. Nothing came, however, of talkabout restructuring the ruling coalitions at federal or state level.
The political atmosphere in the country was recognised with concern by members of the internationalcommunity previously active within Bosnia and Herzegovina and by relevant institutions of the EuropeanUnion and the wider international community, namely the European Commission, the PeaceImplementation Council, and the Council of Europe's Parliamentary Assembly. A number of resolutionswere passed condemning the failure to meet various conditions under various processes or to progresspast the signing of the SAA as well as any attempts to undermine the status of either the state of Bosniaand Herzegovina or either of its constituent entities. The High Representative, however, did not translatethe concern of the international community into punitive action against any of those responsible for theunsettled political conditions in the country. In early November, the European Commission adopted aProgress Report on Bosnia and Herzegovina that made clear how little progress it saw as having been madeover the year and how much damage had been done by the irresponsible and reckless behaviour of leadingpoliticians within the country. Moreover, the country and its leading politicians were warned that, unlessthings changed considerably and soon, they had little to expect of the European Union. Finally, we maynote, that at the end of November the European Union foreign and defence ministers announced theirintention of strengthening EU involvement in the country, but without specifics.
Other important events during the year that further complicated an already complicated situationincluded the unilateral declaration of independence by Kosovo and, to a lesser extent, the arrest ofwartime Bosnian Serb leader Radovan Karadžič in July.
In the final quarter of the year, the leaders of three leading ethnic parties, Milorad Dodik, SulejmanTihić, and Dragan Čavić, agreed a series of compromises in Prud over the most important political issuesand those most directly related to European Union concerns, including constitutional reform, the statusof Brčko district, the status of national property, etc. This agreement was warmly welcomed by theinternational community, rather less so by other domestic politicians, parties, and the public generally. Itremains to be seen what practical results it will have.
As a result of the political ferment over the year, it will come as no surprise to learn that both federaland state level were essentially subject to gridlock, with great difficulty passing legislation. Moreover, asthe international financial crisis began to bite, the fragility of the budgetary position of the Federation andto some extent the state-level became clearer. In fact, the Federal Minister for Finance has issued severalwarnings that the Federation was facing possible bankruptcy.
The situation was certainly not helped by the constant talk of restructuring or dissolution of thecoalitions at state and federal level, nor by the fact that no restructuring took place. As a consequence,
9
Annual Report 2008

there could be little surprise that the Peace Implementation Council announced that the Office of theHigh Representative would not be closing in 2009. There has, moreover, been a growing consensus withinthe Federation and in some parts of the international community that the crisis of the last year or so hasmade clear that the Office of the High Representative has a crucial role to play in ensuring the stability ofthe country for some time to come. Given the relatively passive role played by the current incumbent,however, it is not clear what that role will be precisely.
Overall, our survey results are in line with the generally poor political conditions in the country overthe year. The very pessimistic public mood already evident in 2007 continued through 2008. At thebeginning of the year, nearly 80% of the Bosniak majority area sample and nearly 60% of both the Croatand Serb majority area samples were of the opinion that political life is headed in the wrong direction.This softened somewhat in the middle of the year, but hardened again towards the end, when again 80%of the Bosniak Sample and approximately 50% of both the Serb and Croat samples were of the view thatpolitically things were getting worse (see Tables I and II for political stability in annex). This is in spite ofthe signing of the SAA. This pessimism was also evident with regard to the economy (see below).
The public continue to see salvation in integration with Europe. More than 75% of the total samplesaid they supported the process through the year. Support was particularly high amongst Bosniaks(around 90% from the year). The percentages for the Croat and Serb samples were in ranges from 65 to78% and from 56.9% to 67.1%, respectively. This, no doubt, reflects the fact that a certain percentage ofthese two groups see salvation in neighbouring countries rather than membership of a trans-nationalunion. It is worth noting that Serb sample support for integration with Europe dropped 10 points overthe year. The views of the ethnic samples as to how important EU membership is for political stabilityhere follow the same pattern. Even less welcome is the fact that fewer of the total sample now view theprocess of integration with Europe from the perspective of hope than previously: down from 73 to 64%.In fact, only 50% of the Serb sample viewed the process with hope, compared to 75% of the Bosniak and65% of the Croat samples. (See Tables VI, VII, and VIII for political stability section in annex).
When it comes to support for political parties, the main change was the declining support for theSNSD, which began the year with 45% support in the Republika Srpska and ended it with just 24%. As aresult it lost its position as the most popular party in the country to the SDP. The support leaked by theSNSD did not transfer to any other party, its former supporters preferring to declare as “don’t know” ordeclining to answer questions in this regard. (See Table IX for political stability section in annex).
It may therefore not surprise that both the Serb and Bosniak samples were increasingly criticalregarding the parties in power over the year, with particularly few Bosniaks taking the view that the partiesin power were in any way successful in defining or implementing key reforms, capable of meeting theconditions required for progress to integration with Europe, or deserving to stay in power. The Croats wereless critical than in previous years, indicating a certain consolidation of Croat support behind the HDZ BIH.
This is reflected in the relatively low approval ratings of various government institutions through theyear: around 40% for the state level institutions, 38% for federal institutions, 39% for RS institutions, andaround 51% for the municipal level. The showing of the municipal level, relative to the others, is largely dueto a spike after the local elections. As previously, at least since the SNSD took power in the Republika Srpskaand to a large extent at state-level, the Serb sample showed the most confidence in all levels of government,including federal institutions, followed by the Croat sample, with the Bosniaks considerably behind. This isindicative of the extent to which the RS sample support the SNSD policy that less is more, when it comes tocentral government. International institutions fared a little better, with overall support ranging from 38% forthe United States to 46% for UNDP. Results were similar with regard to perceived corruption in governmentand international institutions. (Tables I and II and V on institutional stability in annex).
Finally, with regard to political and institutional stability, we note that attitudes towards the Office ofthe High Representative remained split on ethnic lines. While an average of 44% of the overall sampleexpressed approval of OHR’s job performance, this was due to higher support amongst Bosniakscounterbalancing lower support amongst Serbs. Croats were somewhere in between. Even amongstBosniaks, the approval rating was only around 50%. (Table II on institutional stability in annex).
Much the same pattern is true of approval for the various OHR-led reform measures, with theBosniak approval ratings in and around 50%, compared to Serb ratings in and around 30%. The pattern
10
Ann
ual R
epor
t 200
8

regarding the powers of the High Representative is even clearer, with a considerable majority (about 70%)of the Serb sample in favour of reducing the powers of the office, compared to a considerable majority ofBosniak's in favour of increasing them or at least leaving them as they are. Croats again were to be foundsomewhere in between. (Tables VI and VII on institutional stability in annex).
When we come to economic stability in Bosnia and Herzegovina, we find at first glance a rather morepositive picture, as the Economic Stability Index recovered over the year from a low of 43 points inNovember 2007, spending the year in the range from 46-48 points. The improving or at least notdeteriorating Economic Stability Index is in part due to the relatively buoyant economic indicators for theyear and in part to the slowness of public opinion to react to the global economic crisis. For example:
• Industrial production was up in both entities over the year, 8% in the Federation and 17% in theRepublika Srpska. The increase in the Republika Srpska was in large part due to an astonishingdoubling of production in December 2008 compared to December 2007. (Table I on economicstability in annex).
• While unemployment remains a major macroeconomic problem, there was a near 10% reductionin official unemployment over the year, with 40,000 fewer unemployed people in November 2008that there had been in late 2007. Most of this reduction was in the Federation. (Table II oneconomic stability in annex).
• The news regarding inflation was more mixed, with strong growth in prices during the first half ofthe year, particularly in response to international pressure on food and fuel prices. This affectedfood, utilities, and service industries most and was hardest on the poorest families. As in otherparts of the world, this pressure eased during the second half of the year. (Table III on economicstability in annex).
• Central Bank reserves continued to rise over most of the year, beginning to fall only in the final quarter,when they lost some 500 million in total. By the end of the year, however, they had begun to climbagain, so the nature of the long-term trend is unclear. (Graph III on economic stability in annex).
• The most worrying indicator is, as always, the trade deficit and the export-import ratio. The ratiowas as low as 41% and the country generated a more than 9.5 billion KM deficit for the year.Further liberalisation of trade is set to take place in early 2009, particularly with the removal ofcustoms on imports coming from the European Union, which already make up a very largeproportion of total imports and exports .This will hardly make things any easier, particularly withregard to the government's current fiscal problems. (Table V on economic stability in annex).
This situation is reflected in the moderate pessimism expressed by our sample in all surveysconducted through 2008. More than half took the view that there had been no major changes in theeconomy over the previous year, while a third or more described the economy as deteriorating. Althoughgenerally negative, public opinion regarding the economy was, however, subject to moderateimprovement (i.e. reducing pessimism) during the first three quarters. This was halted in the fourthquarter, as awareness of the likely consequences of the global crisis filtered through. The federal samplewas moderately more pessimistic than the Republika Srpska sample, with Bosniak majority areas the mostpessimistic, followed by Serb majority areas, and then Croat majority areas. (Table VI on economicstability in annex).
When it comes to expectations, the public was also generally pessimistic, but not increasingly so.Even at the end of the year, only 25% said they expect things actually to get worse economically speaking,while the majority, as usual, expects more of the same. Moreover, the sample became somewhat lessconcerned than it was about the possibility of rising prices, though 63% still expect them to rise. As manyas 20% even expect their income to improve. On the other hand, on average more than 80% of oursample expect not to be able to save over the coming year. (Tables VII-XII on economic stability in annex).
Our questions regarding the efficiency of institutions and their economic impact on the public alsoreveal a disturbing picture. In general, a majority of our sample think that institutions in Bosnia cost morethan they should, both in money and in the time required to carry out tasks. Asked to quantify this, theysaid they add somewhere between 10 and 30% to their living costs in direct costs and an additional 10 to30% in indirect costs. A not insignificant percentage of the population therefore said that governmentinstitutions add as much as 60% to their cost of living. This is after taxation and contributions. When it
11
Annual Report 2008

comes to the institutions responsible for fiscal and monetary policy, the Central Bank and the IndirectTaxation Authority were best ranked in terms of their job performance through the year. Worst rankedwere the Privatisation Agencies, the Employment Bureau, and the Foreign Investment Promotion Agency.This makes clear that the public see the benefit of the monetary and fiscal agencies responsible forproviding a stable framework for the economy, but not of those tasked with hands-on stimulation of thebusiness environment, and perhaps there is some justice in that view. (Tables XIII-XVIII on economicstability in annex).
Our survey of 150 top managers tended over the year to display a rather bleaker picture of thebusiness environment and economy in Bosnia and Herzegovina. By the end of the year as much as 70%of the business sample was describing the economic situation in the country as having deteriorated, whileonly 4% described it as better than last year. Business sector expectations for first six months of 2009 arehardly any more optimistic. 62% of the sample think things will deteriorate and only 3% expect them toimprove. (Tables I and II on business sector stability in annex).
This is reflected in the fact that there is increasing idle capacity in the economy, with 50% ofcompanies underutilising existing resources. Financial indicators are no better, with nearly 30% of thesample saying their results were worse than last year. 43% said they expect them to get even worse.There has also been an increase in company debt, particularly in the RS. All together these indicatorscontribute to the fact that only 69% of the sample in December 2008 said they had made a profit. Thiscompares to around 80% in 2007. These indicators generally deteriorated over the year, suggestive of anongoing slump. (Tables IV, V, and VI on business sector stability in annex).
Companies put much of the blame for the situation on the various levels of government and the factthat they are more of a hindrance than a help to the conduct of business. The sample regularly find state-level least helpful and municipal level most helpful. When asked about specific barriers to business, againit seemed clear that most of the worst obstacles related to administration or government rather thangeneral economic conditions. In the polls of 2008, the focus tended to be on the courts as an obstacle tobusiness, followed by the tax burden, corruption, and in fourth place unfair business practices. These fourfactors have consistently been identified as the main obstacles, though there is some difference as to theranking from quarter to quarter. Moreover, they were consistently identified as such by more than 80%of the sample. (Tables VII, VIII and IX on business sector stability in annex).
Finally we may note that business was as critical as the public of the high direct and indirect costsassociated with domestic institutions. A very high percentage of companies said such costs add anywherebetween 10 and 40% to their costs, seriously affecting their competitiveness under tougher globaleconomic conditions. The percentage was higher in the Federation than in the RS. It is perhaps no greatsurprise to find that the most efficient institutions, according to the business sample, were the CentralBank, the Indirect Taxation Authority, and the entity Tax Administrations, while the least effective werethe legal system, the Privatisation Agencies, and the Social Insurance Funds. Nor is it particularlysurprising to find that nearly 70% of companies admit to using informal connections and contacts to getthings done. In fact, they have been increasingly willing to admit to using such means over the year andparticularly since the third quarter. (Tables Xff on business sector stability in annex).
Next we come to incomes and social welfare, where the situation through the year was at leastapparently stable. Like the Economic Stability Index, the Social Stability Index recovered early in the yearfrom a low in November 2007 and maintained its new position, higher than the low but still relativelyweak compared to its average in earlier years. This is not unrelated to the issue of household income, asthere was a reduction in the number of households without any income or with less than 500 KM permonth, as average salaries increased over the year, keeping pace with increasing living costs (Tables I andII on incomes and social welfare in annex). Moreover, pensions increased during the year, particularly thehighest pensions (Table XIIIa on incomes and social welfare in annex). We have already mentioned anumber of the other important factors, particularly the decline over the year in the percentage of thesample who expect the economic situation to deteriorate, down in Bosniak majority areas from 70.8% inlate 2007 to 39.7% in late 2008, and from 46.1% to 20.1% in Croat majority areas, while unchanged in Serbmajority areas at around 28% (Table V on incomes and social welfare in annex) This may, of course, berelated to a feeling that things have got as bad as they can. There may also be a certain admixture of reliefthat the rising prices of early 2008 seemed to be over and done with, as global fuel and food prices had
12
Ann
ual R
epor
t 200
8

begun to come down. On the other hand, there was a reduction in the percentage who expect their cashincome to fall, from 19.1% to 14.2% in the Federation and from 14.42% to 8.89% in the Republika Srpskabetween November 2007 and 2008, with a smaller but still significant increase in the percentage whoexpect household income to actually increase (Tables VI and VIII on incomes and social welfare in annex).Again this is no doubt related to the fact that incomes have been rising, even if largely thanks to increasedgovernment spending rather than increased real employment or productivity. As government budgetscome under increasing strain in 2009, this expectation is likely to look increasingly unrealistic. Finally, theinitial bite of the economic crisis may be seen in the reduction in the already small percentage who expectto be able to save, as well as the increase in the percentage who think they might lose their job over thecoming three months (Tables IX and X on incomes and social welfare in annex).
Behind the relative complacency of the general population seems to be the increase in salaries,pensions, and benefit payments, and so overall incomes, through the year, so that price inflation did nothave the impact it might have. The average salary in October 2008 was approximately 780 KM in bothentities, an increase of 24.68% on the average salary in the RS a year before, though just 12% in theFederation (Table XIIIa). This increase in salaries is largely due to higher public-sector salaries and mayprove unsustainable even in the short term. The similar increase in pensions in both entities is alreadyproving difficult to finance.
There are therefore reasons for believing that 2009 may be marked by significant difficulties in socialsecurity and social welfare, as government resources prove inadequate to meet increased demands uponthe system. In this regard, it is worth pointing out that steps were taken during 2008 to create a NationalSocial Inclusion Strategy, but there is still no clear indication as to when the strategy will be completed oradopted. Moreover, the government has shown signs during 2008 of accepting the need for systematicsolutions to ensure a minimum standard of living and adequate social welfare and protection. The RSgovernment introduced regulations at the end of the year to increase the allocation for social welfare, butthe burden will be borne by the municipalities, who simply do not have the resources, particularly thesmaller municipalities. There is considerable ground for concern that the impact of the economic crisis maybe felt most by the worst off in 2009, as employment contracts, incomes fall, and government funds dry up.
In this respect it is worth stressing the findings of our social inclusion section which found significantand consistent differences on the basis of our surveys between the ethnic minority and majority sampleson the various ethnic majority areas in terms of their reported income and economic self-assessment,over and above the differences between the ethnic majority areas themselves. Perhaps the most concreteexample is the considerable gap between majority and minority samples when it comes to the possessionof consumer durables, like cars or mobile phones. This is compounded by the fact that rural householdsare clearly worse off than urban ones, while female headed household are worse off than male headedones. These economic differences are compounded by major differences in the degree to which membersof the minority and majority samples in the various areas respond to political life and in particular theextent to which they identify with their ethnic group and with the civic and political unit of which theyform a constituent part, namely Bosnia and Herzegovina. Nowhere is this clearer than between themajority and the minority samples in the Serb majority areas. There are similar differences between theethnic majority and minority samples in terms of the approval ratings for the various levels ofgovernment, the courts and the police, and the Office of the High Representative.
This picture is confirmed by our section on ethnic relations. The Ethnic Stability Index was relativelyhigh through the year, peaking during mid-year, but still ending 5 points up on the low of 72 for November2007. As noted above, this is the only one of the indices to have maintained a generally positivemovement over the past 8 years, no doubt reflecting the gradual subsidence of ethnic passions caused bythe war. This was in spite of a year in which much of political life seemed to be designed primarily atcausing ethnic divisions and strife, from the reaction to the Kosovo declaration of independence, throughdisagreement over the census, and the RS Prime Minister’s decision to withdraw from the state-levelelectricity distribution company and similar grandstanding related to and following the local electioncampaign. It is therefore encouraging that our sample was less likely to report harassment on ethnicgrounds during 2008 than it had been in 2007 (Table I on ethnic stability in annex). Unfortunately thisdecrease relates primarily to Bosniak majority areas and there were in fact increases in Serb and Croatmajority areas, particularly with regard to the minority samples. There was a more general increase in
13
Annual Report 2008

14
Ann
ual R
epor
t 200
8
support for at least the idea of minority return, with a jump in support in both Bosniak and Serb majorityareas, but no in Croat ones (Table II on ethnic stability in annex).
Less positively, when it comes to measures of social distance between the ethnic groups, we find thatCroats became less tolerant of Bosniaks and Serbs over the year, with considerably fewer finding itentirely or generally acceptable to have Bosniak or Serb neighbours, see their children go to schooltogether, have a Bosniak or Serb boss, etc. Bosniaks were also more intolerant than before of Serbs andCroats. By contrast, Serb acceptance of both Bosniaks and Croats was up in most of the areas asked about.Even with these changes, however, Bosniaks are considerably the most tolerant, followed some waybehind by Croats, and with Serbs in third place. There was a similar pattern to willingness to move townfor a better job to an area where one would not belong to the majority ethnicity, with both Bosniaks andCroats less willing than before to do so and Serbs expressing unchanged levels of readiness. Again, onemust take into account the fact that Serbs were in general the least willing (around 25%) to countenancesuch a move in any case, followed by Croats (between 30% and 36%), with Bosniaks much the most willing(around 40%) (Tables IV, V, and VI on ethnic stability in annex).
Pride in ethnicity declined over the year in all three ethnic majority areas, with regard to the majoritysamples. The minority samples all registered higher levels of ethnic pride in November 2008 than they hadin November 2007. The percentages of all groups expressing pride in ethnicity were close to or above 80%.This contrasts to the percentages expressing pride in being citizens of Bosnia and Herzegovina, which werecomparable only for Bosniaks, while for Croats and Serbs they were below 40% through the year. Theminority samples in both Serb and Croat majority areas expressed considerably higher levels of pride thanthe majority samples, rising over the year to reach the mid-70s. The country clearly remains very dividedalong ethnic lines, with Bosniaks, whether living as the local majority or a local minority, the only groupwith a large percentage willing to express a strong degree of identification. By comparison, relatively fewCroats and even fewer Serbs harbour positive feelings about the country they live in. (Tables VIII and IX onethnic stability in annex) In spite of this, it is encouraging to note that there was a significant reductionover the year in the percentages of most of our analytical categories who think that the withdrawal ofinternational forces from the country might lead to war – except people living in the Republika Srpska, whowere more like to think so at the end of the year than they had been at the beginning. It is worth notingthat they were in any case the least likely to think war might break out and the increase was minimal, sothat overall the change was clearly positive (Table X on ethnic stability in annex)
Finally coming to public safety, we note that the Security Stability Index rose steadily from its low inMarch 2008 (85) to reach a reasonably high 88 by the end of the year, the same level as it had been inNovember 2007. The reason for this change was public reaction in the early part of the year to a juvenilekilling in Sarajevo and other events which created major public concern over public safety. As theauthorities in Sarajevo took concerted action, including a curfew for juveniles and stronger punitivemeasures related to parental responsibility, the public concern faded over the summer. This was reflectedthe fact that the percentages of our sample reporting having been victims of a crime were not muchchanged over the year, but there was a major increase in the percentages of the various samplesexpressing dissatisfaction with police assistance received, particularly in Bosniak majority areas (Tables Iand III on public and personal safety in annex).

1. A year of political instability and profound institutional crisisAccording to our Political Stability Index, 2008 was politically the least stable year since we started
our surveys in May 2000. During the second quarter of 2008, it fell to its lowest recorded level (48 points).The average for the year is also the lowest yet, at 50.5. What is more, this means that for the second yearin a row the Political Stability Index was at a record low average value.1 In fact, as the above graph makesclear, the trend for the Political Stability Index has been clearly downward since its peak of 57 points in2001. There was a major drop of 5 points between 2003 and 2005, reflecting the very difficult politicalperiod when Lord Ashdown was High Representative, the SDP-led Alliance lost power, and the restorationof the politics of ethnic division produced deadlock in nearly every area of reform required by theEuropean Union for progress towards membership.
While there was a moderate recovery in 2006, political events during 2007 and 2008 have confirmedthe negative nature of the overall trend, particularly following the collapse of the initial constitutionalnegotiations, the subsequent general elections, and the stand-off they produced between the
Annual Report 2008 - Political Stability in BiH
15
I POLITICAL STABILITY IN BIH1. A year of political instability and profound institutional crisis
2. SAA signed, but lack of follow-up produces strong international criticism
3. Public pessimism prevails
4. Support for European integration high
5. Support for the SNSD down
ANNUALREPORT2008
1 The average value of the Political Stability Index for 2007 was 52.7, the lowest value up till that point.

increasingly radical RS Prime Minister, Milorad Dodik, and the increasingly undiplomatic BiH PresidencyMember Haris Silajdžić. 2008 proved a year of political instability and profound institutional crisis, inwhich positive events were few and far between, while difficulties came thick and fast. The long-awaitedsigning of the Stabilisation and Association Agreement with the European Union came in the middle ofthe year, but failed to energise political life or to produce any significant progress on the path towardsEurope. In fact, political life was overtaken by radical rhetoric, inability to agree on any political issue ofimportance, and the obviously dysfunctional coalitions at both state and federal levels. It was also a yearof municipal elections, whose results provided no surprises and brought no major change to the balanceof forces. Finally, 2008 confirmed the country’s susceptibility to influences and events in neighbouringcountries, which only served to further complicate an already complicated political environment.
2. SAA signed, but lack of follow-up produces stronginternational criticism
This year, 2008, finally saw the signing of the Stabilisation and Association Agreement with theEuropean Union, one of the few positive events of the year. After nearly 2 years of negotiations, the packageof legislation for police reform was passed by the state level parliament in April, under considerable pressurefrom the international community. While Bosnia and Herzegovina signed its SAA as a result of compromise,it was the last state in the region to do so. This event, certainly one of the most important of the year, wasnonetheless only the overture to a process which will require the country to pass a considerable amount oflegislation and to reach compromise on political and institutional issues of the highest significance.
Regardless of nearly unanimous declared support for the process of integration with Europe, therewas practically no further progress in this regard after the signing itself. Passage of the BiH Fiscal CouncilAct and the National Strategy for War Crimes Prosecution was practically the only legislative activity in theareas of reform which are a precondition to further progress. EU officials made clear that constitutionalreform, while not technically a condition, will be required for membership of the European Union. Giventhe political cloud that hung over local political life almost the whole year, consensus on constitutionalchange seemed more remote than ever before.
This was an election year. The holding of local elections on 5 October helped maintain thepolarisation of political life. Nationalist rhetoric was ramped up and divisions came increasingly to thefore. Calls for secession were made increasingly freely from the Republika Srpska, while representativesof Bosniak parties in the Federation called for the abolition of the entities, just as their colleagues fromthe so-called Croat block were appealing for the creation of a third entity. The result of the local electionsbrought no dramatic change. The SDA, SNSD, and the HDZ BiH fared best, while the relative losers werethe two junior partners in the coalition, the SBiH and the HDZ 1990.
Political crisis continued after the local elections. Radical rhetoric, inability to reach consensus onimportant issues, and dysfunctional institutions remained characteristic of the domestic political scenefor the rest of the year. The coalition at state level had never functioned properly, but in 2008 differencesin opinion between the ruling parties took on more dramatic dimensions, not infrequently producing acondition of continuous crisis in state level institutions. Particularly good examples are instances ofelected officials using official appearances abroad to present their own or their party’s views, rather thanthose of the institutions they represent.2
Because of this constant political crisis, a number of different European institutions paid particularattention to the country during the year. These European institutions were unanimous in stressing theneed for the adoption of a new or changes to the existing constitution to create functional state-levelstructures. A meeting of the Peace Implementation Council (PIC) held in February agreed that if the Officeof the High Representative was to be transformed into an Office of a Special EU Representative certain
2 For examples, see the third-quarter report.3 Five goals were set out: acceptable and sustainable solutions regarding the allocation of property between state and other levels of government,
acceptable and sustainable solutions to the issue of military property, full implementation of the final arbitration agreement on Brčko, fiscalsustainability, and reinforcement of the rule of law. The two conditions were: signing the SAA and favourable assessment of the situation in thecountry by the Steering Board, which would be based on thoroughgoing respect for the Dayton peace agreement. The text of the PIC’s declarationis available at HTTP://www.ohr.int/pic/default.asp?content_id=41354
16
Ann
ual R
epor
t 200
8 - P
olit
ical
Sta
bilit
y in
BiH

goals and conditions would have to be met in advance by the country.3 All attempts at unilateral changeto the constitutional structure of the country were also condemned, as were any attempts to question itsterritorial integrity. This position regarding the status of the Office of the High Representative wasrepeated at a meeting of the PIC held in June, and again in November. It should be stressed that, contraryto expectations, the High Representative’s own approach to local leaders and political circumstancesremained relatively passive. Negative trends and even quite extreme displays by politicians received littlemore than a warning, with no use of concrete measures or the Bonn authorities.
In September, the Council of Europe’s Parliamentary Assembly passed a Resolution on Bosnia andHerzegovina criticising the country for failing to meet its admission requirements and calling upon it tochange the discriminatory provisions in its Constitution, while condemning any type of obstruction to thework of the state level institutions or undermining the integrity of the state. The European Parliament alsopassed a Resolution on Bosnia and Herzegovina in October, stating that there was no place in theEuropean Union for Bosnia and Herzegovina as the country exists today – radicalised, divided, andwithout political consensus over the path towards Europe. In early November, the European Commissionadopted a Progress Report on Bosnia and Herzegovina in which it made clear its view that there had beenat best partial progress over the political criteria and that most of that had been in the first half of theyear, while the lack of consensus over capacity building at state level, undermining of the Dayton peaceagreement, and inflammatory rhetoric had detracted from any progress previously made. At the end ofNovember, the European Union foreign and defence ministers discussed Bosnia and Herzegovina at oneof their regular meetings and announced their intention of strengthening EU involvement in the country,which has yet to materialise.
Certain events in the region also affected the political crisis in Bosnia and Herzegovina, the mostimportant being the unilateral declaration of independence by Kosovo on 17 February. It should be notedthat the mere expectation of this event had had a negative impact through 2007. Constant attempts bypoliticians from the RS to link the status of Kosovo with the status of their entity raised the politicaltemperature even before the declaration of independence, so the reaction following the event itself wasmuch as expected. The negative statements by RS politicians, the visit by the RS Prime Minister to attendpublic demonstrations in Belgrade, demonstrations held in the main towns of the RS, and even the votingof a resolution by the RS National Assembly refusing to recognise the unilateral declaration ofindependence by Kosovo and Metohija offered little to surprise and brought little change to the politicalclimate.
Events related to the Hague Tribunal, both directly and indirectly, also affected the political scene inBosnia and Herzegovina. Positive events included the arrest of Stojan Župljanin in June and that ofRadovan Karadžić in July, though the latter’s trial has yet to start and will certainly represent one of themost important political events of the coming period. Political life was also shaken by the sentencing offormer Republic of Bosnia and Herzegovina Army General Rasim Delić, who was found guilty on groundsof command responsibility and sentenced to 3 years in prison for war crimes committed in central Bosnia.As expected, the sentence provoked an extremely negative reaction in the RS, because of the leniency ofthe term imposed, which led to accusations of bias on the part of the court.
At the end of the year, the leaders of the three leading ethnic parties in Bosnia and Herzegovina madean attempt to reach agreement over the most important political issues, with a view to avoiding orovercoming the long-term crisis. The leaders of the SDA, SNSD, and the HDZ BiH reached agreement inprinciple on constitutional reform, the status of Brčko district, and the status of national property, underthe so-called Prud agreement.4 The Prud agreement received a very warm welcome from representativesof the international community and the European Union, but was not particularly warmly received byother local political players, whether in the ruling coalition or opposition. As a result, it remains extremelyuncertain whether implementation of the agreement will be at all possible, and to what extent it reallyrepresents the first step out of the current crisis.
4 The agreement provides for the following: ammendments to the constitution to bring it into line with European norms, while improving theeffectiveness of state-level institutions and making clear territorial organization; a census in 2011, with the proviso that the 1991 census will remainthe basis for ethnic representation at all levels of government and administration until 2014; a deal on the division of government property, withthe state-level retaining ownership of such property as is necessary for state-level institutions to function and the remainder split between the entityand lower levels of government; a deal to sort out the legal status of Brčko District by constitutional amendment.
17
Annual Report 2008 - Political Stability in BiH

3. Public pessimism prevailsThe very pessimistic public mood already evident in 2007 continued through 2008. Already at the
beginning of the year, the sample showed considerable pessimism regarding the political situation in thecountry, with as many as 78.8% of the Bosniak sample, 57.7% of the Croat sample, and 57.3% of the Serbsample taking the view that Bosnia and Herzegovina was moving in the wrong direction. Over thefollowing two quarters, Serb and Bosniak opinion softened, only to harden again by the end of the year.In the final quarter, 50.3% of the Serb sample, 52.9% of the Croat sample, and as much as 79.7% of theBosniak sample said they thought the country was headed in the wrong direction politically. On average,more than half the total sample expressed pessimism throughout the year, with the Bosniak sample mostpessimistic, and the Serb sample least so (Tables I and II in annex).
The Bosniak sample was also most negative during the year vis-à-vis the economic situation, with asmuch as 60% of the opinion through the year that the economic situation in Bosnia and Herzegovina wasbad, and a negligible number of the view that the economic situation could be described as good(between 1.4% at the beginning and 0.2% at the end of the year). The Croat sample were far less likely toexpress a negative assessment of the economic situation in the country, but this was largely because alarge majority of the sample through the year (more than 47%) refused to express a clear opinion on theissue. The Serb sample also showed a very high and steady level of pessimism regarding the economicsituation, which varied over the year between 61.4% and 17.9% (Table III in annex). The sample from theRS were also critical regarding the economic situation in that entity, with between 53.8% and 61.4% alsodescribing the economic situation there as poor (Table IIIa in annex).
The percentage of the sample who would emigrate if the opportunity arose was also high through2008, at between 38.2% and 42.2% of the total sample, yet another negative trend continued from theprevious year. As has become the norm, the 18 to 35 age group was most eager to emigrate, with more
than 60% expressing such a desire through the year (Table IV). The breakdown by ethnicity was fairlystable through the year (Table V in annex).
4. Support for European integration highSupport for the process of European integration was high through the year, higher even than it had
been in 2007. That means between 75.6% and 79.9% of the total sample said they supported the processthrough the year. The Bosniak sample was most likely to support or express approval (between 87.9% and94%), but support was also relatively high amongst both the other samples as well -- around 65% and78.3% for the Croat sample and between 56.9% and 67.1% for the Serb sample. There was, however, anoteworthy drop in support amongst the Serb sample over the year, ending the year 10 points down onthe first quarter (Table VIII in annex).
The view that becoming a member of the European Union is of particular importance to the politicalstability of the country also enjoyed considerable public support during the year, with between 77.2% and80.3% of the total sample supporting it: more than 87% of the Bosniak sample, 66% of the Croat sample,and 60% of the Serb sample through the year. As with the previous question, there was a gradual decline
Age GenderAll 18 - 35 36 - 50 51 + Male Female
2008 March June Sept Nov March June Sept Nov March June Sept Nov March June Sept Nov March June Sept Nov March June Sept NovYes 42.2 38.2 41.6 40.4 64.7 61.3 64.5 63.3 51.1 46.1 45.6 39.4 18.6 14.9 17.4 17.6 42.5 37.2 43.4 43.3 41.9 39.2 39.9 37.6No 47.5 50.3 47.9 46.3 23.6 27.7 24.3 19.2 35.9 39.7 41.6 48.9 73.7 76.3 73.9 72.2 45.8 49.7 46.3 45.9 49.1 51.0 49.3 46.7DK/NA 10.3 11.4 10.6 13.3 11.7 11.0 11.2 17.5 13.0 14.3 12.7 11.7 7.7 8.8 8.7 10.2 11.7 13.1 10.3 10.8 9.0 9.9 10.8 15.7TOTAL 100.0 100.0 100.0100.0 100.0100.0 100.0100.0 100.0 100.0 100.0 100.0 100.0 100.0 100.0 100.0 100.0 100.0 100.0 100.0 100.0 100.0 100.0 100.0Source: Public opinion polls conducted for EWS by Prism Research
Would emigrate if they couldTable IV
18
Ann
ual R
epor
t 200
8 - P
olit
ical
Sta
bilit
y in
BiH
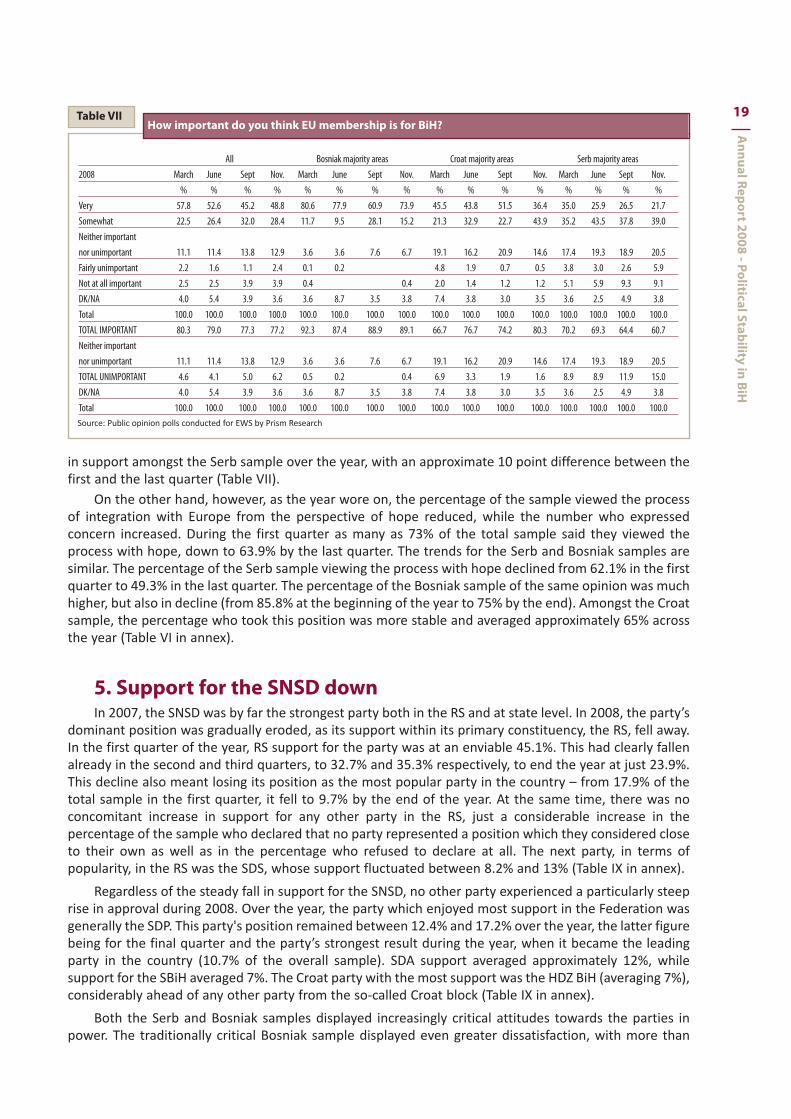
in support amongst the Serb sample over the year, with an approximate 10 point difference between thefirst and the last quarter (Table VII).
On the other hand, however, as the year wore on, the percentage of the sample viewed the processof integration with Europe from the perspective of hope reduced, while the number who expressedconcern increased. During the first quarter as many as 73% of the total sample said they viewed theprocess with hope, down to 63.9% by the last quarter. The trends for the Serb and Bosniak samples aresimilar. The percentage of the Serb sample viewing the process with hope declined from 62.1% in the firstquarter to 49.3% in the last quarter. The percentage of the Bosniak sample of the same opinion was muchhigher, but also in decline (from 85.8% at the beginning of the year to 75% by the end). Amongst the Croatsample, the percentage who took this position was more stable and averaged approximately 65% acrossthe year (Table VI in annex).
5. Support for the SNSD downIn 2007, the SNSD was by far the strongest party both in the RS and at state level. In 2008, the party’s
dominant position was gradually eroded, as its support within its primary constituency, the RS, fell away.In the first quarter of the year, RS support for the party was at an enviable 45.1%. This had clearly fallenalready in the second and third quarters, to 32.7% and 35.3% respectively, to end the year at just 23.9%.This decline also meant losing its position as the most popular party in the country – from 17.9% of thetotal sample in the first quarter, it fell to 9.7% by the end of the year. At the same time, there was noconcomitant increase in support for any other party in the RS, just a considerable increase in thepercentage of the sample who declared that no party represented a position which they considered closeto their own as well as in the percentage who refused to declare at all. The next party, in terms ofpopularity, in the RS was the SDS, whose support fluctuated between 8.2% and 13% (Table IX in annex).
Regardless of the steady fall in support for the SNSD, no other party experienced a particularly steeprise in approval during 2008. Over the year, the party which enjoyed most support in the Federation wasgenerally the SDP. This party's position remained between 12.4% and 17.2% over the year, the latter figurebeing for the final quarter and the party’s strongest result during the year, when it became the leadingparty in the country (10.7% of the overall sample). SDA support averaged approximately 12%, whilesupport for the SBiH averaged 7%. The Croat party with the most support was the HDZ BiH (averaging 7%),considerably ahead of any other party from the so-called Croat block (Table IX in annex).
Both the Serb and Bosniak samples displayed increasingly critical attitudes towards the parties inpower. The traditionally critical Bosniak sample displayed even greater dissatisfaction, with more than
All Bosniak majority areas Croat majority areas Serb majority areas2008 March June Sept Nov. March June Sept Nov. March June Sept Nov. March June Sept Nov.
% % % % % % % % % % % % % % % %Very 57.8 52.6 45.2 48.8 80.6 77.9 60.9 73.9 45.5 43.8 51.5 36.4 35.0 25.9 26.5 21.7Somewhat 22.5 26.4 32.0 28.4 11.7 9.5 28.1 15.2 21.3 32.9 22.7 43.9 35.2 43.5 37.8 39.0Neither importantnor unimportant 11.1 11.4 13.8 12.9 3.6 3.6 7.6 6.7 19.1 16.2 20.9 14.6 17.4 19.3 18.9 20.5Fairly unimportant 2.2 1.6 1.1 2.4 0.1 0.2 4.8 1.9 0.7 0.5 3.8 3.0 2.6 5.9Not at all important 2.5 2.5 3.9 3.9 0.4 0.4 2.0 1.4 1.2 1.2 5.1 5.9 9.3 9.1DK/NA 4.0 5.4 3.9 3.6 3.6 8.7 3.5 3.8 7.4 3.8 3.0 3.5 3.6 2.5 4.9 3.8Total 100.0 100.0 100.0 100.0 100.0 100.0 100.0 100.0 100.0 100.0 100.0 100.0 100.0 100.0 100.0 100.0TOTAL IMPORTANT 80.3 79.0 77.3 77.2 92.3 87.4 88.9 89.1 66.7 76.7 74.2 80.3 70.2 69.3 64.4 60.7Neither important nor unimportant 11.1 11.4 13.8 12.9 3.6 3.6 7.6 6.7 19.1 16.2 20.9 14.6 17.4 19.3 18.9 20.5TOTAL UNIMPORTANT 4.6 4.1 5.0 6.2 0.5 0.2 0.4 6.9 3.3 1.9 1.6 8.9 8.9 11.9 15.0DK/NA 4.0 5.4 3.9 3.6 3.6 8.7 3.5 3.8 7.4 3.8 3.0 3.5 3.6 2.5 4.9 3.8Total 100.0 100.0 100.0 100.0 100.0 100.0 100.0 100.0 100.0 100.0 100.0 100.0 100.0 100.0 100.0 100.0Source: Public opinion polls conducted for EWS by Prism Research
How important do you think EU membership is for BiH?Table VII 19
Annual Report 2008 - Political Stability in BiH

20
Ann
ual R
epor
t 200
8 - P
olit
ical
Sta
bilit
y in
BiH
half of the opinion that the parties in power had not been even relatively successful in defining andimplementing key reforms, that they were not capable of meeting the conditions required for progresstowards integration with Europe on time, and that they did not deserve to stay in power. The Croatsample was less stable in its opinion over the year, with between 25 and 40% expressing negativeassessment of the parties in power (except during the second quarter when a considerably higherpercentage took a critical view). Nonetheless, we should mention that this represents a lower level ofcriticism than the previous year, largely due to the increased percentage of the sample unable or unwillingto express an opinion regarding the effectiveness of the ruling coalition, rather than an increase in thepercentage expressing actual approval (Table XI in annex).
The Serb sample also displayed a more critical attitude than the previous year, though they remainthe most positive overall with regard to the parties in power. Between 20 and 30% gave a criticalassessment of the parties in power, while approximately 30% of the sample refused to answer throughthe year. This leaves between 28.5% and 36.3% of the opinion that the parties in power deserve to remainin power (Table XI in annex).

1. Gridlock at BiH and FBiH levels reflect pervasive political crisis
The institutions of Bosnia and Herzegovina have always been faithful mirrors of any crisis present inlocal politics, so that their (inability to) function is a good indicator of political stability in the country. Thiswas the case in 2008 -- profound crisis in political life was accompanied by equally profound institutionalcrisis. Problems in the performance of the ruling coalition at state level, evident from the very beginningof its mandate, deepened through the year. Profound political disagreements between the parties makingup the ruling coalition were reflected, as expected, in the performance of the state level institutions.More than ever before, these state institutions were a vision of ineffectiveness, inefficiency, party conflict,and the pursuit of party and not common interests.
After the signing of the Stabilisation and Association Agreement with the European Union, Bosniaand Herzegovina accepted a series of conditions related to membership, which will require not merelyhighly intensive legislative activity and involvement of institutions at all levels, but also a high degree ofconsensus between all political players regarding the path towards Europe. Unfortunately, since thesigning of the agreement, it has become clear that there is little if any commitment to and no practicalconsensus regarding meeting the obligations and priorities set by the EU. It is a demoralising indicatorthat only 13 of the over 30 short-term priorities put before the country by the European Union had beenmet by the end of September this year, whether in whole or in part, so that it is impossible to talk of acomprehensive reform process this year.
Instead of dealing with reforms and carrying out the tasks required for integration with Europe, thestate level institutions were preoccupied throughout 2008 with themselves. The decision-making processin the collective state level institutions was marred by outvoting and the absence of consensus. Alreadyat the beginning of the year, two decisions by the collegiate head of state, the Presidency of Bosnia andHerzegovina were found to be in violation of vital national/ethnic interests. This body’s inability to reachcompromise was confirmed after the Presidency failed to adopt a platform during the second quarter ofthe year for participation in the UN General Assembly, so that the Chair of the Presidency, Haris Silajdžić,gave a speech which was a reflection of his personal views. His speech to the Parliamentary assembly ofthe Council of Europe was a similar case in point. This certainly contributed to the deterioration of thepolitical climate, provoking the predictably negative reaction from politicians in the RS.
II INSTITUTIONAL STABILITY IN BiH1. Gridlock at BiH and FBiH levels reflect pervasive political crisis
2. Ethnic groups differ significantly over government institutions
3. Support for OHR split on ethnic lines
ANNUALREPORT2008
21
Annual Report 2008 - Political Stability in BiH

On the other hand, a number of appearances by the RS Prime Minister, Milorad Dodik, and otherpoliticians from the RS, during which they questioned the territorial integrity of the country and the authoritiespooled by the entities at state level, also had a particularly negative impact on political stability and thefunctioning of state level institutions. The RS institutions went even further than mere verbal grandstanding. Inearly September, the RS government initiated the process of creating its own electricity transmission company(parallel to the state company responsible for this area), after which it refused to deliver documentation to theBosnia and Herzegovina Prosecutor's Office relating to the tax declarations of two private companies, the RSgovernment and certain ministries, while during the year it proceeded to open its own representative officesabroad. These activities continued in the face of occasional warnings by representatives of the internationalcommunity and reaction by representatives of political parties based in the Federation.
Coming to the performance of the entity institutions, the SNSD maintained its dominant positionwithin the RS government through 2008, and while there was some quarrelling with the junior coalitionpartners, principally the PDP, this did not affect the performance of institutions within the entity. Thefederal institutions, on the other hand, staggered from crisis to crisis through the year, again largely as aresult of poor relations between the coalition partners at this level, particularly the SDA and the SBiH.After publication of the local election results, the SDA and HDZ BiH opened negotiations on restructuringthe government, and there were even hints about the possible dissolution of the coalition between theSDA and the SBiH. Once the SDP made clear, however, that it had no intention of joining the rulingcoalition, it became obvious that a new majority could not be formed without the SBiH (and HDZ 1990),so that all talk of restructuring was in the end abandoned. A clear indicator of the crisis within the federalinstitutions is the fact that the federal budget for next year is 240 million KM less than this year's budgetas a direct result of this year’s deficit. That the Federation is on the edge of bankruptcy was announcedmore than once during the year by the Minister of Finance of the Federation.
Under such conditions of political and institutional crisis, rather greater involvement was expectedfrom the international institutions, led by the Office of the High Representative. The energetic approachtaken by the new High Representative, Miroslav Lajčak, in 2007, which suggested he might take an activerole in political process, underwent a transformation in 2008. His passivity, his reluctance to use his Bonnauthorities, and his self-imposed restriction to verbal warning made clear that there is no consensus on adefinite and determined course of action within the European Union or amongst the countries that makeup the Peace Implementation Council. Several times during the year, the High Representative himself,alongside representatives of the EU institutions, stressed that the responsibility for progress towardsintegration with Europe lies exclusively with domestic institutions and local political actors. Nor did localpoliticians show a united front with regard to the role of the Office of the High Representative. Whilepoliticians from the Federation (particularly those from the so-called Bosniak parties) advocated a greaterand clearer role for the international community in Bosnia and Herzegovina, those from the RS wereunanimous in their view that the Office of the High Representative should be closed. The decision of theinternational community was somewhere in between -- at the end of the year, the Peace ImplementationCouncil decided that the time had not yet come to close the Office of the High Representative or towithdraw the European security forces (EUFOR). On the other hand, it was also clear that any moresignificant involvement than that currently in place was not to be expected any time soon.
2. Ethnic groups differ significantly over governmentinstitutions
The overall approval ratings for various government institutions in 2008 were as follows: around 40%for state level institutions, 38% for federal institutions, 39% for RS institutions, and around 51% formunicipal level. There was not much fluctuation in the approval ratings during the year -- after a modestfall in the second and third quarters, the institutional approval ratings generally recovered to the level ofthe beginning of the year (Table I in annex). There remain, however, significant differences between thevarious ethnic groups.
The Serb sample showed most confidence in all levels of government over the year, with a noticeabledip in the third quarter. On average, some 50% of this group expressed support for state level institutions,65% for municipal institutions, and as much as 68% for RS institutions. A relatively high percentage even
22
Ann
ual R
epor
t 200
8 - I
nsti
tuti
onal
Sta
bilit
y in
BiH

expressed support or approval for the work of the federal institutions -- around 48%. The Croat samplestarted the year with a fairly high percentage expressing confidence in the various levels of governmentand their performance, but there was a significant decline in the second quarter and the low-level wasmaintained pretty well to the end of the year. The average for the year was around 36% support for theperformance of the state level institutions, 35% for the federal level institutions, 40% for the municipalauthorities, and around 22% expressing satisfaction with how the RS institutions were doing their job.The Bosniak sample was the most critical group in 2008, though here too there was a moderateimprovement in the second half of the year. On average they gave the state level institutions an approvalrating of around 29%, federal level around 28%, RS institutions around 16%, with only the municipal leveldoing significantly better, at around 39% (Table II in annex).
The overall approval rating for international institutions present in Bosnia and Herzegovina was a littlehigher than the approval rating for government institutions and there was very little between the institutionsin question. Overall support (annual average) ranged from approximately 38% for the USA to 46% for UNDP(Table I in annex). There was also less difference between the various ethnic groups in this regard.
Bosniak majority areas Croat majority areas Serb majority areasMarch 08. June 08. Sept 08. Nov 08. March 08. June 08. Sept 08. Nov 08. March 08. June 08. Sept 08. Nov 08.
% % % % % % % % % % % %FBiH Parliament
Not at all 0.6 2.3 2.7 0.9 2.7 1.3 1.3 0.8 3.9 1.7 0.6 0.4A little 8.0 7.0 11.1 7.8 18.3 11.0 15.7 12.2 20.5 17.4 28.4 18.3Moderately 8.1 11.0 11.0 10.7 26.4 19.1 27.3 19.9 12.5 11.5 16.7 16.5Fairly 25.6 16.7 17.4 21.1 26.4 47.3 28.4 33.5 29.3 24.8 22.3 29.8Very 57.7 63.0 57.8 59.5 26.1 21.2 27.3 33.7 33.8 44.6 31.9 35.0
Total 100.0 100.0 100.0 100.0 100.0 100.0 100.0 100.0 100.0 100.0 100.0 100.0FBiH Government
Not at all 0.6 2.0 2.5 0.9 2.5 2.1 1.4 1.2 4.9 1.9 0.6 0.7A little 8.6 7.3 9.1 7.5 16.5 8.6 14.5 10.8 20.0 16.7 27.5 17.3Moderately 7.9 10.2 11.3 11.1 26.9 19.1 28.0 22.3 12.3 12.0 17.3 17.4Fairly 25.5 16.4 16.4 19.6 26.4 47.9 30.2 32.5 29.6 24.5 21.6 29.6Very 57.4 64.1 60.8 60.9 27.7 22.3 25.9 33.2 33.2 44.9 33.0 35.0
Total 100.0 100.0 100.0 100.0 100.0 100.0 100.0 100.0 100.0 100.0 100.0 100.0RS National Assembly
Not at all 0.6 2.5 2.3 0.5 2.4 1.0 1.4 0.8 5.7 2.3 3.0 2.2A little 5.5 5.7 5.1 6.6 13.7 5.9 14.2 6.3 22.7 17.9 30.3 19.3Moderately 6.7 9.9 11.6 9.9 24.5 17.5 21.8 16.5 14.5 14.2 14.9 17.5Fairly 23.2 15.4 18.0 18.4 25.1 50.1 31.3 34.9 28.7 25.0 20.6 31.3Very 64.1 66.5 63.0 64.6 34.3 25.6 31.4 41.5 28.4 40.6 31.3 29.7
Total 100.0 100.0 100.0 100.0 100.0 100.0 100.0 100.0 100.0 100.0 100.0 100.0RS Government
Not at all 0.6 2.5 1.9 0.5 2.3 0.5 1.4 0.8 5.5 2.9 3.3 1.5A little 5.0 5.8 5.1 7.2 12.3 5.3 13.7 6.8 22.3 17.9 29.5 20.2Moderately 6.5 9.6 9.1 9.6 24.3 20.7 23.9 15.1 16.1 13.2 13.7 16.8Fairly 23.2 15.2 19.1 18.6 26.5 48.7 29.6 34.3 29.2 24.7 21.1 32.0Very 64.6 66.9 64.8 64.1 34.6 24.8 31.4 43.0 26.9 41.3 32.5 29.5
Total 100.0 100.0 100.0 100.0 100.0 100.0 100.0 100.0 100.0 100.0 100.0 100.0Municipal authorities
Not at all 0.6 2.4 3.5 1.0 2.8 0.8 2.2 0.4 3.3 1.8 2.3 1.8A little 8.8 7.1 8.9 10.6 12.3 12.1 14.1 8.6 20.2 16.0 23.9 19.7Moderately 13.3 11.6 13.3 16.4 29.0 26.4 23.5 21.8 19.0 16.9 17.6 16.6Fairly 23.2 16.5 17.6 21.4 27.1 37.8 29.0 36.1 27.7 22.2 25.0 30.5Very 54.1 62.5 56.7 50.6 28.7 22.8 31.1 33.1 29.8 43.1 31.2 31.4
Total 100.0 100.0 100.0 100.0 100.0 100.0 100.0 100.0 100.0 100.0 100.0 100.0Source: Public opinion polls conducted for EWS by Prism Research
How widespread do you think corruption, understood as taking bribes and abuse of office forpersonal gain, is in the following institutions
Table V
23
Annual Report 2008 - Institutional Stability in BiH

In contrast to the low-level of support they expressed for domestic institutions, the Bosniak sampleshowed a higher level of approval for the international institutions than the other two ethnic groups.There was a significant drop in support only in the second quarter, with support relatively high level in allother quarters. Taking the annual average, some 42% of this group expressed support for the US, with50% expressing support or approval for the Office of the High Representative. There was a significantdecline in the Croat sample support for international institutions during the third quarter, which did notrecover in the fourth. Nonetheless, the average annual value was somewhere between 40% and 43%depending on which international institution was in question. The Serb Sample recorded a relativelysteady approval rating for international institutions through the year, albeit one which was somewhatlower than either of the other two ethnic samples. As has become traditional, this group expressed leastsupport for the work of the United States (annual average around 30%), and most for the OSCE and UNDP(annual average of around 41%). See Table II in annex for more details.
Next comes the issue of corruption in government institutions, which our sample was very inclinedto believe was widespread through the year. On average approximately 43% of the sample in 2008 wasof the opinion that corruption is very widespread in government or state level institutions, 45% that it isvery widespread in federal level institutions, and around 46% that it is very common in RS institutions(Table IV in annex). Once again, the Bosniak sample was considerably the most critical, with more than50% generally of the opinion that corruption is widespread in state level institutions, more than 60%saying it is common in federal institutions, and around 64% alleging it of RS institutions. The members ofthe other two ethnic groups were considerably less critical, with an average of 26% of Croats and 37% ofSerbs taking the view that corruption is very widespread in state level institutions. It is interesting to notethat in spite of the very high approval ratings given to the RS institutions by the Serb sample, on average32% still considered corruption to be very widespread in them (Table V in annex).
3. Support for OHR split on ethnic linesIn 2008, an average of 44% of the overall sample expressed support for the job being done by the
Office of the High Representative (Table I in annex). There continue to be clear differences between theethnic groups in their opinions and attitudes, but they are not as marked as they were in previous years.As usual, the Bosniak sample was the most supportive -- except for during the second quarter, when therewas a significant dip in support - with more than half of this group generally expressing approval of thejob being done by the Office of the High Representative, so that the annual average was 51%. Next wasthe Croat sample. The percentage of this group who expressed approval of the OHR fell significantly in thesecond quarter (down approximately 15 points) and remained at that level to the end of the year.Nonetheless, the average for this group was approximately 40%. The Serb group is the least supportiveof the three, averaging approximately 35%. There was little change in the level of support expressed bythis group through the year (Table II in annex).
When we look at the sample’s views regarding the various OHR-led reform measures, we finddeclining confidence in public administration reform (average for the year around 42%), followed bypolitical reforms (41%), economic reforms (around 39%), and anticorruption measures (around 36%)(Table VI in annex). There was a clear reduction in confidence regarding all areas of reform through theyear.
Support for the measures being taken by the High Representative is still highest amongst Bosniaks,though even their support declined significantly during the first and third quarters, with a moderaterecovery at the end of the year. The Bosniak approval rating for political reform averaged around 56%,around 50% for economic performance, 46% for anti-corruption reforms, and 54% for publicadministration reforms. Serb and Croat ratings were considerably lower and their views were veryconsistent. Here too we saw a gradual decline in support over the year, so that it was considerably lowerin the last quarter than it had been in the first. On average, some 36% of the Croat sample expressedsupport for political reforms, 34% for economic reforms, 28% for anticorruption measures, and 32% forpublic administration reforms. Around 26% of the Serb sample expressed support for political reforms onaverage, while 28% were in favour of the economic and anticorruption measures, and approximately 34%expressed support for public administration reforms (Table VII in annex).
24
Ann
ual R
epor
t 200
8 - I
nsti
tuti
onal
Sta
bilit
y in
BiH

These three ethnic groups continue to show very different patterns of opinion regarding the powersof the High Representative. On the one hand, the Serb sample’s views through the year were clear, witha considerable majority (around 70%) in favour of reducing the High Representative's powers. The Croatand Bosniak samples views were more labile over the year, with a majority of Croats tending to think thatthe high Representative's powers should be reduced or stay as they are, while Bosniaks rather felt theyshould be increased or stay as they are (Table IX).
Bosniak majority areas Croat majority areas Serb majority areasMarch 08. June 08. Sept 08. Nov 08. March 08. June 08. Sept 08. Nov 08. March 08. June 08. Sept 08. Nov 08.
% % % % % % % % % % % %Reduced 13.9 23.3 22.6 10.9 29.0 40.2 42.2 28.9 71.2 69.9 69.9 71.6Increased 49.2 25.9 33.1 41.9 32.6 15.5 16.2 18.9 4.3 1.7 2.8 2.9Stay the same 24.2 33.8 29.7 40.0 22.7 39.8 36.1 31.9 18.3 23.5 20.0 19.1DK/NA 12.7 17.0 14.5 7.2 15.7 4.5 5.4 20.2 6.2 5.0 7.3 6.4Total 100.0 100.0 100.0 100.0 100.0 100.0 100.0 100.0 100.0 100.0 100.0 100.0Source: Public opinion polls conducted for EWS by Prism Research
In your view, should the High Representative’s powers be reduced, increased or stay the same?Table IX 25
Annual Report 2008 - Institutional Stability in BiH

We have been measuring economic stability using the index based on our opinion polls since thesereports began in 2000. Generally speaking, we may say that the index has not fluctuated much on aquarterly basis, but we have noted steady deterioration quarter by quarter recently. To provide a clearerpicture of these trends, we have calculated annual averages of the index and a trend line for the past eightyears. The results are shown in the following graph.
The Economic Stability Index has clearly fluctuated considerably over recent years, when viewed atthe annual level, with the trend generally a negative one. Our trendline shows the index as having enjoyedmoderate growth between 2000 and 2003, but as falling after 2003 with increasing, if unevenmomentum, to reach its lowest level to date in 2008.
Given that worldwide economic activity has been experiencing a slowdown, particularly in late 2008,it would seem that the index reflects fairly well what we have in fact been witnessing. Even though we aretalking here about the public's expectations, it is indicative that they have for five years tended to suggestdecreasing economic stability, with the lowest value last year. In other words, the public's economicexpectations seem to have provided a realistic foreshadowing of the economic instability we are currentlyexperiencing.
III ECONOMIC STABILITY IN BiH1. Industrial production up
2. Unemployment still a major macro-economic problem
3. Retail prices up significantly over year, as Central Bank of BiH reserves fall
4. Trade deficit at worrying level
5. The public see economy as doing poorly
6. BiH institutions are too costly and time-consuming and getting more so
ANNUALREPORT2008
27
Annual Report 2008 - Political Stability in BiH

1. Industrial production up Industrial production in Bosnia and Herzegovina grew in both entities during 2008, up 8% in the FBiH
and 17% in the RS compared to the year before. The very high jump in the RS during the final month ofthe year is particularly striking, with levels of production practically double those of December 2007.
In the FBiH, the three highest growth branchesof industry were the production of other vehicles,followed by chemicals and related products, andmedical, optical, and precision equipment andtimepieces.1 This is the same set and order as thequarter before. In the Republika Srpska, the threeleading sectors were the production of coke andpetroleum products, followed by other electricalmachines and apparatus, and in third place motorvehicles and trailers.2 As the values for these indices(in the footnotes) suggest, certain of the sectors experienced growth of more than 100% compared to thesame period last year. The production of coke and petroleum products saw particularly high growth, withan index of 675, so that production was more than six times the level in 2007.
For the sake of comparison, we may note that in 2007 industrial production rose most with regard tothe production of office machinery and computers, followed by motorized vehicles and trailers, and semi-trailers, and metal products other than machinery and equipment.3 In 2006, the most sucessful sectors weredifferent, with the production of medical, precision, and optical equipment and timepieces in first place,followed by the extraction of metal ore, and in third place the production of chemicals and related products.4
According to these results, two sectors saw particularly high levels of growth over the past three years,namely: chemicals and related products and medical, precision, and optical instruments and timepieces.
Industrial production in the RS rose most with regard to the following three sectors: the production offurniture and similar products, the production of mass consumer products, and recycling.5 In 2006, the threeleading sectors in the RS were: wood and cork processing and products, the extraction of stone and darkcoal, brown coal, lignite, and peat, and the production of rubber and plastic products.6 It is clear that thestructure of the leading sectors in the RS has varied considerably from year to year over the past three years.
The sectors in the Republika Srpska whose indices fell most in 2008 were the production of officeequipment and computers, followed by furniture, and in third place the extraction of other ores and stones.7
The sectors with the lowest indices, however, were the production of radio, TV, and communicationsequipment, recycling, the production of office and computer equipment, and the production of metalproducts other than machinery.8 There is one sector which has appeared for three years in a row in this list,namely the production of radio, TV, and communications equipment, suggesting that this branch of industryhas been going through particularly difficult times. On the other hand, both entities saw the production ofoffice and computer machinery decline, suggesting that this sector clearly had a rough ride in 2008 when itcomes to the prospects for continued growth. It is worth noting that in 2007 this was one of the mostsuccessful sectors in the FBiH, but one of the worst performing in 2008, at least relative to the year before.
2. Unemployment still a major macro-economic problemThe high unemployment rate in Bosnia and Herzegovina is certainly one of the country's main
macroeconomic headaches. The increase in registered unemployment in past years has recently been halted
1 Index values, respectively: 180.1; 151.4; 119.9. Source: Federal Statistics Office, “Mjesečni statistički pregled,” no. 1, January 2009.2 Index values, respectively: 674.8; 216.1; 143.3. Source: RS Statistics Office, “Saopštenje statistike industrije – Decembar 2008. godine”, no. 8/09,
January 2009. 3 Index values, respectively: 164.9; 155.3; 153.8. Source: Federal Statistics Office, December 20074 Index values, respectively: 143.6; 132.5 and 129.7. Source: Federal Statistics Office, Mjesečni pregled FBiH 1/07, January 20075 Source: RS Statistics Office, Sopštenje statistike industrije, December 20076 Source: RS Statistics Office, Sopštenje statistike industrije, January 20077 Source: Federal Statistics Office, Mjesečni statistički pregled, no 1, January 2009.8 Source: RS Statistics Office, Saopštenje statistike industrije - Decembar 2008. godine, no 8/09, January 2009
VIII 2008 VIII 2008 I-VIII 2008VIII 2007 VIII 2007 I-VIII 2007
FBiH 98.2 109.6 105.4RS 100.2 109.4 107.8
Source: Public opinion polls conducted for EWS by Prism Research
Index of the physical volume ofindustrial production in BiH
Table I
28
Ann
ual R
epor
t 200
8 - E
cono
mic
Sta
bilit
y in
BiH

and the number of the unemployed has even fallen slightly. These are, however, modest steps, as more thanhalf a million people remain unemployed, which is a very high number for such a small economy. Thefollowing table presents data on unemployment as registered by the employment bureaux.
We note that in late 2008 (November) some 480,000 people were registered as unemployed, downsome 40,000 on 2007. Gender analysis shows that women are moderately more at risk than men, with 51%of the unemployed being women and 49% men. When it comes to educational level, we find that theunemployed are most likely to be skilled or highly skilled (171,813) or unskilled workers (161,463), who makeup 70% of the total. They are least likely to be university graduates, who make up just 11,771 or 2.5% of thetotal, while post-graduates make up just 1.5 %.
3. Retail prices up significantly over year, as Central Bank ofBiH reserves fall
After the introduction of VAT in 2006, there wasa major rise in retail prices, with the retail priceindices up 7% in the FBiH and 8.4% in the RS. In 2007,prices were more stable, with an increase of around2% in both entities. 2008 saw considerable pricesrises again, however, averaging a little above 7%,close to the level of inflation in 2006. There was nomajor difference between the entities.
The main areas generating higher prices and living costs were food and non-alcoholic beverages (up12.1%), followed by accommodation, water, electricity, gas and other fuels (up 8.6%), and third restaurantsand hotels (up 7.1%). Retail prices only fell for clothing and shoes, down 2.1%.
Central Bank of BiH reserves have been growing steadily for some time, including most of the monthsof 2008. The fourth quarter did see a negative turn, with a reduction in the reserves, as Graph 3 shows.
The upward trend of last year came to an end inOctober 2008. In October and November 2008 theBank's total reserves fell by some 500 million KM. Thelast month of 2008 saw a moderate recovery, whichis of course a good sign, and the trend may wellcontinue into 2009. In any case, the reason for thisdrop in late 2008 is not hard to surmise, as the globalfinancial crisis resulted in the withdrawal of depositsfrom the banking system, reducing reserves. Itshould be noted, however, that this is likely to be ashort-term adjustment and that reserves are still atthe same level they were in July 2008, so there is noreason for panic. It is possible that they will fallfurther, but we do not expect a major decline oranything that would threaten the continuedoperation of the BiH Central Bank Currency Boardarrangement. In any case, the global financial crisis is
VIII 2008 VIII 2008 I- VIII 2008VII 2008 VIII 2007 I- VIII 2007
FBiH 98.2 109.6 105.4RS 100.2 109.4 107.8Source: Public opinion polls conducted for EWS by Prism Research
Retail Price and Cost of Living IndicesTable I
Jan-05 Jan-06 Mar-06 Jan-07 Mar-07 Apr-07 Jun-07 Aug-07 Sep-07 Jan-08 Mar-08 Aug-08 WomenFBiH 328,225 349,137 351,867 367,449 371,156 370,961 370,410 369,886 371,342 367,449 357,281 340809 173.837REPUBLIKA SRPSKA 144,823 142,754 145,331 146,180 146,517 144,306 140,189 136,520 134,197 136,108 138,497 133,827 64.069BiH 473,048 491,891 497,198 513,629 517,673 515,267 510,599 506,406 505,539 503,557 495,778 474636 237.906Source: Public opinion polls conducted for EWS by Prism Research
Total number of registered unemployed by entityTable II
Central Bank of BiH Foreign Reserves(millions KM)
Graph 1
29
Annual Report 2008 - Econom
ic Stability in BiH
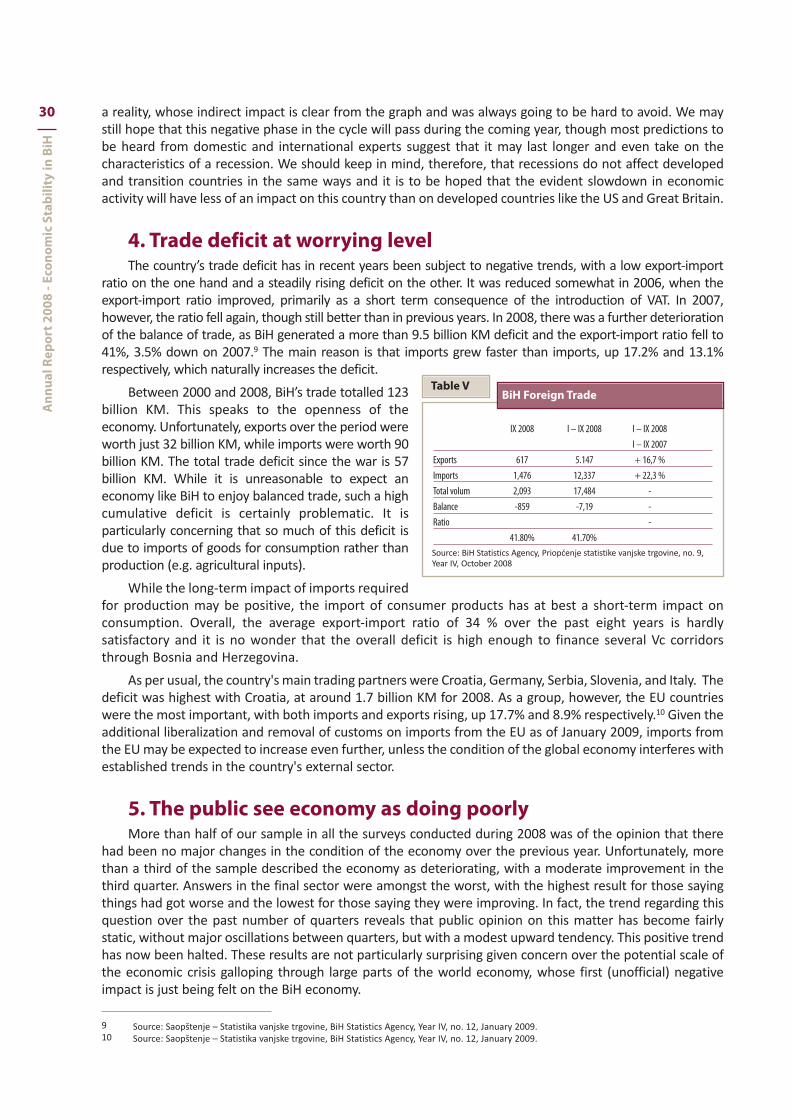
a reality, whose indirect impact is clear from the graph and was always going to be hard to avoid. We maystill hope that this negative phase in the cycle will pass during the coming year, though most predictions tobe heard from domestic and international experts suggest that it may last longer and even take on thecharacteristics of a recession. We should keep in mind, therefore, that recessions do not affect developedand transition countries in the same ways and it is to be hoped that the evident slowdown in economicactivity will have less of an impact on this country than on developed countries like the US and Great Britain.
4. Trade deficit at worrying levelThe country’s trade deficit has in recent years been subject to negative trends, with a low export-import
ratio on the one hand and a steadily rising deficit on the other. It was reduced somewhat in 2006, when theexport-import ratio improved, primarily as a short term consequence of the introduction of VAT. In 2007,however, the ratio fell again, though still better than in previous years. In 2008, there was a further deteriorationof the balance of trade, as BiH generated a more than 9.5 billion KM deficit and the export-import ratio fell to41%, 3.5% down on 2007.9 The main reason is that imports grew faster than imports, up 17.2% and 13.1%respectively, which naturally increases the deficit.
Between 2000 and 2008, BiH’s trade totalled 123billion KM. This speaks to the openness of theeconomy. Unfortunately, exports over the period wereworth just 32 billion KM, while imports were worth 90billion KM. The total trade deficit since the war is 57billion KM. While it is unreasonable to expect aneconomy like BiH to enjoy balanced trade, such a highcumulative deficit is certainly problematic. It isparticularly concerning that so much of this deficit isdue to imports of goods for consumption rather thanproduction (e.g. agricultural inputs).
While the long-term impact of imports requiredfor production may be positive, the import of consumer products has at best a short-term impact onconsumption. Overall, the average export-import ratio of 34 % over the past eight years is hardlysatisfactory and it is no wonder that the overall deficit is high enough to finance several Vc corridorsthrough Bosnia and Herzegovina.
As per usual, the country's main trading partners were Croatia, Germany, Serbia, Slovenia, and Italy. Thedeficit was highest with Croatia, at around 1.7 billion KM for 2008. As a group, however, the EU countrieswere the most important, with both imports and exports rising, up 17.7% and 8.9% respectively.10 Given theadditional liberalization and removal of customs on imports from the EU as of January 2009, imports fromthe EU may be expected to increase even further, unless the condition of the global economy interferes withestablished trends in the country's external sector.
5. The public see economy as doing poorly More than half of our sample in all the surveys conducted during 2008 was of the opinion that there
had been no major changes in the condition of the economy over the previous year. Unfortunately, morethan a third of the sample described the economy as deteriorating, with a moderate improvement in thethird quarter. Answers in the final sector were amongst the worst, with the highest result for those sayingthings had got worse and the lowest for those saying they were improving. In fact, the trend regarding thisquestion over the past number of quarters reveals that public opinion on this matter has become fairlystatic, without major oscillations between quarters, but with a modest upward tendency. This positive trendhas now been halted. These results are not particularly surprising given concern over the potential scale ofthe economic crisis galloping through large parts of the world economy, whose first (unofficial) negativeimpact is just being felt on the BiH economy.
9 Source: Saopštenje – Statistika vanjske trgovine, BiH Statistics Agency, Year IV, no. 12, January 2009.10 Source: Saopštenje – Statistika vanjske trgovine, BiH Statistics Agency, Year IV, no. 12, January 2009.
IX 2008 I – IX 2008 I – IX 2008I – IX 2007
Exports 617 5.147 + 16,7 %Imports 1,476 12,337 + 22,3 %Total volum 2,093 17,484 -Balance -859 -7,19 -Ratio -
41.80% 41.70%Source: BiH Statistics Agency, Priopćenje statistike vanjske trgovine, no. 9,Year IV, October 2008
BiH Foreign TradeTable V
30
Ann
ual R
epor
t 200
8 - E
cono
mic
Sta
bilit
y in
BiH

Looked at by entity, we find that during the second quarter of 2008, the RS sample were morepessimistic, but in the other three it was the FBiH sample who were. At the end of 2008, some 37% of theFBiH sample said the economic situation had deteriorated. The RS sample result was lower, but still high, at32%.12 Looked at by ethnic majority area, we find that Bosniak majority areas were the most pessimisticthrough the year, followed by Serb majority areas, with the best results generally in Croat majority areas.13
The public's economic expectations for the coming year do not give much better grounds for optimism.As usual, most of the sample in all the surveys of 2008 said they expected no change in economic conditions.The answers to the last quarterly survey were the worst in this regard. We assume that fear of the economiccrisis may have depressed the public’s expectations, as the percentage in our final poll of 2008 who said theyexpect things to get worse economically speaking was particularly high (25%).
Overall, however, public opinion seems to be only moderately affected by nervousness over theeconomic crisis, the hot topic of the day, which is, in the end, a good thing for the Bosnian and Herzegovinianeconomy. It is a recognized phenomenon that public opinion is an important factor in the economy, as the
Have your family's economic circumstances changed over the past year, and if so how?11Graph 2
How do you expect your family finances to change over the next year?14Graph 3
11 Source: Table VI in annex.12 Source: Table VII in annex.13 Source: Table VIII in annex.14 Source: Table IX in annex.
31
Annual Report 2008 - Econom
ic Stability in BiH

less the degree of fear, the less consumption willsuffer, and falling consumption aggravates thesituation. To put it in the terms of one of the bestknown of economists, John Maynard Keynes, it isimportant that BiH not fall into the “liquidity trap,”where fear of crisis leads the populace and industryto save money, reducing consumption andinvestment, aggravating economic conditions in thecountry. If our sample's responses are representativeof views in the country, then this should not happen,at least to any very significant degree.
As the graph makes clear, a very high percentageof the population in late 2007 and early 2008 wereworried that prices were going to rise. While this wasa matter of public perception, the picture does seemto reflect what really happened, as in late 2007 andearly 2008 food and fuel prices rose sharply on worldmarkets, for fuel prices to fall steeply again in the second half of 2008. In any case, we note a reduction inthe second half of 2008 in the percentage of our sample predicting further price rises, though a majority stilldo. We also note that there should be a reduction in the prices of EU imports, but we will be able to judgethis only after enough time has gone by after the implementation of the changes. Preliminary projectionsfor January 2009 suggest that the impact may be less than expected.
Expect prices over the next six monthsto...I?15
Graph 4
15 Source: Table X in annex.16 Source: Table XII in annex.
Sep 2006 Dec 2006 April 2007 Sep 2007 Nov. 2007 Mar. 2008 Jun. 2008 Sept. 2008 Nov. 2008Bosnia and Herzegovina % % % % % % % % %Total fall 14.4 13.3 10.4 12.0 16.9 12.4 11.1 13.2 11.8Total rise 18.3 21.5 22.0 23.8 17.9 21.4 18.5 22.8 20.9No change 59.7 59.2 55.6 54.0 58.0 60.0 63.0 58.0 62.6DK/NA 7.5 6.0 12.0 10.3 7.3 6.2 7.3 6.0 4.6Total 100.0 100.0 100.0 100.0 100.0 100.0 100.0 100.0 100.0
Sep 2006 Dec 2006 April 2007 Sep 2007 Nov. 2007 Mar. 2008 Jun. 2008 Sept. 2008 Nov. 2008FBiH % % % % % % % % %Total fall 14.4 15.5 11.0 11.7 19.0 11.1 8.5 13.4 14.2Total rise 17.8 19.0 20.2 23.1 16.2 20.4 16.6 21.1 18.4No change 60.2 58.0 52.9 50.2 56.6 61.1 66.7 58.7 62.8DK/NA 7.6 7.5 15.9 15.0 8.2 7.4 8.2 6.8 4.6Total 100.0 100.0 100.0 100.0 100.0 100.0 100.0 100.0 100.0REPUBLIKA SRPSKA Sep 2006 Dec 2006 April 2007 Sep 2007 Nov. 2007 Mar. 2008 Jun. 2008 Sept. 2008 Nov. 2008Total fall 14.6 10.0 10.1 13.1 14.4 14.4 14.8 13.3 8.9Total rise 19.8 25.7 25.2 24.9 20.5 23.2 22.2 26.5 25.6No change 58.1 60.2 58.0 58.2 58.7 57.9 56.5 55.0 60.6DK/NA 7.6 4.1 6.6 3.8 6.3 4.5 6.4 5.2 4.9Total 100.0 100.0 100.0 100.0 100.0 100.0 100.0 100.0 100.0BRČKO Sep 2006 Dec 2006 April 2007 Sep 2007 Nov. 2007 Mar. 2008 Jun. 2008 Sept. 2008 Nov. 2008Total fall 11.8 15.4 0.8 4.6 12.6 14.4 5.1 2.1Total rise 5.6 11.9 13.0 22.5 13.9 16.1 3.1 0.5 8.6No change 78.5 72.7 82.8 77.5 81.5 67.4 82.5 94.4 89.3DK/NA 4.2 3.4 3.9Total 100.0 100.0 100.0 100.0 100.0 100.0 100.0 100.0 100.0Source: Public opinion polls conducted for EWS by Prism Research
Expect household income over the next six months to...?Table XI
32
Ann
ual R
epor
t 200
8 - E
cono
mic
Sta
bilit
y in
BiH

We have seen that most of the sample said they expect prices to rise over the coming year. At the sametime, a large percentage (around 63%) said they do not expect their income to increase. Around 20% doexpect their income to improve, suggesting that any further increase in prices will be at the expense of livingstandards for most people. While we are talking about expectations, this trend is nonetheless worrying,particularly with regard to low income families.
Finally, given the above analysis, we should not be surprised to find that more than 80% in all our pollsduring 2008 said that they would not be able to put aside any of their income as savings over the comingyear. The worst results were recorded in the final quarter of 2008.16 Such indicators only further confirm theBiH economy's considerable dependence on foreign savings, which is hardly a good sign, particularly at atime when foreign capital will be scarcer, largely as a consequence of the global financial crisis.
6. BiH institutions are too costly and time-consuming andgetting more so
The importance of institutions for the economic progress of a country under modern economicconditions no longer appears in doubt. In addition to their importance for economic development, this isalso an interesting question with regard to BiH, because there has been considerable discussion recently oninstitutional issues. There has been, consequently, sufficient reason for us to monitor issues related to theinstitutional aspects of the BiH economy and society. As this is the economic section of the report, we aremost interested in the economic consequences of institutional costs and the quality and effectiveness of theframework of local institutions.
According to our 2008 surveys, more than half the sample thinks the way in which government isorganized and carries out its functions costs ordinary people considerably more than it should, both in termsof actual cash payments and of time spent in dealing with them. As with other answers, the fourth quartersaw the worst results to date. We assume one reason for this is the reform of direct taxation in the FBiH, butit may equally be the under par response to current economic problems, particularly given the globalfinancial crisis. In any case, 56% think that institutions in BiH cost more than they should in money terms,while 57% said they require too much time. It is worth noting that the worst results were from the RS in thefirst two quarters, but from the FBiH after that.18 In other words, a clear majority are of the view that BiHinstitutions cost too much money and time. Even more starkly, they are expensive, time consuming, and ofquestionable efficiency.
Expect prices and income to rise in BiH17Graph 5 Graph 6
17 Source: Table XIII in annex.18 Source: Table XIII in annex.19 Source: Table XVI in annex.
Transaction costs associated withgovernment institutions in BiH18
33
Annual Report 2008 - Econom
ic Stability in BiH

If we rate the direct and indirect costs caused by institutions on a scale, our sample have clearlyindicated that their cost of living is considerably higher due to both direct costs in terms of payments toinstitutions and indirect costs (e.g. time required for demanding procedures, inefficiency, poorimplementation of laws, etc). Taking an average of our samples’ estimates of these direct and indirect costs,we find that their living costs were at least 10-30% higher as a result of direct payments to institutions anda further 10-30% higher because of indirect costs caused by these institutions.20 In other words, theseresponses suggest that the public are not at all happy with the quality and effectiveness of domesticinstitutions, as, in addition to direct costs like taxes, they are faced with high indirect costs and institutionalfailure, largely as a result of poor implementation in the field. We note that the answers were mostpessimistic in Bosniak and Croat majority areas in all the polls carried out during 2008. In other words, thesituation is worse in the Federation of BiH, which is hardly surprising given the complex administrativestructure of the entity, which is very costly, both directly and indirectly.
Given that the institutions of importance for economic growth and development can be more or lessefficient, we use our survey to monitor the public's views regarding certain basic institutions in BiH and howthey do their job. The best ranking institutions are the Central Bank of BiH, the Indirect Taxation Authority,and the Courts. In all previous reports the Courts were very poorly ranked, so this result represents a majorturnaround. It is however largely due to the collapse in confidence in the entity Tax Administrations, whichhad previously normally come third. On the other hand, the worst ranked institutions were the privatisationagencies, the employment bureaux, and the Foreign Investment Promotion Agency.21 These results shouldcertainly give those institutions pause for thought, when it comes to assessment of their work. The resultsof the survey are given in more detail in Table XIV in the annex to this report.
Finally, when formal government institutions fail to carryout their tasks effectively, it provides a motivefor the public and business to build so-called informal institutions in order to finish business which shouldbe the responsibility of government institutions. Informal institutions include the use of friendly, family, orwork connections in order to complete a task “more quickly” or “easily.” The results of the 2008 surveyssuggest that the public do use such informal institutions or a range of informal rules of behaviour but notexcessively.22
20 Source: Table XVII in annex.21 Source: Table XIV in annex.22 Source: Table XV in annex.
34
Ann
ual R
epor
t 200
8 - E
cono
mic
Sta
bilit
y in
BiH

1. Economic situation worsens during 2008The results of our polls for 2008 were, in so far as they relate to the economic situation in the country,
not merely poor, but also showed signs of further deterioration towards the end of the year. The bestresults, relatively speaking, were for the third quarter, while the worst were the final quarter. As the graphshows, 70% of our sample of 150 leading managers characterise the economic situation in the country asworse and only 4% describe it as better than last year. Some 28% said that there had been no change.Given the global economic environment, with economic, financial, and credit crises worldwide, which hasbegun to transfer to BiH, these results are approximately what was to be expected. All in all, the sampleresponse suggests that 2007 was a more successful year for the business sector in BiH than 2008.
Business sector expectations regarding the economic situation over the first six months of 2009,taken from our final survey of 2008, are hardly optimistic. In other words, a majority of the sample (62%)
IV THE BUSINESS ENVIRONMENT IN BiH1. Economic situation worsens during 2008
2. Idle capacity in every second company
3. Financial indicators for Bosnian companies getting worse
4. Inefficient government, unfair practices, and the high tax burden hamper private sector operations
5. High direct and indirect costs of domestic institutions
Compared to a year ago, the economy is….(%)1Graph 1
1 Source: Table I in annex.
ANNUALREPORT2008
35
Annual Report 2008 - Political Stability in BiH

expect things to deteriorate over the coming six months, while 35% expect no change, and only 3% expectthings to improve.2 As above, these answers are not particularly surprising, given that the Bosnianbusiness sector has no doubt begun to “feel” the consequences of the global crisis, the results of whichremain to be seen. For the moment, we cannot claim unequivocally that the country is in recession orhow badly it will be affected.
2. Idle capacity in every second companyFor some time we have been monitoring reported utilization of capacity by the business sector. As
this is an indicator which it is difficult to get at through the official statistics, but an important one of thereal condition of industry, the sample's responses regarding the degree to which existing capacity is beingput to use deserve particular attention. We have frequently stressed in the quarterly reports that thedegree to which existing capacity is being used indicates how far industry is from its production potential,which is to say how great the gap is between the work to be done and the capacity available to do it.Generally speaking, the answers are not heartening, as a large percentage of companies do haveunemployed capacity, nearly fifty percent in fact.
The fact that such a high percentage of the companies in the survey have idle capacity is not a problemfor those companies alone, but also indirectly a macroeconomic issue for the country. Our survey makesclear the reason behind the underutilization of existing capacity, a reason that is certainly not hopeful forBiH industry. Unfortunately, as we enter 2009 we are beginning to hear talk of trying to maintain existingcapacity utilization and employment levels, given the trend towards recession in the global economy. Inother words, the measure of success for the BiH economy would now be to navigate the negative phase ofthe business cycle without major redundancies and further reductions in capacity use. The impact on theBiH economy remains to be seen, but initial and unconfirmed data suggest that workers are being laid offand capacity turned off. One can even hear commentary, for example in neighbouring Croatia, to the effectthat the situation is being “welcomed” by some employers as an opportunity to get rid of potentiallysurplus or troublesome workers under cover of recession. Such behaviour can hardly be ruled out, thoughthere have been no reports of it in Bosnia and Herzegovina as yet.
3. Financial indicators for Bosnian companies getting worseBiH managers clearly think that the economy has been worse in 2008 than it was in 2007. As these are
business people, their views are clearly based in large part on how their companies are doing. In otherwords, we should expect worsening financial data, which is what we have been getting through 2008.While the first three quarterly reports of this year showed most companies reporting improving results, the
Exploitation of Industrial Capacity in BiH3Graph 2
3 Source: Table III in annex.
36
Ann
ual R
epor
t 200
8 - B
usin
ess
Envi
ronm
ent i
n Bi
H

actual percentage so reporting declined steadilyover the year. This has culminated in our fourthquarter results, which show more companiesreporting deterioration compared to the same timelast year. To be precise, 29% of our sample said theirresults were worse than last year, while 27% saidthey were better.
Expectations for the first six months of 2009show that business expects things to continue gettingworse, with 43% of companies projectingdeteriorating financial results. This is the first timesince we began polling that our sample has beenmore negative in its projections than in its assessmentof the preceding period. There has always been amodest optimism that the future will be better, untilnow. The answers to these two questions suggest thatcompanies in BiH are in a worse position than a yearago and expect it to continue to deteriorate. The mainreason for this is of course the global crisis and itsimpact on the BiH economy. There are no majordifferences between the entities.
In addition to the poorer financial results in 2008, our survey results suggest an increase in company debtcompared to a year ago. The increase is higher in the RS. This is a somewhat ambiguous indicator, however,as an increase in debt may equally be a consequence of investment, as we have pointed out in previousreports. Moreover, when considering increased debt, we should expect it to fall in the coming period, giventhe rise in interest rates due to the crisis.
And finally, poor financial results and higher debt levels than in 2007 may be behind the reduction in thenumber of companies reporting a profit. The percentage declined through 2008, so that in the December poll,69% said they had made of profit and 31% said they had made a loss.5 In 2007, around 80% of the sampleregularly reported operating at a profit.
4. Inefficient government, unfair practices, and the high taxburden hamper private sector operations
Our sample's responses when asked to what degree the various levels of government help business toovercome obstacles have been rather discouraging for some quarters. Results for 2008 varied considerablyby quarter, but were worst in December, particularly for state and entity level.6 These poll results reflectbusiness impatience with the macro-level of government, as though neither cantons nor municipalauthorities did much better in the December survey, they did receive higher marks in earlier surveys. Overall,
Better The same Worse(%) (%) (%)
Jun-05 23 43 34Sep-05 20 49 31Dec-05 31 39 29Mar-06 19 43 38Jun-06 35 34 28Sep-06 36 38 26Dec-06 38 36 26Apr-07 43 36 21Sep-07 62 24 14Dec-07 46 34 20Mar-08 50 32 17Aug-08 35 41 24Sep-08 28 46 26Dec-08 27 44 29Source: Public opinion polls conducted for EWS by Prism Research
With regard to your company’s overalloperations, how would you characterizeyour financial status compared to thesame period last year?
Table IV
4 Source: Table V in annex.5 Source: Table VII in annex. 6 Source: Table VIII in annex.
Higher (%) The same (%) Less (%) N.A. (%)IV' 07 IX '07 XII '07 III '08 VIII '08 IX '08 XII '08 IV' 07 IX '07 XII '07 III '08 VIII '08 IX '08 XII '08IV' 07 IX '07 XII '07 III '08 VIII '08 IX '08 XII '08 IV' 07 IX '07 XII '07 III '08 VIII '08IX '08XII '08
BiH 28 23 39 26 23 34 37 46 35 34 46 47 42 35 25 31 25 27 20 24 28 1 11 1 1 10FBiH 29 24 42 27 25 31 35 42 31 34 43 47 43 38 28 33 24 28 20 26 27 1 12 0 1 9RS 22 19 29 24 17 41 42 62 48 35 52 48 41 33 17 23 29 24 21 18 25 0 10 6 14Source: Public opinion polls conducted for EWS by Prism Research
How would you compare your company's level of debt to the same period last year?Table VI
37
Annual Report 2008 - Business Environm
ent in BiH

if we take a cross-section of answers regarding the effectiveness of government over the past two years, wefind that the private sector has found the state level least helpful and the municipal level most helpful. If welook at the other two levels of government, entity and canton, we find that the results for the past two yearssuggest that the entity level was less helpful than the cantonal.
In addition to the lack of support from government, the private sector also meets a number of otherbarriers specific to this country. We have for some time been monitoring which of these represent thegreatest barriers to business and have received much the same answers quarter after quarter, year after year.Overall, our surveys suggest that most of the major problems they face in business relate to institutions in BiH,so that ineffective and inefficient institutions and high institutional costs are major obstacles to business here.
In most of our polls in 2007 and in early 2008, our sample identified high tax rates, unfair businesspractices, political instability, and the courts as the main problems in conducting business. The answers for thethird quarter of 2008 were somewhat different, in identifying the courts as the main obstacle to business, andonly then the tax burden, corruption, and in fourth place unfair business practices. The final quarter poll resultsare very similar, with minor deviation, as the main problems were now ranked as follows: the tax burden,followed by the courts, unfair business practices, and corruption. Summing up the last two years, then, it wouldseem that the respondents to our seven quarterly polls were most inclined to identify the following as obstaclesto business (as ranked by the polls): 1. the high tax burden; 2. unfair business practices; 3. political instability;4. the courts. These obstacles were on average identified by more than 80% of our business sector sample,which shows the extent to which they are clear and obvious barriers to business in BiH and that they shouldbe tackled as a priority in any attempt to deal with the problems afflicting the private sector here.
The respondents identified the following as the least problematic issues, from the list of suggestionsprovided in the questionnaire: safety regulations and standards, environmental regulations, and a lack ofqualified employees. It is worth noting that according to our last three quarterly surveys the lack of qualifiedemployees is the least of Bosnian managers’ worries. This suggests, to some degree at any rate, that thebusiness sector in Bosnia and Herzegovina does not think that there is a major problem in accessingappropriate human capital. Connecting this to the answers regarding the use of capacity, as there is no lackof human capital but there is surplus capacity to be put to use, one possible problem would seem to beinsufficient physical capital, or in other words a lack of investment required to bring domestic capacity on line.
5. High direct and indirect costs of domestic institutionsGiven that it has become obvious from the results of our surveys that the business success of local
companies is greatly affected by institutions, we have since the beginning of 2008 been monitoring therelative efficiency of the relevant institutions in Bosnia and Herzegovina. Having identified which are the
Very Somewhat Little Not at all N.A.XII '07 III '08 VIII '8 IX '08 XII '07 III '08 VIII '8 IX '08 XII '07 III '08 VIII '8 IX '08 XII '07 III '08 VIII '8 IX '08 XII '07 III '08 VIII '8XII '08
Customs procedures 24 23 19 21 38 23 33 46 19 23 13 17 9 20 13 12 10 10 21 6High taxes 49 52 50 39 20 19 24 33 19 12 10 17 3 11 6 6 9 6 10 5Unfair competition 57 46 48 34 19 24 29 26 13 15 9 25 5 9 4 7 6 7 10 6Corruption 51 36 46 37 18 21 16 25 11 13 9 20 5 9 4 5 15 21 26 15The performance of the courts 44 45 47 43 25 20 21 22 13 15 11 20 5 7 7 5 13 14 14 11Political instability 46 44 36 26 32 27 32 39 10 10 10 23 5 10 8 3 8 10 14 9Labour market regulation 24 21 14 24 23 23 27 31 24 25 27 27 16 23 14 11 13 7 18 6Tax administration 32 25 23 20 29 27 32 34 18 19 20 29 10 20 10 9 11 8 14 6Procedures for issuing work permits 38 37 39 36 28 30 30 29 11 8 9 20 11 15 9 7 11 11 13 5Environmental regulations 22 21 17 17 25 25 28 35 23 21 21 30 15 21 16 9 15 11 19 13Safety regulations and standards23 16 16 11 18 29 20 28 30 21 32 36 14 22 16 13 15 12 17 11Lack of qualified staff 24 18 19 17 16 25 24 34 10 16 20 25 10 25 16 16 39 15 21 7Source: Public opinion polls conducted for EWS by Prism Research
To what extent do the following represent an obstacle to successful operationsTable IX
38
Ann
ual R
epor
t 200
8 - B
usin
ess
Envi
ronm
ent i
n Bi
H

key economic and non-market institutions for business operations and therefore, in the final analysis, foreconomic growth, our goal is to determine how well or poorly those institutions are doing their job orfilling the function for which they were created. The following table presents the results of the last threequarterly surveys.
In ranking the institutions which economic theory and practice consider relevant for the businesssector and economic growth, companies in Bosnia and Herzegovina damned the following as the threeleast effective: the legal system, the Social Insurance Funds, and the Privatisation Agencies. The list has notchanged much through the year, which is a sufficient indication of where progress is required as a priority.An average of the last seven polls, including more than 700 companies in Bosnia and Herzegovina, leads usto the same conclusion, namely that private sector considers the following three institutions the leasteffective (as ranked): 1. the legal system; 2. the Privatisation Agencies; 3. the Social Insurance Funds.
On the other hand, the most effective institutions are considered to be the Central Bank of BiH, theIndirect Taxation Authority, and the entity Tax Administrations. The fiscal and monetary agencies have innearly all reports to date received the best ranking. The Central Bank of BiH has uniformly received thebest ranking from business in all polls conducted over the past two years, a result which deservesrecognition.
It is worth noting that the results of all four surveys for 2008 make clear the extent to which informalinstitutions are availed of in Bosnia and Herzegovina. Nearly 70% of companies make use of informalconnections and contacts, to a greater or lesser degree.7 Nearly 70% of the business sector sample alsosaid that they used a variety of informal or unwritten rules in conducting their business, which isconnected with the use of informal and the existence of inefficient formal institutions.8 In short, the greatmajority of our sample uses informal alternative institutions in their day-to-day operations, to a greateror lesser extent. Moreover, our sample has been increasingly willing to admit to using such means overthe year, but particularly since the third quarter.
Finally, the efficiency of the institutional framework may also be approached directly through thecosts institutions cause the private sector. These costs are known as transaction costs and include bothdirect financial costs and indirect costs expressed in the amount of time spent on various procedures,activities, and processes. According to our third quarter poll, more than half (around 60% from thecorporate sector) said transaction costs are higher than they should be both in terms of financial costsand of time required for the various procedures.9 Interestingly, over the past two years, our results have
Very well Fairly well Fairly poorly Very poorly N.A.IV' 07 IX IX '08 XII '08 IV' 07 IX IX '08 XII '08 IV' 07 IX IX '08 XII '08 IV' 07 IX IX '08 XII '08 IV' 07 IX IX '08XII '08
Central Bank of BiH 34 45 24 30 34 37 43 39 3 3 7 4 3 0 6 6 24 14 20 20Indirect Tax Authority 23 28 15 16 54 49 47 50 10 8 23 18 5 5 8 9 8 10 7 9Entity Tax Administrations 14 20 11 6 49 47 46 48 16 13 25 25 7 7 13 17 14 13 5 5The Judicial System 5 7 4 3 37 29 18 17 13 22 39 36 34 33 30 35 11 9 9 10European Integration Directorate 3 5 7 7 33 28 22 18 8 9 26 20 8 9 11 10 47 49 34 43FIPA 2 7 4 3 31 20 29 19 8 11 18 18 18 18 20 19 40 43 29 41Privatisation Agency 7 8 1 2 29 24 20 14 14 21 28 22 23 22 25 28 28 26 26 34Banking Agency 10 13 7 5 41 39 28 32 7 7 29 20 6 7 8 7 36 34 28 37Employment Bureaus 2 11 3 3 43 30 31 36 15 14 34 24 14 20 16 17 26 26 16 20Foreign-Trade Chamber 2 14 7 4 44 37 28 29 13 13 32 30 10 14 20 18 31 22 13 19Entity Chambers of Commerce 5 13 9 11 46 35 28 28 17 18 31 27 10 12 20 19 22 22 12 15Social Funds 2 7 20 2 26 16 9 10 11 7 33 26 8 19 33 37 52 51 23 26Source: Public opinion polls conducted for EWS by Prism Research
How well do the following institutions do their joyTable X
7 Source: Table XI in annex.8 Source: Table XII in annex.9 Source: Table XIII and XIV in annex.
39
Annual Report 2008 - Business Environm
ent in BiH

tended on average to suggest that the private sector considers the opportunity cost in lost time a greatercost than the cash they pay the authorities, again suggesting dissatisfaction with how domesticinstitutions do their job.
During 2008, we also asked how much higher operating costs were as a result of both direct andindirect institutional costs. We were surprised to find that most companies’ costs were considerablyhigher as a result of direct costs, but even more that businesses put such a high estimate on the indirectcosts they face. In other words, the business sector considers the costs due to lengthy procedures,inefficiency, poor implementation of the law, and so on to be very high.
According to our final survey for 2008, most of the sample (48%) said their costs were between 5%and 20% higher due to direct payments to institutions.10 Nor should we be surprised to find that costs arehigher in the FBiH than in the RS, given the additional layers of government and the more complexinstitutional and administrative structure there. This was also the case in the third quarter. Moreover, ourpoll suggests that indirect costs are also very high, with 46% of companies saying they add between 5%and 20% to their costs. Again the percentage was higher in the FBiH than in the RS, as was the case duringthe third quarter.
10 Source: Tables XV and XVI in annex.
III '08 IX '08 XII '08BIH FBIH RS BIH FBIH RS BIH FBIH RS
0-5 % 19 19 21 10 13 15 18 135-10 % 22 23 21 27 27 23 25 21 2910-20 % 17 14 24 26 33 5 21 24 1320-30 % 7 8 3 9 7 18 10 10 1330-40 % 2 3 0 4 4 5 3 4 040-50 % 1 1 0 7 4 18 3 3 450-60 % 6 5 7 1 1 2 3 0> 60 % 3 4 0 3 1 9 7 6 8n.a. 23 23 24 13 10 23 14 13 21Source: Public opinion polls conducted for EWS by Prism Research
Looking at institutions in BiH, can you estimate how much higher your total costs are because ofindirect payments caused by government
Table XVI
40
Ann
ual R
epor
t 200
8 - B
usin
ess
Envi
ronm
ent i
n Bi
H

The Social Stability Index has been in decline since 2001
There are several reasons for this:
• The obvious connection between social, economic, and political stability: The final survey of 2008shows a more than 0.7 correlation between the Social Stability Index and the Economic StabilityIndex, while the correlation of the social and political stability indices is 0.58.
• Growing inequality: The GINI coefficient increased from 0.26 in 2004 to 0.41 in 2007, even thoughthe number of people living in poverty decreased from 19 to 17 percent. Nearly the same number
V INCOMES AND SOCIAL WELFARE1. Fewer households without income during 2008
2. Public expectations subject to various influences during 2008
3. Purchasing power and living standards unchanged through 2008
4. Social protection and minimum living standards largely unchanged
Social Stability Index Economic Stability Index Political Stability IndexSocial Stability Index 1 0.72 0.58Economic Stability Index 0.72 1 0.56Political Stability Index 0.58 0.56 1Note: Range of -1 and 1 (0 no connection between variables)Source: EWS, quarterly reports.
Correlation between the social, economic, and political stability indices for May 00 - Dec 08.Table
ANNUALREPORT2008
41
Annual Report 2008 - Political Stability in BiH

live around the poverty line. Our surveys show about 50% of households with less than 500 KM inmonthly income, with seasonal ups and downs. Although this number is lower now than in 2001 or2002, the increased cost of living means that many of those with nominally higher incomes are infact struggling to meet basic needs.
• The general public’s expectations are gloomy, with constant worry regarding the economic situation,the impact of privatisation, whether they will be able to save, and price increases. The decline in theindex since 2007 is related to higher prices and living costs and deteriorating expectations.
• Although average wages have almost tripled since 2000, the obvious consumerism that has sweptthe country had increased household debt levels. This is a very dangerous situation when jobuncertainty is on the rise. The fact that household debt in 2008 was above 6 billion KM is verydisturbing.
• Prices grew moderately during the first six years of EWS, but the introduction of VAT and the rise inglobal food and oil prices brought uncertainty. Moreover, it has become increasingly difficult toavoid paying utility and power bills, which was precisely the “give” in the system that allowed manypeople to cover their basic needs.
• Generally, the situation regarding minimum standards of living and social protection is very weak.Conditions in the Federation suggest things are worse there than in the Republic of Srpska, but thesocial security system is fragile and subject to major political discretion in both entities. Afterproblems in 2001 and 2002, the pension system has remained stable, though there were minorissues in 2008. There is clearly a problem regarding the ratio of the registered employed andpensioners, which has been falling, however. The current PAYE system will face serious problems inyears to come.
We have paid more attention to social exclusion over the past few years. The 2007 HumanDevelopment Report found that almost 50% of population were socially excluded, with the mostdisadvantaged groups being old people, the young, the Roma, people with disabilities, and the ruralpopulation, with some impact of ethnic background and gender. Ethnic minority groups like returnees toareas where one constitutive people is dominant reveal the clear problems of Bosnia and Herzegovina –the lack of political or economic integration, combined with problems finding employment or accessingsocial protection, education, or health care. These problems will become more prominent now thatalmost all donors have left the country.
Shifting out attention to 2008, we note a certain recovery of the Social Stability Index, caused largelyby isolated trends and events in economic and political life. In November 2008, it was at 46 points, threepoints higher than it had been in late 2007.
As already mentioned in the quarterly reports, particular trends in the social sector often have theircauses in other areas. Consequently, it is worth noting that in 2008 the Economic Stability Index recoveredconsiderably, as did the Ethnic Stability Index, while the turbulent political situation produced fluctuationsin the Political Stability Index. As noted above, the Social Stability Index is strongly correlated with boththe economic and political stability indexes, so that change in one sector produces change in the others.
The Social Stability Index reflects problems facing Bosnian and Herzegovinian society: low incomes,based on a poor economy and an undereducated workforce, inadequate policy to exploit the country’scompetitive advantages, and the absence of appropriate government (social) programmes ormechanisms, as indicated by our own sample’s expectations, all speak to the fragility of the social securitysystem. The year just past was marked by growing prices, pre- and post election instability, politicaltension and confrontation, declining regional stability following the declaration of independence ofKosovo, and weakening industrial and economic growth (particularly during the last quarter of the year).Finally, even the most important event of 2008, the signing of the Stabilisation and AssociationAgreement with the European Union, has left little trace at the level of social stability, any more than onour sample’s opinions on related questions.
The increase in the value of the Social Stability Index during 2008 was due largely to a reduction inthe number of households without any income or on low incomes (less than 500 KM), an increase inaverage salaries which kept pace with increasing living costs, and somewhat better expectations (exceptduring the last quarter). During 2008, the percentage of the samples in the Republika Srpska and Brčko
42
Ann
ual R
epor
t 200
8 - I
ncom
es a
nd S
ocia
l Wel
fare

district ready to support public protests, strikes, or demonstrations tended downwards, while rising in theFederation. Fewer people also said they wanted to emigrate, particularly amongst the middle-aged (from36 to 50 years of age). Pensions increased, though the increase was greater for the highest pensions evenin percentage terms (around 22.7% in the RS and 10.5% in the FBiH, compared to 6.7% in the RS and 5.1%in the FBiH for lower pensions).
1. Fewer households without income during 2008Looking at our survey data for 2008, we find that for two quarters there were no households
reporting no income in the FBiH and RS, and for three quarters in Brčko District (see Table I). This is areversal of trends in previous years, as there have always been some people who claimed to have nosources of income.1
FBiH RS Brčko DistrictMarch 08. June 08. Sept 08. Nov 08. March 08. June 08. Sept 08. Nov 08. March 08. June 08. Sept 08. Nov 08.
No income 2,2 1,0 4,3 0,8 4,3< 100 KM 2,1 3,5 1,0 2,4 5,2 7,6 5,6 4,5 5,6 17,1 7,9 9,2101 - 200 7,8 1,1 2,2 1,3 9,8 5,6 6,7 3,1 24,1 6,9 13,6 5,3201 - 300 8,7 16,7 15,4 10,1 9,3 12,6 15,4 16,0 30,2 25,4 38,4 27,8301 - 400 8,5 14,7 15,8 14,4 9,9 9,8 17,7 14,4 6,8 8,6 19,0 24,2401 - 500 8,5 12,1 11,7 12,2 9,9 11,4 13,2 11,4 11,1 9,0 3,8 14,1501 - 600 6,6 7,8 9,5 10,8 6,7 8,8 6,7 10,1 8,1 2,9 4,0 5,9601 - 700 6,3 6,0 6,7 8,3 4,5 8,1 4,6 7,4 4,1 7,3 4,1701 - 800 8,2 5,0 5,5 5,9 3,5 4,3 2,3 4,4 2,2 1,0801 - 900 3,9 4,6 5,9 5,7 3,7 2,5 2,7 2,2901 - 1000 2,4 1,4 3,3 3,3 3,1 2,4 1,6 2,0 0,51001 - 1100 5,3 0,5 0,9 1,3 3,8 1,6 0,41101 - 1200 1,3 0,2 0,1 0,2 1,4 0,3 0,31201 - 1300 3,2 0,4 0,2 0,5 2,1 0,5 0,3 0,81301 - 1400 0,7 2,11401 - 1500 1,5 2,21501 - 1600 1,4 0,81601 - 1700 0,9 0,3 0,71701 - 1800 0,4 0,51801-1900 0,2 1,01901 - 2000 0,0 1,0> 2000 KM/DM 1,4 0,8NA 18,4 25,8 20,4 23,7 13,8 24,6 22,1 24,0 9,2 5,4 4,4 12,6
100,0 100,0 100,0 100,0 100,0 100,0 100,0 100,0 100,0 100,0 100,0 100,0No income 2,2 1,0 4,3 0,8 4,3< 100 KM 2,1 3,5 1,0 2,4 5,2 7,6 5,6 4,5 5,6 17,1 7,9 9,2101 - 200 7,8 1,1 2,2 1,3 9,8 5,6 6,7 3,1 24,1 6,9 13,6 5,3201 - 300 8,7 16,7 15,4 10,1 9,3 12,6 15,4 16,0 30,2 25,4 38,4 27,8301 - 400 8,5 14,7 15,8 14,4 9,9 9,8 17,7 14,4 6,8 8,6 19,0 24,2401 - 500 8,5 12,1 11,7 12,2 9,9 11,4 13,2 11,4 11,1 9,0 3,8 14,1SUBTOTAL to 500 37,9 48,2 47,1 40,3 48,3 47,0 59,4 49,5 77,8 66,9 86,9 80,61501 - 1600 1,4 0,0 0,0 0,0 0,8 0,0 0,0 0,0 0,0 0,0 0,01601 - 1700 0,9 0,3 0,71701 - 1800 0,4 0,0 0,0 0,0 0,5 0,0 0,0 0,0 0,0 0,0 0,01801-1900 0,2 0,0 0,0 0,0 1,0 0,0 0,0 0,0 0,0 0,0 0,01901 - 2000 0,0 0,0 0,0 0,0 1,0 0,0 0,0 0,0 0,0 0,0 0,0More than 2000 KM/DM 1,4 0,0 0,0 0,0 0,8 0,0 0,0 0,0 0,0 0,0 0,0 0,0SUBTOTAL >1500 4,3 0,0 0,3 0,0 4,8 0,0 0,0 0,0 0,0 0,0 0,0 0,0Source: Public opinion polls conducted for EWS by Prism Research
Monthly household income, including all wages and income of all household members, childallowance, pension and all other sources of income (in %)
Table I
1 It is worth noting that the Social Security system in the narrow sense (social welfare and home help allowances, child allowance, and benefit) hasrecently shown some stability, with the caveat that the amounts involved remain very low.
43
Annual Report 2008 - Incom
es and Social Welfare

When we look at low-income households (less than 500 KM) we find that the number at the end ofthe year is not much different from what it was in the beginning. According to our quarterly surveys, thenumber of low-income households was up moderately in November 2008, compared to March that sameyear, in Brčko and the Republika Srpska, but not in the Federation, where it had fallen quite significantly.There were significant fluctuations during the year in both entities, but these were largely linked toseasonal trends affecting household income (income from agriculture, construction, remittances fromabroad, etc.). According to our poll, the number of low-income households in November 2008 was stillhighest in Brčko (80.6%) and lowest in the Federation (40.3%). The percentage of low-income householdsin the Republika Srpska was 49.5%.
If we look at the distribution of income in what we term ethnic majority areas, we find trends for2008 which correspond to those by entity, with a reduction in low-income households between Marchand November 2008 in Croat majority areas (from 25.9% to 21.6%), but a moderate increase in the othertwo ethnic majority areas, from 48.3% to 49.5% in Serb majority areas and from 41.3% to 45.1% inBosniak majority ones. These trends are not present for the minority samples in these areas. In fact, thepercentage of minority sample low-income households rose steeply in both Bosniak majority areas (from56.2% to 77.8%) and Croat majority areas (from 22.1% to 45.6%), but fell in Serb majority areas (from67.3% to 66.8%). For more see Table II.
To finish, we will review the distribution of income for certain other categories of the population (seeTable III in annex). According to our survey, there was a reduction between the end of 2007 and the endof 2008 in the number of low-income households in both urban and rural areas (from 42.9% to 37.5% andfrom 54.9% to 50.3%, respectively). This downward trend is also present if we disaggregate data on thebasis of gender. The number of low income households is unchanged for the 18-35 age group, where itwas in any case lowest (29.5% in late 2008). It is down for both the other age groups. (See Table III inannex).
2. Public expectations subject to various influences during 2008Comparing the first and last surveys regarding household economic circumstances during the past
year, we find a reduction in the percentage who felt the situation had improved, with essentially nochange in the percentage who said it had deteriorated. The percentage who described the situation ashaving improved was down from 13.48% to 10.76%, while the percentage for whom it has deteriorateddid not change (see Table IV).
Income in KM Minority sample in BMA Minority sample in CMA Minority sample in SMAQuarter March 08. June 08. Sept 08. Nov 08. March 08. June 08. Sept 08. Nov 08. March 08. June 08. Sept 08. Nov 08.No income 2,7 0,7 0,5 2,1 4,3 0,8< 100 1,6 3,9 1,3 2,6 3,9 2,1 0,1 1,5 5,2 7,6 5,6 4,5101 - 200 8,3 1,3 2,0 1,2 6,0 0,7 2,8 1,6 9,8 5,6 6,7 3,1201 - 300 9,6 19,0 17,2 11,4 5,6 8,6 8,8 5,0 9,3 12,6 15,4 16,0301 - 400 9,2 17,3 18,8 16,1 6,0 5,8 5,1 7,6 9,9 9,8 17,7 14,4401 - 500 9,8 14,0 12,2 13,8 4,0 5,2 10,1 5,8 9,9 11,4 13,2 11,4Subtotal to 500 41,3 55,5 52,3 45,1 25,9 22,4 29,1 21,6 48,3 47,0 59,4 49,5
Income in KM Minority sample in BMA Minority sample in CMA Minority sample in SMAQuarter March 08. June 08. Sept 08. Nov 08. March 08. June 08. Sept 08. Nov 08. March 08. June 08. Sept 08. Nov 08.No income 3,7 2,0 0,5 1,0 10,1 0,9< 100 6,9 1,4 2,0 4,3 0,9 1,8 2,6 9,6 9,0 5,2 4,6101 - 200 17,6 0,6 2,0 6,2 5,0 1,8 1,9 2,5 7,7 11,1 11,8 3,8201 - 300 6,8 21,3 15,4 29,8 4,2 22,5 11,4 15,4 23,2 27,3 25,9 21,6301 - 400 9,7 24,5 24,5 17,5 5,6 27,2 10,8 9,4 8,2 8,7 16,8 25,9401 - 500 11,4 9,0 10,6 20,0 6,0 10,3 14,4 15,7 8,5 4,6 9,5 10,9Subtotal to 500 56,2 56,9 56,5 77,8 22,1 63,5 39,3 45,6 67,3 60,7 70,1 66,8Source: Public opinion polls conducted for EWS by Prism Research
Monthly household income, including all wages and income of all household members, childallowance, pension and all other sources of income (in %)
Table II
44
Ann
ual R
epor
t 200
8 - I
ncom
es a
nd S
ocia
l Wel
fare

There were a number of significant events during the year which affected public expectations. At thebeginning of the year, prices rose, largely due to global pressures on international fuel and food markets.In the middle of the year, it was the campaign for the local elections held in October, while at the end ofthe year there was the global financial crisis and its expected impact on the real economy and financialsystem of the country. Given this, we need not be surprised that there was a pattern of deteriorating andimproving expectations, but in our report we will focus on a comparison of expectations in late 2008 withthose for late 2007.
The percentage of the sample who expect the economic situation to deteriorate over the coming yearwas down in late 2008 on late 2007, from 70.8% to 39.7% in Bosniak majority areas and from 46.1% to20.1% in Croat majority areas, while essentially unchanged in Serb majority areas (29.6% as against27.3%).2 At the same time, the percentage who expect the economic situation to improve was up inBosniak majority areas (from 7% to 17.2%) as well as in Croat majority areas (from 6.6% to 23.2%), butdown in Serb majority areas (from 22% to 19.1%). For further detail see Table V in annex. Theseexpectations related to the general economic situation, as certain indicators (industrial production,employment growth, etc) suggest more growth in the Federation than in the Republika Srpska.
The sample's expectations regarding privatisation and its impact on household finances can be seenfrom Table VI. If we compare our survey data for November 2008 and November 2007, we see that therehas been an increase in pessimism, as more people think that continued privatisation will have a negativeimpact on their household finances. This increase is evident in both entities, while there has been areduction in the level of pessimism in Brčko District. In November 2008, 66.4% of the federal sample,53.5% of the RS sample, and 33.6% of the Brčko District sample took a pessimistic view of the potentialimpact of further privatisation. These levels reflect the poor results of privatisation during 2008, as manyplanned privatisation initiatives failed to be realised in both entities, while the privatisation process isbeing brought to a close in Brčko District. Finally, it is worth mentioning that the percentage who thinkthat continued privatisation will have a positive impact on their household circumstances was down in theFederation and the Republika Srpska, but up in Brčko District.
After a particularly tumultuous period in late 2007 and early 2008, when the prices of goods andservices rose as a consequence of external shocks and global price increases for food and fuel, the
BiH FBiH RS Brčko District BMA CMA SMASurvey March 08. Nov 08. March 08. Nov 08. March 08. Nov 08. March 08. Nov 08. March 08. Nov 08. March 08. Nov 08. March 08. Nov 08.TOTAL BETTER 13,48 10,76 12,15 10,24 15,64 9,39 9,71 43,77 10,33 8,7 18,6 16,3 15,6 9,4STAY THE SAME 51,46 53,78 49,24 51,95 54,83 58,24 49,86 28,00 47,30 49,7 56,1 60,8 54,8 58,2TOTAL WORSE 34,32 34,46 37,51 36,73 29,30 31,63 40,43 25,41 41,45 40,5 23,6 22,0 29,3 31,6DK/NA 0,74 0,99 1,10 1,09 0,23 0,74 2,82 0,92 1,1 1,8 0,9 0,2 0,7Total 100,00 100,00 100,00 100,00 100,00 100,00 100,00 100,00 100,00 100,0 100,0 100,0 100,0 100,Source: Public opinion polls conducted for EWS by Prism Research
Over past year, household economic status has (in %)? Table IV
FBiH RS Brčko District Bosniak Majority areas Croat Majority areas Serb Majority areasQuarter Nov 07. Nov 08. Nov 07. Nov 08. Nov 07. Nov 08. Nov 07. Nov 08. Nov 07. Nov 08. Nov 07. Nov 08.TOTAL NEGATIVE 57,5 66,4 52,0 53,5 80,8 33,6 57,1 68,8 59,0 56,9 52,0 53,5TOTAL POSITIVE 16,3 10,1 16,6 11,3 40,1 16,6 7,9 15,1 18,9 16,6 11,3DK/NA 26,2 23,5 31,4 35,2 19,2 26,3 26,2 23,3 25,9 24,3 31,4 35,2Total 100,0 100,0 100,0 100,0 100,0 100,0 100,0 100,0 100,0 100,0 100,0 100,0Source: Public opinion polls conducted for EWS by Prism Research
Expect further privatization to affect their household's economic status….Table VI
2 Our survey findings as to the percentage who expect the situation to deteriorate in 2009 are in line with the Gallup Voice of the People polls, whichplaces Bosnia and Herzegovina around the middle of the scale by number of pessimists - www.voice-of-the-people.net
45
Annual Report 2008 - Incom
es and Social Welfare

remainder of 2008 may be characterised as a period of relative calm, if not one in which concerns overfuture price rises were entirely absent (see table VIII). There was a reduction in the percentage of thesample who expect prices to rise over the coming six months in both the Federation and the RS (downfrom 89.51% to 78.08% and from 83.87% to 74.92% respectively) as well as in Brčko District (from 100%to 0.43%), between November 2007 and November 2008. It is worth mentioning, however, that thepercentage of pessimists, which is to say the percentage of the sample who expect prices to rise, has beenfalling steadily through the year, as a consequence of lower oil prices, as well as of certain measures takenby the government to control profit margins.
The current economic situation and uncertainty regarding the global economic crisis have failed tohave a significant impact on the percentages who expect their household cash income to change. Thus,comparing November 2007 to November 2008, we find a reduction in the percentage who expect theircash income to fall in both the Federation (from 19.01% to 14.22%) and the Republika Srpska (from14.42% to 8.89%). At the same time, the percentage of the sample who expect household cash income toincrease went up in both entities, from 16.22% to 18.35% in the Federation and from 20.51% to 25.64%in the Republika Srpska. It should be noted that these trends do not hold when looking at the percentageof people in Croat majority areas who expect household income to reduce or those who expecthousehold income to increase in Bosniak majority areas (for more see Table VII in annex).
One of the key indicators regarding concern for the future is the public's expectations regarding theirability to save over the coming year. Looking at our survey data for the fourth quarter of 2008, incomparison to the fourth quarter of 2007, we find that the percentage who expect to be able to savereduced in both entities as well as in Brčko district - from 11.93% to 6.33% in the Federation, from 12.75%to 7.5% in the Republika Srpska, and from 3.95% to 0.43% in Brčko district (see Table IX in annex). Anyreduction in ability to save or in the quantity of savings, under conditions of a global credit crunch, willlead to a significant reduction in consumption. Around 50% of all lending in Bosnia and Herzegovina is forconsumer loans, so that any shortfall in domestic sources of financing, if accompanied by a reduced flowof foreign loans, increases the likelihood of recession and crisis within the country.
That the public are aware of the possibility that the economic crisis will shift from the financial sectorto the real economy is clear from our survey findings regarding the likelihood of losing one’s job over thecoming three months (see Table X below). In November 2008, the number of people who thought theymight lose their jobs over the coming three months was approximately 20% of the total number of theemployed, which is to say 15.41% in the Federation and as many as 22.28% in the Republika Srpska. Thisdata on job security is in line with the findings of economic analysts at the end of the year. Thus,published estimates suggest that the recession facing Bosnia and Herzegovina may lead to between 2000
FBiH RS Brčko DistrictNov 07. March 08. June 08. Sept 08. Nov 08. Nov 07. March 08. June 08. Sept 08. Nov 08. Nov 07. March 08. June 08. Sept 08. Nov 08.
TOTAL FALL 6,48 3,93 2,40 6,24 7,40 7,48 4,02 2,46 13,44 8,88 38,53 4,18 38,41 35,56TOTAL RISE 89,51 87,05 76,32 74,28 78,08 83,87 80,62 89,28 71,59 74,92 100,00 53,42 59,62 10,76 0,43No change 2,08 5,13 15,01 13,70 9,31 6,62 11,97 5,30 10,56 11,67 8,05 33,33 46,01 61,96DK/NA 1,93 3,89 6,27 5,78 5,22 2,03 3,39 2,96 4,41 4,53 2,87 4,83 2,05TotaL 100,0 100,0 100,0 100,0 100,0 100,0 100,0 100,0 100,0 100,0 100,0 100,0 100,0 100,0 100,0Source: Public opinion polls conducted for EWS by Prism Research
Will prices rise or fall over next six months (%)Table VIII
FBiH RS Brčko District 18-35 36-50 51+Nov 07. Nov 08. Nov 07. Nov 08. Nov 07. Nov 08. Nov 07. Nov 08. Nov 07. Nov 08. Nov 07. Nov 08.17,63 15,41 16,91 22,28 67,27 17,74 22,62 17,78 14,46 17,88 12,63
Source: Public opinion poll conducted for EWS by Prism Research
Think they might lose their job during next three months (%)Table X
46
Ann
ual R
epor
t 200
8 - I
ncom
es a
nd S
ocia
l Wel
fare

and 2500 people losing their jobs in the metalworking and construction sectors. It is interesting to notethat there could be as many as 700 to 1000 redundancies in the banking sector.
That the situation at the end of 2008 is, nevertheless, better in certain respects than the situation inlate 2007 is indicated by our sample’s willingness to emigrate. According to our November 2008 surveyresults, 40.36% of the overall sample said they would leave the country if they could. This compares to45.58% of the sample in November 2007. The 18 to 35 age group are still the most ready to emigrate,with nearly 2/3 expressing a desire to do so.
At the end of this section we will now look at the percentage willing to support the holding of publicprotests, strikes, and demonstrations related to particular issues (job loss, low salaries, civil rights, etc). Ifwe look at our survey results from November 2008, in comparison to those for November 2008, we find areduction in the Republika Srpska and Brčko district, but an increase in the Federation (see Table XI in annex).
Reviewing the results for November 2008, we find the following:
• Residents of the Federation remain more likely to support the idea of protests, strikes, anddemonstrations than residents of the RS or Brčko district.
• Rural inhabitants are more likely to support organised forms of expression of dissatisfactionregarding particular social issues than urban dwellers.
• The 18 to 35 age group are most likely to support protests, unlike earlier quarters, when it was the36 to 50 age group.
• The population of the Federation is most likely to support protest with regard to job loss (61.3%),lower salaries and pensions (60.8%), and inability to find employment (58.2%).
• Residents of the Republika Srpska are most likely to support holding protests and demonstrationswith regard to the recovery of property (41.9%), the behaviour of the international community(39.9%), and perceived threats to ethnic or civil rights (39.0%).
• In Brčko district, the sample is most likely to support protests over low salaries and pensions(38.8%) and job loss (33.7%).
3. Purchasing power and living standards unchanged through2008
A look at the data from the entity statistics agencies on average salaries and the consumer price indexlead one to conclude that the rise in salaries during 2008 was matched by rising living costs (see TableXIII). While at the beginning of the year there was a record increase of nearly 20% in the average salaryin the Republika Srpska, there were no further significant increases during the year itself. Average salariesin October 2008 were 780.00 KM in the Republika Srpska and 780.51 KM in the Federation. Compared toDecember 2007, this represents a nominal increase of 24.68% in the Republika Srpska and of 12.02% inthe Federation.
Percentages of sample who support protests regarding (November '08)Graph 1
47
Annual Report 2008 - Incom
es and Social Welfare

In the Republika Srpska, salaries rose most for employees in health care, education, the generationof electricity, and mining. In the Federation, they rose most in agriculture, mining, healthcare, and publicadministration (Table XIII b). Some areas of employment, including transport and warehousing, realestate, and financial mediation in the Republika Srpska, actually saw salaries go down if one comparessalaries from October 2008 with those for December 2007.
During 2008, the average, minimum, and maximum pensions in both entities were increased.According to the entity pension and disability insurance funds, the average pension for November 2008was 368.42 KM in the Federation and 319.41 KM in the Republika Srpska. This represents an increase of11.72% in the Federation and 19.7% in the Republika Srpska, compared to January 2008. Over the sameperiod, the minimum pension increased 6.67% in the RS and 5.1% in the Federation. As for themaximum pension, it increased 10.5% in the Federation and 22.66% in the Republika Srpska (seefollowing table).
The entity statistics agency data indicates that the consumer price index was lower at the end of 2008than at the beginning of the year, when it had undergone significant growth (see Table XIV). If wecompare the data from November 2008 with the data for December 2007, we find that the consumerprice index was up 4.2% in the Republika Srpska and 4.71% in the Federation (Table III).
RSMonth 12/07 01/08 02/08 03/08 04/08 05/08 06/08 07/08 08/08 09/08 10/08 11/08 12/08 Change 10/08 - 12/07Average salary 628,00 584,00 724,00 731,00 751,00 758,00 768,00 765,00 762,00 783,00 783,00 790,00 - 124,68Consumer price index 100,80 101,50 100,30 100,90 99,30 100,80 100,90 100,00 100,20 100,00 100,70 99,40 99,40 104,2*FBiHMonth 12/07 01/08 02/08 03/08 04/08 05/08 06/08 07/08 08/07 09/08 10/08 11/08 12/08 Change 10/08 - 12/07Average salary 696,74 709,84 713,20 723,66 735,11 751,82 740,60 763,51 759,11 773,44 780,51 - - 112,02Consumer price index - 101,26 100,42 100,91 99,74 100,91 100,95 100,11 99,60 100,14 100,76 99,37 - 104,71*Source: Entity Statistics Offices
Trends for average salaries and the Consumer Price Index for the RS and the FBiH (December 07. -November 08.)
Table XIII
RS FBiHDecember 2007. October 2008 Salary Growth (Oct. 08/ Dec. 07) December 2007. October 2008 Salary Growth (Oct. 08/ Dec. 07)
Agriculture 537,00 659,00 22,72% 607,03 727,30 19,81%Fisheries 555,00 683,00 23,06% 423,56 483,66 14,19%Ore extraction and quarries 672,00 903,00 34,38% 645,98 751,05 16,27%Manufacturing 446,00 510,00 14,35% 507,04 562,18 10,87%Electricity, gas, and water generation and supply 697,00 871,00 24,96% 1082,41 1235,22 14,12%Construction 533,00 567,00 6,38% 450,95 516,36 14,50%The retail, wholesale, and repair or cars, bicycles, and articles for personal and household use 442,00 536,00 21,27% 482,09 522,85 8,45%Hotels and restaurants 400,00 450,00 12,50% 460,88 517,32 12,25%Transport and warehousing 763,00 752,00 -1,44% 871,36 977,26 12,15%Financial mediation 1269,00 1204,00 -5,12% 1254,25 1257,11 0,23%Property and renting 688,00 676,00 -1,74% 693,70 757,62 9,21%Government administration, defence, and social security 910,00 1059,00 16,37% 951,99 1099,49 15,49%Education 552,00 890,00 61,23% 740,23 820,20 10,80%Healthcare and social welfare 664,00 1143,00 72,14% 827,28 971,48 17,43%Other communal, public, or private services 530,00 620,00 16,98% 702,45 744,77 6,02%Total - average 628,00 783,00 24,68% 696,74 780,51 12,02%Source: Entity Statistics Offices
Data on average salaries by sector, in the RS and the FBiH Table XIIIb
48
Ann
ual R
epor
t 200
8 - I
ncom
es a
nd S
ocia
l Wel
fare

The data in the above table indicate significant stability in the prices of food and fuels, as well as intheir overall impact on other goods and services. Consequently, given that food and fuel were the mainengines of growth for the consumer price index at the beginning of the year, as they fell towards the endof 2008 so did the overall consumer price index in both entities. One should stress in this regard the roleof state, entity, and cantonal government in making use of appropriate instruments at their disposal(commodity reserves, market inspectors to prevent price gouging, and other similar mechanisms) with aview to maintaining price stability, particularly as we approach the expected crisis.
Comparing our survey results forNovember 2008 with those for November2007 makes clear that food (including coffeeand beverages) and debt repayments nowaccount for a larger percentage ofhousehold spending in the Federation, whilefood and fuel and car maintenance require agreater share of resources in the RepublikaSrpska than previously (see Table XV inannex). It is concerning that the percentageof household spending accounted for byfood has increased in both the Federationand the Republika Srpska, reducing theamount of disposable income for otherspending. It is also concerning that there isan increase in spending on repayments,which is at least in part due to the increase
FBiH RSJanuary 08. May 08. August 08. November 08. January 08. May 08. August 08. November 08.
Lowest pension 281,98 289,17 296,36 296,36 150,00 150,00 150,00 160,00Highest pension 1263,94 1393,48 1393,48 1393,48 1148,60 1329,00 1329,00 1408,88Average pension 329,76 340,04 347,50 368,42 266,84 300,60 300,95 319,41Source: Public opinion polls conducted for EWS by Prism Research
Data on pensions, RS and FBiHTable XIIIa
RS FBiHI 2008 / I 2008 / I 2008 / I 2008 / XI 2008 / XI 2008 / XI 2008 / XI 2008 / XII 2007 I 2007 XII 2007 I 2007 X 2008 XI 2007 X 2008 XI 2007
Total 101,5 105,8 101,26 106,35 99,40 105,10 99,37 105,95Food and non-alcoholic beverages 102,2 110,4 101,97 111,96 99,80 107,30 99,63 109,38Alcohol and tobacco 100 100,2 99,97 100,79 100,00 101,70 100,09 101,40Clothes and shoes 99,9 97,8 99,99 97,31 100,00 98,10 99,64 96,47Accommodation, water and other utilities 102,2 103,9 102,52 105,33 100,30 107,70 101,69 112,14Furniture, furnishings, and regular maintainance 100,2 101,4 100,24 101,39 100,10 102,80 100,24 103,33Healthcare 100 101,9 99,88 99,8 100,10 100,80 100,07 99,45Transport 102 111 100,59 108,03 94,70 104,30 94,34 101,72Communications 103,8 105,5 103,44 103,14 102,80 106,60 99,97 104,80Recreation and culture 100,4 99,9 100,72 103,15 100,00 104,90 99,95 106,47Education 100,7 104,5 100 104,38 100,00 101,10 100,60 97,96Restaurants and hotels 100,6 101,7 100,49 108,38 100,20 105,60 101,04 107,75Other goods and services 100,6 101,6 100,52 101,15 100,00 103,60 100,02 104,38Source: Entity Statistics Offices
Consumer price index (CPI) itemized (January 2007 - November 2008)Table XIV
Graph 3 Purchasing power in Southeastern Europe in2007 and 2008 (in EUR)
49
Annual Report 2008 - Incom
es and Social Welfare

in bank rates over the past few months, which have increased the level of payments required to serviceexisting and new loans.
That Bosnia is at the bottom of the scale in Europe when it comes to purchasing power has beenconfirmed by the GFK marketing agencies study of purchasing power across Europe. According to theirdata, the public in Bosnia and Herzegovina has on average €2325 at their disposal, putting them 36th outof 41 countries in Europe. The situation in 2008 was a little better than in 2007, but only when one looksat the nominal amount and not the country’s ranking (see Table XV a in annex and the following graph).
Modern living standards are also reflected in the possession of basic consumer durable goods, liketelephones, mobile phones, computers (with access to the Internet), and cars. That there has been littlesignificant change in this regard is clear from Table XVI, below. According to our sample, more than halfof households in the Republika Srpska and Federation possessed a car in November 2008. Similarly, thedata show that 83.22% of households in the Federation and 71.41% of households in the Republika Srpskahave a telephone, but considerably fewer have access to the Internet (20.78% in the Federation and14.22% in the Republika Srpska). According to our survey, approximately 3/4 of people above the age of18 in the Federation and approximately 2/3 in the Republika Srpska possess a mobile phone.
4. Social protection and minimum living standards largelyunchanged
The social protection system in both entities is in serious difficulties. It is facing a major increase indemand for the various forms of social welfare, which are still under development, as well as beingburdened by inappropriate or inadequate legal arrangements which enjoin a broader range of socialprotection than budgetary capacity allows. Better socio-economic conditions in the country during 2008,evident largely in fewer people describing their household standard of living as below average, arecertainly a positive development. As a result, in November 2008, 38.7% of the federal sample, 49.9% ofthe Republika Srpska sample, and 67.4% of the Brčko district sample described themselves as belowaverage in terms of household economic status (see Table XVII). This situation represents animprovement on the end of 2007 in both the Federation and Brčko district, but no change in the RepublikaSrpska. Economic self-assessment is strongly linked to income levels and distribution by household, butalso to the presence or absence of mechanisms for ensuring a minimum standard of living (price controls,social welfare programs, etc).
FBiH RSNov 05. Dec 06. Nov 07. Nov 08. Nov 05. Dec 06. Nov 07. Nov 08.
Telephones 86,68 79,46 81,47 83,22 73,09 75,80 63,85 71,41Mobile phones 43,20 56,83 63,65 74,27 48,33 58,42 64,85 65,23Dial up internet access 7,96 11,57 15,28 20,78 8,59 12,37 8,67 14,22Car n/p 47,26 50,86 53,08 n/p 51,49 48,72 54,59Source: Public opinion polls conducted for EWS by Prism Research
Households with durable consumer goods (in %)Table VI
BiH FBiH RS Brčko District Urban Rural BMA CMA SMANov 07. Nov 08. Nov 07. Nov 08. Nov 07. Nov 08. Nov 07. Nov 08. Nov 07. Nov 08. Nov 07. Nov 08.Nov 07. Nov 08. Nov 07. Nov 08. Nov 07. Nov 08.
Barely surviving 13,2 8,1 11,0 5,1 14,6 11,5 48,9 25,7 8,5 5,9 16,7 9,7 11,0 5,1 10,8 5,1 14,6 11,5Well below average 14,6 11,4 14,6 9,2 14,6 14,3 15,9 17,3 13,8 10,9 15,2 11,8 14,0 9,4 16,4 8,6 14,6 14,3Below average 20,4 24,3 20,6 24,4 20,3 24,1 18,7 24,4 19,8 23,3 20,9 25,0 21,1 26,3 18,8 17,0 20,3 24,1TOTAL below average 48,3 43,8 46,2 38,7 49,5 49,9 83,4 67,4 42,2 40,0 52,8 46,6 46,2 40,7 46,0 30,7 49,5 49,9Source: Public opinion polls conducted for EWS by Prism Research
Self-description of household economic status(%) Table XVII
50
Ann
ual R
epor
t 200
8 - I
ncom
es a
nd S
ocia
l Wel
fare

During 2008, the following trends were characteristic for the social protection system and theprovision of a minimum standard of living:
• Rising prices at the beginning of the year affected the most vulnerable, particularly rises in the priceof food, fuel, and community services or utilities. Action was taken to preserve a minimumstandard of living, like the allocation of 28 million KM by the RS government for the worst-off or theintroduction of cash payments for unemployed demobilised soldiers in the Federation, but withconsiderable delay, so that their impact has been questionable. Introducing payments fordemobilised soldiers in the Federation has in fact endangered the federal budget itself and therehas been considerable talk about possible bankruptcy. The second half of the year brought with ita certain dose of relief, as food and fuel prices fell on world markets, while the entity governmentstook action to prevent price gouging with regard to certain goods and services.
• Early in the year, the minimum pension was increased in both entities, as was the coefficient usedto calculate the pension in the first place. This produced a shortfall in the funds required forpayment throughout 2008. The Republika Srpska pension and invalidity insurance fund was alreadylooking for additional resources in February to pay pensions, while the federal fund was in constantfear of the consequences of a European Court of Justice ruling in favour of Duško Karanović and thepossibility that it might have to make supplementary payments to a large number of beneficiaries.Although the RS pension fund’s action against the federal fund, intended to force it to take over38,000 beneficiaries and pay out around 118 million KM in supplementary payments, was in theend thrown out by the Mostar court, the case introduced a high degree of uncertainty into thefederal fund’s expenditure planning. Serious indicators of the need for reform of the pension andinvalidity insurance system were presented at the World Bank conference launching a specialreport on the impact of aging in countries in transition.3 According to their indicators and analyses,Bosnia and Herzegovina belongs amongst the "ageing countries which have taken up reform toolate" and which face particular risks associated with aging-- not merely because of demographicchanges but also because the reforms required have not been brought far enough to assist inameliorating the consequences of ageing. The authors predict that by 2025 the over 65s willaccount for somewhat more than 20% of the population, while the overall population will fall byapproximately 3%. In their view, the practical implications of an ageing population and securingadequate living conditions for the elderly are such that serious attention must be paid to sectoralpolicy regarding the labour market (in particular greater inclusion), productivity improvements, andreforms of the pension and education systems, as well as migration management. It is clear fromthe numbers of the employed, unemployed, and pensioners at the end of 2007 and the end of 2008in Table XVIII that the authorities in Bosnia and Herzegovina have not taken any radical steps.
3 Chawla, Betherman, Banerji, et al., From Red to Grey – the “Third Transition” of Aging Populations in Eastern Europe and the former Soviet Union,World Bank, Washington, 2008
Self-description of household economic status (%) Graph 4
51
Annual Report 2008 - Incom
es and Social Welfare

• While public spending in Bosnia and Herzegovina continues to be at an exceptionally high level(approximately 45% of GDP), spending on social protection and welfare remains at approximately15% of GDP, which is to say less than the European average. It is worth noting that both state leveland entity bodies have little difficulty in rejecting allocation for social protection and ensuring aminimum standard of living, due to the size of public administration and salaries in the publicsector, even though a number of public works or investments could reasonably be handed over tothe private sector, leaving more room for allocation for social welfare.
• During 2008, steps were taken towards the creation of a national social inclusion strategy, but thereis still no clear indication as to when the strategy itself will be completed and adopted. The socialinclusion strategy is important because it focuses on the more than 50% of the population in Bosniaand Herzegovina which may be considered excluded and is intended to provide a systematicapproach to development in all those areas which lead to such a situation (education, health care,the labour market, employment, the social welfare system, and social services).
• The latter part of the year was marked by the announcement of a major economic crisis, followedby the collapse of the world financial system in early October 2008. Given that the effects will befelt on the Bosnian and Herzegovinian economy, a major task facing the authorities will be toensure minimum standards of living and adequate social protection for all those who will need it.The pension system in Bosnia and Herzegovina, like the health care system, is entirely dependentupon the contributions levied from employee salaries. So long as the economic impact of the crisisresults in declining economic activity, with a concomitant reduction in employment and salaries, itis to be expected that there will be serious problems in the health care and pension and invalidityinsurance sectors, particularly given that the number of beneficiaries will not fall in the foreseeablefuture. That the authorities are also concerned about the income of the healthcare and pensioninsurance funds is clear from recent moves by the Republika Srpska government, e.g. to includerepresentatives of the unions and employers in "social dialogue" at the end of the year with a viewto raising the minimum salary used in calculating tax and contributions from 250 KM to 320 KM.
• A number of steps taken by the government during 2008 indicate that more attention is still neededto systematic solutions for ensuring a minimum standard of living and adequate social welfare andprotection. The RS government introduced regulations at the end of the year to increase theallocation for social welfare, but the burden will be borne by the municipalities, so that we will nodoubt soon see problems in a number of smaller municipalities whose budgets are barely enoughto finance current spending (salaries and material expenses). The RS government will contributeonly 5% of the 70 million marks required to finance social welfare at the local level. Representativesof the international institutions, like the World Bank, are fully aware of this problem and areworking with the authorities in the country to develop systematic solutions for more effective waysof targeting social benefits. There is considerable concern that the global financial crisis will haveits greatest impact on the poor,4 particularly in those countries which lack an efficient system oftargeting social benefits and where the government authorities have considerable discretion indetermining the allocation of resources.
4 Statement by Kathy Lindert, World Bank Social Protection Portfolio Manager.
52
Ann
ual R
epor
t 200
8 - I
ncom
es a
nd S
ocia
l Wel
fare

VI SOCIAL INCLUSION1. Some aspects of social inclusion
2. Minority and majority samples share same views on the economy
3. Pessimism over the political situation
4. Ethnic identity and citizenship in conflict for most
1. Some aspects of social inclusionA review of the social inclusion sections in the quarterly reports for 2008 reveals that the main
aspects of social exclusion covered related to the economic situation and household finances, as well asthe attitudes of the various ethnic groups. We have attempted to expand the analysis of certain of theseaspects by looking at categories of the population that may be considered excluded on the grounds ofstatus, place of residence, gender, or ethnicity.1 As the situation did not change significantly over the year,we will focus in this annual report on attitudinal changes for the various socially excluded categories ofthe population between the end of 2007 and the end of 2008.
Ethnic divisions remain one of the most important factors determining social exclusion in Bosnia andHerzegovina and we will now look at three ways this is the case: First, as a direct cause of the exclusionof minority groups, i.e. those who do not belong to the majority ethnicity in the area; second, as a weakinstitutional capacity to prevent exclusion; and third, its negative and far-reaching impact on socialprocesses. Ethnic divisions prevent progressive changes and exacerbate alienation amongst the generalpublic. The effects of ethnic division are most clearly to be seen in the process of return, as ethnicminority groups remain one of the most easily recognizable socially excluded groups, largely due to verypoorly integrated processes of return to pre-war places of residence. This is not reflected only in limitedpolitical participation and access to services, but also in alienation from ordinary social processes in theareas where they live.2 While the other main excluded groups face similar forms of marginalisation, theirexclusion is not a direct result of the political divisions in Bosnian society. The Roma are one particularlyvulnerable group, as are persons with disabilities, the elderly, people living in rural areas, and the young.
When we look at our sample’s assessment of current economic conditions by ethnic majority area, interms of what both the ethnic majority and the ethnic minority samples in those areas thought inNovember 2007 and November 2008, we find a reduction in the numbers who would describe currentconditions as bad in both sets of samples. In November 2008, current economic conditions were
1 According to data available in the reports of the economic planning directorate of the Council of Ministers of Bosnia and Herzegovina, the NationalSocial Inclusion Strategy will focus on young people, the elderly, individuals with disabilities, the Roma, and the rural population, while also payingattention to gender and ethnic aspects.
2 The National Human Development Report for 2007, Social Inclusion in Bosnia and Herzegovina, UNDP, Sarajevo, 2007.
ANNUALREPORT2008
53
Annual Report 2008 - Political Stability in BiH
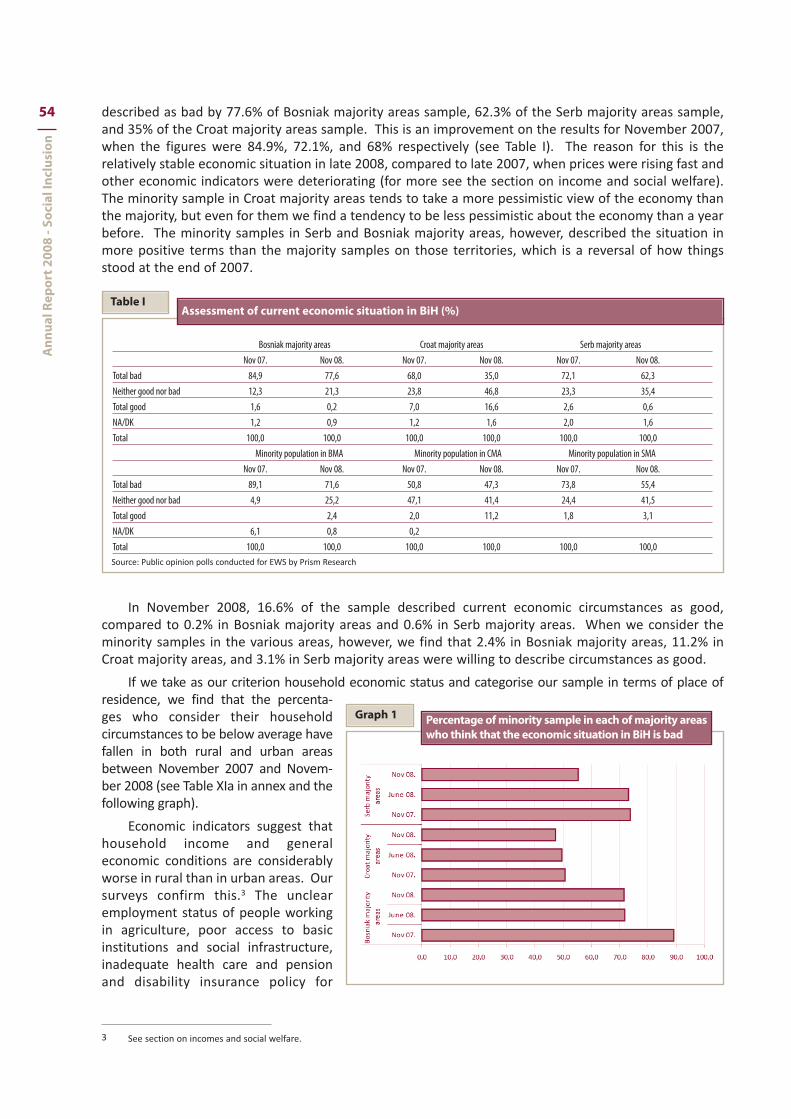
described as bad by 77.6% of Bosniak majority areas sample, 62.3% of the Serb majority areas sample,and 35% of the Croat majority areas sample. This is an improvement on the results for November 2007,when the figures were 84.9%, 72.1%, and 68% respectively (see Table I). The reason for this is therelatively stable economic situation in late 2008, compared to late 2007, when prices were rising fast andother economic indicators were deteriorating (for more see the section on income and social welfare).The minority sample in Croat majority areas tends to take a more pessimistic view of the economy thanthe majority, but even for them we find a tendency to be less pessimistic about the economy than a yearbefore. The minority samples in Serb and Bosniak majority areas, however, described the situation inmore positive terms than the majority samples on those territories, which is a reversal of how thingsstood at the end of 2007.
In November 2008, 16.6% of the sample described current economic circumstances as good,compared to 0.2% in Bosniak majority areas and 0.6% in Serb majority areas. When we consider theminority samples in the various areas, however, we find that 2.4% in Bosniak majority areas, 11.2% inCroat majority areas, and 3.1% in Serb majority areas were willing to describe circumstances as good.
If we take as our criterion household economic status and categorise our sample in terms of place ofresidence, we find that the percenta-ges who consider their householdcircumstances to be below average havefallen in both rural and urban areasbetween November 2007 and Novem -ber 2008 (see Table XIa in annex and thefollowing graph).
Economic indicators suggest thathousehold income and generaleconomic conditions are considerablyworse in rural than in urban areas. Oursurveys confirm this.3 The unclearemployment status of people workingin agriculture, poor access to basicinstitutions and social infrastructure,inadequate health care and pensionand disability insurance policy for
3 See section on incomes and social welfare.
Bosniak majority areas Croat majority areas Serb majority areasNov 07. Nov 08. Nov 07. Nov 08. Nov 07. Nov 08.
Total bad 84,9 77,6 68,0 35,0 72,1 62,3Neither good nor bad 12,3 21,3 23,8 46,8 23,3 35,4Total good 1,6 0,2 7,0 16,6 2,6 0,6NA/DK 1,2 0,9 1,2 1,6 2,0 1,6Total 100,0 100,0 100,0 100,0 100,0 100,0
Minority population in BMA Minority population in CMA Minority population in SMANov 07. Nov 08. Nov 07. Nov 08. Nov 07. Nov 08.
Total bad 89,1 71,6 50,8 47,3 73,8 55,4Neither good nor bad 4,9 25,2 47,1 41,4 24,4 41,5Total good 2,4 2,0 11,2 1,8 3,1NA/DK 6,1 0,8 0,2Total 100,0 100,0 100,0 100,0 100,0 100,0Source: Public opinion polls conducted for EWS by Prism Research
Assessment of current economic situation in BiH (%)Table I
Graph 1 Percentage of minority sample in each of majority areaswho think that the economic situation in BiH is bad
54
Ann
ual R
epor
t 200
8 - S
ocia
l Inc
lusi
on

agricultural workers, and low levels of participation in local decision-making related to the developmentof rural areas have all contributed to increasing the incidence of social exclusion in rural areas.4
When we look at the population in terms of age group, we find evidence of a number of differentforms of social exclusion affecting young people, who are the most vulnerable group when it comes toemployment, as is clearly shown by the Labour Force Survey, which indicated that youth unemployment(people from 15 to 25 years of age) was twice as high as the overall rate. This is clearly one of the mainreasons young people (in this case 18 to 35 year olds) are so willing to emigrate (for more see followinggraph). While there has been a reduction between November 2007 and November 2008 in thepercentage of our sample who said they would emigrate, it is worth noting that this reduction is leastamongst the young. The social exclusion of the young is a particular problem in rural areas and smallmunicipalities, which do not have the resources or the institutional support mechanisms to ensure thatyoung people continue their education.
At the same time, our quarterly opinion pollsshow that the over 50s are in a worse position thanthe younger age cohorts when it comes to incomelevels. This group includes a lot of pensioners, aswell as individuals who lost their jobs duringprivatisation and the restructuring of the largeindustrial corporations, along with any hope offinding new employment due to their decliningphysical abilities and their obsolete skill sets. Thelack of social networks for dealing with problems ofsocial exclusion in all areas of life (education, healthcare, employment, and social welfare) ensures thatmany people in the country may be assigned tocategories requiring social inclusion.
The situation is little different when we look atour results in terms of gender. The quarterly reportsindicate that women have a lower self assessment of economic status and report lower monetary income(household) than men do (see income and social welfare section). There is also gender discrimination atwork, as some employers are unwilling to meet their legal obligations regarding maternity leave.
Finally, we must admit that our surveys do not allow us to access the attitudes or opinions of twosocially excluded groups, namely the Roma and persons with disabilities. It is worth noting that theauthorities have recognised the problems faced by these categories of the population and are tacklingthem through the development of a National Disability Policy, passed by the Council of Ministers in June
4 According to the 2007 National Human Development Report, the incidence of extreme social in exclusion is 19% higher in rural areas than in urbanones.
5 Some municipalities do have development strategies based on human rights (the RMET approach).
Self-assessment of household economicstatus(%)
Graph 2
Majority in BMA Majority in CMA Majority in SMANov 07. Nov 08. Nov 07. Nov 08. Nov 07. Nov 08.
Telephone 83,3 85,7 75,1 73,4 63,8 71,4Mobile phone 64,3 74,6 61,2 73,1 64,9 65,2Car 47,9 49,2 61,4 68,2 48,7 54,6
Minority in BMA Minority in CMA Minority in SMANov 07. Nov 08. Nov 07. Nov 08. Nov 07. Nov 08.
Telephone 84,5 80,5 76,5 62,5 63,8 51,2Mobile phone 60,5 47,6 56,3 53,1 64,9 62,2Car 28,3 31,3 54,3 36,9 48,7 24,5Source: Public opinion polls conducted for EWS by Prism Research
Possession of consumer durablesTable IX
55
Annual Report 2008 - Social Inclusion

2008, and a National Strategy for the Inclusion of the Roma, which was passed as long ago as 2005. It isan unfortunate and worrying habit of the authorities in Bosnia and Herzegovina that they adopt suchdocuments (policy, strategy, plans, etc) over easily, without planning or allocating resources for theirimplementation. A glance at the state and entity level budgets for 2009 shows that there has been noincreased allocation for the implementation of these strategic documents. In this context one must alsomake mention of the Social Inclusion strategy Document. Although there has been talk for more than ayear of its preparation, the public is still very poorly informed about it and the time frame within which itis to be adopted. What is known is that the document will serve efforts to remove key causes of exclusionamongst the most vulnerable groups, including the elderly, the young, individuals with disabilities, thedisplaced, and the Roma. Such causes include poverty, unemployment, poor access to health care andeducation, and attention to gender and ethnic issues.
2. Minority and majority samples share same views on theeconomy
When we look at expectations regarding prices, our surveys indicate that in late 2008 a large sectionof the public still expected prices to rise (Table II). If we compare the data from November 2008 with thedata for November 2007, we notice that there has been a reduction, however, in that percentage for boththe majority and minority samples in all three majority areas. As for the percentage who expect prices tofall, comparing the data for late 2008 and late 2007 shows an increase in Croat and Serb majority areas,but a decrease in Bosniak majority areas. One should note that the views of the minority samples in allthree majority areas are in line with those of the majority samples.
In late 2008, some 78.8% of the sample in Bosniak majority areas, 75.4% in Croat majority areas, and74.9% in Serb majority areas said they expected prices to rise. Our surveys continue to suggest that theminority sample in Bosniak majority areas is more pessimistic regarding price rises than the majority --88.4% expect price rises. This compares to 75.4% of the minority sample in Serb majority areas and 65.5%of the minority sample in Croat majority areas.
Our sample’s views on the prospect of household income increasing in future are in line with the resultsalready presented regarding their assessment of current economic conditions. Thus, in November 2008, wefind that the sample in Croat majority areas was most likely to expect positive change (33.3%). Thiscompares to 25.6% in Serb majority areas and 14.6% in Bosniak majority areas. Comparing this data withthe data from November 2007, we find that there has been an increase in Croat majority areas in thepercentage who expect household income to increase, but a reduction in Bosniak majority areas. Similarpatterns are present for the minority samples in the various ethnic majority areas. Comparison of the resultsfor late 2007 and late 2008 related to the percentages who expect household income to fall shows a
Majority in BMA Majority in CMA Majority in SMANov 07. Nov 08. Nov 07. Nov 08. Nov 07. Nov 08.
Fall 6,1 6,0 7,8 13,0 7,5 8,9Rise 90,0 78,8 87,9 75,4 83,9 74,9Stay the same 1,8 10,2 3,1 5,9 6,6 11,7NA/DK 2,1 5,1 1,3 5,7 2,0 4,5Total 100,0 100,0 100,0 100,0 100,0 100,0
Minority in BMA Minority in CMA Minority in SMANov 07. Nov 08. Nov 07. Nov 08. Nov 07. Nov 08.
Fall 3,7 2,0 3,8 22,9 2,5 13,6Rise 92,5 88,4 87,2 65,5 85,7 75,4Stay the same 8,9 5,6 8,5 6,3 5,7NA/DK 3,9 0,8 3,4 3,1 5,5 5,3Total 100,0 100,0 100,0 100,0 100,0 100,0Source: Public opinion polls conducted for EWS by Prism Research
Expect prices over next six months to…. (%)Table II
56
Ann
ual R
epor
t 200
8 - S
ocia
l Inc
lusi
on

moderate increase in Croat majority areas as well as a moderate increase for the minority samples in Bosniakand Serb majority areas (see Table III in annex). It would appear that the impact of the coming crisis has notyet been felt by these groups and they do not expect it to have a significant impact on their income.
When it comes to their expectations regarding ability to save, people in Bosnia and Herzegovina doappear to be more pessimistic in late 2008 than they were in late 2007, which is reasonable given thegeneral assessment of the country's economic prospects. Comparing the attitudes of the various minorityand majority ethnic samples for November 2007 and November 2008, however, we find that the percentageof the minority samples in the various ethnic majority areas who expect to save has increased, as has theCroat majority areas sample percentage. There has, by contrast, been a reduction in the percentage of theoverall samples in Bosniak and Serb majority area who expect to be able to save. In November 2008, it wasmembers of the Croat ethnic group in Croat majority areas who showed the greatest optimism over theirpotential to save (15.1%), while projections were least good in Bosniak majority areas (only 4.1% of themajority sample). The percentage in Serb majority areas was 7.5%.
Finally we must point out that the minority samples in the various majority ethnic areas do actually findthemselves economically worse-off than the majority samples in those areas. This can be seen most easilyfrom reported levels of household income and possession of consumer durables. Thus, if we look at thenumber of low-income households (monthly income of less than 500 KM) through 2008, we find that thepercentage was consistently higher for the minority sample than for the general population in the variousmajority areas (see table XIII). An exception to this rule was the first quarter of 2008 (March 2008) in Croatmajority areas, when there were fewer minority sample than majority sample low income households.
The picture of minority deprivation relative to the majority population is confirmed when we look at thedata on possession of consumer durables. In November 2008, we find that a smaller percentage of theminority sample were in possession of mobile phones, just as they were less likely to have a landlineconnection or a car (see Table IX). The reasons are no doubt to be sought in the difficulties facing returnees
Majority in BMA Majority in CMA Majority in SMANov 07. Nov 08. Nov 07. Nov 08. Nov 07. Nov 08.
Fall 19,8 13,6 16,3 16,6 14,4 8,9Rise 15,1 14,6 20,1 33,3 20,5 25,6Stay the same 56,0 67,7 58,9 43,4 58,7 60,6NA/DK 9,2 4,1 4,7 6,8 6,3 4,9Total 100,0 100,0 100,0 100,0 100,0 100,0
Minority in BMA Minority in CMA Minority in SMANov 07. Nov 08. Nov 07. Nov 08. Nov 07. Nov 08.
Fall 8,1 11,7 12,8 6,2 5,3 10,0Rise 5,3 3,8 25,8 37,4 10,5 19,6Stay the same 72,7 80,0 48,3 55,2 83,3 61,8NA/DK 13,9 4,5 13,1 1,2 0,9 8,7Total 100,0 100,0 100,0 100,0 100,0 100,0Source: Public opinion polls conducted for EWS by Prism Research
Expect household income over next six months to …. (%)Table III
Bosniak majority areas Croat majority areas Serb majority areasNov 07. Nov 08. Nov 07. Nov 08. Nov 07. Nov 08.
Total fall 19,8 13,6 16,3 16,6 14,4 8,9Total increase 15,1 14,6 20,1 33,3 20,5 25,6No change 56,0 67,7 58,9 43,4 58,7 60,6DK/NA 9,2 4,1 4,7 6,8 6,3 4,9Total 100,0 100,0 100,0 100,0 100,0 100,0Source: Public opinion polls conducted for EWS by Prism Research
Expect household income over next six months to …. (%)Table IIIa
57
Annual Report 2008 - Social Inclusion

attempting to reintegrate, the social ostracism they are subjected to by members of the majority population,and the greater difficulties they face finding employment or sources of income.
3. Pessimism over the political situationPolitical events during 2008 significantly affected the sample’s views regarding the direction political life
has taken (see Table Va). In 2008, there was a clear deterioration of political life, following attempts to changethe rulebook of the Bosnian and Herzegovinian Parliamentary Assembly in order to abolish entity-based voting.The situation was made worse by the declaration of independence by Kosovo, which led to organized protestsand demonstrations in the Republika Srpska, as well as a number of calls for a referendum on secession.
These events made a strong impression on public opinion in Bosniak majority areas, where as many as78.8% of the sample said they thought the political situation was set to deteriorate. The minority sample inBosniak majority areas was even more pessimistic, with 88.3% expecting deterioration. During the secondquarter of 2008, the situation calmed down somewhat, particularly following the signing of the SAA with theEuropean Union. This positive trend, however, was not evident in the opinion of the minority samples inCroat and Serb majority areas. There was an increase during the third quarter in the number of pessimistsin both Bosniak and Croat majority areas, as well as amongst the minority samples in Bosniak and Serbmajority areas. The reasons for this no doubt lie with the holding of local elections and the electioncampaign itself, which was considered to be particularly negative. The end of the year (the fourth quarter)again provided reason for concern over the worsening political situation in Bosniak and Serb majority areas,particularly following the signing of the Prud agreement by the leaders of three political parties (the SDA,the SNSD, and the HDZ BiH). While the agreement was welcomed by the international community, it provedrather controversial on the domestic political scene, dividing the parties into those for and those against it.
Majority in BMA Majority in CMA Majority in SMANov 07. Nov 08. Nov 07. Nov 08. Nov 07. Nov 08.
Yes 11,3 4,1 14,0 15,1 12,8 7,5No 83,8 91,5 79,0 75,1 85,1 89,1NA/DK 4,8 4,3 7,1 9,9 2,2 3,4Total 100,0 100,0 100,0 100,0 100,0 100,0
Minority in BMA Minority in CMA Minority in SMANov 07. Nov 08. Nov 07. Nov 08. Nov 07. Nov 08.
Yes 1,7 4,2 3,0 8,5 5,3 8,8No 92,7 92,6 89,4 89,2 92,2 89,2NA/DK 5,6 3,2 7,6 2,3 2,5 2,0Total 100,0 100,0 100,0 100,0 100,0 100,0Source: Public opinion polls conducted for EWS by Prism Research
Expect to save over next half year (%)Table IV
Majority in BMA Majority in CMA Majority in SMANov 07. Nov 08. Nov 07. Nov 08. Nov 07. Nov 08.
Deteriorating 79,4 79,7 80,2 52,9 82,4 50,3Improving 15,1 13,5 11,5 24,7 12,1 34,6NA/DK 5,5 6,8 8,3 22,4 5,5 15,1Total 100,0 100,0 100,0 100,0 100,0 100,0
Minority in BMA Minority in CMA Minority in SMANov 07. Nov 08. Nov 07. Nov 08. Nov 07. Nov 08.
Deteriorating 90,7 82,1 60,3 47,4 82,5 41,2Improving 4,7 14,7 19,1 48,2 9,5 51,7NA/DK 4,6 3,1 20,6 4,4 8,1 7,1Total 100,0 100,0 100,0 100,0 100,0 100,0Source: Public opinion polls conducted for EWS by Prism Research
Think political situation in BiH is…. (%)Table V
58
Ann
ual R
epor
t 200
8 - S
ocia
l Inc
lusi
on

According to the November 2008 survey, 79.7% of the Bosniak majority areas sample, 57.9% of theCroat majority areas sample, and 50.3% of the Serb majority areas sample said they expected political lifeto deteriorate further over the coming months. Moreover, the minority sample in Bosniak majority areaswere the most pessimistic, with the greatest percentage saying they expected political conditions todeteriorate (82.1%), followed by the minority sample in Croat majority areas. Least pessimistic were theminority sample in Serb majority areas (41.2%).
4. Ethnic identity and citizenship in conflict for mostResearch into ethnic identity and citizenship continues to indicate very large differences of opinion and
attitude between different sectors of the public in Bosnia and Herzegovina. Thus, for the past number ofyears, our surveys have found the levels of pride in belonging to a given ethnic group or people to berelatively stable and that the percentage of the three constitutive peoples who express very considerablepride in their ethnic identity has actually increased. For example, comparing the data for 2008 with data for2004, we find that the percentage of the sample who are very proud of their ethnic identity has increasedin all three ethnic groups, with the largest increase in the Serb ethnic group.6 A similar pattern is found if onelooks at the figures for the minority samples of each of the majority areas, and the trend is confirmed if onesimply compares the data from November 2008 with the data for November 2007 (see Table VI).
In late 2008, Bosniaks were the majority sample most likely to express pride in their ethnicity (84.7%).A slightly smaller percentage of Croats (80.7%) and Serbs (79.3%) also expressed strong pride in their
Bosniak majority areas Croat majority areas Serb majority areasMajority sample Minority sample Majority sample Minority sample Majority sample Minority sample
Nov. 79,7 82,1 52,9 47,4 50,3 41,2Sept. 57,2 60,6 61,5 64,5 42,5 43,2Jun. 54,4 55,6 57,5 71,5 42,5 39,2Mar. 78,8 88,3 57,7 65,7 57,3 37,6Source: Public opinion polls conducted for EWS by Prism Research
Expect political situation to deteriorate (%)Table Va
Majority in BMA Majority in CMA Majority in SMANov 07. Nov 08. Nov 07. Nov 08. Nov 07. Nov 08.
Very proud 86,4 84,7 81,4 80,7 82,0 79,3Somewhat 10,4 8,6 13,6 10,2 12,7 13,7Not much 2,1 3,7 2,7 2,3 3,3 2,5Not at all 0,3 0,9 0,5 1,9Not important 1,2 1,1 1,3 6,0 2,0 2,2DK/Can't decide 1,1 0,2NA/DK 0,5 0,1 0,3 0,2Total 100,0 100,0 100,0 100,0 100,0 100,0
Minority in BMA Minority in CMA Minority in SMANov 07. Nov 08. Nov 07. Nov 08. Nov 07. Nov 08.
Very proud 82,8 90,9 72,8 87,9 74,1 87,8Somewhat 8,0 4,9 4,5 3,1 14,6 5,0Not much 1,0 2,7 6,0 1,0Not at all 5,0 0,6Not important 2,0 0,7 13,8 6,0 10,3 6,4DK/Can't decide 0,8 0,5NA/DK 1,3 1,8 2,1 0,9 0,7Total 100,0 100,0 100,0 100,0 100,0 100,0Source: Public opinion polls conducted for EWS by Prism Research
Pride in ethnic identity (%)Table VI
6 For more on this see the EWS quarterly reports from 2004 and 2008 at www.undp.ba
59
Annual Report 2008 - Social Inclusion

ethnicity. When we look at the various ethnic minority samples on the ethnic majority areas, we find aneven higher percentage expressing pride in their ethnic identity: 90.9% of the minority sample on Bosniakmajority areas, 87.9% of the minority sample in Croat majority areas, and 87.8% in Serb majority areas saidthey were very proud of belonging to their ethnic group. This minority sample opinion suggests that arelatively stable security situation (the Security Stability Index was 88 in November 2008) and fairly goodethnic relations (the Ethnic Stability Index was 77) are key factors in the development of ethnic prideamongst the minority samples. The preceding period, during which the local election campaign took place,was not marred by problems of an ethnic nature, even though there was a certain polarisation of majorityopinion on the various majority areas on the basis of particular political programmes.
When we turn to consider the sample’s attitudes to citizenship of Bosnia and Herzegovina during 2008,we continue to find that it is only amongst Bosniaks that there is a good fit between ethnic identity andcitizenship, as both the Croat and Serb samples display rather lower levels of identification with the state(Table VII). Identification with the state based upon citizenship of Bosnia and Herzegovina and identitybased on belonging to an ethnic group are at much the same level for Bosniaks, but not for Serbs and Croatswho clearly feel considerably less pride in their citizenship than in their ethnic identity.
It is therefore worth noting, in comparing the results for late 2008 with those for late 2007, that therehas been an increase in the percentage of both the majority and minority ethnic samples on both Serb andCroat majority areas who express strong degrees of pride in being citizens of this country. Of course, thisstill means that only 32.5% of the Croat majority areas sample and 23.7% of the Serb majority areas samplesaid they felt a strong degree of pride in being citizens of Bosnia and Herzegovina, according to ourNovember 2008 poll. This situation is unlikely to be remedied, particularly given that citizens of Bosnia andHerzegovina are not being offered the same advantages as citizens of Croatia or, if recent announcementsby Brussels are to be trusted, as Serbian citizens will soon be offered. We have in mind the fact that mostCroats in Bosnia and Herzegovina are also citizens of Croatia and can use their travel documents to travelfreely throughout Western Europe without a visa and it would seem that Brussels intends offering the samefacility to citizens of Serbia.
Looking at our poll results, there are clear differences between the ethnic groups in their attitudesregarding reducing or increasing the High Representative’s powers. In late November 2008, 10.9% of theBosniak majority area sample, 28.9% of the Croat majority areas sample, and as many as 71.9% of the Serbmajority areas sample were of the opinion that the High Representative’s powers should be reduced. It isinteresting to note that there was a reduction between November 2007 and November 2008 in the overallpercentage who think the High Representative’s powers should be reduced. The reduction was steepest inCroat majority areas and for the minority samples in Bosniak and Serb majority areas. The percentage whothink that the High Representative’s powers should be increased was down in both Croat and Serb majorityareas, as well as amongst the minority samples in Bosniak and Croat majority areas (see Table VIII).
Finally, when we come to confidence in the judicial system, we find that the Bosniak majority area groupis the one most likely to express approval (57.75%), followed by the Serb and then the Croat majority areagroups (57.30% and 32.02% respectively), according to our November 2008 poll. It is worth noting that thegroup most likely to express strong agreement with the idea that the legal system could be counted on tosupport or uphold their contractual and ownership rights was the minority sample in Serb majority areas(23.88%). One may also say, on the basis of our November 2008 results, that the minority sample in Serbmajority areas also expressed the highest degree of confidence in the legal system (66.2%). For more, seeTable X in annex.
60
Ann
ual R
epor
t 200
8 - S
ocia
l Inc
lusi
on

1. The Ethnic Stability IndexAt 77 points, the Ethnic Stability Index was at a relatively high level at the end of this year compared
to the 72 points it ended last year with. The level of the index was highest during the middle of the year,after the signing of the Stabilization and Association Agreement, falling in the final quarter following theelections. As may be seen from the following graph, which shows the annual averages and the trendlinefor the Ethnic Stability Index since the project began, the index began at 71 in 2000 and grew steadily overthe next two to four years, since when it has fluctuated within a three point band, but with a generallyupward trend, suggesting that time and distance from the war are having an impact. This period offluctuation in the Ethnic Stability Index corresponds to a similar period of fluctuation in the political,economic, and social stability indices, the main differences in their cases it was preceded by a steep fall.The Ethnic Stability Index is clearly responding to the same political and economic events, like thedifficulties over constitutional negotiations, police and other reforms, the independence of Kosovo, theStabilization and Association Agreement, the rise in the use of radical rhetoric in politics, the localelections in late 2008, rising prices in 2007 and early 2008, and so forth, but they have not yet managedto bring about a major decline in its underlying value.
VII ETHNIC RELATIONS1. The Ethnic Stability Index
2. Exploitation of ethnic divisions in political life continues
3. Reported discrimination falls over year as a whole
4. Support for refugee return recovers
5. Measures of social distance between ethnic groups improve
6. Separatism and Nationalism
ANNUALREPORT2008
61
Annual Report 2008 - Political Stability in BiH

2. Exploitation of ethnic divisions in political life continuesThe beginning of the year saw less stable political and security conditions in Bosnia and Herzegovina,
with very divided public reaction to Kosovo's declaration of independence. Protests were held on thestreets of Banja Luka and other major towns of the Republika Srpska, while the RS National Assemblypassed a resolution stating that it refused to recognize the declaration. In the Federation, the politicalestablishment welcome the declaration of independence. RS politicians began to speculate openly againon holding a secession referendum. The turbulent political relations were calmed following the decisionby the Bosnia and Herzegovina Presidency not to recognise Kosovo as an independent state for theforeseeable future.
The year will be remembered for the signing and ratification of the Stabilisation and AssociationAgreement with the European Union. This was preceded, however, by considerable debate anddisagreement between the main political parties regarding the passage of a police reform bill. TheEuropean Union made signing the SAA conditional upon the passage of the legislation. After considerablepolitical compromise, the agreement was signed on 16 June.
This year also saw the coming into force of the temporary Stabilisation and Association Agreementand implementation of the trade agreement between Bosnia and Herzegovina and the European Union.In mid-July, the country was received into the Union of Mediterranean Countries.
Disagreement between politicians over how to implement the agreed census in Bosnia andHerzegovina was further complicated by the position of international community representatives thatthere was no need to ask for data on ethnic or religious identity. This position was poorly received in theRepublika Srpska, whose Prime Minister, Milorad Dodik, announced that the entity would organise itsown census in 2011, if one were not agreed at the level of the country as a whole.
In the middle of the year, the RS Prime Minister announced the entity's exit from the Bosnian andHerzegovinian electricity transmission company, causing concern amongst the public and theinternational community. The Peace Implementation Council met and called on the RS government tovoid the Prime Minister’s decision, a call they soon complied with.
The year also saw an election campaign, which like previous election campaigns was marked by theuse of nationalist rhetoric deployed to mobilise the electorate. The run-up to the elections and theelections themselves, which were held on 5 October 2008, took place without major problem or incident.As in previous cases, the election campaign served its purpose, raising ethnic tensions amongst the publicand proving yet again how deep divisions in this country run. The turnout was 55%.
The House of Representatives and the House of Peoples of the Bosnian parliament ratified theStabilisation and Association Agreement with the European Union on 22 October 2008. The followingday, the European Parliament in Brussels passed a Resolution on Bosnia and Herzegovina warning politicalleaders in the country that unless there was major change the country has nothing to expect of theEuropean Union.
Because the Bosnian Presidency failed to agree a common platform for the participation of the state-level delegation at the UN General Assembly, the Presidency Chair, Haris Silajdžić, followed his own line infront of the General Assembly, using his speech to treat the behaviour of the governing structures in theRepublika Srpska. He repeated this speech in front of the Council of Europe, after which the Council ofEurope passed a resolution. This resolution put additional strain on political relations between Banja Lukaand Sarajevo. RS politicians were unanimous in the view that his speech was an invitation to further division.
A further important event of the year was the declaration by the High Representative, MiroslavLajcak, that the Office of the High Representative would remain in 2009, though it later emerged that hehimself would no longer serve as High Representative.
In the small town of Prud, on 8 November, three party leaders, from the SDA, the SNSD, and the HDZ,reached agreement on further reforms in the country. They focused on constitutional reforms, stateproperty, the census, and the status of Brčko district. The agreement was met with a range of reactionsby the various political parties in the country.
The final act of the RS government in 2008 sent shock waves through international and local politicalcircles. The government in Banja Luka initiated criminal proceedings against a representative of the
62
Ann
ual R
epor
t 200
8 - E
thni
c Re
lati
ons

international community in Bosnia and Herzegovina. The High Representative made a statement to theeffect that raising such indictments constituted a direct threat to the international community.
3. Reported discrimination falls over year as a wholeThough 2008, an increasing percentage of the urban sample said they had not suffered harassment
on the basis of their ethnicity, up from 88.7% in November 2007 to 96% in November this year. There wasalso a significant decrease in the percentage of the urban sample who said that they had experiencedsuch harassment at least once, down from 5.8% in November 2007 to 1.8% in November 2008. In ruralareas, the situation was reversed, with a minor reduction in the percentage who said they had never beensuffered harassment based on their ethnicity, down from 96.5% in late 2007 to 94.5% at the end of 2008.The percentage who said they had never had any such experience was up for men and women over theyear. In November 2008, 94.7% of men and 95.5% of women said they had never had such an experience.This compares to 91.8% of men and 94.5% of women in November the previous year (Table Ia).
Taking age as our criterion, we find that the oldest age-group were least likely to have experiencedfrequent harassment on the basis of ethnicity, as was the case the previous year. Thus, 0.4% of the over50s said they had suffered frequent harassment on ethnic grounds in November 2008, compared to 1.2%of the middle age group and 1.8% of the younger age group (Table Ib).
Our surveys also show an increase in the percentages of both the majority and minority samples inBosniak majority areas who had not suffered such harassment. The majority sample percentage was upfrom 88.5% last November to 93.2% in November of 2008, while the minority sample percentage was upfrom 92.2% to 95.5%. There was a minor reduction in the percentage of the Croat majority areas minoritysample who gave the same answer, from the 90.4% last year to 89.9% this November. The majority samplepercentage went up from 92% to 94% over the same period. In Serb majority areas, there was a negativefall in the percentages of both majority and minority sample who said they had never suffered suchdiscrimination. Thus, in November 2008 the majority sample percentage was 98.5%, while the minoritysample percentage was 97.3% (down from 97.5% down to 97.5% and 95.8%, respectively) (Table Ic).
4. Support for refugee return recoversThere was an increase against last year's relatively low percentage of both the urban and rural samples
entirely or basically in agreement that people not of the local majority should return to their prewar homesin the community (i.e. minority return). The percentage of the urban sample was 90% in November 2008,up from 83.4% a year before. The rural sample percentage was up from 84.9% to 87.9%. This year, womenwere more likely to support the idea than men (89.9% compared to 88.1%), which was not the case theprevious year. It is worth noting that the percentage of women who actively disagree with minority returnfell from 11.8% in November 2007 to 6.9% in November 2008 (Table II a).
There was an increase during the final quarter of 2008 in the percentage of all age groups who supportminority return. The greatest increase was for the youngest age group, up from 83.1% to 90.5% (Table II b).
GenderUrban Rural Male Female
Nov 2007 Jun. 2008 Sep 2008 Nov 2008 Nov 2007 Jun. 2008 Sep 2008 Nov 2008 Nov 2007 Jun. 2008 Sep 2008 Nov 2008 Nov 2007 Jun. 2008 Sep 2008 Nov 2008
% % % % % % % % % % % % % % % %No - never 88,7 93,6 94,7 96,0 96,5 95,1 96,7 94,5 91,8 94,8 94,5 94,7 94,5 94,1 97,2 95,5Yes - once 5,8 1,3 1,0 1,8 1,9 1,5 0,8 1,2 4,0 1,5 1,1 1,9 3,1 1,4 0,7 1,1Yes - more than once 3,1 1,3 1,8 1,3 1,1 1,1 0,9 1,6 2,4 1,5 1,5 1,6 1,5 0,9 1,0 1,4Yes - frequently 1,8 1,9 0,6 0,4 0,4 1,8 0,8 1,7 1,4 1,1 1,3 1,3 0,7 2,6 0,1 1,0DK/NA 0,6 1,8 2,0 0,6 0,1 0,5 0,8 0,9 0,4 1,2 1,6 0,5 0,2 0,9 1,0 1,0TOTAL 100,0 100,0 100,0 100,0 100,0 100,0 100,0 100,0 100,0 100,0 100,0 100,0 100,0 100,0 100,0 100,0Source: Public opinion polls conducted for EWS by Prism Research
Have you or any of your household been the victim fo verbal harassment or physical attack duringthe past year solely on the grounds of your ethnicity?
Table IIa
63
Annual Report 2008 - Ethnic Relations

Comparing the polls for the last quarters of 2007 and 2008, we find that Croats in Croat majority areasare least supportive of minority return. In Bosniak majority areas, the majority sample percentage incomplete or general agreement with minority return was higher than a year ago, up from 87.4% to 92.1%.The minority sample percentage was also up on last year, from 87.9% to 94.7%. The percentages of boththe majority and minority samples in Serb majority areas who support minority return was up in the finalquarter of 2008, at 87.6% and 90.8% respectively (Table II c).
5. Measures of social distance between ethnic groups improveThere was a reduction in the percentage of the sample in Croat majority areas entirely or generally happy
to live in the same country as Bosniaks, compared to the end of last year (down from 85.7% in November2007 to 81.6% in November 2008). The percentage who consider it acceptable to have a Bosniak neighbourwas down from 80.5% to 76.7%. The percentage willing to accept co-schooling with Bosniak children was bycontrast up on last year (from 21% to 24.6%). The percentage of the Croat majority areas sample who find itacceptable that a family member marry a Bosniak was down from 31.6% to 28.1% (Table IV).
In Serb majority areas, there was a rise over the end of last year in the percentage of the sample willingto live in the same country as Bosniaks: from 67% in November 2007 to 76% in November 2008. There wasalso an increase in the percentage happy to have a Bosniak neighbour, up from 65% to 74.3%. Thepercentage willing to accept co-schooling with Bosniak children fluctuated over the year, rising in the firstquarter but falling again in the second, to recover by the end of the year, when it stood at 74.1%. There wasalso an increase in the percentage of the Serb majority areas sample for whom intermarriage with a Bosniakis acceptable, up from 26.5% in November 2007 to 35.1% in November 2008 (Table IV). The percentage ofthe Bosniak majority areas sample happy to live in the same country as Croats was down from 97.9% inNovember 2007 to 95.3% at the end of 2008. There was also a gradual decline in the percentage of thesample entirely or generally happy to see their children go to the same school as Croat children. Thispercentage was down from 97.3% in November 2007 to 94.8% in November 2008. The percentage willingto see a member of their family marry a Croat was also down on last year (from 50.8% to 33.2%) (Table V).
In Serb majority areas, the percentage entirely or generally willing to live in the same country as Croatswas up (from 69.4% in November 2007 to 77.6% in November 2008). There was a positive reduction in thepercentage who consider it unacceptable to have a Croat neighbour (down from 28.7% to 21.7% over theyear). There was also a reduction in the percentage of the Serb majority areas sample entirely or generallyhappy to see their children go to the same school as Croat children, from 28.5% at the end of last year to22.8% at the end of this year.
The percentage happy to see a member of their family marry a Bosniak also increased from 33.2% to39.9% (Table V).
There was a reduction in the percentage of the sample in Bosniak majority areas who find it entirelyacceptable to live in the same country as Serbs (92.6%), just as there was in the percentage of the Croatsample, down from 83% to 79.7% (Table V).
Compared to the end of last year, there was a reduction in the percentage of the Bosniak majorityareas sample entirely or generally happy to live in the same country as Serbs (down from 95.9% to 92.9%),as there was a reduction in the percentage happy to see their children go to the same school (down from
GenderUrban Rural Male Female
Nov 2007 Jun. 2008 Sep 2008 Nov 2008 Nov 2007 Jun. 2008 Sep 2008 Nov 2008 Nov 2007 Jun. 2008 Sep 2008 Nov 2008 Nov 2007 Jun. 2008 Sep 2008 Nov 2008
% % % % % % % % % % % % % % % %Yes 36,0 34,6 36,1 31,7 34,8 34,5 29,6 33,6 36,7 38,0 37,1 34,7 34,0 31,2 27,9 31,0No 57,4 50,5 52,5 60,9 55,4 54,5 60,4 56,4 55,3 47,8 53,5 57,0 57,2 57,6 60,4 59,6DK/NA 6,6 14,9 11,4 7,4 9,8 11,0 10,0 10,0 8,0 14,3 9,4 8,3 8,8 11,2 11,7 9,5Total 100,0 100,0 100,0 100,0 100,0 100,0 100,0 100,0 100,0 100,0 100,0 100,0 100,0 100,0 100,0 100,0Source: Public opinion polls conducted for EWS by Prism Research
Would you move to a town where you do not belong to the majority ethnicity for work?Table VIIa
64
Ann
ual R
epor
t 200
8 - E
thni
c Re
lati
ons
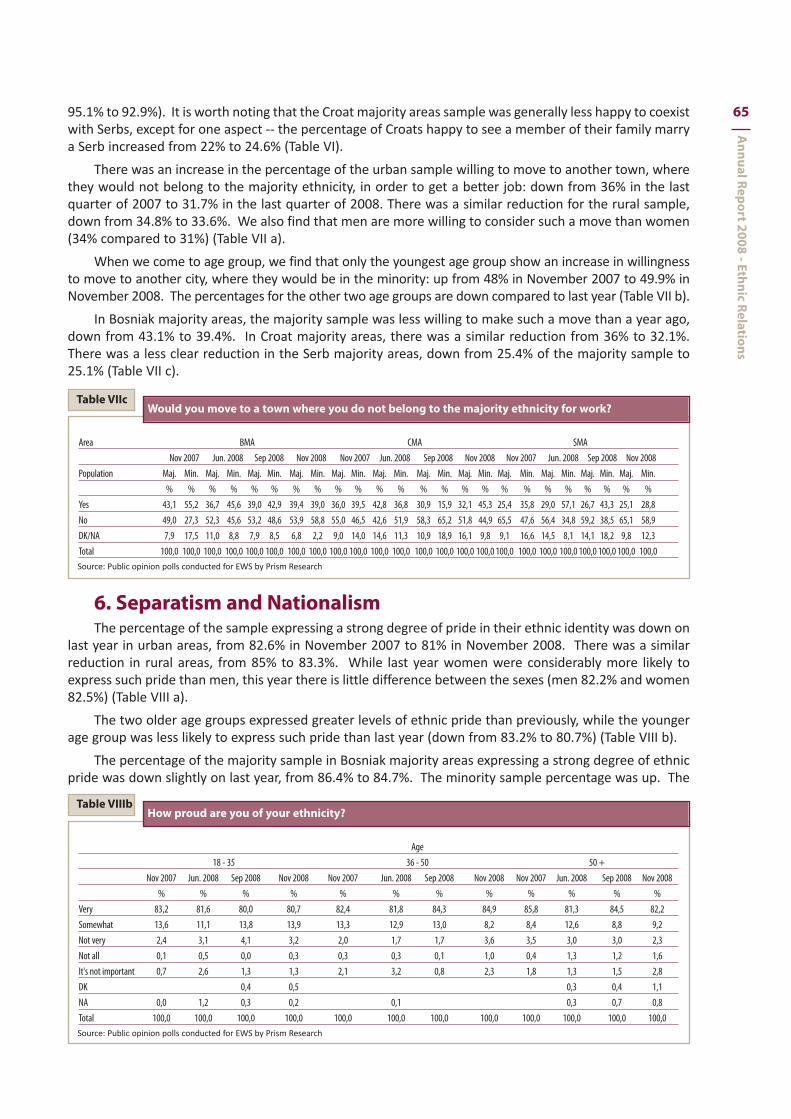
95.1% to 92.9%). It is worth noting that the Croat majority areas sample was generally less happy to coexistwith Serbs, except for one aspect -- the percentage of Croats happy to see a member of their family marrya Serb increased from 22% to 24.6% (Table VI).
There was an increase in the percentage of the urban sample willing to move to another town, wherethey would not belong to the majority ethnicity, in order to get a better job: down from 36% in the lastquarter of 2007 to 31.7% in the last quarter of 2008. There was a similar reduction for the rural sample,down from 34.8% to 33.6%. We also find that men are more willing to consider such a move than women(34% compared to 31%) (Table VII a).
When we come to age group, we find that only the youngest age group show an increase in willingnessto move to another city, where they would be in the minority: up from 48% in November 2007 to 49.9% inNovember 2008. The percentages for the other two age groups are down compared to last year (Table VII b).
In Bosniak majority areas, the majority sample was less willing to make such a move than a year ago,down from 43.1% to 39.4%. In Croat majority areas, there was a similar reduction from 36% to 32.1%.There was a less clear reduction in the Serb majority areas, down from 25.4% of the majority sample to25.1% (Table VII c).
6. Separatism and NationalismThe percentage of the sample expressing a strong degree of pride in their ethnic identity was down on
last year in urban areas, from 82.6% in November 2007 to 81% in November 2008. There was a similarreduction in rural areas, from 85% to 83.3%. While last year women were considerably more likely toexpress such pride than men, this year there is little difference between the sexes (men 82.2% and women82.5%) (Table VIII a).
The two older age groups expressed greater levels of ethnic pride than previously, while the youngerage group was less likely to express such pride than last year (down from 83.2% to 80.7%) (Table VIII b).
The percentage of the majority sample in Bosniak majority areas expressing a strong degree of ethnicpride was down slightly on last year, from 86.4% to 84.7%. The minority sample percentage was up. The
Area BMA CMA SMANov 2007 Jun. 2008 Sep 2008 Nov 2008 Nov 2007 Jun. 2008 Sep 2008 Nov 2008 Nov 2007 Jun. 2008 Sep 2008 Nov 2008
Population Maj. Min. Maj. Min. Maj. Min. Maj. Min. Maj. Min. Maj. Min. Maj. Min. Maj. Min. Maj. Min. Maj. Min. Maj. Min. Maj. Min.% % % % % % % % % % % % % % % % % % % % % % % %
Yes 43,1 55,2 36,7 45,6 39,0 42,9 39,4 39,0 36,0 39,5 42,8 36,8 30,9 15,9 32,1 45,3 25,4 35,8 29,0 57,1 26,7 43,3 25,1 28,8No 49,0 27,3 52,3 45,6 53,2 48,6 53,9 58,8 55,0 46,5 42,6 51,9 58,3 65,2 51,8 44,9 65,5 47,6 56,4 34,8 59,2 38,5 65,1 58,9DK/NA 7,9 17,5 11,0 8,8 7,9 8,5 6,8 2,2 9,0 14,0 14,6 11,3 10,9 18,9 16,1 9,8 9,1 16,6 14,5 8,1 14,1 18,2 9,8 12,3Total 100,0 100,0 100,0 100,0 100,0 100,0 100,0 100,0 100,0 100,0 100,0 100,0 100,0 100,0 100,0 100,0 100,0 100,0 100,0 100,0 100,0 100,0 100,0 100,0Source: Public opinion polls conducted for EWS by Prism Research
Would you move to a town where you do not belong to the majority ethnicity for work?Table VIIc
Age18 - 35 36 - 50 50 +
Nov 2007 Jun. 2008 Sep 2008 Nov 2008 Nov 2007 Jun. 2008 Sep 2008 Nov 2008 Nov 2007 Jun. 2008 Sep 2008 Nov 2008% % % % % % % % % % % %
Very 83,2 81,6 80,0 80,7 82,4 81,8 84,3 84,9 85,8 81,3 84,5 82,2Somewhat 13,6 11,1 13,8 13,9 13,3 12,9 13,0 8,2 8,4 12,6 8,8 9,2Not very 2,4 3,1 4,1 3,2 2,0 1,7 1,7 3,6 3,5 3,0 3,0 2,3Not all 0,1 0,5 0,0 0,3 0,3 0,3 0,1 1,0 0,4 1,3 1,2 1,6It's not important 0,7 2,6 1,3 1,3 2,1 3,2 0,8 2,3 1,8 1,3 1,5 2,8DK 0,4 0,5 0,3 0,4 1,1NA 0,0 1,2 0,3 0,2 0,1 0,3 0,7 0,8Total 100,0 100,0 100,0 100,0 100,0 100,0 100,0 100,0 100,0 100,0 100,0 100,0Source: Public opinion polls conducted for EWS by Prism Research
How proud are you of your ethnicity?Table VIIIb
65
Annual Report 2008 - Ethnic Relations

situation in Croat majority areas was similar, with a reduction in the majority sample percentage and anincrease in the minority sample percentage. In Serb majority areas, the majority sample percentageexpressing a strong degree of pride in their ethnic identity was down from 82% to 79.3%, while theminority sample percentage was up rather more considerably, from 74.1% 84.8% (Table VIII c).
Turning to pride in being a citizen of Bosnia and Herzegovina, we find an increase in the percentage ofthe rural sample expressing a strong degree of pride (up from 50.6% to 54.4%), but a reduction in the urbansample (from 52.9% to 51.5%). The percentage of the female sample was up, from 49.4% 52.6%, whilethere was little change in the percentage of men expressing such pride (Table IX a).
There was a significant reduction in the percentage of the Bosniak majority areas sample expressingpride in their citizenship, down from 86.3% to 80.7% over the year. The minority sample percentage wasup from 78.4% to 87%. The majority sample percentage in Croat majority areas was also up, albeit still inthe low 30s. The minority sample percentage in Croat majority areas was up considerably, from 49.9% to75.4%. In Serb majority areas, the majority sample percentage expressing such pride was 23.7%, while theminority sample percentage was 72.9% (Table IX c).
There was a significant reduction in the percentage of the overall sample who said withdrawal by theEuropean Union security forces would increase the likelihood of renewed conflict in Bosnia andHerzegovina. This held for all categories. For example, in urban areas the percentage fell from 26.2% to21.9%, while it fell from 33.3% to 23.8% in rural areas, and from 32.3% 23.9% for men (Table X a).
When we look at our age groups, we find that the middle age group is most likely to believe that awithdrawal of international forces would increase the likelihood of war, currently at 24.8% (Table X b).
In Bosniak majority areas, the percentage of both the majority and minority sample who share thispessimistic view fell, from 44.7% to 29.5% for the majority sample and from 33.1% to 13.9% for theminority sample. The majority sample percentage in Croat majority areas was down from 21.3% to 18.6%,while the minority sample percentage was down from 33.1% to 27.2%. Only in Serb majority areas did thepercentage increase, up from 15.3% to 17.8% for the majority and from 25.4% to 27% for the minoritysample (Table X c).
The percentage of the sample who felt that the religious communities have a major impact on politicsand political life in Bosnia was up in urban areas, from 27.2% to 31.1% over the year. There was a similarincrease in rural areas, up from 25.6% to 28.1%. Men and women are equally likely to hold this opinion,at 29.5% and 29.3% respectively (Table XII a).
In Bosniak majority areas, there was an increase in the percentage who feel that the religious communitieshave a strong impact on politics, with the majority sample percentage rising from 33.2% last year to 45.6% thisNovember. There was also an increase in the minority sample percentage in Bosniak majority areas.
In Croat majority areas, there was an increase in both the minority and majority sample percentageswho share this view. Only in Serb majority areas did this percentage fall compared to last year, down from
GenderUrban Rural Male Female
Nov 2007Jun. 2008 Sep 2008 Nov 2008Nov 2007 Jun. 2008 Sep 2008 Nov 2008 Nov 2007 Jun. 2008 Sep 2008 Nov 2008Nov 2007 Jun. 2008 Sep 2008 Nov 2008% % % % % % % % % % % % % % % %
None 9,0 11,2 11,4 11,2 11,6 14,7 18,4 15,9 10,3 14,2 14,2 14,7 10,7 12,2 16,5 13,1Little 19,3 20,3 17,8 19,6 21,5 24,3 24,5 20,8 18,9 22,4 23,9 21,4 22,1 22,8 19,4 19,2A certain amount 37,7 30,0 30,5 32,9 33,5 30,5 28,3 27,3 34,5 29,3 26,0 28,9 36,1 31,2 32,3 30,5A lot 27,2 26,2 32,9 31,1 25,6 20,0 23,1 28,1 31,2 26,4 30,9 29,5 21,6 19,0 23,8 29,3DK/NA 6,8 12,3 7,3 5,2 7,8 10,6 5,8 7,8 5,1 7,7 5,0 5,5 9,6 14,8 7,9 7,9Total 100,0 100,0 100,0 100,0 100,0 100,0 100,0 100,0 100,0 100,0 100,0 100,0 100,0 100,0 100,0 100,0Total LITTLE 28,3 31,5 29,3 30,7 33,1 39,0 42,8 36,7 29,2 36,6 38,1 36,2 32,7 35,0 36,0 32,3Total MUCH 64,9 56,2 63,4 64,0 59,1 50,5 51,4 55,5 65,6 55,7 56,9 58,4 57,7 50,2 56,1 59,8DK/NA 6,8 12,3 7,3 5,2 7,8 10,6 5,8 7,8 5,1 7,7 5,0 5,5 9,6 14,8 7,9 7,9Total 100,0 100,0 100,0 100,0 100,0 100,0 100,0 100,0 100,0 100,0 100,0 100,0 100,0 100,0 100,0 100,0Source: Public opinion polls conducted for EWS by Prism Research
How much influence do you think the religious communities/churches in BiH have on current politics?Table XIIa
66
Ann
ual R
epor
t 200
8 - E
thni
c Re
lati
ons

20.1% of the majority sample to 13%. There was an increase in the percentage of the minority sample(Table XII c).
Both the urban and rural samples were less likely than previously to agree that parties with an explicitethnic orientation are best able to protect vital ethnic or national interests: down from 19.5% to 16.2% intowns and from 21.2% to 18% in village areas. Support for this view has been declining steadily over thelast number of years (Table XIII a).
In Bosniak majority areas, there was a reduction in the percentage of the majority sample who agreedwith this view, down from 8.6% to 8% over the year. The minority sample was also less likely to expressagreement with the claim, down from 10.9% in November 2007 to 5.1% in November 2008. By contrast,the majority sample in Croat majority areas was more likely to agree with the statement than last year, upfrom 39.6% to 45.7%. As was the minority sample in these areas, up from 21.5% to 32.6%. In Serb majorityareas, there was a reduction in the percentage of the majority sample who thought ethnic parties are bestable to protect the vital interests of the ethnic group they represent, down from 27% to 20.5%, but anincrease in the percentage of the minority sample, up from 12.5% to 23.3% (Table XIII c).
GenderUrban Rural Male Female
Nov 2007Jun. 2008 Sep 2008 Nov 2008Nov 2007 Jun. 2008 Sep 2008 Nov 2008 Nov 2007 Jun. 2008 Sep 2008 Nov 2008Nov 2007 Jun. 2008 Sep 2008 Nov 2008% % % % % % % % % % % % % % % %
TOTAL DISAGREE 72,5 63,8 63,0 74,9 67,8 62,4 56,9 72,2 73,9 64,3 60,3 72,7 65,8 62,1 59,6 73,9TOTAL AGREE 19,5 22,4 26,4 16,2 21,2 23,8 28,1 18,0 20,5 24,1 27,2 19,3 20,5 22,4 27,3 15,3DK/NA 8,0 13,8 10,7 8,9 11,0 13,8 15,0 9,9 5,6 11,7 12,5 8,0 13,7 15,5 13,1 10,8Total 100,0 100,0 100,0 100,0 100,0 100,0 100,0 100,0 100,0 100,0 100,0 100,0 100,0 100,0 100,0 100,0Source: Public opinion polls conducted for EWS by Prism Research
Some people say that only the ethnic parties can protect vital ethnic interests. To what degree do youagree or disagree with this idea?
Table XIIIa 67
Annual Report 2008 - Ethnic Relations


1. The Security Stability IndexFrom this year’s results, it would again appear that the security index is largely determined by the
public’s everyday experiences and their attitudes to questions like security of property, security ofmovement in their local communities, and confidence in contact with local institutions responsible forpublic safety and security. Thus, the murder of a teenager on a tram in Sarajevo at the beginning of theyear was followed by a decline in the index to its lowest measure to date. Towards the end of the year,the index recovered to approximately its initial position. The elections had no direct impact on the index,confirming that the public’s sense of safety is related to concrete events in their local communities. Asthe following graph, with annual averages and the trendline for the Security Stability Index since 2000, theindex has remained within a fairly narrow 3 point band, between its initial high of 89 and its low of 86.5in 2006, suggesting that there have been no major problems with public safety and security moregenerally over the past 8 years. On the other hand, the trend has clearly been downward, with amoderate recovery in 2007. As the discussion above makes clear the results for 2008 were mixed. It wouldseem rash to rule out the possibility of further deterioration in this area, if longer term trends continue,particularly given the increasing attention given to public safety related concerns in the media.
VIII PUBLIC AND PERSONAL SECURITY1. The Security Stability Index
2. Concern over public safety issues at beginning in the year fades as year goes on
3. Rates fall for most crimes, for most categories of the population
ANNUALREPORT2008
69
Annual Report 2008 - Political Stability in BiH

2. Concern over public safety issues at beginning in the yearfades as year goes on
This year, security issues were at the centre of political life, inspiring a series of civil actions, the mostprominent being the escalation of juvenile delinquency in Sarajevo, which shocked the public.
In spite of the fact that the meeting of the six ruling party leaders in early February made clear thatthere was no political consensus regarding police reform, by the middle of the month, the Council ofMinisters had passed a draft Police Coordination Bodies Bill and the Independent Police SupervisoryBodies Bill. The bills were enacted by the BiH Parliament at the end of the month.
The public was shocked at the beginning of the year by a terrible crime involving the abuse andmurder of a 17-year old Denis Mrnjavac by a group of youths on public transport in Sarajevo.Unprecedented public protests, involving thousands of people, were held to condemn the crime. After anumber of peaceful protests, at which the public expressed its disaffection with public safety, a furthermeeting in front of the Cantonal government buildings in Sarajevo resulted in stones being thrown at thebuilding, for which the authorities blamed a number of non-governmental organisations. As the situationbecame more complicated, regular Saturday demonstrations were held in Sarajevo calling for theresignation of the cantonal Prime Minister Samir Silajdžić and the Mayor Semiha Borovac. In themeantime, the authorities initiated a belated dialogue with the public on issues of security and publicsafety and both cantonal and federal parliaments held extraordinary sessions to discuss to juveniledelinquency and passing preventative strategies. The issue of security consequently became a matter ofpolitical and social debate both in Sarajevo Canton and in the rest of the country.
After much political debate and with international committee support, the Parliamentary assemblyof Bosnia-Herzegovina passed on 11 April two draft laws related to police reform, meeting internationalcommunity criteria and filling the conditions for signature of the Stabilisation and Association Agreementto go ahead.
At a NATO summit in April, it was announced that BiH could expect an invitation to join as early asthe following year (2009). An invitation was issued for closer talks.
In mid-May, the President of the Hague tribunal visited Bosnia-Herzegovina, when he announced thatthe UN Security Council would be requested to defer closing the court until all indictees had beenarrested.
Talks on relaxing visa conditions followed immediately on the signing of SAA in June. The Bosniangovernment was presented with a Roadmap, including tasks and guidelines as to what needed to be doneto make this possible.
The election campaign had no major impact on security, even though it did produce dirtyelectioneering, mudslinging against political opponents, etc. The most disturbing event took place inDoboj, where 17 SDS activists were taken into custody by the police on suspicion of vote buying.
In September, an event of considerable importance for public safety did take place, which succeededin presenting Bosnia-Herzegovina in a particularly bad light internationally. This was the poorly organisedand inadequate police protection provided to participants of the first queer festival in BiH. The result wasto send a clear message to the world that Bosnia and Herzegovina could not function properly as a stateand was unprepared to ensure the basic safety of its citizens, regardless of orientation. Even thoughcertain religious groups and sports fans had announced their intention in advance of lynching participantsin the event, this was not considered by the police sufficient cause to provide adequate resources toprevent possible attacks. In spite of the police presence, a number of people were physically attacked andthe festival was discontinued.
At the end of September, Transparency International announced that BiH is the most corrupt countryin the region, ranking 93rd out of 180 countries worldwide.
Towards the end of the year, there were attacks on federal government buildings. Anonymous groupsexpressed their dissatisfaction with economic and security conditions in the Federation by daubing thegovernment buildings with messages, breaking windows, and leaving messages to the effect that suchdisturbances would continue.
70
Ann
ual R
epor
t 200
8 - P
ublic
and
Per
sona
l Sec
urit
y

3. Rates fall for most crimes, for most categories of thepopulation
Comparing the last quarters of 2008 and 2007, we find there was little change in the urban crimerate. In certain categories, like car theft, there was no change at all (at 0.2%), while others like burglary athome saw an insignificant increase (from 1.3% to 1.5%). The incidence of burglary at the workplace wasdown from 0.8% to 0.2%. The incidence of burglary at home was also down in rural areas (to 0.5% from0.9%), as was car theft (from 0.6% to 0.2%). The rate of pickpocketing rose from 0.7% to 1.4%. In ruralareas, the percentage reporting some form of extortion was down from 0.5% to 0.3%. Men were morelikely to report burglaries or pickpocketing than women. There was no change in the percentage of menreporting car theft (0.3%), while there was a decrease amongst women from 0.5% to 0.2% (Table I a).
Both younger age groups reported a reduction compared to late 2007 in the incidence of burglary athome, (from 0.6% to 0.2% for the youngest, and from 0.1% to 0.4% for the middle-aged), while the oldestage-group reported an increase, from 0.4% to 1.7% (Table I b).
In Bosniak majority areas, there was an insignificant change in the percentage of the majority samplereporting a break in at home, from 1.6% to 1.5%. The minority sample percentage was up, from 1.3% to2.3%. The pickpocketing rate was up for both majority and minority samples, from 1.5% to 2% and from1.3% to 1.5%, respectively.
In Croat majority areas, the majority sample burglary at home rate was the same at the end of theyear as it had been a year before (1.1%), while the minority sample percentage was up significantly, from0.2% to 3.5%. The majority pickpocketing rate was up, however, from 2.6% to 3.6%, as was the majoritysample percentage reporting car theft, from 0.8% to 1.6%. There was an increase in the percentage of theminority sample who said they had been extorted, from 0.7% a year ago to 5.5% in the final quarter of2008. The Serb majority areas minority sample reported fewer break-ins at home than in late 2007, downfrom 0.8% to 0.5%. The majority sample percentage reporting pickpocketing was up, however, from 0.2%to 1%, as was the percentage reporting extortion, from 0.2% to 0.5% (Table I c).
Fewer people in urban areas said they had sought police assistance than last year. The figure wasdown from 9.5% in late 2007 to 4.4% in the first quarter, 6.6% mid year, and 5% at year end. In rural areas,the percentage was up from 4.5% to 4.7%. There was a reduction in the percentages of both men andwomen who said they sought police assistance, to 5.5% and 4.2% respectively, (Table II a).
While fewer young people requested police help than a year ago (7.1%, down from 8.9% lastNovember), they are still the age group most likely to ask for it (Table II b).
In Bosniak majority areas, the majority sample percentage who requested police help declinedsteadily through 2008, from 10.9% in late 2007 to 6.6% in the first and 5.9% in the second quarter, endingthe year at 5.8%. The Croat majority areas majority sample percentage was down from 4.9% to 4.6% overthe same period. Only in Serb majority areas did the majority sample percentage rise, from 2.7% to 3.8%(Table II c).
Dissatisfaction with police assistance received was up in urban areas: up from 16.1% of the relevantsample in late 2007 to 27.2% in late 2008. There was a similar increase in rural areas, up from 19.6% inNovember 2007 to 26.3% in November 2008. Men are particularly likely to express such dissatisfaction,with an increase from 12.7% last year to 36.1% in November 2008. Only women seem immune to this
Urban Rural Male FemaleNov 2007Jun. 2008 Sep 2008 Nov 2008Nov 2007 Jun. 2008 Sep 2008 Nov 2008 Nov 2007 Jun. 2008 Sep 2008 Nov 2008Nov 2007 Jun. 2008 Sep 2008 Nov 2008
% % % % % % % % % % % % % % % %Yes 9,5 4,4 6,6 5,0 4,5 5,5 3,7 4,7 6,7 5,9 6,5 5,5 6,6 4,2 3,5No 90,1 95,3 90,7 94,0 95,1 93,8 95,2 94,5 92,9 93,8 91,3 93,7 92,9 95,1 95,2 94,8DK/NA 0,4 0,3 2,6 1,0 0,4 0,7 1,0 0,8 0,4 0,3 2,2 0,8 0,5 0,7 1,3 1,0TOTAL 100,0 100,0 100,0 100,0 100,0 100,0 100,0 100,0 100,0 100,0 100,0 100,0 100,0 100,0 100,0 100,0Source: Public opinion polls conducted for EWS by Prism Research
During the past three months, have you or a family member requested police assistance for any reason?Table IIa
71
Annual Report 2008 - Public and Personal Security
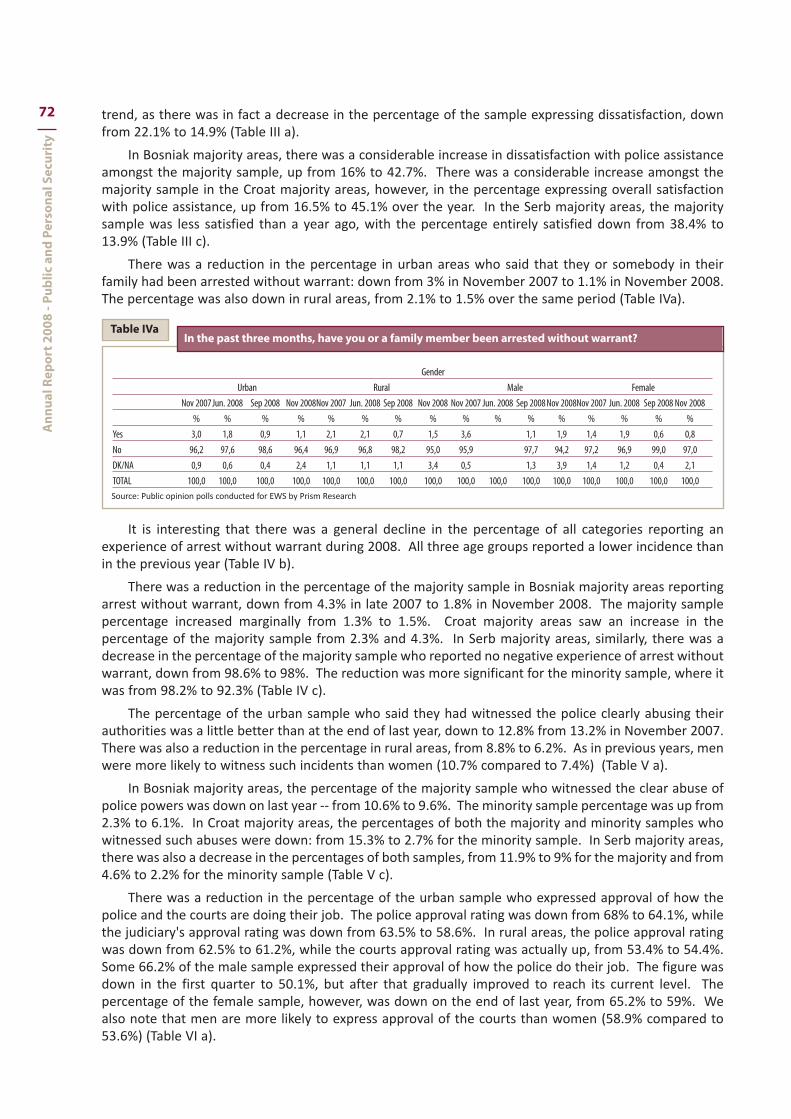
trend, as there was in fact a decrease in the percentage of the sample expressing dissatisfaction, downfrom 22.1% to 14.9% (Table III a).
In Bosniak majority areas, there was a considerable increase in dissatisfaction with police assistanceamongst the majority sample, up from 16% to 42.7%. There was a considerable increase amongst themajority sample in the Croat majority areas, however, in the percentage expressing overall satisfactionwith police assistance, up from 16.5% to 45.1% over the year. In the Serb majority areas, the majoritysample was less satisfied than a year ago, with the percentage entirely satisfied down from 38.4% to13.9% (Table III c).
There was a reduction in the percentage in urban areas who said that they or somebody in theirfamily had been arrested without warrant: down from 3% in November 2007 to 1.1% in November 2008.The percentage was also down in rural areas, from 2.1% to 1.5% over the same period (Table IVa).
It is interesting that there was a general decline in the percentage of all categories reporting anexperience of arrest without warrant during 2008. All three age groups reported a lower incidence thanin the previous year (Table IV b).
There was a reduction in the percentage of the majority sample in Bosniak majority areas reportingarrest without warrant, down from 4.3% in late 2007 to 1.8% in November 2008. The majority samplepercentage increased marginally from 1.3% to 1.5%. Croat majority areas saw an increase in thepercentage of the majority sample from 2.3% and 4.3%. In Serb majority areas, similarly, there was adecrease in the percentage of the majority sample who reported no negative experience of arrest withoutwarrant, down from 98.6% to 98%. The reduction was more significant for the minority sample, where itwas from 98.2% to 92.3% (Table IV c).
The percentage of the urban sample who said they had witnessed the police clearly abusing theirauthorities was a little better than at the end of last year, down to 12.8% from 13.2% in November 2007.There was also a reduction in the percentage in rural areas, from 8.8% to 6.2%. As in previous years, menwere more likely to witness such incidents than women (10.7% compared to 7.4%) (Table V a).
In Bosniak majority areas, the percentage of the majority sample who witnessed the clear abuse ofpolice powers was down on last year -- from 10.6% to 9.6%. The minority sample percentage was up from2.3% to 6.1%. In Croat majority areas, the percentages of both the majority and minority samples whowitnessed such abuses were down: from 15.3% to 2.7% for the minority sample. In Serb majority areas,there was also a decrease in the percentages of both samples, from 11.9% to 9% for the majority and from4.6% to 2.2% for the minority sample (Table V c).
There was a reduction in the percentage of the urban sample who expressed approval of how thepolice and the courts are doing their job. The police approval rating was down from 68% to 64.1%, whilethe judiciary's approval rating was down from 63.5% to 58.6%. In rural areas, the police approval ratingwas down from 62.5% to 61.2%, while the courts approval rating was actually up, from 53.4% to 54.4%.Some 66.2% of the male sample expressed their approval of how the police do their job. The figure wasdown in the first quarter to 50.1%, but after that gradually improved to reach its current level. Thepercentage of the female sample, however, was down on the end of last year, from 65.2% to 59%. Wealso note that men are more likely to express approval of the courts than women (58.9% compared to53.6%) (Table VI a).
GenderUrban Rural Male Female
Nov 2007Jun. 2008 Sep 2008 Nov 2008Nov 2007 Jun. 2008 Sep 2008 Nov 2008 Nov 2007 Jun. 2008 Sep 2008 Nov 2008Nov 2007 Jun. 2008 Sep 2008 Nov 2008% % % % % % % % % % % % % % % %
Yes 3,0 1,8 0,9 1,1 2,1 2,1 0,7 1,5 3,6 1,1 1,9 1,4 1,9 0,6 0,8No 96,2 97,6 98,6 96,4 96,9 96,8 98,2 95,0 95,9 97,7 94,2 97,2 96,9 99,0 97,0DK/NA 0,9 0,6 0,4 2,4 1,1 1,1 1,1 3,4 0,5 1,3 3,9 1,4 1,2 0,4 2,1TOTAL 100,0 100,0 100,0 100,0 100,0 100,0 100,0 100,0 100,0 100,0 100,0 100,0 100,0 100,0 100,0 100,0Source: Public opinion polls conducted for EWS by Prism Research
In the past three months, have you or a family member been arrested without warrant?Table IVa
72
Ann
ual R
epor
t 200
8 - P
ublic
and
Per
sona
l Sec
urit
y

In Bosniak majority areas, there was a decrease in the percentages of the majority sample expressingapproval of the police and the courts, compared to the end of last year, but an increase in the percentagesof the minority sample. In Croat majority areas, there was a decline in both the majority and minoritysample percentages in approval. In Serb majority areas, the majority sample percentage was up, from73.5% to 77.2% (Table VI c).
There was a marginal increase in the percentage of the urban sample who think corruption iswidespread in the police force, up from 40.1% to 40.4% over the course of the year. The percentage hadrisen considerably during the first quarter of 2008, but then returned to a more moderate level in thefollowing quarter. The rural sample percentage who think corruption is very widespread in the police wasdown over the year, from 40.9% to 36.8%. There was an increase in the percentage of the urban samplewho think corruption is very widespread in the courts, up from 43.3% to 44.6%. In rural areas, there wasa reduction in the percentage who think corruption is very widespread in the courts, from 45.5% to 40.6%(Table VII a).
At the end of the year, we find that fewer of the majority sample in Bosniak majority areas thoughtcorruption was widespread in the police force, down from 51.1% in November 2007 to 47.9% inNovember 2008. The minority sample percentage was up from 57.2% to 59.4%. In Croat majority areas,the percentage of the majority sample who think the police are highly corrupt was also down, but so wasthe percentage of the minority sample. In Serb majority areas, there was also an increase in thepercentage of the majority sample who agree: up from 27.3% at the end of 2007 to 29.3%. That was asimilar increase for the minority sample, up from 25.4% to 27.7% (Table VII c).
GenderUrban Rural Male Female
Nov 2007 Jun. 2008 Sep 2008 Nov 2008 Nov 2007 Jun. 2008 Sep 2008 Nov 2008 Nov 2007 Jun. 2008 Sep 2008 Nov 2008 Nov 2007 Jun. 2008 Sep 2008 Nov 2008
% % % % % % % % % % % % % % % %Police
Not at all 4,0 2,8 1,1 3,8 4,9 2,0 3,3 1,5 6,3 3,0 1,8 2,8 2,7 1,7 3,0 2,2Slightly 19,6 9,2 18,0 16,5 11,6 12,4 16,1 15,2 15,0 11,9 16,2 16,5 15,3 10,1 17,6 15,0To some degree 16,9 20,9 19,2 17,1 15,4 17,4 18,6 16,6 14,5 19,6 19,7 15,9 17,6 18,2 17,9 17,6Quite 19,5 21,6 20,2 22,2 27,2 20,9 22,0 30,0 22,0 18,2 19,2 27,1 25,6 24,3 23,2 26,2Very 40,1 45,4 41,4 40,4 40,9 47,3 40,0 36,8 42,2 47,2 43,0 37,7 38,9 45,7 38,2 38,9
TOTAL 100,0 100,0 100,0 100,0 100,0 100,0 100,0 100,0 100,0 100,0 100,0 100,0 100,0 100,0 100,0 100,0Courts
Not at all 4,0 1,7 1,0 2,4 3,0 2,8 2,4 1,1 4,4 2,7 1,2 1,9 2,4 1,9 2,4Slightly 17,1 6,8 15,7 16,7 12,6 10,1 12,9 12,3 14,7 9,9 11,8 13,5 14,5 7,4 16,3To some degree 15,5 16,0 16,7 13,3 12,7 12,9 18,6 16,3 13,9 14,9 19,2 16,0 14,0 13,7 16,4Quite 20,2 25,2 20,3 22,8 26,2 20,8 24,3 29,7 20,6 19,9 21,5 27,4 26,5 25,5 23,6Very 43,3 50,3 46,4 44,6 45,5 53,5 41,8 40,6 46,4 52,6 46,2 41,2 42,6 51,5 41,4
TOTAL 100,0 100,0 100,0 100,0 100,0 100,0 100,0 100,0 100,0 100,0 100,0 100,0 100,0 100,0 100,0Source: Public opinion polls conducted for EWS by Prism Research
How widespread do you think corruption, meaning taking bribes or abuse of office for personal gain, isin the following institutions?
Table VIIa
73
Annual Report 2008 - Public and Personal Security


ANNEX
ANNUALREPORT2008

POLITICAL STABILITY IN BIH
The Political Stability Index of BiH
Table I
Politics in BiH are getting...?
GenderSample All Male Female
March 08. June 08. Sept 08. Nov 08. March 08. June 08. Sept 08. Nov 08. March 08. June 08. Sept 08. Nov 08.% % % % % % % % % % % %
Worse 67,0 50,0 50,9 63,4 70,3 48,3 51,8 63,8 63,8 51,7 50,1 63,0Better 23,8 35,9 36,0 25,0 21,8 40,4 36,3 26,9 25,8 31,5 35,7 23,1DK/NA 9,2 14,1 13,1 11,7 7,8 11,3 11,9 9,3 10,5 16,8 14,3 13,9Total 100,0 100,0 100,0 100,0 100,0 100,0 100,0 100,0 100,0 100,0 100,0 100,0Source: Public opinion polls conducted for EWS by Prism Research
Table II
Politics in BiH are getting...?
Ispitanici Bosniak majority areas Croat majority areas Serb majority areasMarch 08. June 08. Sept 08. Nov 08. March 08. June 08. Sept 08. Nov 08. March 08. June 08. Sept 08. Nov 08.
% % % % % % % % % % % %Worse 78,8 54,4 57,2 79,7 57,7 57,5 61,5 52,9 57,3 42,5 42,5 50,3Better 16,1 31,7 31,8 13,5 26,5 27,9 23,3 24,7 30,6 43,0 42,0 34,6DK/NA 5,1 13,9 11,0 6,8 15,8 14,6 15,1 22,4 12,2 14,5 15,5 15,1Total 100,0 100,0 100,0 100,0 100,0 100,0 100,0 100,0 100,0 100,0 100,0 100,0Source: Public opinion polls conducted for EWS by Prism Research
Ann
ual R
epor
t 200
8
2
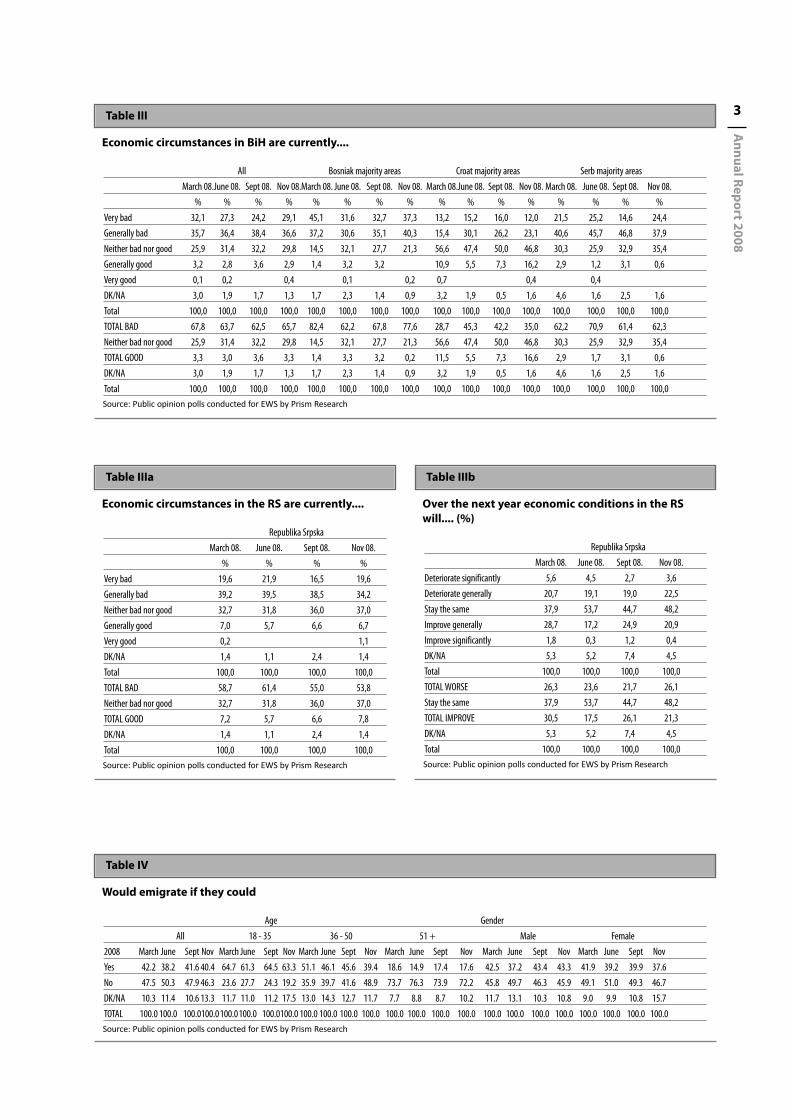
Table III
Economic circumstances in BiH are currently....
All Bosniak majority areas Croat majority areas Serb majority areasMarch 08.June 08. Sept 08. Nov 08.March 08. June 08. Sept 08. Nov 08. March 08.June 08. Sept 08. Nov 08. March 08. June 08. Sept 08. Nov 08.
% % % % % % % % % % % % % % % %Very bad 32,1 27,3 24,2 29,1 45,1 31,6 32,7 37,3 13,2 15,2 16,0 12,0 21,5 25,2 14,6 24,4Generally bad 35,7 36,4 38,4 36,6 37,2 30,6 35,1 40,3 15,4 30,1 26,2 23,1 40,6 45,7 46,8 37,9Neither bad nor good 25,9 31,4 32,2 29,8 14,5 32,1 27,7 21,3 56,6 47,4 50,0 46,8 30,3 25,9 32,9 35,4Generally good 3,2 2,8 3,6 2,9 1,4 3,2 3,2 10,9 5,5 7,3 16,2 2,9 1,2 3,1 0,6Very good 0,1 0,2 0,4 0,1 0,2 0,7 0,4 0,4DK/NA 3,0 1,9 1,7 1,3 1,7 2,3 1,4 0,9 3,2 1,9 0,5 1,6 4,6 1,6 2,5 1,6Total 100,0 100,0 100,0 100,0 100,0 100,0 100,0 100,0 100,0 100,0 100,0 100,0 100,0 100,0 100,0 100,0TOTAL BAD 67,8 63,7 62,5 65,7 82,4 62,2 67,8 77,6 28,7 45,3 42,2 35,0 62,2 70,9 61,4 62,3Neither bad nor good 25,9 31,4 32,2 29,8 14,5 32,1 27,7 21,3 56,6 47,4 50,0 46,8 30,3 25,9 32,9 35,4TOTAL GOOD 3,3 3,0 3,6 3,3 1,4 3,3 3,2 0,2 11,5 5,5 7,3 16,6 2,9 1,7 3,1 0,6DK/NA 3,0 1,9 1,7 1,3 1,7 2,3 1,4 0,9 3,2 1,9 0,5 1,6 4,6 1,6 2,5 1,6Total 100,0 100,0 100,0 100,0 100,0 100,0 100,0 100,0 100,0 100,0 100,0 100,0 100,0 100,0 100,0 100,0Source: Public opinion polls conducted for EWS by Prism Research
Table IIIa
Economic circumstances in the RS are currently....
Republika Srpska March 08. June 08. Sept 08. Nov 08.
% % % %Very bad 19,6 21,9 16,5 19,6Generally bad 39,2 39,5 38,5 34,2Neither bad nor good 32,7 31,8 36,0 37,0Generally good 7,0 5,7 6,6 6,7Very good 0,2 1,1DK/NA 1,4 1,1 2,4 1,4Total 100,0 100,0 100,0 100,0TOTAL BAD 58,7 61,4 55,0 53,8Neither bad nor good 32,7 31,8 36,0 37,0TOTAL GOOD 7,2 5,7 6,6 7,8DK/NA 1,4 1,1 2,4 1,4Total 100,0 100,0 100,0 100,0Source: Public opinion polls conducted for EWS by Prism Research
Table IIIb
Over the next year economic conditions in the RSwill.... (%)
Republika Srpska March 08. June 08. Sept 08. Nov 08.
Deteriorate significantly 5,6 4,5 2,7 3,6Deteriorate generally 20,7 19,1 19,0 22,5Stay the same 37,9 53,7 44,7 48,2Improve generally 28,7 17,2 24,9 20,9Improve significantly 1,8 0,3 1,2 0,4DK/NA 5,3 5,2 7,4 4,5Total 100,0 100,0 100,0 100,0TOTAL WORSE 26,3 23,6 21,7 26,1Stay the same 37,9 53,7 44,7 48,2TOTAL IMPROVE 30,5 17,5 26,1 21,3DK/NA 5,3 5,2 7,4 4,5Total 100,0 100,0 100,0 100,0Source: Public opinion polls conducted for EWS by Prism Research
Table IV
Would emigrate if they could
Age GenderAll 18 - 35 36 - 50 51 + Male Female
2008 March June Sept Nov March June Sept Nov March June Sept Nov March June Sept Nov March June Sept Nov March June Sept NovYes 42.2 38.2 41.6 40.4 64.7 61.3 64.5 63.3 51.1 46.1 45.6 39.4 18.6 14.9 17.4 17.6 42.5 37.2 43.4 43.3 41.9 39.2 39.9 37.6No 47.5 50.3 47.9 46.3 23.6 27.7 24.3 19.2 35.9 39.7 41.6 48.9 73.7 76.3 73.9 72.2 45.8 49.7 46.3 45.9 49.1 51.0 49.3 46.7DK/NA 10.3 11.4 10.6 13.3 11.7 11.0 11.2 17.5 13.0 14.3 12.7 11.7 7.7 8.8 8.7 10.2 11.7 13.1 10.3 10.8 9.0 9.9 10.8 15.7TOTAL 100.0 100.0 100.0100.0100.0100.0 100.0100.0 100.0 100.0 100.0 100.0 100.0 100.0 100.0 100.0 100.0 100.0 100.0 100.0 100.0 100.0 100.0 100.0Source: Public opinion polls conducted for EWS by Prism Research
Annual Report 2008
3

Table V
Would emigrate if they could
Bosniak majority areas Croat majority areas Serb majority areasMarch 08. June 08. Sept 08. Nov 08. March 08. June 08. Sept 08. Nov 08. March 08. June 08. Sept 08. Nov 08.
% % % % % % % % % % % %Yes 48,7 36,8 48,2 39,2 41,4 43,5 48,8 43,4 34,7 38,0 31,5 41,6No 44,2 52,4 41,2 44,8 44,7 40,4 44,0 43,2 52,0 50,8 56,3 47,6DK/NA 7,2 10,8 10,6 15,9 14,0 16,2 7,2 13,5 13,3 11,2 12,1 10,8TOTAL 100,0 100,0 100,0 100,0 100,0 100,0 100,0 100,0 100,0 100,0 100,0 100,0Source: Public opinion polls conducted for EWS by Prism Research
Table VI
You look at the process of BiH joining the EU with....
All Bosniak majority areas Croat majority areas Serb majority areasMarch 08.June 08. Sept 08. Nov 08. March 08. June 08. Sept 08.Nov 08. March 08.June 08. Sept 08. Nov 08. March 08. June 08. Sept 08. Nov 08.
% % % % % % % % % % % % % % % %Hope 73,0 74,8 67,4 63,9 85,8 86,0 78,3 75,0 61,8 69,9 66,4 62,2 62,1 63,2 56,6 49,3Concern 18,2 16,9 22,8 26,3 9,5 7,3 15,9 18,8 27,3 24,4 27,0 28,8 24,7 25,4 27,3 35,6DK/NA 8,8 8,3 9,8 9,8 4,7 6,6 5,8 6,1 10,9 5,8 6,6 9,0 13,1 11,4 16,0 15,2Total 100,0 100,0 100,0 100,0 100,0 100,0 100,0 100,0 100,0 100,0 100,0 100,0 100,0 100,0 100,0 100,0Source: Public opinion polls conducted for EWS by Prism Research
Table VII
How important do you think EU membership is for BiH?
All Bosniak majority areas Croat majority areas Serb majority areasMarch 08.June 08. Sept 08. Nov 08.March 08. June 08. Sept 08. Nov 08. March 08.June 08. Sept 08. Nov 08. March 08. June 08. Sept 08. Nov 08.
% % % % % % % % % % % % % % % %Very 57,8 52,6 45,2 48,8 80,6 77,9 60,9 73,9 45,5 43,8 51,5 36,4 35,0 25,9 26,5 21,7Somewhat 22,5 26,4 32,0 28,4 11,7 9,5 28,1 15,2 21,3 32,9 22,7 43,9 35,2 43,5 37,8 39,0Neither important nor unimportant 11,1 11,4 13,8 12,9 3,6 3,6 7,6 6,7 19,1 16,2 20,9 14,6 17,4 19,3 18,9 20,5Fairly unimportant 2,2 1,6 1,1 2,4 0,1 0,2 4,8 1,9 0,7 0,5 3,8 3,0 2,6 5,9Not at all important 2,5 2,5 3,9 3,9 0,4 0,4 2,0 1,4 1,2 1,2 5,1 5,9 9,3 9,1DK/NA 4,0 5,4 3,9 3,6 3,6 8,7 3,5 3,8 7,4 3,8 3,0 3,5 3,6 2,5 4,9 3,8Total 100,0 100,0 100,0 100,0 100,0 100,0 100,0 100,0 100,0 100,0 100,0 100,0 100,0 100,0 100,0 100,0TOTAL IMPORTANT 80,3 79,0 77,3 77,2 92,3 87,4 88,9 89,1 66,7 76,7 74,2 80,3 70,2 69,3 64,4 60,7Neither important nor unimportant 11,1 11,4 13,8 12,9 3,6 3,6 7,6 6,7 19,1 16,2 20,9 14,6 17,4 19,3 18,9 20,5TOTAL UNIMPORTANT 4,6 4,1 5,0 6,2 0,5 0,2 0,4 6,9 3,3 1,9 1,6 8,9 8,9 11,9 15,0DK/NA 4,0 5,4 3,9 3,6 3,6 8,7 3,5 3,8 7,4 3,8 3,0 3,5 3,6 2,5 4,9 3,8Total 100,0 100,0 100,0 100,0 100,0 100,0 100,0 100,0 100,0 100,0 100,0 100,0 100,0 100,0 100,0 100,0Source: Public opinion polls conducted for EWS by Prism Research
Ann
ual R
epor
t 200
8
4

Table IX
Taking all the circumstances into account, which party represents the political perspective closest to yours? (%)
GenderAll Male Female FBiH RS
June 08. Sept 08. Nov 08. June 08. Sept 08. Nov 08. June 08. Sept 08. Nov 08. June 08. Sept 08. Nov 08.June 08.Sept 08.Nov 08.DNZ BiH-Demokratska narodna zajednica BiH 0,1 0,1 0,2 0,2Stranka za Bosnu i Hercegovinu 3,3 5,1 3,4 3,2 4,0 4,0 3,4 6,2 2,8 5,3 8,7 5,7 0,2SDA-Stranka demokratske akcije 5,5 9,1 7,9 6,4 9,9 7,8 4,6 8,3 7,9 8,9 15,5 13,2Stranka penzionera-umirovljenika BiH 0,8 0,7 1,0 0,8 1,3 1,1 0,7 0,1 0,9 1,3 1,1 1,7SDP-Socijaldemokratska partija BiH-Socijaldemokrati 7,6 9,2 10,7 6,8 10,8 12,2 8,4 7,8 9,3 12,4 14,5 17,2 0,5 0,2 0,2Liberalno demokratska stranka Bosne i Hercegovine 0,1 0,0 0,2 0,3 0,4 0,1 0,2 0,1 0,3Penzionerska stranka RS 0,1 0,1 0,2 0,1 0,3 0,2DNS-Demokratski narodni savez 0,5 1,5 0,9 0,7 2,2 1,3 0,3 0,9 0,6 1,2 3,6 2,4SDS-Srpska demokratska stranka 3,6 5,4 3,4 3,7 5,7 3,5 3,6 5,1 3,3 0,4 9,1 13,0 8,2Srpska radikalna stranka dr. Vojislav Šešelj 0,9 0,5 0,2 1,0 0,2 0,4 0,8 0,8 2,3 1,2 0,5PDP RS-Partija demokratskog progresa RS 0,4 0,8 1,4 0,6 0,9 1,5 0,1 0,7 1,2 0,9 2,0 3,5Savez nezavisnih socijaldemokrata-SNSD Milorad Dodik 12,9 14,1 9,7 13,5 13,7 9,0 12,4 14,4 10,4 32,7 35,3 23,9Socijalistička partija 0,3 0,8 0,5 1,0 0,2 0,6 0,9 1,9Narodna stranka "Radom za boljitak" 0,5 0,5 1,1 0,4 0,8 0,7 0,6 0,2 1,6 0,8 0,9 1,9HDZ-Hrvatska demokratska zajednica BiH 3,8 4,9 4,1 3,8 5,4 4,5 3,7 4,5 3,6 6,5 8,4 6,4 0,2Naša stranka 0,8 1,1 0,6 1,4Srpska radikalna stranka Republike Srpske 0,4 0,1 0,2 0,6 0,2 0,1 0,9 0,2Građanska demokratska stranka Bosne i Hercegovine 0,1 0,3 0,2BSP-Bosansko-hercegovačka stranka prava 0,1 0,1 0,1Demokratska stanka invalida BiH-DSI BiH 0,1 0,1 0,1DSS-Demokratska stranka Srpske 0,1 0,3 0,3Zeleni BiH 0,2 0,0 0,4 0,1 0,3 0,1Evropska ekološka stranka E-5 0,3 0,5 0,4Hrvatska stranka prava Bosne i Hercegovine-Ðapić dr. Jurišić 0,6 0,3 0,3 0,7 0,5 0,3 0,4 0,1 0,3 1,0 0,5 0,5Hrvatska demokratska zajednica 1990 0,7 0,8 0,5 0,8 0,6 0,7 0,7 1,0 0,4 1,2 1,4 0,8Nezavisna demokratska stranka 0,0 0,1 0,1Narodna bošnjačka stranka 0,1 0,1 0,1Pokret mladih BiH 0,1 0,2 0,2HNZ-Hrvatska narodna zajednica 0,0 0,0 0,0BOSS-Bosanska stranka 0,4 0,3 0,2 0,7 0,1 0,3 0,1 0,5 0,1 0,7 0,6 0,4SDU BiH-Socijaldemokratska Unija Bosne i Hercegovine 0,1 0,0 0,0 0,3 0,3BPS-Sefer Halilović 0,9 1,4 0,3 0,9 2,0 0,6 0,9 0,9 1,5 2,5 0,5Some other 0,3 0,2 0,3 0,1 0,3 0,2 0,5 0,3Won't vote 16,1 14,6 17,5 18,4 11,0None of the above 34,3 25,5 8,6 34,3 24,8 8,6 34,3 26,1 8,5 35,4 25,9 8,7 32,4 24,6 9,0DK 11,8 10,4 8,4 10,9 7,8 8,6 12,7 12,8 8,2 14,2 13,3 7,8 8,4 6,1 9,8NA 9,5 8,1 20,3 8,2 8,2 18,5 10,7 8,0 22,0 9,0 5,7 14,0 9,8 11,8 31,1TOTAL 100,0 100,0 100,0 100,0 100,0 100,0 100,0 100,0 100,0 100,0 100,0 100,0 100,0 100,0 100,0Source: Public opinion polls conducted for EWS by Prism Research
Table VIII
To what extend to you support BiH joining the EU? (%)
All Bosniak majority areas Croat majority areas Serb majority areasMarch 08.June 08. Sept 08. Nov 08.March 08. June 08. Sept 08. Nov 08. March 08.June 08. Sept 08. Nov 08. March 08. June 08. Sept 08. Nov 08.
Strongly support 61,1 52,6 50,9 48,5 86,5 78,7 72,2 74,5 47,7 43,6 45,6 34,3 35,4 25,1 29,3 20,2Somewhat support 18,8 24,6 24,7 27,4 7,5 9,2 15,8 15,2 18,8 32,7 19,4 44,0 31,6 39,4 34,9 36,7Neither for nor against 11,3 12,9 14,4 13,8 3,2 4,2 7,6 6,0 19,5 16,8 27,4 13,3 18,4 22,0 18,3 24,1Somewhat against 2,7 2,3 2,5 1,9 0,1 1,0 0,4 3,7 1,4 1,4 1,9 5,6 5,1 4,7 4,0Strongly against 2,8 2,5 3,9 5,0 0,6 0,2 0,1 0,7 2,6 0,7 1,9 1,1 5,7 5,7 8,8 11,7DK/NA 3,3 5,1 3,6 3,4 2,3 7,5 3,3 3,1 7,7 4,8 4,2 5,4 3,2 2,7 4,0 3,3Total 100,0 100,0 100,0 100,0 100,0 100,0 100,0 100,0 100,0 100,0 100,0 100,0 100,0 100,0 100,0 100,0TOTAL FOR 79,9 77,2 75,6 75,9 94,0 87,9 88,0 89,7 66,5 76,4 65,0 78,3 67,1 64,5 64,2 56,9Neither for nor against 11,3 12,9 14,4 13,8 3,2 4,2 7,6 6,0 19,5 16,8 27,4 13,3 18,4 22,0 18,3 24,1TOTAL AGAINST 5,5 4,8 6,4 7,0 0,6 0,4 1,2 1,1 6,3 2,1 3,4 3,0 11,3 10,8 13,5 15,7DK/NA 3,3 5,1 3,6 3,4 2,3 7,5 3,3 3,1 7,7 4,8 4,2 5,4 3,2 2,7 4,0 3,3Total 100,0 100,0 100,0 100,0 100,0 100,0 100,0 100,0 100,0 100,0 100,0 100,0 100,0 100,0 100,0 100,0Source: Public opinion polls conducted for EWS by Prism Research
Annual Report 2008
5
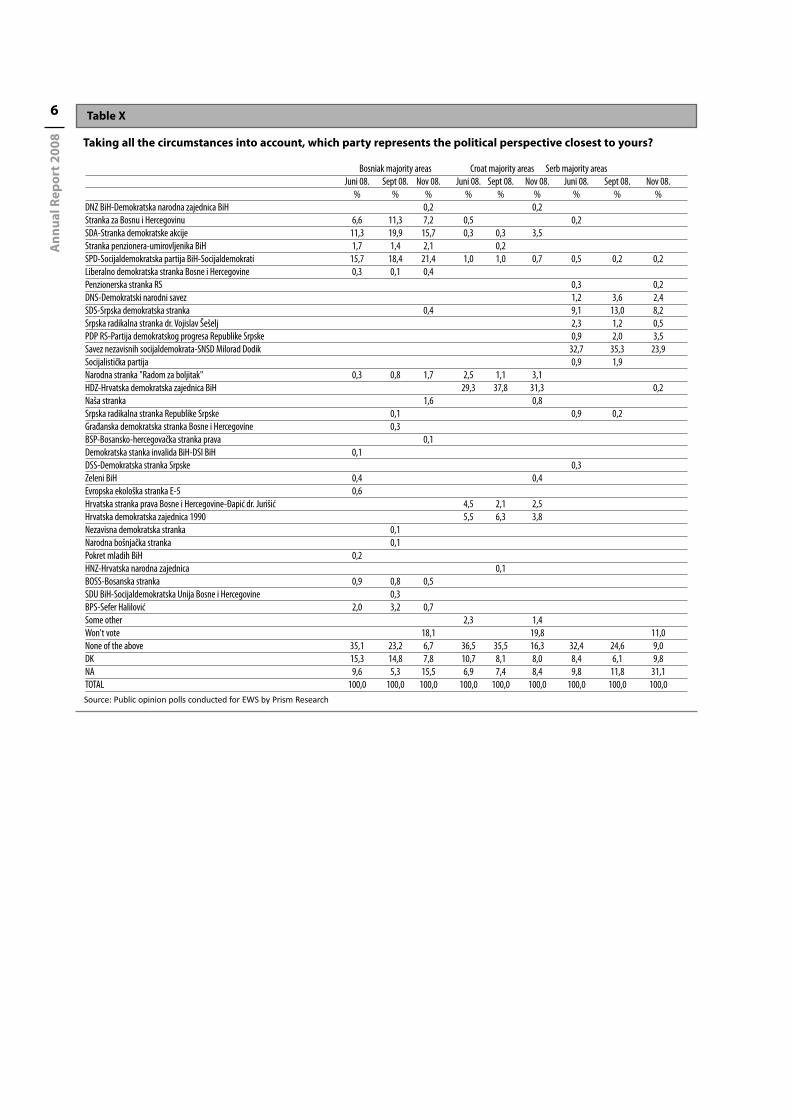
Table X
Taking all the circumstances into account, which party represents the political perspective closest to yours?
Bosniak majority areas Croat majority areas Serb majority areasJuni 08. Sept 08. Nov 08. Juni 08. Sept 08. Nov 08. Juni 08. Sept 08. Nov 08.
% % % % % % % % %DNZ BiH-Demokratska narodna zajednica BiH 0,2 0,2Stranka za Bosnu i Hercegovinu 6,6 11,3 7,2 0,5 0,2SDA-Stranka demokratske akcije 11,3 19,9 15,7 0,3 0,3 3,5Stranka penzionera-umirovljenika BiH 1,7 1,4 2,1 0,2SPD-Socijaldemokratska partija BiH-Socijaldemokrati 15,7 18,4 21,4 1,0 1,0 0,7 0,5 0,2 0,2Liberalno demokratska stranka Bosne i Hercegovine 0,3 0,1 0,4Penzionerska stranka RS 0,3 0,2DNS-Demokratski narodni savez 1,2 3,6 2,4SDS-Srpska demokratska stranka 0,4 9,1 13,0 8,2Srpska radikalna stranka dr. Vojislav Šešelj 2,3 1,2 0,5PDP RS-Partija demokratskog progresa Republike Srpske 0,9 2,0 3,5Savez nezavisnih socijaldemokrata-SNSD Milorad Dodik 32,7 35,3 23,9Socijalistička partija 0,9 1,9Narodna stranka "Radom za boljitak" 0,3 0,8 1,7 2,5 1,1 3,1HDZ-Hrvatska demokratska zajednica BiH 29,3 37,8 31,3 0,2Naša stranka 1,6 0,8Srpska radikalna stranka Republike Srpske 0,1 0,9 0,2Građanska demokratska stranka Bosne i Hercegovine 0,3BSP-Bosansko-hercegovačka stranka prava 0,1Demokratska stanka invalida BiH-DSI BiH 0,1DSS-Demokratska stranka Srpske 0,3Zeleni BiH 0,4 0,4Evropska ekološka stranka E-5 0,6Hrvatska stranka prava Bosne i Hercegovine-Ðapić dr. Jurišić 4,5 2,1 2,5Hrvatska demokratska zajednica 1990 5,5 6,3 3,8Nezavisna demokratska stranka 0,1Narodna bošnjačka stranka 0,1Pokret mladih BiH 0,2HNZ-Hrvatska narodna zajednica 0,1BOSS-Bosanska stranka 0,9 0,8 0,5SDU BiH-Socijaldemokratska Unija Bosne i Hercegovine 0,3BPS-Sefer Halilović 2,0 3,2 0,7Some other 2,3 1,4Won't vote 18,1 19,8 11,0None of the above 35,1 23,2 6,7 36,5 35,5 16,3 32,4 24,6 9,0DK 15,3 14,8 7,8 10,7 8,1 8,0 8,4 6,1 9,8NA 9,6 5,3 15,5 6,9 7,4 8,4 9,8 11,8 31,1TOTAL 100,0 100,0 100,0 100,0 100,0 100,0 100,0 100,0 100,0Source: Public opinion polls conducted for EWS by Prism Research
Ann
ual R
epor
t 200
8
6

Table XI
Do you agree with the following? (%)
Bosniak majority areas Croat majority areas Serb majority areasMarch 08. June 08. Sept 08. Nov 08. March 08. June 08. Sept 08. Nov 08. March 08. June 08. Sept 08. Nov 08.
The parties currently in government are fairly successful in defining and implementing key reformsStrongly agree 0,1 2,9 3,5 2,6 3,0 4,7 1,3 1,3 15,7 5,8 11,4 9,3Agree to some degree 9,1 12,4 6,7 2,7 13,3 8,5 7,0 9,8 25,5 28,0 28,9 33,1Neither agree nor disagree 21,2 15,0 19,9 18,9 39,5 30,5 42,5 36,4 29,9 36,3 28,7 30,1Disagree strongly 58,9 54,4 61,2 68,3 27,7 50,6 35,3 24,8 20,9 20,7 21,7 19,1DK/NA 10,6 15,2 8,7 7,5 16,4 5,6 14,0 27,7 8,0 9,1 9,4 8,3
Total 100,0 100,0 100,0 100,0 100,0 100,0 100,0 100,0 100,0 100,0 100,0 100,0TOTAL AGREE 9,3 15,3 10,2 5,3 16,4 13,2 8,3 11,1 41,2 33,9 40,3 42,4Neither agree nor disagree 21,2 15,0 19,9 18,9 39,5 30,5 42,5 36,4 29,9 36,3 28,7 30,1TOTAL DISAGREE 58,9 54,4 61,2 68,3 27,7 50,6 35,3 24,8 20,9 20,7 21,7 19,1DK/NA 10,6 15,2 8,7 7,5 16,4 5,6 14,0 27,7 8,0 9,1 9,4 8,3
Total 100,0 100,0 100,0 100,0 100,0 100,0 100,0 100,0 100,0 100,0 100,0 100,0The parties currently in govermment show sufficient responsibility to the public
Strongly agree 0,1 2,8 2,3 1,3 5,4 4,5 1,1 1,9 11,7 5,1 9,3 7,0Agree to some degree 8,7 6,0 5,9 3,3 10,8 4,7 6,8 8,1 23,2 18,2 22,3 22,8Neither agree nor disagree 21,1 12,3 22,3 20,3 39,8 31,1 38,4 34,5 29,0 31,6 29,1 31,7Disagree strongly 60,5 63,6 61,2 67,6 27,7 54,1 39,8 27,8 29,0 36,4 30,0 28,9DK/NA 9,6 15,2 8,3 7,5 16,4 5,6 14,0 27,7 7,1 8,8 9,4 9,5
Total 100,0 100,0 100,0 100,0 100,0 100,0 100,0 100,0 100,0 100,0 100,0 100,0TOTAL AGREE 8,8 8,8 8,2 4,6 16,1 9,2 7,8 9,9 34,9 23,3 31,5 29,8Neither agree nor disagree 21,1 12,3 22,3 20,3 39,8 31,1 38,4 34,5 29,0 31,6 29,1 31,7TOTAL DISAGREE 60,5 63,6 61,2 67,6 27,7 54,1 39,8 27,8 29,0 36,4 30,0 28,9DK/NA 9,6 15,2 8,3 7,5 16,4 5,6 14,0 27,7 7,1 8,8 9,4 9,5
Total 100,0 100,0 100,0 100,0 100,0 100,0 100,0 100,0 100,0 100,0 100,0 100,0The parties currently in government are capable of meeting the conditions for progress towards integration with Europe within a reasonable timeframe
Strongly agree 0,1 1,9 3,2 1,0 3,1 4,2 0,4 1,3 13,4 4,6 10,6 8,6Agree to some degree 7,5 9,5 5,6 3,2 12,9 5,0 5,0 8,7 22,2 24,6 25,3 24,7Neither agree nor disagree 23,3 17,7 20,3 21,2 39,4 35,9 41,3 35,1 33,4 38,5 30,4 36,7Disagree strongly 58,1 55,4 62,5 67,2 28,3 49,0 39,3 26,8 21,0 21,8 23,8 20,7DK/NA 10,9 15,5 8,4 7,5 16,4 5,9 14,0 28,0 9,9 10,5 10,0 9,4
Total 100,0 100,0 100,0 100,0 100,0 100,0 100,0 100,0 100,0 100,0 100,0 100,0TOTAL AGREE 7,7 11,4 8,7 4,1 16,0 9,2 5,4 10,1 35,6 29,1 35,9 33,2Neither agree nor disagree 23,3 17,7 20,3 21,2 39,4 35,9 41,3 35,1 33,4 38,5 30,4 36,7TOTAL DISAGREE 58,1 55,4 62,5 67,2 28,3 49,0 39,3 26,8 21,0 21,8 23,8 20,7DK/NA 10,9 15,5 8,4 7,5 16,4 5,9 14,0 28,0 9,9 10,5 10,0 9,4
Total 100,0 100,0 100,0 100,0 100,0 100,0 100,0 100,0 100,0 100,0 100,0 100,0The parties currently in government deserve to remain in power
Strongly agree 0,7 2,9 3,3 1,4 3,5 4,2 1,2 1,3 15,7 6,5 12,4 9,3Agree to some degree 6,5 7,1 4,3 1,4 11,7 4,6 5,4 9,4 20,6 22,0 21,3 25,9Neither agree nor disagree 22,6 15,5 22,8 20,1 36,4 35,4 39,0 34,4 32,6 39,0 31,6 35,8Disagree strongly 59,8 58,8 61,3 68,8 30,1 48,2 40,4 27,2 23,3 23,2 24,0 19,8DK/NA 10,4 15,7 8,2 8,3 18,3 7,6 14,0 27,7 7,9 9,3 10,7 9,3
Total 100,0 100,0 100,0 100,0 100,0 100,0 100,0 100,0 100,0 100,0 100,0 100,0TOTAL AGREE 7,2 10,0 7,6 2,8 15,3 8,8 6,6 10,7 36,2 28,5 33,7 35,2Neither agree nor disagree 22,6 15,5 22,8 20,1 36,4 35,4 39,0 34,4 32,6 39,0 31,6 35,8TOTAL DISAGREE 59,8 58,8 61,3 68,8 30,1 48,2 40,4 27,2 23,3 23,2 24,0 19,8DK/NA 10,4 15,7 8,2 8,3 18,3 7,6 14,0 27,7 7,9 9,3 10,7 9,3
Total 100,0 100,0 100,0 100,0 100,0 100,0 100,0 100,0 100,0 100,0 100,0 100,0Changing the composition of the government would help accelerate implementation of key reforms and economic recovery
Strongly agree 27,5 37,9 34,2 45,7 12,5 20,0 19,8 12,4 10,8 7,8 9,3 6,5Agree to some degree 27,2 15,5 21,4 14,1 20,1 20,3 15,8 14,3 15,6 14,7 15,9 15,0Neither agree nor disagree 21,3 13,2 18,4 15,9 40,6 36,7 35,5 33,4 36,6 38,4 40,6 41,8Disagree strongly 9,6 16,5 16,6 15,6 10,0 15,4 13,8 9,5 24,9 21,0 20,7 25,3DK/NA 14,4 16,8 9,3 8,6 16,8 7,5 15,2 30,4 12,1 18,1 13,5 11,4
Total 100,0 100,0 100,0 100,0 100,0 100,0 100,0 100,0 100,0 100,0 100,0 100,0TOTAL AGREE 54,7 53,4 55,6 59,8 32,7 40,3 35,5 26,7 26,4 22,5 25,1 21,5Neither agree nor disagree 21,3 13,2 18,4 15,9 40,6 36,7 35,5 33,4 36,6 38,4 40,6 41,8TOTAL DISAGREE 9,6 16,5 16,6 15,6 10,0 15,4 13,8 9,5 24,9 21,0 20,7 25,3DK/NA 14,4 16,8 9,3 8,6 16,8 7,5 15,2 30,4 12,1 18,1 13,5 11,4
Total 100,0 100,0 100,0 100,0 100,0 100,0 100,0 100,0 100,0 100,0 100,0 100,0Source: Public opinion polls conducted for EWS by Prism Research
Annual Report 2008
7

INSTITUTIONAL STABILITY IN BIH
Table Ia
Do you approve of the work of….? (%)Gender
All Male FemaleMarch 08. June 08. Sept 08. Nov 08. March 08. June 08. Sept 08. Nov 08. March 08. June 08. Sept 08. Nov 08.
BiH Presidency Yes 41,5 38,4 38,5 40,4 41,9 40,6 35,0 42,7 41,1 36,2 41,9 38,2No 34,9 39,8 39,7 39,1 36,8 42,0 45,1 36,7 33,1 37,7 34,5 41,4Not applicable 1,0 3,3 1,4 1,0 4,2 1,9 0,9 2,5 1,0Neither approve nor disapprove 14,2 9,5 12,1 8,4 13,4 8,1 9,7 8,9 15,0 11,0 14,3 8,0DK/NA 8,4 9,0 8,3 12,0 6,9 5,2 8,3 11,6 9,8 12,6 8,3 12,4
Total 100,0 100,0 100,0 100,0 100,0 100,0 100,0 100,0 100,0 100,0 100,0 100,0BiH Parliament
Yes 41,3 37,4 37,6 41,2 41,9 39,0 34,4 42,8 40,7 35,9 40,7 39,7No 35,0 41,1 40,0 38,1 36,5 44,2 45,2 36,4 33,5 38,1 35,1 39,7Not applicable 1,1 3,2 1,5 1,2 3,9 2,0 0,9 2,5 0,9Neither approve nor disapprove 14,1 9,2 11,8 8,5 13,0 7,7 9,4 8,8 15,1 10,7 14,2 8,2DK/NA 8,6 9,1 9,0 12,2 7,3 5,2 8,9 12,0 9,7 12,9 9,1 12,4
Total 100,0 100,0 100,0 100,0 100,0 100,0 100,0 100,0 100,0 100,0 100,0 100,0Council of Ministers
Yes 41,3 37,0 38,4 41,3 41,3 39,2 35,8 43,6 41,4 34,9 40,9 39,1No 34,7 41,3 39,9 38,2 36,8 44,1 44,4 36,0 32,7 38,6 35,6 40,3Not applicable 1,0 3,4 1,4 1,1 4,4 2,0 0,9 2,4 0,7Neither approve nor disapprove 14,4 9,2 11,7 8,5 13,5 7,2 9,3 8,7 15,3 11,2 14,0 8,2DK/NA 8,6 9,1 8,6 12,0 7,3 5,2 8,4 11,7 9,7 12,9 8,8 12,3
Total 100,0 100,0 100,0 100,0 100,0 100,0 100,0 100,0 100,0 100,0 100,0 100,0FBiH Parliament
Yes 40,5 35,3 37,3 37,8 40,7 37,2 33,5 39,8 40,3 33,5 41,0 35,9No 35,1 42,8 39,9 41,0 37,1 46,0 45,5 39,4 33,3 39,7 34,6 42,5Not applicable 1,4 3,1 2,0 1,3 4,0 2,5 1,5 2,3 1,5Neither approve nor disapprove 14,4 9,5 11,9 9,0 13,7 7,6 9,8 9,1 15,1 11,3 13,9 8,9DK/NA 8,5 9,3 9,0 12,2 7,2 5,3 8,8 11,7 9,8 13,2 9,1 12,7
Total 100,0 100,0 100,0 100,0 100,0 100,0 100,0 100,0 100,0 100,0 100,0 100,0FBiH Government
Yes 40,9 35,3 36,3 39,1 40,8 37,0 32,9 42,1 41,1 33,6 39,6 36,2No 34,7 42,5 40,8 40,2 37,2 45,4 46,3 37,6 32,2 39,7 35,5 42,6Not applicable 1,4 3,1 2,1 1,3 4,0 2,7 1,5 2,3 1,5Neither approve nor disapprove 14,2 9,8 11,6 8,7 13,4 8,4 9,3 8,8 15,1 11,2 13,9 8,7DK/NA 8,8 9,3 9,2 12,0 7,3 5,3 8,8 11,6 10,1 13,2 9,6 12,4
Total 100,0 100,0 100,0 100,0 100,0 100,0 100,0 100,0 100,0 100,0 100,0 100,0RS National Assembly
Yes 41,2 36,5 37,8 40,2 41,0 36,9 36,2 44,6 41,4 36,2 39,4 36,1No 36,3 41,3 38,7 39,7 39,3 45,3 41,8 35,0 33,4 37,4 35,7 44,1Not applicable 0,4 3,2 1,5 0,5 3,9 2,2 0,4 2,5 0,9Neither approve nor disapprove 12,6 9,8 11,3 8,2 11,2 8,1 9,4 9,7 13,8 11,3 13,1 6,8DK/NA 9,6 9,2 10,7 11,9 8,0 5,8 10,4 10,7 11,0 12,5 11,0 13,0
Total 100,0 100,0 100,0 100,0 100,0 100,0 100,0 100,0 100,0 100,0 100,0 100,0RS Government
Yes 41,4 37,1 38,1 40,3 42,1 37,7 36,5 44,5 40,7 36,5 39,6 36,3No 36,0 41,2 39,1 39,6 37,7 44,9 42,4 34,7 34,3 37,7 35,9 44,3Not applicable 0,3 3,1 1,6 0,3 3,7 2,4 0,4 2,5 0,9Neither approve nor disapprove 12,7 9,2 11,4 8,1 11,9 7,6 9,3 9,7 13,4 10,8 13,3 6,7DK/NA 9,6 9,3 9,9 11,9 7,9 6,0 9,3 11,1 11,3 12,5 10,4 12,7
Total 100,0 100,0 100,0 100,0 100,0 100,0 100,0 100,0 100,0 100,0 100,0 100,0Municipal authorities
Yes 53,4 47,2 46,5 55,5 53,2 51,0 43,5 59,0 53,6 43,6 49,4 52,2No 25,1 31,7 32,2 25,0 26,8 33,1 36,7 21,1 23,5 30,2 27,8 28,7Not applicable 0,3 3,0 1,6 0,5 3,9 2,4 0,1 2,2 0,9Neither approve nor disapprove 12,4 9,2 11,0 7,2 12,0 6,6 8,8 7,7 12,9 11,8 13,0 6,7DK/NA 8,8 8,9 8,7 12,3 7,6 5,4 8,6 12,2 9,9 12,2 8,9 12,4
Total 100,0 100,0 100,0 100,0 100,0 100,0 100,0 100,0 100,0 100,0 100,0 100,0
Source: Opinion poll conducted for the UNDP EWS project by Prism Research
Ann
ual R
epor
t 200
8
8

Table Ib
Do you approve of the work of….? (%)Gender
All Male FemaleMarch 08. June 08. Sept 08. Nov 08. March 08. June 08. Sept 08. Nov 08. March 08. June 08. Sept 08. Nov 08.
Cantonal Authorities Yes 39,4 29,5 34,6 38,6 40,0 31,1 31,8 42,0 38,8 27,9 37,3 35,4No 36,0 45,3 43,5 38,3 37,5 49,4 48,9 35,0 34,6 41,4 38,3 41,3Not applicable 0,6 3,7 1,2 0,7 5,8 1,8 0,5 1,6 0,7Neither approve nor disapprove 12,4 9,7 10,7 6,1 12,1 5,9 9,1 6,7 12,6 13,3 12,2 5,6DK/NA 11,6 11,8 10,0 17,0 9,7 7,8 8,4 16,3 13,4 15,7 11,5 17,7
Total 100,0 100,0 100,0 100,0 100,0 100,0 100,0 100,0 100,0 100,0 100,0 100,0OSCE
Yes 49,4 40,4 44,1 48,0 50,3 41,9 41,8 52,2 48,6 39,0 46,3 43,9No 24,7 33,4 32,4 26,3 25,5 36,1 36,3 24,3 23,9 30,8 28,7 28,1Not applicable 1,3 2,8 1,6 1,0 3,7 1,7 1,6 2,0 1,5Neither approve nor disapprove 11,9 11,0 11,2 10,4 11,8 10,0 9,4 9,8 12,0 11,9 13,0 11,0DK/NA 12,7 12,4 10,7 15,4 11,5 8,2 10,8 13,7 13,9 16,4 10,5 16,9
Total 100,0 100,0 100,0 100,0 100,0 100,0 100,0 100,0 100,0 100,0 100,0 100,0OHR
Yes 46,8 40,3 42,9 45,6 47,7 41,4 40,5 47,7 45,9 39,3 45,2 43,6No 26,5 33,1 33,4 29,6 27,1 36,3 37,2 28,9 26,0 30,0 29,8 30,4Not applicable 1,5 2,7 1,5 1,2 3,5 1,7 1,8 1,9 1,3Neither approve nor disapprove 13,0 11,7 11,2 11,2 12,4 10,9 9,8 10,4 13,6 12,5 12,5 11,9DK/NA 12,1 12,2 11,0 13,6 11,5 8,0 10,8 13,0 12,7 16,2 11,1 14,1
Total 100,0 100,0 100,0 100,0 100,0 100,0 100,0 100,0 100,0 100,0 100,0 100,0UNDP
Yes 48,5 42,4 43,8 50,5 48,2 44,6 41,9 55,0 48,7 40,3 45,7 46,2No 22,5 29,7 29,5 22,9 24,7 32,2 32,8 21,2 20,5 27,3 26,3 24,5Not applicable 1,4 3,0 1,5 1,5 3,4 1,7 1,3 2,7 1,4Neither approve nor disapprove 13,3 11,9 11,6 10,7 12,1 11,0 9,7 9,5 14,5 12,7 13,4 11,9DK/NA 14,3 13,0 13,5 15,9 13,5 8,8 13,9 14,3 15,0 17,1 13,2 17,4
Total 100,0 100,0 100,0 100,0 100,0 100,0 100,0 100,0 100,0 100,0 100,0 100,0EUFOR
Yes 46,1 39,9 42,1 47,2 46,6 42,3 39,9 49,8 45,5 37,6 44,2 44,7No 25,1 32,9 32,9 27,5 25,9 36,1 35,9 27,1 24,3 29,8 30,0 28,0Not applicable 1,4 2,9 1,4 1,5 3,4 1,7 1,3 2,4 1,1Neither approve nor disapprove 14,1 12,1 11,1 10,7 13,4 11,3 9,7 9,9 14,6 12,8 12,6 11,5DK/NA 13,4 12,3 12,5 14,6 12,6 6,9 12,8 13,3 14,1 17,4 12,1 15,9
Total 100,0 100,0 100,0 100,0 100,0 100,0 100,0 100,0 100,0 100,0 100,0 100,0EU
Yes 45,2 41,7 42,3 47,7 45,5 43,7 40,1 53,3 45,0 39,8 44,3 42,4No 23,0 29,6 29,4 24,5 24,9 33,2 33,1 22,5 21,3 26,1 25,9 26,5Not applicable 1,3 3,3 1,7 1,3 4,1 1,7 1,3 2,6 1,6Neither approve nor disapprove 14,2 11,8 11,6 10,4 13,6 10,4 10,0 9,5 14,8 13,1 13,2 11,2DK/NA 16,2 13,7 15,1 17,4 14,8 8,6 15,1 14,7 17,6 18,5 15,1 19,9
Total 100,0 100,0 100,0 100,0 100,0 100,0 100,0 100,0 100,0 100,0 100,0 100,0US
Yes 40,5 36,4 36,7 38,7 41,1 37,3 33,3 41,9 39,9 35,4 40,0 35,7No 30,6 36,2 37,1 35,2 32,2 40,8 41,4 35,2 29,1 31,9 33,1 35,1Not applicable 2,2 3,3 2,2 2,0 4,3 2,8 2,4 2,3 1,7Neither approve nor disapprove 13,2 11,5 11,5 11,2 11,9 9,6 9,8 9,7 14,4 13,3 13,1 12,8DK/NA 13,6 12,6 12,4 14,9 12,9 7,9 12,7 13,2 14,2 17,1 12,2 16,5
Total 100,0 100,0 100,0 100,0 100,0 100,0 100,0 100,0 100,0 100,0 100,0 100,0European Integration Directorate
Yes 45,6 41,7 42,1 47,7 46,1 44,5 40,0 53,2 45,0 39,0 44,1 42,5No 22,9 29,3 30,1 23,4 24,6 31,7 34,0 21,3 21,3 27,0 26,4 25,4Not applicable 1,1 2,9 1,6 1,1 3,4 1,7 1,2 2,3 1,5Neither approve nor disapprove 13,9 12,5 11,2 10,8 13,1 11,3 9,3 9,8 14,6 13,6 13,1 11,9DK/NA 16,5 13,7 14,9 18,0 15,1 9,0 15,0 15,7 17,9 18,2 14,8 20,2
Total 100,0 100,0 100,0 100,0 100,0 100,0 100,0 100,0 100,0 100,0 100,0 100,0
Source: Opinion poll conducted for the UNDP EWS project by Prism Research
Annual Report 2008
9

Table IIa
Do you approve of the work of….? (%)
Bosniak majority areas Croat majority areas Serb majority areasMarch 08. June 08. Sept 08. Nov 08. March 08. June 08. Sept 08. Nov 08. March 08. June 08. Sept 08. Nov 08.
BiH Presidency Yes 28,2 25,3 31,8 31,4 46,6 31,4 32,4 34,5 52,9 53,9 45,7 49,5No 47,8 49,4 50,7 52,1 21,7 48,3 33,4 22,6 26,0 27,3 30,3 30,8Not applicable 0,8 4,7 1,0 1,9 1,9 3,2 0,6 2,4 1,4Neither approve nor disapprove 11,7 7,2 8,7 5,0 17,6 13,6 18,2 16,7 16,6 10,8 14,6 10,6DK/NA 11,4 13,5 7,8 11,5 12,2 4,8 12,8 26,2 4,0 5,6 7,9 9,1
Total 100,0 100,0 100,0 100,0 100,0 100,0 100,0 100,0 100,0 100,0 100,0 100,0BiH Parliament
Yes 28,1 23,6 30,5 32,1 46,3 31,1 33,4 33,5 52,9 53,6 44,7 51,2No 47,6 51,3 50,7 51,7 22,2 50,1 33,6 23,7 25,9 27,6 31,2 28,3Not applicable 0,8 4,7 0,9 1,7 0,8 2,0 1,0 2,4 2,1Neither approve nor disapprove 11,8 6,9 8,8 4,4 17,2 13,1 17,5 17,4 16,2 10,6 14,1 11,1DK/NA 11,6 13,5 9,1 11,8 12,6 4,8 13,5 25,4 4,0 5,9 7,9 9,4
Total 100,0 100,0 100,0 100,0 100,0 100,0 100,0 100,0 100,0 100,0 100,0 100,0Council of Ministers
Yes 27,7 22,9 30,8 31,4 45,8 30,7 35,0 33,2 53,5 53,6 45,9 52,4No 47,5 50,9 51,8 52,5 22,6 51,8 32,0 23,8 25,2 28,0 30,1 27,4Not applicable 0,8 5,1 0,9 1,5 0,6 2,0 0,8 2,4 1,8Neither approve nor disapprove 12,3 7,5 8,8 4,3 17,5 12,4 17,5 18,2 16,4 10,1 13,8 11,1DK/NA 11,6 13,7 7,8 11,8 12,6 4,5 13,5 24,7 4,0 5,9 8,4 9,1
Total 100,0 100,0 100,0 100,0 100,0 100,0 100,0 100,0 100,0 100,0 100,0 100,0FBiH Parliament
Yes 28,0 23,1 31,5 28,9 45,7 30,4 33,9 31,8 50,9 49,1 42,6 47,8No 47,6 51,2 50,8 55,3 21,9 51,7 32,6 25,2 26,7 31,4 31,1 29,9Not applicable 0,8 4,6 0,9 1,4 2,2 2,0 2,6 3,3Neither approve nor disapprove 11,9 7,6 8,5 4,4 18,4 13,4 17,8 18,3 16,6 10,3 14,4 12,2DK/NA 11,6 13,5 8,4 11,4 12,6 4,5 13,5 24,7 3,9 6,6 8,6 10,1
Total 100,0 100,0 100,0 100,0 100,0 100,0 100,0 100,0 100,0 100,0 100,0 100,0FBiH Government
Yes 28,1 22,2 29,8 30,5 45,9 30,8 33,4 32,4 51,9 49,9 42,0 48,8No 47,9 51,2 53,1 54,2 22,2 52,0 33,1 25,0 25,0 30,6 30,6 29,2Not applicable 0,7 4,6 0,9 1,4 2,2 2,0 2,6 3,6Neither approve nor disapprove 11,5 8,5 8,2 3,9 17,9 12,7 17,8 19,0 16,8 10,3 14,2 12,0DK/NA 11,7 13,5 8,1 11,4 12,6 4,5 13,5 23,6 4,3 6,6 9,5 9,9
Total 100,0 100,0 100,0 100,0 100,0 100,0 100,0 100,0 100,0 100,0 100,0 100,0RS National Assembly
Yes 16,9 15,1 22,2 19,1 30,0 23,6 18,3 16,9 72,7 65,0 61,6 71,6No 57,4 57,4 56,9 62,4 36,5 56,0 38,3 38,1 12,4 17,8 17,1 12,8Not applicable 4,9 0,9 0,6 0,8 3,7 0,4 2,2 1,6Neither approve nor disapprove 12,2 8,5 7,5 4,6 17,9 13,7 23,7 20,8 11,2 9,7 12,3 9,2DK/NA 13,5 14,1 12,5 13,9 15,0 5,9 16,0 24,3 3,4 5,3 7,4 6,4
Total 100,0 100,0 100,0 100,0 100,0 100,0 100,0 100,0 100,0 100,0 100,0 100,0RS Government
Yes 17,1 15,3 23,2 18,9 29,5 24,4 16,9 17,3 73,3 65,8 61,6 71,9No 56,6 57,8 57,7 63,0 36,8 54,8 39,7 37,4 12,2 17,6 16,7 12,1Not applicable 4,9 0,9 0,6 0,8 3,7 0,2 2,0 1,9Neither approve nor disapprove 12,9 7,5 7,5 4,6 17,7 13,7 23,7 19,8 10,7 9,6 12,4 9,3DK/NA 13,5 14,4 10,7 13,4 15,4 6,2 16,0 25,5 3,5 5,0 7,4 6,7
Total 100,0 100,0 100,0 100,0 100,0 100,0 100,0 100,0 100,0 100,0 100,0 100,0Municipal authorities
Yes 40,3 31,7 37,9 47,1 48,7 42,5 34,1 35,6 69,8 65,5 58,6 69,0No 36,5 42,8 45,2 36,3 19,6 36,5 28,0 21,6 14,1 18,0 19,4 13,9Not applicable 4,5 1,0 1,0 0,6 2,6 0,2 2,3 2,1Neither approve nor disapprove 12,3 7,4 7,7 3,8 16,9 15,6 20,7 18,5 11,2 9,1 12,1 8,2DK/NA 10,9 13,6 8,2 12,8 13,7 4,8 14,7 24,4 4,7 5,1 7,8 8,8
Total 100,0 100,0 100,0 100,0 100,0 100,0 100,0 100,0 100,0 100,0 100,0 100,0
Source: Opinion poll conducted for the UNDP EWS project by Prism Research
Ann
ual R
epor
t 200
8
10

Table IIb
Do you approve of the work of….? (%)
Bosniak majority areas Croat majority areas Serb majority areasMarch 08. June 08. Sept 08. Nov 08. March 08. June 08. Sept 08. Nov 08. March 08. June 08. Sept 08. Nov 08.
Cantonal Authorities Yes 37,0 25,9 34,4 40,1 47,9 42,3 35,3 32,7No 40,8 47,8 47,8 42,2 19,4 36,6 28,1 23,0Not applicable 0,3 4,5 1,0 1,8 0,9 2,1Neither approve nor disapprove 10,7 8,0 8,2 3,2 18,1 15,7 19,6 17,4DK/NA 11,3 13,9 8,6 14,5 12,9 4,5 14,9 26,8
Total 100,0 100,0 100,0 100,0 100,0 100,0 100,0 100,0OSCE
Yes 52,2 36,3 49,7 54,7 49,1 45,7 32,5 38,2 44,1 41,3 39,8 39,8No 21,3 31,8 31,1 23,1 17,6 32,8 30,2 18,1 32,1 36,6 35,7 34,2Not applicable 1,9 5,6 1,3 1,7 0,4 2,3 0,6 0,6 1,6Neither approve nor disapprove 10,8 10,5 7,0 7,2 16,5 15,5 20,3 20,6 12,2 10,2 13,3 11,9DK/NA 13,8 15,8 10,9 15,0 15,2 5,5 14,7 23,1 11,0 11,3 9,7 14,1
Total 100,0 100,0 100,0 100,0 100,0 100,0 100,0 100,0 100,0 100,0 100,0 100,0OHR
Yes 55,4 38,6 51,4 56,5 48,0 46,1 31,5 35,0 34,2 38,3 35,2 32,5No 17,9 27,5 28,8 20,8 18,5 31,6 30,0 19,6 40,4 41,0 41,0 45,1Not applicable 1,9 5,4 1,3 2,5 0,6 2,2 0,6 0,4 1,4Neither approve nor disapprove 10,9 12,2 7,7 9,0 16,0 15,6 21,6 21,5 15,2 10,2 11,8 11,4DK/NA 13,8 16,3 10,8 13,7 15,0 6,1 14,7 23,8 9,6 10,0 10,6 11,0
Total 100,0 100,0 100,0 100,0 100,0 100,0 100,0 100,0 100,0 100,0 100,0 100,0UNDP
Yes 52,1 38,2 49,9 58,4 49,2 48,0 35,1 37,8 41,9 43,3 38,2 41,8No 17,2 27,6 26,1 17,9 16,1 28,4 26,3 17,8 31,9 33,5 35,4 31,9Not applicable 2,2 5,6 1,3 2,1 1,4 2,0 0,2 0,7 1,6Neither approve nor disapprove 11,7 12,1 7,4 7,4 17,0 15,9 21,4 19,0 14,6 10,5 13,3 12,9DK/NA 16,8 16,4 15,4 16,3 15,5 6,3 15,1 25,3 11,4 11,9 11,6 13,4
Total 100,0 100,0 100,0 100,0 100,0 100,0 100,0 100,0 100,0 100,0 100,0 100,0EUFOR
Yes 51,2 37,8 50,4 56,6 48,8 47,1 32,3 36,4 37,0 37,9 34,2 36,0No 19,8 27,8 27,9 20,5 15,3 30,3 29,8 18,8 35,4 40,6 40,8 40,3Not applicable 2,2 5,8 1,3 2,6 1,3 1,7 0,2 0,2 1,2Neither approve nor disapprove 12,0 12,2 7,2 7,5 17,4 15,5 21,6 20,9 16,0 11,1 12,2 12,1DK/NA 14,8 16,4 13,1 15,4 15,7 5,7 14,7 23,8 11,4 10,2 11,6 11,6
Total 100,0 100,0 100,0 100,0 100,0 100,0 100,0 100,0 100,0 100,0 100,0 100,0EU
Yes 47,9 37,3 46,7 53,8 49,4 47,0 35,9 37,1 38,5 43,0 37,6 40,6No 18,6 27,8 27,4 19,0 15,6 29,2 24,7 17,8 31,5 32,7 34,2 34,7Not applicable 2,2 6,2 1,4 1,8 1,6 2,0 0,2 0,7 1,8Neither approve nor disapprove 12,8 11,5 7,4 7,5 17,0 15,9 20,3 19,4 15,6 10,9 13,6 11,8DK/NA 18,5 17,1 17,1 19,8 16,1 6,3 17,1 25,7 14,2 12,8 12,9 12,9
Total 100,0 100,0 100,0 100,0 100,0 100,0 100,0 100,0 100,0 100,0 100,0 100,0US
Yes 44,6 33,6 42,7 46,7 45,3 48,7 32,2 34,4 31,6 33,3 29,4 27,2No 22,5 30,9 33,6 29,3 19,7 27,8 27,9 19,0 45,0 46,4 45,6 48,9Not applicable 4,1 7,0 2,9 1,5 0,5 1,4 0,2 0,2 1,6Neither approve nor disapprove 12,7 11,4 7,9 7,9 17,4 17,0 21,7 21,6 13,0 10,0 12,3 12,8DK/NA 16,1 17,1 12,9 16,1 16,1 6,0 16,8 25,0 10,2 10,1 11,1 11,1
Total 100,0 100,0 100,0 100,0 100,0 100,0 100,0 100,0 100,0 100,0 100,0 100,0European Integration Directorate
Yes 47,6 37,0 47,4 53,5 48,0 44,6 35,0 35,7 40,1 44,1 36,6 41,6No 19,6 28,3 27,4 18,9 16,6 31,4 24,7 17,7 29,7 30,6 36,1 31,8Not applicable 1,9 5,3 1,4 1,5 1,1 2,4 0,2 0,7 1,6Neither approve nor disapprove 12,7 11,9 7,0 7,5 17,5 17,2 20,7 20,8 14,8 11,9 13,0 12,5DK/NA 18,2 17,5 16,8 20,1 16,3 5,6 17,2 25,8 15,2 12,7 12,8 14,1
Total 100,0 100,0 100,0 100,0 100,0 100,0 100,0 100,0 100,0 100,0 100,0 100,0
Source: Opinion poll conducted for the UNDP EWS project by Prism Research
Annual Report 2008
11

Table IIIa
How well do you thing the following institutions do their jobs? (%)
All Bosniak majority area Croat majority areas Serb majority areasMarch 08.June 08. Sept 08. Nov 08.March 08. June 08. Sept 08. Nov 08. March 08.June 08. Sept 08. Nov 08. March 08. June 08. Sept 08. Nov 08.
Central Bank of BiHVery well 10,4 9,5 12,8 7,4 14,8 14,7 20,8 8,7 6,6 4,2 5,8 3,1 4,5 4,7 5,6 6,8Fairly well 37,8 38,3 37,6 33,1 37,4 39,2 32,9 25,2 32,1 44,1 34,7 26,8 39,8 35,7 43,1 42,7Fairly poorly 19,6 19,7 19,2 29,5 14,1 13,6 19,4 34,3 27,0 34,6 19,9 32,1 24,4 20,7 18,6 23,5Very poorly 5,5 6,6 7,2 9,8 6,1 5,0 4,9 12,1 7,2 7,3 9,8 6,7 4,1 8,4 9,0 8,5DK/NA 26,7 25,9 23,2 20,2 27,5 27,5 21,9 19,8 27,1 9,9 29,7 31,3 27,2 30,5 23,8 18,5
Total 100,0 100,0 100,0 100,0 100,0 100,0 100,0 100,0 100,0 100,0 100,0 100,0 100,0 100,0 100,0 100,0TOTAL GOOD 48,2 47,8 50,4 40,5 52,2 54,0 53,7 33,8 38,7 48,2 40,5 29,9 44,3 40,4 48,6 49,5TOTAL BAD 25,1 26,2 26,3 39,3 20,2 18,6 24,3 46,4 34,2 41,8 29,8 38,9 28,5 29,1 27,6 32,0DK/NA 26,7 25,9 23,2 20,2 27,5 27,5 21,9 19,8 27,1 9,9 29,7 31,3 27,2 30,5 23,8 18,5
Total 100,0 100,0 100,0 100,0 100,0 100,0 100,0 100,0 100,0 100,0 100,0 100,0 100,0 100,0 100,0 100,0Indirect Taxation Authority of BiH
Very well 5,4 7,0 7,2 6,6 6,1 12,0 10,0 8,5 2,5 1,8 3,7 2,4 3,9 3,3 5,6 4,8Fairly well 34,0 32,8 32,4 32,6 32,1 31,8 24,0 23,4 28,0 37,7 29,2 25,8 37,7 32,4 42,6 44,9Fairly poorly 28,0 26,6 29,2 28,8 24,7 23,5 35,0 33,1 34,9 38,6 26,2 32,1 30,3 24,7 22,3 23,1Very poorly 7,6 9,5 9,5 13,3 9,0 6,4 8,2 18,5 8,8 12,1 12,7 8,8 5,9 12,3 10,1 8,4DK/NA 25,0 24,1 21,7 18,7 28,1 26,3 22,7 16,6 25,7 9,8 28,2 30,9 22,2 27,2 19,4 18,7
Total 100,0 100,0 100,0 100,0 100,0 100,0 100,0 100,0 100,0 100,0 100,0 100,0 100,0 100,0 100,0 100,0TOTAL GOOD 39,4 39,8 39,6 39,3 38,2 43,8 34,0 31,9 30,5 39,5 32,9 28,2 41,6 35,7 48,2 49,7TOTAL BAD 35,6 36,1 38,7 42,0 33,7 29,9 43,2 51,6 43,8 50,6 38,9 40,8 36,1 37,0 32,4 31,5DK/NA 25,0 24,1 21,7 18,7 28,1 26,3 22,7 16,6 25,7 9,8 28,2 30,9 22,2 27,2 19,4 18,7
Total 100,0 100,0 100,0 100,0 100,0 100,0 100,0 100,0 100,0 100,0 100,0 100,0 100,0 100,0 100,0 100,0Entity Tax Authorities
Very well 5,4 6,7 5,7 3,5 6,1 11,4 6,7 3,1 3,1 1,3 3,3 3,0 4,1 3,4 5,6 2,9Fairly well 32,3 30,2 31,6 29,5 30,0 28,3 24,1 23,4 22,4 35,4 26,7 23,7 38,3 30,1 41,6 37,3Fairly poorly 30,8 28,1 30,1 31,8 27,7 24,7 35,9 34,4 39,2 38,9 27,7 31,5 31,0 27,4 23,8 29,8Very poorly 8,6 11,6 12,2 17,6 11,0 8,8 12,4 23,1 10,3 15,4 16,9 11,6 5,7 13,6 9,8 13,1DK/NA 23,0 23,5 20,4 17,6 25,2 26,8 21,0 16,0 25,1 9,0 25,5 30,2 20,9 25,5 19,2 16,9
Total 100,0 100,0 100,0 100,0 100,0 100,0 100,0 100,0 100,0 100,0 100,0 100,0 100,0 100,0 100,0 100,0TOTAL GOOD 37,7 36,9 37,3 33,0 36,1 39,7 30,8 26,5 25,5 36,7 30,0 26,7 42,4 33,5 47,2 40,2TOTAL BAD 39,4 39,6 42,3 49,4 38,6 33,5 48,2 57,5 49,4 54,3 44,5 43,1 36,7 41,0 33,6 42,9DK/NA 23,0 23,5 20,4 17,6 25,2 26,8 21,0 16,0 25,1 9,0 25,5 30,2 20,9 25,5 19,2 16,9
Total 100,0 100,0 100,0 100,0 100,0 100,0 100,0 100,0 100,0 100,0 100,0 100,0 100,0 100,0 100,0 100,0The Judicial System
Very well 4,3 5,7 5,1 5,3 3,7 9,5 6,6 6,1 3,0 1,6 2,5 2,3 4,2 2,9 4,5 4,1Fairly well 28,2 28,1 27,3 28,1 25,7 27,4 20,2 23,1 22,6 29,4 25,2 28,5 32,5 27,6 36,1 32,8Fairly poorly 29,9 30,8 35,1 25,4 26,6 26,1 39,8 27,1 34,1 41,0 24,5 26,1 32,2 32,3 32,8 23,6Very poorly 17,6 14,4 15,1 10,9 22,2 13,1 15,4 15,4 15,5 18,9 23,1 5,3 13,8 14,9 11,2 7,3DK/NA 20,0 20,9 17,4 30,2 21,9 23,9 18,0 28,3 24,7 9,0 24,6 37,8 17,3 22,2 15,4 32,2
Total 100,0 100,0 100,0 100,0 100,0 100,0 100,0 100,0 100,0 100,0 100,0 100,0 100,0 100,0 100,0 100,0TOTAL GOOD 32,5 33,9 32,4 33,4 29,4 36,9 26,8 29,2 25,6 31,0 27,7 30,8 36,7 30,5 40,6 36,9TOTAL BAD 47,5 45,2 50,2 36,3 48,7 39,2 55,2 42,5 49,6 60,0 47,7 31,4 46,0 47,2 44,1 30,9DK/NA 20,0 20,9 17,4 30,2 21,9 23,9 18,0 28,3 24,7 9,0 24,6 37,8 17,3 22,2 15,4 32,2
Total 100,0 100,0 100,0 100,0 100,0 100,0 100,0 100,0 100,0 100,0 100,0 100,0 100,0 100,0 100,0 100,0European Integration Directorate
Very well 4,3 6,6 5,1 4,4 5,3 10,8 7,9 5,1 3,3 0,8 2,9 2,5 2,3 3,9 3,1 3,0Fairly well 28,7 32,7 28,6 25,7 28,0 31,1 20,4 21,0 24,9 33,6 30,7 25,4 30,2 34,2 37,6 30,5Fairly poorly 27,7 24,3 30,2 24,7 25,2 23,0 35,7 25,5 33,7 40,3 22,9 24,0 28,5 19,3 25,3 24,2Very poorly 8,5 7,6 11,0 12,4 10,5 5,7 9,2 18,6 9,1 12,4 14,8 6,6 6,3 8,1 10,9 7,1DK/NA 30,8 28,7 25,1 32,8 31,0 29,3 26,9 29,9 29,0 12,9 28,8 41,5 32,7 34,6 23,2 35,3
Total 100,0 100,0 100,0 100,0 100,0 100,0 100,0 100,0 100,0 100,0 100,0 100,0 100,0 100,0 100,0 100,0TOTAL GOOD 33,0 39,3 33,7 30,0 33,3 42,0 28,3 26,0 28,2 34,4 33,5 27,9 32,5 38,0 40,6 33,4TOTAL BAD 36,2 32,0 41,2 37,2 35,8 28,7 44,8 44,0 42,8 52,6 37,7 30,5 34,7 27,4 36,2 31,3DK/NA 30,8 28,7 25,1 32,8 31,0 29,3 26,9 29,9 29,0 12,9 28,8 41,5 32,7 34,6 23,2 35,3
Total 100,0 100,0 100,0 100,0 100,0 100,0 100,0 100,0 100,0 100,0 100,0 100,0 100,0 100,0 100,0 100,0
Source: Opinion poll conducted for the UNDP EWS project by Prism Research
Ann
ual R
epor
t 200
8
12
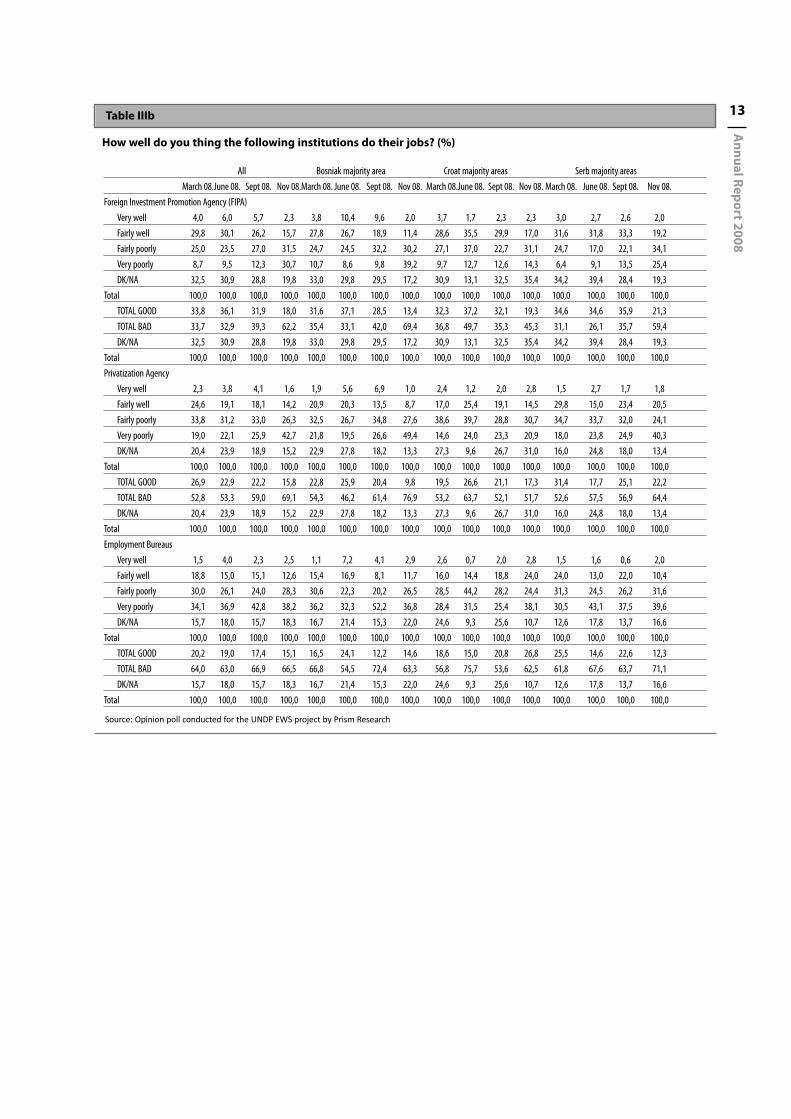
Table IIIb
How well do you thing the following institutions do their jobs? (%)
All Bosniak majority area Croat majority areas Serb majority areasMarch 08.June 08. Sept 08. Nov 08.March 08. June 08. Sept 08. Nov 08. March 08.June 08. Sept 08. Nov 08. March 08. June 08. Sept 08. Nov 08.
Foreign Investment Promotion Agency (FIPA)Very well 4,0 6,0 5,7 2,3 3,8 10,4 9,6 2,0 3,7 1,7 2,3 2,3 3,0 2,7 2,6 2,0Fairly well 29,8 30,1 26,2 15,7 27,8 26,7 18,9 11,4 28,6 35,5 29,9 17,0 31,6 31,8 33,3 19,2Fairly poorly 25,0 23,5 27,0 31,5 24,7 24,5 32,2 30,2 27,1 37,0 22,7 31,1 24,7 17,0 22,1 34,1Very poorly 8,7 9,5 12,3 30,7 10,7 8,6 9,8 39,2 9,7 12,7 12,6 14,3 6,4 9,1 13,5 25,4DK/NA 32,5 30,9 28,8 19,8 33,0 29,8 29,5 17,2 30,9 13,1 32,5 35,4 34,2 39,4 28,4 19,3
Total 100,0 100,0 100,0 100,0 100,0 100,0 100,0 100,0 100,0 100,0 100,0 100,0 100,0 100,0 100,0 100,0TOTAL GOOD 33,8 36,1 31,9 18,0 31,6 37,1 28,5 13,4 32,3 37,2 32,1 19,3 34,6 34,6 35,9 21,3TOTAL BAD 33,7 32,9 39,3 62,2 35,4 33,1 42,0 69,4 36,8 49,7 35,3 45,3 31,1 26,1 35,7 59,4DK/NA 32,5 30,9 28,8 19,8 33,0 29,8 29,5 17,2 30,9 13,1 32,5 35,4 34,2 39,4 28,4 19,3
Total 100,0 100,0 100,0 100,0 100,0 100,0 100,0 100,0 100,0 100,0 100,0 100,0 100,0 100,0 100,0 100,0Privatization Agency
Very well 2,3 3,8 4,1 1,6 1,9 5,6 6,9 1,0 2,4 1,2 2,0 2,8 1,5 2,7 1,7 1,8Fairly well 24,6 19,1 18,1 14,2 20,9 20,3 13,5 8,7 17,0 25,4 19,1 14,5 29,8 15,0 23,4 20,5Fairly poorly 33,8 31,2 33,0 26,3 32,5 26,7 34,8 27,6 38,6 39,7 28,8 30,7 34,7 33,7 32,0 24,1Very poorly 19,0 22,1 25,9 42,7 21,8 19,5 26,6 49,4 14,6 24,0 23,3 20,9 18,0 23,8 24,9 40,3DK/NA 20,4 23,9 18,9 15,2 22,9 27,8 18,2 13,3 27,3 9,6 26,7 31,0 16,0 24,8 18,0 13,4
Total 100,0 100,0 100,0 100,0 100,0 100,0 100,0 100,0 100,0 100,0 100,0 100,0 100,0 100,0 100,0 100,0TOTAL GOOD 26,9 22,9 22,2 15,8 22,8 25,9 20,4 9,8 19,5 26,6 21,1 17,3 31,4 17,7 25,1 22,2TOTAL BAD 52,8 53,3 59,0 69,1 54,3 46,2 61,4 76,9 53,2 63,7 52,1 51,7 52,6 57,5 56,9 64,4DK/NA 20,4 23,9 18,9 15,2 22,9 27,8 18,2 13,3 27,3 9,6 26,7 31,0 16,0 24,8 18,0 13,4
Total 100,0 100,0 100,0 100,0 100,0 100,0 100,0 100,0 100,0 100,0 100,0 100,0 100,0 100,0 100,0 100,0Employment Bureaus
Very well 1,5 4,0 2,3 2,5 1,1 7,2 4,1 2,9 2,6 0,7 2,0 2,8 1,5 1,6 0,6 2,0Fairly well 18,8 15,0 15,1 12,6 15,4 16,9 8,1 11,7 16,0 14,4 18,8 24,0 24,0 13,0 22,0 10,4Fairly poorly 30,0 26,1 24,0 28,3 30,6 22,3 20,2 26,5 28,5 44,2 28,2 24,4 31,3 24,5 26,2 31,6Very poorly 34,1 36,9 42,8 38,2 36,2 32,3 52,2 36,8 28,4 31,5 25,4 38,1 30,5 43,1 37,5 39,6DK/NA 15,7 18,0 15,7 18,3 16,7 21,4 15,3 22,0 24,6 9,3 25,6 10,7 12,6 17,8 13,7 16,6
Total 100,0 100,0 100,0 100,0 100,0 100,0 100,0 100,0 100,0 100,0 100,0 100,0 100,0 100,0 100,0 100,0TOTAL GOOD 20,2 19,0 17,4 15,1 16,5 24,1 12,2 14,6 18,6 15,0 20,8 26,8 25,5 14,6 22,6 12,3TOTAL BAD 64,0 63,0 66,9 66,5 66,8 54,5 72,4 63,3 56,8 75,7 53,6 62,5 61,8 67,6 63,7 71,1DK/NA 15,7 18,0 15,7 18,3 16,7 21,4 15,3 22,0 24,6 9,3 25,6 10,7 12,6 17,8 13,7 16,6
Total 100,0 100,0 100,0 100,0 100,0 100,0 100,0 100,0 100,0 100,0 100,0 100,0 100,0 100,0 100,0 100,0
Source: Opinion poll conducted for the UNDP EWS project by Prism Research
Annual Report 2008
13
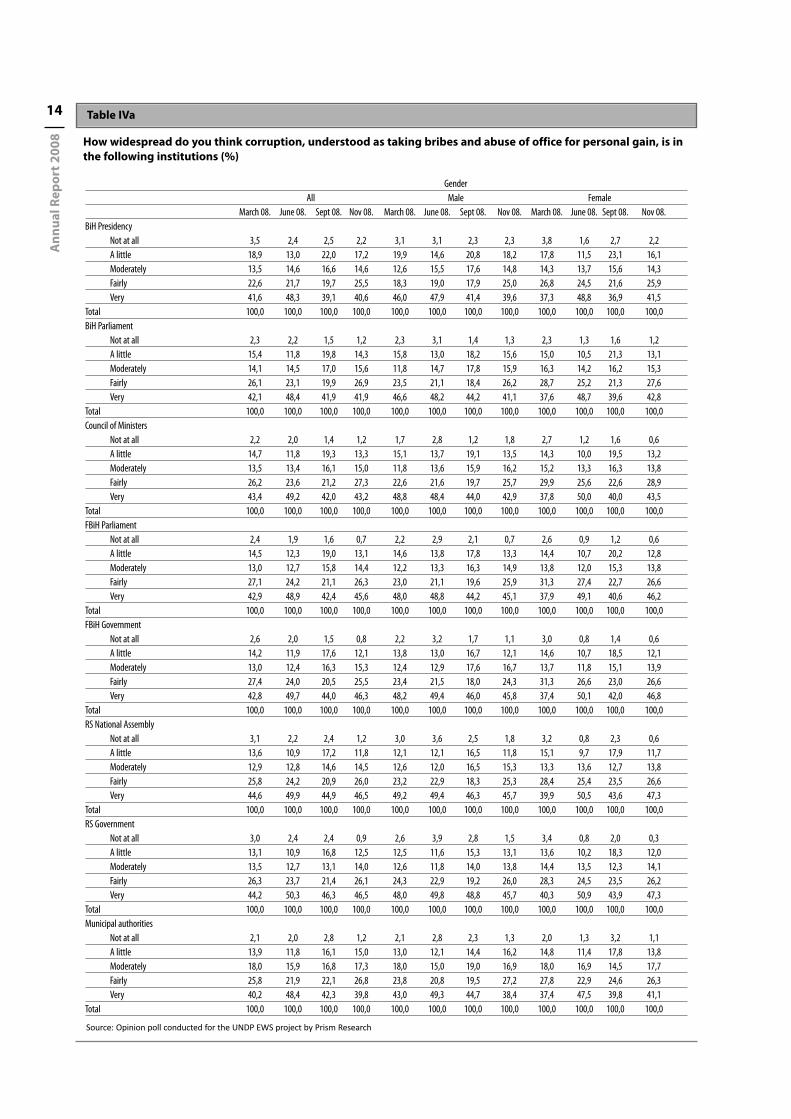
Table IVa
How widespread do you think corruption, understood as taking bribes and abuse of office for personal gain, is inthe following institutions (%)
GenderAll Male Female
March 08. June 08. Sept 08. Nov 08. March 08. June 08. Sept 08. Nov 08. March 08. June 08. Sept 08. Nov 08.BiH Presidency
Not at all 3,5 2,4 2,5 2,2 3,1 3,1 2,3 2,3 3,8 1,6 2,7 2,2A little 18,9 13,0 22,0 17,2 19,9 14,6 20,8 18,2 17,8 11,5 23,1 16,1Moderately 13,5 14,6 16,6 14,6 12,6 15,5 17,6 14,8 14,3 13,7 15,6 14,3Fairly 22,6 21,7 19,7 25,5 18,3 19,0 17,9 25,0 26,8 24,5 21,6 25,9Very 41,6 48,3 39,1 40,6 46,0 47,9 41,4 39,6 37,3 48,8 36,9 41,5
Total 100,0 100,0 100,0 100,0 100,0 100,0 100,0 100,0 100,0 100,0 100,0 100,0BiH Parliament
Not at all 2,3 2,2 1,5 1,2 2,3 3,1 1,4 1,3 2,3 1,3 1,6 1,2A little 15,4 11,8 19,8 14,3 15,8 13,0 18,2 15,6 15,0 10,5 21,3 13,1Moderately 14,1 14,5 17,0 15,6 11,8 14,7 17,8 15,9 16,3 14,2 16,2 15,3Fairly 26,1 23,1 19,9 26,9 23,5 21,1 18,4 26,2 28,7 25,2 21,3 27,6Very 42,1 48,4 41,9 41,9 46,6 48,2 44,2 41,1 37,6 48,7 39,6 42,8
Total 100,0 100,0 100,0 100,0 100,0 100,0 100,0 100,0 100,0 100,0 100,0 100,0Council of Ministers
Not at all 2,2 2,0 1,4 1,2 1,7 2,8 1,2 1,8 2,7 1,2 1,6 0,6A little 14,7 11,8 19,3 13,3 15,1 13,7 19,1 13,5 14,3 10,0 19,5 13,2Moderately 13,5 13,4 16,1 15,0 11,8 13,6 15,9 16,2 15,2 13,3 16,3 13,8Fairly 26,2 23,6 21,2 27,3 22,6 21,6 19,7 25,7 29,9 25,6 22,6 28,9Very 43,4 49,2 42,0 43,2 48,8 48,4 44,0 42,9 37,8 50,0 40,0 43,5
Total 100,0 100,0 100,0 100,0 100,0 100,0 100,0 100,0 100,0 100,0 100,0 100,0FBiH Parliament
Not at all 2,4 1,9 1,6 0,7 2,2 2,9 2,1 0,7 2,6 0,9 1,2 0,6A little 14,5 12,3 19,0 13,1 14,6 13,8 17,8 13,3 14,4 10,7 20,2 12,8Moderately 13,0 12,7 15,8 14,4 12,2 13,3 16,3 14,9 13,8 12,0 15,3 13,8Fairly 27,1 24,2 21,1 26,3 23,0 21,1 19,6 25,9 31,3 27,4 22,7 26,6Very 42,9 48,9 42,4 45,6 48,0 48,8 44,2 45,1 37,9 49,1 40,6 46,2
Total 100,0 100,0 100,0 100,0 100,0 100,0 100,0 100,0 100,0 100,0 100,0 100,0FBiH Government
Not at all 2,6 2,0 1,5 0,8 2,2 3,2 1,7 1,1 3,0 0,8 1,4 0,6A little 14,2 11,9 17,6 12,1 13,8 13,0 16,7 12,1 14,6 10,7 18,5 12,1Moderately 13,0 12,4 16,3 15,3 12,4 12,9 17,6 16,7 13,7 11,8 15,1 13,9Fairly 27,4 24,0 20,5 25,5 23,4 21,5 18,0 24,3 31,3 26,6 23,0 26,6Very 42,8 49,7 44,0 46,3 48,2 49,4 46,0 45,8 37,4 50,1 42,0 46,8
Total 100,0 100,0 100,0 100,0 100,0 100,0 100,0 100,0 100,0 100,0 100,0 100,0RS National Assembly
Not at all 3,1 2,2 2,4 1,2 3,0 3,6 2,5 1,8 3,2 0,8 2,3 0,6A little 13,6 10,9 17,2 11,8 12,1 12,1 16,5 11,8 15,1 9,7 17,9 11,7Moderately 12,9 12,8 14,6 14,5 12,6 12,0 16,5 15,3 13,3 13,6 12,7 13,8Fairly 25,8 24,2 20,9 26,0 23,2 22,9 18,3 25,3 28,4 25,4 23,5 26,6Very 44,6 49,9 44,9 46,5 49,2 49,4 46,3 45,7 39,9 50,5 43,6 47,3
Total 100,0 100,0 100,0 100,0 100,0 100,0 100,0 100,0 100,0 100,0 100,0 100,0RS Government
Not at all 3,0 2,4 2,4 0,9 2,6 3,9 2,8 1,5 3,4 0,8 2,0 0,3A little 13,1 10,9 16,8 12,5 12,5 11,6 15,3 13,1 13,6 10,2 18,3 12,0Moderately 13,5 12,7 13,1 14,0 12,6 11,8 14,0 13,8 14,4 13,5 12,3 14,1Fairly 26,3 23,7 21,4 26,1 24,3 22,9 19,2 26,0 28,3 24,5 23,5 26,2Very 44,2 50,3 46,3 46,5 48,0 49,8 48,8 45,7 40,3 50,9 43,9 47,3
Total 100,0 100,0 100,0 100,0 100,0 100,0 100,0 100,0 100,0 100,0 100,0 100,0Municipal authorities
Not at all 2,1 2,0 2,8 1,2 2,1 2,8 2,3 1,3 2,0 1,3 3,2 1,1A little 13,9 11,8 16,1 15,0 13,0 12,1 14,4 16,2 14,8 11,4 17,8 13,8Moderately 18,0 15,9 16,8 17,3 18,0 15,0 19,0 16,9 18,0 16,9 14,5 17,7Fairly 25,8 21,9 22,1 26,8 23,8 20,8 19,5 27,2 27,8 22,9 24,6 26,3Very 40,2 48,4 42,3 39,8 43,0 49,3 44,7 38,4 37,4 47,5 39,8 41,1
Total 100,0 100,0 100,0 100,0 100,0 100,0 100,0 100,0 100,0 100,0 100,0 100,0
Source: Opinion poll conducted for the UNDP EWS project by Prism Research
Ann
ual R
epor
t 200
8
14
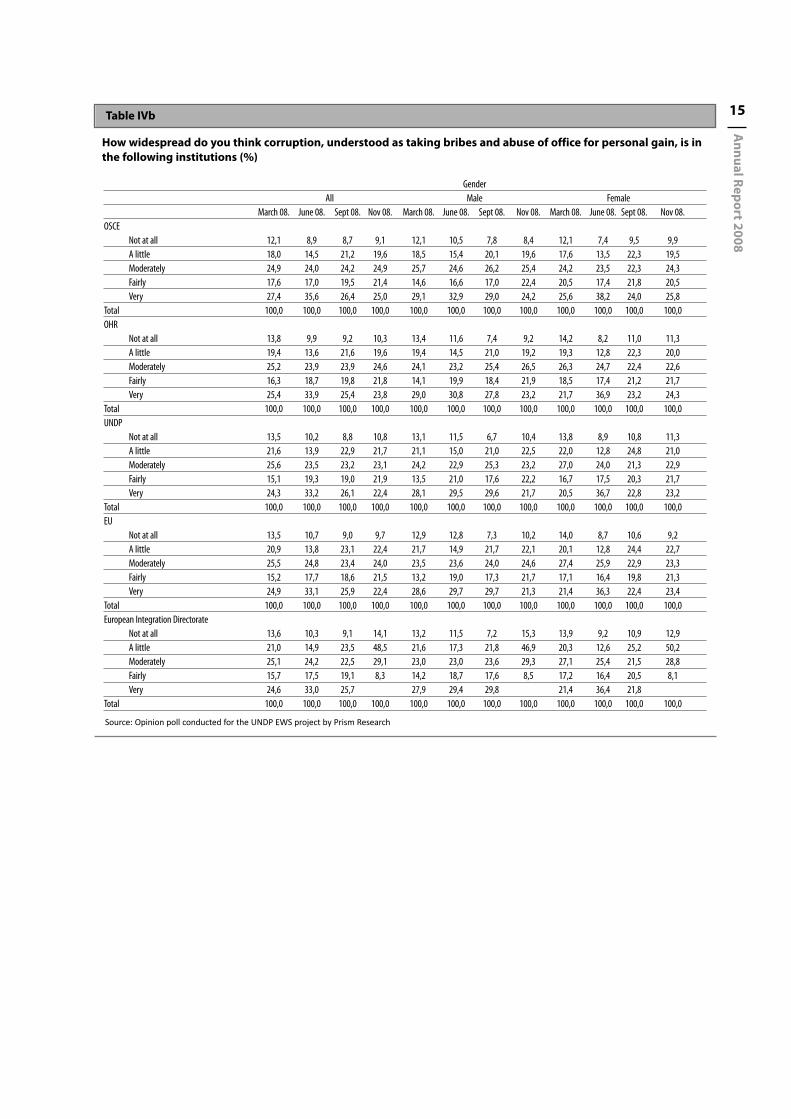
Table IVb
How widespread do you think corruption, understood as taking bribes and abuse of office for personal gain, is inthe following institutions (%)
GenderAll Male Female
March 08. June 08. Sept 08. Nov 08. March 08. June 08. Sept 08. Nov 08. March 08. June 08. Sept 08. Nov 08.OSCE
Not at all 12,1 8,9 8,7 9,1 12,1 10,5 7,8 8,4 12,1 7,4 9,5 9,9A little 18,0 14,5 21,2 19,6 18,5 15,4 20,1 19,6 17,6 13,5 22,3 19,5Moderately 24,9 24,0 24,2 24,9 25,7 24,6 26,2 25,4 24,2 23,5 22,3 24,3Fairly 17,6 17,0 19,5 21,4 14,6 16,6 17,0 22,4 20,5 17,4 21,8 20,5Very 27,4 35,6 26,4 25,0 29,1 32,9 29,0 24,2 25,6 38,2 24,0 25,8
Total 100,0 100,0 100,0 100,0 100,0 100,0 100,0 100,0 100,0 100,0 100,0 100,0OHR
Not at all 13,8 9,9 9,2 10,3 13,4 11,6 7,4 9,2 14,2 8,2 11,0 11,3A little 19,4 13,6 21,6 19,6 19,4 14,5 21,0 19,2 19,3 12,8 22,3 20,0Moderately 25,2 23,9 23,9 24,6 24,1 23,2 25,4 26,5 26,3 24,7 22,4 22,6Fairly 16,3 18,7 19,8 21,8 14,1 19,9 18,4 21,9 18,5 17,4 21,2 21,7Very 25,4 33,9 25,4 23,8 29,0 30,8 27,8 23,2 21,7 36,9 23,2 24,3
Total 100,0 100,0 100,0 100,0 100,0 100,0 100,0 100,0 100,0 100,0 100,0 100,0UNDP
Not at all 13,5 10,2 8,8 10,8 13,1 11,5 6,7 10,4 13,8 8,9 10,8 11,3A little 21,6 13,9 22,9 21,7 21,1 15,0 21,0 22,5 22,0 12,8 24,8 21,0Moderately 25,6 23,5 23,2 23,1 24,2 22,9 25,3 23,2 27,0 24,0 21,3 22,9Fairly 15,1 19,3 19,0 21,9 13,5 21,0 17,6 22,2 16,7 17,5 20,3 21,7Very 24,3 33,2 26,1 22,4 28,1 29,5 29,6 21,7 20,5 36,7 22,8 23,2
Total 100,0 100,0 100,0 100,0 100,0 100,0 100,0 100,0 100,0 100,0 100,0 100,0EU
Not at all 13,5 10,7 9,0 9,7 12,9 12,8 7,3 10,2 14,0 8,7 10,6 9,2A little 20,9 13,8 23,1 22,4 21,7 14,9 21,7 22,1 20,1 12,8 24,4 22,7Moderately 25,5 24,8 23,4 24,0 23,5 23,6 24,0 24,6 27,4 25,9 22,9 23,3Fairly 15,2 17,7 18,6 21,5 13,2 19,0 17,3 21,7 17,1 16,4 19,8 21,3Very 24,9 33,1 25,9 22,4 28,6 29,7 29,7 21,3 21,4 36,3 22,4 23,4
Total 100,0 100,0 100,0 100,0 100,0 100,0 100,0 100,0 100,0 100,0 100,0 100,0European Integration Directorate
Not at all 13,6 10,3 9,1 14,1 13,2 11,5 7,2 15,3 13,9 9,2 10,9 12,9A little 21,0 14,9 23,5 48,5 21,6 17,3 21,8 46,9 20,3 12,6 25,2 50,2Moderately 25,1 24,2 22,5 29,1 23,0 23,0 23,6 29,3 27,1 25,4 21,5 28,8Fairly 15,7 17,5 19,1 8,3 14,2 18,7 17,6 8,5 17,2 16,4 20,5 8,1Very 24,6 33,0 25,7 27,9 29,4 29,8 21,4 36,4 21,8
Total 100,0 100,0 100,0 100,0 100,0 100,0 100,0 100,0 100,0 100,0 100,0 100,0
Source: Opinion poll conducted for the UNDP EWS project by Prism Research
Annual Report 2008
15

Table Va
How widespread do you think corruption, understood as taking bribes and abuse of office for personal gain, is inthe following institutions (%)
Bosniak majority areas Croat majority areas Serb majority areasMarch 08. June 08. Sept 08. Nov 08. March 08. June 08. Sept 08. Nov 08. March 08. June 08. Sept 08. Nov 08.
BiH PresidencyNot at all 3,1 2,6 4,1 4,0 3,3 1,0 2,9 0,4 3,9 2,4 0,8 0,9A little 15,2 9,1 15,6 12,6 18,5 12,3 20,8 18,3 23,0 16,5 28,7 20,7Moderately 11,2 13,9 11,6 12,8 25,2 20,5 27,2 14,8 11,2 12,9 17,0 15,1Fairly 16,9 14,7 15,7 20,9 24,4 45,5 28,0 34,5 27,9 21,2 22,2 28,7Very 53,6 59,7 53,0 49,7 28,6 20,7 21,2 32,1 34,0 46,9 31,3 34,7
Total 100,0 100,0 100,0 100,0 100,0 100,0 100,0 100,0 100,0 100,0 100,0 100,0BiH Parliament
Not at all 0,8 2,6 2,2 1,8 2,4 1,3 1,3 1,1 3,7 2,0 0,8 0,7A little 8,6 7,2 12,9 9,3 17,8 9,8 17,2 16,3 22,4 17,0 27,9 19,2Moderately 11,0 12,3 11,8 13,4 26,8 21,8 30,7 16,2 11,7 13,2 16,4 15,6Fairly 23,2 17,8 16,4 22,6 24,5 46,3 24,2 35,6 29,6 21,1 22,8 29,9Very 56,4 60,2 56,8 52,8 28,4 20,8 26,6 30,7 32,6 46,6 32,1 34,7
Total 100,0 100,0 100,0 100,0 100,0 100,0 100,0 100,0 100,0 100,0 100,0 100,0Council of Ministers
Not at all 0,6 2,6 1,9 1,8 3,2 1,0 1,9 0,4 3,5 1,7 0,8 0,7A little 8,0 7,2 12,5 7,6 15,2 9,3 15,0 11,3 21,4 16,9 27,6 19,5Moderately 8,8 11,5 10,4 12,6 28,5 21,6 30,2 21,6 12,5 12,0 16,4 14,7Fairly 24,5 16,5 18,4 22,8 25,4 46,3 28,1 34,2 28,3 23,8 22,4 30,6Very 58,1 62,3 56,8 55,2 27,7 21,8 24,8 32,6 34,4 45,6 32,9 34,5
Total 100,0 100,0 100,0 100,0 100,0 100,0 100,0 100,0 100,0 100,0 100,0 100,0FBiH Parliament
Not at all 0,6 2,3 2,7 0,9 2,7 1,3 1,3 0,8 3,9 1,7 0,6 0,4A little 8,0 7,0 11,1 7,8 18,3 11,0 15,7 12,2 20,5 17,4 28,4 18,3Moderately 8,1 11,0 11,0 10,7 26,4 19,1 27,3 19,9 12,5 11,5 16,7 16,5Fairly 25,6 16,7 17,4 21,1 26,4 47,3 28,4 33,5 29,3 24,8 22,3 29,8Very 57,7 63,0 57,8 59,5 26,1 21,2 27,3 33,7 33,8 44,6 31,9 35,0
Total 100,0 100,0 100,0 100,0 100,0 100,0 100,0 100,0 100,0 100,0 100,0 100,0FBiH Government
Not at all 0,6 2,0 2,5 0,9 2,5 2,1 1,4 1,2 4,9 1,9 0,6 0,7A little 8,6 7,3 9,1 7,5 16,5 8,6 14,5 10,8 20,0 16,7 27,5 17,3Moderately 7,9 10,2 11,3 11,1 26,9 19,1 28,0 22,3 12,3 12,0 17,3 17,4Fairly 25,5 16,4 16,4 19,6 26,4 47,9 30,2 32,5 29,6 24,5 21,6 29,6Very 57,4 64,1 60,8 60,9 27,7 22,3 25,9 33,2 33,2 44,9 33,0 35,0
Total 100,0 100,0 100,0 100,0 100,0 100,0 100,0 100,0 100,0 100,0 100,0 100,0RS National Assembly
Not at all 0,6 2,5 2,3 0,5 2,4 1,0 1,4 0,8 5,7 2,3 3,0 2,2A little 5,5 5,7 5,1 6,6 13,7 5,9 14,2 6,3 22,7 17,9 30,3 19,3Moderately 6,7 9,9 11,6 9,9 24,5 17,5 21,8 16,5 14,5 14,2 14,9 17,5Fairly 23,2 15,4 18,0 18,4 25,1 50,1 31,3 34,9 28,7 25,0 20,6 31,3Very 64,1 66,5 63,0 64,6 34,3 25,6 31,4 41,5 28,4 40,6 31,3 29,7
Total 100,0 100,0 100,0 100,0 100,0 100,0 100,0 100,0 100,0 100,0 100,0 100,0RS Government
Not at all 0,6 2,5 1,9 0,5 2,3 0,5 1,4 0,8 5,5 2,9 3,3 1,5A little 5,0 5,8 5,1 7,2 12,3 5,3 13,7 6,8 22,3 17,9 29,5 20,2Moderately 6,5 9,6 9,1 9,6 24,3 20,7 23,9 15,1 16,1 13,2 13,7 16,8Fairly 23,2 15,2 19,1 18,6 26,5 48,7 29,6 34,3 29,2 24,7 21,1 32,0Very 64,6 66,9 64,8 64,1 34,6 24,8 31,4 43,0 26,9 41,3 32,5 29,5
Total 100,0 100,0 100,0 100,0 100,0 100,0 100,0 100,0 100,0 100,0 100,0 100,0Municipal authorities
Not at all 0,6 2,4 3,5 1,0 2,8 0,8 2,2 0,4 3,3 1,8 2,3 1,8A little 8,8 7,1 8,9 10,6 12,3 12,1 14,1 8,6 20,2 16,0 23,9 19,7Moderately 13,3 11,6 13,3 16,4 29,0 26,4 23,5 21,8 19,0 16,9 17,6 16,6Fairly 23,2 16,5 17,6 21,4 27,1 37,8 29,0 36,1 27,7 22,2 25,0 30,5Very 54,1 62,5 56,7 50,6 28,7 22,8 31,1 33,1 29,8 43,1 31,2 31,4
Total 100,0 100,0 100,0 100,0 100,0 100,0 100,0 100,0 100,0 100,0 100,0 100,0
Source: Public opinion polls conducted for UNDP EWS by PRISM Research
Ann
ual R
epor
t 200
8
16

Table Vb
How widespread do you think corruption, understood as taking bribes and abuse of office for personal gain, is inthe following institutions (%)
Bosniak majority areas Croat majority areas Serb majority areasMarch 08. June 08. Sept 08. Nov 08. March 08. June 08. Sept 08. Nov 08. March 08. June 08. Sept 08. Nov 08.
OSCENot at all 16,1 6,5 14,0 13,3 7,3 7,7 3,2 7,5 7,4 11,4 5,0 3,8A little 14,1 12,6 14,4 17,6 21,5 23,0 25,4 18,5 20,3 12,7 24,9 19,0Moderately 25,7 26,1 28,5 33,4 30,4 29,7 24,0 18,5 22,0 19,0 19,9 17,9Fairly 11,9 10,8 16,1 14,6 20,0 26,3 21,4 30,0 24,3 20,9 23,0 28,0Very 32,2 44,1 26,9 21,0 20,8 13,3 25,9 25,5 25,9 36,1 27,2 31,3
Total 100,0 100,0 100,0 100,0 100,0 100,0 100,0 100,0 100,0 100,0 100,0 100,0OHR
Not at all 17,5 7,3 14,9 15,1 9,9 8,1 3,8 8,9 9,0 13,1 5,2 4,3A little 15,9 12,7 16,2 19,4 24,9 21,8 25,5 17,1 20,7 10,6 23,9 17,5Moderately 27,2 25,1 27,5 32,2 26,7 30,4 22,5 16,2 22,4 19,2 20,6 19,6Fairly 10,3 14,2 17,5 15,0 19,9 27,4 22,5 32,7 22,9 20,7 22,3 27,6Very 29,0 40,7 24,0 18,4 18,6 12,3 25,7 25,2 25,2 36,4 27,9 31,1
Total 100,0 100,0 100,0 100,0 100,0 100,0 100,0 100,0 100,0 100,0 100,0 100,0UNDP
Not at all 16,8 7,2 13,2 15,9 9,6 8,6 4,7 8,2 9,0 13,7 5,6 4,9A little 19,6 12,0 18,2 21,2 24,5 22,7 27,8 20,3 22,3 11,8 24,1 20,0Moderately 26,2 23,6 28,0 30,6 28,1 31,7 22,8 15,1 24,0 19,4 18,4 17,8Fairly 8,6 16,7 15,4 15,7 19,4 25,8 21,3 32,2 21,9 20,0 22,8 27,1Very 28,8 40,6 25,2 16,6 18,5 11,2 23,3 24,2 22,9 35,1 29,2 30,2
Total 100,0 100,0 100,0 100,0 100,0 100,0 100,0 100,0 100,0 100,0 100,0 100,0EU
Not at all 16,8 8,6 14,2 12,7 10,4 6,1 4,8 8,8 8,7 14,3 5,1 6,0A little 19,2 11,4 16,4 23,0 20,7 24,3 29,9 20,2 22,3 11,7 25,5 21,0Moderately 25,9 26,4 29,6 32,3 30,5 32,9 21,3 14,5 23,3 19,1 17,8 18,0Fairly 8,5 13,2 15,2 15,9 19,5 24,8 21,0 31,4 22,3 20,3 22,1 25,1Very 29,6 40,5 24,7 16,1 18,9 11,9 23,1 25,2 23,4 34,6 29,5 29,9
Total 100,0 100,0 100,0 100,0 100,0 100,0 100,0 100,0 100,0 100,0 100,0 100,0European Integration Directorate
Not at all 16,8 7,8 14,6 15,7 10,4 6,5 4,8 15,8 9,0 14,0 5,1 7,3A little 19,2 12,6 17,5 44,5 23,6 25,0 30,1 36,4 21,5 13,0 25,3 58,1Moderately 25,8 26,0 27,3 30,3 27,9 31,5 22,0 42,9 23,3 18,7 17,8 26,2Fairly 8,2 13,0 15,7 9,5 19,9 24,8 21,1 4,8 23,7 20,2 22,9 8,4Very 29,9 40,6 24,9 18,2 12,2 22,1 22,6 34,1 29,0
Total 100,0 100,0 100,0 100,0 100,0 100,0 100,0 100,0 100,0 100,0 100,0 100,0
Source: Public opinion polls conducted for UNDP EWS by PRISM Research
Annual Report 2008
17

Table VI
How would you assess measures taken by the High Representative in the following areas? (%)
GenderAll Male Female
March 08. June 08. Sept 08. Nov 08. March 08. June 08. Sept 08. Nov 08. March 08. June 08. Sept 08. Nov 08.Political reforms
Very positive 10,1 8,7 4,7 4,9 12,3 9,8 5,5 4,1 8,0 7,7 3,9 5,7Generally positive 36,2 32,8 32,1 35,8 33,0 34,4 31,2 38,9 39,3 31,2 32,9 32,8Generally negative 24,6 29,1 29,5 28,9 28,0 31,2 30,9 26,5 21,4 27,1 28,2 31,1Very negative 15,0 13,0 16,9 11,8 15,9 14,6 17,2 13,0 14,1 11,5 16,7 10,5DK/NA 14,1 16,4 16,8 18,7 10,8 9,9 15,3 17,5 17,3 22,5 18,3 19,9
Total 100,0 100,0 100,0 100,0 100,0 100,0 100,0 100,0 100,0 100,0 100,0 100,0Political reforms
TOTAL POSITIVE 46,3 41,5 36,7 40,6 45,3 44,3 36,7 42,9 47,3 38,9 36,8 38,4TOTAL NEGATIVE 39,6 42,1 46,4 40,6 43,9 45,8 48,0 39,5 35,5 38,6 44,9 41,6DK/NA 14,1 16,4 16,8 18,7 10,8 9,9 15,3 17,5 17,3 22,5 18,3 19,9
Total 100,0 100,0 100,0 100,0 100,0 100,0 100,0 100,0 100,0 100,0 100,0 100,0Economic reforms
Very positive 9,9 7,9 4,5 4,1 11,3 9,0 4,8 3,5 8,5 6,9 4,2 4,7Generally positive 34,6 33,2 29,6 32,8 32,1 33,6 28,6 34,1 36,9 32,9 30,5 31,5Generally negative 27,5 30,7 32,8 31,8 31,3 34,2 34,4 30,6 23,9 27,3 31,4 32,8Very negative 13,7 12,0 16,9 12,3 14,7 13,2 17,5 13,8 12,7 10,8 16,4 10,8DK/NA 14,3 16,2 16,2 19,1 10,5 10,0 14,7 17,9 17,9 22,2 17,6 20,1
Total 100,0 100,0 100,0 100,0 100,0 100,0 100,0 100,0 100,0 100,0 100,0 100,0Economic reforms
TOTAL POSITIVE 44,5 41,2 34,0 36,9 43,4 42,6 33,4 37,6 45,5 39,8 34,7 36,2TOTAL NEGATIVE 41,2 42,6 49,8 44,0 46,0 47,5 51,9 44,5 36,6 38,0 47,8 43,7DK/NA 14,3 16,2 16,2 19,1 10,5 10,0 14,7 17,9 17,9 22,2 17,6 20,1
Total 100,0 100,0 100,0 100,0 100,0 100,0 100,0 100,0 100,0 100,0 100,0 100,0Anti-corruption
Very positive 10,1 8,2 4,8 4,1 11,9 8,9 5,1 4,3 8,3 7,4 4,4 4,0Generally positive 32,8 29,0 27,1 29,6 31,4 29,0 26,5 30,2 34,2 29,1 27,6 29,0Generally negative 26,4 31,5 33,0 29,0 27,9 34,8 34,6 29,4 25,1 28,3 31,4 28,5Very negative 17,1 15,7 19,9 19,0 18,4 17,8 19,6 18,6 15,9 13,8 20,1 19,2DK/NA 13,6 15,6 15,3 18,4 10,4 9,4 14,1 17,4 16,6 21,5 16,4 19,3
Total 100,0 100,0 100,0 100,0 100,0 100,0 100,0 100,0 100,0 100,0 100,0 100,0Anti-corruption
TOTAL POSITIVE 42,9 37,2 31,8 33,7 43,3 38,0 31,6 34,5 42,5 36,5 32,0 33,0TOTAL NEGATIVE 43,5 47,2 52,9 47,9 46,2 52,6 54,3 48,1 40,9 42,1 51,5 47,7DK/NA 13,6 15,6 15,3 18,4 10,4 9,4 14,1 17,4 16,6 21,5 16,4 19,3
Total 100,0 100,0 100,0 100,0 100,0 100,0 100,0 100,0 100,0 100,0 100,0 100,0Civil service reforms
Very positive 10,0 8,3 3,7 4,9 11,9 8,3 3,6 4,5 8,2 8,3 3,9 5,2Generally positive 36,7 36,2 32,9 36,9 35,0 38,3 31,1 36,8 38,3 34,2 34,7 36,9Generally negative 24,4 27,3 28,8 26,7 26,7 29,5 31,0 26,2 22,3 25,2 26,7 27,3Very negative 14,0 11,3 17,1 12,5 15,2 13,1 18,3 14,6 12,9 9,5 16,0 10,6DK/NA 14,9 16,9 17,5 19,0 11,3 10,8 16,1 17,9 18,3 22,8 18,7 20,0
Total 100,0 100,0 100,0 100,0 100,0 100,0 100,0 100,0 100,0 100,0 100,0 100,0Civil service reforms
TOTAL POSITIVE 46,7 44,5 36,7 41,7 46,9 46,6 34,7 41,3 46,6 42,5 38,6 42,2TOTAL NEGATIVE 38,4 38,6 45,9 39,3 41,8 42,6 49,2 40,8 35,2 34,8 42,7 37,9DK/NA 14,9 16,9 17,5 19,0 11,3 10,8 16,1 17,9 18,3 22,8 18,7 20,0
Total 100,0 100,0 100,0 100,0 100,0 100,0 100,0 100,0 100,0 100,0 100,0 100,0
Source: Opinion poll conducted for the UNDP EWS project by Prism Research
Ann
ual R
epor
t 200
8
18

Table VII
How would you assess measures taken by the High Representative in the following areas?
Bosniak majority areas Croat majority areas Serb majority areasMarch 08. June 08. Sept 08. Nov 08. March 08. June 08. Sept 08. Nov 08. March 08. June 08. Sept 08. Nov 08.
% % % % % % % % % % % %Political reforms
Very positive 18,5 16,4 9,2 8,2 7,7 0,7 3,4 1,7 3,2 1,1 0,6Generally positive 43,7 38,9 38,9 48,1 33,1 37,6 29,5 30,0 27,5 24,4 25,6 21,1Generally negative 17,0 16,6 24,3 22,2 20,2 37,4 33,1 28,7 36,1 40,6 31,9 37,4Very negative 7,3 8,2 12,4 8,4 11,5 13,2 14,0 5,0 23,5 17,3 23,7 18,4DK/NA 13,6 19,8 15,2 13,1 27,4 11,8 22,7 32,9 11,2 14,4 17,7 22,4
Total 100,0 100,0 100,0 100,0 100,0 100,0 100,0 100,0 100,0 100,0 100,0 100,0Political reforms
TOTAL POSITIVE 62,2 55,3 48,1 56,3 40,8 37,6 30,2 33,4 29,3 27,7 26,7 21,7TOTAL NEGATIVE 24,3 24,8 36,7 30,6 31,8 50,6 47,1 33,6 59,6 57,9 55,6 55,9DK/NA 13,6 19,8 15,2 13,1 27,4 11,8 22,7 32,9 11,2 14,4 17,7 22,4
Total 100,0 100,0 100,0 100,0 100,0 100,0 100,0 100,0 100,0 100,0 100,0 100,0Economic reforms
Very positive 17,5 14,6 8,9 6,7 6,9 0,7 3,0 2,5 3,3 0,9 0,9Generally positive 39,6 34,8 35,1 42,9 30,6 38,3 29,9 27,5 29,7 30,1 24,0 21,4Generally negative 20,7 22,1 28,1 27,0 24,5 34,6 33,5 30,0 37,0 39,3 36,6 37,8Very negative 8,4 8,6 12,7 9,3 10,0 15,3 14,6 6,6 19,9 13,4 22,0 17,9DK/NA 13,8 20,0 15,2 14,1 28,0 11,8 21,2 32,9 11,0 13,9 16,6 22,1
Total 100,0 100,0 100,0 100,0 100,0 100,0 100,0 100,0 100,0 100,0 100,0 100,0Economic reforms
TOTAL POSITIVE 57,1 49,4 44,1 49,6 37,5 38,3 30,6 30,5 32,2 33,3 24,8 22,3TOTAL NEGATIVE 29,1 30,6 40,8 36,3 34,5 49,9 48,1 36,6 56,8 52,8 58,6 55,7DK/NA 13,8 20,0 15,2 14,1 28,0 11,8 21,2 32,9 11,0 13,9 16,6 22,1
Total 100,0 100,0 100,0 100,0 100,0 100,0 100,0 100,0 100,0 100,0 100,0 100,0Anti-corruption
Very positive 17,6 14,9 6,8 6,7 8,2 1,5 2,8 2,6 3,6 3,7 0,9Generally positive 38,6 32,7 29,8 37,1 27,1 21,1 24,9 24,5 29,4 27,5 26,0 22,0Generally negative 19,5 21,5 34,2 27,2 21,0 42,8 30,6 25,2 34,6 39,3 30,9 31,9Very negative 10,8 11,3 14,0 15,9 16,2 25,7 24,0 15,0 23,6 16,5 24,4 23,5DK/NA 13,6 19,6 15,3 13,1 27,5 10,5 19,0 32,4 9,7 13,1 15,0 21,6
Total 100,0 100,0 100,0 100,0 100,0 100,0 100,0 100,0 100,0 100,0 100,0 100,0Anti-corruption
TOTAL POSITIVE 56,1 47,6 36,6 43,8 35,3 21,1 26,5 27,3 32,0 31,1 29,7 23,0TOTAL NEGATIVE 30,3 32,8 48,1 43,1 37,2 68,4 54,6 40,3 58,2 55,8 55,3 55,4DK/NA 13,6 19,6 15,3 13,1 27,5 10,5 19,0 32,4 9,7 13,1 15,0 21,6
Total 100,0 100,0 100,0 100,0 100,0 100,0 100,0 100,0 100,0 100,0 100,0 100,0Civil service reforms
Very positive 17,1 13,5 6,9 7,4 8,0 0,3 0,9 3,3 3,0 5,4 1,2 1,6Generally positive 42,1 40,3 37,5 49,0 27,8 34,0 27,2 24,5 33,4 32,7 31,1 26,4Generally negative 16,9 17,6 26,0 21,2 22,0 38,4 34,3 31,1 34,1 34,9 28,3 32,5Very negative 10,1 8,8 14,1 9,0 13,9 14,5 16,1 8,2 17,1 11,6 20,0 16,9DK/NA 13,8 19,8 15,4 13,4 28,2 12,9 21,6 32,9 12,4 15,5 19,4 22,7
Total 100,0 100,0 100,0 100,0 100,0 100,0 100,0 100,0 100,0 100,0 100,0 100,0Civil service reforms
TOTAL POSITIVE 59,2 53,8 44,5 56,4 35,8 34,3 28,0 27,8 36,4 38,1 32,3 28,0TOTAL NEGATIVE 26,9 26,4 40,1 30,2 36,0 52,9 50,4 39,3 51,2 46,5 48,3 49,4DK/NA 13,8 19,8 15,4 13,4 28,2 12,9 21,6 32,9 12,4 15,5 19,4 22,7
Total 100,0 100,0 100,0 100,0 100,0 100,0 100,0 100,0 100,0 100,0 100,0 100,0
Source: Opinion poll conducted for the UNDP EWS project by Prism Research
Annual Report 2008
19

Table VIII
In your view, should the High Representative’s powers be reduced, increased or stay the same? (%)
GenderAll Male Female
March 08. June 08. Sept 08. Nov 08. March 08. June 08. Sept 08. Nov 08. March 08. June 08. Sept 08. Nov 08.Reduced 38,3 43,5 43,9 37,6 41,3 42,9 45,7 39,6 35,5 44,2 42,2 35,7Increased 29,5 15,4 18,9 23,1 31,8 19,7 21,8 23,1 27,3 11,2 16,0 23,2Stay the same 21,8 30,8 26,7 30,7 19,5 30,2 24,7 30,5 24,1 31,3 28,6 30,9DK/NA 10,3 10,3 10,6 8,5 7,4 7,2 7,8 6,8 13,2 13,3 13,2 10,1Total 100,0 100,0 100,0 100,0 100,0 100,0 100,0 100,0 100,0 100,0 100,0 100,0Source: Opinion poll conducted for the UNDP EWS project by Prism Research
Table IX
In your view, should the High Representative’s powers be reduced, increased or stay the same? (%)
Bosniak majority areas Croat majority areas Serb majority areasMarch 08. June 08. Sept 08. Nov 08. March 08. June 08. Sept 08. Nov 08. March 08. June 08. Sept 08. Nov 08.
Reduced 13,9 23,3 22,6 10,9 29,0 40,2 42,2 28,9 71,2 69,9 69,9 71,6Increased 49,2 25,9 33,1 41,9 32,6 15,5 16,2 18,9 4,3 1,7 2,8 2,9Stay the same 24,2 33,8 29,7 40,0 22,7 39,8 36,1 31,9 18,3 23,5 20,0 19,1DK/NA 12,7 17,0 14,5 7,2 15,7 4,5 5,4 20,2 6,2 5,0 7,3 6,4Total 100,0 100,0 100,0 100,0 100,0 100,0 100,0 100,0 100,0 100,0 100,0 100,0Source: Opinion poll conducted for the UNDP EWS project by Prism Research
Ann
ual R
epor
t 200
8
20

ECONOMIC STABILITY
Table I
Index of the physical volume of industrial productionin BiH
VIII 2008 VIII 2008 I-VIII 2008VIII 2007 VIII 2007 I-VIII 2007
98,2 109,6 105,4100,2 109,4 107,8
Source: Opinion poll conducted for the UNDP EWS project by Prism Research
Table II
Total number of registered unemployed by entity
Jan-05 Jan-06 Mar-06 Jan-07 Mar-07 Apr-07 Jun-07 Aug-07 Sep-07 Jan-08 Mar-08 Aug-08 WomenFBiH 328.225 349.137 351.867 367.449 371.156 370.961 370.410 369.886 371.342 367.449 357.281 340809 173,837REPUBLIKA SRPSKA 144.823 142.754 145.331 146.180 146.517 144.306 140.189 136.520 134.197 136.108 138.497 133.827 64,069BiH 473.048 491.891 497.198 513.629 517.673 515.267 510.599 506.406 505.539 503.557 495.778 474636 237,906Source: Opinion poll conducted for the UNDP EWS project by Prism Research
Annual Report 2008
21
Economic Stability Index

Table III
Retail Price and Cost of Living Indices
VIII 2008 VIII 2008 I- VIII 2008VII 2008 VIII 2007 I- VIII 2007
FBiH 98.2 109.6 105.4RS 100.2 109.4 107.8
Sources: Entity Statistics Agencies websites
Table V
Balance of Trade of BIH
IX 2008 I – IX 2008 I – IX 2008I – IX 2007
Exports 617 5.147 + 16,7 %Imports 1,476 12,337 + 22,3 %Total volum 2,093 17,484 -Balance -859 -7,19 -Ratio -
41.80% 41.70%Source: BiH Statistics Agency, Priopćenje statistike vanjske trgovine, no. 9,Year IV, October 2008
Table IV
Month ReservesXII '03 2,781I '04 2,785XII '04 3,458I '05 3,451XII '05 4,196I '06 4,233XII '06 5,400I 2007 5,137II 5,519III 5,289IV 5,699V 5,751VI 5,899VII 6,203
Month ReservesVIII 6,298IX 6,475X 6,518XI 6413I 2008 6637V 6,480VI 6531VII 6699VIII 6805IX 6834X 6403XI 6228XII 6296
Table VI
Have your family's economic circumstances changed over the past year, and if so how?
BiH April 2006 Jun. 2006 Sept. 2006 Dec. 2006 April 2007 Sept. 2007 Nov. 2007 Mar. 2008 Jun. 2008 Sept. 2008 Nov. 2008% % % % % % % % % % %
Got better 9,2 10,8 11,4 15,3 14,1 18,1 12,5 13,5 14,0 15,5 10,8Stayed the same 55,1 54,1 57,6 61,4 61,0 55,8 47,7 51,5 51,5 57,1 53,8Got worse 35,1 34,7 30,7 23,1 23,1 24,0 38,9 34,3 33,7 27,0 34,5N.A. 0,6 0,4 0,4 0,1 1,8 2,2 1,0 0,7 0,7 0,3 1,0TOTAL 100,0 100,0 100,0 100,0 100,0 100,0 100,0 100,0 100,0 100,0 100,0
Table VII
Have your family's economic circumstances changed over the past year, and if so how? (%)
FBH April 2006 Jun. 2006 Sept. 2006 Dec. 2006 April 2007 Sept. 2007 Nov. 2007 Mar. 2008 Jun. 2008 Sept. 2008 Nov. 2008Better 11,6 13,0 11,5 17,0 14,6 15,0 12,1 12,2 16,3 14,6 10,2The same 52,7 53,7 59,5 59,2 63,7 58,3 44,2 49,2 52,1 56,8 51,9Worse 35,1 32,6 28,9 23,7 20,0 23,5 42,2 37,5 30,7 28,5 36,7N.A. 0,7 0,6 0,2 0,1 1,7 3,1 1,4 1,1 0,9 0,2 1,1Total 100,1 99,9 100,0 100,0 100,0 100,0 100,0 100,0 100,0 100,0 100,0RS April 2006 Jun. 2006 Sept. 2006 Dec. 2006 April 2007 Sept. 2007 Nov. 2007 Mar. 2008 Jun. 2008 Sept. 2008 Nov. 2008Better 5,9 7,1 11,3 13,2 13,3 22,3 13,4 15,6 11,2 17,5 9,4The same 58,9 54,6 54,5 64,6 56,8 52,2 53,2 54,8 51,4 59,7 58,2Worse 34,8 38,3 33,6 22,1 27,9 24,9 33,0 29,3 37,0 22,2 31,6N.A. 0,4 0,0 0,6 0,2 2,0 0,7 0,4 0,2 0,5 0,6 0,7Total 100,0 100,0 100,0 100,0 100,0 100,0 100,0 100,0 100,0 100,0 100,0DB April 2006 Jun. 2006 Sept. 2006 Dec. 2006 April 2007 Sept. 2007 Nov. 2007 Mar. 2008 Jun. 2008 Sept. 2008 Nov. 2008Better 5,8 21,9 9,6 8,8 15,3 22,4 3,9 9,7 6,6 17,5 43,8The same 52,2 54,4 64,3 62,9 65,5 52,5 38,1 49,9 37,8 59,7 28,0Worse 42,0 23,7 26,1 28,3 19,2 20,1 57,9 40,4 55,7 22,2 25,4N.A. 0,0 0,0 0,0 0,0 0,0 4,9 0,6 2,8Total 100,0 100,0 100,0 100,0 100,0 100,0 100,0 100,0 100,0 100,0 100,0Source: Opinion polls conducted for EWS by PRISM Research
Central Bank of BiH Foreign Reserves (millions of KM)
Ann
ual R
epor
t 200
8
22

Table X
Expect prices over the next six months to...I? (%)
Bosnia and Herzegovina Sep 2006 Dec 2006 April 2007 Sep 2007 Nov. 2007 Mar. 2008 Jun. 2008 Sept. 2008 Nov. 2008Fall significantly 1,1 0,8 0,2 0,5 1,4 0,7 0,6 2,2 0,6Fall modestly 3,9 6,0 2,0 3,6 5,4 4,0 1,8 7,6 8,1Rise modestly 37,8 42,3 37,8 37,1 22,3 35,2 29,7 33,4 36,5Rise significantly 16,9 20,5 22,4 50,6 65,2 48,6 51,4 38,4 38,4No Change 33,7 25,5 26,0 2,9 3,8 7,9 11,5 13,1 11,6N.A. 6,7 4,9 11,6 5,4 1,9 3,6 4,9 5,2 4,9Total fall 5,0 6,8 2,2 4,1 6,7 4,7 2,5 9,8 8,7Total rise 54,7 62,8 60,2 87,6 87,5 83,8 81,1 71,8 74,9No Change 33,7 25,5 26,0 2,9 3,8 7,9 11,5 13,1 11,6NZ/BO 6,7 4,9 11,6 5,4 1,9 3,6 4,9 5,2 4,9Total 100,0 100,0 100,0 100,0 100,0 100,0 100,0 100,0 100,0
Table VIII
Have your family's economic circumstances changed over the past year, and if so how? (%)
Bosniaks April 2006 Jun. 2006 Sept. 2006 Dec. 2006 April 2007 Sept. 2007 Nov. 2007 Mar. 2008 Jun. 2008 Sept. 2008 Nov. 2008Better 10.2 11.9 10.6 16.4 13.7 14.1 11.9 10.3 17.8 13.1 8.7The same 53.6 52.2 58.1 60.3 64.7 59.0 44.5 47.3 48.3 54.8 49.7Worse 35.5 35.3 31.1 23.2 19.5 24.5 41.7 41.5 33.0 32.1 40.5N.A. 0.8 0.6 0.2 0.1 2.2 2.4 1.9 0.9 0.9 1.1Total 100.0 100.0 100.0 100.0 100.0 100.0 100.0 100.0 100.0 100.0 100.0Croats April 2006 Jun. 2006 Sept. 2006 Dec. 2006 April 2007 Sept. 2007 Nov. 2007 Mar. 2008 Jun. 2008 Sept. 2008 Nov. 2008Better 16.7 16.7 14.6 18.7 18.1 18.3 12.7 18.6 11.0 19.9 16.3The same 49.6 59.1 64.2 55.6 60.3 55.9 43.4 56.1 65.5 63.7 60.8Worse 33.6 23.4 20.9 25.5 21.7 20.2 43.9 23.6 22.6 15.6 22.0N.A. 0.2 0.8 0.3 0.2 5.6 1.8 1.0 0.8 0.9Total 100.1 100.0 100.0 100.0 100.0 100.0 100.0 100.0 100.0 100.0 100.0Serbs April 2006 Jun. 2006 Sept. 2006 Dec. 2006 April 2007 Sept. 2007 Nov. 2007 Mar. 2008 Jun. 2008 Sept. 2008 Nov. 2008Better 5.9 7.1 11.3 13.2 13.3 22.3 13.4 15.6 11.2 17.5 9.4The same 58.9 54.6 54.5 64.6 56.8 52.2 53.2 54.8 51.4 59.7 58.2Worse 34.8 38.3 33.6 22.1 27.9 24.9 33.0 29.3 37.0 22.2 31.6N.A. 0.4 0.0 0.6 0.2 2.0 0.7 0.4 0.2 0.5 0.6 0.7Total 100.0 100.0 100.0 100.0 100.0 100.0 100.0 100.0 100.0 100.0 100.0Source: Opinion polls conducted for EWS by PRISM Research
Table IX
How do you expect your family finances to change over the next year? (%)
BiH April 2006 Jun. 2006 Sept. 2006 Dec. 2006 April 2007 Sept. 2007 Nov. 2007 Mar. 2008 Jun. 2008 Sept. 2008 Nov. 2008Get worse 18,8 23,4 20,4 15,9 12,2 18,0 35,2 20,2 22,5 16,1 24,5Stay the same 56,4 50,0 52,4 52,0 56,5 54,1 45,7 56,2 56,1 62,0 55,4Get better 20,8 21,1 23,4 29,4 24,3 21,5 14,4 20,0 17,2 17,2 15,0N.A. 4,1 5,5 3,8 2,7 7,0 6,4 4,7 3,6 4,3 4,7 5,1Total 100,0 100,0 100,0 100,0 100,0 100,0 100,0 100,0 100,0 100,0 100,0FBH Mar. 2006 Jun. 2006 Sept. 2006 Dec. 2006 April 2007 Sept. 2007 Nov. 2007 Mar. 2008 Jun. 2008 Sept. 2008 Nov. 2008Get worse 18,2 22,3 17,0 18,0 10,4 16,7 41,5 19,0 21,1 16,4 27,1Stay the same 59,1 49,1 55,1 51,8 59,3 54,1 42,2 59,9 56,6 66,2 58,6Get better 17,8 20,7 23,4 26,8 21,3 21,4 12,3 17,5 16,8 13,3 9,6N.A. 4,8 7,9 4,5 3,5 9,0 7,8 4,0 3,5 5,5 4,1 4,8Total 100,0 100,0 100,0 100,0 100,0 100,0 100,0 100,0 100,0 100,0 100,0RS Mar. 2006 Jun. 2006 Sept. 2006 Dec. 2006 April 2007 Sept. 2007 Nov. 2007 Mar. 2008 Jun. 2008 Sept. 2008 Nov. 2008Get worse 17,6 25,5 25,4 11,9 14,3 20,5 25,3 20,7 23,6 15,3 21,8Stay the same 53,3 50,9 48,6 52,5 52,5 52,4 50,9 51,0 55,5 55,0 52,2Get better 26,2 21,5 23,5 34,0 28,8 22,3 17,7 24,4 18,3 23,8 20,2N.A. 2,9 2,2 2,5 1,5 4,4 4,7 6,1 3,9 2,6 6,0 5,8Total 100,0 100,0 100,0 100,0 100,0 100,0 100,0 100,0 100,0 100,0 100,0DB Mar. 2006 Jun. 2006 Sept. 2006 Dec. 2006 April 2007 Sept. 2007 Nov. 2007 Mar. 2008 Jun. 2008 Sept. 2008 Nov. 2008Get worse 54,4 16,2 21,4 33,7 25,2 6,5 46,1 41,3 39,4 24,2 4,5Stay the same 37,7 57,5 50,4 48,9 52,3 86,0 46,0 50,7 51,1 75,8 31,2Get better 2,4 25,7 20,7 16,7 21,3 7,5 7,9 8,0 4,6 61,4N.A. 5,5 0,7 7,5 0,8 1,2 4,8 2,8Total 100,0 100,0 100,0 100,0 100,0 100,0 100,0 100,0 100,0 100,0 100,0Source: Opinion polls conducted for EWS by PRISM Research
Annual Report 2008
23

Table XI
Expect household income over the next six months to...? (%)
Bosnia and Herzegovina Sep 2006 Dec 2006 April 2007 Sep 2007 Nov. 2007 Mar. 2008 Jun. 2008 Sept. 2008 Nov. 2008Fall significantly 4.9 3.1 1.8 2.3 7.1 6.2 3.8 4.0Fall modestly 9.5 10.3 8.7 9.7 9.8 6.2 7.3 9.2 11.8Rise modestly 15.8 19.8 18.1 19.5 15.1 17.6 15.0 19.1 15.0Fall modestly 2.5 1.7 3.9 4.3 2.8 3.8 3.5 3.7 6.0No change 59.7 59.2 55.6 54.0 58.0 60.0 63.0 58.0 62.6DK/NA 7.5 6.0 12.0 10.3 7.3 6.2 7.3 6.0 4.6Total 100.0 100.0 100.0 100.0 100.0 100.0 100.0 100.0 100.0Total fall 14.4 13.3 10.4 12.0 16.9 12.4 11.1 13.2 11.8Total rise 18.3 21.5 22.0 23.8 17.9 21.4 18.5 22.8 20.9No change 59.7 59.2 55.6 54.0 58.0 60.0 63.0 58.0 62.6DK/NA 7.5 6.0 12.0 10.3 7.3 6.2 7.3 6.0 4.6Total 100.0 100.0 100.0 100.0 100.0 100.0 100.0 100.0 100.0FBiH Sep 2006 Dec 2006 April 2007 Sep 2007 Nov. 2007 Mar. 2008 Jun. 2008 Sept. 2008 Nov. 2008Fall significantly 5.9 3.2 2.4 2.2 8.3 5.8 2.8 4.4Fall modestly 8.5 12.3 8.6 9.5 10.7 5.2 5.6 9.0 14.2Rise modestly 15.0 18.0 16.0 18.8 13.1 16.6 12.5 16.6 12.2Fall modestly 2.8 1.0 4.2 4.2 3.2 3.8 4.2 4.4 6.1No change 60.2 58.0 52.9 50.2 56.6 61.1 66.7 58.7 62.8DK/NA 7.6 7.5 15.9 15.0 8.2 7.4 8.2 6.8 4.6Total 100.0 100.0 100.0 100.0 100.0 100.0 100.0 100.0 100.0Total fall 14.4 15.5 11.0 11.7 19.0 11.1 8.5 13.4 14.2Total rise 17.8 19.0 20.2 23.1 16.2 20.4 16.6 21.1 18.4No change 60.2 58.0 52.9 50.2 56.6 61.1 66.7 58.7 62.8DK/NA 7.6 7.5 15.9 15.0 8.2 7.4 8.2 6.8 4.6Total 100.0 100.0 100.0 100.0 100.0 100.0 100.0 100.0 100.0REPUBLIKA SRPSKA Sep 2006 Dec 2006 April 2007 Sep 2007 Nov. 2007 Mar. 2008 Jun. 2008 Sept. 2008 Nov. 2008Fall significantly 3.3 2.7 0.8 2.5 5.4 6.5 5.2 3.4Fall modestly 11.2 7.3 9.3 10.6 9.0 7.9 9.6 9.9 8.9Rise modestly 17.4 22.8 22.1 20.8 18.2 19.7 19.5 23.7 19.6Fall modestly 2.3 2.9 3.2 4.1 2.3 3.5 2.7 2.8 6.0No change 58.1 60.2 58.0 58.2 58.7 57.9 56.5 55.0 60.6DK/NA 7.6 4.1 6.6 3.8 6.3 4.5 6.4 5.2 4.9Total 100.0 100.0 100.0 100.0 100.0 100.0 100.0 100.0 100.0Total fall 14.6 10.0 10.1 13.1 14.4 14.4 14.8 13.3 8.9Total rise 19.8 25.7 25.2 24.9 20.5 23.2 22.2 26.5 25.6No change 58.1 60.2 58.0 58.2 58.7 57.9 56.5 55.0 60.6DK/NA 7.6 4.1 6.6 3.8 6.3 4.5 6.4 5.2 4.9Total 100.0 100.0 100.0 100.0 100.0 100.0 100.0 100.0 100.0BRČKO Sep 2006 Dec 2006 April 2007 Sep 2007 Nov. 2007 Mar. 2008 Jun. 2008 Sept. 2008 Nov. 2008Fall significantly 8.4 6.7 0.8 4.6 11.4 4.1 0.7Fall modestly 3.4 8.7 1.2 10.3 4.4 2.1Rise modestly 5.6 11.9 4.6 11.7 13.9 8.2 5.8Fall modestly 8.4 10.8 7.9 3.1 0.5 2.8No change 78.5 72.7 82.8 77.5 81.5 67.4 82.5 94.4 89.3DK/NA 4.2 3.4 3.9Total 100.0 100.0 100.0 100.0 100.0 100.0 100.0 100.0 100.0Total fall 11.8 15.4 0.8 4.6 12.6 14.4 5.1 2.1Total rise 5.6 11.9 13.0 22.5 13.9 16.1 3.1 0.5 8.6No change 78.5 72.7 82.8 77.5 81.5 67.4 82.5 94.4 89.3DK/NA 4.2 3.4 3.9Total 100.0 100.0 100.0 100.0 100.0 100.0 100.0 100.0 100.0Source: Opinion polls conducted for EWS by PRISM Research
Ann
ual R
epor
t 200
8
24

Table XII
Do you expect to be able to save money over the coming year?
BIH Sep 2006 Dec 2006 April 2007 Sep 2007 Nov. 2007 Mar. 2008 Jun. 2008 Sept. 2008 Nov. 2008% % % % % % % % %
Yes 9.1 15.0 11.5 13.6 12.1 11.8 9.6 8.0 6.6No 82.2 80.6 82.5 80.4 84.0 83.3 83.8 85.3 88.8DK 8.8 4.4 6.0 6.0 4.0 4.9 6.5 6.6 4.5Total 100.0 100.0 100.0 100.0 100.0 100.0 100.0 100.0 100.0FBIH Sep 2006 Dec 2006 April 2007 Sep 2007 Nov. 2007 Mar. 2008 Jun. 2008 Sept. 2008 Nov. 2008Yes 11.1 14.5 10.0 14.9 11.9 11.2 11.3 7.1 6.3No 78.3 80.0 82.5 78.2 82.7 85.6 81.2 85.0 88.2DK 10.6 5.5 7.5 6.9 5.3 3.2 7.5 7.9 5.5Total 100.0 100.0 100.0 100.0 100.0 100.0 100.0 100.0 100.0RS Sep 2006 Dec 2006 April 2007 Sep 2007 Nov. 2007 Mar. 2008 Jun. 2008 Sept. 2008 Nov. 2008Yes 5.8 16.5 14.3 12.4 12.8 12.7 6.9 9.7 7.5No 87.6 80.5 81.7 82.7 85.1 79.8 87.7 85.4 89.1DK 6.6 3.0 4.0 4.9 2.2 7.4 5.4 4.9 3.4Total 100.0 100.0 100.0 100.0 100.0 100.0 100.0 100.0 100.0DB Sep 2006 Dec 2006 April 2007 Sep 2007 Nov. 2007 Mar. 2008 Jun. 2008 Sept. 2008 Nov. 2008Yes 15.2 1.5 3.9 8.1 15.1 2.1 0.4No 84.8 96.9 96.6 100.0 96.1 87.8 82.7 94.7 99.6DK 1.6 3.4 4.1 2.2 3.3Total 100.0 100.0 100.0 100.0 100.0 100.0 100.0 100.0 100.0Source: Opinion polls conducted for EWS by PRISM Research
Table XIII
How much does the current institutional framework in BiH (how public administration is organized and functions)affect your activities with regard to ...?
BiH FBiH RS D BrckoJun. 08 Sept. '08 Nov. '08 Jun. 08 Sept. '08 Nov. '08 Jun. 08 Sept. '08 Nov. '08 Jun. 08 Sept. '08 Nov. '08
% % % % % % % % % % % %Money
More than it should 54.4 50.0 57.0 46.6 50.8 59.0 67.3 46.6 55.4 24.7 91.2 35.9Less than it might 22.3 29.0 25.0 25.8 28.4 20.1 16.2 30.9 29.8 37.5 8.8 64.1DK 23.4 21.0 18.0 27.5 20.7 20.8 16.5 22.5 14.8 37.8
Total 100.0 100.0 100.0 100.0 100.0 100.0 100.0 100.0 100.0 100.0 100.0 100.0Time More than it should 53.2 47.3 56.1 46.2 47.9 59.9 64.9 44.0 51.2 27.3 91.4 41.0
Less than it might 22.5 31.2 25.7 25.9 30.8 19.5 16.6 32.9 32.9 37.5 8.6 59.0DK 24.3 21.6 18.2 27.9 21.3 20.6 18.5 23.0 15.8 35.2
Annual Report 2008
25

Table XIV
How good do you think the following institutions are at their job? (%)
BiH FBiH RS D BrckoVI 08 IX '08 XI '08 VI 08 IX '08 XI '08 VI 08 IX '08 XI '08 VI 08 IX '08 XI '08
% % % % % % % % % % % %Central Bank of BiH
Good 47.8 50.4 40.5 52.7 50.8 33.0 40.4 48.6 49.5 53.5 73.2 75.1Bad 26.2 26.3 39.3 23.7 25.6 44.8 29.1 27.6 32.0 41.6 24.1 24.9DK 25.9 23.2 20.2 23.6 23.7 22.1 30.5 23.8 18.5 4.8 2.7
Indirect Taxation AuthorityGood 39.8 39.6 39.3 42.9 33.8 31.1 35.7 48.2 49.7 32.0 37.1 67.4Bad 36.1 38.7 42.0 34.5 42.3 49.4 37.0 32.4 31.5 63.1 60.1 32.6DK 24.1 21.7 18.7 22.7 24.0 19.5 27.2 19.4 18.7 4.8 2.7
Entity Tax AdministrationsBad 36.9 37.3 33.0 39.0 30.6 26.5 33.5 47.2 40.2 41.7 33.9 72.3DK 39.6 42.3 49.4 38.1 47.4 54.6 41.0 33.6 42.9 55.9 64.1 27.7Good 23.5 20.4 17.6 22.9 22.0 18.9 25.5 19.2 16.9 2.4 2.1
Judicial SystemDK 33.9 32.4 33.4 35.6 27.0 29.5 30.5 40.6 36.9 49.4 27.6 70.9Good 45.2 50.2 36.3 43.8 53.5 40.2 47.2 44.1 30.9 48.2 72.4 29.1Bad 20.9 17.4 30.2 20.6 19.5 30.2 22.2 15.4 32.2 2.4
Directorate for European IntegrationGood 39.3 33.7 30.0 40.3 29.5 26.4 38.0 40.6 33.4 36.6 20.3 62.1Bad 32.0 41.2 37.2 34.0 43.2 41.3 27.4 36.2 31.3 60.5 79.7 30.9DK 28.7 25.1 32.8 25.7 27.3 32.3 34.6 23.2 35.3 2.9 6.9
Foreign Investment Promotion AgencyBad 36.1 31.9 18.0 37.1 29.3 14.6 34.6 35.9 21.3 37.7 27.2 46.1DK 32.9 39.3 62.2 36.8 40.5 64.5 26.1 35.7 59.4 56.8 72.2 50.7Good 30.9 28.8 19.8 26.1 30.1 20.9 39.4 28.4 19.3 5.5 0.5 3.3
Privatisation AgencyDK 22.9 22.2 15.8 26.1 20.6 11.3 17.7 25.1 22.2 30.7 11.1 21.3Good 53.3 59.0 69.1 50.1 59.3 71.8 57.5 56.9 64.4 62.0 88.9 75.9Bad 23.9 18.9 15.2 23.8 20.1 16.9 24.8 18.0 13.4 7.3 2.8
Employment BureauxGood 19.0 17.4 15.1 22.1 14.1 17.1 14.6 22.6 12.3 16.0 10.4 12.2Bad 63.0 66.9 66.5 59.2 68.2 63.2 67.6 63.7 71.1 81.6 89.6 74.2DK 18.0 15.7 18.3 18.7 17.6 19.7 17.8 13.7 16.6 2.4 13.5
Source: public opinion polls conducted for UNDP EWS project by Prism Research
Table XV
To what extent do you use the following in dealing with various state, entity, cantonal, or municipal institutions? (%)
BiH FBiH RS D BrckoVI '08 IX '08 XI '08 VI '08 IX '08 XI '08 VI '08 IX '08 XI '08 VI '08 IX '08 XI '08
Informal connections and contactsVery much 23.5 20.2 12.9 23.3 21.4 11.9 23.2 17.9 13.6 31.1 27.9 23.2Not much 65.7 71.1 78.3 60.7 66.4 76.5 73.5 77.8 81.0 55.0 72.1 76.8DK 10.9 8.7 8.9 16.0 12.2 11.5 3.2 4.2 5.4 13.9
So-called informal rulesVery much 22.4 18.0 12.7 22.5 16.6 10.2 22.0 19.6 15.9 28.6 25.2 23.2Not much 66.2 72.6 77.8 61.0 70.3 77.3 74.2 75.8 78.6 57.5 74.8 76.8DK 11.4 9.4 9.5 16.4 13.0 12.5 3.8 4.6 5.5 13.9
Source: public opinion polls conducted for UNDP EWS project by Prism Research
Ann
ual R
epor
t 200
8
26

Annual Report 2008
27Table XVI
Can you estimate how much greater your and your family's costs are as a result of direct payments to governmentor official institutions in BiH, including organizations, government institutions, formal laws, rules, and theirimplementation (%)
Bosniaks Croats Serbs Distrikt BrckoJun. 2008 Sept. 2008 Nov. '08 Jun. 2008 Sept. 2008 Nov. '08 Jun. 2008 Sept. 2008 Nov. '08 Jun. 2008 Sept. 2008 Nov. '08
0 - 5% 8.3 8.6 8.4 11.4 8.5 14.4 12.9 12.5 14.8 36.9 30.2 7.85 - 10% 16.5 18.6 18.9 7.4 27.6 12.4 16.6 23.6 13.3 13.4 23.1 26.510 - 20% 21.6 22.5 22.2 18.1 14.4 16.5 15.3 13.3 18.5 16.0 19.3 56.620 - 30% 16.0 13.7 15.6 16.9 15.8 18.8 13.3 10.2 10.9 1.4 14.3 9.130 - 40% 2.2 5.2 6.9 13.0 10.9 14.2 4.7 4.2 5.0 9.9 3.840 - 50% 3.3 5.6 5.1 6.7 4.2 4.3 7.5 1.4 6.3 0.6> 50% 3.4 4.9 4.2 2.8 5.7 0.6 9.7 3.7 5.7 1.3 7.710-30 % 37.6 36.2 37.8 35.0 30.1 35.3 28.6 23.5 29.4 17.3 33.7 65.7DK 28.7 20.9 18.7 23.7 12.9 18.9 20.0 31.1 25.4 20.6 1.6TOTAL 100.0 100.0 100.0 100.0 100.0 100.0 100.0 100.0 100.0 100.0 100.0 100.0Source: Public opinion polls conducted for EWS by Prism Research
Table XVII
Can you estimate how much greater your total household costs are because of indirect costs associated in dealingwith official institutions (e.g. costs due to time spent on variosu procedures, ineffective implementation of the law,ineffective institutions)? (%)
Bosniaks Croats Serbs Distrikt BrckoJun. 2008 Sept. '08 Nov. '08 Jun. 2008 Sept. '08 Nov. '08 Jun. 2008 Sept. '08 Nov. '08 Jun. 2008 Sept. '08 Nov. '08
0 - 5% 8.2 10.0 15.0 11.2 7.9 16.8 16.9 13.8 18.2 42.1 19.9 31.65 - 10% 17.9 24.8 17.4 7.1 23.0 12.1 12.8 21.5 18.7 7.9 30.3 40.810 - 20% 16.0 25.9 19.6 16.3 15.9 19.2 12.8 16.6 14.1 16.9 22.9 21.020 - 30% 16.8 9.7 19.2 19.6 16.7 20.8 10.7 8.9 8.7 1.1 13.5 6.630 - 40% 2.1 1.9 12.6 11.3 12.1 3.5 7.9 4.140 - 50% 2.1 1.6 4.6 5.4 4.7 7.9 5.0 1.9 4.5 0.0 2.1> 50% 3.9 3.5 3.4 3.1 3.0 2.6 6.3 3.1 8.8 1.3 5.610-30 % 32.9 35.5 38.8 35.9 32.6 40.1 23.5 25.5 22.8 18.0 36.4 27.6DK 32.8 22.7 20.8 24.7 17.4 20.5 23.4 30.8 27.0 22.8 1.6TOTAL 100.0 100.0 100.0 100.0 100.0 100.0 100.0 100.0 100.0 100.0 100.0 100.0Source: Public opinion polls conducted for EWS by Prism Research
Table XVIII
Looking at the performance of government institutions over the past five years, do you think they have become significantly more efficient, somewhat more efficient, not changed, somewhat less efficient, or significantly lessefficient?
Bosniaks Croats Serbs Distrikt BrckoJun. 2008 Sept. '08 Nov. '08 Jun. 2008 Sept. '08 Nov. '08 Jun. 2008 Sept. '08 Nov. '08 Jun. 2008 Sept. '08 Nov. '08
% % % % % % % % % % % %Significantly more efficient 2.4 0.1 1.2 1.2 0.8 1.6 5.0 1.8 2.2 1.9Somewhat more efficient 19.2 14.1 18.6 16.5 8.8 14.2 33.3 29.5 37.9 9.0 42.6Unchanged 36.8 48.2 45.0 64.1 59.0 43.3 50.2 47.9 45.7 52.3 31.3Somewhat less efficient 17.5 18.4 26.4 9.7 12.0 18.0 6.3 8.5 6.8 30.2 24.1Significantly less efficient 6.7 5.4 3.2 3.1 2.2 1.5 1.2 0.9 1.5 6.3DK 17.4 13.9 5.7 6.6 16.9 22.1 7.3 8.2 6.2TOTAL 100 100.0 100.0 100 100.0 100.0 100 100.0 100.0 100 100.0Source: Public opinion polls conducted for EWS by Prism Research
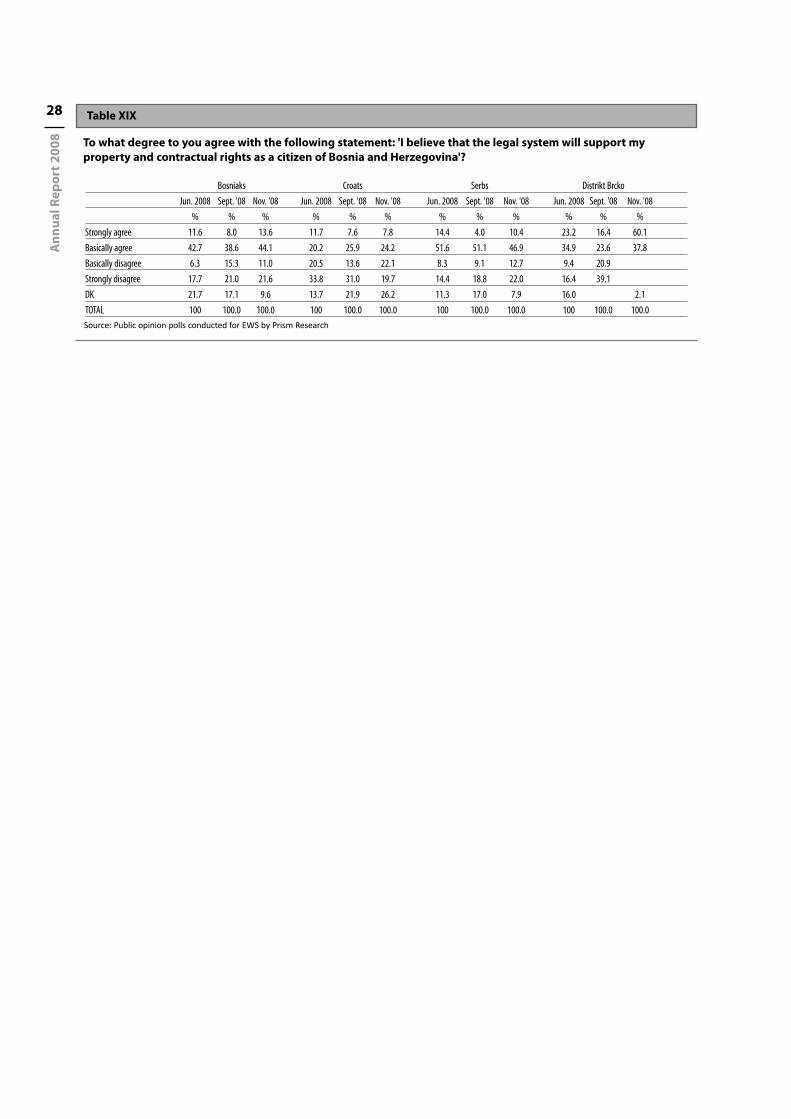
Ann
ual R
epor
t 200
8
28 Table XIX
To what degree to you agree with the following statement: 'I believe that the legal system will support myproperty and contractual rights as a citizen of Bosnia and Herzegovina'?
Bosniaks Croats Serbs Distrikt BrckoJun. 2008 Sept. '08 Nov. '08 Jun. 2008 Sept. '08 Nov. '08 Jun. 2008 Sept. '08 Nov. '08 Jun. 2008 Sept. '08 Nov. '08
% % % % % % % % % % % %Strongly agree 11.6 8.0 13.6 11.7 7.6 7.8 14.4 4.0 10.4 23.2 16.4 60.1Basically agree 42.7 38.6 44.1 20.2 25.9 24.2 51.6 51.1 46.9 34.9 23.6 37.8Basically disagree 6.3 15.3 11.0 20.5 13.6 22.1 8.3 9.1 12.7 9.4 20.9Strongly disagree 17.7 21.0 21.6 33.8 31.0 19.7 14.4 18.8 22.0 16.4 39.1DK 21.7 17.1 9.6 13.7 21.9 26.2 11.3 17.0 7.9 16.0 2.1TOTAL 100 100.0 100.0 100 100.0 100.0 100 100.0 100.0 100 100.0 100.0Source: Public opinion polls conducted for EWS by Prism Research

THE BUSINESS ENVIRONMENT
Table I
Compared to twelve months ago, the economicsituation in BiH now is …? (%)
Better The same WorseFeb-05 4 31 66Jun-05 4 39 57Sep-05 2 42 56Dec-05 5 51 44Mar-06 7 41 53Jun-06 7 39 54Sep-06 17 38 45Dec-06 13 40 47Apr-07 16 51 33Sep-07 22 34 43Dec-07 9 29 62Mar-08 12 35 53Aug-08 9 35 55Sep-08 12 35 53Dec-08 4 28 68Source: UNDP EWS BiH Top 150 Business to Business Survey, conducted byPrism Research
Table III
Exploitation of capacity (%)
Above At BelowBosnia and Herzegovina
Sep-05 2 42 56Dec-05 31 39 29Mar-06 5 51 43Jun-06 7 57 35Sep-06 7 47 46Dec-06 9 42 48Apr-07 6 49 45Sep-07 9 53 38Dec-07 8 42 51Mar-08 10 43 48Aug-08 10 43 47Sep-08 5 56 39Dec-08 2 53 45
FBiH Sep-05 3 46 51Dec-05 32 42 25Mar-06 4 50 45Jun-06 7 59 34Sep-06 8 49 43Dec-06 11 42 45Apr-07 6 51 43Sep-07 11 54 35Dec-07 8 47 45Mar-08 12 42 46Aug-08 10 46 44Sep-08 4 61 35Dec-08 1 53 46
RS Sep-05 - 35 65Dec-05 29 32 39Mar-06 7 54 39Jun-06 13 38 50Sep-06 - 38 62Dec-06 - 42 58Apr-07 6 44 50Sep-07 29 48 35Dec-07 6 24 71Mar-08 3 45 52Aug-08 10 21 47Sep-08 9 36 55Dec-08 0 58 42
Source: UNDP EWS BiH Top 150 Business to Business Survey, conducted byPrism Research
Table II
In your opinion, the economic situation in BiH in sixmonths time will be…? (%)
Better The same WorseFeb-05 12 46 42Jun-05 11 52 36Sep-05 8 48 44Dec-05 10 36 54Mar-06 15 52 33Jun-06 13 60 26Sep-06 16 62 21Dec-06 19 54 25Apr-07 21 55 23Sep-07 21 52 24Dec-07 18 29 62Mar-08 17 47 36Aug-08 15 58 26Sep-08 11 52 37Dec-08 3 35 62Source: UNDP EWS BiH Top 150 Business to Business Survey, conducted byPrism Research
Annual Report 2008
29

Table VI
How would you compare your company's level of debt to the same period last year?
Higher (%) The same (%) Less (%) N.A. (%)IV' 07 IX '07 XII '07 III '08 VIII '08 IX '08 XII '08 IV' 07 IX '07 XII '07 III '08VIII '08 IX '08 XII '08 IV' 07 IX '07 XII '07 III '08 VIII '08 IX '08 XII '08 IV' 07 IX '07 XII '07 III '08 VIII '08 IX '08 XII '08
BiH 28 23 39 26 23 34 37 46 35 34 46 47 42 35 25 31 25 27 20 24 28 1 11 1 1 10FBiH 29 24 42 27 25 31 35 42 31 34 43 47 43 38 28 33 24 28 20 26 27 1 12 0 1 9RS 22 19 29 24 17 41 42 62 48 35 52 48 41 33 17 23 29 24 21 18 25 0 10 6 14Source: UNDP EWS BiH Top 150 Business to Business Survey, conducted by Prism Research
Table VII
During the past six months, your company has made a...
Bosnia and Herzegovina Profit Loss(%) (%)
Sep-05 72 28Dec-05 65 33Mar-06 76 24Jun-06 77 23Sep-06 79 21Dec-06 81 19Apr-07 79 18Sep-07 79 16Dec-07 77 20Mar-08 78 18Aug-08 72 26Sep-08 63 26Dec-08 69 31
Better The same Worse
BiH
Sep-05 30 52 17
Dec-05 25 45 31
Mar-06 39 42 19
Jun-06 55 30 15
Sep-06 45 39 15
Dec-06 49 36 15
Apr-07 60 34 6
Sep-07 55 36 8
Dec-07 33 39 28
Mar-08 50 36 14
Aug-08 45 46 9
Sep-08 31 48 21
Dec-08 21 36 43
FBiH
Sep-05 28 57 16
Dec-05 25 42 33
Mar-06 39 40 21
Jun-06 53 32 15
Sep-06 40 44 17
Dec-06 43 40 17
Better The same Worse
Apr-07 55 41 4
Sep-07 54 38 7
Dec-07 27 47 26
Mar-08 49 32 18
Aug-08 46 46 9
Sep-08 31 47 22
Dec-08 18 36 46
RS
Sep-05 35 43 20
Dec-05 23 52 26
Mar-06 39 46 14
Jun-06 75 13 13
Sep-06 71 19 10
Dec-06 74 16 5
Apr-07 78 11 11
Sep-07 58 29 10
Dec-07 17 12 35
Mar-08 52 45 3
Aug-08 41 48 10
Sep-08 27 55 18
Dec-08 25 33 42
Table IV
With regard to your company’s overall operations, howwould you characterize your financial status comparedto the same period last year? (%)
Better The same WorseJun-05 23 43 34Sep-05 20 49 31Dec-05 31 39 29Mar-06 19 43 38Jun-06 35 34 28Sep-06 36 38 26Dec-06 38 36 26Apr-07 43 36 21Sep-07 62 24 14Dec-07 46 34 20Mar-08 50 32 17Aug-08 35 41 24Sep-08 28 46 26Dec-08 27 44 29Source: UNDP EWS BiH Top 150 Business to Business Survey, conducted byPrism Research
Table V
You expect that your company's financial results in thenext six months time will be… (%)
Ann
ual R
epor
t 200
8
30
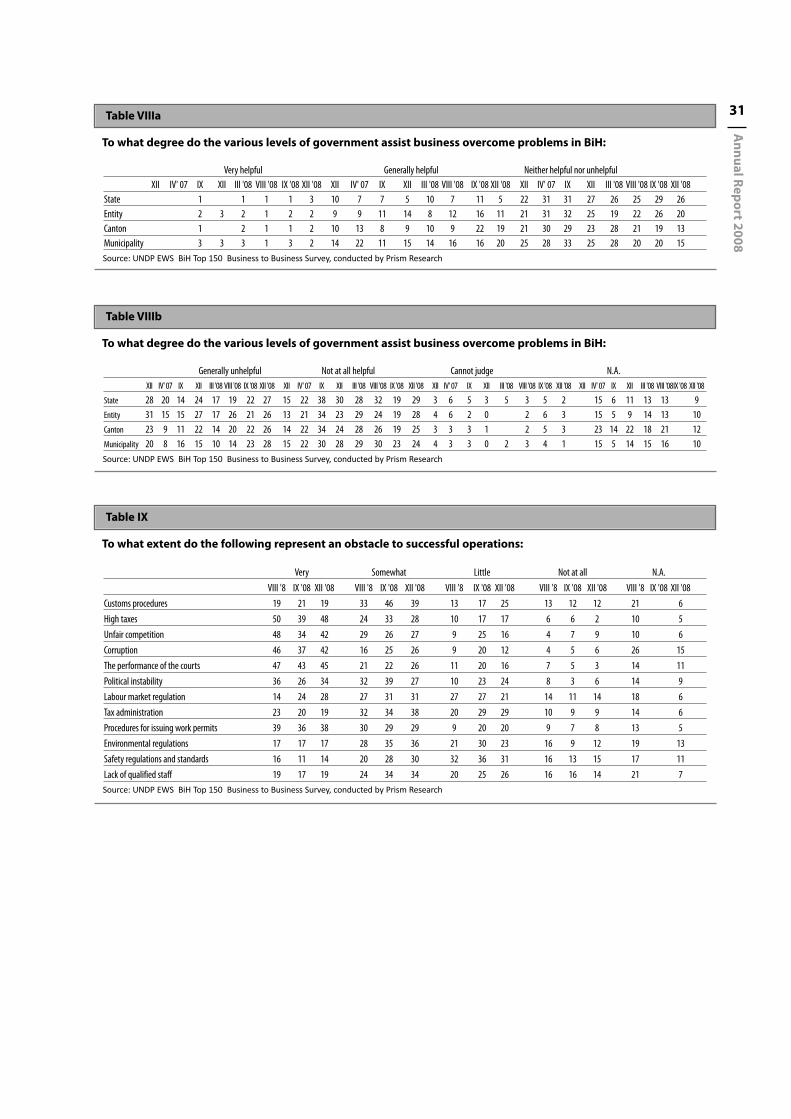
Table VIIIa
To what degree do the various levels of government assist business overcome problems in BiH:
Very helpful Generally helpful Neither helpful nor unhelpfulXII IV' 07 IX XII III '08 VIII '08 IX '08 XII '08 XII IV' 07 IX XII III '08 VIII '08 IX '08 XII '08 XII IV' 07 IX XII III '08 VIII '08 IX '08 XII '08
State 1 1 1 1 3 10 7 7 5 10 7 11 5 22 31 31 27 26 25 29 26Entity 2 3 2 1 2 2 9 9 11 14 8 12 16 11 21 31 32 25 19 22 26 20Canton 1 2 1 1 2 10 13 8 9 10 9 22 19 21 30 29 23 28 21 19 13Municipality 3 3 3 1 3 2 14 22 11 15 14 16 16 20 25 28 33 25 28 20 20 15Source: UNDP EWS BiH Top 150 Business to Business Survey, conducted by Prism Research
Table VIIIb
To what degree do the various levels of government assist business overcome problems in BiH:
Generally unhelpful Not at all helpful Cannot judge N.A.XII IV' 07 IX XII III '08 VIII '08 IX '08 XII '08 XII IV' 07 IX XII III '08 VIII '08 IX '08 XII '08 XII IV' 07 IX XII III '08 VIII '08 IX '08 XII '08 XII IV' 07 IX XII III '08 VIII '08IX '08 XII '08
State 28 20 14 24 17 19 22 27 15 22 38 30 28 32 19 29 3 6 5 3 5 3 5 2 15 6 11 13 13 9Entity 31 15 15 27 17 26 21 26 13 21 34 23 29 24 19 28 4 6 2 0 2 6 3 15 5 9 14 13 10Canton 23 9 11 22 14 20 22 26 14 22 34 24 28 26 19 25 3 3 3 1 2 5 3 23 14 22 18 21 12Municipality 20 8 16 15 10 14 23 28 15 22 30 28 29 30 23 24 4 3 3 0 2 3 4 1 15 5 14 15 16 10Source: UNDP EWS BiH Top 150 Business to Business Survey, conducted by Prism Research
Table IX
To what extent do the following represent an obstacle to successful operations:
Very Somewhat Little Not at all N.A.VIII '8 IX '08 XII '08 VIII '8 IX '08 XII '08 VIII '8 IX '08 XII '08 VIII '8 IX '08 XII '08 VIII '8 IX '08 XII '08
Customs procedures 19 21 19 33 46 39 13 17 25 13 12 12 21 6High taxes 50 39 48 24 33 28 10 17 17 6 6 2 10 5Unfair competition 48 34 42 29 26 27 9 25 16 4 7 9 10 6Corruption 46 37 42 16 25 26 9 20 12 4 5 6 26 15The performance of the courts 47 43 45 21 22 26 11 20 16 7 5 3 14 11Political instability 36 26 34 32 39 27 10 23 24 8 3 6 14 9Labour market regulation 14 24 28 27 31 31 27 27 21 14 11 14 18 6Tax administration 23 20 19 32 34 38 20 29 29 10 9 9 14 6Procedures for issuing work permits 39 36 38 30 29 29 9 20 20 9 7 8 13 5Environmental regulations 17 17 17 28 35 36 21 30 23 16 9 12 19 13Safety regulations and standards 16 11 14 20 28 30 32 36 31 16 13 15 17 11Lack of qualified staff 19 17 19 24 34 34 20 25 26 16 16 14 21 7Source: UNDP EWS BiH Top 150 Business to Business Survey, conducted by Prism Research
Annual Report 2008
31

Table XI
To what extent do you use in your everydayoperationsinformal collections and contacts, e.g.family, friends, colleagues...?
IV' 07 IX '07 XII '07 III '08 VIII '08 IX '08 XII '08Very Much 3 9 9 3 8 9 11Somewhat 20 18 28 28 26 31 27Little 30 31 29 32 31 32 28Not All 33 36 25 29 22 19 24No Answer 14 7 9 8 13 8 10Source: UNDP EWS BiH Top 150 Business to Business Survey, conducted byPrism Research
Table XIII
How much does the current institutional framework inBosnia and Herzegovina, i.e. the way in which publicadministration is organised and functions, affect yourbusiness activities in terms of financial costs?
IV' 07 IX '07 XII '07 III '08 VIII '08 IX '08 XII '08Much more than necessary 25 36 42 32 42 39 39Somewhat more than necessary 28 22 24 24 24 31 24About right 7 7 5 14 10 11 10Somewhat less than necessary 7 5 6 7 2 3 2Significantly less than necessary 7 9 4 6 3 4 7No answer 26 22 19 17 18 12 18Source: UNDP EWS BiH Top 150 Business to Business Survey, conducted byPrism Research
Table XIV
How much does the current institutional frameworkin Bosnia and Herzegovina, i.e. the way in whichpublic administration is organised and functions,affect your business activities in terms time spent(lengthy and demanding procedures and activities...)
IV' 07 IX '07 XII '07 III '08 VIII '08 IX' 08 XII '08Much more than necessary 33 38 37 36 42 44 40Somewhat more than necessary 18 17 30 26 21 19 18About right 10 9 6 7 9 16 11Somewhat less than necessary 6 4 4 6 5 3Significantly less than necessary 5 6 4 5 4 4 7No answer 28 26 19 20 3 12 21Source: UNDP EWS BiH Top 150 Business to Business Survey, conducted byPrism Research
Table XII
To what extent do you use in your everydayoperations ''unwritten rules'', including customs,business practices, codes of behaviour, etc.?
IV' 07 IX '07 XII '07 III '08 VIII '08 IX '08 XII '08Very Much 8 15 14 7 4 8 9Somewhat 21 28 28 38 26 39 37Little 33 28 34 24 29 33 26Not All 22 20 15 19 21 11 17No Answer 16 9 9 12 20 8 12Source: UNDP EWS BiH Top 150 Business to Business Survey, conducted byPrism Research
Ann
ual R
epor
t 200
8
32 Table X
To what extent do the following represent an obstacle to successful operations:
Very well Fairly well Fairly poorly Very poorly N.A.IV' 07 IX IX '08 XII '08 IV' 07 IX IX '08 XII '08 IV' 07 IX IX '08 XII '08 IV' 07 IX IX '08 XII '08 IV' 07 IX IX '08 XII '08
Central Bank of BiH 34 45 24 30 34 37 43 39 3 3 7 4 3 0 6 6 24 14 20 20Indirect Tax Authority 23 28 15 16 54 49 47 50 10 8 23 18 5 5 8 9 8 10 7 9Entity Tax Administrations 14 20 11 6 49 47 46 48 16 13 25 25 7 7 13 17 14 13 5 5The Judicial System 5 7 4 3 37 29 18 17 13 22 39 36 34 33 30 35 11 9 9 10European Integration Directorate 3 5 7 7 33 28 22 18 8 9 26 20 8 9 11 10 47 49 34 43FIPA 2 7 4 3 31 20 29 19 8 11 18 18 18 18 20 19 40 43 29 41Privatisation Agency 7 8 1 2 29 24 20 14 14 21 28 22 23 22 25 28 28 26 26 34Banking Agency 10 13 7 5 41 39 28 32 7 7 29 20 6 7 8 7 36 34 28 37Employment Bureaus 2 11 3 3 43 30 31 36 15 14 34 24 14 20 16 17 26 26 16 20Foreign-Trade Chamber 2 14 7 4 44 37 28 29 13 13 32 30 10 14 20 18 31 22 13 19Entity Chambers of Commerce 5 13 9 11 46 35 28 28 17 18 31 27 10 12 20 19 22 22 12 15Social Funds 2 7 20 2 26 16 9 10 11 7 33 26 8 19 33 37 52 51 23 26Source: UNDP EWS BiH Top 150 Business to Business Survey, conducted by Prism Research

Table XV
Looking at institutions in BiH, can you estimate howmuch higher your total costs are because of directcash payments made to government
III '08 IX '08 XII '08III '08 BIH FBIH RS BIH FBIH RS BIH FBIH RS0-5 % 12 9 17 13 13 14 14 17 135-10 % 20 22 17 29 35 9 20 21 1710-20 % 25 27 21 22 20 32 28 26 2920-30 % 8 5 14 13 14 5 13 14 830-40 % 4 4 3 5 4 3 4 4 440-50 % 4 5 0 1 5 0 0 050-60 % 3 3 3 3 4 4 4 4> 60 % 1 1 0 1 1 5 7 0n.a. 23 23 24 13 9 27 13 7 25Source: UNDP EWS BiH Top 150 Business to Business Survey, conducted byPrism Research
Table XVI
Looking at institutions in BiH, can you estimate howmuch higher your total costs are because of indirectpayments caused by government
III '08 IX '08 XII '08BIH FBIH RS BIH FBIH RS BIH FBIH RS
0-5 % 19 19 21 10 13 15 18 135-10 % 22 23 21 27 27 23 25 21 2910-20 % 17 14 24 26 33 5 21 24 1320-30 % 7 8 3 9 7 18 10 10 1330-40 % 2 3 0 4 4 5 3 4 040-50 % 1 1 0 7 4 18 3 3 450-60 % 6 5 7 1 1 2 3 0> 60 % 3 4 0 3 1 9 7 6 8n.a. 23 23 24 13 10 23 14 13 21Source: UNDP EWS BiH Top 150 Business to Business Survey, conducted byPrism Research
Table XVII
How has the performance of the government institutions important for your business changed over the past five years?
State level Entity level State level Entity level State level Entity levelBIH III '08 III '08 IX '08 IX '08 XII '08 XII '08Significantly deteriorated 14 7 12 9 12 8Moderately deteriorated 18 21 14 13 21 18The same 37 34 42 43 37 36Moderately improved 13 22 21 25 21 30Significantly improved 6 3 1 1 1Don't know 13 13 10 9 10 8
101 100FBiHSignificantly deteriorated 12 5 13 9 14 8Moderately deteriorated 20 22 17 14 24 21The same 36 35 42 44 35 31Moderately improved 14 23 17 22 22 35Significantly improved 7 3Don't know 11 12 12 10 6 6
100 100RSSignificantly deteriorated 17 10 9 9 4 4Moderately deteriorated 14 21 5 9 21 13The same 38 31 41 36 33 42Moderately improved 10 21 36 36 21 25Significantly improved 3 3 5 5 4Don't know 17 14 5 5 21 13Source: UNDP EWS BiH Top 150 Business to Business Survey, conducted by Prism Research
Table XVIII
To what extent do you agree with the statement, "I am convinced the legal system will support my ownership andand contractual rights in business disputes"?
BIH FBIH RSIII '08 IX '08 XII '08 III '08 IX '08 XII '08 III '08 IX '08 XII '08
Strongly disagree 21 25 16 26 34 18Basically disagree 14 17 16 14 7 27Neither agree nor disagree 40 37 43 40 31 27Basically agree 17 15 16 14 17 18Strongly agree 7 6 7 5 7 9NA 2 1 3
101 100 99 99 99 99
Annual Report 2008
33

INCOME AND SOCIAL WELFARE
Table Ia
Monthly household income, including all wages and income of all household members, child allowance, pensionand all other sources of income (in %)
FBiH RS Brcko DistrictJune 08. Sept 08. Nov 08. June 08. Sept 08. Nov 08. June 08. Sept 08. Nov 08.
No income 1.0 0.8 4.3< 100 KM 3.5 1.0 2.4 7.6 5.6 4.5 17.1 7.9 9.2101 - 200 1.1 2.2 1.3 5.6 6.7 3.1 6.9 13.6 5.3201 - 300 16.7 15.4 10.1 12.6 15.4 16.0 25.4 38.4 27.8301 - 400 14.7 15.8 14.4 9.8 17.7 14.4 8.6 19.0 24.2401 - 500 12.1 11.7 12.2 11.4 13.2 11.4 9.0 3.8 14.1501 - 600 7.8 9.5 10.8 8.8 6.7 10.1 2.9 4.0 5.9601 - 700 6.0 6.7 8.3 8.1 4.6 7.4 7.3 4.1701 - 800 5.0 5.5 5.9 4.3 2.3 4.4 2.2 1.0801 - 900 4.6 5.9 5.7 2.5 2.7 2.2901 - 1000 1.4 3.3 3.3 2.4 1.6 2.0 0.51001 - 1100 0.5 0.9 1.3 1.6 0.41101 - 1200 0.2 0.1 0.2 0.3 0.31201 - 1300 0.4 0.2 0.5 0.5 0.31301 - 14001401 - 15001501 - 16001601 - 1700 0.31701 - 18001801-19001901 - 2000> 2000 KM/DMNA 25.8 20.4 23.7 24.6 22.1 24.0 20.8 4.4 12.6
100.0 100.0 100.0 100.0 100.0 100.0 100.0 100.0 100.0Source: EWS opinion poll conducted by PRISM Research
Ann
ual R
epor
t 200
8
34
The Social Stability Index

Table Ib
Monthly household income, including all wages and income of all household members, child allowance, pensionand all other sources of income (in %)
FBiH RS Brcko DistrictJune 08. Sept 08. Nov 08. June 08. Sept 08. Nov 08. June 08. Sept 08. Nov 08.
No income 1.0 0.8 4.3< 100 KM 3.5 1.0 2.4 7.6 5.6 4.5 17.1 7.9 9.2101 - 200 1.1 2.2 1.3 5.6 6.7 3.1 6.9 13.6 5.3201 - 300 16.7 15.4 10.1 12.6 15.4 16.0 25.4 38.4 27.8301 - 400 14.7 15.8 14.4 9.8 17.7 14.4 8.6 19.0 24.2401 - 500 12.1 11.7 12.2 11.4 13.2 11.4 9.0 3.8 14.1SUBTOTAL to 500 48.2 47.1 40.3 47.0 59.4 49.5 66.9 86.9 80.61501 - 1600 0.0 0.0 0.0 0.0 0.0 0.0 0.0 0.0 0.01601 - 1700 0.31701 - 1800 0.0 0.0 0.0 0.0 0.0 0.0 0.0 0.0 0.01801-1900 0.0 0.0 0.0 0.0 0.0 0.0 0.0 0.0 0.01901 - 2000 0.0 0.0 0.0 0.0 0.0 0.0 0.0 0.0 0.0More than 2000 KM/DM 0.0 0.0 0.0 0.0 0.0 0.0 0.0 0.0 0.0SUBTOTAL >1500 0.0 0.3 0.0 0.0 0.0 0.0 0.0 0.0 0.0Source: EWS opinion poll conducted by PRISM Research
Table II
Monthly household income, including all wages andincome of all household members, child allowance,pension and all other sources of income (in %)
June 08. Sept 08. Nov 08.No income 1.0less than 100 KM 5.4 3.0 3.4101 - 200 3.0 4.2 2.1201 - 300 15.3 15.9 12.8301 - 400 12.6 16.6 14.6401 - 500 11.7 12.2 11.9SUBTOTAL to 500 48.1 52.9 44.9
Table II
Monthly household income, including all wages and income of all household members, child allowance, pensionand all other sources of income (in %)
Income in KM Bosniak Majority areas Croat Majority areas Serb Majority areasQuarter June 08. Sept 08. Nov 08. June 08. Sept 08. Nov 08. June 08. Sept 08. Nov 08.No income 0.7 2.1 0.8< 100 3.9 1.3 2.6 2.1 0.1 1.5 7.6 5.6 4.5101 - 200 1.3 2.0 1.2 0.7 2.8 1.6 5.6 6.7 3.1201 - 300 19.0 17.2 11.4 8.6 8.8 5.0 12.6 15.4 16.0301 - 400 17.3 18.8 16.1 5.8 5.1 7.6 9.8 17.7 14.4401 - 500 14.0 12.2 13.8 5.2 10.1 5.8 11.4 13.2 11.4Subtotal to 500 55.5 52.3 45.1 22.4 29.1 21.6 47.0 59.4 49.5 Income in KM Minority sample in BMA Minority sample in CMA Minority sample in SMAQuarter June 08. Sept 08. Nov 08. June 08. Sept 08. Nov 08. June 08. Sept 08. Nov 08.No income 2.0 1.0 0.9< 100 1.4 2.0 4.3 1.8 2.6 9.0 5.2 4.6101 - 200 0.6 2.0 6.2 1.8 1.9 2.5 11.1 11.8 3.8201 - 300 21.3 15.4 29.8 22.5 11.4 15.4 27.3 25.9 21.6301 - 400 24.5 24.5 17.5 27.2 10.8 9.4 8.7 16.8 25.9401 - 500 9.0 10.6 20.0 10.3 14.4 15.7 4.6 9.5 10.9Subtotal to 500 56.9 56.5 77.8 63.5 39.3 45.6 60.7 70.1 66.8Source: Opinion polls conducted for EWS by Prism Research
Annual Report 2008
35

Table IV
Over past year, household economic status has (in %)?
BiH FBiH RS Brcko Distrikt Bosniak Croat Serbmaj. areas maj. areas maj. areas
Survey Sept 08. Nov 08. Sept 08. Nov 08. Sept 08. Nov 08. Sept 08. Nov 08. Nov 08. Nov 08. Nov 08.TOTAL BETTER 15.51 10.76 14.61 10.24 17.52 9.39 2.58 43.77 8.7 16.3 9.4STAY THE SAME 57.10 53.78 56.75 51.95 59.69 58.24 18.48 28.00 49.7 60.8 58.2TOTAL WORSE 27.05 34.46 28.46 36.73 22.17 31.63 78.94 25.41 40.5 22.0 31.6DK/NA 0.35 0.99 0.18 1.09 0.61 0.74 2.82 1.1 0.9 0.7Total 100.00 100.00 100.00 100.00 100.00 100.00 100.00 100.00 100.0 100.0 100.0Source: Opinion polls conducted for EWS by Prism Research
Table VI
Expect further privatization to affect their household's economic status….
FBiH RS Brcko Distrikt Bosniak Croat Serbmajority areas majority areas majority areas
Quarter Sept 08. Nov 08. Sept 08. Nov 08. Sept 08. Nov 08. Sept 08. Nov 08. Sept 08. Nov 08. Sept 08. Nov 08.TOTAL NEGATIVE 59.3 66.4 58.0 53.5 32.0 33.6 59.0 68.8 60.4 56.9 58.0 53.5TOTAL POSITIVE 13.6 10.1 13.7 11.3 13.6 40.1 11.2 7.9 22.3 18.9 13.7 11.3DK/NA 27.1 23.5 28.3 35.2 54.4 26.3 29.8 23.3 17.3 24.3 28.3 35.2Total 100.0 100.0 100.0 100.0 100.0 100.0 100.0 100.0 100.0 100.0 100.0 100.0Source: Opinion polls conducted for EWS by Prism Research
Table V
Expect the economic situation over the next year to...(in %)
Bosniak Majority areas Croat Majority areas Serb Majority areasSept 08. Nov 08. Sept 08. Nov 08. Sept 08. Nov 08.
Deteriorate significantly 10.0 0.1 1.5 5.2 2.8 3.7Deteriorate somewhat 32.8 39.6 13.0 14.9 19.4 23.7Stay the same 41.4 38.9 69.6 53.2 43.7 48.8Improve somewhat 7.5 4.0 9.7 22.0 25.4 19.1Improve significantly 0.5 13.3 1.2 1.3DK/NA 7.9 4.1 6.3 3.4 7.6 4.7Total 100.0 100.0 100.0 100.0 100.0 100.0TOTAL DETERIORATE 42.8 39.7 14.5 20.1 22.1 27.3Stay the same 41.4 38.9 69.6 53.2 43.9 48.8TOTAL IMPROVE 7.9 17.2 9.7 23.2 26.6 19.1DK/NA 7.9 4.1 6.3 3.4 7.5 4.7Total 100.0 100.0 100.0 100.0 100.0 100.0Source: Opinion polls conducted for EWS by Prism Research
Table III
Monthly household income, including all wages and income of all household members, child allowance, pensionand all other sources of income (in %)
BiHIncome in KM Urban Rural Male Female 18-35 36-50 51+
Sept 08. Nov 08. Sept 08. Nov 08. Sept 08. Nov 08. Sept 08. Nov 08. Sept 08. Nov 08. Sept 08. Nov 08. Sept 08. Nov 08.No income 0.1 1.7 1.6 0.4 0.1 2.4< 100 1.5 2.0 4.2 4.4 1.9 2.8 4.0 3.9 1.1 3.3 2.0 2.9 5.4 3.8101 - 200 3.0 1.3 5.2 2.7 4.2 1.9 4.3 2.3 1.4 0.9 3.4 0.5 7.4 4.4201 - 300 10.9 9.0 19.6 15.7 16.5 11.5 15.2 14.1 5.8 2.5 7.6 9.9 30.2 25.5301 - 400 14.7 13.0 18.0 15.9 16.1 15.5 17.1 13.9 9.8 10.3 17.6 13.9 22.6 19.6401 - 500 12.0 12.2 12.3 11.7 11.5 12.6 12.8 11.3 13.5 12.4 14.8 14.2 9.4 9.9SUBTOTAL TO 500 42.1 37.5 60.9 50.3 51.9 44.3 53.8 45.4 31.7 29.5 45.4 41.3 77.3 63.1Source: Opinion polls conducted for EWS by Prism Research
Ann
ual R
epor
t 200
8
36
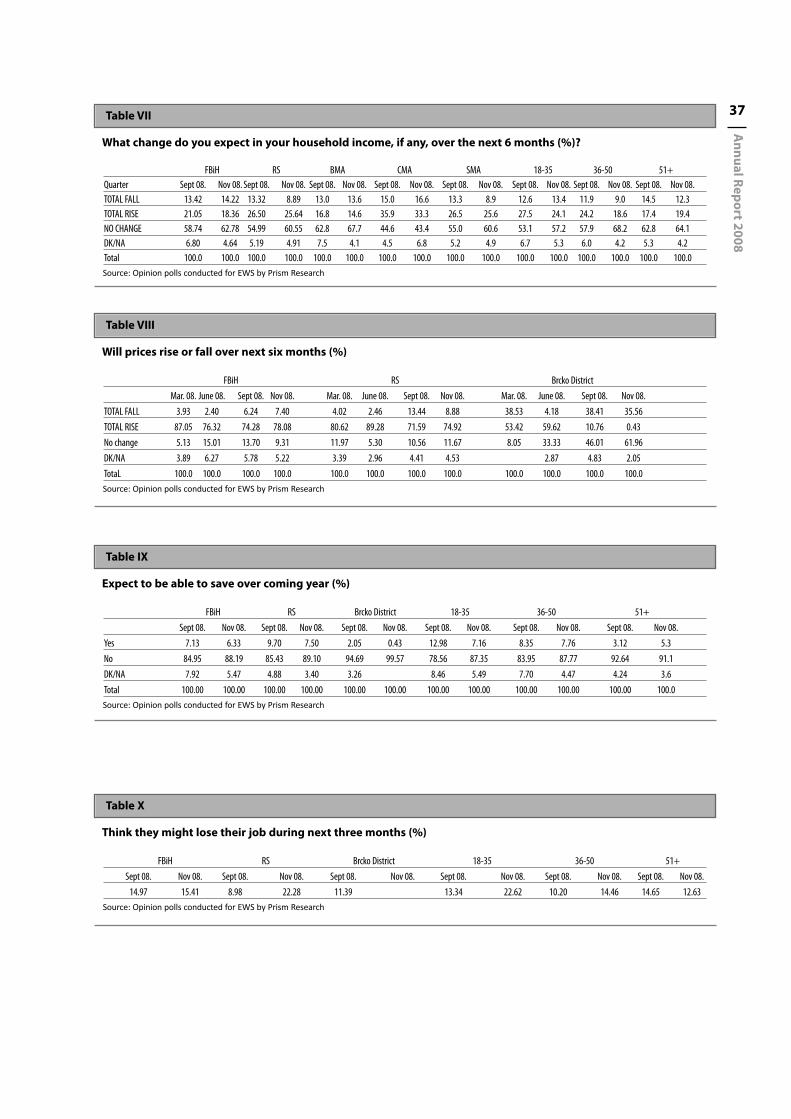
Table IX
Expect to be able to save over coming year (%)
FBiH RS Brcko District 18-35 36-50 51+Sept 08. Nov 08. Sept 08. Nov 08. Sept 08. Nov 08. Sept 08. Nov 08. Sept 08. Nov 08. Sept 08. Nov 08.
Yes 7.13 6.33 9.70 7.50 2.05 0.43 12.98 7.16 8.35 7.76 3.12 5.3No 84.95 88.19 85.43 89.10 94.69 99.57 78.56 87.35 83.95 87.77 92.64 91.1DK/NA 7.92 5.47 4.88 3.40 3.26 8.46 5.49 7.70 4.47 4.24 3.6Total 100.00 100.00 100.00 100.00 100.00 100.00 100.00 100.00 100.00 100.00 100.00 100.0Source: Opinion polls conducted for EWS by Prism Research
Table VIII
Will prices rise or fall over next six months (%)
FBiH RS Brcko DistrictMar. 08. June 08. Sept 08. Nov 08. Mar. 08. June 08. Sept 08. Nov 08. Mar. 08. June 08. Sept 08. Nov 08.
TOTAL FALL 3.93 2.40 6.24 7.40 4.02 2.46 13.44 8.88 38.53 4.18 38.41 35.56TOTAL RISE 87.05 76.32 74.28 78.08 80.62 89.28 71.59 74.92 53.42 59.62 10.76 0.43No change 5.13 15.01 13.70 9.31 11.97 5.30 10.56 11.67 8.05 33.33 46.01 61.96DK/NA 3.89 6.27 5.78 5.22 3.39 2.96 4.41 4.53 2.87 4.83 2.05TotaL 100.0 100.0 100.0 100.0 100.0 100.0 100.0 100.0 100.0 100.0 100.0 100.0Source: Opinion polls conducted for EWS by Prism Research
Table VII
What change do you expect in your household income, if any, over the next 6 months (%)?
FBiH RS BMA CMA SMA 18-35 36-50 51+Quarter Sept 08. Nov 08. Sept 08. Nov 08. Sept 08. Nov 08. Sept 08. Nov 08. Sept 08. Nov 08. Sept 08. Nov 08. Sept 08. Nov 08. Sept 08. Nov 08.TOTAL FALL 13.42 14.22 13.32 8.89 13.0 13.6 15.0 16.6 13.3 8.9 12.6 13.4 11.9 9.0 14.5 12.3TOTAL RISE 21.05 18.36 26.50 25.64 16.8 14.6 35.9 33.3 26.5 25.6 27.5 24.1 24.2 18.6 17.4 19.4NO CHANGE 58.74 62.78 54.99 60.55 62.8 67.7 44.6 43.4 55.0 60.6 53.1 57.2 57.9 68.2 62.8 64.1DK/NA 6.80 4.64 5.19 4.91 7.5 4.1 4.5 6.8 5.2 4.9 6.7 5.3 6.0 4.2 5.3 4.2Total 100.0 100.0 100.0 100.0 100.0 100.0 100.0 100.0 100.0 100.0 100.0 100.0 100.0 100.0 100.0 100.0Source: Opinion polls conducted for EWS by Prism Research
Table X
Think they might lose their job during next three months (%)
FBiH RS Brcko District 18-35 36-50 51+Sept 08. Nov 08. Sept 08. Nov 08. Sept 08. Nov 08. Sept 08. Nov 08. Sept 08. Nov 08. Sept 08. Nov 08.
14.97 15.41 8.98 22.28 11.39 13.34 22.62 10.20 14.46 14.65 12.63Source: Opinion polls conducted for EWS by Prism Research
Annual Report 2008
37

Ann
ual R
epor
t 200
8
38
Table XIII
Trends for average salaries and the Consumer Price Index for the RS and the FBiH (December 07. - November 08.)
RSMonth 12/07 01/08 02/08 03/08 04/08 05/08 06/08 07/08 08/08 09/08 10/08 11/08 Change 10/08 - 12/07Average salary 628.00 584.00 724.00 731.00 751.00 758.00 768.00 765.00 762.00 783.00 783.00 790.00 124.68Consumer price index100.80 101.50 100.30 100.90 99.30 100.80 100.90 100.00 100.20 100.00 100.70 99.40 104,2*FBiHMonth 12/07 01/08 02/08 03/08 04/08 05/08 06/08 07/08 08/07 09/08 10/08 11/08 Change 10/08 - 12/07Average salary 696.74 709.84 713.20 723.66 735.11 751.82 740.60 763.51 759.11 773.44 780.51 - 112.02Consumer price index - 101.26 100.42 100.91 99.74 100.91 100.95 100.11 99.60 100.14 100.76 99.37 104,71*Source: Entity Statistics Offices
Table XII
Would leave BiH if they could (%)
BiH FBiH RS 18-35 36-50 51+Sept 08. 41.58 48.31 31.52 64.45 45.61 17.41Nov 08. 40.36 40.08 41.56 63.29 39.38 17.57Source: Entity Statistical Offices
Table XI
Would support public protests, strikes, and demonstrations regarding (%)
FBiH RS Brcko District Urban Rural 18-35 36-50 51+Survey June 08. Sept 08. Nov 08. June 08. Sept 08. Nov 08. June 08. Sept 08. Nov 08. June 08. Sept 08. Nov 08. June 08. Sept 08. Nov 08. Nov 08. Nov 08. Nov 08.
Job loss 59.8 53.5 61.3 48.0 45.6 35.1 24.5 33.4 33.7 56.5 55.1 49.7 52.9 46.0 50.9 60.4 54.7 37.1Inability to find a job 58.2 50.9 58.2 46.8 44.8 35.3 24.5 33.4 31.6 54.4 52.9 48.4 51.9 44.5 48.8 59.1 51.2 36.1Entity government policy 53.5 45.0 51.6 44.3 40.2 32.5 24.5 27.6 2.9 50.9 45.7 42.9 48.0 40.4 43.0 51.4 45.3 32.7Low salaries/pensions 59.2 51.9 60.8 50.3 45.4 37.7 24.5 45.2 38.8 57.7 54.5 50.9 52.9 45.2 51.6 58.4 53.3 42.6Discrimination/to protect ethnic and civil rights 56.9 50.8 56.4 50.5 47.3 39.0 24.5 30.6 5.5 54.8 53.7 47.1 52.8 45.4 49.3 56.1 53.0 37.3Behaviour of the international community 51.1 43.2 49.8 48.0 43.8 39.9 24.5 25.2 4.2 49.8 46.0 43.3 49.0 40.8 46.0 50.4 49.6 35.7Return of property 59.6 50.3 54.6 49.6 46.9 41.9 24.5 28.3 33.1 56.0 52.2 46.4 54.1 45.7 51.2 55.8 50.9 41.1Source: Opinion polls conducted for EWS by Prism Research

Table XIV
Consumer price index (CPI) itemized (November 2008)
RS FBiHXI 2008/ XI 2008/ XI 2008/ XI 2008 /X 2008 XI 2007 X 2008 XI 2007
Total 99.40 105.10 99.37 105.95Food and non-alcoholic beverages 99.80 107.30 99.63 109.38Alcohol and tobacco 100.00 101.70 100.09 101.40Clothes and shoes 100.00 98.10 99.64 96.47Accommodation, water and other utilities 100.30 107.70 101.69 112.14Furniture, furnishings, and regular maintainance 100.10 102.80 100.24 103.33Healthcare 100.10 100.80 100.07 99.45Transport 94.70 104.30 94.34 101.72Communications 102.80 106.60 99.97 104.80Recreation and culture 100.00 104.90 99.95 106.47Education 100.00 101.10 100.60 97.96Restaurants and hotels 100.20 105.60 101.04 107.75Other goods and services 100.00 103.60 100.02 104.38Entity Statistics Offices
Table XV
Average household spending by item (as % of total)
FBiH RSQuarter Mar. 08.June 08.Sept 08. Nov 08. Mar. 08. June 08. Sept 08. Nov 08.
FOOD 32.9 28.2 32.9 40.2 30.5 30.6 29.1 36.7CLOTHING/SHOES 5.5 5.3 6.7 5.5 5.7 6.0 7.7 6.8TOBACCO 4.6 4.3 4.6 4.0 5.3 5.8 5.7 3.8HYGIENE 6.3 6.3 6.7 6.0 6.1 7.0 6.5 6.4FUEL AND CAR MAINTENANCE 6.1 5.8 5.3 5.5 6.1 6.8 6.1 6.2PUBLIC TRANSPORT 2.3 2.3 2.9 1.4 1.5 2.6 2.2 1.6CHILDCARE 1.1 1.6 1.5 0.2 0.6 0.7 0.8 0.1REPAYMENTS 4.4 5.0 4.9 5.9 4.2 3.8 4.4 3.7HOUSE REPAIRS 3.4 5.8 3.2 1.9 2.1 3.4 3.2 2.4MEDICAL EXPENSES 7.0 6.7 5.9 5.0 8.4 7.3 6.5 4.9RECREATION 3.9 4.3 3.5 2.4 3.0 4.3 3.5 2.8EDUCATION (CHILDREN) 4.0 4.4 5.4 3.0 4.3 2.9 4.7 3.4ELECTRICITY 8.8 8.5 7.3 6.3 12.4 9.5 9.5 7.8WATER 3.3 3.8 3.1 2.0 2.6 2.7 3.0 1.5TELEPHONE 4.9 5.8 4.9 4.3 6.6 5.8 6.0 4.7GAS 1.5 1.7 1.4 0.2 0.7 0.8 1.1 0.6
100.0 100.0 100.0 93.6 100.0 100.0 100.0 93.3Source: Opinion polls conducted for EWS by Prism Research
Annual Report 2008
39
Table XVI
Households with durable consumer goods (in %)
FBiH RSJune 08. Sept 08. Nov 08. June 08. Sept 08. Nov 08.
Telephones 81.55 78.09 83.22 72.22 72.44 71.41Mobile phones 66.80 68.10 74.27 67.40 68.53 65.23Dial up internet access 18.05 19.58 20.78 13.16 12.11 14.22Car 51.59 48.33 53.08 51.52 51.47 54.59Source: ALDI, BiH and entity consolidated budgets, Eurostat, IMF
Table XVII
Self-description of household economic status(%)
BiH FBiH RS Brcko District Urban Rural BosniakMA Croat MA Serb MASept 08. Nov 08. Sept 08. Nov 08. Sept 08. Nov 08. Sept 08. Nov 08. Nov 08. Nov 08. Nov 08. Nov 08. Nov 08.
Barely surviving 9.5 8.1 7.7 5.1 11.7 11.5 13.7 25.7 5.9 9.7 5.1 5.1 11.5Well below average 14.0 11.4 12.0 9.2 15.4 14.3 44.4 17.3 10.9 11.8 9.4 8.6 14.3Below average 19.7 24.3 17.5 24.4 23.1 24.1 19.7 24.4 23.3 25.0 26.3 17.0 24.1TOTAL below average 43.2 43.8 37.2 38.7 50.2 49.9 77.8 67.4 40.0 46.6 40.7 30.7 49.9Source: Public opinion poll conducted for EWS by Prism Research

SOCIAL INCLUSION
Table I
Assessment of current economic situation in BiH (%)
Bosniak majority areas Croat majority areas Serb majority areasNov 07. Nov 08. Nov 07. Nov 08. Nov 07. Nov 08.
Total bad 84,9 77,6 68,0 35,0 72,1 62,3Neither good nor bad 12,3 21,3 23,8 46,8 23,3 35,4Total good 1,6 0,2 7,0 16,6 2,6 0,6NA/DK 1,2 0,9 1,2 1,6 2,0 1,6Total 100,0 100,0 100,0 100,0 100,0 100,0
Minority population in BMA Minority population in CMA Minority population in SMANov 07. Nov 08. Nov 07. Nov 08. Nov 07. Nov 08.
Total bad 89,1 71,6 50,8 47,3 73,8 55,4Neither good nor bad 4,9 25,2 47,1 41,4 24,4 41,5Total good 2,4 2,0 11,2 1,8 3,1NA/DK 6,1 0,8 0,2Total 100,0 100,0 100,0 100,0 100,0 100,0Source: Public opinion polls conducted for EWS by Prism Research
Table Ia
Assessment of economic situation in BiH by minority situation on each of the ethnic majority areas (%)
Bosniak majority areas Croat majority areas Serb majority areasJun. 08. Sep 08. Nov 08. Jun. 08. Sep 08. Nov 08. Jun. 08. Sep 08. Nov 08.
Total bad 71.8 72.0 71.6 49.6 58.7 47.3 73.2 64.0 55.4Neither good nor bad 21.2 20.3 25.2 33.3 38.8 41.4 24.3 31.7 41.5Total good 6.4 2.4 17.1 1.5 11.2 2.5 1.8 3.1NA/DK 0.6 7.7 0.8 1.0 2.5Total 100.0 100.0 100.0 100.0 100.0 100.0 100.0 100.0 100.0Source: Public opinion polls conducted for EWS by Prism Research
Table II
Expect prices over next six months to…. (%)
Majority in BMA Majority in CMA Majority in SMANov 07. Nov 08. Nov 07. Nov 08. Nov 07. Nov 08.
Fall 6,1 6,0 7,8 13,0 7,5 8,9Rise 90,0 78,8 87,9 75,4 83,9 74,9Stay the same 1,8 10,2 3,1 5,9 6,6 11,7NA/DK 2,1 5,1 1,3 5,7 2,0 4,5Total 100,0 100,0 100,0 100,0 100,0 100,0
Minority in BMA Minority in CMA Minority in SMANov 07. Nov 08. Nov 07. Nov 08. Nov 07. Nov 08.
Fall 3,7 2,0 3,8 22,9 2,5 13,6Rise 92,5 88,4 87,2 65,5 85,7 75,4Stay the same 8,9 5,6 8,5 6,3 5,7NA/DK 3,9 0,8 3,4 3,1 5,5 5,3Total 100,0 100,0 100,0 100,0 100,0 100,0Source: Public opinion polls conducted for EWS by Prism Research
Ann
ual R
epor
t 200
8
40

Annual Report 2008
41Table III
Expect household income over next six months to …. (%)
Majority in BMA Majority in CMA Majority in SMANov 07. Nov 08. Nov 07. Nov 08. Nov 07. Nov 08.
Fall 19,8 13,6 16,3 16,6 14,4 8,9Rise 15,1 14,6 20,1 33,3 20,5 25,6Stay the same 56,0 67,7 58,9 43,4 58,7 60,6NA/DK 9,2 4,1 4,7 6,8 6,3 4,9Total 100,0 100,0 100,0 100,0 100,0 100,0
Minority in BMA Minority in CMA Minority in SMANov 07. Nov 08. Nov 07. Nov 08. Nov 07. Nov 08.
Fall 8,1 11,7 12,8 6,2 5,3 10,0Rise 5,3 3,8 25,8 37,4 10,5 19,6Stay the same 72,7 80,0 48,3 55,2 83,3 61,8NA/DK 13,9 4,5 13,1 1,2 0,9 8,7Total 100,0 100,0 100,0 100,0 100,0 100,0Source: Public opinion polls conducted for EWS by Prism Research
Table IIIa
Expect household income over next six months to …. (%)
Bosniak majority areas Croat majority areas Serb majority areasSept 08. Nov 08. Sept 08. Nov 08. Sept 08. Nov 08.
Total fall 13.0 13.6 15.0 16.6 13.3 8.9Total increase 16.8 14.6 35.9 33.3 26.5 25.6No change 62.8 67.7 44.6 43.4 55.0 60.6NZ/BO 7.5 4.1 4.5 6.8 5.2 4.9Total 100.0 100.0 100.0 100.0 100.0 100.0Source: Public opinion polls conducted for EWS by Prism Research
Table IV
Expect to save over next half year (%)
Majority in BMA Majority in CMA Majority in SMANov 07. Nov 08. Nov 07. Nov 08. Nov 07. Nov 08.
Yes 11,3 4,1 14,0 15,1 12,8 7,5No 83,8 91,5 79,0 75,1 85,1 89,1NA/DK 4,8 4,3 7,1 9,9 2,2 3,4Total 100,0 100,0 100,0 100,0 100,0 100,0
Minority in BMA Minority in CMA Minority in SMANov 07. Nov 08. Nov 07. Nov 08. Nov 07. Nov 08.
Yes 1,7 4,2 3,0 8,5 5,3 8,8No 92,7 92,6 89,4 89,2 92,2 89,2NA/DK 5,6 3,2 7,6 2,3 2,5 2,0Total 100,0 100,0 100,0 100,0 100,0 100,0Source: Public opinion polls conducted for EWS by Prism Research

Ann
ual R
epor
t 200
8
42
Table Va
Expect political situation to deteriorate (%)
Bosniak majority areas Croat majority areas Serb majority areasMajority sample Minority sample Majority sample Minority sample Majority sample Minority sample
Nov. 79.7 82.1 52.9 47.4 50.3 41.2Sept. 57.2 60.6 61.5 64.5 42.5 43.2Jun. 54.4 55.6 57.5 71.5 42.5 39.2Mar. 78.8 88.3 57.7 65.7 57.3 37.6Source: Public opinion polls conducted for EWS by Prism Research
Table V
Think political situation in BiH is…. (%)
Majority in BMA Majority in CMA Majority in SMANov 07. Nov 08. Nov 07. Nov 08. Nov 07. Nov 08.
Deteriorating 79,4 79,7 80,2 52,9 82,4 50,3Improving 15,1 13,5 11,5 24,7 12,1 34,6NA/DK 5,5 6,8 8,3 22,4 5,5 15,1Total 100,0 100,0 100,0 100,0 100,0 100,0
Minority in BMA Minority in CMA Minority in SMANov 07. Nov 08. Nov 07. Nov 08. Nov 07. Nov 08.
Deteriorating 90,7 82,1 60,3 47,4 82,5 41,2Improving 4,7 14,7 19,1 48,2 9,5 51,7NA/DK 4,6 3,1 20,6 4,4 8,1 7,1Total 100,0 100,0 100,0 100,0 100,0 100,0Source: Public opinion polls conducted for EWS by Prism Research
Table VI
Pride in ethnic identity (%)
Majority in BMA Majority in CMA Majority in SMANov 07. Nov 08. Nov 07. Nov 08. Nov 07. Nov 08.
Very proud 86,4 84,7 81,4 80,7 82,0 79,3Somewhat 10,4 8,6 13,6 10,2 12,7 13,7Not much 2,1 3,7 2,7 2,3 3,3 2,5Not at all 0,3 0,9 0,5 1,9Not important 1,2 1,1 1,3 6,0 2,0 2,2DK/Can't decide 1,1 0,2NA/DK 0,5 0,1 0,3 0,2Total 100,0 100,0 100,0 100,0 100,0 100,0
Minority in BMA Minority in CMA Minority in SMANov 07. Nov 08. Nov 07. Nov 08. Nov 07. Nov 08.
Very proud 82,8 90,9 72,8 87,9 74,1 87,8Somewhat 8,0 4,9 4,5 3,1 14,6 5,0Not much 1,0 2,7 6,0 1,0Not at all 5,0 0,6Not important 2,0 0,7 13,8 6,0 10,3 6,4DK/Can't decide 0,8 0,5NA/DK 1,3 1,8 2,1 0,9 0,7Total 100,0 100,0 100,0 100,0 100,0 100,0Source: Public opinion polls conducted for EWS by Prism Research

Annual Report 2008
43
Table VIII
Thinks High Representative's powers should be…. (%)
Majority in BMA Majority in CMA Majority in SMANov 07. Nov 08. Nov 07. Nov 08. Nov 07. Nov 08.
Reduced 13,1 10,9 46,8 28,9 85,1 71,6Increased 55,8 41,9 22,0 18,9 3,9 2,9Left as they are 25,0 40,0 22,9 31,9 7,4 19,1NA/DK 6,2 7,2 8,3 20,2 3,6 6,4Total 100,0 100,0 100,0 100,0 100,0 100,0
Minority in BMA Minority in CMA Minority in SMANov 07. Nov 08. Nov 07. Nov 08. Nov 07. Nov 08.
Reduced 26,8 12,8 17,3 12,0 27,0 17,6Increased 35,5 26,9 33,7 30,5 24,2 28,2Left as they are 24,9 56,4 22,1 54,2 45,4 42,2NA/DK 12,9 3,9 26,9 3,4 3,5 12,0Total 100,0 100,0 100,0 100,0 100,0 100,0Source: Public opinion polls conducted for EWS by Prism Research
Table VII
Pride in being a citizen of BiH (%)
Majority in BMA Majority in CMA Majority in SMANov 07. Nov 08. Nov 07. Nov 08. Nov 07. Nov 08.
Very proud 86,3 80,7 31,6 32,5 16,4 23,7Somewhat 9,8 11,2 27,5 33,8 21,8 20,1Not much 2,1 5,4 12,7 13,8 19,0 15,7Not at all 0,5 0,4 10,7 4,7 21,6 20,8Not important 1,2 0,8 12,6 14,0 20,3 17,7DK/Can't decide 0,9 1,5 0,3 1,2NA/DK 0,2 0,6 3,5 0,9 1,0 0,9Total 100,0 100,0 100,0 100,0 100,0 100,0
Minority in BMA Minority in CMA Minority in SMANov 07. Nov 08. Nov 07. Nov 08. Nov 07. Nov 08.
Very proud 78,4 87,0 49,9 75,4 64,2 72,9Somewhat 8,0 8,7 9,6 12,5 23,6 9,8Not much 1,0 2,7 9,5 3,0 1,1Not at all 4,2 0,6 1,1 0,9 5,3Not important 2,0 27,7 6,7 10,4 10,2DK/Can't decide 2,6 0,8 0,5NA/DK 3,9 0,8 2,3 1,4 0,9 0,7Total 100,0 100,0 100,0 100,0 100,0 100,0Source: Public opinion polls conducted for EWS by Prism Research
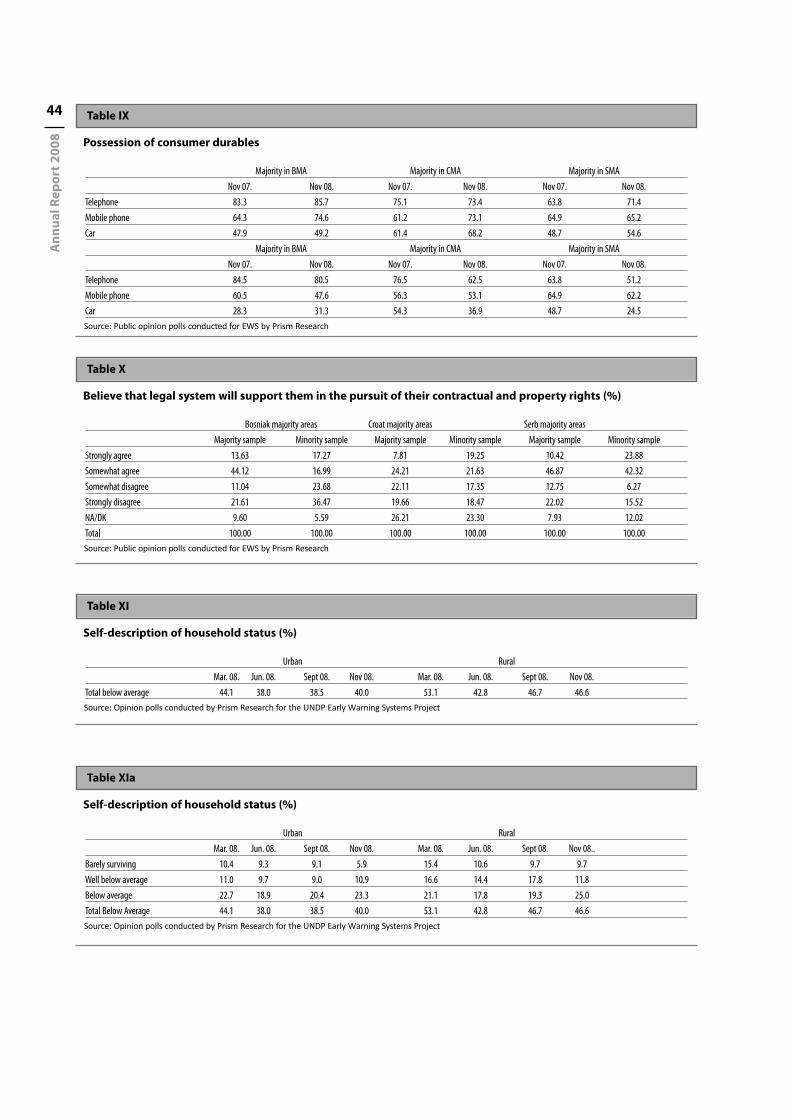
Ann
ual R
epor
t 200
8
44
Table X
Believe that legal system will support them in the pursuit of their contractual and property rights (%)
Bosniak majority areas Croat majority areas Serb majority areasMajority sample Minority sample Majority sample Minority sample Majority sample Minority sample
Strongly agree 13.63 17.27 7.81 19.25 10.42 23.88Somewhat agree 44.12 16.99 24.21 21.63 46.87 42.32Somewhat disagree 11.04 23.68 22.11 17.35 12.75 6.27Strongly disagree 21.61 36.47 19.66 18.47 22.02 15.52NA/DK 9.60 5.59 26.21 23.30 7.93 12.02Total 100.00 100.00 100.00 100.00 100.00 100.00Source: Public opinion polls conducted for EWS by Prism Research
Table XI
Self-description of household status (%)
Urban RuralMar. 08. Jun. 08. Sept 08. Nov 08. Mar. 08. Jun. 08. Sept 08. Nov 08.
Total below average 44.1 38.0 38.5 40.0 53.1 42.8 46.7 46.6Source: Opinion polls conducted by Prism Research for the UNDP Early Warning Systems Project
Table XIa
Self-description of household status (%)
Urban RuralMar. 08. Jun. 08. Sept 08. Nov 08. Mar. 08. Jun. 08. Sept 08. Nov 08..
Barely surviving 10.4 9.3 9.1 5.9 15.4 10.6 9.7 9.7Well below average 11.0 9.7 9.0 10.9 16.6 14.4 17.8 11.8Below average 22.7 18.9 20.4 23.3 21.1 17.8 19.3 25.0Total Below Average 44.1 38.0 38.5 40.0 53.1 42.8 46.7 46.6Source: Opinion polls conducted by Prism Research for the UNDP Early Warning Systems Project
Table IX
Possession of consumer durables
Majority in BMA Majority in CMA Majority in SMANov 07. Nov 08. Nov 07. Nov 08. Nov 07. Nov 08.
Telephone 83.3 85.7 75.1 73.4 63.8 71.4Mobile phone 64.3 74.6 61.2 73.1 64.9 65.2Car 47.9 49.2 61.4 68.2 48.7 54.6
Majority in BMA Majority in CMA Majority in SMANov 07. Nov 08. Nov 07. Nov 08. Nov 07. Nov 08.
Telephone 84.5 80.5 76.5 62.5 63.8 51.2Mobile phone 60.5 47.6 56.3 53.1 64.9 62.2Car 28.3 31.3 54.3 36.9 48.7 24.5Source: Public opinion polls conducted for EWS by Prism Research

Annual Report 2008
45Table XII
Would emigrate if they could (%) - Sept 08/Nov 08
BiH FBiH RS 18-35 36-50 51+Sept 08. 41.58 48.31 31.52 64.45 45.61 17.41Nov 08. 40.36 40.08 41.56 63.29 39.38 17.57Source: Opinion polls conducted by Prism Research for the UNDP Early Warning Systems Project
Table XIII
Monthly household income, including all wages and income of all household members, child allowance, pensionand all other sources of income (in %)
Income in KM Bosniak Majority areas Croat Majority areas Serb Majority areasQuarter March 08. June 08. Sept 08. Nov 08. March 08. June 08. Sept 08. Nov 08. March 08. June 08. Sept 08. Nov 08.No income 2.7 0.7 0.5 2.1 4.3 0.8< 100 1.6 3.9 1.3 2.6 3.9 2.1 0.1 1.5 5.2 7.6 5.6 4.5101 - 200 8.3 1.3 2.0 1.2 6.0 0.7 2.8 1.6 9.8 5.6 6.7 3.1201 - 300 9.6 19.0 17.2 11.4 5.6 8.6 8.8 5.0 9.3 12.6 15.4 16.0301 - 400 9.2 17.3 18.8 16.1 6.0 5.8 5.1 7.6 9.9 9.8 17.7 14.4401 - 500 9.8 14.0 12.2 13.8 4.0 5.2 10.1 5.8 9.9 11.4 13.2 11.4Subtotal to 500 41.3 55.5 52.3 45.1 25.9 22.4 29.1 21.6 48.3 47.0 59.4 49.5Income in KM Bosniak Majority areas Croat Majority areas Serb Majority areasQuarter March 08. June 08. Sept 08. Nov 08. March 08. June 08. Sept 08. Nov 08. March 08. June 08. Sept 08. Nov 08.No income 3.7 2.0 0.5 1.0 10.1 0.9< 100 6.9 1.4 2.0 4.3 0.9 1.8 2.6 9.6 9.0 5.2 4.6101 - 200 17.6 0.6 2.0 6.2 5.0 1.8 1.9 2.5 7.7 11.1 11.8 3.8201 - 300 6.8 21.3 15.4 29.8 4.2 22.5 11.4 15.4 23.2 27.3 25.9 21.6301 - 400 9.7 24.5 24.5 17.5 5.6 27.2 10.8 9.4 8.2 8.7 16.8 25.9401 - 500 11.4 9.0 10.6 20.0 6.0 10.3 14.4 15.7 8.5 4.6 9.5 10.9Subtotal to 500 56.2 56.9 56.5 77.8 22.1 63.5 39.3 45.6 67.3 60.7 70.1 66.8Source: Opinion polls conducted by Prism Research for the UNDP Early Warning Systems Project

Ann
ual R
epor
t 200
8
46 ETHNIC RELATIONS
Table Ia
Have you or any of your household been the victim fo verbal harassment or physical attack during the past yearsolely on the grounds of your ethnicity?
GenderUrban Rural Male Female
Nov 2007 Jun. 2008 Sep 2008 Nov 2008 Nov 2007 Jun. 2008 Sep 2008 Nov 2008 Nov 2007 Jun. 2008 Sep 2008 Nov 2008 Nov 2007 Jun. 2008 Sep 2008 Nov 2008
% % % % % % % % % % % % % % % %No - never 88.7 93.6 94.7 96.0 96.5 95.1 96.7 94.5 91.8 94.8 94.5 94.7 94.5 94.1 97.2 95.5Yes - once 5.8 1.3 1.0 1.8 1.9 1.5 0.8 1.2 4.0 1.5 1.1 1.9 3.1 1.4 0.7 1.1Yes - more than once 3.1 1.3 1.8 1.3 1.1 1.1 0.9 1.6 2.4 1.5 1.5 1.6 1.5 0.9 1.0 1.4Yes - frequently 1.8 1.9 0.6 0.4 0.4 1.8 0.8 1.7 1.4 1.1 1.3 1.3 0.7 2.6 0.1 1.0DK/NA 0.6 1.8 2.0 0.6 0.1 0.5 0.8 0.9 0.4 1.2 1.6 0.5 0.2 0.9 1.0 1.0TOTAL 100.0 100.0 100.0 100.0 100.0 100.0 100.0 100.0 100.0 100.0 100.0 100.0 100.0 100.0 100.0 100.0Source: EWS opinion poll conducted by PRISM Research
Table Ib
Have you or any of your household been the victim fo verbal harassment or physical attack during the past yearsolely on the grounds of your ethnicity?
Age18 - 35 36 - 50 51 +
Nov 2007 Jun. 2008 Sep 2008 Nov 2008 Nov 2007 Jun. 2008 Sep 2008 Nov 2008 Nov 2007 Jun. 2008 Sep 2008 Nov 2008
% % % % % % % % % % % %No - never 92.2 94.7 94.7 94.6 93.7 94.1 96.4 94.6 93.6 94.8 96.6 96.0Yes - once 4.1 1.3 0.7 1.0 4.1 1.5 0.7 2.0 2.7 1.5 1.1 1.5Yes - more than once 2.5 0.2 1.1 1.5 1.8 1.2 1.0 1.6 1.6 2.1 1.6 1.3Yes - frequently 1.0 2.6 0.9 1.8 0.4 2.5 0.7 1.2 1.5 0.9 0.6 0.4DK/NA 0.2 1.1 2.6 1.1 0.6 1.2 0.4 0.6 0.7 0.2 0.7TOTAL 100.0 100.0 100.0 100.0 100.0 100.0 100.0 100.0 100.0 100.0 100.0 100.0Source: EWS opinion poll conducted by PRISM Research
The Inter-ethnic Stability Index

Annual Report 2008
47Table Ic
Have you or any of your household been the victim fo verbal harassment or physical attack during the past yearsolely on the grounds of your ethnicity? (%)
AREABosniak MA Croat MA Serb MA
Jun. 2008 Sep 2008 Nov 2008 Jun. 2008 Sep 2008 Nov 2008 Jun. 2008 Sep 2008 Nov 2008Population Maj. Min. Maj. Min. Maj. Min. Maj. Min. Maj. Min. Maj. Min. Maj. Min. Maj. Min. Maj. Min.No - never 93.5 91.9 97.0 92.0 93.2 95.5 96.2 88.8 86.1 86.0 94.0 89.9 95.3 91.2 97.5 97.5 97.5 95.8Yes - once 1.2 3.2 2.0 1.9 2.8 7.5 3.4 11.3 2.6 5.8 1.4 5.6 1.0 1.8 0.6Yes - more than once 1.4 3.1 0.4 2.0 2.3 1.2 1.9 6.3 0.8 1.0 2.7 1.4 2.1 0.7 0.6 1.7Yes - frequently 2.6 0.9 2.0 1.8 3.2 1.5 0.7 0.3 1.1 1.0 1.1 0.6 0.7 0.7 2.0DK/NA 1.3 1.8 1.8 2.0 0.7 1.0 0.3 3.5 1.9 2.1 0.5 0.9 0.2 0.5 0.5TOTAL 100.0 100.0 100.0 100.0 100.0 100.0 100.0 100.0 100.0 100.0 100.0 100.0 100.0 100.0 100.0 100.0 100.0 100.0Source: EWS opinion poll conducted by PRISM Research
Table IIa
To what degree you agree or disagree that prewar residents of your municipality who are not of the majorityethnicity should return to their homes? (%)
GenderUrban Rural Male Female
Nov 2007 Jun. 2008 Sep 2008 Nov 2008 Nov 2007 Jun. 2008 Sep 2008 Nov 2008 Nov 2007 Jun. 2008 Sep 2008 Nov 2008 Nov 2007 Jun. 2008 Sep 2008 Nov 2008
TOTAL DISAGREE 12.6 10.8 12.6 6.2 11.8 11.0 11.6 9.0 12.5 13.1 12.6 8.8 11.8 8.8 11.5 6.9TOTAL AGREE 83.4 85.4 83.0 90.5 84.9 85.2 85.0 87.9 85.6 84.7 83.0 88.1 83.0 85.8 85.2 89.8DK/NA 4.0 3.9 4.4 3.3 3.3 3.8 3.4 3.1 1.9 2.2 4.4 3.2 5.2 5.3 3.2 3.2Total 100.0 100.0 100.0 100.0 100.0 100.0 100.0 100.0 100.0 100.0 100.0 100.0 100.0 100.0 100.0 100.0Source: EWS opinion poll conducted by PRISM Research
Table IIb
To what degree you agree or disagree that prewar residents of your municipality who are not of the majorityethnicity should return to their homes?
Age18 - 35 36 - 50 51 +
Nov 2007 Jun. 2008 Sep 2008 Nov 2008 Nov 2007 Jun. 2008Sep 2008 Nov 2008 Nov 2007 Jun. 2008 Sep 2008 Nov 2008% % % % % % % % % % % %
TOTAL DISAGREE 12.8 11.0 11.0 6.0 12.1 7.8 10.1 7.9 11.6 12.6 14.1 9.6TOTAL AGREE 83.1 86.0 83.6 90.5 86.1 88.2 85.3 89.6 84.0 83.4 83.9 87.0DK/NA 4.1 3.0 5.4 3.5 1.8 4.0 4.6 2.4 4.4 4.1 1.9 3.4Total 100.0 100.0 100.0 100.0 100.0 100.0 100.0 100.0 100.0 100.0 100.0 100.0
Source: EWS opinion poll conducted by PRISM Research
Table IIc
To what degree you agree or disagree that prewar residents of your municipality who are not of the majorityethnicity should return to their homes? (%)
AREABosniak majority areas Croat majority areas Serb majority areas
Jun. 2008 Sep 2008 Nov 2008 Jun. 2008 Sep 2008 Nov 2008 Jun. 2008 Sep 2008 Nov 2008Population Maj. Min. Maj. Min. Maj. Min. Maj. Min. Maj. Min. Maj. Min. Maj. Min. Maj. Min. Maj. Min.
% % % % % % % % % % % % % % % % % %TOTAL DISAGREE 9.5 7.6 5.0 7.6 5.6 2.5 13.5 21.8 29.5 14.2 13.2 8.1 11.7 15.6 15.0 12.7 9.1 7.0TOTAL AGREE 87.3 91.1 92.7 91.1 92.1 94.7 80.9 77.5 60.8 82.9 79.6 80.5 84.1 82.0 81.1 80.0 87.6 90.8DK/NA 3.2 1.4 2.3 1.4 2.3 2.8 5.6 0.7 9.7 2.9 7.2 11.4 4.2 2.4 3.8 7.3 3.3 2.2Total 100.0 100.0 100.0 100.0 100.0 100.0 100.0 100.0 100.0 100.0 100.0 100.0 100.0 100.0 100.0 100.0 100.0 100.0Source: EWS opinion poll conducted by PRISM Research

Ann
ual R
epor
t 200
8
48
Table IIIc
To which of the following categories does your family/household belong? (%)
AREABosniak majority areas Croat majority areas Serb majority areas
Jun. 2008 Sep 2008 Nov 2008 Jun. 2008 Sep 2008 Nov 2008 Jun. 2008 Sep 2008 Nov 2008Population Maj. Min. Maj. Min. Maj. Min. Maj. Min. Maj. Min. Maj. Min. Maj. Min. Maj. Min. Maj. Min.Resident, never moved away 75.8 74.6 64.1 62.3 70.3 50.9 78.1 60.6 78.1 36.4 69.9 48.4 69.4 23.0 64.1 41.6 67.5 33.7Displaced - lived elsewhere beforethe war 6.6 3.8 7.0 4.5 2.0 3.4 6.8 5.8 5.0 10.3 17.5 19.8 13.5 22.4 10.9 21.0 0.5Refugee from another country 0.3 2.0 0.6 1.1 1.4 0.3 0.7 1.4 2.4 0.9 0.7Returnee 9.9 18.5 16.4 28.8 13.7 44.3 14.0 23.4 9.2 49.5 13.2 29.0 4.5 58.9 4.7 43.2 4.8 52.6Moved here after the war 5.4 1.8 10.3 4.0 7.1 2.8 2.5 5.6 2.9 7.0 2.0 1.0 3.7 2.3 4.7 1.8 3.5 5.7DK/NA 1.9 1.2 2.1 2.9 3.7 2.1 2.6 2.6 2.0 4.1 3.4 1.2 3.3 2.5 2.4 7.4TOTAL 100.0 100.0 100.0 100.0 100.0 100.0 100.0 100.0 100.0 100.0 100.0 100.0 100.0 100.0 100.0 100.0 100.0 100.0Source: EWS opinion poll conducted by PRISM Research
Table IIIa
To which of the following categories does your family/household belong? (%)
GenderUrban Rural Male Female
Nov 2007 Jun. 2008 Sep 2008 Nov 2008 Nov 2007 Jun. 2008 Sep 2008 Nov 2008 Nov 2007 Jun. 2008 Sep 2008 Nov 2008 Nov 2007 Jun. 2008 Sep 2008 Nov 2008
Resident, never moved away66.5 72.0 62.2 59.6 72.0 74.0 67.2 74.3 71.4 72.7 66.6 67.7 67.9 73.5 63.6 68.5Displaced - lived elsewhere before the war 15.3 12.5 16.3 15.6 14.0 10.4 10.7 9.3 15.8 11.4 13.1 12.7 13.4 11.3 13.1 11.3Refugee from anothercountry 0.8 1.0 0.5 1.0 0.2 0.5 0.7 0.5 0.4 0.5 0.8 0.4 0.4 0.9 0.4 0.9Returnee 5.4 7.7 9.8 11.4 6.3 9.8 13.2 10.5 6.5 10.2 11.0 10.3 5.4 7.7 12.5 11.4Moved here after the war 8.4 5.7 9.6 8.9 4.4 3.3 4.9 2.2 3.5 3.9 6.4 5.9 8.7 4.7 7.4 4.3DK/NA 3.6 1.0 1.6 3.5 3.1 2.0 3.4 3.1 2.5 1.3 2.1 2.9 4.2 1.8 3.1 3.6TOTAL 100.0 100.0 100.0 100.0 100.0 100.0 100.0 100.0 100.0 100.0 100.0 100.0 100.0 100.0 100.0 100.0Source: EWS opinion poll conducted by PRISM Research
Table IIIb
To which of the following categories does your family/household belong?
Age18 - 35 36 - 50 50 +
Nov 2007 Jun. 2008 Sep 2008 Nov 2008 Nov 2007 Jun. 2008 Sep 2008 Nov 2008 Nov 2007 Jun. 2008 Sep 2008 Nov 2008% % % % % % % % % % % %
Resident, never moved away 63.5 72.8 64.0 67.9 72.7 72.4 62.0 64.3 73.0 73.9 67.7 70.8Displaced - lived elsewhere before the war 16.2 9.2 11.5 11.4 15.3 15.0 17.3 12.4 12.5 11.2 12.3 12.3Refugee from another country 0.4 1.2 0.6 0.7 0.0 0.2 1.2 0.3 0.7 0.8 1.0Returnee 4.5 8.7 9.3 10.0 4.8 6.6 12.1 13.7 7.9 10.5 13.9 9.7Moved here after the war 10.8 6.7 12.0 7.3 5.1 4.9 6.3 5.0 2.6 2.2 2.5 2.8DK/NA 4.6 1.5 2.7 3.2 1.4 1.1 2.0 3.4 3.6 1.5 2.8 3.3TOTAL 100.0 100.0 100.0 100.0 100.0 100.0 100.0 100.0 100.0 100.0 100.0 100.0Source: EWS opinion poll conducted by PRISM Research

Annual Report 2008
49Table IVa
How acceptable do you find it...? (%Croat M.A. Serb M.A.
Mar. 2008 Jun. 2008 Sep 2008 Mar. 2008 Jun. 2008 Sep 2008to live in the same country as Bosniaks
Entirely acceptable 50.8 49.8 61.2 48.5 34.5 38.1Basically acceptable 26.1 17.6 20.3 32.7 36.2 37.9Basically unacceptable 8.3 16.6 11.6 7.7 13.4 11.7Entirely unacceptable 10.5 13.3 2.9 9.4 12.1 10.8DK/NA 4.3 2.6 4.0 1.8 3.8 1.6
Total 100.0 100.0 100.0 100.0 100.0 100.0to live in the same country as Bosniaks
Total acceptable 76.9 67.4 81.6 81.1 70.7 76.0Total unacceptable 18.8 29.9 14.4 17.0 25.5 22.4DK/NA 4.3 2.6 4.0 1.8 3.8 1.6
Total 100.0 100.0 100.0 100.0 100.0 100.0to have Bosniaks as neighbours
Entirely acceptable 49.1 48.5 57.0 46.5 32.4 36.2Basically acceptable 27.0 18.6 19.6 29.8 37.5 38.1Basically unacceptable 9.4 16.7 15.7 9.7 13.8 12.9Entirely unacceptable 10.2 13.5 3.2 10.6 12.3 11.3DK/NA 4.3 2.6 4.4 3.4 4.1 1.4
Total 100.0 100.0 100.0 100.0 100.0 100.0to have Bosniaks as neighbours
Total acceptable 76.1 67.2 76.7 76.3 69.8 74.3Total unacceptable 19.6 30.2 18.9 20.3 26.1 24.2DK/NA 4.3 2.6 4.4 3.4 4.1 1.4
Total 100.0 100.0 100.0 100.0 100.0 100.0for Bosniak children to go to the same school as your children
Entirely acceptable 47.7 48.6 54.3 45.1 33.3 37.4Basically acceptable 27.3 16.7 16.9 30.0 34.9 36.7Basically unacceptable 10.3 18.5 18.6 12.7 14.4 13.3Entirely unacceptable 10.2 13.3 6.1 9.6 12.5 11.1DK/NA 4.5 3.0 4.2 2.6 5.0 1.6
Total 100.0 100.0 100.0 100.0 100.0 100.0for Bosniak children to go to the same school as your children
Total acceptable 75.0 65.3 71.2 75.1 68.1 74.1Total unacceptable 20.5 31.7 24.6 22.3 26.9 24.3DK/NA 4.5 3.0 4.2 2.6 5.0 1.6
Total 100.0 100.0 100.0 100.0 100.0 100.0to have a Bosniak boss
Entirely acceptable 45.3 45.5 51.7 31.1 28.3 31.3Basically acceptable 23.2 17.1 15.7 26.2 30.6 30.3Basically unacceptable 15.1 20.2 17.1 20.3 20.5 19.4Entirely unacceptable 11.8 13.5 9.3 17.0 14.8 14.7DK/NA 4.5 3.6 6.2 5.3 5.9 4.3
Total 100.0 100.0 100.0 100.0 100.0 100.0to have a Bosniak boss
Total acceptable 68.6 62.6 67.4 57.3 58.9 61.6Total unacceptable 26.9 33.8 26.4 37.4 35.2 34.2DK/NA 4.5 3.6 6.2 5.3 5.9 4.3
Total 100.0 100.0 100.0 100.0 100.0 100.0for a family member to marry a Bosniak
Entirely acceptable 18.6 29.8 23.9 13.5 14.7 15.9Basically acceptable 10.7 6.4 4.2 13.5 13.1 19.2Basically unacceptable 28.1 19.4 21.2 24.7 20.3 19.3Entirely unacceptable 36.5 40.9 44.5 41.8 42.2 39.6DK/NA 6.0 3.6 6.1 6.5 9.7 6.0
Total 100.0 100.0 100.0 100.0 100.0 100.0for a family member to marry a Bosniak
Total acceptable 29.4 36.2 28.1 27.0 27.9 35.1Total unacceptable 64.6 60.3 65.7 66.5 62.7 58.9DK/NA 6.0 3.6 6.1 6.5 9.5 6.0
Total 100.0 100.0 100.0 100.0 100.0 100.0Source: EWS opinion poll conducted by PRISM Research

Ann
ual R
epor
t 200
8
50 Table V
How acceptable do you find it...? (%)
Bosniak MA Serb MAJun. 2008 Sep 2008 Nov 2008 Jun. 2008 Sep 2008 Nov 2008
Maj. Maj. Maj. Maj. Maj. Maj.% % % % % %
to live in the same country as Croats Entirely acceptable 91.5 90.7 90.2 50.5 35.7 37.9Basically acceptable 4.5 6.0 5.1 31.2 36.1 39.7Basically unacceptable 1.4 0.6 0.7 8.5 14.6 10.0Entirely unacceptable 1.5 0.5 0.1 8.6 10.6 10.6DK/NA 1.0 2.2 3.8 1.1 3.0 1.8
Total 100.0 100.0 100.0 100.0 100.0 100.0to live in the same country as Croats Total acceptable 96.0 96.7 95.3 81.8 71.8 77.6
Total unacceptable 2.9 1.1 0.9 17.1 25.2 20.6DK/NA 1.0 2.2 3.8 1.1 3.0 1.8
Total 100.0 100.0 100.0 100.0 100.0 100.0to have Croats as neighbours Entirely acceptable 91.9 88.5 89.9 49.0 33.8 37.3
Basically acceptable 4.3 8.1 5.4 28.6 37.6 39.5Basically unacceptable 1.4 0.7 0.7 10.7 14.5 10.9Entirely unacceptable 1.3 0.5 0.1 9.4 10.8 10.8DK/NA 1.0 2.2 3.8 2.2 3.3 1.4
Total 100.0 100.0 100.0 100.0 100.0 100.0to have Croats as neighbours Total acceptable 96.2 96.6 95.3 77.6 71.4 76.9
Total unacceptable 2.8 1.2 0.9 20.2 25.3 21.7DK/NA 1.0 2.2 3.8 2.2 3.3 1.4
Total 100.0 100.0 100.0 100.0 100.0 100.0for Croat children to go to the same school as your children
Entirely acceptable 91.8 87.3 89.8 48.4 33.4 38.1Basically acceptable 4.5 7.8 5.0 28.9 35.4 37.3Basically unacceptable 1.2 1.4 0.7 11.3 15.4 12.4Entirely unacceptable 1.3 1.4 0.1 8.6 11.2 10.4DK/NA 1.1 2.2 4.3 2.8 4.6 1.8
Total 100.0 100.0 100.0 100.0 100.0 100.0for Croat children to go to the same school as your children
Total acceptable 96.3 95.1 94.8 77.3 68.8 75.4Total unacceptable 2.5 2.7 0.9 19.9 26.6 22.8DK/NA 1.1 2.2 4.3 2.8 4.6 1.8
Total 100.0 100.0 100.0 100.0 100.0 100.0to have a Croat boss Entirely acceptable 90.5 84.9 85.9 35.7 30.4 34.3
Basically acceptable 5.2 8.3 6.5 26.3 30.9 33.6Basically unacceptable 1.2 2.6 1.3 18.0 20.1 15.0Entirely unacceptable 1.3 2.0 1.4 14.5 13.6 13.2DK/NA 1.8 2.2 4.9 5.5 5.1 4.0
Total 100.0 100.0 100.0 100.0 100.0 100.0to have a Croat boss Total acceptable 95.7 93.2 92.5 62.0 61.3 67.8
Total unacceptable 2.5 4.6 2.7 32.5 33.6 28.2DK/NA 1.8 2.2 4.9 5.5 5.1 4.0
Total 100.0 100.0 100.0 100.0 100.0 100.0for a family member to marry a Croat Entirely acceptable 27.1 24.5 24.1 17.8 14.3 16.9
Basically acceptable 8.6 8.0 9.1 20.4 13.4 23.0Basically unacceptable 13.0 13.8 13.8 19.6 24.6 18.3Entirely unacceptable 44.3 48.2 44.7 35.6 37.2 36.3DK/NA 7.0 5.6 8.3 6.5 10.5 5.4
Total 100.0 100.0 100.0 100.0 100.0 100.0for a family member to marry a Croat Total acceptable 35.7 32.4 33.2 38.2 27.7 39.9
Total unacceptable 57.3 62.0 58.5 55.3 62.0 54.7DK/NA 7.0 5.6 8.3 6.5 10.3 5.4
Total 100.0 100.0 100.0 100.0 100.0 100.0Source: EWS opinion poll conducted by PRISM Research

Annual Report 2008
51Table VI
How acceptable do you find it...? (%)
Bosniak majority areas Croat majority areasJun. 2008 Sep 2008 Nov 2008 Jun. 2008 Sep 2008 Nov 2008
Maj. Maj. Maj. Maj. Maj. Maj.to live in the same country as Serbs Entirely acceptable 90.9 86.7 87.7 48.1 49.8 57.6
Basically acceptable 4.4 7.0 4.9 26.8 19.0 22.1Basically unacceptable 1.8 1.1 2.5 11.9 15.7 12.4Entirely unacceptable 1.9 2.9 0.6 9.3 12.9 4.2DK/NA 1.0 2.3 4.2 4.0 2.6 3.6
Total 100.0 100.0 100.0 100.0 100.0 100.0to live in the same country as Serbs Total acceptable 95.3 93.7 92.6 74.8 68.7 79.7
Total unacceptable 3.7 4.0 3.1 21.1 28.6 16.6DK/NA 1.0 2.3 4.2 4.0 2.6 3.6
Total 100.0 100.0 100.0 100.0 100.0 100.0to have Serbs as neighbours Entirely acceptable 91.1 84.4 87.6 46.4 49.6 55.8
Basically acceptable 4.1 8.3 5.4 28.2 18.2 22.8Basically unacceptable 1.9 2.0 2.2 11.5 16.4 13.0Entirely unacceptable 1.9 2.9 0.6 9.8 13.2 5.1DK/NA 1.0 2.3 4.2 4.0 2.6 3.2
Total 100.0 100.0 100.0 100.0 100.0 100.0to have Serbs as neighbours Total acceptable 95.2 92.7 92.9 74.6 67.8 78.6
Total unacceptable 3.8 5.0 2.8 21.3 29.6 18.2DK/NA 1.0 2.3 4.2 4.0 2.6 3.2
Total 100.0 100.0 100.0 100.0 100.0 100.0for Serb children to go to the same school as your children
Entirely acceptable 90.5 82.9 87.9 45.7 47.5 53.8Basically acceptable 4.1 8.2 5.1 28.6 20.0 21.4Basically unacceptable 1.9 2.8 2.2 11.8 15.5 14.6Entirely unacceptable 1.9 3.7 0.6 9.9 14.0 7.0DK/NA 1.7 2.3 4.2 4.0 3.0 3.2
Total 100.0 100.0 100.0 100.0 100.0 100.0for Serb children to go to the same school as your children
Total acceptable 94.6 91.2 92.9 74.3 67.5 75.2Total unacceptable 3.8 6.5 2.8 21.6 29.5 21.6DK/NA 1.7 2.3 4.2 4.0 3.0 3.2
Total 100.0 100.0 100.0 100.0 100.0 100.0to have a Serb boss Entirely acceptable 88.6 81.9 83.7 39.8 44.6 47.8
Basically acceptable 4.4 7.8 5.5 23.5 19.3 21.0Basically unacceptable 2.3 3.7 4.4 19.9 18.6 16.3Entirely unacceptable 1.9 4.3 1.6 12.7 14.5 10.1DK/NA 2.9 2.3 4.9 4.0 3.0 4.8
Total 100.0 100.0 100.0 100.0 100.0 100.0to have a Serb boss Total acceptable 93.0 89.7 89.1 63.3 63.9 68.8
Total unacceptable 4.1 8.0 6.0 32.6 33.2 26.4DK/NA 2.9 2.3 4.9 4.0 3.0 4.8
Total 100.0 100.0 100.0 100.0 100.0 100.0for a family member to marry a Serb Entirely acceptable 24.8 20.5 20.5 19.0 28.3 18.8
Basically acceptable 7.8 6.4 8.4 11.3 9.2 5.9Basically unacceptable 9.4 14.6 12.8 30.8 21.0 26.7Entirely unacceptable 49.7 51.5 49.3 33.4 37.6 43.4DK/NA 8.3 7.0 9.0 5.5 3.9 5.3
Total 100.0 100.0 100.0 100.0 100.0 100.0for a family member to marry a Serb Total acceptable 32.6 26.9 29.0 30.3 37.5 24.6
Total unacceptable 59.1 66.1 62.1 64.2 58.6 70.1DK/NA 8.3 7.0 9.0 5.5 3.9 5.3
Total 100.0 100.0 100.0 100.0 100.0 100.0Source: EWS opinion polls conducted by PRISM Research

Ann
ual R
epor
t 200
8
52
Table VIIc
Would you move to a town where you do not belong to the majority ethnicity for work? (%)
AREABosniak majority areas Croat majority areas Serb majority areas
Jun. 2008 Sep 2008 Nov 2008 Jun. 2008 Sep 2008 Nov 2008 Jun. 2008 Sep 2008 Nov 2008Population Maj. Min. Maj. Min. Maj. Min. Maj. Min. Maj. Min. Maj. Min. Maj. Min. Maj. Min. Maj. Min.Yes 36.7 45.6 39.0 42.9 39.4 39.0 42.8 36.8 30.9 15.9 32.1 45.3 29.0 57.1 26.7 43.3 25.1 28.8No 52.3 45.6 53.2 48.6 53.9 58.8 42.6 51.9 58.3 65.2 51.8 44.9 56.4 34.8 59.2 38.5 65.1 58.9DK/NA 11.0 8.8 7.9 8.5 6.8 2.2 14.6 11.3 10.9 18.9 16.1 9.8 14.5 8.1 14.1 18.2 9.8 12.3Total 100.0 100.0 100.0 100.0 100.0 100.0 100.0 100.0 100.0 100.0 100.0 100.0 100.0 100.0 100.0 100.0 100.0 100.0Source: EWS opinion poll conducted by PRISM Research
Table VIIa
Would you move to a town where you do not belong to the majority ethnicity for work? (%)
GenderUrban Rural Male Female
Nov 2007 Jun. 2008 Sep 2008 Nov 2008 Nov 2007 Jun. 2008 Sep 2008 Nov 2008 Nov 2007 Jun. 2008 Sep 2008 Nov 2008 Nov 2007 Jun. 2008 Sep 2008 Nov 2008
Yes 36.0 34.6 36.1 31.7 34.8 34.5 29.6 33.6 36.7 38.0 37.1 34.7 34.0 31.2 27.9 31.0No 57.4 50.5 52.5 60.9 55.4 54.5 60.4 56.4 55.3 47.8 53.5 57.0 57.2 57.6 60.4 59.6DK/NA 6.6 14.9 11.4 7.4 9.8 11.0 10.0 10.0 8.0 14.3 9.4 8.3 8.8 11.2 11.7 9.5Total 100.0 100.0 100.0 100.0 100.0 100.0 100.0 100.0 100.0 100.0 100.0 100.0 100.0 100.0 100.0 100.0Source: EWS opinion poll conducted by PRISM Research
Table VIIb
Would you move to a town where you do not belong to the majority ethnicity for work? (%)
Age18 - 35 36 - 50 50 +
Nov 2007 Jun. 2008 Sep 2008 Nov 2008 Nov 2007 Jun. 2008Sep 2008 Nov 2008 Nov 2007 Jun. 2008 Sep 2008 Nov 2008Yes 48.1 47.4 45.0 49.9 39.2 38.0 30.8 28.6 21.0 21.9 21.2 18.2No 42.4 37.5 43.1 41.8 52.7 46.8 56.4 60.7 71.4 69.2 70.8 73.6DK/NA 9.6 15.1 12.0 8.3 8.1 15.2 12.9 10.8 7.6 8.8 7.9 8.2Total 100.0 100.0 100.0 100.0 100.0 100.0 100.0 100.0 100.0 100.0 100.0 100.0Source: EWS opinion poll conducted by PRISM Research
Table VIIIa
How proud are you of your ethnicity? Gender
Urban Rural Male FemaleNov 2007 Jun. 2008 Sep 2008 Nov 2008 Nov 2007 Jun. 2008 Sep 2008 Nov 2008 Nov 2007 Jun. 2008 Sep 2008 Nov 2008 Nov 2007 Jun. 2008 Sep 2008 Nov 2008
% % % % % % % % % % % % % % % %Very 82.6 78.7 77.3 81.0 85.0 83.8 86.8 83.3 80.9 79.9 82.4 82.2 86.9 83.2 83.1 82.5Somewhat 12.4 13.3 16.2 11.7 10.9 11.0 8.3 10.0 13.9 13.1 11.4 11.0 9.2 11.0 11.9 10.5Not very 2.7 3.0 3.8 2.6 2.7 2.4 2.6 3.2 3.5 2.4 3.4 3.1 2.0 3.0 2.8 2.8Not all 0.1 1.2 0.5 0.7 0.4 0.5 0.5 1.1 0.4 1.2 0.8 1.2 0.2 0.4 0.2 0.7It's not important 2.1 2.2 1.5 2.8 1.0 2.2 1.1 1.6 1.3 2.7 1.8 1.1 1.7 1.7 0.8 3.0DK 0.3 0.5 0.9 0.2 0.4 1.2 0.2 0.6NA 0.0 1.2 0.2 0.3 0.1 0.5 0.4 0.6 0.1 0.2 0.0 0.6 0.6 0.5Total 100.0 100.0 100.0 100.0 100.0 100.0 100.0 100.0 100.0 100.0 100.0 100.0 100.0 100.0 100.0 100.0Source: EWS opinion poll conducted by PRISM Research

Annual Report 2008
53Table VIIIb
How proud are you of your ethnicity? (%) Age
18 - 35 36 - 50 50 +Nov 2007 Jun. 2008 Sep 2008 Nov 2008 Nov 2007 Jun. 2008Sep 2008 Nov 2008 Nov 2007 Jun. 2008 Sep 2008 Nov 2008
Very 83.2 81.6 80.0 80.7 82.4 81.8 84.3 84.9 85.8 81.3 84.5 82.2Somewhat 13.6 11.1 13.8 13.9 13.3 12.9 13.0 8.2 8.4 12.6 8.8 9.2Not very 2.4 3.1 4.1 3.2 2.0 1.7 1.7 3.6 3.5 3.0 3.0 2.3Not all 0.1 0.5 0.0 0.3 0.3 0.3 0.1 1.0 0.4 1.3 1.2 1.6It's not important 0.7 2.6 1.3 1.3 2.1 3.2 0.8 2.3 1.8 1.3 1.5 2.8DK 0.4 0.5 0.3 0.4 1.1NA 0.0 1.2 0.3 0.2 0.1 0.3 0.7 0.8Total 100.0 100.0 100.0 100.0 100.0 100.0 100.0 100.0 100.0 100.0 100.0 100.0Source: EWS opinion poll conducted by PRISM Research
Table VIIIc
How proud are you of your ethnicity? (%)AREA
Bosniak majority areas Croat majority areas Serb majority areasJun. 2008 Sep 2008 Nov 2008 Jun. 2008 Sep 2008 Nov 2008 Jun. 2008 Sep 2008 Nov 2008
Population Maj. Min. Maj. Min. Maj. Min. Maj. Min. Maj. Min. Maj. Min. Maj. Min. Maj. Min. Maj. Min.Very 91.1 74.5 87.4 84.7 84.7 90.9 77.3 85.1 78.3 72.9 80.7 87.9 71.3 71.4 78.4 82.7 79.3 87.8Somewhat 4.8 10.7 8.6 8.6 8.6 4.9 13.3 8.9 11.9 11.1 10.2 3.1 20.5 16.2 15.5 9.3 13.7 5.0Not very 0.7 2.1 2.8 0.9 3.7 2.7 4.5 2.8 6.4 2.0 2.3 1.0 4.5 1.1 2.5 1.8 2.5Not all 0.4 4.7 0.1 0.9 0.3 1.1 2.2 1.0 0.5 1.1 2.4 0.7 0.9 1.9It's not important 2.0 7.4 0.9 4.9 1.1 0.7 3.6 1.1 1.5 7.6 6.0 6.0 2.0 4.4 1.5 5.4 2.2 6.4DK 0.2 0.1 1.1 0.8 1.1 0.6 0.2NA 0.7 0.6 0.5 0.2 0.8 6.3 0.3 2.1 0.6 3.5 0.7 0.2 0.7Total 100.0 100.0 100.0 100.0 100.0 100.0 100.0 100.0 100.0 100.0 100.0 100.0 100.0 100.0 100.0 100.0 100.0 100.0Source: EWS opinion poll conducted by PRISM Research
Table IXa
How proud are you of being a citizen of Bosnia and Herzegovina? (%)
GENDERUrban Rural Male Female
Nov 2007 Jun. 2008 Sep 2008 Nov 2008 Nov 2007 Jun. 2008 Sep 2008 Nov 2008 Nov 2007 Jun. 2008 Sep 2008 Nov 2008 Nov 2007 Jun. 2008 Sep 2008 Nov 2008
Very 52.9 51.5 46.3 51.5 50.6 53.1 55.5 54.4 49.4 51.3 49.7 52.6 53.6 53.4 53.4 53.8Somewhat 16.0 14.8 21.2 14.5 17.1 14.3 21.6 19.2 17.5 13.4 21.4 16.9 15.9 15.5 21.5 17.5Not very 11.2 12.1 13.8 12.4 9.4 11.1 9.6 8.7 8.9 12.3 11.9 10.1 11.4 10.8 10.9 10.5Not all 9.2 10.2 9.1 11.5 11.0 6.7 5.6 6.8 13.2 9.3 7.6 9.1 7.3 7.2 6.7 8.5It's not important 9.9 9.5 7.9 8.4 10.6 13.7 4.9 9.3 10.0 12.2 7.5 9.4 10.5 11.7 5.0 8.4DK 0.6 1.0 1.0 0.3 0.3 0.9 0.9 0.1 0.2 0.8 1.6 0.3 0.7 1.1 0.2NA 0.9 1.3 0.6 0.6 0.9 0.8 1.7 0.8 0.9 1.3 1.1 0.3 0.9 0.7 1.4 1.1Total 100.0 100.0 100.0 100.0 100.0 100.0 100.0 100.0 100.0 100.0 100.0 100.0 100.0 100.0 100.0 100.0Source: EWS opinion poll conducted by PRISM Research

Ann
ual R
epor
t 200
8
54
Table Xa
If international security forces withdrew, do you think war could break out again? (%)
TIP GenderUrban Rural Male Female
Nov 2007 Jun. 2008 Sep 2008 Nov 2008 Nov 2007 Jun. 2008 Sep 2008 Nov 2008 Nov 2007 Jun. 2008 Sep 2008 Nov 2008 Nov 2007 Jun. 2008 Sep 2008 Nov 2008
Yes 26.2 14.0 19.9 21.9 33.3 16.8 17.3 23.8 32.3 16.2 20.9 23.9 28.3 15.0 16.1 22.1No 62.1 71.7 63.9 67.4 56.7 71.3 71.5 63.6 60.4 73.9 67.5 66.5 57.7 69.2 68.9 64.1DK/NA 11.6 14.3 16.2 10.6 10.0 11.8 11.2 12.6 7.2 9.9 11.6 9.6 14.0 15.8 15.0 13.8Total 100.0 100.0 100.0 100.0 100.0 100.0 100.0 100.0 100.0 100.0 100.0 100.0 100.0 100.0 100.0 100.0Source: EWS opinion poll conducted by PRISM Research
Table Xb
If international security forces withdrew, do you think war could break out again? (%)
Age18 - 35 36 - 50 50 +
Nov 2007 Jun. 2008 Sep 2008 Nov 2008 Nov 2007 Jun. 2008Sep 2008 Nov 2008 Nov 2007 Jun. 2008 Sep 2008 Nov 2008Yes 32.6 11.4 19.0 22.3 26.9 21.0 14.7 24.8 30.5 16.6 19.9 22.5No 56.7 77.6 66.7 62.2 62.6 65.5 72.6 66.1 58.6 70.3 67.2 67.8DK/NA 10.7 11.0 14.2 15.5 10.5 13.5 12.7 9.1 10.9 13.1 12.8 9.8Total 100.0 100.0 100.0 100.0 100.0 100.0 100.0 100.0 100.0 100.0 100.0 100.0Source: EWS opinion poll conducted by PRISM Research
Table IXb
How proud are you of being a citizen of Bosnia and Herzegovina? (%)
Age18 - 35 36 - 50 50 +
Nov 2007 Jun. 2008 Sep 2008 Nov 2008 Nov 2007 Jun. 2008Sep 2008 Nov 2008 Nov 2007 Jun. 2008 Sep 2008 Nov 2008Very 54.1 52.9 50.8 51.5 50.4 51.5 46.3 56.6 50.1 51.8 55.2 52.6Somewhat 18.9 14.7 26.7 20.5 17.5 11.6 20.7 14.1 14.1 15.7 16.8 16.0Not very 6.8 11.2 10.3 12.2 9.6 11.6 12.6 8.9 13.7 12.1 11.8 9.3Not all 8.6 6.9 6.8 6.7 11.5 9.4 10.0 11.3 10.9 8.8 5.9 9.2It's not important 10.8 12.8 3.9 7.9 9.6 15.4 8.9 8.5 10.3 9.7 7.0 10.3DK 0.2 0.1 0.5 0.9 0.1 0.3 1.2 0.5 0.2 0.8 1.2 1.2NA 0.7 1.3 1.0 0.4 1.3 0.1 0.3 0.8 1.1 2.0 1.6Total 100.0 100.0 100.0 100.0 100.0 100.0 100.0 100.0 100.0 100.0 100.0 100.0Source: EWS opinion poll conducted by PRISM Research
Table IXc
How proud are you of being a citizen of Bosnia and Herzegovina? (%)
AREABosniak majority areas Croat majority areas Serb majority areas
Jun. 2008 Sep 2008 Nov 2008 Jun. 2008 Sep 2008 Nov 2008 Jun. 2008 Sep 2008 Nov 2008Population Maj. Min. Maj. Min. Maj. Min. Maj. Min. Maj. Min. Maj. Min. Maj. Min. Maj. Min. Maj. Min.Very 89.8 78.0 81.1 76.7 80.7 87.0 35.6 69.2 36.1 60.2 32.5 75.4 12.7 54.3 21.0 60.8 23.7 72.9Somewhat 4.0 10.0 12.4 9.6 11.2 8.7 21.1 7.6 29.1 16.3 33.8 12.5 25.1 16.3 30.2 15.1 20.1 9.8Not very 1.5 2.1 4.1 6.9 5.4 2.7 15.8 9.3 16.3 3.1 13.8 3.0 22.3 3.2 18.7 10.8 15.7 1.1Not all 1.7 4.1 0.7 1.9 0.4 12.9 9.2 6.2 6.5 4.7 1.1 14.4 8.4 15.0 20.8 5.3It's not important 2.1 3.4 0.9 4.9 0.8 11.6 3.2 8.8 7.6 14.0 6.7 23.9 13.3 11.6 10.9 17.7 10.2DK 0.2 0.6 0.9 0.8 1.3 0.5 1.4 0.3 0.5 1.1 1.2 1.2NA 0.7 2.4 0.2 0.6 0.8 1.8 1.0 2.1 6.3 0.9 1.4 1.1 3.5 2.3 2.5 0.9 0.7Total 100.0 100.0 100.0 100.0 100.0 100.0 100.0 100.0 100.0 100.0 100.0 100.0 100.0 100.0 100.0 100.0 100.0 100.0Source: EWS opinion poll conducted by PRISM Research

Annual Report 2008
55
Table XIa
Would support or personally participate in public protests, strikes, or demonstrations regarding...? (%)
GenderUrban Rural Male Female
Nov 2007 Jun. 2008 Sep 2008 Nov 2008 Nov 2007 Jun. 2008 Sep 2008 Nov 2008 Nov 2007 Jun. 2008 Sep 2008 Nov 2008 Nov 2007 Jun. 2008 Sep 2008 Nov 2008
Discrimination/to protect ethnic or civil rights48.5 54.8 53.7 47.1 52.9 52.8 45.4 49.3 55.3 56.7 52.2 49.5 46.9 50.7 45.9 47.344.8 39.0 37.8 41.8 43.5 41.6 48.0 45.7 40.7 36.3 40.9 43.9 47.4 44.5 46.2 44.26.7 6.2 8.5 11.1 3.5 5.6 6.7 5.0 4.0 7.0 6.9 6.6 5.7 4.8 7.9 8.5
Total 100.0 100.0 100.0 100.0 100.0 100.0 100.0 100.0 100.0 100.0 100.0 100.0 100.0 100.0 100.0 100.0Source: EWS opinion poll conducted by PRISM Research
Table XIb
Would support or personally participate in public protests, strikes, or demonstrations regarding...? (%)
Age18 - 35 36 - 50 50 +
Nov 2007 Jun. 2008 Sep 2008 Nov 2008 Nov 2007 Jun. 2008Sep 2008 Nov 2008 Nov 2007 Jun. 2008 Sep 2008 Nov 2008Discrimination/to protect ethnic or civil rights
53.2 57.9 51.1 56.1 57.2 62.9 57.1 53.0 44.7 45.0 42.5 37.340.9 35.5 39.3 36.6 39.6 31.2 38.1 39.0 50.2 50.2 50.8 55.2
Total 5.9 6.6 9.6 7.3 3.2 5.9 4.8 8.0 5.2 4.9 6.7 7.5100.0 100.0 100.0 100.0 100.0 100.0 100.0 100.0 100.0 100.0 100.0 100.0
Source: EWS opinion poll conducted by PRISM Research
Table XIc
Would support or personally participate in public protests, strikes, or demonstrations regarding...? (%)
AREABosniak majority areas Croat majority areas Serb majority areas
Jun. 2008 Sep 2008 Nov 2008 Jun. 2008 Sep 2008 Nov 2008 Jun. 2008 Sep 2008 Nov 2008Maj. Min. Maj. Min. Maj. Min. Maj. Min. Maj. Min. Maj. Min. Maj. Min. Maj. Min. Maj. Min.
Discrimination/to protect ethnic or civil rights61.3 53.2 49.8 39.1 56.2 54.3 41.2 35.5 54.3 48.9 57.3 40.4 50.5 41.8 47.3 46.5 39.0 33.131.5 38.9 42.0 48.6 34.0 41.3 50.8 61.6 35.7 34.5 34.9 57.6 45.5 53.5 46.5 49.0 55.6 63.07.1 7.9 8.1 12.3 9.8 4.5 8.0 2.9 10.0 16.6 7.9 2.1 4.0 4.7 6.2 4.4 5.3 3.9
Total 100.0 100.0 100.0 100.0 100.0 100.0 100.0 100.0 100.0 100.0 100.0 100.0 100.0 100.0 100.0 100.0 100.0 100.0Source: EWS opinion poll conducted by PRISM Research
Table Xc
If international security forces withdrew, do you think war could break out again? (%)
AREABosniak majority areas Croat majority areas Serb majority areas
Jun. 2008 Sep 2008 Nov 2008 Jun. 2008 Sep 2008 Nov 2008 Jun. 2008 Sep 2008 Nov 2008Population Maj. Min. Maj. Min. Maj. Min. Maj. Min. Maj. Min. Maj. Min. Maj. Min. Maj. Min. Maj. Min.Yes 16.2 20.8 26.0 17.5 29.5 13.9 12.4 26.4 15.5 19.6 18.6 27.2 15.4 18.4 11.5 13.5 17.8 27.0No 65.1 53.3 56.6 70.7 60.9 78.4 75.2 61.3 74.5 71.1 57.0 67.7 78.1 55.6 78.0 75.4 70.9 64.7DK/NA 18.7 25.8 17.4 11.8 9.5 7.7 12.4 12.3 10.0 9.3 24.5 5.2 6.5 26.0 10.5 11.1 11.3 8.3Total 100.0 100.0 100.0 100.0 100.0 100.0 100.0 100.0 100.0 100.0 100.0 100.0 100.0 100.0 100.0 100.0 100.0 100.0Source: EWS opinion poll conducted by PRISM Research

Ann
ual R
epor
t 200
8
56 Table XIIa
How much influence do you think the religious communities/churches in BiH have on current politics? (%)
GenderUrban Rural Male Female
Nov 2007 Jun. 2008 Sep 2008 Nov 2008 Nov 2007 Jun. 2008 Sep 2008 Nov 2008 Nov 2007 Jun. 2008 Sep 2008 Nov 2008 Nov 2007 Jun. 2008 Sep 2008 Nov 2008
None 9.0 11.2 11.4 11.2 11.6 14.7 18.4 15.9 10.3 14.2 14.2 14.7 10.7 12.2 16.5 13.1Little 19.3 20.3 17.8 19.6 21.5 24.3 24.5 20.8 18.9 22.4 23.9 21.4 22.1 22.8 19.4 19.2A certain amount 37.7 30.0 30.5 32.9 33.5 30.5 28.3 27.3 34.5 29.3 26.0 28.9 36.1 31.2 32.3 30.5A lot 27.2 26.2 32.9 31.1 25.6 20.0 23.1 28.1 31.2 26.4 30.9 29.5 21.6 19.0 23.8 29.3DK/NA 6.8 12.3 7.3 5.2 7.8 10.6 5.8 7.8 5.1 7.7 5.0 5.5 9.6 14.8 7.9 7.9Total 100.0 100.0 100.0 100.0 100.0 100.0 100.0 100.0 100.0 100.0 100.0 100.0 100.0 100.0 100.0 100.0Total LITTLE 28.3 31.5 29.3 30.7 33.1 39.0 42.8 36.7 29.2 36.6 38.1 36.2 32.7 35.0 36.0 32.3Total MUCH 64.9 56.2 63.4 64.0 59.1 50.5 51.4 55.5 65.6 55.7 56.9 58.4 57.7 50.2 56.1 59.8DK/NA 6.8 12.3 7.3 5.2 7.8 10.6 5.8 7.8 5.1 7.7 5.0 5.5 9.6 14.8 7.9 7.9Total 100.0 100.0 100.0 100.0 100.0 100.0 100.0 100.0 100.0 100.0 100.0 100.0 100.0 100.0 100.0 100.0Source: EWS opinion poll conducted by PRISM Research
Table XIIb
How much influence do you think the religious communities/churches in BiH have on current politics? (%)
Age18 - 35 36 - 50 50 +
Nov 2007 Jun. 2008 Sep 2008 Nov 2008 Nov 2007 Jun. 2008Sep 2008 Nov 2008 Nov 2007 Jun. 2008 Sep 2008 Nov 2008None 10.4 14.2 13.4 11.2 9.1 10.2 14.4 13.1 11.6 13.6 17.8 17.2Little 18.4 23.1 17.4 18.8 19.7 23.1 23.0 17.9 23.1 21.7 24.9 23.4A certain amount 36.3 29.9 35.2 31.2 41.5 27.7 27.7 30.5 30.0 32.1 24.4 27.6A lot 26.7 22.7 29.7 29.4 23.1 28.7 29.2 35.1 28.2 19.7 24.0 25.4DK/NA 8.2 10.1 4.3 9.4 6.7 10.3 5.7 3.3 7.2 12.8 9.0 6.3Total 100.0 100.0 100.0 100.0 100.0 100.0 100.0 100.0 100.0 100.0 100.0 100.0Total LITTLE 28.8 37.3 30.8 30.0 28.7 33.3 37.5 31.0 34.7 35.3 42.7 40.6Total MUCH 63.0 52.6 64.9 60.6 64.6 56.4 56.8 65.6 58.1 51.9 48.3 53.1DK/NA 8.2 10.1 4.3 9.4 6.7 10.3 5.7 3.3 7.2 12.8 9.0 6.3Total 100.0 100.0 100.0 100.0 100.0 100.0 100.0 100.0 100.0 100.0 100.0 100.0Source: EWS opinion poll conducted by PRISM Research
Table XIIc
How much influence do you think the religious communities/churches in BiH have on current politics? (%)
AREABosniak majority areas Croat majority areas Serb majority areas
Jun. 2008 Sep 2008 Nov 2008 Jun. 2008 Sep 2008 Nov 2008 Jun. 2008 Sep 2008 Nov 2008Population Maj. Min. Maj. Min. Maj. Min. Maj. Min. Maj. Min. Maj. Min. Maj. Min. Maj. Min. Maj. Min.None 4.7 6.8 7.3 4.9 2.1 7.4 20.7 6.1 9.2 6.6 6.2 5.7 19.2 11.8 24.5 19.2 28.0 10.4Little 17.6 10.6 12.6 10.4 18.1 13.2 29.8 28.3 29.8 11.7 16.1 14.0 25.3 35.1 29.7 31.3 22.7 25.8A certain amount 28.7 15.1 31.5 29.1 31.6 18.7 35.1 24.6 36.2 39.2 32.2 33.2 31.0 31.5 24.3 20.4 28.3 27.5A lot 32.5 45.2 43.0 45.2 45.6 58.8 10.6 38.0 14.7 35.1 25.7 43.7 16.1 12.5 14.8 14.0 13.0 24.1DK/NA 16.5 22.2 5.6 10.4 2.6 1.9 3.7 3.0 10.0 7.3 19.8 3.4 8.4 9.1 6.6 15.1 8.0 12.2Total 100.0 100.0 100.0 100.0 100.0 100.0 100.0 100.0 100.0 100.0 100.0 100.0 100.0 100.0 100.0 100.0 100.0 100.0Total LITTLE 22.3 17.5 19.9 15.3 20.2 20.5 50.5 34.4 39.0 18.3 22.3 19.7 44.5 46.9 54.2 50.5 50.7 36.2Total MUCH 61.2 60.4 74.5 74.4 77.2 77.5 45.7 62.6 51.0 74.3 57.9 76.9 47.1 44.1 39.2 34.5 41.3 51.6DK/NA 16.5 22.2 5.6 10.4 2.6 1.9 3.7 3.0 10.0 7.3 19.8 3.4 8.4 9.1 6.6 15.1 8.0 12.2Total 100.0 100.0 100.0 100.0 100.0 100.0 100.0 100.0 100.0 100.0 100.0 100.0 100.0 100.0 100.0 100.0 100.0 100.0Source: EWS opinion poll conducted by PRISM Research

Annual Report 2008
57Table XIIIa
Some people say that only the ethnic parties can protect vital ethnic interests. To what degree do you agree ordisagree with this idea? (%)
GenderUrban Rural Male Female
Nov 2007 Jun. 2008 Sep 2008 Nov 2008 Nov 2007 Jun. 2008 Sep 2008 Nov 2008 Nov 2007 Jun. 2008 Sep 2008 Nov 2008 Nov 2007 Jun. 2008 Sep 2008 Nov 2008
TOTAL DISAGREE 72.5 63.8 63.0 74.9 67.8 62.4 56.9 72.2 73.9 64.3 60.3 72.7 65.8 62.1 59.6 73.9TOTAL AGREE 19.5 22.4 26.4 16.2 21.2 23.8 28.1 18.0 20.5 24.1 27.2 19.3 20.5 22.4 27.3 15.3DK/NA 8.0 13.8 10.7 8.9 11.0 13.8 15.0 9.9 5.6 11.7 12.5 8.0 13.7 15.5 13.1 10.8Total 100.0 100.0 100.0 100.0 100.0 100.0 100.0 100.0 100.0 100.0 100.0 100.0 100.0 100.0 100.0 100.0Source: EWS opinion poll conducted by PRISM Research
Table XIIIb
Some people say that only the ethnic parties can protect vital ethnic interests. To what degree do you agree ordisagree with this idea? (%)
Age18 - 35 36 - 50 51 +
Nov 2007 Jun. 2008 Sep 2008 Nov 2008 Nov 2007 Jun. 2008Sep 2008 Nov 2008 Nov 2007 Jun. 2008 Sep 2008 Nov 2008% % % % % % % % % % % %
TOTAL DISAGREE 71.1 59.6 60.0 73.9 73.4 65.3 60.2 74.4 66.1 65.0 59.6 72.0TOTAL AGREE 20.1 26.7 29.5 14.9 19.5 21.1 25.8 17.4 21.6 21.4 26.2 19.5DK/NA 8.8 13.7 10.5 11.2 7.1 13.6 14.0 8.3 12.3 13.6 14.2 8.5Total 100.0 100.0 100.0 100.0 100.0 100.0 100.0 100.0 100.0 100.0 100.0 100.0Source: EWS opinion poll conducted by PRISM Research
Table XIIIc
Some people say that only the ethnic parties can protect vital ethnic interests. To what degree do you agree ordisagree with this idea? (%)
AREABosniak majority areas Croat majority areas Serb majority areas
Jun. 2008 Sep 2008 Nov 2008 Jun. 2008 Sep 2008 Nov 2008 Jun. 2008 Sep 2008 Nov 2008Population Maj. Min. Maj. Min. Maj. Min. Maj. Min. Maj. Min. Maj. Min. Maj. Min. Maj. Min. Maj. Min.
% % % % % % % % % % % % % % % % % %TOTAL DISAGREE 69.4 83.7 73.4 63.8 86.9 92.7 51.6 75.5 47.2 64.4 41.0 60.4 51.4 65.7 53.1 52.3 65.4 59.8TOTAL AGREE 15.1 10.9 15.9 14.5 8.0 5.1 32.2 18.4 38.5 28.1 45.7 32.6 31.0 21.4 31.5 30.2 20.5 23.3DK/NA 15.6 5.4 10.6 21.7 5.1 2.2 16.1 6.1 14.3 7.5 13.3 7.1 17.7 12.9 15.4 17.4 14.1 16.9Total 100.0 100.0 100.0 100.0 100.0 100.0 100.0 100.0 100.0 100.0 100.0 100.0 100.0 100.0 100.0 100.0 100.0 100.0Source: EWS opinion poll conducted by PRISM Research

Ann
ual R
epor
t 200
8
58 PUBLIC AND PERSONAL SECURITY
Table Ia
During the past three months, have (personally or a family member) been a victim of.... (%)
Urban Rural Male FemaleNov 2007 Jun. 2008 Sep 2008 Nov 2008 Nov 2007 Jun. 2008 Sep 2008 Nov 2008 Nov 2007 Jun. 2008 Sep 2008 Nov 2008 Nov 2007 Jun. 2008 Sep 2008 Nov 2008
Burglary at homeYes 1.3 3.1 2.9 1.5 0.9 1.8 1.9 0.5 1.1 2.8 2.4 1.4 1.0 2.0 2.3 0.5No 98.6 96.5 96.0 98.3 98.7 96.8 95.4 98.6 98.6 95.5 96.1 98.2 98.7 97.8 95.3 98.7DK/NA 0.1 0.5 1.1 0.2 0.5 1.4 2.7 0.9 0.3 1.8 1.6 0.4 0.3 0.3 2.5 0.8
TOTAL 100.0 100.0 100.0 100.0 100.0 100.0 100.0 100.0 100.0 100.0 100.0 100.0 100.0 100.0 100.0 100.0Burglary at workplace
Yes 0.8 0.9 1.0 0.2 0.4 1.0 1.2 0.7 0.4 1.3 1.6 0.5 0.7 0.7 0.6 0.5No 98.4 98.6 97.5 99.3 98.4 97.0 96.4 98.2 98.7 96.8 97.1 98.8 98.2 98.5 96.7 98.5DK/NA 0.9 0.5 1.5 0.5 1.1 2.0 2.4 1.1 0.9 1.9 1.3 0.7 1.1 0.8 2.7 1.0
TOTAL 100.0 100.0 100.0 100.0 100.0 100.0 100.0 100.0 100.0 100.0 100.0 100.0 100.0 100.0 100.0 100.0Pickpocketing
Yes 1.7 2.1 4.1 2.2 0.7 1.4 2.2 1.4 0.0 1.9 4.1 2.1 2.2 1.5 2.0 1.4No 98.2 97.4 94.3 97.5 98.8 97.2 95.4 97.6 99.6 96.4 94.6 97.4 97.5 98.2 95.4 97.8DK/NA 0.1 0.5 1.6 0.2 0.5 1.4 2.4 1.0 0.3 1.7 1.4 0.5 0.3 0.3 2.7 0.8
TOTAL 100.0 100.0 100.0 100.0 100.0 100.0 100.0 100.0 100.0 100.0 100.0 100.0 100.0 100.0 100.0 100.0Car theft
Yes 0.2 1.8 0.6 0.2 0.6 0.8 0.9 0.2 0.3 1.9 1.1 0.3 0.5 0.7 0.4 0.2No 99.0 97.7 98.1 99.5 98.4 97.8 97.0 98.8 98.9 96.4 97.7 99.2 98.4 99.0 97.2 99.0DK/NA 0.8 0.5 1.3 0.2 1.0 1.4 2.2 1.0 0.7 1.7 1.2 0.5 1.1 0.3 2.4 0.9
TOTAL 100.0 100.0 100.0 100.0 100.0 100.0 100.0 100.0 100.0 100.0 100.0 100.0 100.0 100.0 100.0 100.0Theft of other valuables
Yes 2.2 3.1 3.6 1.0 2.3 1.1 1.5 2.4 2.7 2.0 2.4 1.3 1.9 1.8 2.4 2.3No 97.4 96.5 94.8 98.8 97.2 97.6 96.1 96.7 97.1 96.2 96.3 98.1 97.5 97.9 94.9 97.0DK/NA 0.4 0.5 1.6 0.2 0.5 1.4 2.4 1.0 0.3 1.7 1.3 0.6 0.6 0.3 2.7 0.7
TOTAL 100.0 100.0 100.0 100.0 100.0 100.0 100.0 100.0 100.0 100.0 100.0 100.0 100.0 100.0 100.0 100.0Scam/Con
Yes 0.2 0.3 0.5 0.1 0.3 0.7 0.9 0.1 0.2 0.7 1.0 0.1 0.3 0.3 0.4 0.1No 99.7 99.0 97.8 99.5 99.2 98.1 96.7 99.0 99.5 97.7 97.6 99.3 99.3 99.2 96.8 99.1DK/NA 0.1 0.7 1.7 0.4 0.5 1.3 2.4 1.0 0.3 1.6 1.4 0.6 0.4 0.5 2.7 0.8
TOTAL 100.0 100.0 100.0 100.0 100.0 100.0 100.0 100.0 100.0 100.0 100.0 100.0 100.0 100.0 100.0 100.0Blackmail
Yes 0.1 1.0 0.8 0.2 0.5 1.1 0.9 0.3 0.5 1.9 1.1 0.2 0.2 0.3 0.5 0.3No 99.7 98.4 97.6 99.4 99.1 97.6 96.7 98.6 99.1 96.5 97.6 99.2 99.6 99.3 96.7 98.6DK/NA 0.1 0.6 1.6 0.4 0.5 1.3 2.4 1.2 0.4 1.6 1.3 0.6 0.3 0.4 2.7 1.1
TOTAL 100.0 100.0 100.0 100.0 100.0 100.0 100.0 100.0 100.0 100.0 100.0 100.0 100.0 100.0 100.0 100.0
Source: EWS opinion poll conducted by PRISM Research
The Safety Index of BiH

Annual Report 2008
59Table Ib
During the past three months, have (personally or a family member) been a victim of....
Table I b Age18 - 35 36 - 50 51 +
Nov 2007 Jun. 2008 Sep 2008 Nov 2008 Nov 2007 Jun. 2008 Sep 2008 Nov 2008 Nov 2007 Jun. 2008 Sep 2008 Nov 2008% % % % % % % % % % % %
Burglary at homeYes 1.9 2.5 3.2 0.5 0.9 1.0 1.7 0.4 0.4 3.1 1.8 1.7No 98.0 96.6 93.8 99.4 99.1 98.8 98.2 98.6 98.9 95.4 96.1 97.4DK/NA 0.1 0.9 3.0 0.1 0.2 0.1 1.0 0.7 1.6 2.2 0.8
TOTAL 100.0 100.0 100.0 100.0 100.0 100.0 100.0 100.0 100.0 100.0 100.0 100.0Burglary at workplace
Yes 0.5 0.7 1.8 1.1 0.6 0.6 0.3 0.2 0.6 1.4 0.9 0.1No 99.0 98.2 95.1 98.3 98.6 98.7 99.6 98.8 97.7 96.6 97.1 98.9DK/NA 0.5 1.1 3.0 0.7 0.8 0.6 0.1 1.0 1.6 2.0 2.0 1.0
TOTAL 100.0 100.0 100.0 100.0 100.0 100.0 100.0 100.0 100.0 100.0 100.0 100.0Pickpocketing
Yes 1.4 1.6 3.5 1.9 1.0 1.8 4.7 1.8 1.0 1.9 1.7 1.6No 98.5 97.5 93.5 98.0 99.0 98.0 95.1 97.2 98.4 96.6 96.3 97.4DK/NA 0.2 0.9 3.0 0.1 0.0 0.2 0.3 1.0 0.7 1.5 2.0 1.0
TOTAL 100.0 100.0 100.0 100.0 100.0 100.0 100.0 100.0 100.0 100.0 100.0 100.0Car theft
Yes 0.6 1.9 1.8 0.2 0.1 1.1 0.3 0.4 0.4 0.9 0.1 0.1No 98.9 97.3 95.7 99.5 99.3 98.9 99.6 98.8 98.0 97.5 97.9 98.9DK/NA 0.5 0.9 2.5 0.4 0.6 0.0 0.1 0.8 1.6 1.6 2.0 1.0
TOTAL 100.0 100.0 100.0 100.0 100.0 100.0 100.0 100.0 100.0 100.0 100.0 100.0Theft of other valuables
Yes 2.3 2.1 3.3 1.6 2.8 1.6 1.1 1.2 1.8 2.0 2.2 2.4No 97.2 97.0 93.5 98.3 97.2 98.4 98.8 98.0 97.5 96.4 95.8 96.5DK/NA 0.5 0.9 3.1 0.1 0.0 0.0 0.1 0.8 0.7 1.6 2.0 1.1
TOTAL 100.0 100.0 100.0 100.0 100.0 100.0 100.0 100.0 100.0 100.0 100.0 100.0Scam/Con
Yes 0.0 0.3 1.6 0.1 0.5 0.0 0.3 0.1 0.3 0.9 0.2 0.0No 99.9 98.9 95.3 99.8 99.3 99.7 99.5 98.8 99.0 97.4 97.8 98.9DK/NA 0.1 0.9 3.1 0.1 0.2 0.3 0.3 1.0 0.7 1.6 2.0 1.1
TOTAL 100.0 100.0 100.0 100.0 100.0 100.0 100.0 100.0 100.0 100.0 100.0 100.0Blackmail
Yes 0.4 0.9 1.8 0.4 0.0 0.0 0.3 0.1 0.5 1.8 0.2 0.2No 99.5 98.2 95.0 99.5 100.0 100.0 99.6 98.8 98.8 96.6 97.8 98.4DK/NA 0.1 0.9 3.1 0.1 0.0 0.0 0.1 1.0 0.7 1.6 2.0 1.4
TOTAL 100.0 100.0 100.0 100.0 100.0 100.0 100.0 100.0 100.0 100.0 100.0 100.0Source: EWS opinion poll conducted by PRISM Research

Ann
ual R
epor
t 200
8
60 Table Ic
During the past three months, have (personally or a family member) been a victim of.... (%)
AREABosniak majority areas Croat majority areas Serb majority areas
Jun. 2008 Sep 2008 Nov 2008 Jun. 2008 Sep 2008 Nov 2008 Jun. 2008 Sep 2008 Nov 2008Maj. Min. Maj. Min. Maj. Min. Maj. Min. Maj. Min. Maj. Min. Maj. Min. Maj. Min. Maj. Min.
Burglary at homeYes 3.2 4.3 2.3 1.5 2.3 1.8 7.2 4.1 5.0 1.1 3.5 1.7 1.9 0.5No 96.2 93.8 94.1 97.1 97.5 97.7 96.9 90.2 92.9 90.0 97.4 95.3 96.9 100.0 98.1 99.3 100.0 99.5DK/NA 0.7 1.8 3.7 2.9 0.9 1.2 2.6 2.9 4.9 1.5 1.2 1.4 0.7
TOTAL 100.0 100.0 100.0 100.0 100.0 100.0 100.0 100.0 100.0 100.0 100.0 100.0 100.0 100.0 100.0 100.0 100.0 100.0Burglary at workplace
Yes 1.0 3.8 0.7 0.9 0.5 1.8 6.2 2.5 0.5 1.2 3.5 0.7 1.1 1.2 0.3No 98.3 94.4 95.9 96.2 98.6 100.0 97.2 91.7 94.5 94.5 97.0 95.3 97.0 98.9 98.6 99.3 99.2 100.0DK/NA 0.7 1.8 3.4 2.9 0.9 1.0 2.1 2.9 4.9 1.8 1.2 2.3 0.2 0.7 0.5
TOTAL 100.0 100.0 100.0 100.0 100.0 100.0 100.0 100.0 100.0 100.0 100.0 100.0 100.0 100.0 100.0 100.0 100.0 100.0Pickpocketing
Yes 2.1 5.0 3.1 2.0 2.0 1.5 3.3 7.4 3.2 3.1 3.6 3.7 0.9 1.3 3.0 1.1 1.0 0.5No 97.2 93.2 93.5 95.1 97.0 98.5 95.7 90.5 93.7 92.0 94.6 95.1 97.8 98.7 96.8 98.2 99.0 99.5DK/NA 0.7 1.8 3.4 2.9 0.9 1.0 2.1 3.2 4.9 1.8 1.2 1.4 0.2 0.7
TOTAL 100.0 100.0 100.0 100.0 100.0 100.0 100.0 100.0 100.0 100.0 100.0 100.0 100.0 100.0 100.0 100.0 100.0 100.0Car theft
Yes 1.6 2.5 0.5 0.1 0.9 6.2 1.0 0.5 1.6 3.0 1.1 1.1No 97.8 95.7 96.6 97.1 99.0 100.0 98.1 91.7 96.1 94.5 97.0 95.8 97.5 100.0 98.7 99.3 99.8 100.0DK/NA 0.7 1.8 2.9 2.9 0.9 1.0 2.1 2.9 4.9 1.5 1.2 1.4 0.2 0.7 0.2
TOTAL 100.0 100.0 100.0 100.0 100.0 100.0 100.0 100.0 100.0 100.0 100.0 100.0 100.0 100.0 100.0 100.0 100.0 100.0Theft of other valuables
Yes 2.7 8.1 2.1 1.2 2.2 8.8 3.5 2.9 4.5 0.9 2.1 2.5 0.9 1.4 0.5No 96.6 90.7 94.5 97.1 97.8 100.0 96.8 89.1 93.6 95.1 95.3 94.3 97.7 97.9 97.2 98.4 98.6 99.5DK/NA 0.7 1.2 3.5 2.9 0.9 1.0 2.1 2.9 4.9 1.8 1.2 1.4 0.2 0.7
TOTAL 100.0 100.0 100.0 100.0 100.0 100.0 100.0 100.0 100.0 100.0 100.0 100.0 100.0 100.0 100.0 100.0 100.0 100.0Scam/Con
Yes 0.9 3.1 0.5 0.1 0.7 6.9 1.2 0.5 0.3 4.0 0.9No 98.2 95.1 96.0 97.1 98.9 96.9 98.7 91.0 95.6 94.6 97.9 93.7 98.6 100.0 98.9 99.3 100.0 100.0DK/NA 0.9 1.9 3.5 2.9 1.1 3.1 0.6 2.1 3.2 4.9 1.8 2.3 1.4 0.2 0.7
TOTAL 100.0 100.0 100.0 100.0 100.0 100.0 100.0 100.0 100.0 100.0 100.0 100.0 100.0 100.0 100.0 100.0 100.0 100.0Blackmail
Yes 1.8 3.1 0.6 0.1 0.7 6.2 1.0 0.3 5.5 0.4 1.1 0.5No 97.4 95.1 95.9 97.1 98.6 96.9 98.7 91.7 96.1 95.1 97.9 92.2 98.2 100.0 98.7 99.3 99.5 100.0DK/NA 0.8 1.8 3.5 2.9 1.4 3.1 0.6 2.1 2.9 4.9 1.8 2.3 1.4 0.2 0.7
TOTAL 100.0 100.0 100.0 100.0 100.0 100.0 100.0 100.0 100.0 100.0 100.0 100.0 100.0 100.0 100.0 100.0 100.0 100.0Source: EWS opinion poll conducted by PRISM Research

Annual Report 2008
61
Table IIIa
If you have requested police assistance, how satisfied were you with the police response? (%)
GenderUrban Rural Male Female
Nov 2007 Jun. 2008 Sep 2008 Nov 2008 Nov 2007 Jun. 2008 Sep 2008 Nov 2008 Nov 2007 Jun. 2008 Sep 2008 Nov 2008 Nov 2007 Jun. 2008 Sep 2008 Nov 2008
Not at all satisfied 16.1 84.3 24.5 27.2 19.6 59.6 18.7 26.3 12.7 76.8 33.0 36.1 22.1 58.2 2.6 14.9Generally dissatisfied 51.6 11.7 46.2 33.1 25.9 34.7 38.9 21.5 47.8 20.6 37.4 6.6 35.8 33.5 53.2 51.6Generally satisfied 27.3 23.7 22.0 39.1 33.7 40.7 32.4 25.6 43.3 31.4 32.2 19.0Totally satisfied 4.3 5.6 15.5 15.4 8.6 6.5 6.3 4.0 9.0 10.7 12.0 12.3DK/NA 0.7 4.0 2.2 5.7 5.0 0.8 2.6 5.1 8.3 2.2TOTAL 100.0 100.0 100.0 100.0 100.0 100.0 100.0 100.0 100.0 100.0 100.0 100.0 100.0 100.0 100.0 100.0Source: EWS opinion poll conducted by PRISM Research
Table IIa
During the past three months, have you or a family member requested police assistance for any reason? (%)
GenderUrban Rural Male Female
Nov 2007 Jun. 2008 Sep 2008 Nov 2008 Nov 2007 Jun. 2008 Sep 2008 Nov 2008 Nov 2007 Jun. 2008 Sep 2008 Nov 2008 Nov 2007 Jun. 2008 Sep 2008 Nov 2008
Yes 9.5 4.4 6.6 5.0 4.5 5.5 3.7 4.7 6.7 5.9 6.5 5.5 6.6 4.2 3.5No 90.1 95.3 90.7 94.0 95.1 93.8 95.2 94.5 92.9 93.8 91.3 93.7 92.9 95.1 95.2 94.8DK/NA 0.4 0.3 2.6 1.0 0.4 0.7 1.0 0.8 0.4 0.3 2.2 0.8 0.5 0.7 1.3 1.0TOTAL 100.0 100.0 100.0 100.0 100.0 100.0 100.0 100.0 100.0 100.0 100.0 100.0 100.0 100.0 100.0 100.0Source: EWS opinion poll conducted by PRISM Research
Table IIb
During the past three months, have you or a family member requested police assistance for any reason? (%)
Age18 - 35 36 - 50 50 +
Nov 2007 Jun. 2008 Sep 2008 Nov 2008 Nov 2007 Jun. 2008Sep 2008 Nov 2008 Nov 2007 Jun. 2008 Sep 2008 Nov 2008Yes 8.9 4.6 3.5 7.1 5.3 5.3 8.5 3.7 5.6 5.5 4.4 3.4No 91.1 95.4 94.5 92.5 94.4 94.3 90.6 94.5 93.5 94.0 93.7 95.9DK/NA 2.0 0.5 0.3 0.4 0.9 1.8 1.0 0.5 1.9 0.7TOTAL 100.0 100.0 100.0 100.0 100.0 100.0 100.0 100.0 100.0 100.0 100.0 100.0Source: EWS opinion poll conducted by PRISM Research
Table IIc
During the past three months, have you or a family member requested police assistance for any reason? (%)
AREABosniak majority areas Croat majority areas Serb majority areas
Jun. 2008 Sep 2008 Nov 2008 Jun. 2008 Sep 2008 Nov 2008 Jun. 2008 Sep 2008 Nov 2008Maj. Min. Maj. Min. Maj. Min. Maj. Min. Maj. Min. Maj. Min. Maj. Min. Maj. Min. Maj. Min.
Yes 6.60 11.21 5.94 7.79 5.84 2.25 4.08 7.76 3.13 5.32 4.57 2.18 3.86 3.19 4.62 3.28 3.76 1.80No 93.06 86.32 93.08 92.21 92.53 96.55 94.71 91.55 90.75 93.14 94.33 94.23 95.79 96.81 94.16 96.72 96.24 98.20DK/NA 0.34 2.48 0.98 1.63 1.20 1.21 0.69 6.12 1.54 1.10 3.59 0.34 1.21TOTAL 100.00 100.00100.00100.00 100.00 100.00 100.00 100.00 100.00 100.00 100.00 100.00 100.00 100.00 100.00 100.00100.00 100.00Source: EWS opinion poll conducted by PRISM Research

Ann
ual R
epor
t 200
8
62
Table IVa
In the past three months, have you or a family member been arrested without warrant? (%)
GenderUrban Rural Male Female
Nov 2007 Jun. 2008 Sep 2008 Nov 2008 Nov 2007 Jun. 2008 Sep 2008 Nov 2008 Nov 2007 Jun. 2008 Sep 2008 Nov 2008 Nov 2007 Jun. 2008 Sep 2008 Nov 2008
Yes 3.0 1.8 0.9 1.1 2.1 2.1 0.7 1.5 3.6 1.1 1.9 1.4 1.9 0.6 0.8No 96.2 97.6 98.6 96.4 96.9 96.8 98.2 95.0 95.9 97.7 94.2 97.2 96.9 99.0 97.0DK/NA 0.9 0.6 0.4 2.4 1.1 1.1 1.1 3.4 0.5 1.3 3.9 1.4 1.2 0.4 2.1TOTAL 100.0 100.0 100.0 100.0 100.0 100.0 100.0 100.0 100.0 100.0 100.0 100.0 100.0 100.0 100.0 100.0Source: EWS opinion poll conducted by PRISM Research
Table IIIb
If you have requested police assistance, how satisfied were you with the police response? (%)
Age18 - 35 36 - 50 50 +
Nov 2007 Jun. 2008 Sep 2008 Nov 2008 Nov 2007 Jun. 2008Sep 2008 Nov 2008 Nov 2007 Jun. 2008 Sep 2008 Nov 2008Not at all satisfied 17.9 77.5 6.9 16.6 18.3 64.3 38.8 39.2 16.2 65.2 15.7 38.5Generally dissatisfied 44.9 22.5 36.9 27.1 39.6 29.2 41.8 28.3 38.5 27.0 49.2 24.2Generally satisfied 29.7 48.3 37.9 16.9 16.6 27.6 45.3 24.6 24.7Totally satisfied 7.5 8.0 13.2 23.3 2.8 10.5 12.5DK/NA 5.2 1.8 6.5 4.9 7.8TOTAL 100.0 100.0 100.0 100.0 100.0 100.0 100.0 100.0 100.0 100.0 100.0 100.0Source: EWS opinion poll conducted by PRISM Research
Table IIIc
If you have requested police assistance, how satisfied were you with the police response? (%)
AREABosniak majority areas Croat majority areas Serb majority areas
Jun. 2008 Sep 2008 Nov 2008 Jun. 2008 Sep 2008 Nov 2008 Jun. 2008 Sep 2008 Nov 2008Maj. Min. Maj. Min. Maj. Min. Maj. Min. Maj. Min. Maj. Min. Maj. Min. Maj. Min. Maj. Min.
Not at all satisfied 76.5 82.8 21.3 42.7 46.7 86.8 11.4 61.6 100.0 25.9 3.7Generally dissatisfied 23.5 11.7 55.0 77.1 32.8 66.7 53.3 13.2 23.5 8.9 37.2 22.8 21.8 31.0 33.3 12.3 30.5Generally satisfied 19.5 22.9 10.3 33.3 39.4 91.1 45.1 54.4 36.1 33.3 70.0 69.5Totally satisfied 4.1 9.2 25.7 9.2 7.0 33.3 13.9DK/NA 5.5 5.0 8.5 22.8 16.6TOTAL 100.0 100.0 100.0 100.0 100.0 100.0 100.0 100.0 100.0 100.0 100.0 100.0 100.0 100.0 100.0 100.0 100.0 100.0Source: EWS opinion poll conducted by PRISM Research
Table IVb
In the past three months, have you or a family member been arrested without warrant? (%)
Age18 - 35 36 - 50 50 +
Nov 2007 Jun. 2008 Sep 2008 Nov 2008 Nov 2007 Jun. 2008Sep 2008 Nov 2008 Nov 2007 Jun. 2008 Sep 2008 Nov 2008Yes 3.5 2.1 0.5 2.0 1.3 1.8 1.1 0.7 1.3 2.0 0.9 1.2No 95.9 97.2 98.0 94.6 97.3 96.9 97.8 96.9 97.3 97.6 99.0 95.8DK/NA 0.6 0.8 1.4 3.4 1.4 1.3 1.1 2.4 1.4 0.3 0.2 3.0TOTAL 100.0 100.0 100.0 100.0 100.0 100.0 100.0 100.0 100.0 100.0 100.0 100.0Source: EWS opinion poll conducted by PRISM Research

Annual Report 2008
63Table IVc
In the past three months, have you or a family member been arrested without warrant? (%)
AREABosniak majority areas Croat majority areas Serb majority areas
Jun. 2008 Sep 2008 Nov 2008 Jun. 2008 Sep 2008 Nov 2008 Jun. 2008 Sep 2008 Nov 2008Maj. Min. Maj. Min. Maj. Min. Maj. Min. Maj. Min. Maj. Min. Maj. Min. Maj. Min. Maj. Min.
Yes 2.6 6.2 0.9 0.9 1.8 1.5 1.63 9.7 1.1 4.3 2.0 1.4 0.6 1.1No 96.9 92.0 97.9 99.1 94.2 95.4 96.17 88.9 97.5 99.5 93.1 97.3 97.6 100.0 99.1 98.9 98.0 92.3DK/NA 0.5 1.9 1.2 4.0 3.1 2.19 1.4 1.4 0.5 2.6 0.7 1.0 0.3 2.0 7.7TOTAL 100.0 100.0 100.0 100.0 100.0 100.0 100.00 100.0 100.0 100.0 100.0 100.0 100.0 100.0 100.0 100.0 100.0 100.0Source: EWS opinion poll conducted by PRISM Research
Table Vc
Over the past six months, have you experienced or witnessed the clear abuse of police powers (e.g. regulatingtraffic, civil protests, or during investigation, etc.)? (%)
AREABosniak majority areas Croat majority areas Serb majority areas
Jun. 2008 Sep 2008 Nov 2008 Jun. 2008 Sep 2008 Nov 2008 Jun. 2008 Sep 2008 Nov 2008Maj. Min. Maj. Min. Maj. Min. Maj. Min. Maj. Min. Maj. Min. Maj. Min. Maj. Min. Maj. Min.
Yes 8.4 8.7 10.1 8.9 9.6 6.1 10.0 17.7 3.2 10.1 8.1 2.7 14.8 2.1 8.2 2.9 9.0 2.2No 90.4 86.3 88.5 87.3 88.4 90.8 86.0 80.5 91.2 86.8 89.8 96.6 83.8 95.3 89.5 96.4 90.3 97.2DK/NA 1.2 5.0 1.4 3.8 2.0 3.1 4.0 1.7 5.6 3.1 2.1 0.7 1.4 2.5 2.3 0.7 0.7 0.5TOTAL 100.0 100.0 100.0 100.0 100.0 100.0 100.0 100.0 100.0 100.0 100.0 100.0 100.0 100.0 100.0 100.0 100.0 100.0Source: Public opinion poll conducted for EWS by Prism Research
Table Va
Over the past six months, have you experienced or witnessed the clear abuse of police powers (e.g. regulatingtraffic, civil protests, or during investigation, etc.)? (%)
GenderUrban Rural Male Female
Nov 2007 Jun. 2008 Sep 2008 Nov 2008 Nov 2007 Jun. 2008 Sep 2008 Nov 2008 Nov 2007 Jun. 2008 Sep 2008 Nov 2008 Nov 2007 Jun. 2008 Sep 2008 Nov 2008
Yes 13.7 12.0 13.7 12.8 8.8 10.1 4.1 6.2 12.1 11.9 10.6 10.7 9.8 10.0 6.0 7.4No 86.1 86.0 82.8 86.1 90.2 88.5 94.5 92.1 87.1 86.4 87.1 88.4 89.7 88.4 91.8 90.6DK/NA 0.2 1.9 3.4 1.1 0.9 1.4 1.4 1.7 0.8 1.7 2.3 0.9 0.5 1.6 2.3 1.9TOTAL 100.0 100.0 100.0 100.0 100.0 100.0 100.0 100.0 100.0 100.0 100.0 100.0 100.0 100.0 100.0 100.0Source: EWS opinion poll conducted by PRISM Research
Table Vb
Over the past six months, have you experienced or witnessed the clear abuse of police powers (e.g. regulatingtraffic, civil protests, or during investigation, etc.)? (%)
Age18 - 35 36 - 50 50 +
Nov 2007 Jun. 2008 Sep 2008 Nov 2008 Nov 2007 Jun. 2008Sep 2008 Nov 2008 Nov 2007 Jun. 2008 Sep 2008 Nov 2008Yes 15.0 14.1 12.1 13.0 10.1 13.3 10.0 8.1 7.9 7.4 3.5 5.6No 84.6 84.2 84.4 85.1 88.7 84.9 88.8 90.3 91.8 91.2 94.8 93.6DK/NA 0.4 1.7 3.5 1.9 1.3 1.7 1.2 1.6 0.3 1.4 1.7 0.8TOTAL 100.0 100.0 100.0 100.0 100.0 100.0 100.0 100.0 100.0 100.0 100.0 100.0Source: EWS opinion poll conducted by PRISM Research

Ann
ual R
epor
t 200
8
64 Table VIa
Do you have confidence in the work of the ...? (%)
GenderUrban Rural Male Female
Nov 2007 Jun. 2008 Sep 2008 Nov 2008 Nov 2007 Jun. 2008 Sep 2008 Nov 2008 Nov 2007 Jun. 2008 Sep 2008 Nov 2008 Nov 2007 Jun. 2008 Sep 2008 Nov 2008
PoliceYes 68.0 52.4 54.7 64.1 62.5 51.3 53.9 61.2 64.5 50.1 53.1 66.2 65.2 53.3 55.4 59.0No 22.1 25.3 28.0 23.1 24.3 31.7 26.1 20.1 25.8 33.3 30.1 17.9 21.0 24.8 23.9 24.7Not applicable 0.7 1.5 0.4 0.1 1.9 1.0 0.2 2.6 1.1 0.5 0.9 0.4Neither approve nor disapprove 5.4 9.2 10.8 4.8 5.5 9.2 9.5 7.1 4.2 8.5 7.7 6.8 6.6 9.9 12.3 5.5Total 100.0 100.0 100.0 100.0 100.0 100.0 100.0 100.0 100.0 100.0 100.0 100.0 100.0 100.0 100.0 100.0
CourtsYes 63.5 49.1 48.9 58.6 53.4 45.9 49.6 54.4 56.1 47.8 46.7 58.9 59.4 46.8 51.7 53.6No 26.0 28.9 32.7 28.1 31.9 35.7 29.9 26.0 33.5 35.6 34.5 24.2 25.4 30.1 27.9 29.5Not applicable 1.3 2.1 0.6 0.3 2.3 2.4 0.8 2.3 2.6 0.6 2.1 0.7Neither approve nor disapprove 5.5 8.7 11.2 4.9 5.7 9.8 9.4 7.3 4.7 8.5 8.6 6.8 6.4 10.1 11.7 5.8DK/NA 3.7 11.1 6.5 8.4 8.7 6.2 8.8 12.3 4.9 5.7 7.6 10.2 8.1 10.8 8.0 11.1Total 100.0 100.0 100.0 100.0 100.0 100.0 100.0 100.0 100.0 100.0 100.0 100.0 100.0 100.0 100.0 100.0
Source: EWS opinion poll conducted by PRISM Research
Table VIb
Do you have confidence in the work of the ...? (%)
Age18 - 35 36 - 50 50 +
Nov 2007 Jun. 2008 Sep 2008 Nov 2008 Nov 2007 Jun. 2008Sep 2008 Nov 2008 Nov 2007 Jun. 2008 Sep 2008 Nov 2008% % % % % % % % % % % %
PoliceYes 66.8 51.5 52.8 66.2 65.9 54.7 55.5 58.9 62.4 51.1 55.0 61.2No 21.9 29.2 26.9 17.8 24.3 28.5 24.5 22.9 24.0 28.9 28.2 24.0Not applicable 0.7 2.0 0.1 2.1 0.2 0.3 1.4 1.6Neither approve nor disapprove 4.8 8.0 8.9 3.5 4.0 10.6 13.9 8.5 7.1 9.0 9.1 7.2DK/NA 5.8 9.3 11.3 12.6 5.8 4.1 6.1 9.7 6.3 9.7 6.0 7.6
Total 100.0 100.0 100.0 100.0 100.0 100.0 100.0 100.0 100.0 100.0 100.0 100.0Courts
Yes 62.3 46.1 50.0 61.9 58.9 47.4 50.1 48.9 52.8 48.7 48.2 55.5No 26.2 34.6 29.7 21.2 30.6 33.8 31.1 32.2 31.4 30.9 32.5 29.0Not applicable 0.6 3.0 0.5 1.5 0.2 1.3 2.0 3.5Neither approve nor disapprove 4.6 7.4 8.5 4.0 4.2 12.4 13.1 8.8 7.5 8.9 10.2 6.9DK/NA 6.3 8.9 11.3 13.0 6.3 4.9 5.6 10.1 7.0 9.5 5.7 8.6
Total 100.0 100.0 100.0 100.0 100.0 100.0 100.0 100.0 100.0 100.0 100.0 100.0Source: EWS opinion poll conducted by PRISM Research

Annual Report 2008
65Table VIc
Do you have confidence in the work of the ...? (%)
AREABosniak majority areas Croat majority areas Serb majority areas
Jun. 2008 Sep 2008 Nov 2008 Jun. 2008 Sep 2008 Nov 2008 Jun. 2008 Sep 2008 Nov 2008Maj. Min. Maj. Min. Maj. Min. Maj. Min. Maj. Min. Maj. Min. Maj. Min. Maj. Min. Maj. Min.
PoliceYes 34.8 51.1 46.1 39.1 53.5 63.1 49.1 44.4 39.3 40.8 42.2 51.0 70.8 76.8 66.9 77.3 77.2 72.5No 41.9 31.0 39.5 43.9 32.7 33.5 30.3 44.8 26.1 28.4 19.0 21.6 14.6 15.2 13.3 13.3 9.7 14.7Not applicable 3.1 2.4 0.4 1.0 1.4 0.9 0.9Neither approve nor disapprove 7.3 5.1 7.3 5.8 3.6 2.0 16.4 6.5 18.6 13.9 16.9 22.5 8.9 4.5 11.0 6.2 6.3 2.8DK/NA 13.0 10.4 6.6 11.2 10.2 1.5 4.2 3.3 14.5 16.8 21.9 4.9 4.9 3.5 7.9 3.2 6.8 10.1
Total 100.0 100.0 100.0 100.0 100.0 100.0 100.0 100.0 100.0 100.0 100.0 100.0 100.0 100.0 100.0 100.0 100.0 100.0Courts
Yes 33.3 47.7 41.8 37.1 49.9 50.6 37.0 44.4 35.8 35.6 40.7 43.8 65.2 67.5 60.3 68.0 66.1 62.2No 42.1 34.4 42.8 46.9 35.6 42.9 45.2 45.8 30.6 31.8 21.3 28.2 19.2 18.6 18.8 22.2 19.8 20.1Not applicable 3.8 2.4 1.9 1.4 0.5 1.2 4.7 1.5 0.7Neither approve nor disapprove 7.6 5.1 6.8 5.8 4.0 5.1 13.7 6.5 18.1 15.4 16.6 23.6 9.7 4.5 12.0 5.1 6.2 7.7DK/NA 13.1 10.4 6.7 10.3 10.5 1.5 4.2 3.3 14.1 16.8 21.4 4.4 4.6 4.8 7.4 3.9 7.9 10.1
Total 100.0 100.0 100.0 100.0 100.0 100.0 100.0 100.0 100.0 100.0 100.0 100.0 100.0 100.0 100.0 100.0 100.0 100.0Source: EWS opinion poll conducted by PRISM Research
Table VIIa
How widespread do you think corruption, meaning taking bribes or abuse of office for personal gain, is in thefollowing institutions? (%)
GenderUrban Rural Male Female
Nov 2007 Jun. 2008 Sep 2008 Nov 2008 Nov 2007 Jun. 2008 Sep 2008 Nov 2008 Nov 2007 Jun. 2008 Sep 2008 Nov 2008 Nov 2007 Jun. 2008 Sep 2008 Nov 2008
% % % % % % % % % % % % % % % %Police
Not at all 4.0 2.8 1.1 3.8 4.9 2.0 3.3 1.5 6.3 3.0 1.8 2.8 2.7 1.7 3.0 2.2Slightly 19.6 9.2 18.0 16.5 11.6 12.4 16.1 15.2 15.0 11.9 16.2 16.5 15.3 10.1 17.6 15.0To some degree 16.9 20.9 19.2 17.1 15.4 17.4 18.6 16.6 14.5 19.6 19.7 15.9 17.6 18.2 17.9 17.6Quite 19.5 21.6 20.2 22.2 27.2 20.9 22.0 30.0 22.0 18.2 19.2 27.1 25.6 24.3 23.2 26.2Very 40.1 45.4 41.4 40.4 40.9 47.3 40.0 36.8 42.2 47.2 43.0 37.7 38.9 45.7 38.2 38.9
TOTAL 100.0 100.0 100.0 100.0 100.0 100.0 100.0 100.0 100.0 100.0 100.0 100.0 100.0 100.0 100.0 100.0Courts
Not at all 4.0 1.7 1.0 2.4 3.0 2.8 2.4 1.1 4.4 2.7 1.2 1.9 2.4 1.9 2.4Slightly 17.1 6.8 15.7 16.7 12.6 10.1 12.9 12.3 14.7 9.9 11.8 13.5 14.5 7.4 16.3To some degree 15.5 16.0 16.7 13.3 12.7 12.9 18.6 16.3 13.9 14.9 19.2 16.0 14.0 13.7 16.4Quite 20.2 25.2 20.3 22.8 26.2 20.8 24.3 29.7 20.6 19.9 21.5 27.4 26.5 25.5 23.6Very 43.3 50.3 46.4 44.6 45.5 53.5 41.8 40.6 46.4 52.6 46.2 41.2 42.6 51.5 41.4
TOTAL 100.0 100.0 100.0 100.0 100.0 100.0 100.0 100.0 100.0 100.0 100.0 100.0 100.0 100.0 100.0Source: EWS opinion poll conducted by PRISM Research

Table VIIc
How widespread do you think corruption, meaning taking bribes or abuse of office for personal gain, is in thefollowing institutions? (%)
AREABosniak majority areas Croat majority areas Serb majority areas
Jun. 2008 Sep 2008 Nov 2008 Jun. 2008 Sep 2008 Nov 2008 Jun. 2008 Sep 2008 Nov 2008Maj. Min. Maj. Min. Maj. Min. Maj. Min. Maj. Min. Maj. Min. Maj. Min. Maj. Min. Maj. Min.
PoliceNot at all 2.6 3.1 2.7 4.5 4.3 3.0 5.8 2.6 1.3 0.6 3.1 0.8 2.7 2.0 0.6Slightly 8.6 13.3 11.8 2.2 11.5 6.3 16.0 8.0 11.1 10.8 10.1 21.5 11.5 24.4 23.3 34.2 19.6 30.1To some degree 12.8 16.7 13.5 11.3 13.5 5.2 24.0 8.4 22.6 14.1 21.5 25.7 24.1 20.1 22.9 27.8 19.5 24.7Quite 15.5 15.9 18.1 21.5 22.5 24.7 33.4 39.9 27.8 31.7 29.8 22.3 23.7 34.8 22.9 20.3 31.0 17.5Very 60.5 51.0 53.9 65.0 47.9 59.4 23.7 37.9 35.9 42.1 38.0 27.3 40.0 18.0 28.9 17.6 29.3 27.7
TOTAL 100.0 100.0 100.0 100.0 100.0 100.0 100.0 100.0 100.0 100.0 100.0 100.0 100.0 100.0 100.0 100.0 100.0 100.0Source: EWS opinion poll conducted by PRISM Research
Table VIIb
How widespread do you think corruption, meaning taking bribes or abuse of office for personal gain, is in thefollowing institutions? (%)
18 - 35 36 - 50 51 +Nov 2007 Jun. 2008 Sep 2008 Nov 2008 Nov 2007 Jun. 2008Sep 2008 Nov 2008 Nov 2007 Jun. 2008 Sep 2008 Nov 2008
PoliceNot at all 4.8 1.9 2.6 3.2 4.5 2.3 1.8 0.8 4.3 2.7 2.6 2.5Slightly 15.6 13.5 10.4 15.3 18.4 14.5 8.3 18.1 12.3 17.4 13.2 18.0To some degree 15.6 18.7 20.3 15.9 11.8 17.4 20.7 17.0 19.5 20.2 16.7 22.9Quite 21.1 26.6 24.2 21.4 26.2 25.9 18.9 23.1 24.6 25.5 19.6 20.1Very 43.0 39.2 42.5 44.3 39.1 39.9 50.4 41.0 39.3 34.2 47.9 36.5
TOTAL 100.0 100.0 100.0 100.0 100.0 100.0 100.0 100.0 100.0 100.0 100.0 100.0Courts
Not at all 3.5 1.5 1.9 3.1 3.6 2.6 0.8 0.8 3.2 3.0 2.3 0.8Slightly 15.1 7.9 13.2 15.6 15.8 7.6 13.0 15.7 13.2 10.2 15.6 11.6To some degree 15.6 14.6 16.2 15.5 11.1 16.5 19.1 13.4 14.4 12.4 18.6 15.7Quite 20.6 25.4 23.0 24.2 25.8 21.0 21.1 29.5 24.7 20.6 23.0 27.5Very 45.3 50.5 45.7 41.6 43.7 52.2 46.0 40.6 44.4 53.8 40.4 44.4
TOTAL 100.0 100.0 100.0 100.0 100.0 100.0 100.0 100.0 100.0 100.0 100.0 100.0Source: EWS opinion poll conducted by PRISM Research
66
Ann
ual R
epor
t 200
8