dynamic behaviour of hydraulic structures part b structures in
TRANSCRIPT
Dynamic behaviour of hydraulic structures
Part B Structures in waves
P.A. Kolkman T.H.G. Jongeling
Delft Hydraulics
The three manuscripts (parts A, B and C) were put in book form by Rijkswaterstaat in Dutch in a limited edition and distributed within Rijkswaterstaat and Delft Hydraulics. Dutch title of that edition is: Dynamisch gedrag van Waterbouwkundige Constructies. Ten years after this Dutch version Delft Hydraulics decided to translate the books into English thus making these available for English speaking colleagues as well. Because of in the text often referred is to Delft Hydraulic reports made for clients (so with restrictions for others to look at) we decided to limit the circulation of the English version as well. However, the books are of value also without perusal of these reports. The task was carried out by Mr. R.J. de Jong of Delft Hydraulics. Translation services were provided by Veritaal (www.veritaal.nl). Delft Hydraulics 2007
Delft Hydraulics
i
Table of contents Part B List of symbols Part B 1 INTRODUCTION..............................................................................................................1 2 WAVES..............................................................................................................................3
2.1 Wave phenomena......................................................................................................3 2.2 Wind-generated waves .............................................................................................5
2.2.1 Wave characteristics ...........................................................................................5 2.2.2 Wind-generated waves as a stochastic process...................................................8 2.2.3 Reflection, refraction and diffraction ...............................................................12 2.2.4 Forecasting of wind-generated waves ..............................................................14
3 WAVE LOADS................................................................................................................15 4 QUASI-STATIC WAVE LOAD .....................................................................................19
4.1 Slender structures...................................................................................................20 4.2 Non-slender structures ...........................................................................................25 4.3 Numeric calculation................................................................................................27 4.4 Scale model investigation .......................................................................................27 4.5 Influence of flow .....................................................................................................27 4.6 Response of structures to quasi-static wave load.................................................28
5 WAVE IMPACT LOAD..................................................................................................31 5.1 Wave impacts in relation to the structure ............................................................31 5.2 Wave impact characteristics..................................................................................32 5.3 Influencing factors ..................................................................................................35 5.4 Types of wave impacts............................................................................................36 5.5 Analytical calculation of maximum impact pressures ........................................37
6 RESPONSE OF STRUCTURES TO WAVE IMPACTS................................................43 6.1 Important properties of the structure ..................................................................43 6.2 Response of a single mass spring system to an impulse load ..............................44 6.3 Influence of the response on the impact load .......................................................48
7 EXPERIENCES WITH WAVE IMPACTS IN PROTOTYPES AND SCALE MODELS ..........................................................................................................................................49
7.1 Storm surge barrier Eastern Scheldt. Grid gate design (scale model investigation) ...........................................................................................................49 7.2 Storm surge barrier Eastern Scheldt. Caisson design (scale model investigation) ...........................................................................................................51 7.3 Storm surge barrier Eastern Scheldt. Design with piers and lifting gates (scale model investigations and prototype measurements) ...........................................53 7.4 Discharge sluice Haringvliet (scale model investigations and prototype measurements) ........................................................................................................56 7.5 Cooling-water intake of Alto Lazio nuclear power station (scale model investigation) ...........................................................................................................58 7.6 Civitavecchia caisson breakwater (scale model investigation) ...........................60 7.7 Asphalt slope (scale model investigation) .............................................................63
8 GENERAL DESIGN DIRECTIVES ...............................................................................65 9 REFERENCES .................................................................................................................67
9.1 Delft Hydraulics Reports (in Dutch).....................................................................67 9.2 Other reference material .......................................................................................71
INDEX BY SUBJECT (PART B)............................................................................................74 Biographies of the authors........................................................................................................78

Delft Hydraulics
ii
List of symbols Part B A = wave amplitude (m) A = surface area of structure hit by a wave impact (m2) An = wave amplitude of the nth component (m) Ac = culvert cross-sectional area (m2) c = wave celerity (m/s) cc = shock wave celerity in structure material (m/s) Cd = drag term (-) Cm = mass inertia term (-) cs = slamming coefficient (-) cw = celerity of shock wave in water (m/s) c0 = slamming coefficient at the moment the wave hits the structure (-) d = water depth (m) D = dimension of structure (m) D(f) = frequency-dependent direction distribution function E = wave energy per unit of (horizontal) surface area (N/m) E = module of elasticity of the structure material (N/m2) E(f) = frequency-dependent wave energy (N/m) Ei(f) = frequency-dependent wave energy of incoming wave (N/m) f = wave frequency (S-1) fn = (peak) frequency at the maximum value in the wave spectrum (S-1) F = force (N) F0 = maximum value of F during a wave impact (N) g = gravitational acceleration (m/s2) H = wave height (crest-trough value) (m) Hrms = standard deviation (root-mean-square) of the wave height (m) Hs = significant wave height (m)
I = impulse area (0
tFdt∫ ) of the wave impact (Ns)
k = wave number = 2 / Lπ (m-1) k = impact pressure coefficient (linear wave impact model) k = (spring) stiffness (N/m) k = measure for wall roughness (m) K = module of compression (distortion as a function of pressure) (m2/N) K = KC = Keulegan-Carpenter number = /mu T D L = wave length (m) m = mass (kg) m = mass of water involved in the wave impact (kg) m0 = surface area of wave spectrum p = water pressure (N/m2) p0 = water pressure before the wave impact occurs (N/m2) p(H) = probability density function of the wave height r = reflection coefficient r(f) = frequency-dependent reflection coefficient Re = Reynolds number = vD/ν (-) s = immersion depth of a falling object (m) S = Strouhal number = dimensionless excitation frequency of flowing fluid = fD/v (-) t = time (s) ts = time interval of wave impact increment (s)
Delft Hydraulics
iii
T = wave period (s) T = natural period of a mass spring system (s) Tk = period of pressure oscillations during the decay of a wave impact (s) Tp = dominant wave period (peak period) (s) um = horizontal orbital velocity (m/s) v = water velocity (m/s) v0 = incoming velocity of water (before the wave impact occurs) (m/s) V = volume of the structure (m3) x = horizontal coordinate in the flow direction of the wave (m) x = deflection of the structure in direction x (m) z = vertical coordinate (relative to still water surface) (m) α = coefficient γ(f) = frequency-dependent amplification factor γp = peak amplification factor η = deflection of still water surface (m) θ = angle relative to main wave direction (radials) κ = compressibility = K-1 (see at K) (m2/N) ρ = density (specific weight) of the fluid (kg/m3) ρc = density (specific weight) of the structure (kg/m3) σ = form factor of a spectrum τ = wave impact duration (s) υ = kinematic viscosity of the fluid (m2/s) φ = phase angle (radials) φn = phase angle of the nth wave component (radials) ω = natural angular frequency of a mass spring system (radials/s) ω = wave frequency (angular frequency) (radials/s) ωn = angular frequency of the nth wave component (radials/s)

Delft Hydraulics
iv

Delft Hydraulics
1
1 INTRODUCTION
Part B of the manual mainly deals with wave impacts and the response of structures to wave impacts. By definition, wave impacts cause an impulse load; depending on the dynamic properties of the structure, the impact load may provoke a stronger, but also a weaker response, than would a static load, equal in magnitude to the amplitude of the impact load. In other words: the dynamic amplification factor may be higher or lower than one.
Many factors influence the occurrence of wave impacts, the magnitude of the impact pressures and the progress of the impact in time and space. The most important factors are the geometry of the structure, the local wave and flow conditions and the shape of the individual wave (in this, the ‘previous history’ plays a part, i.e. the influence of preceding waves on the incoming wave). Also air enclosures may play an important part, both in the magnitude of the load, and in the response. A wave impact is a phenomenon that never exactly repeats itself, and therefore it is a special kind of load.
Wind-generated waves are differentiated into locally generated waves (wind-generated waves) and waves that are the remainder of waves generated elsewhere (swell waves). The development of significant wind-generated waves requires a reasonably large fetch length for the wind. Structures on which wind-generated waves and swell waves operate therefore, are typically structures in or at the edge of a large water surface, or structures at the edge of water connected with a large water surface. Examples of such structures are: levees, jetties, breakwaters, storm surge barriers, discharge sluices and offshore structures.
The following is an introduction of wave phenomena, and more specifically wind-generated waves. In this, attention is also given to concepts such as refraction, diffraction and reflection. The introduction has been included because of the importance of a good reproduction of incoming waves in scale model investigations focused on wave (impact) loads.
Next, attention is given to loads generated by waves. Distinction is made between quasi-static loads and wave impact loads. The duration of wave impact loads is of a lesser order than that of quasi-static loads and the impact load therefore only operates for a small part of the wave period. Attention is also given to wave impact characteristics, the creation of scale models for wave impact loads and factors, notably air, that influence the impact load. On the basis of a single mass spring system, the response of a wave impact is discussed. Similar to flow-induced oscillations, the wave-impact-caused, damping out oscillations generate interaction forces (hydrodynamic forces of inertia and damping forces).
Experiences with wave impacts at Delft Hydraulics are given for a number of selected structures. It appears that in a hydraulic structure wave impact pressures (on average, across a surface of several square metres) may increase from 100 up to 200 kN/m2; locally however, much higher pressures may be generated, from 300 up to 400 kN/m2. The impact duration typically lies between 10 to 100 ms, but exceptional durations, especially shorter ones, are also possible.
Based on experience, some general design directives are formulated. More detailed advice is, in fact, only possible on the basis of a carefully executed scale model investigation.
And finally, Part B of the manual concludes with a list of references.

Delft Hydraulics
2

Delft Hydraulics
3
2 WAVES
2.1 Wave phenomena
The movements of waves in water with a free fluid surface are dominated by gravity. To cause these movements requires energy supply. In nature, wind provides the energy; wind therefore is the most important cause of wave generation, but in hydraulic engineering artificially generated waves, such as those in the wake of moving vessels, are equally important.
Once the waves are generated, there is gravity-related higher potential energy at the wave crests and lower potential energy at the wave troughs. On top of that, on the disturbed water surface there is an additional quantity of potential energy, related to the surface tension of the water. This component moreover is only significant in case of minor water disturbances, i.e. in case of great curvatures of the water surface; for bigger waves it is completely negligible in view of the gravity component. Between areas of high and low potential energy there is a continuous exchange of energy due to the conversion of potential energy into kinetic energy.
When looking at a wave field, there appears to be complete disorder; nevertheless characteristic quantities may be defined, and usually it is possible to give an approximate, mathematical description of the wave field.
Individual waves are characterized by period, height, celerity and direction of propagation. When the wave period is taken as a basis for comparison, there appears to be great variance in naturally occurring waves. From short to long, these are:
• Wind-generated waves. These are caused by the wind skimming over the water surface. Important factors here are the wind intensity, the duration of the wind load, the fetch length and the (variation of the) wind direction. At first, ripples develop in the water due to the friction of the wind with the water. When small waves have formed, the shape of the wave also starts to play a role in the generative process. At the weather side of the wave an overpressure is generated and at the lee side an underpressure, through which a resultant force operates in the direction of propagation of the developing wave. The wave height, the wave length and the wave period, increase. The period of wind-generated waves at sea typically ranges up to about 10 s; on inland waters with a limited fetch length and with lesser wind velocities than at sea, the wave period mostly is no higher than 3 to 5 s. Wind-generated waves at sea are usually referred to as sea state.
• Swell. This consists of waves that are the remainder of wind-generated waves; these waves may originate from a wind field elsewhere or be the remainder of waves, after the wind has subsided. They are characterized by the fact that they are no longer subject to the effects of the wind. When the wind subsides, the waves lose energy by friction (internal friction, friction with the air and with the bottom). The wave energy is also distributed over a larger area because the waves fan out (directional dispersion) and because longer waves (on deep-water) move faster (frequency dispersion). The last two factors actually cause less wave energy to remain per unit of surface area. Within a swell field, the longer waves are in front because of their greater celerity, followed by the shorter waves. Because of the fact, that the shorter waves take more time to reach the same point, the energy loss of shorter waves is relatively greater, which is why, eventually, the longer waves remain. It is however remarkable, that the
Delft Hydraulics
4
wave length and the wave period may grow during the runoff of the waves. Swell waves therefore may have a period of up to 30 s. As a consequence of frequency dispersion and directional dispersion, swell waves show a more regular pattern than wind-generated waves.
• Seiches. Water level variations of a relatively short duration, that may also be periodic, occur at sea and along the coast. The periodic water level variations, referred to as shower oscillations, may on the one hand be considered as a temporary change of the water level, but on the other hand also as a long wave. They are formed at sea as a consequence of large-scale air pressure variations that normally occur during storm depressions. These are referred to as shower impulses, when dealing with a single disturbance of the water surface. The wave period of shower oscillations and impulses lies between 10 minutes and 1 hour. Harbour basins and estuaries may be sensitive to amplification in case of such long waves. The harbour basin of IJmuiden, which has a natural period of 35 minutes, may serve as an example. These resonant rise phenomena (long standing waves) within a (partly) closed water basin are called seiches. They may develop, as an example, because of shower oscillations or impulses. The seiches are usually still present long after the cause has gone.
• Tides. These are very long waves (that is, waves with a long period), generated by interactions between the gravitational fields of the earth, the moon and the sun. On the Dutch coast, the period is more than twelve hours.
• Storm surges. These are also very long waves, that are caused under the influence of meteorological phenomena. The duration of these non-periodic waves ranges from one to several days.
• High-water waves on rivers. These are caused after prolonged rainfall in the catchment basin of the river and may last from days to weeks. The celerity of these waves is a factor 1.5 higher than the profile average of the water flow velocity.
• Translatory waves. These are caused, as an example, when a gate (of a sluice) is lifted. Downstream a positive wave is generated, upstream a negative wave (a lowering of the water level, which moves in upstream direction). The front of the translatory wave travels with a velocity of:
tv gd= (B2.1)
With d = water depth (wave height << d). Naturally, the water flow velocity is lower and, on average across the flow profile A, it equals the discharge Q divided by A.
In case of wind-generated waves and swell waves on deep-water, the net horizontal
water displacement (in the direction of propagation of the waves) is very small and, in fact, almost negligible. The long waves however (as an example high-water waves on rivers), are characterized by big horizontal water transport.
With the long waves that were mentioned above, the streamlines are only slightly curved. The pressure distribution in the vertical therefore, is nearly hydrostatic and the water transport is determined by the pressure distribution in the direction of movement and by the bottom resistance. In long-wave calculation depth-average quantities may be used.
Contrary to the long waves, short waves are characterized by a strongly curved surface and curved streamlines. Because of the vertical acceleration of the water, the pressure
Delft Hydraulics
5
distribution in the vertical is not hydrostatic. Wind-generated waves and swell waves may be considered as short waves.
In all the surface waves (gravitational waves) that were mentioned above, the compressibility of water is of no significance. In case of acoustic waves (pressure waves) in water, as an example in pipe systems, the variance in density as a function of time and place is significant however. This type of wave therefore is completely different from surface waves and is caused, as an example, by the sudden closure of a pipe. The celerity of acoustic waves equals that of the speed of sound in water; this depends on the amount of air present in the water and the degree of dispersion and the size of the air bubbles (without air, the speed of sound in water is about 1500 m/s, with air the speed of sound in water may drop to 100 m/s, hence below the speed of sound in air with an atmospheric pressure of 330 m/s).
In case of explosions, the celerity of the explosion front may however exceed that of the speed of sound. This is referred to as supersonic waves. Acoustic waves in pipe systems are not dealt with any further here. For an introduction into those issues, please see Wijdieks (1983).
In case a surface wave is abruptly stopped, as an example because the wave front hits a structure, a wave impact results. Here too, a pressure wave (compression wave) is generated in the water. In Chapter 5 we shall return to this.
The next paragraph deals with wind-generated waves. For a more extensive treatment of this subject, we refer to Battjes (1982 and 1988), Groen and Dorrestein (1976) and Le Méhauté (1976), among others. Within the framework of this manual, long waves are not discussed any further. The effect of these waves on hydraulic structures as a rule remains limited to a quasi-static load. Seiches may sometimes cause resonance phenomena in relatively weak structures; this happens when the period of the seiches equals that of one of the natural periods of the structure. For brevity’s sake, we refer to Part A, in which similar issues have already been dealt with extensively.
2.2 Wind-generated waves
2.2.1 Wave characteristics Waves may be characterized by height H (crest-trough value), period T, length L and
direction of propagation. Each individual wave has a shape; the steepness of the front may be significant for the generation of wave impacts. The length L equals the product of wave celerity c and period T: L cT= (B2.2) The wave frequency ω (angular frequency) is defined as:
2Tπω = (B2.3)
and the wave number k as:
2kLπ
= (B2.4)
Delft Hydraulics
6
The magnitude H/L is referred to as the steepness of the wave. The steepness of waves may increase when waves end up in a current or when waves enter more shallow waters. The steepness of waves has an upper limit: when the steepness of surface waves on deep-water is greater than about 1:7, they break. The celerity of waves increases with the wave period. On shallow water the surface waves are influenced by the bottom and in that case the celerity of the surface waves is lower than on deep-water; the celerity now no longer depends on the wave period, but it is a function of the water depth d. Water is referred to as ‘deep’ when d/L > 0.5, and it is referred to as ‘shallow’ when d/L < 0.05. In between there is a transitional area. Water particles in a surface wave on deep-water pass through approximately circular paths. The circular paths are largest at the surface and decrease in size towards the bottom by an e-power. On less deep-water, the circular paths change into elliptic paths. In reality, these paths are not closed, but open, and the water particles undergo a small net displacement in the direction of propagation of the waves. The movement of the water particles is referred to as orbital movement. For the mathematical description of waves, several theories have been developed. For reasons of simplicity, the linear wave theory is often used, and in many cases it offers a sufficiently accurate description. In non-linear wave theories, higher-order terms are added to the description; for deep-water, these are sequence developments for the magnitude H/L, for shallow water there are sequence developments for H/d. For a description of these wave theories, we refer to the extensive literature in this field (for a general introduction, see Le Méhauté, 1976, among others).
According to the linear wave theory (that is, taking relatively small disturbances of the water surface as a starting point) the celerity of waves in water with a constant depth is:
2tanh2gT dc
Lπ
π= (B2.5)
This is the so-called dispersion relation. In case of deep-water, the term tanh (2πd/L) approximates the value 1 and the wave celerity becomes:
2gTcπ
= (B2.6)
The wave length may then be calculated with:
2
21.562gTL cT Tπ
= = = (B2.7)
On shallow water the term tanh (2πd/L) approximates 2πd/L and with L=cT the wave celerity changes into: c gd= (B2.8)
Delft Hydraulics
7
This is the same celerity as that with which the front of a translatory wave travels (translatory wave height is small in relation to the water depth). Waves appear to move in groups. This phenomenon may be understood by considering the waves as a combination of compound waves, that differ little in frequency and wave length. Within the combination, interferences (well-known of dynamics) are generated, which become visible in the water as groups (see Groen and Dorresteijn, 1976). The celerity of an individual wave does not equal the celerity of a wave group. On deep-water a wave group moves with a celerity that is a factor 2 lower than the celerity of the individual wave. This means that individual waves gain on a wave group, become bigger, and next decrease in height, disappearing at the front of the wave group. On shallow water however, the celerity of the wave group approximates the celerity of the individual wave in decreasing water depth.
Moving waves possess energy that is transported in the direction of propagation. The wave energy consists of potential energy (the reference plane being the still water surface) and kinetic energy. In linear wave theory, the average potential energy per unit of surface area equals the average kinetic energy per unit of surface area. The total energy equals:
218
E gHρ= (B2.9)
The energy is transported with a velocity corresponding to the velocity of the wave
group. The orbital movement of the waves (kinetic energy) generates no net energy transportation – assuming that the orbital movement is a closed circle, as is the case, approximately, when the wave propagates on deep-water; energy transport then only is a transport of potential energy (raising of the local water surface level). On shallow water the closed-circle movement is no longer the basis for the orbital movement; in that case there is also a transport of kinetic energy. According to the linear wave theory, the pressure distribution in the vertical is:
cosh ( ) sin( )2 coshH k d zp gz g t kx
kdρ ρ ω+
= − + − (B2.10)
On deep-water k(d+z) >> 1, so that Equation B2.10 changes into:
sin( )2
kzHp gz g e t kxρ ρ ω= − + − (B2.11a)
On shallow water kd << 1 and Equation B2.10 changes into:
sin( )2Hp gz g t kxρ ρ ω= − + − (B2.11b)
In these equations z is the coordinate in vertical direction (the origin coincides with
the still water surface), x is the coordinate of the direction of propagation, t is time and H is the wave height. The term ρgz is the hydrostatic pressure term, to which the wave pressure is added. The factor ekz is the reduction factor, by which the depth-dependent wave pressure on
Delft Hydraulics
8
deep-water decreases towards the bottom. On shallow water this factor for z = -d tends towards 1, so that the wave pressure in the vertical becomes constant and the total pressure becomes hydrostatic. These shallow water surface waves are also referred to as long waves; the deep-water surface waves are referred to as short waves. In the above, reference was made to first-order waves. In nature first-order waves go together with second-order waves. In fact, it appears that the average position of the water surface in wave groups develops according to a wave pattern. The amplitude of these second-order waves is small; the period depends on the frequency of the wave groups in a wave field, and therefore it is relatively big. When approaching the coast and the upwards slope of the bottom, these second-order-tied waves may be separated from the wave groups as a consequence of breaking, refraction and diffraction, and become free waves.
2.2.2 Wind-generated waves as a stochastic process A wave field that travels in a certain direction, may be represented as consisting of a
large number of single waves, each with its natural period, wave height and speed of propagation. Moreover, each wave has its own phase angle φ. This phase angle may be considered as a stochastic magnitude with a uniform probability density distribution on the interval [-π, +π], so that each phase angle on this interval has an equal probability of occurring. The resulting deflection of the water surface η in relation to the still water surface may then be described as: ( ) cos( )n n n
nt A tη ω φ= +∑ (B2.12)
with nω = angular frequency = 2 / nTπ of wave component n nA = amplitude of wave component n This model is known as the random phase model.
In theory it may be deduced that the wave heights follow a Rayleigh probability density function. Measurements have shown that the wave heights match this distribution very well. The Rayleigh distribution is defined as:
2
2
2( ) for 0
( ) 0 for 0
rms
HH
rms
Hp H e HH
p H H
⎛ ⎞−⎜ ⎟⎝ ⎠= >
= ≤
(B2.13)
with Hrms = RMS value of the wave heights (for a definition of the RMS value, see Paragraph 5.7.2 in Part C).
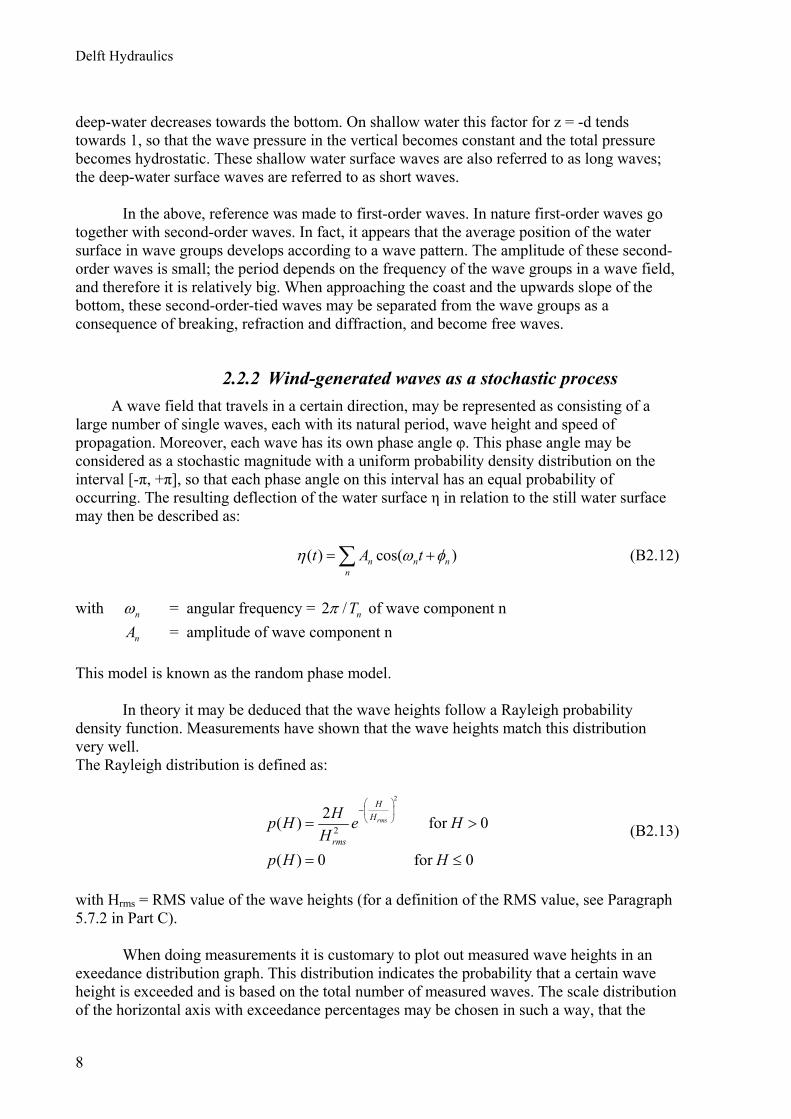
When doing measurements it is customary to plot out measured wave heights in an exeedance distribution graph. This distribution indicates the probability that a certain wave height is exceeded and is based on the total number of measured waves. The scale distribution of the horizontal axis with exceedance percentages may be chosen in such a way, that the
Delft Hydraulics
9
graph shows a straight line when the wave heights are indicated according to the Rayleigh distribution. The figure below shows an example.
Figure B2.1: Exceedance distribution of wave heights. The wave energy in a wave field may be shown in the form of a spectrum, by using the Fourier analysis. The wave spectrum (energy density spectrum) shows the energy distribution across the frequencies in the wave field. The wave spectrum offers no information about the height of individual waves. Assuming that the wave heights are Rayleigh distributed, it is however the case that: 03.8sH m= (B2.14) and: 2s rmsH H= (B2.15) so: 02.7rmsH m= with m0 = surface area of wave spectrum Hs = significant wave height Hrms = RMS value of wave heights in the spectrum
In various sources the coefficient 3.8 is also given the value 4. The significant wave height Hs is defined as the average of the highest third part of the waves; this magnitude is generally used to indicate the wave height of a wave field. In the Rayleigh distribution, Hs approximately equals an exceedance value of 13.5%.
Measurements at sea have resulted in different forms of the wave spectrum. The
Pierson-Moskowitz energy density spectrum is generally accepted for a full-blown sea state on deep-water. This standard spectrum is defined as follows:
Delft Hydraulics
10
45
2 4
4 5( )(2 )
pffgE f e
fαπ
⎡ ⎤⎛ ⎞⎢ ⎥− ⎜ ⎟⎜ ⎟⎢ ⎥⎝ ⎠⎣ ⎦= (B2.17)
with α = coefficient (scale parameter) g = gravitational acceleration f = wave frequency fp = peak frequency, which means the frequency in the spectrum with maximum energy
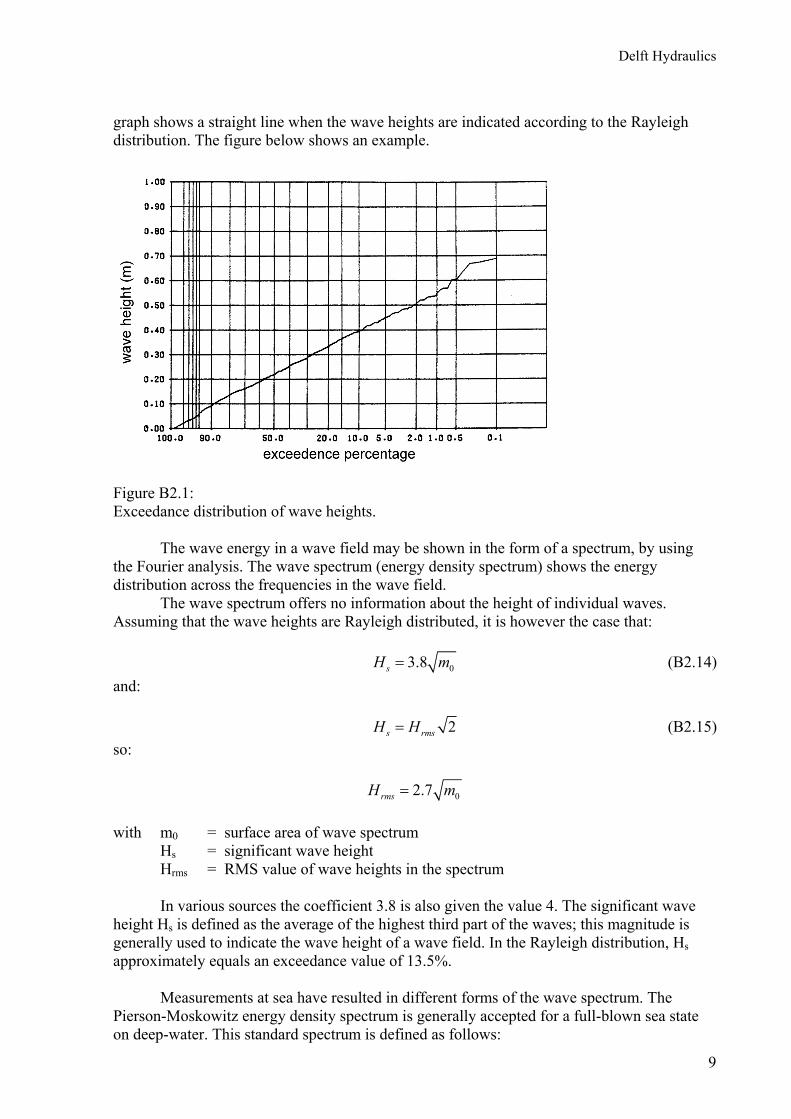
Other well-known standard forms of the wave spectrum, used less often than the Pierson-Moskowitz spectrum, are the Bretschneider spectrum and the Neumann spectrum. With increasing sea state, the energy extends from the higher frequencies of the spectrum toward the lower frequencies (more and more waves with a longer period are generated). As shown in Figure B2.2, the energy density in a full-blown sea state spectrum is highest among the lower frequencies.
Figure B2.2: Pierson-Moskowitz wave spectrum and JONSWAP wave spectrum.
In the seventies, wave measurements were carried out to the west of Denmark, as part of JONSWAP (Joint North Sea Wave Project). These measurements have demonstrated that, in case of a limited fetch length, the form of the spectrum deviates from the Pierson-Moskowitz spectrum. This occurs particularly in coastal areas. In those cases, more energy appears to be concentrated around the peak frequency of the wave spectrum. This has resulted in the JONSWAP spectrum. The JONSWAP spectrum is arrived at by multiplying the Pierson-Moskowitz spectrum with a frequency-dependent amplification factor γ(f):
Delft Hydraulics
11
( )2
2 2
0
0.5
( )
p
p
a
f f
f
f
a eσ
γ γ
⎡ ⎤−⎢ ⎥−⎢ ⎥⎢ ⎥⎣ ⎦
=
=
(B2.18)
with γ0 = peak amplification factor (often 3.3) fp = peak frequency σ = shape factor; often σ = σa = 0.07 for f < fp σ = σb = 0.09 for f > fp
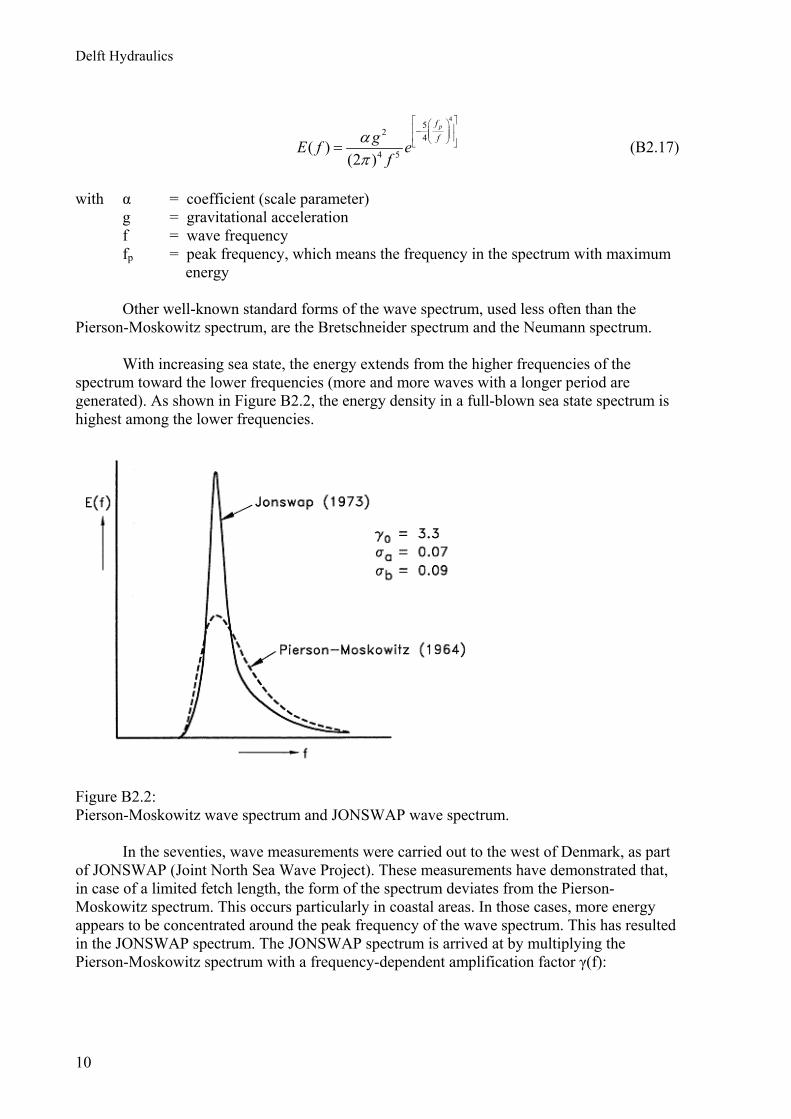
In Figure B2.2 the JONSWAP spectrum is compared with the Pierson-Moskowitz spectrum. The spectra have the same peak period Tp and an equal surface m0 (and therefore an equal significant wave height Hs). It is possible that wind-generated waves are generated locally in a swell field. In that case the spectrum shows two peaks: one peak corresponding with the swell field and another peak, corresponding with the higher frequencies of the locally caused wind-generated wave field (double-peaked wave spectrum). In the above, exclusive reference was made to the wave spectrum of one wave direction. Normally however, also the direction of propagation of the waves will vary because of variations in the wind direction. A three-dimensional spectrum then develops, with wave frequency along one axis and wave direction along the other.
Figure B2.3: Peak amplification factor γ(f)
In general terms, the combined wave height / wave direction spectrum E(f,θ) may be represented by the equation:
( , ) ( ) ( , )E f E f D fθ θ= × (B2.19) with E(f) = frequency-dependent wave energy D(f,θ) = frequency-dependent direction distribution function with a maximum for
Delft Hydraulics
12
θ = 0° (the main direction) θ = angle with main wave direction By definition:
( , )d 1D fπ
π
θ θ−
=∫ (B2.20)
For the direction distribution function D(f,θ) it is generally assumed that:
2( , ) (cos )2
sD f A θθ = (B2.21)
with A = coefficient s = coefficient dependent on the frequency f
2.2.3 Reflection, refraction and diffraction Waves travel in a certain direction. When meeting an obstacle in their path, the waves
will partly be bounced back (reflection) and partly move round the obstacle. Waves that travel in the direction of a vertical wall, may be reflected for almost 100%.
The reflected wave then is of equal height as the incoming wave. In a flume, in which regular waves (with a constant period and a constant height) are generated, and in which a vertical wall is positioned at right angles to the central axis of the flume, the effect of reflection is clearly visible: the incoming waves travel up to the reflecting wall, after which the waves reverse direction and move backward with the same velocity. It now seems as if the waves no longer propagate, because a regular pattern of nodes (places without vertical water displacement) and antinodes (places with maximum vertical water displacement) develops, with the nodes and antinodes at fixed places (standing wave). This pattern is the product of the waves that move forward and backward. The nodes are situated at mutual distances of ½L, and the first node is situated at a distance of ¼L of the reflection plane. In case of complete reflection, the vertical deflection of the water in an antinode equals that of twice the height of the incoming wave.
Waves that hit the wall at an angle are reflected at the same angle in relation to the
normal on that wall. In case of complete reflection, the height of the reflected wave again equals the height of the incoming wave. The well-known cross pattern then develops with – at a reflection of 100% – local wave heights of up to 2H (H = incoming wave height).
In case of irregular waves, the reflection pattern is less clear, due to the variance in
both wave height and wave period, but the phenomenon also manifests here. The reflection coefficient r(f) is defined as:
( )( )( )
r
i
E fr fE f
= (B2.22)
with Ei(f) = energy of incoming wave Er(f) = energy of reflected wave
Delft Hydraulics
13
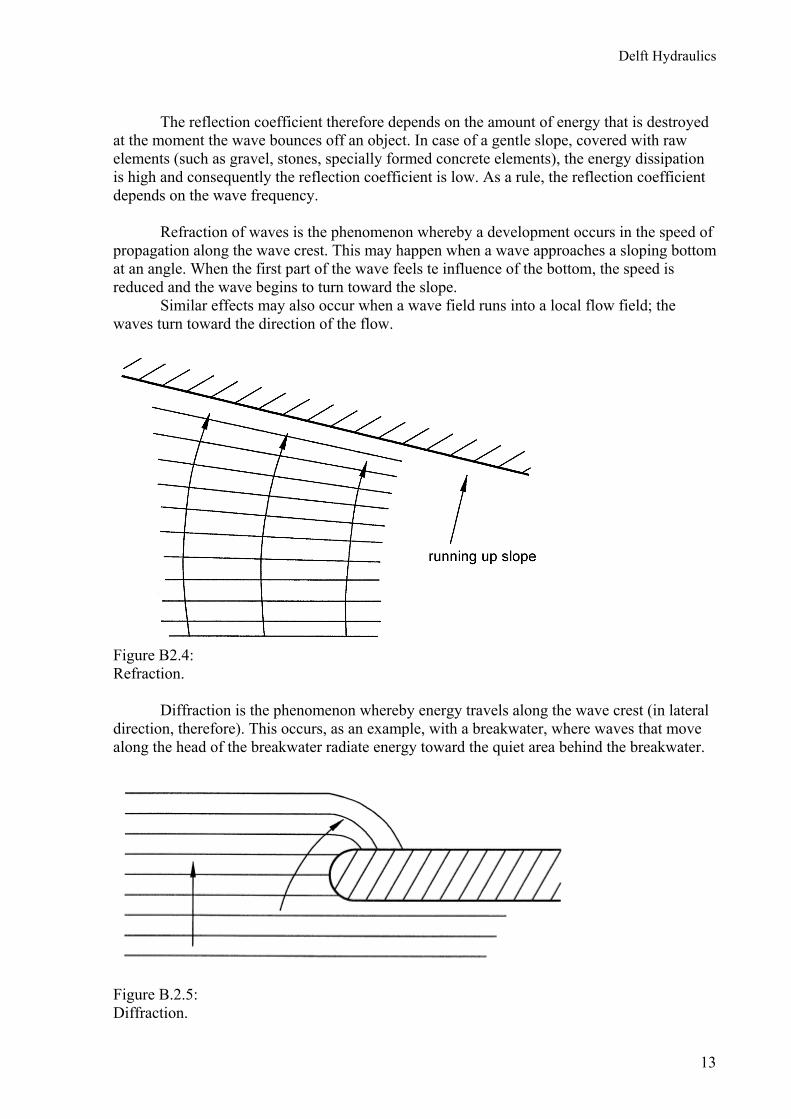
The reflection coefficient therefore depends on the amount of energy that is destroyed at the moment the wave bounces off an object. In case of a gentle slope, covered with raw elements (such as gravel, stones, specially formed concrete elements), the energy dissipation is high and consequently the reflection coefficient is low. As a rule, the reflection coefficient depends on the wave frequency. Refraction of waves is the phenomenon whereby a development occurs in the speed of propagation along the wave crest. This may happen when a wave approaches a sloping bottom at an angle. When the first part of the wave feels te influence of the bottom, the speed is reduced and the wave begins to turn toward the slope. Similar effects may also occur when a wave field runs into a local flow field; the waves turn toward the direction of the flow.
Figure B2.4: Refraction.
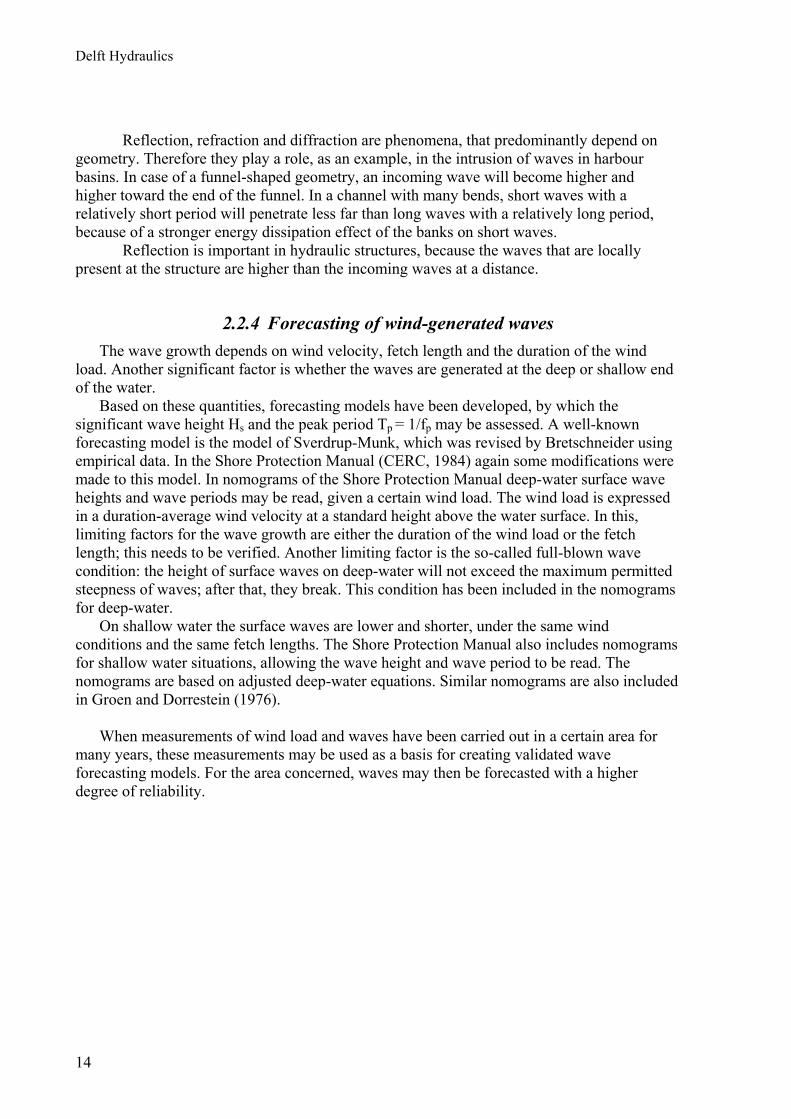
Diffraction is the phenomenon whereby energy travels along the wave crest (in lateral
direction, therefore). This occurs, as an example, with a breakwater, where waves that move along the head of the breakwater radiate energy toward the quiet area behind the breakwater.
Figure B.2.5: Diffraction.
Delft Hydraulics
14
Reflection, refraction and diffraction are phenomena, that predominantly depend on
geometry. Therefore they play a role, as an example, in the intrusion of waves in harbour basins. In case of a funnel-shaped geometry, an incoming wave will become higher and higher toward the end of the funnel. In a channel with many bends, short waves with a relatively short period will penetrate less far than long waves with a relatively long period, because of a stronger energy dissipation effect of the banks on short waves.
Reflection is important in hydraulic structures, because the waves that are locally present at the structure are higher than the incoming waves at a distance.
2.2.4 Forecasting of wind-generated waves The wave growth depends on wind velocity, fetch length and the duration of the wind
load. Another significant factor is whether the waves are generated at the deep or shallow end of the water.
Based on these quantities, forecasting models have been developed, by which the significant wave height Hs and the peak period Tp = 1/fp may be assessed. A well-known forecasting model is the model of Sverdrup-Munk, which was revised by Bretschneider using empirical data. In the Shore Protection Manual (CERC, 1984) again some modifications were made to this model. In nomograms of the Shore Protection Manual deep-water surface wave heights and wave periods may be read, given a certain wind load. The wind load is expressed in a duration-average wind velocity at a standard height above the water surface. In this, limiting factors for the wave growth are either the duration of the wind load or the fetch length; this needs to be verified. Another limiting factor is the so-called full-blown wave condition: the height of surface waves on deep-water will not exceed the maximum permitted steepness of waves; after that, they break. This condition has been included in the nomograms for deep-water.
On shallow water the surface waves are lower and shorter, under the same wind conditions and the same fetch lengths. The Shore Protection Manual also includes nomograms for shallow water situations, allowing the wave height and wave period to be read. The nomograms are based on adjusted deep-water equations. Similar nomograms are also included in Groen and Dorrestein (1976).
When measurements of wind load and waves have been carried out in a certain area for
many years, these measurements may be used as a basis for creating validated wave forecasting models. For the area concerned, waves may then be forecasted with a higher degree of reliability.
Delft Hydraulics
15
3 WAVE LOADS
Waves hitting a structure cause loads that vary over time. The magnitude of these loads depends on wave height, wave period and wave direction, and of course the dimensions of the surface area of the structure, on which the wave pressures operate. The shape and the surface properties of the structure, the foreland geometry and the presence of other structures also play a role in this, in relation to reflection, diffraction and refraction, wave overtopping and the dissipation of wave energy. In this chapter a preview is given concerning the concept of wave load. Chapters 4 and 5 go into these matters more deeply.
Wave loads may be differentiated into quasi-static loads and wave impact loads. Quasi-
static loads are loads that move with the same period as the waves themselves. Wave impact loads are much faster loads; they only occur during a short part of the wave period (indication of impact duration: 10-200 ms) and after the falling away of the wave impact pressure, the quasi-static wave pressure remains.
The wave-group-related second-order waves with relatively small amplitude and a long
period are especially important for floating and moored objects. They may be the cause of drift forces; when, as an example, manoeuvring vessels or positioning large offshore structures, these forces may be influential. They may also be the cause of resonances in harbour basins, as a result of which vessels may intensily swing in their moorings.
For structures with a horizontal dimension D that is small in relation to the wavelength L,
the wave will move around the structure more or less undisturbed. Locally disturbances do develop, by way of a wake at the lee side of the structure. This wake (an area of separated flow and free boundary layers in the water, where vortices are formed) may be compared to the wake that is generated at structures around which the water flows (see also Chapter 5 in Part A). In case of stationary flow, the force of the flow or drag force is generally proportional to ρv2D/2; this also applies to the fluctuating part of this force. The frequency f of the fluctuating part of the force is connected with the approach velocity v and cross dimension D through the Strouhal number S = fD/v. In structures with rounded corners and with a non-angular shape, the Strouhal number is a function of the Reynolds number Re = vD/ν, with ν = kinematic viscosity coefficient (see also Chapter 5 in Part A).
In case of waves however, the flow is not stationary, but there is an alternating current, connected with the orbital movement, of which the amplitude moreover decreases according to the distance from the water surface. Therefore, both forces of inertia (due to the acceleration and deceleration of the water movement), as well as drag forces (connected with the circumfluence) develop. With decreasing amplitude of the horizontal water movement, the importance of the drag force in relation to the force of inertia decreases.
With increasing structure dimension D in relation to wave length L, the diffraction of the
waves becomes more important, that is, the waves themselves are more and more influenced by the presence of the structure (‘scattering’), and the mass inertia term dominates the wave forces . Phase differences between the wave pressures develop at various points of the structure.
At round structures less and less wake develops on the lee side and the forces are
decreasingly determined by flow separation and increasingly by wave diffraction; from D/L >
Delft Hydraulics
16
0,2 wave diffraction becomes dominant. In the water movement around the structure almost no vortices occur anymore. Wave forces may then be calculated on the basis of potential flow theory (in the potential flow theory, the starting point is a non-viscous circle, rotation-free flow). These calculations are known as diffraction calculations. See also Berkhoff (1976).
At angular structures, such as a rectangular caisson, separation phenomena continue to occur at angular points, when increasing the structure dimension D, but the effects of this are local. Similar to round structures, when increasing D, wave diffraction becomes dominant and determining of the wave forces. The transition possibly relates to a higher D/L value, rather than to round structures. About this, data are however not available.
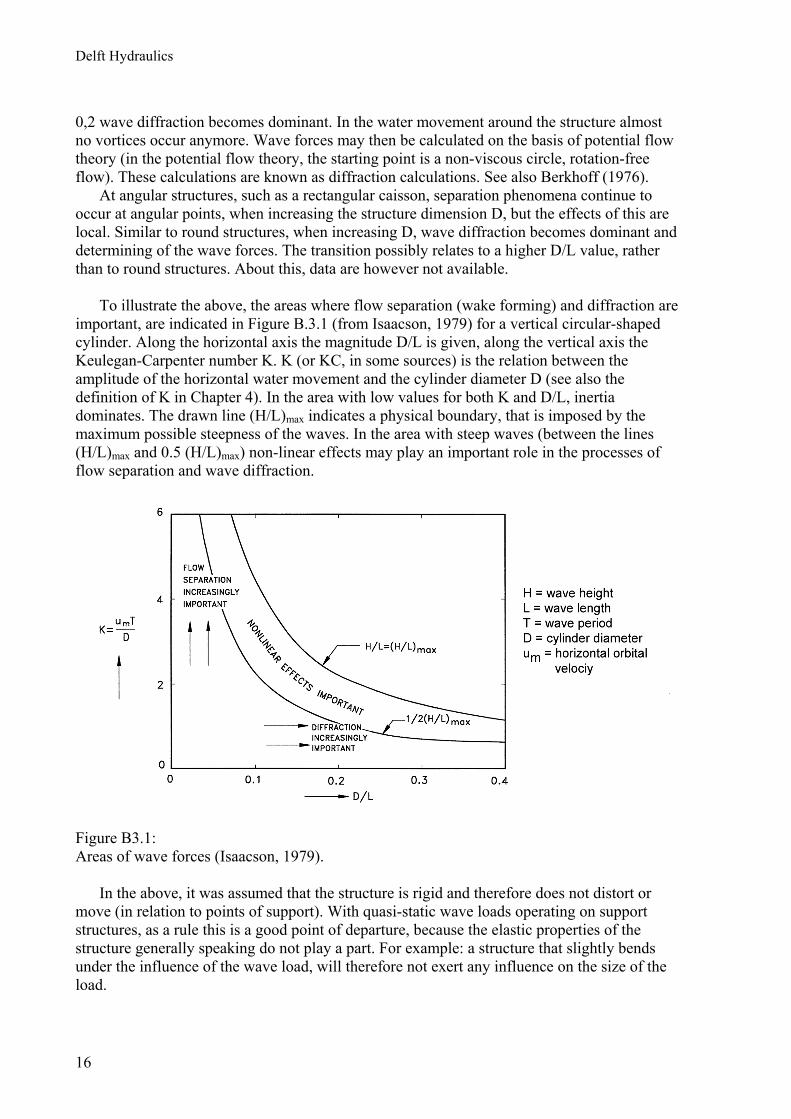
To illustrate the above, the areas where flow separation (wake forming) and diffraction are
important, are indicated in Figure B.3.1 (from Isaacson, 1979) for a vertical circular-shaped cylinder. Along the horizontal axis the magnitude D/L is given, along the vertical axis the Keulegan-Carpenter number K. K (or KC, in some sources) is the relation between the amplitude of the horizontal water movement and the cylinder diameter D (see also the definition of K in Chapter 4). In the area with low values for both K and D/L, inertia dominates. The drawn line (H/L)max indicates a physical boundary, that is imposed by the maximum possible steepness of the waves. In the area with steep waves (between the lines (H/L)max and 0.5 (H/L)max) non-linear effects may play an important role in the processes of flow separation and wave diffraction.
Figure B3.1: Areas of wave forces (Isaacson, 1979).
In the above, it was assumed that the structure is rigid and therefore does not distort or move (in relation to points of support). With quasi-static wave loads operating on support structures, as a rule this is a good point of departure, because the elastic properties of the structure generally speaking do not play a part. For example: a structure that slightly bends under the influence of the wave load, will therefore not exert any influence on the size of the load.
Delft Hydraulics
17
This is wholly different in case of hinge-attached, moored or floating structures; in those cases the structure may perform relatively large movements because of the influence of the wave load, and the quasi-static loads are also a function of the degree of movement.
In case of wave impact loads whereby a certain amount of water is suddenly ‘blocked’
because the structure blocks the water movement, the elasticity of the structure, of the water and of the enclosed air, generally play an important role in the magnitude of the load and the response.
In Chapter 4 more attention is given to the size of the quasi-static loads. Wave impact
loads are further discussed in Chapter 5.

Delft Hydraulics
18
Delft Hydraulics
19
4 QUASI-STATIC WAVE LOAD
For the design of a structure in the wave zone, an estimate of the expected wave loads that may occur over the life span of the structure, is required. On the one hand, this means that an understanding of the wave climate is required, and, on the other hand, an understanding of the process of conversion of wave energy into loads operating on the structure. In this chapter a global overview is given concerning the possibilities to determine quasi-static wave loads. In this, it is assumed that the wave conditions are known; in this manual no further attention is given to the determination of wave conditions or the probability of occurrence of these conditions. Analytical calculation
For the calculation of quasi-static wave loads that influence structures, analytical methods are available. The point of departure of this calculation is a certain design wave with a certain height, period and direction. The design wave is chosen on the basis of a statistical analysis of the wave climate. The calculation of the wave load requires fluid velocities and accelerations within the wave, also referred to as wave pressures; for this a wave theory needs to be applied. When making the calculation, it is generally assumed that the wave is long-crested and that it moves toward the structure at right angles.
In case of short-crested waves (as a consequence of directional dispersion) the wave loads are lower and a reduction factor may be applied. Generally this also applies to incoming waves that are at an incline. See also Battjes (1992).
The equations given in the list of references share the characteristic of being simplifications of reality and therefore they should be used with considerable care. The first wave load equations were developed for breakwaters; equations for offshore structures were developed more recently. Breakwaters are broad structures and require a different approach than the usually slender offshore structures. Contrary to the rule in mechanics, a slender structure is defined as follows. A slender structure has a dimension D perpendicular to the wave direction, which is small in relation to wave length L:
0.05 to 0.2DL< (B4.1)
For slender structures calculations may be performed on the basis of an almost
undisturbed wave field; the wave load consists of a mass inertia term and a drag term (see also Chapter 3).
For non-slender structures (circular structures: D/L > 0.2) the forces are determined by diffracting waves. When D/L is sufficiently great (order of dimension 1), reflection occurs as well.
Delft Hydraulics
20
4.1 Slender structures
An equation that is often used for the calculation of the quasi-static wave load (operating in the wave direction) on slender, vertical structures, is the Morison equation, which consists of the sum of a mass inertia term and a drag term:
d 1d 2m duF C V C Du ut
ρ ρ= + (B4.2)
with F = force per unit of length in vertical direction Cm = mass inertia term Cd = drag term ρ = density (specific mass) of water u = horizontal orbital velocity in the central axis of the structure (calculated as if the structure is absent) V = volume of the structure per unit of length in vertical direction D = transverse dimension of the structure perpendicular to the wave direction
In case of an orbital movement, the horizontal velocity u is the highest near the water surface; u decreases toward the bottom. The load therefore varies according to the position below the water surface.
The horizontal velocity u is usually calculated by using the linear wave theory; in that case the velocity varies in time sinusoidally:
cosh ( ) sin( )2 sinhH k d zu t kx
kdω ω+
= − (B4.3)
with z = coordinate in vertical direction (positive direction upward; origin coincides
with mean still water level) x = horizontal coordinate in direction of propagation of the waves; this is zero if
the origin is chosen in the central axis of the structure H = wave height k = wave number = 2 / Lπ d = water depth ω = wave frequency = 2 /Tπ L = wave length T = wave period
For the calculation of the wave load, the maximum velocity um is used; this therefore still depends on the position below the water surface.
As demonstrated by Equation (B4.2), the extreme value of the mass inertia term, in case of a harmonic water movement, is 90º out-of-phase with the extreme value of the drag term; the maximum values in both terms therefore do not occur simultaneously.
For different geometries experimental Cm and Cd values were determined. This
especially applies to circular cylinders (frequently applied in the offshore industry; see among others Klopman and Kostense, 1989). In the latter case, in the Equation B4.2, V = ¼лD2 (volume per unit of length) and D = pile diameter.

Delft Hydraulics
21
For Cm, potential flow theory gives a value of 2 for a circular cylinder; this means that
an imaginary volume of water of twice the volume V of the cylinder is accelerated in movement. In case of a moving cylinder in a still water surface, the imaginary accelerated volume of water (the added water mass) equals one time the volume of the cylinder, and is therefore smaller by a factor 2. The potential flow theory indicates an upper limit for Cm; in reality Cm is smaller, due to wake formation. For the same reason, the coefficient Cd, found for cylinders with the potential flow theory, i.e. Cd = 0, cannot be used.
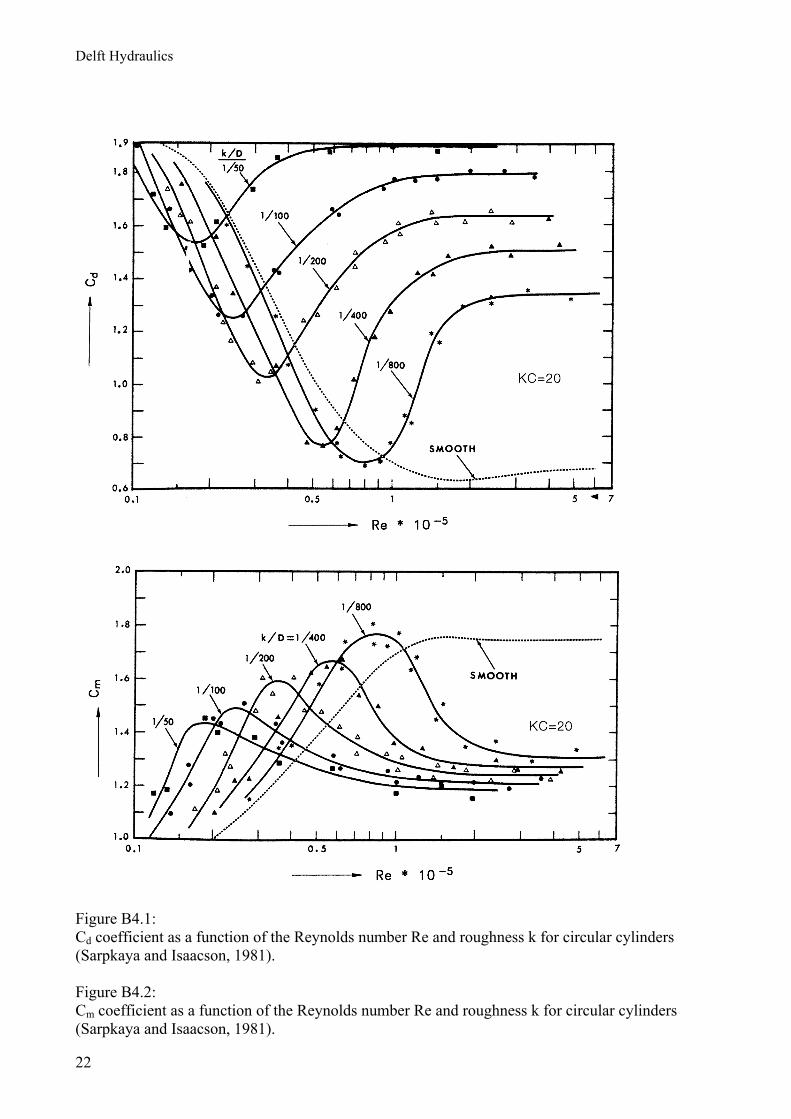
The coefficients Cm and Cd for circular structures strongly depend on the Reynolds
number (see also Chapter 5 in Part A). Similar to a stationary flow, in case of an oscillating flow around a cylinder, the degree of turbulence in the boundary layer alongside the cylinder and in the free boundary layer behind the cylinder determine the width of the wake behind the cylinder. The magnitude of these forces depends on the width of the wake. In case of increasing turbulence in the free boundary layer (higher Reynolds number), the flow bends back more, which narrows the wake and reduces the drag force (Cd). Because of this, the inertia force (Cm) increases. When the Reynolds number further increases, the turbulence in the free boundary layer alongside the cylinder increases as well. The effect of this, is that the flow separates earlier (the velocities operating on the cylinder surface are higher), which broadens the wake again, increasing Cd and decreasing Cm. The roughness of the structure’s surface strongly influences the separation process (the greater the roughness, the greater the turbulence in the boundary layer). The roughness k is a representative measure of the unevenness on the cylinder surface. The dimension is m, but k is usually expressed in mm. In practice, the dimensions of the unevenness may vary from a few mm (light fouling / rust) to a few cm (heavy fouling). The figures below (taken from Sarpkaya and Isaacson, 1981) indicate the dependence of the Cd and Cm coefficients on the Reynolds number and the effect of the roughness k. The Reynolds number Re is defined as:
Re mu Dν
= (B4.4)
with ν = kinematic viscosity coefficient um = maximum horizontal orbital velocity D = diameter of cylinder
Delft Hydraulics
22
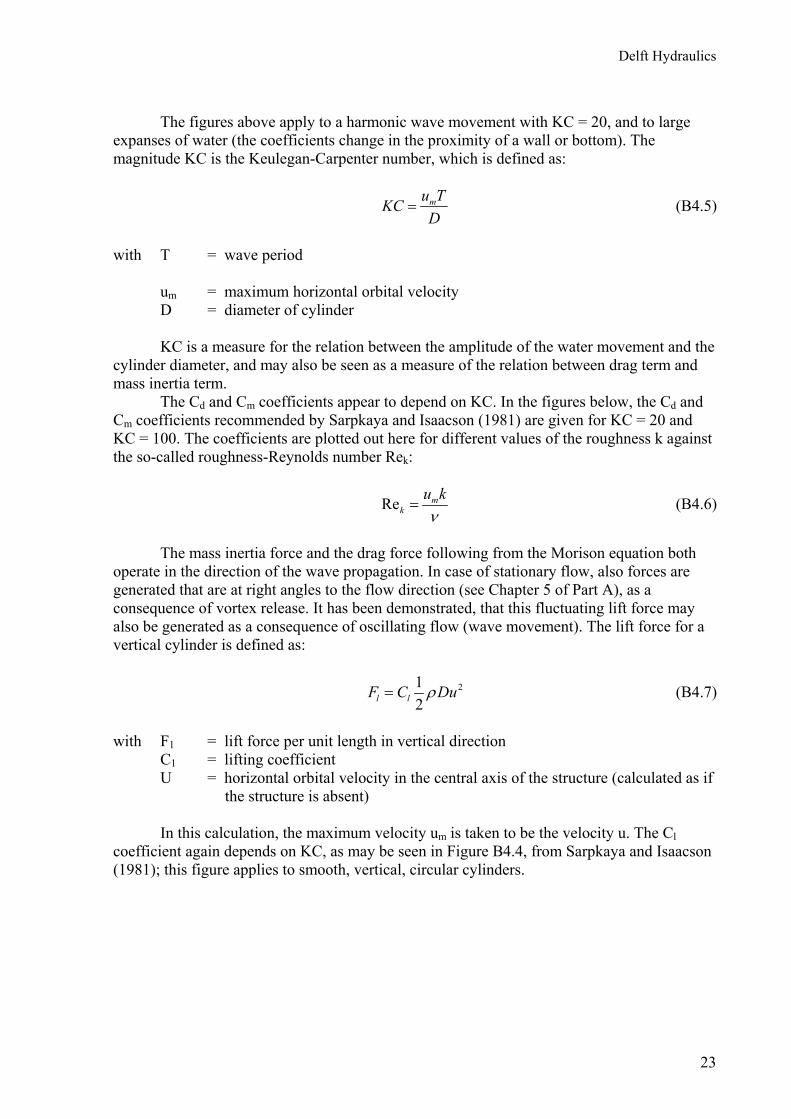
Figure B4.1: Cd coefficient as a function of the Reynolds number Re and roughness k for circular cylinders (Sarpkaya and Isaacson, 1981). Figure B4.2: Cm coefficient as a function of the Reynolds number Re and roughness k for circular cylinders (Sarpkaya and Isaacson, 1981).
Delft Hydraulics
23
The figures above apply to a harmonic wave movement with KC = 20, and to large expanses of water (the coefficients change in the proximity of a wall or bottom). The magnitude KC is the Keulegan-Carpenter number, which is defined as:
mu TKCD
= (B4.5)
with T = wave period um = maximum horizontal orbital velocity D = diameter of cylinder
KC is a measure for the relation between the amplitude of the water movement and the cylinder diameter, and may also be seen as a measure of the relation between drag term and mass inertia term.
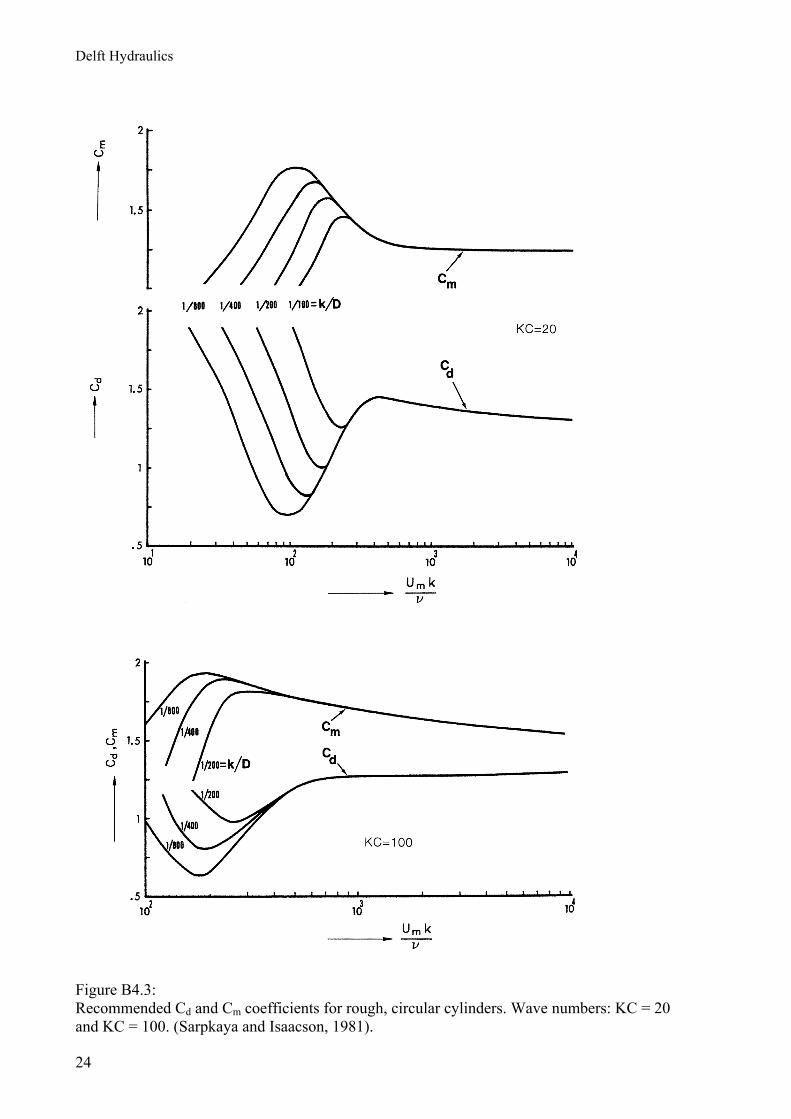
The Cd and Cm coefficients appear to depend on KC. In the figures below, the Cd and Cm coefficients recommended by Sarpkaya and Isaacson (1981) are given for KC = 20 and KC = 100. The coefficients are plotted out here for different values of the roughness k against the so-called roughness-Reynolds number Rek:
Re mk
u kν
= (B4.6)
The mass inertia force and the drag force following from the Morison equation both
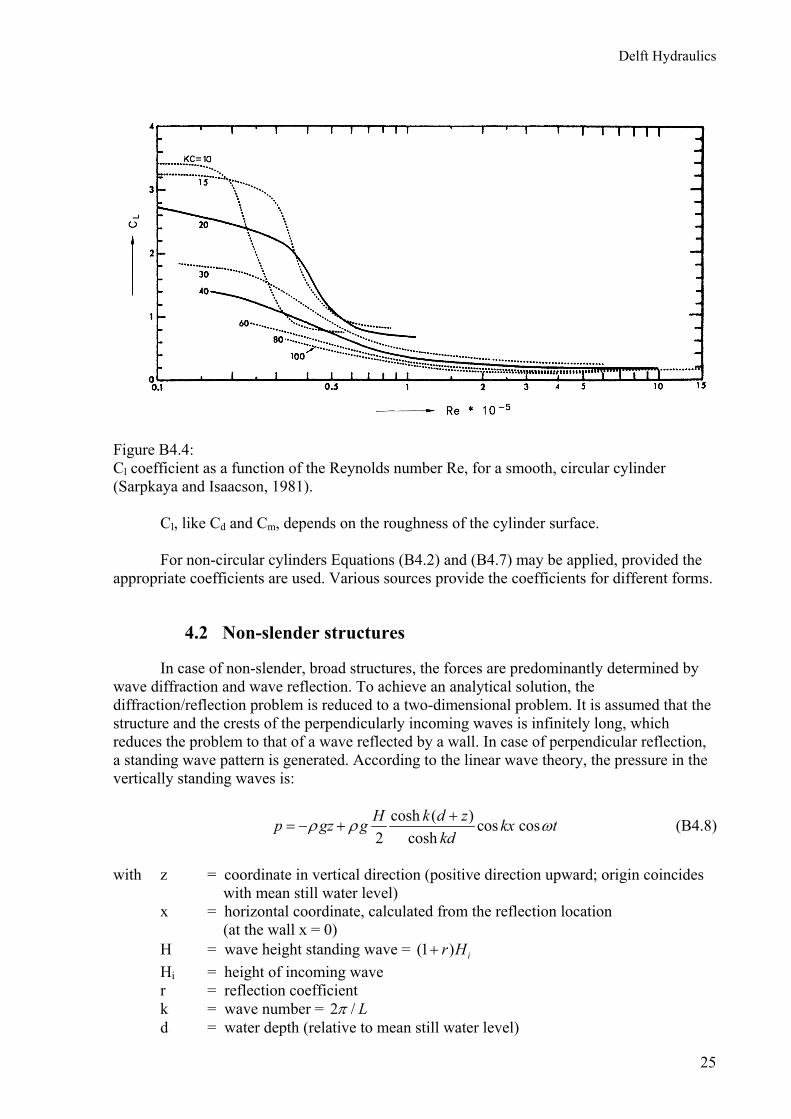
operate in the direction of the wave propagation. In case of stationary flow, also forces are generated that are at right angles to the flow direction (see Chapter 5 of Part A), as a consequence of vortex release. It has been demonstrated, that this fluctuating lift force may also be generated as a consequence of oscillating flow (wave movement). The lift force for a vertical cylinder is defined as:
212l lF C Duρ= (B4.7)
with F1 = lift force per unit length in vertical direction C1 = lifting coefficient U = horizontal orbital velocity in the central axis of the structure (calculated as if the structure is absent)
In this calculation, the maximum velocity um is taken to be the velocity u. The Cl coefficient again depends on KC, as may be seen in Figure B4.4, from Sarpkaya and Isaacson (1981); this figure applies to smooth, vertical, circular cylinders.
Delft Hydraulics
24
Figure B4.3: Recommended Cd and Cm coefficients for rough, circular cylinders. Wave numbers: KC = 20 and KC = 100. (Sarpkaya and Isaacson, 1981).
Delft Hydraulics
25
Figure B4.4: Cl coefficient as a function of the Reynolds number Re, for a smooth, circular cylinder (Sarpkaya and Isaacson, 1981).
Cl, like Cd and Cm, depends on the roughness of the cylinder surface. For non-circular cylinders Equations (B4.2) and (B4.7) may be applied, provided the
appropriate coefficients are used. Various sources provide the coefficients for different forms.
4.2 Non-slender structures
In case of non-slender, broad structures, the forces are predominantly determined by wave diffraction and wave reflection. To achieve an analytical solution, the diffraction/reflection problem is reduced to a two-dimensional problem. It is assumed that the structure and the crests of the perpendicularly incoming waves is infinitely long, which reduces the problem to that of a wave reflected by a wall. In case of perpendicular reflection, a standing wave pattern is generated. According to the linear wave theory, the pressure in the vertically standing waves is:
cosh ( ) cos cos2 coshH k d zp gz g kx t
kdρ ρ ω+
= − + (B4.8)
with z = coordinate in vertical direction (positive direction upward; origin coincides
with mean still water level) x = horizontal coordinate, calculated from the reflection location
(at the wall x = 0) H = wave height standing wave = (1 ) ir H+ Hi = height of incoming wave r = reflection coefficient
k = wave number = 2 / Lπ d = water depth (relative to mean still water level)
Delft Hydraulics
26
The equation above is based on a first-order wave approach, i.e. without a mean water-
level increase. Sainflou was one of the first to deduce an analytical expression for the wave force operating on a vertical wall, as a consequence of a standing, non-breaking trochoidal wave. In this expression, account was taken of a mean water-level increase in relation to the still water line (second-order approach). The pressure distribution was assumed to be linear. Measurements showed that the Sainflou equation overestimates the wave pressure in case of steep waves. The equation was later revised by Rundgren (1959) on the basis of the modified higher-order wave theory of Miche (1944). Also Iribarren (1954) has provided equations for the wave pressure on a vertical wall. The equations of Sainflou and Miche/Rundgren are used in CERC (1984), in graphs from which the wave load on a wall may be read. The equations apply to non-breaking waves. In case of breaking waves, wave impacts may occur on the wall. The wave impact pressures as a rule are much higher than the quasi-static wave pressures. For wave impact pressures we refer to Chapter 5. In case of wave overtopping, when the product of the mean water-level increase and the zero top value of the wave is greater than the part of the wall that extends above the still water line, the wave load may be reduced. In CERC (1984) reduction factors for this are given. Other effects however can now come into play. The overtopping water may hit other parts of the structure and cause wave impacts. Also, when the overtopping water falls down into the water on the lee side, it may generate a sudden water movement, which may cause dynamic loads. When there is little or no water coverage on the lee side, bottom protection is likely to be necessary. The graphs in CERC (1984) are based on relatively simple, easy-to-use equations. Other equations for wave pressure on vertical walls were formulated among others by Minikin (1950) (also for breaking waves; Chapter 5 goes into this further) and Nagai (1973). More recently Goda has proposed a set of universal equations for the wave pressure on vertical breakwaters (Goda, 1985 and 1992). These equations include coefficients for wave direction, deep-water surface waves and shallow-water waves. The equations do not change in case of overtopping. Goda’s equations may be considered as the state-of-the-art equations of today. Within the framework of this manual however, the equations of Goda will not be discussed any further. When an initial rough estimate of the quasi-static wave load on a vertical wall is desired, the conservative approach may be taken by assuming that the wave pressure from the free water surface up to the still water line progresses hydrostatically and after that remains constant up till the bottom. This also gives a hydrostatic development of the total pressure, with pmax = ρg(d+A) as the highest and pmin = ρg(d-A) as the lowest value at the bottom, with A = local wave amplitude and d = water depth. This pressure distribution equals that of long waves; with long waves the pressure distribution may be assumed to be approximately hydrostatic. In case of long walls, the wave diffraction/reflection problem, as indicated above, may be reduced to a two-dimensional reflection problem with standing waves. For structures of smaller dimensions this is not possible and the diffraction problem needs to be solved. For this, the potential flow theory may be used. In that case, waves are linearised and considered
Delft Hydraulics
27
as the sum of harmonic components. For a vertical round cylinder an analytical solution for the potential problem is available, see as an example Sarpkaya and Isaacson (1981) or Nagai (1973). For other geometries the wave diffraction problem (potential problem) may be solved by using numeric calculating techniques.
4.3 Numeric calculation
The numeric calculation of quasi-static wave loads is carried out by using so-called diffraction models. See among others Berkhoff (1976). These models are based on a linear potential flow equation and therefore do not include a drag term; they are not suited for slender structures, because in case of slender structures the influence of the drag force is significant. Compare with the Morison equation (Equation B4.2).
The diffraction models therefore are used for voluminous structures in which inertia forces are predominant, such as ships, building pits and large-sized piers. This may also include underwater structures and floating structures.
Each time, wave forces are calculated for one wave frequency. In case of a wave spectrum, the spectrum is translated as a sum of single waves. By using the superposition principle (based therefore on linearity) the force spectrum in case of a wave spectrum may be calculated. As this force spectrum does not contain phase information, the force development with time cannot be determined from this. It is however possible, to deduce a characteristic value from the spectrum, a standard deviation as an example (see also Paragraph 5.7.4 in Part C).
Diffraction models may be used to calculate hydrodynamic coefficients (for
hydrodynamic coefficients, see also Chapter 2 in Part A). Actually, this is the inverse wave problem: in one of its degrees of freedom, the structure is subjected to a forced movement, and as a consequence waves are transmitted. A mass inertia term and a damping term (representing the transmitted waves) are found. These terms may then be included in calculating the response of this structure to external forces (these may also be wave forces), such as hydrodynamic interaction forces. See also Chapter 3 in Part C for a calculation of the response of the structure.
4.4 Scale model investigation
For structures of a somewhat more complex shape, at this point in time the available analytical and numeric models do not suffice to determine the quasi-static wave loads. This also particularly applies to components of the structure. As a rule, scale models should offer a solution. This also applies to structures that have so much freedom of motion, that the wave loads are influenced by the motion. Chapter 5 of Part C will deal with scale model techniques more extensively, as well as with the possibilities of analysing measurement signals and making processing results presentable.
4.5 Influence of flow
Waves that end up in a flow field, are influenced by that flow. In case of counter flow the wave celerity is reduced and thereby also the wave length (the wave period remains unchanged). In connection with this, the waves become higher; the steepness of the waves
Delft Hydraulics
28
may increase so much, that the waves break. In case of flow, the reverse occurs and the waves become ‘stretched out’ and lower.
These flow refraction effects may be included in numeric wave models, by building in
a flow field (potential flow). In this, a dissipation term for breaking waves and bottom friction may also be included (see Hurdle, Kostense and Van den Bosch, 1989).
In river mouths flow may as an example lead to the fact, that the waves are pushed to one side; the effect of this may be, that in this case waves penetrate further than in a situation without flow.
With slender structures the effect of flow on the wave load may be included by adding
the celerity vectorially to the orbital velocity in the Morison comparison. This gives a good estimate of the flow and wave load; in this, the Cd and Cm coefficients belonging with the combined celerity and orbital velocity are used (these coefficients depend on the Reynolds number and therefore on the wave celerity).
The local effect of flow around structures on waves however is very complex and as
yet hardly accessible for calculation. Generally speaking therefore, the combination of flow and waves will be investigated in a scale model.
4.6 Response of structures to quasi-static wave load
The response of a structure to dynamic loads consists of time-dependent distortions and displacements and, connected with this, time-dependent tensions within the material and forces in the points of support.
Walls, breakwaters etc. are rigid structures of considerable weight and the wave loads are transmitted to the underground or the foundational structures (of the pile) without major distortions. The most important failure mechanisms are overturning and sliding across the underground. With these structures therefore the magnitude and the location of the time-variable load resultant are especially important.
Structures that float (whether moored or not) or that are connected by a hinge (as an example bottom-hinged gates that arise on the free side through aeration, thus forming a water barrier) move to a greater or lesser extent under the influence of waves. The wave load here is also a function of the degree of motion. The degree of response of the structure now strongly depends on the relation between the natural frequency of the structure and the wave frequency, and a parallel may be drawn with the response of mass spring systems. For this, see Chapter 3 of Part C. The response may both occur in the form of total movements (displacement as a ‘rigid body’), as well as in the form of, as an example, bending or torsion oscillations (distortion of the body).
Slender support structures distort under the influence of wave load (bending, torsion). Here too, the response strongly depends on the relation between natural frequency and wave frequency. Next to power fluctuations in the frequency of the waves, also higher-frequency power fluctuations may occur as a consequence of vortices in the wake behind the structure.
An often used method to determine the response of a structure at a given wave
spectrum, is the method by which a response spectrum is calculated, using a transfer function. The relation used is: 2( ) ( ) . ( )yy xxG f H f G f=
Delft Hydraulics
29
with Gyy(f) = response spectrum H(f) = transfer function (frequency-dependent) Gxx(f) = wave spectrum
The function |H(f)| contains the frequency-dependent amplification factor. The transfer function H(f) also contains phase information. This however is of no significance when one is only concerned with learning about the magnitude of the response.
In a scale model, it is common practice to determine a transfer function between wave
spectrum and response spectrum, or between wave spectrum and the spectrum of the forces operating on the structure. This provides an understanding of the sensitivity of the structure to components of the wave spectrum. Once a transfer function has been established, the response may be calculated for any random wave spectrum. This operating procedure could be used when the structure may be considered as a linear, time-independent system. In Chapter 5 of Part C the transfer function and, in more general terms, calculating in the frequency domain, is further discussed.

Delft Hydraulics
30
Delft Hydraulics
31
5 WAVE IMPACT LOAD
5.1 Wave impacts in relation to the structure
Wave impacts occur when the movement of the free water surface is suddenly blocked. In the most unfavourable case, the momentum of the moving water is thereby completely ‘cancelled out’ and converted into power. In practice however, the water may always run off sideways and part of the momentum takes on a different direction. A similar phenomenon occurs when an object hits the water surface (in shipping, the hitting of a ship on the water surface is called slamming).
The structure provides the power to ‘stop’ the water. Depending on the rigidity, the structure will consequently be distorted to a greater or lesser extent; weighted structures (as an example breakwaters of the caisson type) may be displaced.
If the water is suddenly stopped and cannot run off sideways, infinitely high pressures
would be generated – should the water not be compressible. In reality this doesn’t happen, because there are always elastic elements present:
• The water itself is compressible; • This compressibility increases when there are air bubbles in the water; • Air pockets enclosed between the water front and the structure operate as an elastic
element; • The construction itself is elastic.
The weakest element determines the magnitude of the impact pressure. Also significant is the fact that a structure isn’t always hit simultaneously across the whole surface area; therefore a ‘spreading’ of the impact takes place over time, which results in a longer impact duration and a lower peak pressure.
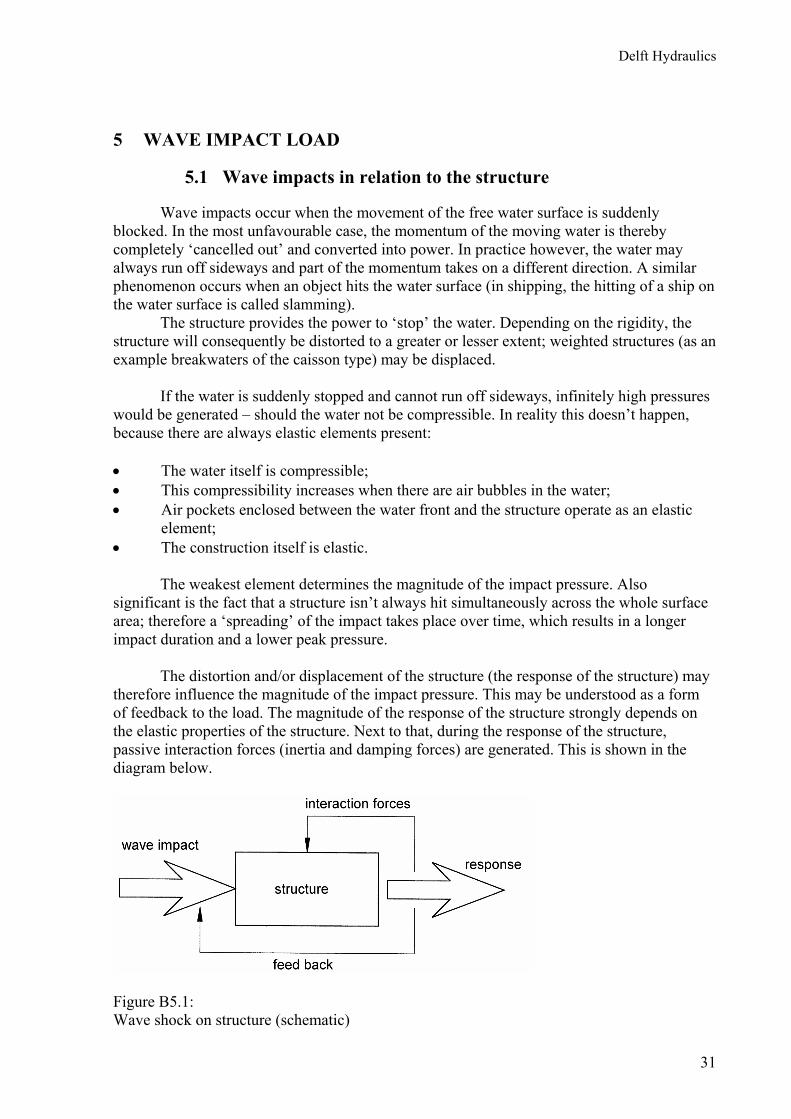
The distortion and/or displacement of the structure (the response of the structure) may
therefore influence the magnitude of the impact pressure. This may be understood as a form of feedback to the load. The magnitude of the response of the structure strongly depends on the elastic properties of the structure. Next to that, during the response of the structure, passive interaction forces (inertia and damping forces) are generated. This is shown in the diagram below.
Figure B5.1: Wave shock on structure (schematic)
Delft Hydraulics
32
Wave impacts are impulse loads with a quickly mounting load amplitude over time. This kind of load not only occurs in case of waves, but may as an example also occur due to the sudden opening or closing of valves in pipes or in pipe systems that are not properly deaerated as a consequence of instable fluid surfaces. Generally speaking therefore, in situations in which water movements are abruptly stopped or caused to change direction. Loads due to colliding ice floes, ships or other floating objects are also impulse-like and are comparable in effect to wave impact loads. Wave impacts may cause heavy loads. As a rule therefore, a designer will focus on designing or placing the structure in such a way, that wave impacts are avoided. When this is not possible, an estimate needs to be made concerning the probability and magnitude of wave impact occurrence. For a complete probability analysis of the wave impact problem it is necessary to know the physical relations between the different influencing quantities and moreover, the probability distribution functions of these quantities. Usually these are not known, so that probability analyses often have considerable limitations. Another possibility is to make an initial estimate of the impact load of a given design wave, on the basis of analytical models. These models usually give a high value for the impact load. In Paragraph 5.4 some analytical models are discussed. As a rule, a check of the impact load (and of the response) or a more specific quantification of the load is desirable. Numeric models are being developed, but their value for hydraulic structures is still limited. Scale models are more suited for a more specific determination of the impact load, but they also have their limitations, because air inclusions may cause scale effects that are difficult to quantify. The operating procedure with the scale model therefore could be as follows: for a given structure, with hydraulic conditions remaining the same, the wave impact pressures and exceedance distributions are determined. Next, by varying the hydraulic conditions (parameter variation), an understanding may be obtained about the question whether wave impacts do or do not occur and of what magnitude these impacts are. A fundamental difficulty remains the translation of that understanding to the prototype, but it is always possible to give an upper limit for the load. The next paragraphs discuss the excitation side of the wave impact problem, followed by the response side and feedback in Chapter 6. In Chapter 5 of Part C the scale model technique is further discussed and in Chapter 4 and 5 of Part C scale effects in wave impact investigations are discussed.
5.2 Wave impact characteristics
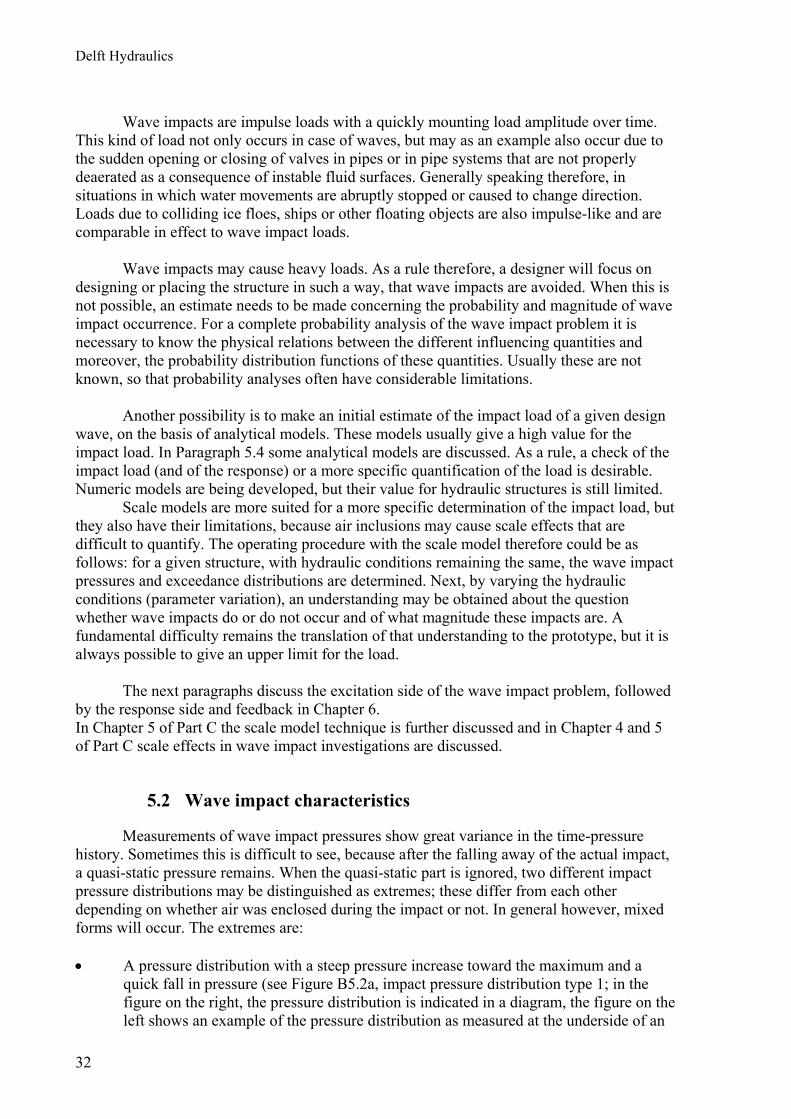
Measurements of wave impact pressures show great variance in the time-pressure history. Sometimes this is difficult to see, because after the falling away of the actual impact, a quasi-static pressure remains. When the quasi-static part is ignored, two different impact pressure distributions may be distinguished as extremes; these differ from each other depending on whether air was enclosed during the impact or not. In general however, mixed forms will occur. The extremes are: • A pressure distribution with a steep pressure increase toward the maximum and a
quick fall in pressure (see Figure B5.2a, impact pressure distribution type 1; in the figure on the right, the pressure distribution is indicated in a diagram, the figure on the left shows an example of the pressure distribution as measured at the underside of an
Delft Hydraulics
33
upper beam of the storm surge barrier Eastern Scheldt during stormy conditions; CONDITS project). In this type of impact no air is enclosed.
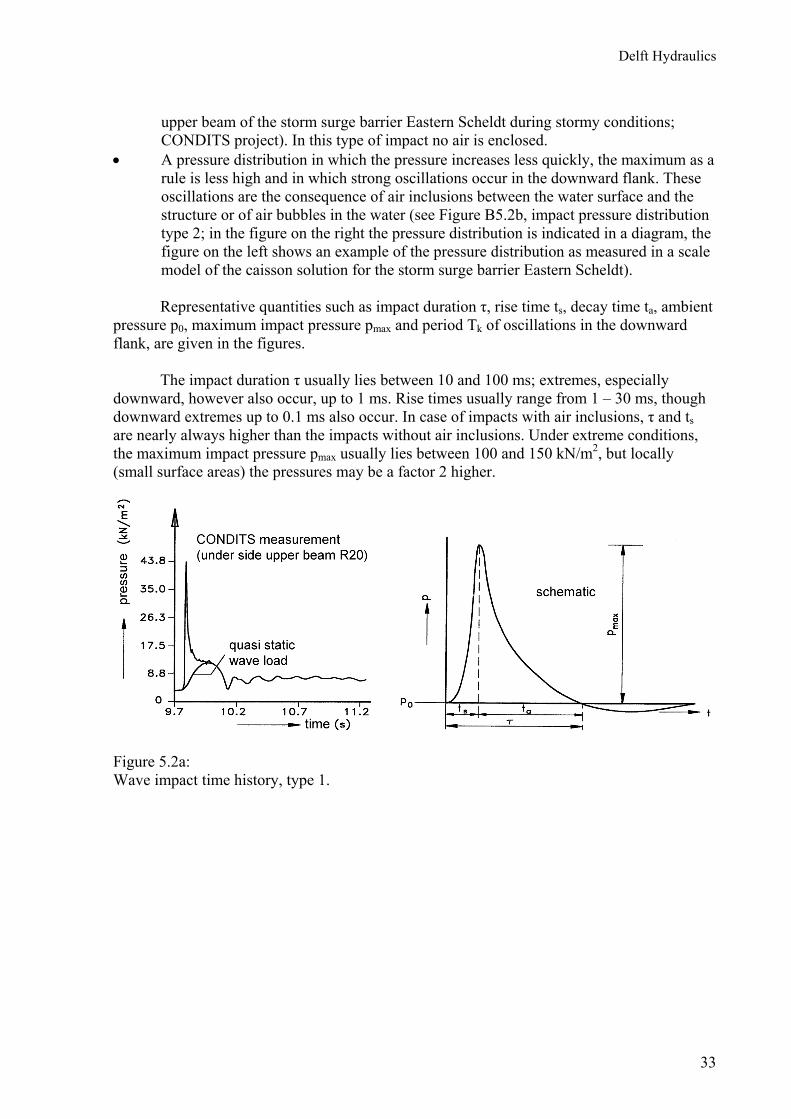
• A pressure distribution in which the pressure increases less quickly, the maximum as a rule is less high and in which strong oscillations occur in the downward flank. These oscillations are the consequence of air inclusions between the water surface and the structure or of air bubbles in the water (see Figure B5.2b, impact pressure distribution type 2; in the figure on the right the pressure distribution is indicated in a diagram, the figure on the left shows an example of the pressure distribution as measured in a scale model of the caisson solution for the storm surge barrier Eastern Scheldt).
Representative quantities such as impact duration τ, rise time ts, decay time ta, ambient
pressure p0, maximum impact pressure pmax and period Tk of oscillations in the downward flank, are given in the figures. The impact duration τ usually lies between 10 and 100 ms; extremes, especially downward, however also occur, up to 1 ms. Rise times usually range from 1 – 30 ms, though downward extremes up to 0.1 ms also occur. In case of impacts with air inclusions, τ and ts are nearly always higher than the impacts without air inclusions. Under extreme conditions, the maximum impact pressure pmax usually lies between 100 and 150 kN/m2, but locally (small surface areas) the pressures may be a factor 2 higher.
Figure 5.2a: Wave impact time history, type 1.
Delft Hydraulics
34
Figure B5.2b: Wave impact time history, type 2.
Wave impacts usually do not occur simultaneously across a large surface area; the impact front moves and the load on the structure is thereby spread out over time. To determine the total load on the structure it is therefore important to understand the spatial pressure pattern over time.
The impulse Ik of a wave impact is defined as the integral of the impact pressure
across the wave duration τ and across the affected surface area A:
( )d dkA
I p t t Aτ
= ∫ ∫ (B5.1)
As it is not always possible to give an unambiguous indication of the impact duration
τ, in various sources the impulse is also defined as the integral of the pressure across the rise time ts and the affected surface area A.
The impulse thus defined does not equal the total impulse mv (m = water mass, v = water velocity) of the moving water, but only refers to the reduction of the impulse component that is perpendicular to the surface area of the structure; after all, in case of a wave impact, as a rule the water will not be completely stopped (thus resulting in a velocity 0), but part of the impulse will change direction and the water will run off sideways.
The amount of water involved in the impact may be translated into a virtual water
mass, which as a whole experiences a sudden deceleration during the impact. This virtual mass is comparable with the added water mass of vibrating structures and may be translated in the same way. Chapter 3 of Part C further discusses the determination of the added water mass.
Delft Hydraulics
35
5.3 Influencing factors
Many factors influence the occurrence of wave impacts, the magnitude of impact pressures and the progress of the impact in time and space. Specific attention is given to: Geometric factors: • The shape of the structure (with reference to air enclosures, the possibility of water
flowing away sideways, the dimension of the affected surface area); • The angle with and the position in relation to the average water surface (as an
example, components that protrude over the water surface, levee slopes, walls); • The depth and the course of the foreland (with reference to the propagation of the
waves, refraction and breaking). Factors in relation to rigidity (see also Paragraph 5.4): • The elasticity of the structure and the compressibility of the water; • The presence of air pockets between the water surface and the structure or the
presence of air bubbles in the water. Factors in relation to the incoming wave: • The wave height and the wave period (the greater the wave height and the shorter the
wave period, the higher the velocity of the water surface); • The wave direction (the greater the angle between the normal on the structure and the
wave direction, the smaller the probability of wave impacts); • Wave directional dispersion; • The shape of the local wave, which is co-determined by preceding waves travelling
back. Factors in relation to the water: • The salinity of the water (the salinity influences the size and the distribution of air
bubbles in the water and thereby the celerity of shock waves (see Paragraph 5.4); also the density depends on the salinity);
• Flow of the water (flow influences the wave field, but also the waves that are locally present at the structure);
• The water level.
The question whether wave impacts will occur or not predominantly depends on the geometry of the structure and its environment. Wave impacts, as an example, will not occur against a vertical wall, as long as the foreland is sufficiently deep and no changes occur in the bottom condition. In case of a sloping foreland, the probability exists that the waves will break exactly in the proximity of the structure: the steepness of the wave front strongly increases and the wave crest may therefore hit the structure.
The geometric influencing factors therefore are particularly determining for the
occurrence of wave impacts; wave properties such as wave height, wave period and wave direction especially influence the magnitude of the impulse. The greater the wave period, the

Delft Hydraulics
36
greater the water mass involved in the wave impact. Wave height and wave period both influence the velocity of that water mass. The highest waves however by definition do not generate the biggest wave impacts. This is also determined by how the preceding waves, that travel backwards, transform the incoming wave. The direction of propagation of the wave front determines the direction of the impulse. As a rule, when the angle of the wave front relative to the surface of the structure increases, the probability of wave impacts decreases. In case of an angle greater than 20º, the probability of heavy wave impacts is small, because the water may easily run off sideways. Wave impact situations of high probability therefore are: • Vertical structures with a sloping foreland. • Protruding parts of a structure that are located in an area with vertical water
movements. This could also be the ceiling of a culvert drain. Impacts as a consequence of vertical water movements are greatest in the area where the vertical velocity is the greatest, in other words, in the proximity of the still water line.
• Structures that waves can flow through or underneath and structures of which the underside is located in the area of vertical water movements.
• Structures that are so low, that waves overtop them, which causes parts of the structure on the lee side to be hit by the overtopping water. The overtopping water may also cause sudden water movements on the lee side, which at a later stage may cause a impact phenomenon.
• Slopes with breaking waves. To prevent wave impacts, these situations need to be avoided as much as possible.
5.4 Types of wave impacts
Following Lundgren (1969), wave impacts are differentiated according to the following types:
• Hammer shocks.
These are shocks in which the incoming water surface runs parallel to the surface of the structure and in which the water cannot run off sideways; there is also no air enclosed between the water and the structure, or the air inclusions are small and local. In practice, these shocks hardly ever occur, unless on a limited part of the surface area that is affected. With these impacts the compressibility of water (which is influenced by the presence of air in the water) and the elasticity of the structure are of significance for the phenomena that occur and for the magnitude of the impact pressure. At the moment the impact occurs, shock waves are generated in the water and in the structure, which travel with the speed of sound. These phenomena are shown in a shock wave model.
• Ventilated shocks. With these shocks air may escape from between the water surface and the structure and the water may run off sideways. These phenomena are predominantly determined by inertia forces and gravity; the compression of the water and the elasticity of the structure are no longer of any significance. The phenomena may be shown in a flow pressure model.
Delft Hydraulics
37
• Compression shocks. With these shocks, air is enclosed and compressed between the water front and the structure. Afterwards, the air bubble oscillates with a natural period, thereby generating the characteristic oscillating pressure distribution in the downward flank of the impact pressure. In case of large air bubbles, the compression occurs almost adiabatically; when a lot of small bubbles are enclosed, a greater exchange of heat with the surrounding water is possible and the compression tends toward an isothermal process. The higher the oscillation frequency, the smaller the enclosed air bubble(s). The maximum pressure as a rule is smaller than in case of ventilated shocks or hammer shocks. For this type of impact, air compression models have been developed, in which the air bubble is considered as a spring and in which the water mass involved in the impact is determined via a calculation of the added water mass.
The maximum pressure of a wave impact may be assessed on the basis of the above-mentioned models, when it is clear which factors predominate. As a rule however, the pressure-determining factors cannot be given right away. Moreover, estimates are necessary, for example of the velocity of the water, the amount of the water mass contributing to the impact impulse and the amount of air enclosed in the water. Prototype or scale model measurements may then be necessary to arrive at a good forecast of the wave impact load.
5.5 Analytical calculation of maximum impact pressures
Taking the aforementioned types of wave impacts as a point of departure, wave impact models have been developed by which the maximum impact pressure may be calculated. The expressions for the maximum impact pressure are given below. In general, the equations (with the exception of the air compression model) offer no information about the impact duration, and therefore also not about the impact impulse. Because the response of the structure depends on both quantities, the expressions below for the maximum impact pressure are only suited for limited use, unless a good estimate of impact duration and impact impulse can be achieved.
This paragraph also briefly discusses analytical equations for wave impact load on vertical walls.
• Linear shock wave model
This model applies to wave impacts of the hammer shock type. It is assumed that the compressibility of the water and the elasticity of the massive structure are the pressure-determining factors. When the impact occurs, both in the water and in the structure a shock wave is generated. The model shows the magnitude of the pressure leap across the shock wave front in the water. When only taking account of the compressibility of the water, the maximum impact pressure pmax follows from: max 0 0w wp p c vρ− = (B5.2) with ρw = density (specific mass) of water cw = shock wave celerity in water (in case of pure water 1430 m/s) v0 = approach velocity of the water front p0 = pressure in water before a shock, thus before arrival of the shock wave front
Delft Hydraulics
38
This equation is also used to calculate hammer shocks in pipes and was first used by Von Kármán (1929) in wave impact calculation. The speed of propagation cw is related to the compressibility and the density of the water according to:
wKcρ
= (B5.3)
with K = compression module = 1/κ (=2.04.109 N/m2 for pure water) κ = compressibility defined as: ( / ) /V Vκ ρ= − Δ Δ with Δp = pressure change,
V = original volume, ΔV = change of volume
If the elasticity of the structure is also taken into account, the equation for the maximum pressures changes into:
max 0 01
1 /w ww w c c
p p c vc c
ρρ ρ
− =+
(B5.4)
with cc = celerity of shock wave (= speed of sound) in structure material ( / cE ρ= ) E = module of elasticity of the structure material ρc = density (specific mass) of the structure
This equation demonstrates that the maximum pressure in the water is reduced by taking account of the elastic properties of the structure material. As a rule, the speed of sound in the structure material is high in relation to the speed of sound in water. For steel, as an example, cc = 5100 m/s, for concrete cc = 3500 m/s. For pure water cw = 1430 m/s, but when air is enclosed in the water, the speed of sound will be considerably lower. In case of a 1% air volume as an example, the speed of sound is only about 100 m/s. The influence of the elasticity of the structure material on the maximum pressure then becomes negligibly small. In case of non-massive structures the deflection is one order greater than the elastic compression of the material; in that case the elasticity of the structure may be of significance.
In case air is enclosed in the water, the maximum impact pressure is remarkably lower than in the case of pure water. For this, Führböter (1966) has deduced an analytical expression. This will be further discussed in Chapter 4 of Part C.
The linear shock wave model shows an absolute upper limit for the impact pressure
(assuming that the water is pure and that the speed of sound therefore is 1430 m/s). Also when assuming a lower speed of sound, this model still shows very high, often unrealistic, impact pressures.
• Flow pressure model
This is the simplest model that applies to a shock wave of the ventilated shock type. In this model it is assumed that the water may easily run off sideways. The maximum pressure pmax is expressed by a coefficient in the flow pressure:
2max 0 0
1( )2
p p k vρ− = (B5.5)
with k = coefficient for the magnitude of the impact pressure.
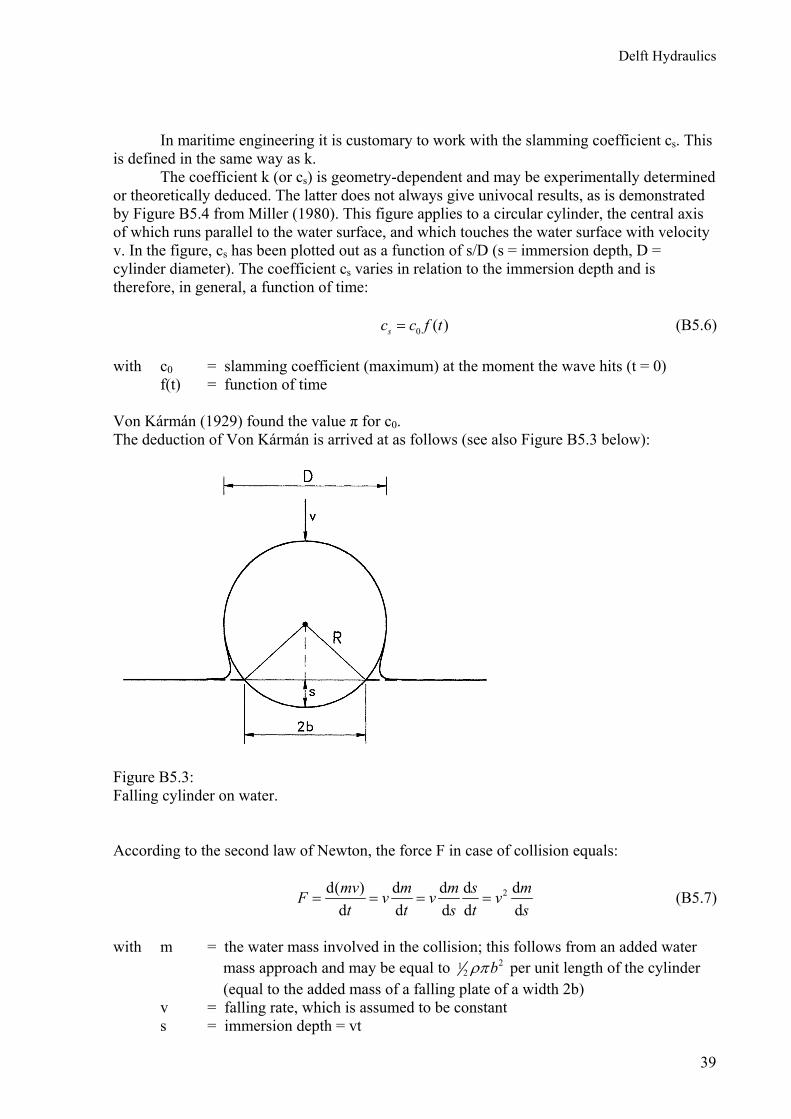
Delft Hydraulics
39
In maritime engineering it is customary to work with the slamming coefficient cs. This
is defined in the same way as k. The coefficient k (or cs) is geometry-dependent and may be experimentally determined
or theoretically deduced. The latter does not always give univocal results, as is demonstrated by Figure B5.4 from Miller (1980). This figure applies to a circular cylinder, the central axis of which runs parallel to the water surface, and which touches the water surface with velocity v. In the figure, cs has been plotted out as a function of s/D (s = immersion depth, D = cylinder diameter). The coefficient cs varies in relation to the immersion depth and is therefore, in general, a function of time: 0 ( )sc c f t= (B5.6) with c0 = slamming coefficient (maximum) at the moment the wave hits (t = 0) f(t) = function of time Von Kármán (1929) found the value π for c0. The deduction of Von Kármán is arrived at as follows (see also Figure B5.3 below):
Figure B5.3: Falling cylinder on water. According to the second law of Newton, the force F in case of collision equals:
2d( ) d d d dd d d d dmv m m s mF v v vt t s t s
= = = = (B5.7)
with m = the water mass involved in the collision; this follows from an added water mass approach and may be equal to 21
2 bρπ per unit length of the cylinder (equal to the added mass of a falling plate of a width 2b) v = falling rate, which is assumed to be constant s = immersion depth = vt
Delft Hydraulics
40
With 2 (2 )b s R s= − follows for F per unit of cylinder length: 2 ( )F v R sρπ= − (B5.8) Now, when the slamming coefficient is defined as:
21
2
sFcv Dρ
(B5.9)
cs is found to be: (1 2 / ) (1 2 / )sc s D vt Dπ π= − = − (B5.10) For t = 0 the maximum value is found to be: cs = c0 = π.
The other researchers quoted by Miller, namely Wagner (1931) and Fabula (1957), give other deductions (assuming that the water rises when the cylinder penetrates the water surface, and assuming an elliptically immersed cylinder surface) and find the value 2π for c0. These researchers also give a higher function value f(t) (Figure B5.4).
The dashed lines in Figure B5.4 are based on experiments with a falling circular
cylinder (Watanebe, 1934) and experiments with waves hitting a fixed circular cylinder (Campbell and Weynberg, 1979). The last experiments were conducted at Wolfson Marine Craft Unit (WMCU) of Southampton University. Miller recommends the WMCU curve with c0 = 5,15. Considering the results of the experiments, this seems a good starting point.

Delft Hydraulics
41
Figure B5.4: Slamming coefficient cs for a circular cylinder (Miller, 1980).
When a falling cylinder hits a water surface, which itself is moving in vertical direction, the relative velocity vrel needs to be used in the calculation. In practice, this situation occurs with moving vessels in sea state conditions and with other floating objects in waves.
For the magnitude of the impact pressure it is significant whether the water surface hits
the structure at an angle or not. The coefficient k in Equation B5.5 is smaller, the greater the angle between the water surface and the structure. The flow pressure model is well suited for an initial assessment of the impact pressure.
• Air compression model The air compression model applies to a wave impact of the compression shock type, and may therefore be used when air is enclosed between the water and the structure. In the air compression model, the enclosed air is the most important element. Several models have been developed. A well-known model is the linear piston model of Bagnold (1939). The water here is assumed to be incompressible and the structure inelastic. The air bubble between the water and the structure is the elastic element and transfers the impact pressure to the structure. The amount of water involved in the impact may be determined by assessing the added water mass. The model may be compared with a single mass spring system; the solution of the pressure comparison runs analogous. Ramkema (1978) has refined the model of Bagnold, by also including the compressibility of water. As the model requires more explanation than the two models mentioned above, it is not further dealt with here. In Chapter 4 of Part C the model is discussed further.
Delft Hydraulics
42
• Impact pressure on a vertical wall
One of the first formulas for wave impact loads for breaking waves on a vertical wall was put forward by Minikin (1950). His equation is based on experiences with existing breakwaters and experiments of Bagnold (1939), and has become widely known. The equation is also given in the Shore Protection Manual (CERC, 1984), with the warning however, that the equation leads to very high impact loads. The impact duration has not been included in the equation, so that the total wave impact impulse cannot be determined and the effect of the wave impact in terms of a stability assessment (shearing force or overturning moment) cannot be estimated very well. Of a more recent date are the equations of Goda (1985 and 1992). These equations apply to vertical breakwaters and may be used for both breaking and for non-breaking (standing) waves. Oumeraci, Klammer and Partenscky (1993) have made a classification of breaking waves and the related wave impacts on a breakwater with a vertical wall, based on measurements in a large wave flume. Their research shows that the place where the wave breaks is of great significance; this is both determined by the foreland geometry and the design of the base of the breakwater, as well as by the shape of the individual wave (which again is determined by the ‘previous history’ in the area near the wall). The research found wave impacts with characteristics of the ventilated shock type and the compression shock type. The research confirms that geometric factors determine whether wave impacts will occur or not.
Delft Hydraulics
43
6 RESPONSE OF STRUCTURES TO WAVE IMPACTS
6.1 Important properties of the structure
For wave impacts, it is essential that the movement of an amount of water is abruptly stopped when hitting the surface of a structure. For this, the structure needs to supply the force, which – according to the second law of Newton – equals the first coefficient of time of the impulse mv of the impact:
d( )dmvFt
= (B6.1)
In this equation, v is the velocity component perpendicular to the surface and m is the
water mass that is decelerated. The force F equals the load that operates locally and perpendicularly on the structure. The structure can only absorb the load when it is undergoing a distortion. This distortion may or may not be elastic. In case of very rigid structures such as concrete walls, the distortion naturally is very small.
The response of the structure consists of the entirety of distortions that occur over
time, including the accompanying transfer of the load to the points of support. The response not only depends on the magnitude and the duration of the wave impact load, but also on the dynamic properties of the structure. In case of impulse loads such as a wave impact, one or more natural movements of the elastic structure are hit; the structure shows decaying vibration. Important for the response is how the impact duration τ relates to the natural oscillation period(s) Tn of the structure. It is also important how great the damping is. When the time-dependent load and the dynamic properties of the structure are known, the response in the time domain may be calculated. This is further discussed in Chapter 3 of Part C.
In the next paragraph the influence of impact duration, impact form and natural
oscillation period on the response are further discussed, on the basis of a single mass spring system. In reality, the situation is more complex, because a structure usually has several degrees of freedom. Essentially however, there is little change: several natural oscillations may be hit simultaneously, so that the response will then consist of a superposition of several natural movements. When this occurs, energy may be transferred between the different natural movements.
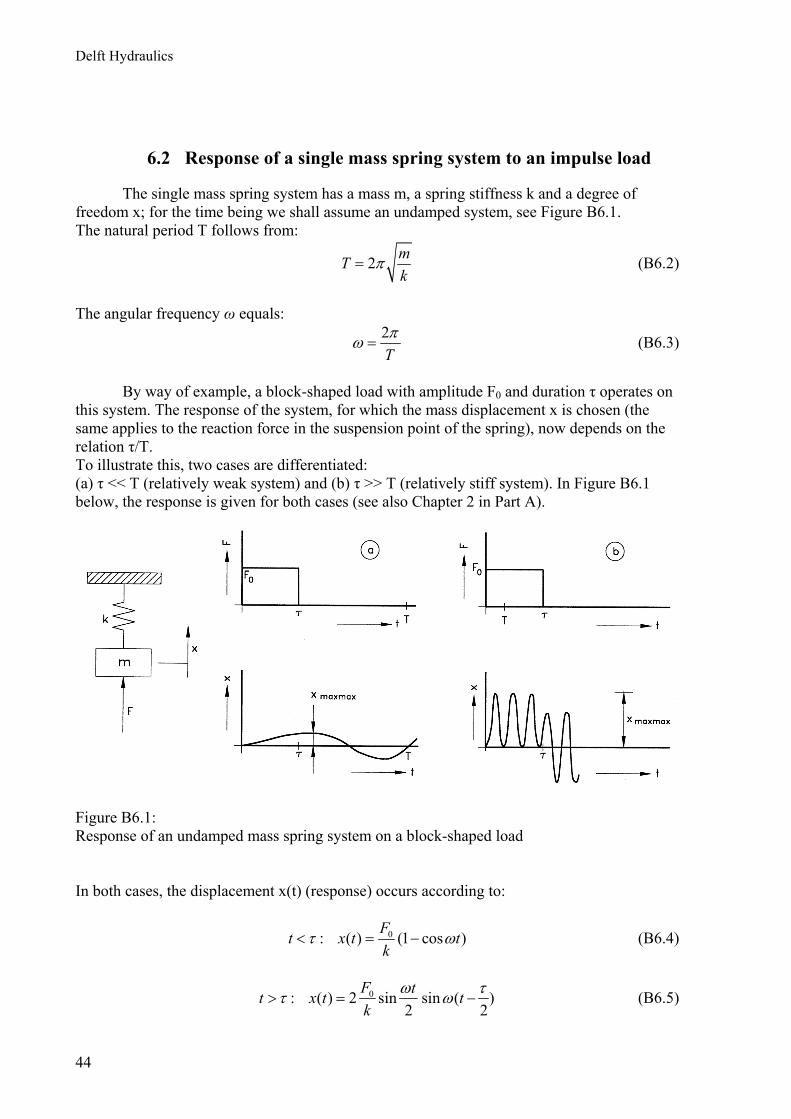
Delft Hydraulics
44
6.2 Response of a single mass spring system to an impulse load
The single mass spring system has a mass m, a spring stiffness k and a degree of freedom x; for the time being we shall assume an undamped system, see Figure B6.1. The natural period T follows from:
2 mTk
π= (B6.2)
The angular frequency ω equals:
2Tπω = (B6.3)
By way of example, a block-shaped load with amplitude F0 and duration τ operates on
this system. The response of the system, for which the mass displacement x is chosen (the same applies to the reaction force in the suspension point of the spring), now depends on the relation τ/T. To illustrate this, two cases are differentiated: (a) τ << T (relatively weak system) and (b) τ >> T (relatively stiff system). In Figure B6.1 below, the response is given for both cases (see also Chapter 2 in Part A).
Figure B6.1: Response of an undamped mass spring system on a block-shaped load In both cases, the displacement x(t) (response) occurs according to:
0: ( ) (1 cos )Ft x t tk
τ ω< = − (B6.4)
0: ( ) 2 sin sin ( )2 2
F tt x t tk
ω ττ ω> = − (B6.5)
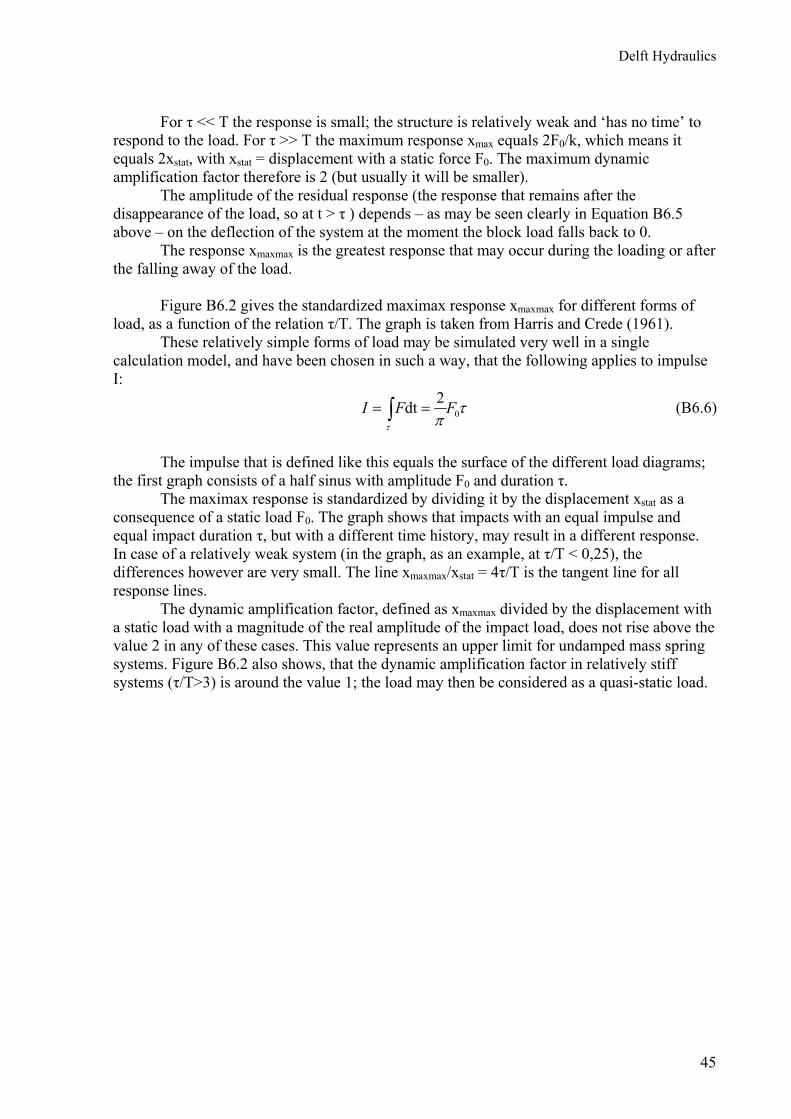
Delft Hydraulics
45
For τ << T the response is small; the structure is relatively weak and ‘has no time’ to respond to the load. For τ >> T the maximum response xmax equals 2F0/k, which means it equals 2xstat, with xstat = displacement with a static force F0. The maximum dynamic amplification factor therefore is 2 (but usually it will be smaller).
The amplitude of the residual response (the response that remains after the disappearance of the load, so at t > τ ) depends – as may be seen clearly in Equation B6.5 above – on the deflection of the system at the moment the block load falls back to 0.
The response xmaxmax is the greatest response that may occur during the loading or after the falling away of the load.
Figure B6.2 gives the standardized maximax response xmaxmax for different forms of
load, as a function of the relation τ/T. The graph is taken from Harris and Crede (1961). These relatively simple forms of load may be simulated very well in a single
calculation model, and have been chosen in such a way, that the following applies to impulse I:
02dtI F F
τ
τπ
= =∫ (B6.6)
The impulse that is defined like this equals the surface of the different load diagrams;
the first graph consists of a half sinus with amplitude F0 and duration τ. The maximax response is standardized by dividing it by the displacement xstat as a
consequence of a static load F0. The graph shows that impacts with an equal impulse and equal impact duration τ, but with a different time history, may result in a different response. In case of a relatively weak system (in the graph, as an example, at τ/T < 0,25), the differences however are very small. The line xmaxmax/xstat = 4τ/T is the tangent line for all response lines.
The dynamic amplification factor, defined as xmaxmax divided by the displacement with a static load with a magnitude of the real amplitude of the impact load, does not rise above the value 2 in any of these cases. This value represents an upper limit for undamped mass spring systems. Figure B6.2 also shows, that the dynamic amplification factor in relatively stiff systems (τ/T>3) is around the value 1; the load may then be considered as a quasi-static load.
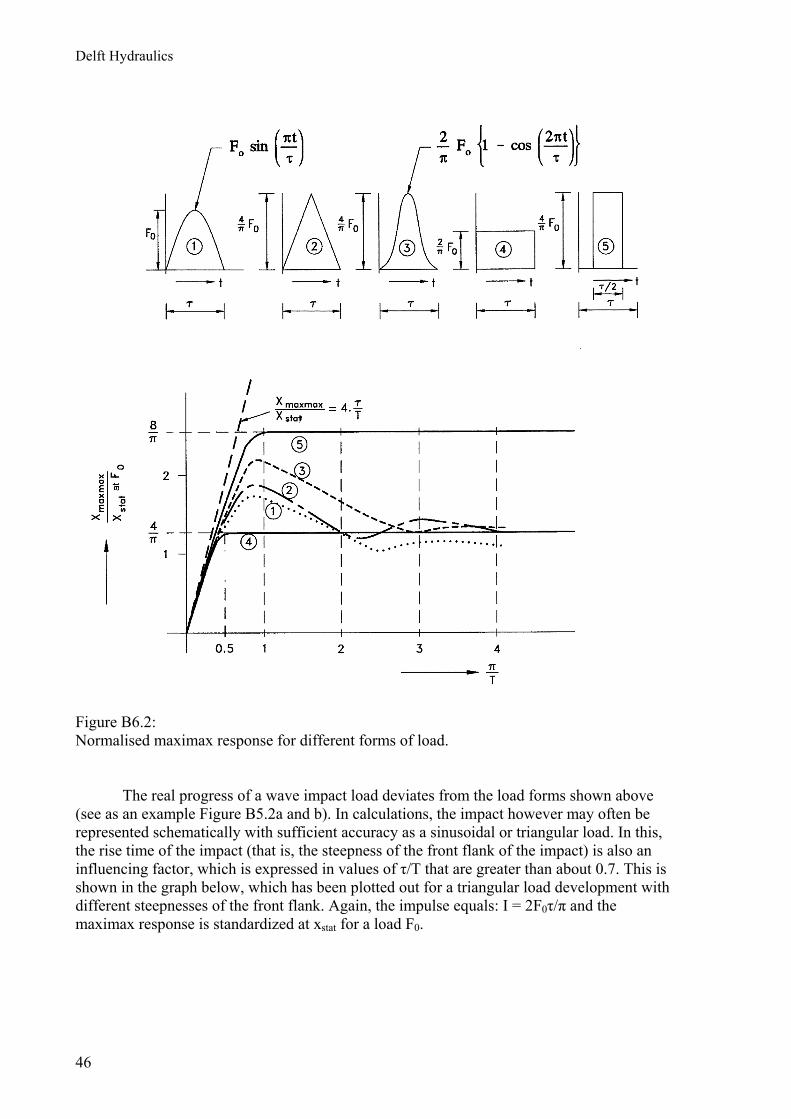
Delft Hydraulics
46
Figure B6.2: Normalised maximax response for different forms of load.
The real progress of a wave impact load deviates from the load forms shown above (see as an example Figure B5.2a and b). In calculations, the impact however may often be represented schematically with sufficient accuracy as a sinusoidal or triangular load. In this, the rise time of the impact (that is, the steepness of the front flank of the impact) is also an influencing factor, which is expressed in values of τ/T that are greater than about 0.7. This is shown in the graph below, which has been plotted out for a triangular load development with different steepnesses of the front flank. Again, the impulse equals: I = 2F0τ/π and the maximax response is standardized at xstat for a load F0.
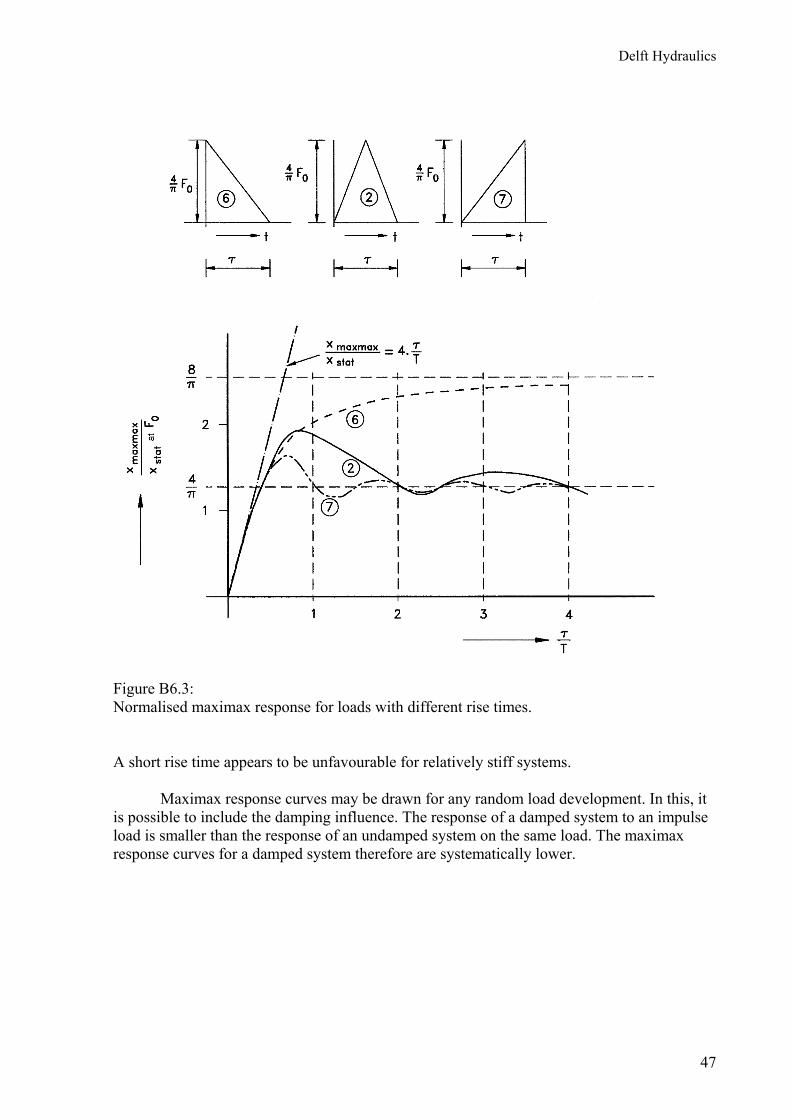
Delft Hydraulics
47
Figure B6.3: Normalised maximax response for loads with different rise times. A short rise time appears to be unfavourable for relatively stiff systems. Maximax response curves may be drawn for any random load development. In this, it is possible to include the damping influence. The response of a damped system to an impulse load is smaller than the response of an undamped system on the same load. The maximax response curves for a damped system therefore are systematically lower.

Delft Hydraulics
48
6.3 Influence of the response on the impact load
The question now occurring is, whether wave impact pressures may be influenced by the response of the structure.
When air is enclosed between the structure and the water surface, the air functions like an elastic medium, and there is a clear influence on the impact pressure distribution (see also Chapter 5). It may then be assumed, that a recessive structure would show a similar effect; for this, the structure needs to be relatively weak.
In Chapter 5 it was already indicated that, according to Von Kármán, a reduced maximum
impact pressure may be obtained, when the elastic properties of the structure material (by way of the speed of sound) are included. This applies to massive structures that do not bend. The equation of Von Kármán however indicates a theoretical upper limit. In practice, impact pressures never reach this upper limit (unless perhaps on a micro scale), because the water may run off sideways. The reducing effect of the elastic properties of the structure material on the Von Kármán pressure therefore is subordinate to the reducing effect of sideways runoff.
Sources concerned with the influence of an elastic bending on the impact pressure are
very rare. Witte (1988) and Dette, Schulz and Witte (1991) have carried out investigations, using a vertical elastic plate, fastened to the bottom. Their investigations show that heavy impacts with a small probability of occurring are not influenced very much by the bending stiffness of the wall; smaller impacts with a greater probability of occurring however are reduced (the maximum in impact pressure is up to 25% lower). The cause of this difference possibly relates to the fact, that the heavy impacts lasted relatively short (short rise time); the response of the plate to this load therefore was limited, so that also the influence of the elastic bending could not be great. The investigation does indicate, that an influence of the response of the structure may be expected, when τ/T is sufficiently high (τ/T > 0.5), when the impact duration therefore is sufficiently long or when the natural oscillation period is sufficiently small. With increasing stiffness of the structure (as an example τ/T > 1.5) the bending becomes less and less, so that also the effect of deflection of the structure in relation to the effect of sideways runoff of the water will be very small. Very stiff structures do not distort, so that in those cases no effect on the impact load is to be expected.
The response of the structure therefore may in some cases influence the magnitude of the
impact pressure (feedback). In case the structure shows decaying vibration after a wave impact, also interaction forces are generated in the form of added-mass and damping forces. For brevity’s sake, we refer to Chapter 2 in Part A, in which these issues have already been discussed. In general, the situation of wave conditions is more complicated than that of flowing water situations, because the position of the free water surface varies as a function of time. During the investigation of the discharge sluices Haringvliet it was found, that the added water mass is a function of the instantaneous water surface.

Delft Hydraulics
49
7 EXPERIENCES WITH WAVE IMPACTS IN PROTOTYPES AND SCALE MODELS
This Chapter presents the experiences with wave impacts at Delft Hydraulics (Hydraulic Research Laboratory), gathered during a number of scale model investigations or during prototype measurements.
The selected structures are:
• Storm surge barrier Eastern Scheldt. Grid gate design (scale model investigation). • Storm surge barrier Eastern Scheldt. Caisson design (scale model investigation). • Storm surge barrier Eastern Scheldt. Design with piers and lifting gates (scale model
investigations and prototype measurements). • Discharge sluice Haringvliet (scale model investigations and prototype
measurements). • Cooling-water intake of Alto Lazio nuclear power station (scale model investigation). • Civitavecchia caisson breakwater (scale model investigation). • Asphalt slope (scale model investigation).
7.1 Storm surge barrier Eastern Scheldt. Grid gate design (scale model investigation)
Description: One of the designs for the closure of the Eastern Scheldt with a movable barrier, was a design with so-called grid gates. In this design, the gates consist of two grids that move alongside each other; when open, the horizontal beams of both grids are ‘back to back’ and the discharge opening is formed by the openings between the grid beams. When closed, the grids are moved in such a way, that these openings are closed. Variations of this design, with steel grid beams and concrete grid beams have been investigated. The effects of wave impacts on concrete grid beams have been investigated in a stiff scale model. Wave impact zone: The grid beams are of considerable size in horizontal direction, necessary for the retaining function of the barrier. Vertical water movements may generate impact phenomena, especially on the underside of the grid beams. Conditions: Investigations have been conducted on closed gates, during varying water levels and with perpendicular incoming, irregular waves. The foreland geometry is varied. Measurements have been taken of wave impact pressures. Observations: Wave impacts occur most frequently and have the greatest magnitude when the average water level is just below the underside of a grid beam. Air inclusions occurred during the wave impacts.
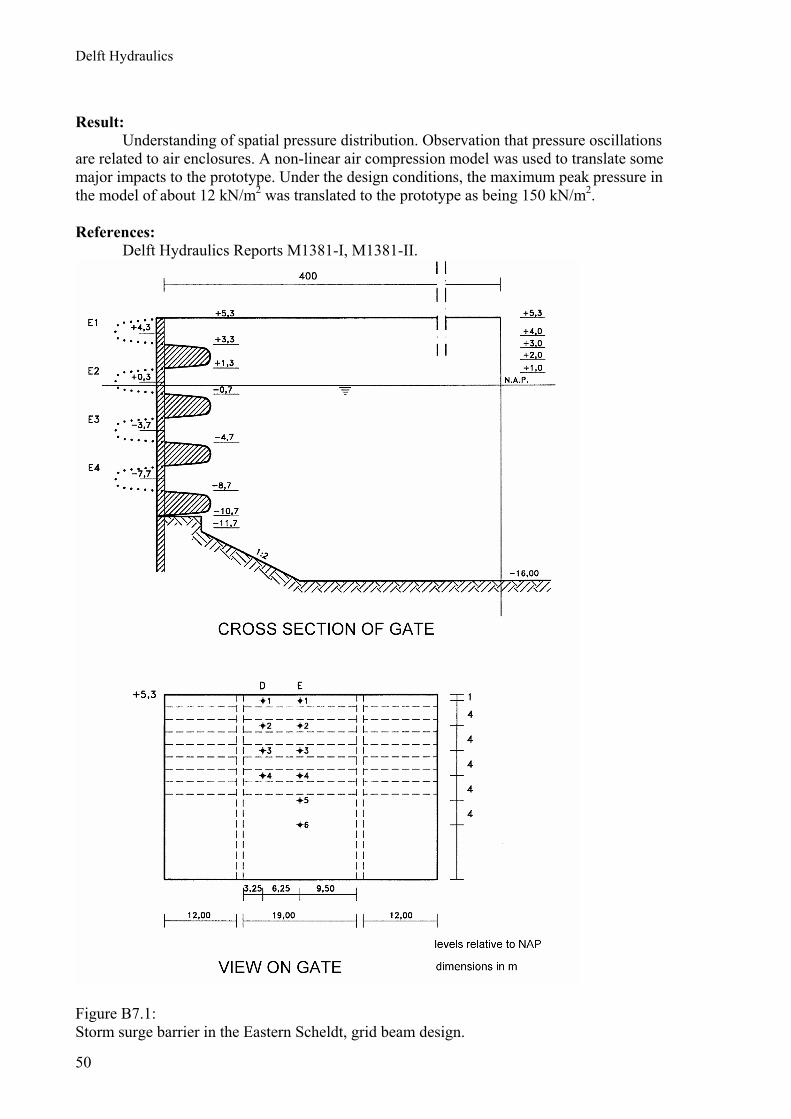
Delft Hydraulics
50
Result: Understanding of spatial pressure distribution. Observation that pressure oscillations are related to air enclosures. A non-linear air compression model was used to translate some major impacts to the prototype. Under the design conditions, the maximum peak pressure in the model of about 12 kN/m2 was translated to the prototype as being 150 kN/m2. References: Delft Hydraulics Reports M1381-I, M1381-II.
Figure B7.1: Storm surge barrier in the Eastern Scheldt, grid beam design.
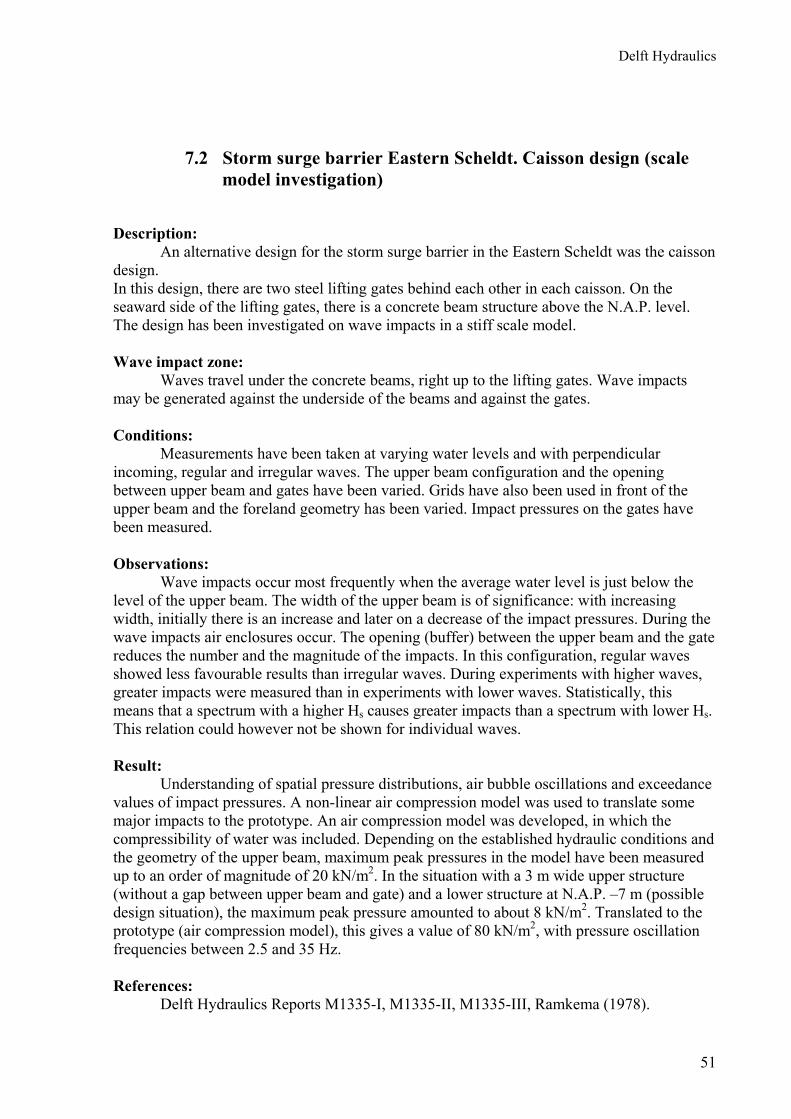
Delft Hydraulics
51
7.2 Storm surge barrier Eastern Scheldt. Caisson design (scale model investigation)
Description: An alternative design for the storm surge barrier in the Eastern Scheldt was the caisson design. In this design, there are two steel lifting gates behind each other in each caisson. On the seaward side of the lifting gates, there is a concrete beam structure above the N.A.P. level. The design has been investigated on wave impacts in a stiff scale model. Wave impact zone: Waves travel under the concrete beams, right up to the lifting gates. Wave impacts may be generated against the underside of the beams and against the gates. Conditions: Measurements have been taken at varying water levels and with perpendicular incoming, regular and irregular waves. The upper beam configuration and the opening between upper beam and gates have been varied. Grids have also been used in front of the upper beam and the foreland geometry has been varied. Impact pressures on the gates have been measured. Observations: Wave impacts occur most frequently when the average water level is just below the level of the upper beam. The width of the upper beam is of significance: with increasing width, initially there is an increase and later on a decrease of the impact pressures. During the wave impacts air enclosures occur. The opening (buffer) between the upper beam and the gate reduces the number and the magnitude of the impacts. In this configuration, regular waves showed less favourable results than irregular waves. During experiments with higher waves, greater impacts were measured than in experiments with lower waves. Statistically, this means that a spectrum with a higher Hs causes greater impacts than a spectrum with lower Hs. This relation could however not be shown for individual waves. Result: Understanding of spatial pressure distributions, air bubble oscillations and exceedance values of impact pressures. A non-linear air compression model was used to translate some major impacts to the prototype. An air compression model was developed, in which the compressibility of water was included. Depending on the established hydraulic conditions and the geometry of the upper beam, maximum peak pressures in the model have been measured up to an order of magnitude of 20 kN/m2. In the situation with a 3 m wide upper structure (without a gap between upper beam and gate) and a lower structure at N.A.P. –7 m (possible design situation), the maximum peak pressure amounted to about 8 kN/m2. Translated to the prototype (air compression model), this gives a value of 80 kN/m2, with pressure oscillation frequencies between 2.5 and 35 Hz. References: Delft Hydraulics Reports M1335-I, M1335-II, M1335-III, Ramkema (1978).
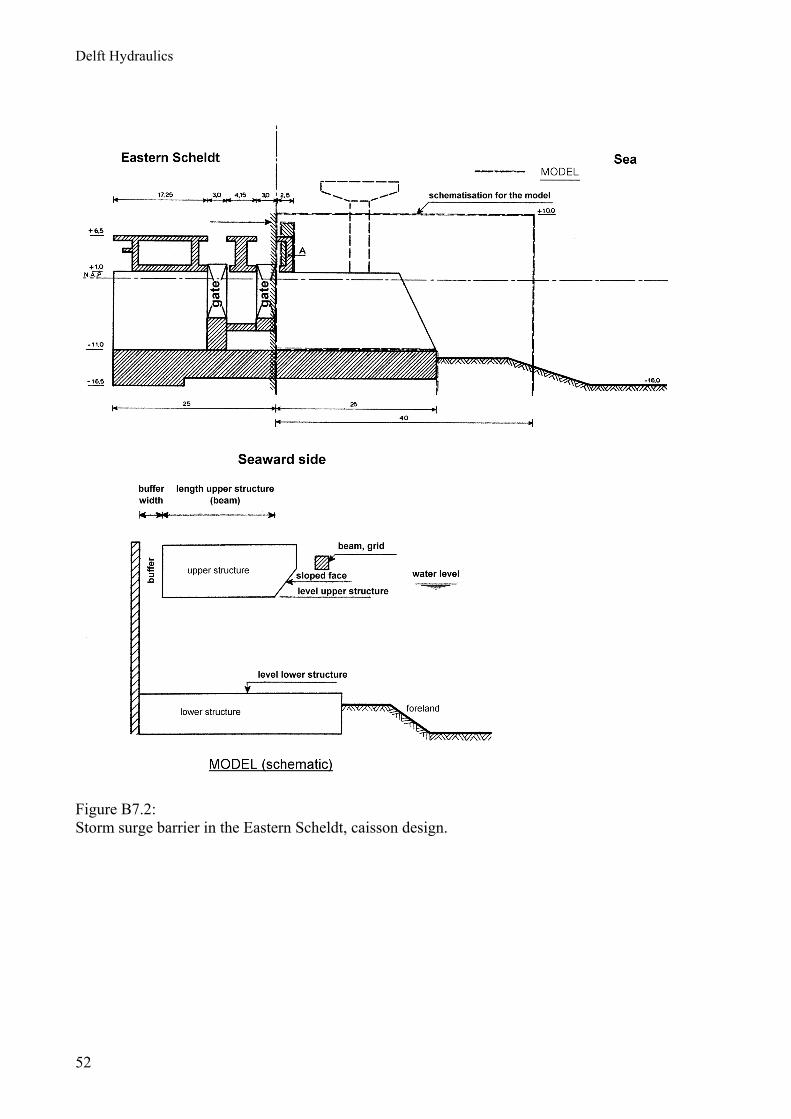
Delft Hydraulics
52
Figure B7.2: Storm surge barrier in the Eastern Scheldt, caisson design.

Delft Hydraulics
53
7.3 Storm surge barrier Eastern Scheldt. Design with piers and lifting gates (scale model investigations and prototype measurements)
Description: The definitive design of the storm surge barrier Eastern Scheldt has evoluted from a piers-on-pits structure with double lifting gates, to a structure of sunken piers on consolidated soil, a single row of lifting gates on the seaward side, concrete upper beams (1 m above N.A.P.) and sill beams. The gates initially had double plating; this was later changed to a structure with single plating. The plate girders in this case were situated on the seaward side. Due to the wave impacts, the plate girders have been replaced by frame girders made of round tubes. For all variations wave impact measurements were carried out in scale models (both stiff models, as well as elastic models, were used). After the completion of the storm surge barrier, a condition security system (CONDITS) was set up, which also includes carrying out wave impact measurements of two gates and an upper beam. Wave impact zone: Components that are sensitive to wave impacts are the upper beams, both in situations in which the gates were in lifted position and in lowered position; this also includes the lifting gates themselves, in particular the horizontal components, such as the principal beams of the gates and the partitions in the end structure. Conditions: During the scale model investigation, both regular and irregular waves were set up under all relevant operational conditions, whether or not combined with flow. Measurements have been taken of wave impact pressures, total wave impact loads and responses of gates and upper beams during wave impacts. Also high-speed film shots have been taken, especially focusing on air enclosures. Calculation models have been used to couple wave impact responses measured in elastic models with wave impact loads measured in stiff models; thus an estimate was made of the magnitude of the impact impulse. Measurements have also been taken of the prototype (CONDITS), both preceding and during high-water closures (over the years 1989 – 1992). Pressures and accelerations, forces in the frame girders of the principal beams of a gate and forces in a supporting block of an upper beam, as well as local water movements, have been measured. Observations: The most unfavourable situation for the gates is the situation when the upper gate girder is located at sea level. A second plating protects the underside of the beams, but cannot prevent the fact, that impacts occur at the top of the gates and at the upper beam. Statistically, there is an increase of the wave impact pressure, relative to the wave height and the wave steepness. Air inclusions have been observed; for the translation of impact pressures however, the less favourable ventilated wave impact model was taken as a starting point for the peak values. Wave impacts do not occur simultaneously across the whole length of the gate, nor with perpendicular incoming waves. The phase differences then appear to be small. Perforations in the web plates of the plate girders cause a limited reduction of the wave impact pressures. The peak pressures in the model reached values of up to 100 kN/m2 (design conditions), but locally peak pressures were found up to a magnitude of 250 kN/m2 (values scaled with ventilated wave impact model). The total impact impulse, determined by coupling of the pressure measurements with response measurements, appeared to give such high
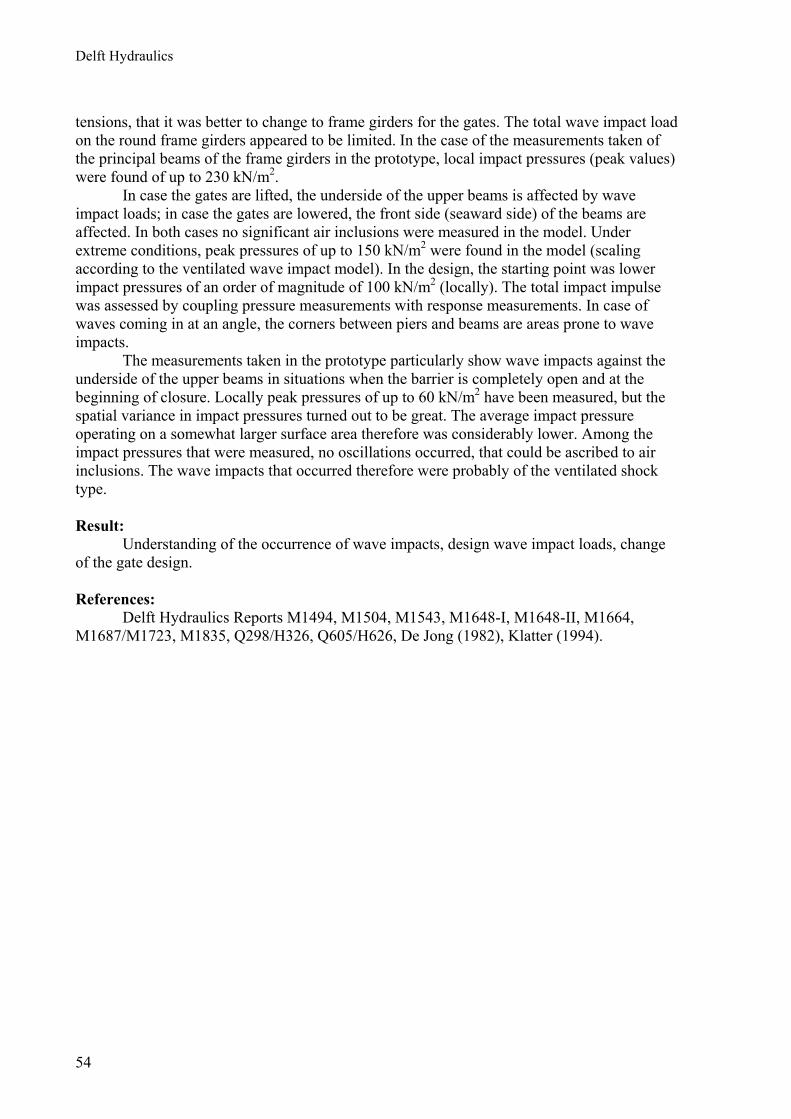
Delft Hydraulics
54
tensions, that it was better to change to frame girders for the gates. The total wave impact load on the round frame girders appeared to be limited. In the case of the measurements taken of the principal beams of the frame girders in the prototype, local impact pressures (peak values) were found of up to 230 kN/m2. In case the gates are lifted, the underside of the upper beams is affected by wave impact loads; in case the gates are lowered, the front side (seaward side) of the beams are affected. In both cases no significant air inclusions were measured in the model. Under extreme conditions, peak pressures of up to 150 kN/m2 were found in the model (scaling according to the ventilated wave impact model). In the design, the starting point was lower impact pressures of an order of magnitude of 100 kN/m2 (locally). The total impact impulse was assessed by coupling pressure measurements with response measurements. In case of waves coming in at an angle, the corners between piers and beams are areas prone to wave impacts. The measurements taken in the prototype particularly show wave impacts against the underside of the upper beams in situations when the barrier is completely open and at the beginning of closure. Locally peak pressures of up to 60 kN/m2 have been measured, but the spatial variance in impact pressures turned out to be great. The average impact pressure operating on a somewhat larger surface area therefore was considerably lower. Among the impact pressures that were measured, no oscillations occurred, that could be ascribed to air inclusions. The wave impacts that occurred therefore were probably of the ventilated shock type. Result: Understanding of the occurrence of wave impacts, design wave impact loads, change of the gate design. References: Delft Hydraulics Reports M1494, M1504, M1543, M1648-I, M1648-II, M1664, M1687/M1723, M1835, Q298/H326, Q605/H626, De Jong (1982), Klatter (1994).
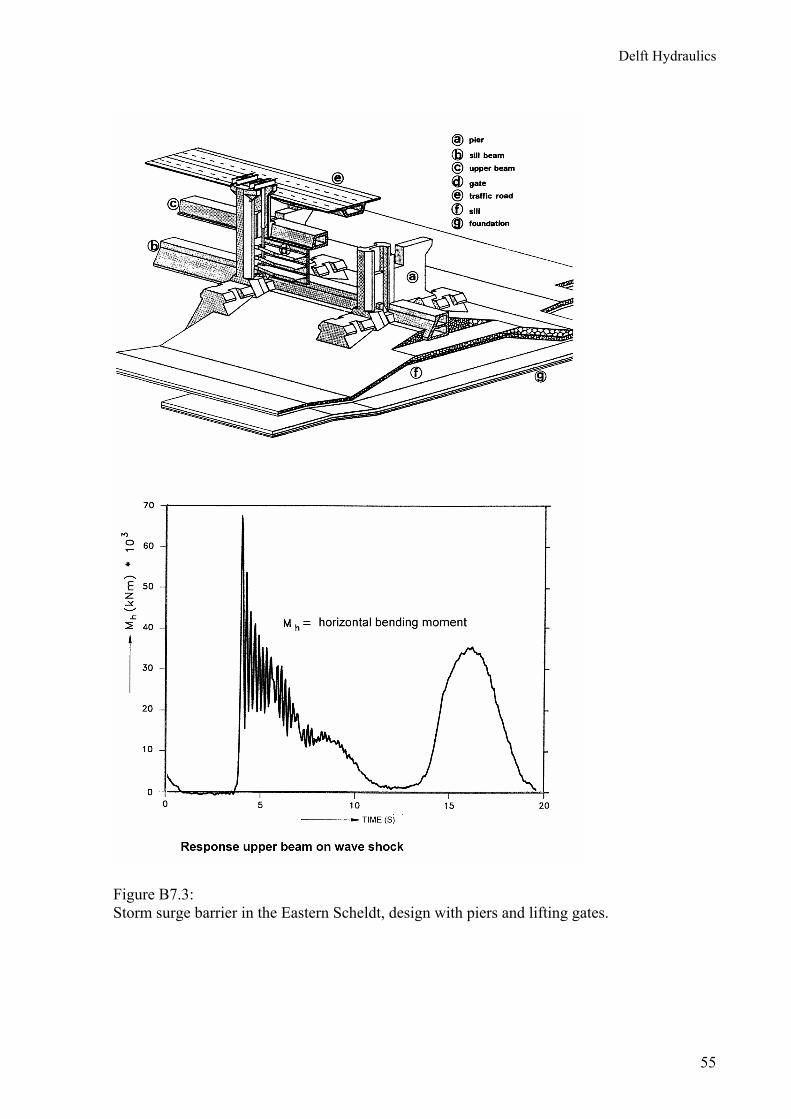
Delft Hydraulics
55
Figure B7.3: Storm surge barrier in the Eastern Scheldt, design with piers and lifting gates.
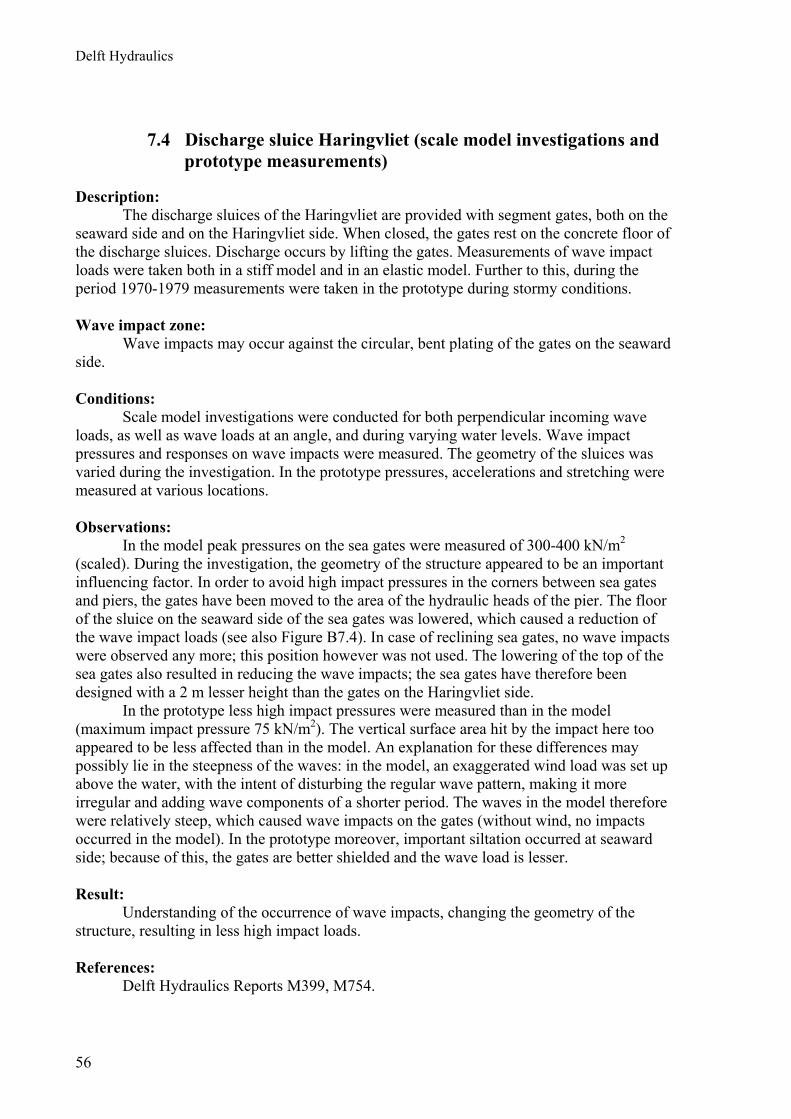
Delft Hydraulics
56
7.4 Discharge sluice Haringvliet (scale model investigations and prototype measurements)
Description: The discharge sluices of the Haringvliet are provided with segment gates, both on the seaward side and on the Haringvliet side. When closed, the gates rest on the concrete floor of the discharge sluices. Discharge occurs by lifting the gates. Measurements of wave impact loads were taken both in a stiff model and in an elastic model. Further to this, during the period 1970-1979 measurements were taken in the prototype during stormy conditions. Wave impact zone: Wave impacts may occur against the circular, bent plating of the gates on the seaward side. Conditions: Scale model investigations were conducted for both perpendicular incoming wave loads, as well as wave loads at an angle, and during varying water levels. Wave impact pressures and responses on wave impacts were measured. The geometry of the sluices was varied during the investigation. In the prototype pressures, accelerations and stretching were measured at various locations. Observations: In the model peak pressures on the sea gates were measured of 300-400 kN/m2 (scaled). During the investigation, the geometry of the structure appeared to be an important influencing factor. In order to avoid high impact pressures in the corners between sea gates and piers, the gates have been moved to the area of the hydraulic heads of the pier. The floor of the sluice on the seaward side of the sea gates was lowered, which caused a reduction of the wave impact loads (see also Figure B7.4). In case of reclining sea gates, no wave impacts were observed any more; this position however was not used. The lowering of the top of the sea gates also resulted in reducing the wave impacts; the sea gates have therefore been designed with a 2 m lesser height than the gates on the Haringvliet side. In the prototype less high impact pressures were measured than in the model (maximum impact pressure 75 kN/m2). The vertical surface area hit by the impact here too appeared to be less affected than in the model. An explanation for these differences may possibly lie in the steepness of the waves: in the model, an exaggerated wind load was set up above the water, with the intent of disturbing the regular wave pattern, making it more irregular and adding wave components of a shorter period. The waves in the model therefore were relatively steep, which caused wave impacts on the gates (without wind, no impacts occurred in the model). In the prototype moreover, important siltation occurred at seaward side; because of this, the gates are better shielded and the wave load is lesser. Result: Understanding of the occurrence of wave impacts, changing the geometry of the structure, resulting in less high impact loads. References: Delft Hydraulics Reports M399, M754.
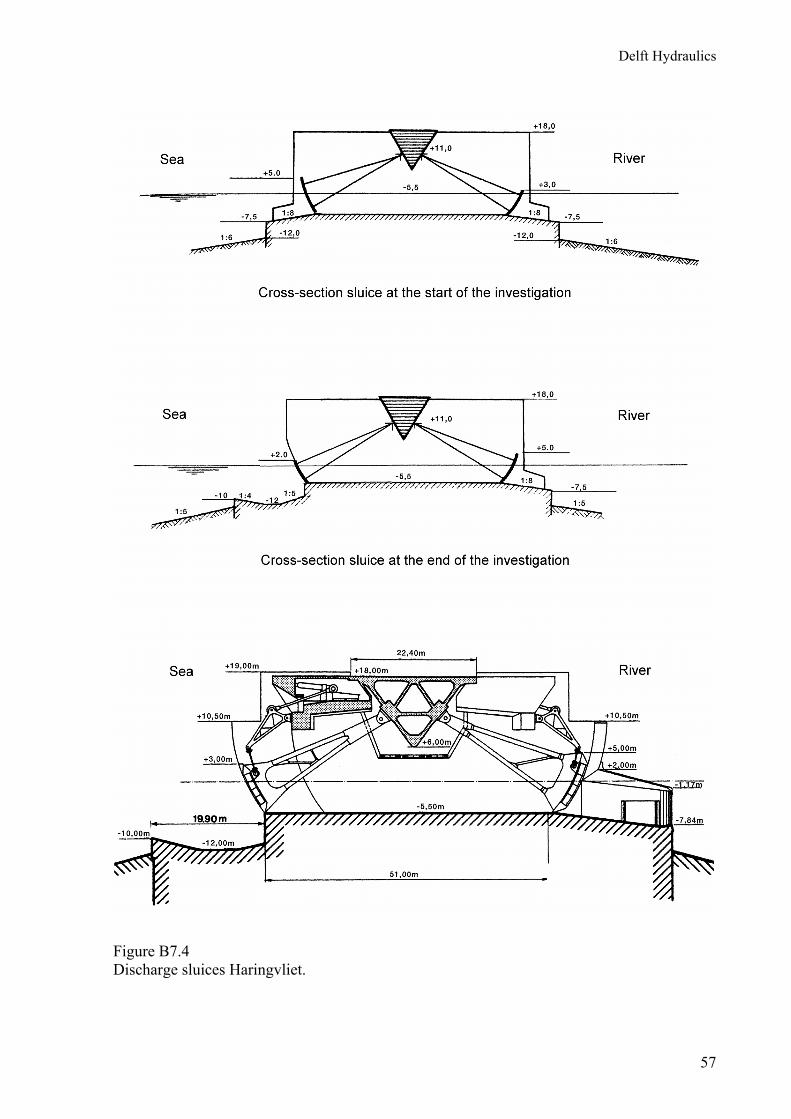
Delft Hydraulics
57
Figure B7.4 Discharge sluices Haringvliet.

Delft Hydraulics
58
7.5 Cooling-water intake of Alto Lazio nuclear power station (scale model investigation)
Description: The cooling-water intake of Alto Lazio nuclear power station (Italy) consists of a substructure below the water line with intake openings, on top of which there is an inspection tower and space for the lifting gates of the intake openings (Figure B7.5). The local water depth is 12.5 m. The structure experiences wave loads. Wave (impact) loads have been investigated in a stiff scale model that was mounted on a frame for force measurements. To bring about a reduction of the heavy wave impacts measured, the single tower was replaced by three towers of smaller dimensions. Wave impact zone: Waves experience extra resistance because of the substructure projecting from the bottom, and in front of the towers breaking waves are generated, which affect the towers. Conditions: In the scale model, the structure has been investigated with two different wave directions; wave height and wave period were varied (Hs between 3 and 7.5 m, Tp between 8 and 12 s). Observations: For the single, rectangular tower high impact loads were measured, which were a factor 2 to 3 greater than the quasi-static loads. The magnitude of the impact load could be considerably reduced by reducing the simultaneously hit surface area, that is, by replacing the single tower by three smaller towers, positioned at such distances from each other, that only one tower could be affected at the time. Result: Reduction of the impact load. References: Delft Hydraulics Report M1765.

Delft Hydraulics
59
Figure B7.5 Cooling-water intake of Alto Lazio nuclear power station.
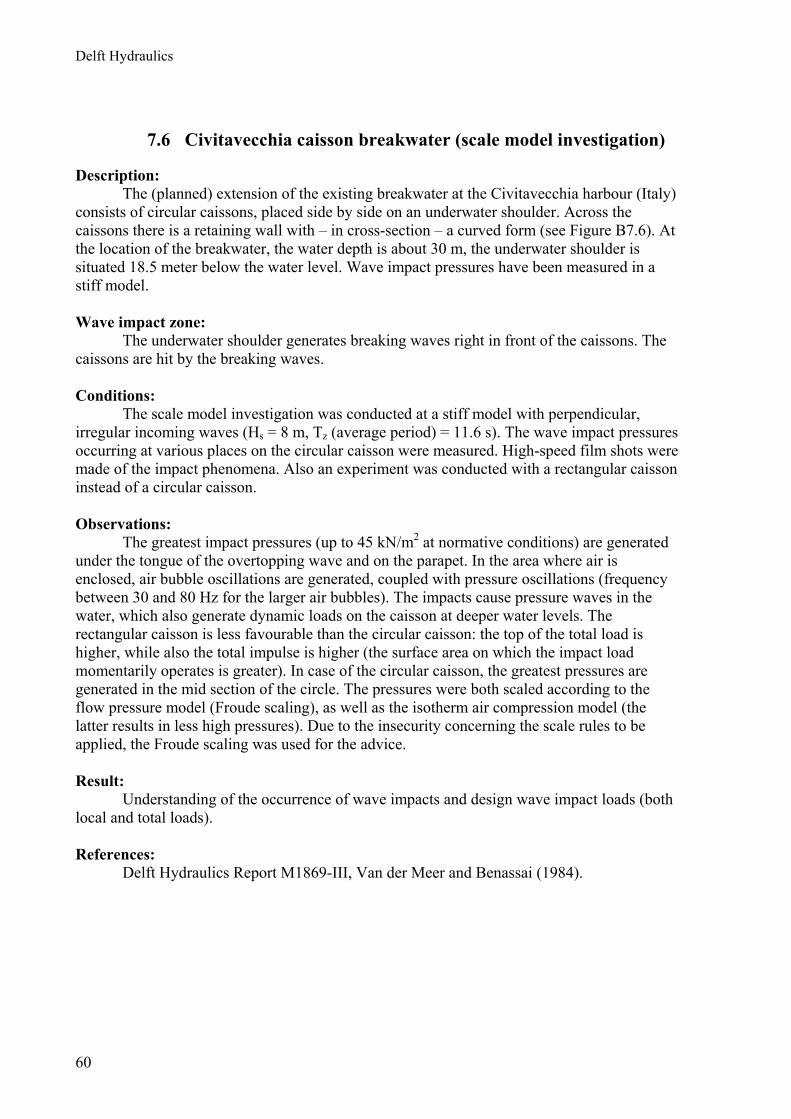
Delft Hydraulics
60
7.6 Civitavecchia caisson breakwater (scale model investigation)
Description: The (planned) extension of the existing breakwater at the Civitavecchia harbour (Italy) consists of circular caissons, placed side by side on an underwater shoulder. Across the caissons there is a retaining wall with – in cross-section – a curved form (see Figure B7.6). At the location of the breakwater, the water depth is about 30 m, the underwater shoulder is situated 18.5 meter below the water level. Wave impact pressures have been measured in a stiff model. Wave impact zone: The underwater shoulder generates breaking waves right in front of the caissons. The caissons are hit by the breaking waves. Conditions: The scale model investigation was conducted at a stiff model with perpendicular, irregular incoming waves (Hs = 8 m, Tz (average period) = 11.6 s). The wave impact pressures occurring at various places on the circular caisson were measured. High-speed film shots were made of the impact phenomena. Also an experiment was conducted with a rectangular caisson instead of a circular caisson. Observations: The greatest impact pressures (up to 45 kN/m2 at normative conditions) are generated under the tongue of the overtopping wave and on the parapet. In the area where air is enclosed, air bubble oscillations are generated, coupled with pressure oscillations (frequency between 30 and 80 Hz for the larger air bubbles). The impacts cause pressure waves in the water, which also generate dynamic loads on the caisson at deeper water levels. The rectangular caisson is less favourable than the circular caisson: the top of the total load is higher, while also the total impulse is higher (the surface area on which the impact load momentarily operates is greater). In case of the circular caisson, the greatest pressures are generated in the mid section of the circle. The pressures were both scaled according to the flow pressure model (Froude scaling), as well as the isotherm air compression model (the latter results in less high pressures). Due to the insecurity concerning the scale rules to be applied, the Froude scaling was used for the advice. Result: Understanding of the occurrence of wave impacts and design wave impact loads (both local and total loads). References: Delft Hydraulics Report M1869-III, Van der Meer and Benassai (1984).
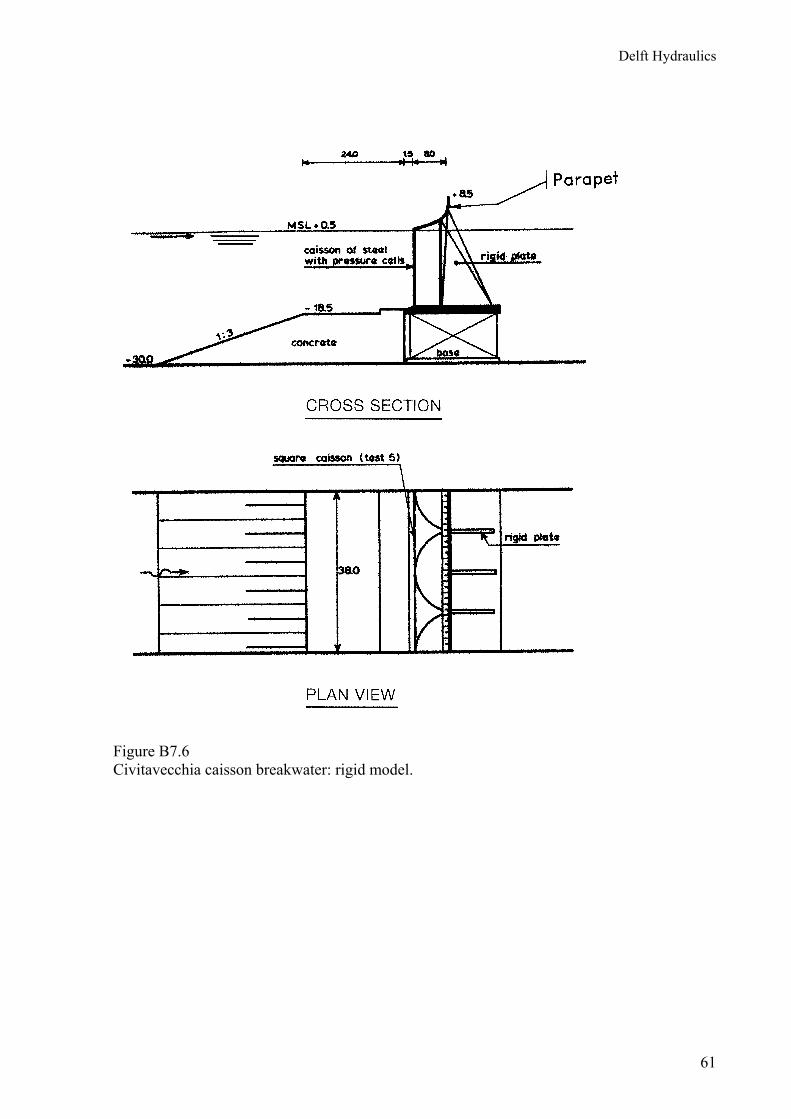
Delft Hydraulics
61
Figure B7.6 Civitavecchia caisson breakwater: rigid model.
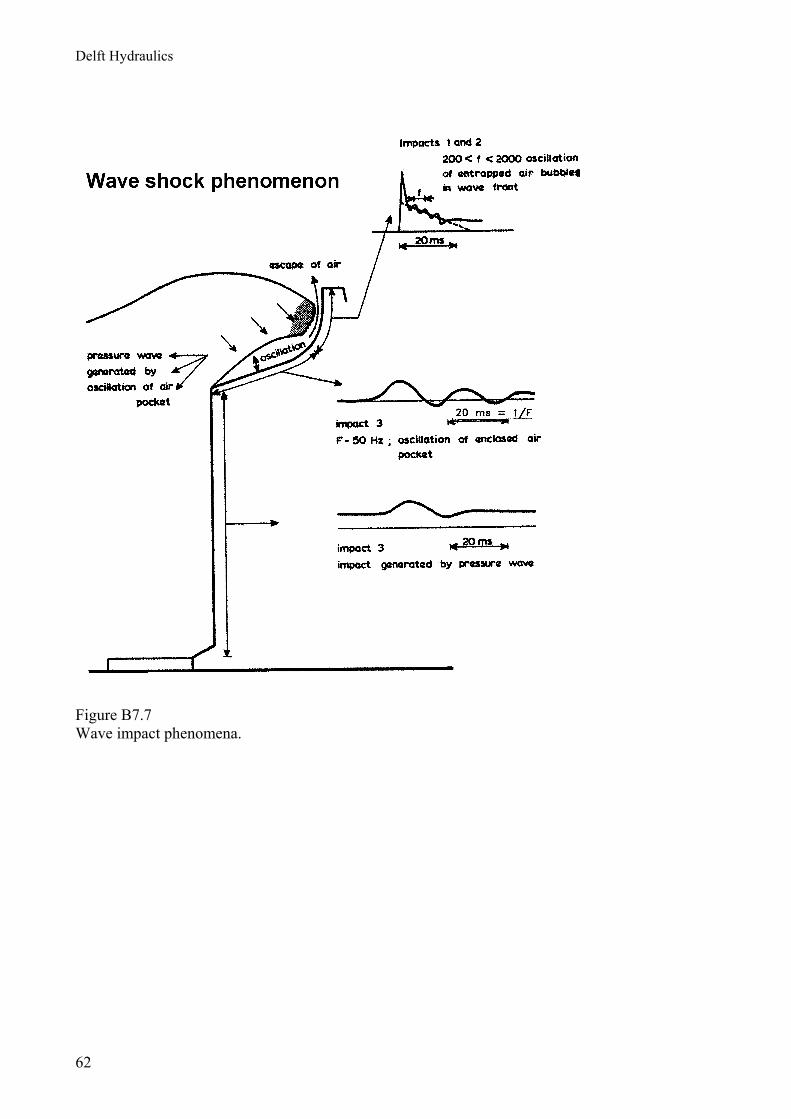
Delft Hydraulics
62
Figure B7.7 Wave impact phenomena.
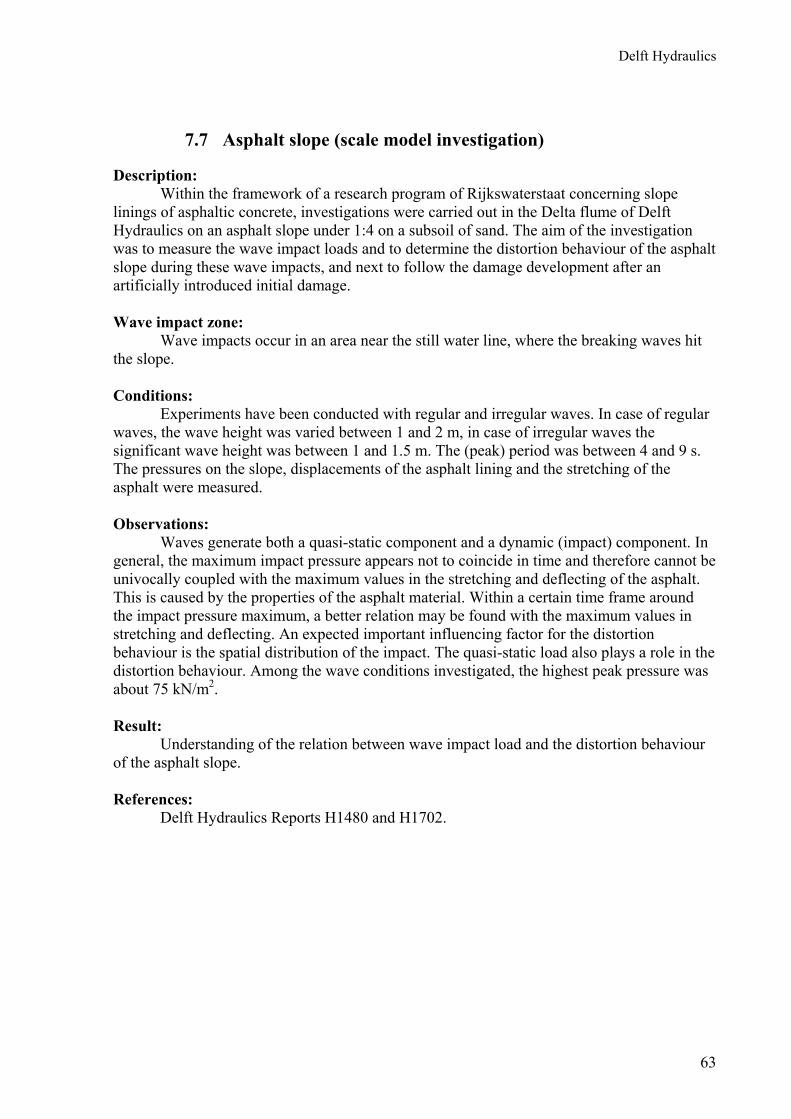
Delft Hydraulics
63
7.7 Asphalt slope (scale model investigation)
Description: Within the framework of a research program of Rijkswaterstaat concerning slope linings of asphaltic concrete, investigations were carried out in the Delta flume of Delft Hydraulics on an asphalt slope under 1:4 on a subsoil of sand. The aim of the investigation was to measure the wave impact loads and to determine the distortion behaviour of the asphalt slope during these wave impacts, and next to follow the damage development after an artificially introduced initial damage. Wave impact zone: Wave impacts occur in an area near the still water line, where the breaking waves hit the slope. Conditions: Experiments have been conducted with regular and irregular waves. In case of regular waves, the wave height was varied between 1 and 2 m, in case of irregular waves the significant wave height was between 1 and 1.5 m. The (peak) period was between 4 and 9 s. The pressures on the slope, displacements of the asphalt lining and the stretching of the asphalt were measured. Observations: Waves generate both a quasi-static component and a dynamic (impact) component. In general, the maximum impact pressure appears not to coincide in time and therefore cannot be univocally coupled with the maximum values in the stretching and deflecting of the asphalt. This is caused by the properties of the asphalt material. Within a certain time frame around the impact pressure maximum, a better relation may be found with the maximum values in stretching and deflecting. An expected important influencing factor for the distortion behaviour is the spatial distribution of the impact. The quasi-static load also plays a role in the distortion behaviour. Among the wave conditions investigated, the highest peak pressure was about 75 kN/m2. Result: Understanding of the relation between wave impact load and the distortion behaviour of the asphalt slope. References: Delft Hydraulics Reports H1480 and H1702.
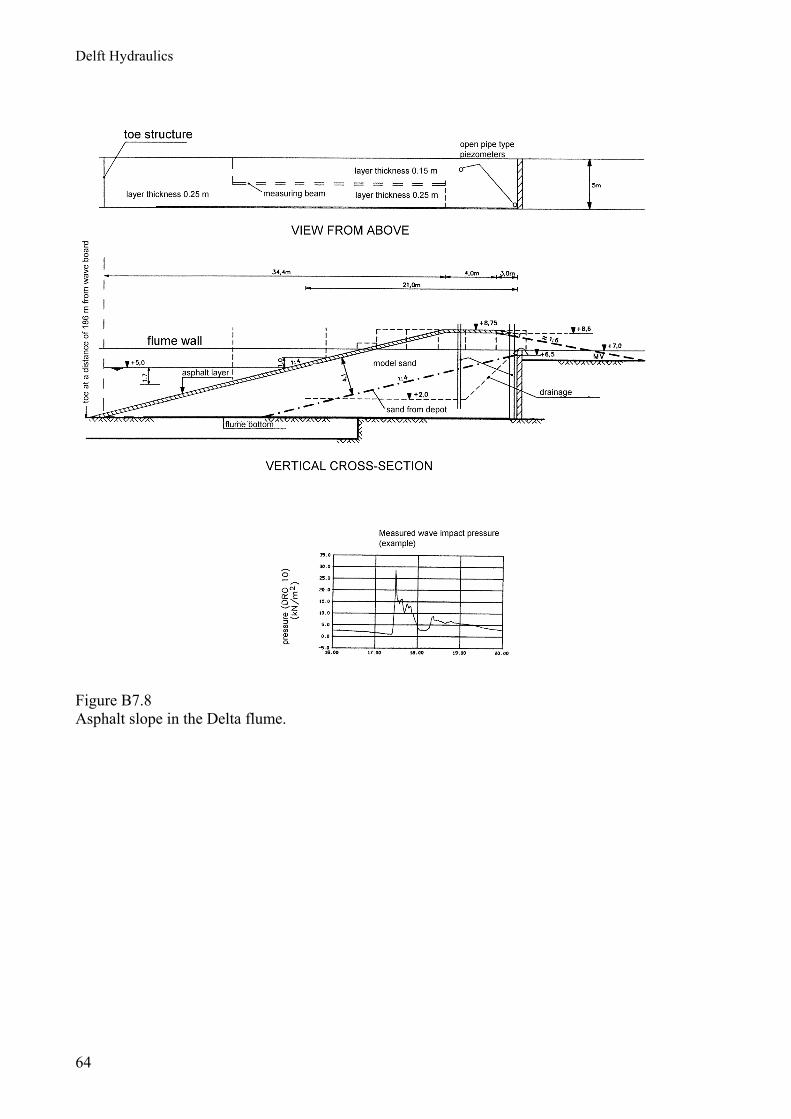
Delft Hydraulics
64
Figure B7.8 Asphalt slope in the Delta flume.
Delft Hydraulics
65
8 GENERAL DESIGN DIRECTIVES
Wave impacts may cause high pressures on a structure; sometimes the impact pressures are many times greater than the quasi-static pressures. These high impact pressures however, do not always have to cause high tensions in the main girders of the structure: this is especially the case, when the impact duration is very short in relation to the natural oscillation period of the structure. Also, as a rule, impact pressures will not operate on a large part of the structure simultaneously. Nonetheless, when designing a structure, it is advisable to use as a starting point the fact, that wave impact loads should be prevented as much as possible or should remain limited.
Taking the waves as a starting point, the following measures could be considered:
• Prevent waves from reaching the structure. This could be achieved by locating the
structure in an area sheltered from the waves or by protecting the structure, as an example by using natural walls or by building breakwaters or (partially open) partitions. Measures like this could work, especially for smaller structures.
• Prevent waves from breaking in the immediate proximity of walls; this is because standing, non-breaking waves do not cause impact loads on vertical structures, which have no protruding components. Waves may break on a sloping foreland, on underwater shoulders, on the substructure of the structure and on other underwater structures. An effective solution will not always be possible; another consideration would be to let the waves break at a sufficient distance from the structure.
The measures mentioned require considerable hydraulic structures. As a rule, it will therefore be more cost-effective to adapt the design of the structure in such a way, that the effect of the wave impacts remains limited or that the wave impacts cannot occur: • Prevent placing horizontal or sloping structure components in areas where the water level
moves up and down. This especially applies to the area around the average water level, because there, the vertical velocities are highest.
• If this is not possible, the structure needs to be made as open as possible (as an example by using lattice structures). Perforations in plate structures reduce the dimensions of the affected surface area; the impact pressures themselves however are not strongly reduced by this. Non-plated structures, such as structures composed of pipes, have the advantage that the moving water may flow around the structure more easily, which reduces both the impact load and spreads out the impact load over time (because the wave front has to travel around the structure). This last effect moreover will occur as a rule with plated structures, because the water level seldomly runs perfectly parallel to the plate surface; in case of level structures however, the probability of a parallel approach is present all the time. In case of flow through the structure, as a rule the waves become lower, which is favourable in relation to wave impacts; in case of counter flow, the waves may become steeper locally, and thereby generate less favourable effects.
• For gates with horizontal beams on the wave side, a second vertical plating may be used to protect the beams.
• In case of a gate in a shaft it is desirable to use a shaft in front of the gate; this will allow the water to escape upward, which may prevent impacts or reduce them. Another consideration is to place an extra perforated outer plating in front of the gate.

Delft Hydraulics
66
• The entry of a shaft can sometimes be situated so low, that the (crests of the) waves cannot run into the shaft.
• The presence of corners, into which the incoming waves may travel, needs to be prevented; in those places the water cannot run off sideways, which may lead to high impact loads.
• Air enclosures between the water surface and the structure operate like a spring; depending on the size of the air bubble, more or less high bubble oscillations may be generated, which may start the local natural oscillations of the structure. The air bubble is considerably weaker than the structure itself; the effect of this may be that the response of the structure is smaller than if there would be no air bubble present. Because of the difficulty in forecasting the effect of air bubbles moreover, it is not recommended to base designs on this.
• The response of the structure to the impact load depends on the relation between impact duration τ and natural oscillation period T; manipulation of the stiffness of the structure or of the mass therefore in principle offers possibilities of reducing the response. A relatively low stiffness and/or higher mass (therefore a greater natural oscillation period) causes a smaller response, but because of stiffness and strength requirements (static and quasi-static loads!) this usually is not a real option. As a rule, therefore, the aim is to increase the stiffness as much as possible (τ/T > 2 to 3); the impact load then is more or less registered as a quasi-static load. Considering the need for an economically viable design, the designer will usually not have a lot of playroom and may therefore better focus on a design in which impacts do not occur.
• The response also depends on damping properties of the structure. Damping (both by the structure and by the water) may be effective in limiting the total response of the structure. Locally, especially in low-damped plate fields, the effect is usually limited.
In summary, measures in the field of placing and designing the structure in the most
favourable way, will be most effective.
Delft Hydraulics
67
9 REFERENCES
9.1 Delft Hydraulics Reports (in Dutch)1
M399-I/IV Golfaanval Haringvlietsluizen. Verslagen modelonderzoek, 1960/1961, ir M.A. Aartsen, ir E. Allersma. (Wave attack Haringvliet sluices; scale model) M423A Golfkrachten op bruggen te Delfzijl. Verslag modelonderzoek, 1958, ir E. van Marle. (Wave forces on bridges in Delfzijl; scale model) M654 Golfdrukken op de hefdeuren van de Lauwerszeesluizen. Verslag modelonder- zoek, 1977, ir P.A. Zijderveld. (Wave pressures on llift Gates of Lauwerszee sluices; scale model) M754 Buitenmetingen spuisluis Haringvliet. Verslag metingen, 1981, ir J.D. van den Bunt, ir A.C.M. Vermeer. (In situ measurements sluice Haringvliet) M1057 Schaaleffecten bij golfklappen op een talud. Verslag modelonderzoek, 1979, ir Th. van Doorn. (Scale effects at wave impacts on slopes; scale model) M1138 Piombino thermal power plant. Wave forces on intake structure. Verslag modelonderzoek, 1972, ir R.J. van Dijk. M1187-III Radareiland. Golfbelastingen. Verslag modelonderzoek, 1976, ir J.D. van den Bunt, ir R. Maaten. (wave loads on Radar island; scale model) M1320-IV Stormvloedkering Oosterschelde. Onderzoek naar de golfklapgevoeligheid van de pijleroplossing met dubbele kering. Voorlopig verslag modelonderzoek, 1976, ir E. van Hijum. (Storm surge barrier Eastern Scheldt; investigation of sensitivity of alternative design design with large piers and double gates; scale model) M1335-I Stormvloedkering Oosterschelde. Golfklappen op de schuif in de Ooster scheldecaisson. Verslag modelonderzoek, 1977, ir C. Ramkema. (Storm surge barrier Eastern Scheldt; wave impacts on the gate in the Eastern Scheldt caisson (alternative design); scale model) M1335-II Stormvloedkering Oosterschelde. Golfklappen: een zuigermodel met samen drukbaar water. Verslag modelonderzoek, 1979, ir C. Ramkema, ir C. Flokstra. (Storm surge barrier Eastern Scheldt; a piston model with compressible water) 1 Reports can only be studied by others after Delft Hydraulics has received approval for this from the client involved.
Delft Hydraulics
68
M1335-III Stormvloedkering Oosterschelde. Golfklappen: een literatuuroverzicht en schaaleffecten in modelonderzoek. Verslag bureaustudie, 1979, ir C. Ramkema. (Storm surge barrier Eastern Scheldt; a literature survey on wave impacts and remarks on scale effects) M1381-I Golfklappen op stalen roosterschuiven in de stormvloedkering van de Ooster schelde. Nota modelonderzoek, 1976, ir C. Ramkema. (Storm surge barrier Eastern Scheldt; wave impacts on steel grid gates (alternative design); scale model). M1381-II Stormvloedkering Oosterschelde. Golfklappen tegen betonnen roosterschuiven. Verslag modelonderzoek, 1978, ir C. Ramkema. (Storm surge barrier Eastern Scheldt; wave impacts on concrete grid gates (alternative design); scale model). M1396-III Stormvloedkering Oosterschelde. Belasting in gesloten toestand; oriënterend onderzoek golfklappen scheve golfaanval. Verslag modelonderzoek, 1982, ir J.C. Stans. (Storm surge barrier Eastern Scheldt; wave impacts at oblique incoming waves; scale model). M1494 Stormvloedkering Oosterschelde. Vooronderzoek m.b.v. een stijf sectiemodel naar stroom- en golfbelasting op dorpelbalken, bovenbalken en plaatliggerschuiven. Verslag modelonderzoek, 1981, ir T.H.G. Jongeling. (Storm surge barrier Eastern Scheldt; pre-investigation to flow and wave induced forces on sill beams, upper beams and plate girder gates with a stiff scale model section). M1504 Stormvloedkering Oosterschelde. Oriënterend onderzoek naar golfklappen op de plaatliggerschuiven, sectie R15, loodrechte golfaanval en aanstroming. Verslag modelonderzoek, 1982, ir R.M. Korthof. (Storm surge barrier Eastern Scheldt; pre-investigation to wave impact on plate girder gates with a stiff scale model section). M1543 Stormvloedkering Oosterschelde. Belasting bij gesloten en weigerende schuif, sectie R15, h.o.h. afstand pijlers 45 m, scheve golfaanval. Verslag modelonderzoek, 1981, ir J.C. Stans. (Storm surge barrier Eastern Scheldt; loads on part of the barrier during closed gate conditions and when one of the gates is malfunctioning (open) during oblique wave attack; scale model). M1648-I Stormvloedkering Oosterschelde. Onderzoek m.b.v. een elastisch gelijkvormig model naar het responsiegedrag van de bovenbalken bij golfklapbelasting. Berekening van golfklapdrukken m.b.v. een wiskundig massaveersysteem model. Verslag modelonderzoek en bureaustudie, 1981, ir T.H.G. Jongeling. (Storm surge barrier Eastern Scheldt; response of the upper beams due to wave impacts; elastic similarity scale model and computations)
Delft Hydraulics
69
M1648-II Stormvloedkering Oosterschelde. Onderzoek m.b.v. een elastisch gelijkvormig model naar het responsiegedrag van de plaatliggerschuiven bij golfklapbelas- tingen. Berekening van optredende krachten in de bewegingswerken van de schuiven. Verslag modelonderzoek en bureaustudie, 1981, ir T.H.G. Jongeling. (Storm surge barrier Eastern Scheldt; response of the plate girder gates and
gate operating system due to wave impacts; elastic similarity scale model and computations) M1664 Stormvloedkering Oosterschelde. Golfklappen op de hefschuiven; optimalise- ring plaatliggerschuif. Verslag modelonderzoek, 1980. ir J.C. Stans. (Storm surge barrier Eastern Scheldt; wave impacts on plate girder gates and optimalisation of the design; scale model) M1723/M1687 Stormvloedkering Oosterschelde. Verticale golfbelastingen op de vak werkschuiven, loodrechte golfaanval. Verslag modelonderzoek, 1982, ir R.M. Korthof. (Storm surge barrier Eastern Scheldt; wave impacts on open truss girder gates; scale model) M1765 Alto Lazio nuclear power plant. Wave forces on the cooling water intake structure. Verslag modelonderzoek, 1982, ir R.M. Korthof. M1835 Stormvloedkering Oosterschelde. Golfklappen op de eindkokers. Verslag modelonderzoek, 1982, ir R.M. Korthof. (Storm surge barrier Eastern Scheldt; wave impacts on plate girder structures at both gate ends; scale model) M1869-III Civitavecchia harbour, Italy. Wave impacts on a circular and square caisson. Verslag modelonderzoek, 1983, ir J.W. van der Meer. M2040 Regelmatige-golfklapmetingen Deltagoot, talud 1:6, analyse tijdsafhankelijke drukverdeling op een vaste plaats langs het talud. Verslag modelonderzoek, 1984, R.J.H. Stive. (Regular wave impacts on a slope (1:6), measured in the Deltaflume and analysis of time dependent pressure distribution) R765 Golfklappen op het uitwateringsriool bij Lomé, Togo. Verslag bureaustudie, 1972, ir J.K. Kostense. (Wave impact at the sluice culvert at Lomé, Togo; desk study) R1359 Oil jetty St Eustatius, west coast. Breaking wave forces on vertical piles. Verslag bureaustudie, 1978, ir R.M. Korthof. R1440-II Randvoorwaarden bij het ontwerp van pijpleidingen. Golf- en stroomkrachten op pijpleidingen. Verslag literatuurstudie, 1979, ir. J. Bosma. (Boundary conditions for the design of pipe Lines; wave and flow forces; literature survey)
Delft Hydraulics
70
R2279 Stormvloedkering Oosterschelde. Bovenbalken: nadere beschouwing golfklap belastingen en responsie bovenbalken bij golfklappen. Notitie bureaustudie, 1985, ir T.H.G. Jongeling, ir E. van Meerendonk. (Storm surge barrier Eastern Scheldt; analysis of wave impacts and responses
of upper beams; desk study) Q298/H326 Conditiebewaking stormvloedkering Oosterschelde. Meetsysteem op schuiven S13 en R21 en bovenbalk R20. Verslag ontwerp en realisatie meetsysteem, 1988, ir. T.H.G. Jongeling. (Storm surge barrier Eastern Scheldt; measuring system for in situ checks) Q490 Spuisluizen afsluitdijk Den Oever. Dynamisch gedrag hefschuiven bij golfbe lastingen. Verslag prototype metingen, 1990, ir H.W.R. Perdijk, ir T.H.G. Jongeling. (In situ measurements dynamic behaviour lift gates Sluices Den Oever) Q605/H626 Conditiebewaking stormvloedkering Oosterschelde. Meting tijdens hoogwa- tersluiting 14 febr. 1989. Verslag buitenmetingen, 1990, ir. T.H.G. Jongeling. (Storm surge barrier Eastern Scheldt; in situ measurements during high water closure) Q1299 Golfbelasting op draaibruggen van de Afsluitdijk. Verslag bureaustudie, 1991, ir A. Vrijburcht. (Wave loads on bridges of the Afsluitdijk) H231 Duinafslag tijdens superstormvloed op Walcheren. Analyse golf(klap)belasting op asfalt zandlichaam aan duinvoet. Verslag onderzoek, 1986, ir R.J.H. Stive. (Dune erosion during a super storm surge; analysis of wave impact on asphalt sand mixture at the toe of the dunes) H463 Second order wave forces; a literature survey. Verslag bureaustudie, 1989, ir S.T. Schuurmans. H976 Literature survey to wave impacts on dike slopes. Verslag bureaustudie, 1990, ir G. Ph. van Vledder. H1256 Waterbeweging op gladde taluds: invloed van berm en ondiep voorland op golfdrukken, golfoploop, golfoverslag en snelheden. Verslag modelonderzoek, 1991, ir J.P. de Waal, ir J.J. Veldman. (Water movements on smooth slopes: influence of berm and shallow foreland on wave pressures, wave run up, wave overtopping and velocities) H1480 Gedrag van asfaltbekleding onder golfaanval. Verslag modelonderzoek, 1992, ing H. Derks, ir M. Klein Breteler. (Behaviour of asphalt top layers during wave attack; scale model) H1702 Gedrag van asfaltbekleding onder golfaanval. Relatie tussen belasting en rek. Verslag bureaustudie, H1702, ir J.P. de Waal. (Behaviour of asphalt top layers during wave attack; relation between load and elasticity).
Delft Hydraulics
71
H1942 Handboek voor hydraulische belastingen op waterbouwkundige constructies. In voorbereiding. ir M. Klein Breteler. (Handbook for hydraulic loads on hydraulic structures)
9.2 Other reference material
Bagnold, R.A. (1939): "Interim report on wave pressure research", Journal of the Institution of Civil Engineers, Vol 12, London, England. Battjes, J.A. (1988): "Korte golven", Collegehandleiding b76, Faculteit der Civiele Techniek, TU Delft. Battjes, J.A. (1992): "Windgolven", Collegehandleiding b78, Faculteit der Civiele Techniek, TU Delft. Berkhoff, J.C.W. (1976): "Mathematical models for simple harmonic linear water waves. Wave diffraction and refraction.", Delft Hydraulics publication no 163. Campbell, I.M. and Weynberg, P.A. (1979): "Slam load histories on cylinders", in Int. Conference on Environmental Forces on Engineering Structures, Imperial College, London, England. CERC (1984): Shore Protection Manual (1984). Department of the Army, Waterways Experi ment Station, Corps of Engineers, Coastal Engineering Research Center, U.S.A. Dette, H.H., Schulz, K.P., Witte, H.H. (1991): "Experiments on wave-induced loadings on rigid and elastic walls", Leichtweiss Institut für Wasserbau, Technische Universität Braunschweig, Deutschland. (In het kader van het Europese Marine Science and Technology programma MAST G6, Coastal structures.) Fabula, A.G. (1957): "Ellipse-fitting approximation of two-dimensional normal symmetric impact of rigid bodies on water" in Proc. of 5th Midwestern Conference on Fluid Mechanics, pp 299-315, University of Michigan, USA. Führböter, A. (1966): "Der Druckschlag durch Brecher auf Deichböschungen." Mitteilungen des Frazius Instituts, Heft 28, Technische Universität Hannover, Deutschland. Führböter, A. (1969): "Laboratory investigation of impact forces", in Proc. of Symposium on Research on Wave Action, Vol 2, paper 6, Delft Hydraulics, Delft. Goda, Y. (1985): "Random Seas and Design of Maritime Structures", University of Tokyo Press, Japan. Goda, Y. (1992): "The Design of Upright Breakwaters", in Proc. of the Short Course on Design and Reliability of Coastal Structures, pp 547-568, Venice, Italy, ICCE'92. Groen, P. en Dorrestein, R. (1976): "Zeegolven", Staatsdrukkerij en uitgeverijbedrijf, 'sGravenhage.
Delft Hydraulics
72
Harris, C.M., Crede, C.E. (1961): "Shock and Vibration Handbook", McGraw-Hill Book Company, New York, USA. Hurdle, D.P., Kostense, J.K. and Bosch, P. van der (1989): "Mild-slope model for the wave behaviour in and around harbours and coastal structures in areas of variable depth and flow conditions", in Proc. of 2nd Int. Symp. on Water Modelling and Measurements. Iribarren Cavanilles, R. (1954): "Obras Maritimas", Madrid 1954. Isaacson, M. (1979): "Wave-Induced Forces in the Diffraction Regime", in Mechanics of Wave-Induced Forces on Cylinders, pp 68-89, ed. T.L. Shaw, Pitman, London, England. Jong, R.J. de, Korthof, R.M., Perdijk, H.W.R. (1982): "Response studies of the storm surge barrier of the Eastern Scheldt.", Delft Hydraulics publication no 284. Karman, T.L. von, Wattendorf, F. (1929): "The impact on seaplane floats during landing", National Advisory Committee for Aeronautics (NACA), TN 321, Washington, USA. Klatter, L., Janssen, H., Dijkman, M. (1994): "Wave impacts on the Eastern Scheldt Barrier. Evaluation of five years field measurements", in Proc. of ICCE '94, Japan. Klopman, G., Kostense, J.K. (1989): "The loading on a vertical cilinder in random waves at high Reynolds numbers.", Delft Hydraulics publication no 426. Kolkman, P.A. (1981): "Maximale golfdrukken volgens stromingsdrukmodel, schokgolfmo del en waterpistonmodel", Note SL1 in Notes of P.A. Kolkman in the period 1969 – 1990, Delft Hydraulics (1992). Lundgren, H. (1969): "Wave shock forces: An analysis of deformation and forces in the wave and in the foundation", in Proc. of Symposium on Research on Wave Action, Vol 2, paper 4, Delft Hydraulics, Delft. Meer, J.W. van der (1988): "Rock slopes and gravel beaches under wave attack.", Delft Hydraulics publication no 396. Meer, J.W. van der, Benassai, E. (1984): "Wave forces and impacts on a circular and square caisson.", in Proc. of 19th Conference on Coastal Engineering, Houston, USA. Meer, J.W. van der, Heydra, G. (1990): "Rocking armour units: number, location and impact velocity.", Delft Hydraulics publication no 435. Méhauté, B. Le (1976): "An Introduction to Hydrodynamics and Water Waves", Springer- Verlag, New York, U.S.A. Miche, R. (1944): "Mouvements ondulatoires de la mer in profondeur constante ou décroissante", Annales des Ponts et Chaussées, Vol 114, Paris, France. Miller, B.L. (1980): "Wave Slamming on Offshore Structures", report no R81, National Maritime Institute, Feltham, England.
Delft Hydraulics
73
Minikin, R.R. (1950): "Winds, waves and maritime structures", Griffin, London, England. Nagai, S. (1973): "Wave Forces on Structures", in Advances in Hydroscience, Vol 9, pp 253-324, Academic Press, New York, U.S.A. Oumeraci, H., Klammer, P., Partenscky, H.W. (1993): "Classification of breaking wave loads on vertical structures" in Journal of Waterway, Port, Coastal and Ocean Engineering, Vol 119, no 4. Ramkema, C. (1978): "A model law for wave impacts on coastal structures.", Delft Hydraulics publication no 207. Rundgren, L. (1958): ""Water wave forces", Bulletin no 54, Royal Institute of Technology, Division of Hydraulics, Stockholm, Sweden. Sarpkaya, T. and Isaacson, M. (1981): "Mechanics of Wave Forces on Offshore Structures", Van Nostrand Reinhold Company, New York, U.S.A. Stive, R.J.H. (1984): "Wave impact on uniform steep slopes at approximately prototype scale", IAHR Symposium on scale effects in modeling hydraulic structures, Esslingen am Neckar, Deutschland. Vreugdenhil, C.B. (1969): "On the effect of artificial-viscosity methods in calculating shocks.", Delft Hydraulics publication no 71. Vrijer, A. (1983): "Fender forces caused by ship impacts.", Delft Hydraulics publication no 309. Wagner, H. (1931): "Landing of seaplanes", National Advisory Committee for Aeronautics (NACA), TM 622, Washington, USA. Watanabe, S. (1934): "Impact resistance on water - Part IV, cilinder", Scientific papers of the Institute of Physical and Chemical Research, Vol 23, Tokyo, Japan. Wijdieks, J. (1983): "Waterhammer. Practice - criteria - provisions - mathematical descriptions - examples.", Delft Hydraulics publication no 310. Witte, H.H. (1988): "Druckschlagbelastung durch Wellen in deterministischer und stochastischer Betrachtung" in Mitteilungen Heft 102/1988, Leichtweiss Institut für Wasserbau, Technische Universität, Braunschweig, Deutschland.
Delft Hydraulics
74
INDEX BY SUBJECT (PART B)
Air compression model (air compression model) (Paragraph 5.5) Breaking of waves (Paragraph 2.2.1) Celerity (Paragraph 2.1) Compression shocks (air compression model) (Paragraph 5.5) Design directives (Chapter 8) Diffraction (Paragraph 2.2.3) Experiences in prototype (Paragraphs 7.3 – 7.4) Experiences in scale models (Paragraphs 7.1 – 7.7) Flow influence on waves (Paragraph 4.4) Flow pressure model (Paragraph 5.5) Forecasting of wind-generated waves (Paragraph 2.2.4) Guidelines for designs (Chapter 8) Hammer shock (Paragraph 5.4) Impulse load (Paragraph 6.2) JONSWAP spectrum (Paragraph 2.2.2) Long wave (Paragraph 2.1) Mass spring system (Paragraph 6.2) Peak amplification factor (Paragraph 2.2.2) Pierson-Moskowitz distribution (Paragraph 2.2.2) Prototype (Paragraphs 7.3 – 7.4) Quasi-static wave load (Paragraphs 4.1 – 4.5) Rayleigh distribution (Paragraph 2.2.2) Reflection (Paragraph 2.2.3)
Delft Hydraulics
75
Refraction (Paragraph 2.2.3) Response: - response properties of the structure (Paragraph 6.1) - response to quasi-static wave load (Paragraph 4.5) - response of a single mass spring system to an impulse load (Paragraph 6.2) - influence of response to wave impact load (Paragraph 6.3) Reynolds influence (Paragraph 4.1.1) Scale models (Paragraphs 7.1 – 7.7) Scale rules : see part C Sea state (Chapter 2) Seiches (Paragraph 2.1) Slamming coefficient (Paragraph 5.5) Slender structures (Paragraph 4.1.1) Short wave (Paragraph 2.2.1) Short (non-slender) structures (Paragraph 4.1.2) Stochastic process (Paragraph 2.2.2) Storm surge (Paragraph 2.1) Structures
- slender structures (Paragraph 4.1.1) - non-slender structures (Paragraph 4.1.2)
Swell (Paragraph 2.1) Translatory wave (Paragraph 2.10 Types of wave impacts (Paragraph 5.4) Ventilated shocks (Paragraph 5.4) Wave characteristics - long wave / short wave (Paragraphs 2.2.1 – 2.2.2) - wave number (Paragraph 2.2.1) - spectrum (Paragraph 2.2.2) - celerity (Paragraph 2.2.1) Wave diffraction (Paragraphs 2.2.3 – 2.2.4)
Delft Hydraulics
76
Wave energy (Paragraph 2.2.1) Wave forecasting (Paragraph 2.2.4) Wave growth (Paragraph 2.2.4) Wave impact - maximum wave pressure (Paragraph 5.5) - wave impact characteristics (Paragraph 5.2) - wave types (Paragraph 5.4) Wave load: - quasi-static (Paragraphs 4.1 – 4.4) - dynamic: see wave impact: see wave impact Wave number (Paragraph 2.2.1) Wave pressure distribution along the vertical (Paragraph 2.2.1) Wave reflection (Paragraph 2.2.3) Wave refraction (Paragraph 2.2.3) Wave impact model (Paragraph 5.5) Wave spectrum: - JONSWAP spectrum (Paragraph 2.2.2) - Pierson-Moskowitz distribution (Paragraph 2.2.2) - Rayleigh distribution (Paragraph 2.2.2) Wind-generated waves - stochastics (Paragraphs 2.2.2 – 2.2.3) - forecasting (Paragraph 2.2.4)

Delft Hydraulics
77
Delft Hydraulics
78
Biographies of the authors
Dr P.A. Kolkman was born in 1932 and graduated from the Delft University of Technology in 1956. He was awarded a doctorate in 1976 on the subject of vibrations in closure mechanisms. He spent his entire career at Delft Hydraulics. In addition, he was a scientific researcher at the Delft University of Technology from 1968 to 1990. Dr Kolkman has been involved in the design of almost all major Dutch navigation locks, river dams and tidal barriers and has also acted as an advisor to large hydraulic engineering projects abroad. He has also been responsible for various leading publications. In particular, he has acquired an international reputation for his work in the area of combating vibration in movable gates and hydraulic valve mechanisms. He is the co-author of a number of books published in English on saline-fresh water separation systems in sea locks and drainage relationships in man-made structures, among other subjects. At this time he is the chief editor of the ‘International Association of Hydraulic Research (IAHR)’ journal. T.H.G. Jongeling was born in 1947 and completed his studies in 1976 in Applied Mechanics at the Delft University of Technology. He has worked at the HBG and IBBC-TNO and has been with Delft Hydraulics since 1977. Mr. Jongeling specialises in the dynamics of hydraulic structures and has carried out research and consultancy projects in the field of vibration and wave impact, particularly in connection with large sea defence projects in the Netherlands and overseas. He has also contributed to the design of numerous large and small hydraulic engineering projects, as well as writing a number of works in the field of structural vibration. Mr. Jongeling is now also active in the area of irrigation systems. Dienst Weg- en Waterbouwkunde (civil engineering unit of Rijkswaterstaat) Bouwdienst (construction office of Rijkswaterstaat) Delft Hydraulics 1996