dutch dairy in figures - zuivelnl
TRANSCRIPT
2019
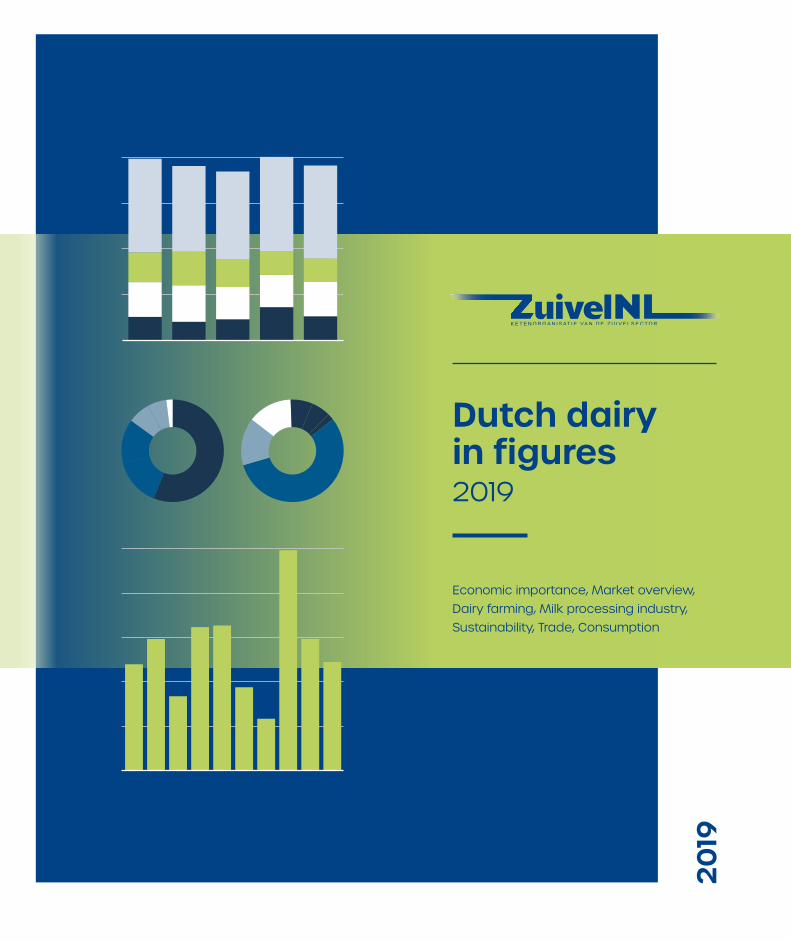
Economic importance, Market overview, Dairy farming, Milk processing industry, Sustainability, Trade, Consumption
Dutch dairy in figures2019
THE NETHERLANDS: LAND OF DAIRY
Modern sector
The Netherlands is known worldwide
as a dairy country. There is a long
tradition of milk, butter and cheese
production and consumption and the
typical pasture landscape with cattle
and windmills is inextricably connec-
ted with the perception of our country.
Behind this image lies a modern
sector, with consideration for people,
animals and the environment. It is one
of the largest and most vital agricul-
tural sectors in the Netherlands and
contributes significantly to the Dutch
economy. The Dutch dairy sector is
one of the frontrunners in the internati-
onal dairy world. As a result, the sector
has a strong image and good access
to important (growth) markets.
Greater efficiency on dairy farms and
in the production locations remains
necessary from a cost price perspec-
tive and in order to remain internatio-
nally competitive. Distinctive product
quality, food safety, animal health,
animal welfare and sustainable deve-
lopment are important prerequisites
in that respect. The professionalism of
dairy farmers, in the dairy industry and
in supplying sectors is decisive for the
successful development of the sector.
End of milk quota system
has major impact
The abolition of the milk quota system
at the end of March 2015 and the
generally promising outlook for the
global dairy market gave a boost to
new investments in dairy farming and
the dairy industry, aimed at capacity
growth through modernisation,
expansion and new construction.
However, the strong growth in dairy
farming, and thus an extension in the
dairy herd, resulted in the phosphate
production ceiling set by the European
Commission for the Netherlands being
exceeded in 2015 and 2016. In order
to reduce phosphate production,
the phosphate reduction plan came
into force in 2017 and the phosphate
rights system has been in effect since
1 January 2018. Under pressure from
these measures, the dairy herd has
now been brought back to the level
of around the time the quota system
The publication Zuivel in Cijfers (Dairy in Figures) provides an
overview in figures of the key developments in the Dutch dairy
sector in 2019 and is divided into eight topics:
• The Netherlands: land of dairy • Economic importance
• Market overview • Dairy farming • Milk processing industry
• Sustainability • Trade • Consumption
Tables with detailed statistical information can be consulted on the website of ZuivelNL (www.zuivelnl.org).
The figures for the year 2019 are provisional, but will only differ slightly from the final figures.
Data from this publication may be reproduced provided the source is acknowledged. No rights may be derived
from this publication.
was abolished, causing phosphate
production to fall well below the
permitted sector ceiling.
Oriented to the future through sus-
tainable, economically responsible
development
In the coming years, Dutch dairy
farming will continue to focus on
a healthy, balanced development
within the environmental constraints,
whereby further reduction in nitrogen
and greenhouse gas emissions
are important points for attention.
Within the dairy industry as well,
climate measures, relating in parti-
cular to greenhouse gas reduction
and energy policy, are increasingly
impacting businesses. Both the dairy
industry and dairy farming sectors
want to contribute in an economically
responsible manner to realising the
national climate objectives that
follow from the global climate accord
reached in Paris (2015).
page
3
The Netherlands: land of dairyDUTCH DAIRY IN FIGURES
2019
ZuivelNL page
2

Goat milk production 0.4 billion kg
25 Milk processing companies
53 Dairy plants
Cow milk production 14.0 billion kg
0.5 millionDairy goats
1.6 million Dairy cows
NUMBER OF DAIRY FARMS IN THE NETHERLANDS
580Dairy farms with goats
16,260Dairy farms with cows
MILK PRODUCTION
EXPORT REVENUES€7.8 billion
TOTAL SURFACE AREA GRASSLAND AND MAIZE 1.1 MILLION HECTARES
THIS IS 26.3% OF THE SURFACE AREA IN THE NETHERLANDS
83%OUTDOOR GRAZING AT DAIRY FARMS
49,000fte
7.1% contribution to trade surplus
MILK PROCESSING
TOTAL €54.1 billion
€7.6 billionShare dairy industry
CONTRIBUTION OF AGRO & FOOD TO THE ECONOMY
EMPLOYMENT DAIRY FARMING AND MILK PROCESSING INDUSTRY
Source: Statistics Netherlands (CBS), Sustainable Dairy Chain, Wageningen University & Research, ZuivelNL
ZuivelNL page
4
page
5
Dutch dairy at a glance
Dutch dairy at a glance
Cheese56%
Milk powder15%
Other14%
Drinking milk and other fresh milk
products7%
Condensed milk6% Butter and
butteroil2%
DUTCH DAIRY IN FIGURES
2019

DUTCH ECONOMY
€774.5billion
CONTRIBUTION OF AGRO & FOOD TO THE ECONOMY IN 2018
ADDED VALUE DUTCH DAIRY COMPLEX
Dutch
originRe-exports Total
Milk and cream 0.7 0.1 0.7
Concentrated
milk products1.2 0.2 1.4
Fermented milk
products0.1 0.0 0.1
Whey products
and milk protein
concentrates0.3 0.1 0.4
Butter and
butteroil0.8 0.5 1.4
Cheese 3.1 0.5 3.7
Total 6.2 1.4 7.6
2010 20142012 2016 20182011 20152013 2017 2019
page
7
Economic
importance
DUTCH DAIRY IN FIGURES
2019
ZuivelNL page
6
EXPORT REVENUES AGRICULTURAL PRODUCTS
Source: Statistics Netherlands (CBS), Wageningen University & Research
Source: Statistics Netherlands (CBS)
Source: Wageningen University & Research
Agro & Food contributes
€54.1 billion (7.0%) to the Dutch
economy, of which €7.6 billion
(1.0%) relates to dairy.
Economic importance
Ornamental horticulture
Meat
Dairy
Vegetables
Fruits
Beverages
Processed fruits and vegetables
Preparations of cereals, flour or milk
Food processing residues, livestock feed
Cocoa preparations
Eggs and honey
DAIRY EXPORT REVENUES
0 2 4 6 8 10
Dutch origin
Re-exports
billion euro
euro
million euro
10,000
8,000
6,000
4,000
2,000
02014 2015 2016 2017 2018
Dairy farming
Milk processing industry
Distribution
Dairy sector related services 1
1 Among other agricultural and financial services, utilities and employment agencies
DAIRY FARMS - INCOME DEVELOPMENT PER FARM
Source: Wageningen University & Research
0
20,000
40,000
60,000
80,000
100,000
billion euro
49,10059,200
23,500
65,400
33,600
99,200
37,600
64,50059,300
48,000
Ireland 1,623
Denmark 989
Netherlands 826
Lithuania 541
Germany 398
France 386
Poland 374
Belgium 365
United Kingdom 230
Italy 207
Other EU-28 212
EU-28 AVERAGE 326
EU-28
Uruguay 705
Argentina 244
Brazil 165
Colombia 151
Chile 140
Venezuela 62
SOUTH AMERICA
New Zealand 4,671
Australia 354
OCEANIA
Pakistan 218
India 134
Japan 57
Republic of Korea 40
China 23
Thailand 18
Viet Nam 10
Indonesia 3
Malaysia 1
Philippines 0
ASIA
Turkey 244
Israel 191
Iran 119
Saudi Arabia 64
United Arab Emirates 4
MIDDLE EAST
Kenya 73
South Africa 61
Algeria 59
Egypt 59
Nigeria 3
AFRICA
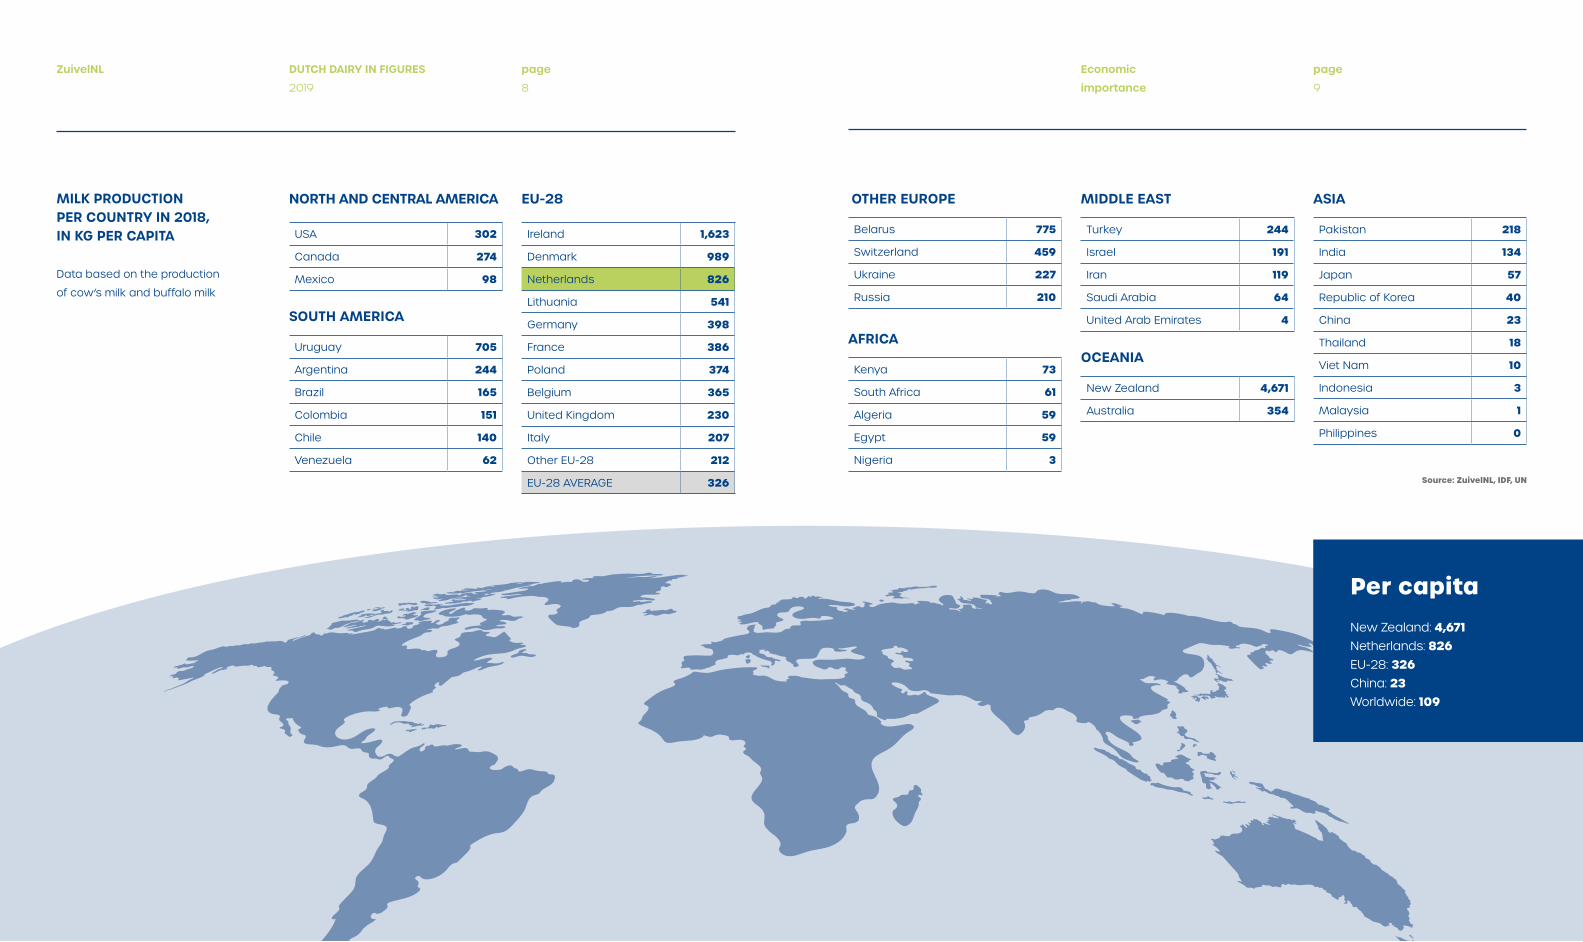
Source: ZuivelNL, IDF, UN
Belarus 775
Switzerland 459
Ukraine 227
Russia 210
OTHER EUROPE
USA 302
Canada 274
Mexico 98
NORTH AND CENTRAL AMERICA
Per capitaNew Zealand: 4,671Netherlands: 826EU-28: 326China: 23Worldwide: 109
DUTCH DAIRY IN FIGURES
2019
ZuivelNL page
8
page
9
Economic
importance
MILK PRODUCTION PER COUNTRY IN 2018, IN KG PER CAPITA
Data based on the production
of cow’s milk and buffalo milk

Market overview
Market prices in 2019
The dairy market was dominated in
2019 by the strong recovery in protein
prices. Thanks to the complete reduc-
tion of intervention stocks, skimmed
milk powder was once again subject
to the normal supply and demand
mechanism. The fat prices, on the
other hand, were under pressure for
much of the year and fell further. This
price decline had already started
during the second half of 2018.
The EU butter market rebounded in
January, after the price decline had
come to an end in December 2018.
In February and March, however,
the market weakened again and
prices fell. This was caused by limited
demand and a large supply, partly due
to high stock levels. After a temporary
stabilisation of the butter price in April,
these factors caused the price to
weaken again from mid-May onwards.
Prices fell until mid-August, only to
rise slightly again until mid-October.
After this prices remained virtually
unchanged until the end of the year,
at a level just above the long-term
average. The price level of European
butter was well below the world
market price level from March/April
until November. This caused strong
growth in export demand, particularly
in the third and fourth quarters. The
price for skimmed milk powder incre-
ased further in January and February
due to good demand. Almost all the
remaining EU intervention stock was
sold during these months. At the end
of February a small volume of inter-
vention powder remained, which was
sold in the following months. The price
then stabilised in March and April.
The market was quiet during these
months. Thanks to a further develop-
ment in demand from export markets,
there was room for an upward move-
ment in prices from the second half of
April to the end of May. After a slight
decline in June, the price underwent
an almost uninterrupted rise from
July to the end of November. This
was due to unabated high demand,
particularly in Asia, and limited supply
due to the lagging development of the
milk pool. The milk supply in the main
exporting countries hardly increased
in 2019 (+0.1%). In December, the
price level stabilised as a result of
increased competition with skimmed
milk powder from the US and growing
resistance among buyers to the high
price level of European product.
The average price level of protein-re-
lated products in 2019 was ultimately
considerably higher than in 2018.
The average price for skimmed milk
powder rose by more than 43%. In
the case of whole milk powder, the
increase in the protein component had
more of an effect than the decrease
in the fat component. As a result, the
average price for whole milk powder
increased by more than 9% in 2019.
The average price of butter fell by
almost 24%. In 2019, the average price
of cheese rose by 2% and that of
whey powder by 1%.
page
10
ZuivelNL DUTCH DAIRY IN FIGURES
2019
DUTCH QUOTATION FOR BUTTER AND SKIMMED MILK POWDER
Source: ZuivelNL
DEVELOPMENT MILK DELIVERIES IN IMPORTANT EXPORTING COUNTRIESArgentina, Australia, Brazil, Canada, Chile, EU-28, New Zealand, Turkey, Uruguay and USA
Source: Eurostat, RVO.nl, national statistics
2010 2011 2012 2013 2014 2015 2016 2017 2018 2019
Milk deliveries (x billion kg) 301 310 316 318 331 337 336 342 346 347
Relative development compared to previous year
2.2% 3.1% 2.2% 0.4% 4.2% 1.8% -0.3% 1.8% 1.4% 0.1%
EU-28 INTERVENTION STOCKS
Source: EU Milk Market Observatory
million kg
700
400
600
300
500
200
100
0
Quotation butter
Intervention price butter Intervention price skimmed milk powder
Quotation skimmed milk powder
euro per 100 kg excluding VAT, ex-factory
0
100
200
300
400
Market overview page
11
Butter Skimmed milk powder
Jan ‘15Jan ‘13Jan ‘11 Jan ‘17Jul ‘15Jul ‘13Jul ‘11 Jul ‘17Jan ‘10 Jan ‘16Jan ‘14Jan ‘12 Jan ‘18Jul ‘10 Jul ‘16Jul ‘14Jul ‘12 Jul ‘18 Jan ‘19 Jul ‘19 Jan ‘20
20112010 2012 2014 2016 20182013 2015 2017 2019

PRICE DEVELOPMENT DAIRY PER LINK IN THE CHAIN
Source: Statistics Netherlands (CBS), Wageningen University & Research
Source: LTO
Source: LTO
index, 2015 = 100
Milk prices
The Dutch advance milk prices
showed a slight downward trend
during most of the year. The positive
effect of the sharp rise in protein
prices was completely cancelled
out by the sharp fall in fat prices. The
milk price reached its lowest point in
October but then showed an increase
in the last two months. This was due
to the recovery in fat prices from
August onwards and the continuing
rise in protein prices.
COMPANY COUNTRY 2018 2019 2019/2018
Granarolo (North) Italy 38.37 39.24 2.3%
FrieslandCampina Netherlands 36.07 36.49 1.2%
Valio Finland 36.74 36.46 -0.8%
Sodiaal (Pas de Calais) France 34.89 35.50 1.8%
Savencia (Basse Normandie) France 33.69 35.17 4.4%
Danone (Pas de Calais) France 34.55 35.04 1.4%
Lactalis (Pays de la Loire) France 33.98 34.89 2.7%
Hochwald Milch eG Germany 34.41 34.37 -0.1%
Arla Foods DK Denmark 35.50 34.02 -4.2%
Müller (Leppersdorf) Germany 33.02 33.46 1.3%
Saputo Dairy UK United Kingdom 32.66 32.92 0.8%
Milcobel Belgium 32.75 32.36 -1.2%
DMK Deutsches Milchkontor eG Germany 32.96 32.33 -1.9%
Kerry Agribusiness Ireland 32.51 31.04 -4.5%
Dairygold Ireland 32.76 30.89 -5.7%
Glanbia Ireland 32.59 30.76 -5.6%
AVERAGE MILK PRICE 34.22 34.06 -0.5%
Capsa Food Spain - 31.14 -
Emmi Switzerland 48.23 51.60 7.0%
Fonterra New Zealand 29.01 31.19 7.5%
USA class III USA 31.49 38.16 21.2%
Note: prices for standard milk with 4.2% fat and 3.4% protein with an annual delivery of 1,000,000 kg milk (excluding VAT, including supplementary payments and excluding premiums for special milk flows)
euro per 100 kg euro per 100 kg
INTERNATIONAL MILK PRICE COMPARISON DUTCH MILK PRICE COMPARED TO EU, NEW ZEALAND AND USA
Prices for standard milk with 4.2% fat and 3.4% protein with an annual delivery of 1,000,000 kg milk
ZuivelNL page
12
DUTCH DAIRY IN FIGURES
2019
page
13
Market overview
Farmgate milk price Consumer prices (CPI) Producer prices (PPI)
140
80
120
Dec ‘10 Dec ‘11 Dec ‘12 Dec ‘13 Dec ‘14 Dec ‘15 Dec ‘16 Dec ‘17 Dec ‘18 Dec ‘19
60
100
160
Netherlands
USA
EU-28
New Zealand
2010 2013 20172011 2014 20182012 20162015 2019
20
30
40
50
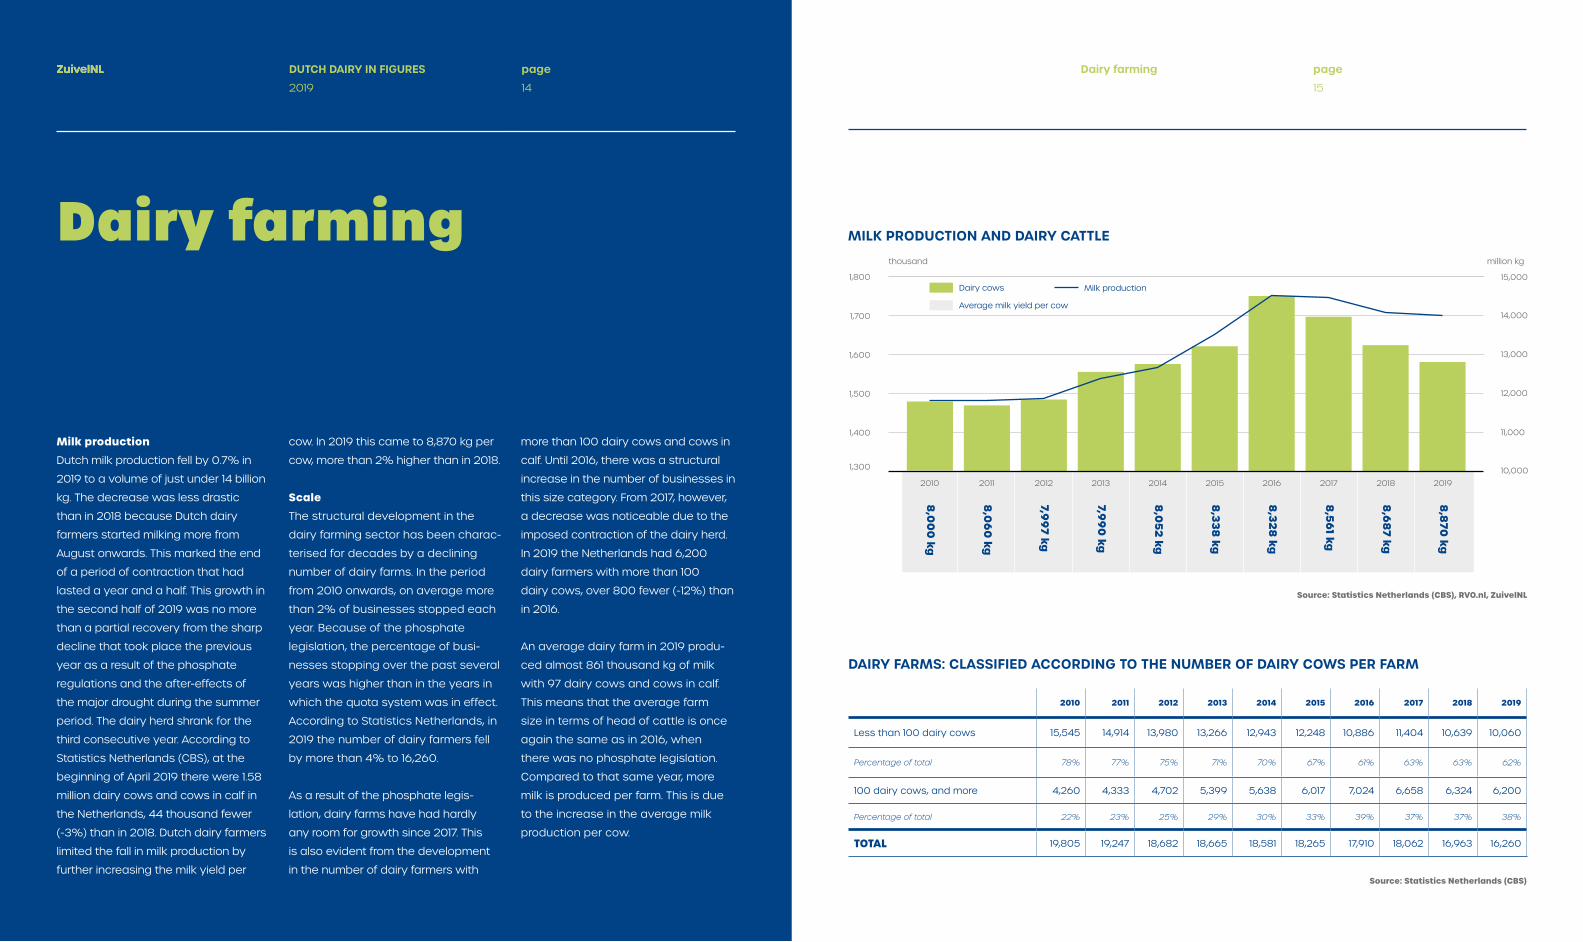
Milk production
Dutch milk production fell by 0.7% in
2019 to a volume of just under 14 billion
kg. The decrease was less drastic
than in 2018 because Dutch dairy
farmers started milking more from
August onwards. This marked the end
of a period of contraction that had
lasted a year and a half. This growth in
the second half of 2019 was no more
than a partial recovery from the sharp
decline that took place the previous
year as a result of the phosphate
regulations and the after-effects of
the major drought during the summer
period. The dairy herd shrank for the
third consecutive year. According to
Statistics Netherlands (CBS), at the
beginning of April 2019 there were 1.58
million dairy cows and cows in calf in
the Netherlands, 44 thousand fewer
(-3%) than in 2018. Dutch dairy farmers
limited the fall in milk production by
further increasing the milk yield per
cow. In 2019 this came to 8,870 kg per
cow, more than 2% higher than in 2018.
Scale
The structural development in the
dairy farming sector has been charac-
terised for decades by a declining
number of dairy farms. In the period
from 2010 onwards, on average more
than 2% of businesses stopped each
year. Because of the phosphate
legislation, the percentage of busi-
nesses stopping over the past several
years was higher than in the years in
which the quota system was in effect.
According to Statistics Netherlands, in
2019 the number of dairy farmers fell
by more than 4% to 16,260.
As a result of the phosphate legis-
lation, dairy farms have had hardly
any room for growth since 2017. This
is also evident from the development
in the number of dairy farmers with
more than 100 dairy cows and cows in
calf. Until 2016, there was a structural
increase in the number of businesses in
this size category. From 2017, however,
a decrease was noticeable due to the
imposed contraction of the dairy herd.
In 2019 the Netherlands had 6,200
dairy farmers with more than 100
dairy cows, over 800 fewer (-12%) than
in 2016.
An average dairy farm in 2019 produ-
ced almost 861 thousand kg of milk
with 97 dairy cows and cows in calf.
This means that the average farm
size in terms of head of cattle is once
again the same as in 2016, when
there was no phosphate legislation.
Compared to that same year, more
milk is produced per farm. This is due
to the increase in the average milk
production per cow.
Dairy farming
ZuivelNL
2010 2011 2012 2013 2014 2015 2016 2017 2018 2019
Less than 100 dairy cows 15,545 14,914 13,980 13,266 12,943 12,248 10,886 11,404 10,639 10,060
Percentage of total 78% 77% 75% 71% 70% 67% 61% 63% 63% 62%
100 dairy cows, and more 4,260 4,333 4,702 5,399 5,638 6,017 7,024 6,658 6,324 6,200
Percentage of total 22% 23% 25% 29% 30% 33% 39% 37% 37% 38%
TOTAL 19,805 19,247 18,682 18,665 18,581 18,265 17,910 18,062 16,963 16,260
DAIRY FARMS: CLASSIFIED ACCORDING TO THE NUMBER OF DAIRY COWS PER FARM
Source: Statistics Netherlands (CBS)
Source: Statistics Netherlands (CBS), RVO.nl, ZuivelNL
MILK PRODUCTION AND DAIRY CATTLE
million kgthousand
8,0
00
kg
8,0
60
kg
7,997 kg
7,99
0 kg
8,0
52 kg
8,338
kg
8,328
kg
8,561 kg
8,6
87 kg
8,870
kg
DUTCH DAIRY IN FIGURES
2019
ZuivelNL page
14
page
15
Dairy farming
1,300
1,400
1,500
1,600
1,700
1,800
10,000
11,000
12,000
13,000
14,000
15,000
2010 2011 2012 2013 2014 2015 2016 2017 2018 2019
Milk productionDairy cows
Average milk yield per cow

Surface grassland (km2) G
M
C
X
F
O
Dairy cows (x 1,000)
Dairy farms
Surface maize (km2)
Dairy cows per km2 grassland
Dairy farms with outdoor grazing (%) 1
DRENTHE
GRONINGEN
FRIESLAND
OVERIJSSEL
FLEVOLAND
NOORD-HOLLAND
UTRECHTZUID-HOLLAND
NOORD-BRABANT
LIMBURG
TOTAL NETHERLANDS
ZEELAND
GELDERLAND
2015 2019G 675 620M 196 160C 109 105X 161 170F 1,098 964O 73 78
2015 2019G 646 616M 88 71C 104 104X 160 169F 961 864O 74 78
2015 2019G 1,807 1,745M 157 159C 292 297X 162 170F 2,824 2,585O 75 81
2015 2019G 1,407 1,368M 374 334C 260 253X 185 185F 3,212 2,930O 77 82
2015 2019G 142 141M 46 31C 36 34X 252 241F 269 238O 34 42
2015 2019G 692 635M 47 43C 85 88X 123 139F 1,043 942O 94 95
2015 2019G 534 566M 56 61C 86 94X 162 166F 1,176 1,191O 88 91
2015 2019G 693 580M 50 45C 101 91X 145 156F 1,320 1,058O 92 94
2015 2019G 941 873M 593 444C 232 210X 247 241F 2,449 2,080O 58 63
2015 2019G 291 271M 170 121C 52 47X 180 175F 553 474O 72 74
2015 2019G 9,563 9,068M 2,242 1,874C 1,622 1,578X 170 174F 18,265 16,260O 78 83
2015 2019G 175 180M 55 49C 22 22X 126 125F 229 215O 72 74
2015 2019G 1.561 1.474M 410 357C 243 232X 156 157F 3,131 2,719O 77 80
Source: Statistics Netherlands (CBS), ZuivelNL
KEY FIGURES DAIRY FARMING PER PROVINCE
Source: Foundation for Quality and Maintenance of Milking Installations
MILKING PARLOUR TYPES
Herringbone parlour
Automatic milking systems
Parallel parlour
Rotary parlour
Swingover parlour
Tandem parlour
Tied up stable
OUTDOOR GRAZING IN THE NETHERLANDS
Bron: Sustainable Dairy Chain, ZuivelNL
76.6%Outdoor
grazing
17.0%Other
6.4%Partly outdoor
grazing
DUTCH DAIRY IN FIGURES
2019
ZuivelNL page
16
page
17
Dairy farming
1 Source of the figures per province is Statistics Netherlands (CBS), year 2019 refers to the year 2018. Source of the figures for total Netherlands is ZuivelNL.
19,304Milking parlours
201059.0 %
11.7 %
10.3 %
9.8 %
5.0 %
3.5 % 0.7 %
16,258Milking parlours
201935.2 %
26.6 %
5.7 %
5.1 %
22.0 %
2.8 % 2.6 %

Milk processing IndustryMilk supply
The milk supply in the main dairy-
exporting countries remained
virtually the same in 2019 as the
year previous (+0.1%). There was a
decrease in volume in the first half
of 2019. The second half of the year
saw growth. Milk supply in the EU
increased by 0.6% in 2019. The first
two months of the year still saw the
volume decreasing, after which the
supply mainly showed slight growth
of around 1%. Ireland, Poland and the
United Kingdom recorded the largest
absolute increases, although Irish milk
supply fell sharply in the last quarter.
The German and French milk supply
remained at virtually the same level
as in 2018. The Netherlands recorded a
decrease of almost 1%, still as a result
of the introduction of the phosphate
legislation. The US showed modest
growth (+0.4%) in 2019, caused by
dairy herd shrinkage in the first half
of the year and lower growth in the
average milk yield per cow. Milk
production stagnated until the end of
August, after which there was slight
growth from September onwards.
The New Zealand milk supply showed
an unstable picture throughout the
year, which was partly due to drought
and therefore disappointing grass
growth. This resulted in a decrease of
0.7% for the whole of 2019. Australia
continued along the path of strong
contraction (-6.6%) as a result of
persistent drought. It was not until
December that there was some light
at the end of the tunnel, when there
was stabilisation for the first time in
eighteen months.
Milk processing
The Dutch dairy industry processed
an estimated 13.85 billion kg of milk in
2019, slightly more than in 2018. More
milk went to the production of cheese
and non-skimmed milk powder. Cheese
production increased by more than 1%
in 2019 to a volume of 891 thousand
tonnes. The Netherlands consequently
accounts for approximately 4%
of global cheese production. The
production of non-skimmed milk
powder increased by almost 10%
to a volume of 177 thousand tonnes,
recovering from the sharp decline in
2018. Less milk was processed into
butter and butter oil and skimmed
milk powder. Butter and butter oil
production decreased by more than
1% in 2019 to a volume of 231 thousand
tonnes. The production volume of
skimmed milk powder fell by almost
6% to 61 thousand tonnes.
Structure
At the end of 2019, the Dutch dairy
industry consisted of 25 companies
with a total of 53 production
locations. Five of these companies
are cooperatives. They process the
milk at 27 production locations. On
balance, the number of companies
and production locations has remained
unchanged for a number of years.
The production value of the Dutch dairy
industry increased by more than 1% in
2019 to an estimated €7.6 billion. This
increase reflects the higher revenues
on the dairy market. The prices of milk
powder in particular, but also those
of cheese were on average higher in
2019. In contrast, the production value
of butter and butter oil fell sharply as a
result of the sharp fall in prices. Per 100
kg of processed milk, the production
value ended up at a level of €54.87,
almost 1% higher than in 2018.
VOLUME 2019
ABSOLUTE GROWTH
COMPARED TO 2018
RELATIVE GROWTH
COMPARED TO 2018
billion kg billion kg %
EU-28 157.6 1.0 0.6%
Ireland 8.2 0.4 5.3%
United Kingdom 15.4 0.2 1.6%
Poland 12.2 0.2 1.9%
Belgium 4.2 0.1 2.7%
Germany 31.7 0.0 0.1%
Denmark 5.6 0.0 0.0%
France 24.5 0.0 -0.1%
Netherlands 13.8 -0.1 -0.7%
Italy 12.0 -0.1 -0.9%
Other EU-28 30.0 0.2 0.6%
Brazil 25.8 0.6 2.3%
USA 98.6 0.4 0.4%
Canada 9.5 0.0 -0.1%
Chile 2.4 0.0 -1.1%
Uruguay 2.0 -0.1 -4.5%
New Zealand 21.8 -0.2 -0.7%
Argentina 10.6 -0.2 -1.8%
Turkey 9.6 -0.5 -4.7%
Australia 8.8 -0.6 -6.6%
Source: Eurostat, RVO.nl, national statistics Source: Eurostat, IDF, RVO.nl, USDA, ZMB, ZuivelNL, national statistics
INTERNATIONAL MILK DELIVERIESMilk deliveries in the leading exporting
countries of the world
GLOBAL PRODUCTION OF A NUMBER OF DAIRY PRODUCTS
CHEESE
NON-SKIMMED MILK POWDER
BUTTER AND BUTTEROIL
SKIMMED MILK POWDER
page
19
DUTCH DAIRY IN FIGURES
2019
ZuivelNL page
18
Milk processing Industry
million kg
2016 20182015 2017 20193,000
4,000
5,000
-1.0 % 1.3 % -1.2 % 1.4 %
2016 20182015 2017 20198,000
10,000
12,000
1.9 % 1.6 % 2.9 % 2.8 %
2016 20182015 2017 20193,000
4,000
5,000
-7.2 % 4.6 % -0.7 % 0.3 %
2016 20182015 2017 201915,000
20,000
25,000
2.5 % 2.9 % 1.8 % 0.7 %
PRODUCTION NL891 million kg +1.3% compared to 2018
PRODUCTION NL231 million kg -1.3% compared to 2018
PRODUCTION NL177 million kg +9.9% compared to 2018
PRODUCTION NL61 million kg -5.9% compared to 2018
FrieslandCampina (21)
Ausnutria (2)
A-ware (2)
Bel Leerdammer (2)
DOC Kaas (2)
Kaasmakerij Henri Willig (2)
Danone/Nutricia (2)
Rouveen Kaasspecialiteiten (2)
Vreugdenhil Dairy Foods (2)
Arla FoodsNIJKERK
De GraafstroomBLESKENSGRAAF
DV Nutrition 1
HOOGEVEEN
Farm DairyLELYSTAD
GlobemilkBOXMEER
Trouw NutritionSLOTEN
Kaasmakerij ÖzgaziETTEN-LEUR
VIV BuismanZELHEM
CONO KaasmakersWESTBEEMSTER
Den EelderWELL
Eijssen DairyBEEK
FonterraHEERENVEEN
Hochwald FoodsBOLSWARD
VecozuivelZEEWOLDE
NestléNUNSPEET
ZuivelhoeveHENGELO OV
Lochem
SteenderenZelhem
Hengelo
Den Bosch
MaasdamRotterdam
Lutjewinkel
Leeuwarden
Marum
Bedum
Beilen
Hoogeveen
Meppel
Kampen
Nijkerk
Nunspeet
WestbeemsterRouveen
Molenschot
Ommen
Coevorden
Dalfsen
Schoonrewoerd
Heerenveen
Scharsterbrug
Gorinchem
Katwoude
Well
Beek
Lelystad
Sloten
Zeewolde
ZoetermeerBleskensgraaf
Cuijk
Balkbrug
Dronrijp
Bolsward
Workum
Noordwijk GR
Veghel
Rijkevoort
BoxmeerEtten-leur
Born
Nuenen
Borculo
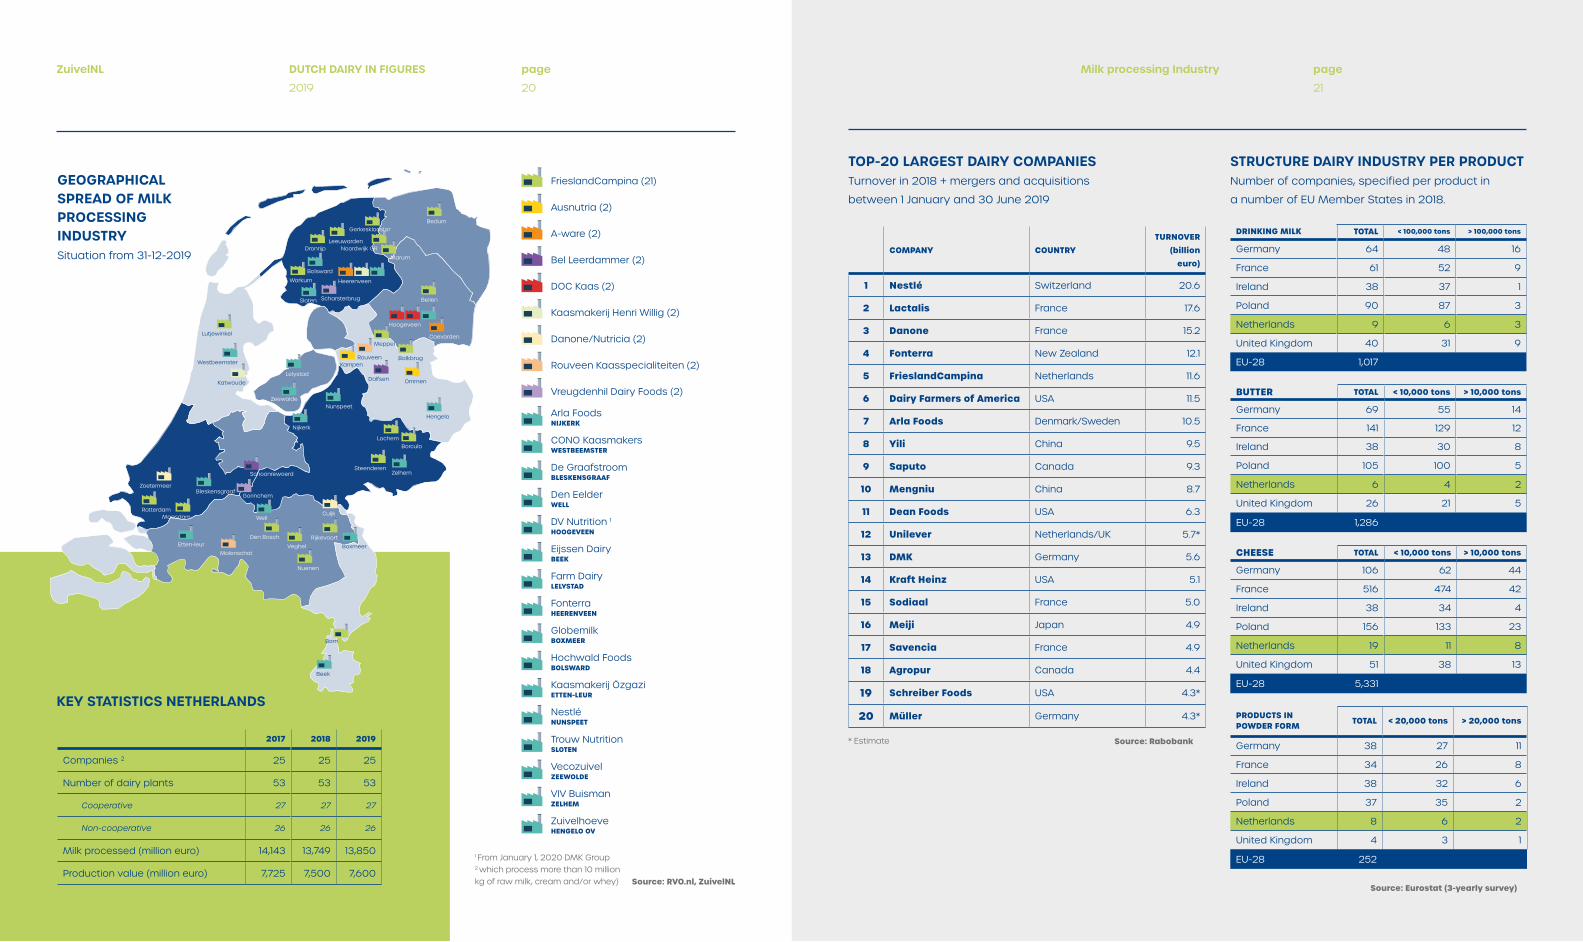
2017 2018 2019
Companies 2 25 25 25
Number of dairy plants 53 53 53
Cooperative 27 27 27
Non-cooperative 26 26 26
Milk processed (million euro) 14,143 13,749 13,850
Production value (million euro) 7,725 7,500 7,600
GEOGRAPHICAL SPREAD OF MILK PROCESSING INDUSTRYSituation from 31-12-2019
KEY STATISTICS NETHERLANDS
Source: RVO.nl, ZuivelNL
COMPANY COUNTRYTURNOVER
(billion euro)
1 Nestlé Switzerland 20.6
2 Lactalis France 17.6
3 Danone France 15.2
4 Fonterra New Zealand 12.1
5 FrieslandCampina Netherlands 11.6
6 Dairy Farmers of America USA 11.5
7 Arla Foods Denmark/Sweden 10.5
8 Yili China 9.5
9 Saputo Canada 9.3
10 Mengniu China 8.7
11 Dean Foods USA 6.3
12 Unilever Netherlands/UK 5.7*
13 DMK Germany 5.6
14 Kraft Heinz USA 5.1
15 Sodiaal France 5.0
16 Meiji Japan 4.9
17 Savencia France 4.9
18 Agropur Canada 4.4
19 Schreiber Foods USA 4.3*
20 Müller Germany 4.3*
TOP-20 LARGEST DAIRY COMPANIESTurnover in 2018 + mergers and acquisitions
between 1 January and 30 June 2019
Source: Rabobank
CHEESE TOTAL < 10,000 tons > 10,000 tons
Germany 106 62 44
France 516 474 42
Ireland 38 34 4
Poland 156 133 23
Netherlands 19 11 8
United Kingdom 51 38 13
EU-28 5,331
BUTTER TOTAL < 10,000 tons > 10,000 tons
Germany 69 55 14
France 141 129 12
Ireland 38 30 8
Poland 105 100 5
Netherlands 6 4 2
United Kingdom 26 21 5
EU-28 1,286
PRODUCTS IN POWDER FORM TOTAL < 20,000 tons > 20,000 tons
Germany 38 27 11
France 34 26 8
Ireland 38 32 6
Poland 37 35 2
Netherlands 8 6 2
United Kingdom 4 3 1
EU-28 252
STRUCTURE DAIRY INDUSTRY PER PRODUCTNumber of companies, specified per product in
a number of EU Member States in 2018.
DRINKING MILK TOTAL < 100,000 tons > 100,000 tons
Germany 64 48 16
France 61 52 9
Ireland 38 37 1
Poland 90 87 3
Netherlands 9 6 3
United Kingdom 40 31 9
EU-28 1,017
Source: Eurostat (3-yearly survey)
Gerkesklooster
DUTCH DAIRY IN FIGURES
2019
ZuivelNL page
20
page
21
Milk processing Industry
1 From January 1, 2020 DMK Group2 which process more than 10 million kg of raw milk, cream and/or whey)
* Estimate

Sustainability
Source: Sustainable Dairy Chain, 2018 Report
Source: Sustainable Dairy Chain, 2018 Report
PROGRESS IN ENERGY EFFICIENCY IN THE DAIRY CHAIN(objective: annual reduction of 2% compared to reference year 2005)
SECTOR CARBON FOOTPRINT FROM THE DAIRY CHAINPRODUCT CARBON FOOTPRINT DAIRY FARMING
2010 2011 2012 2013 2014 2015 2016 2017 2018
On the dairy farm
Rumen fermentation and digestion (methane)
538 540 548 549 541 541 523 483 480
Manure (methane) a) 150 148 152 154 151 155 147 139 137
Manure and soil (nitrous oxide) b) 153 156 158 157 159 143 133 124 121
Energy use (CO2) c) 31 33 34 31 33 31 30 29 28
Total on the dairy farm 872 877 892 892 884 871 833 775 767
In production of raw materials
Concentrated feed (CO2) 295 307 327 335 326 347 342 336 315
Roughage and by-products (CO2) 24 27 32 34 36 34 33 29 33
Fertilizer (CO2) 39 38 40 39 40 37 34 34 30
Energy (CO2) d) 37 20 21 22 20 19 19 19 18
Other (CO2) e) 32 36 34 29 30 29 26 29 33
Total production raw materials 426 428 455 459 452 467 454 447 428
Total dairy farming 1,298 1,304 1,347 1,352 1,336 1,338 1,287 1,222 1,195
(a) animal manure emissions from fermentation processes in an anaerobic environment;(b) emissions from nitrification and denitrification processes in the storage of animal manure and in the soil, and the indirect emission after atmospheric deposition of
N-compounds and by washout of N from agricultural soils;c) direct fossil fuel emissions (assuming that 80% of the total fossil fuel emissions occur during combustion on dairy farm), including contract work and cultivation work;d) emissions that occur during the production of electricity (100%) and fossil fuels (assuming that 20% of the total emissions of fossil fuels occur during production);e) emissions from the production of other raw materials supplied, for example agricultural plastics and pesticides.
Source: Sustainable Dairy Chain, 2018 Report
grams of CO2 equivalents per kg of measuring milk delivered by source
page
23
SustainabilityDUTCH DAIRY IN FIGURES
2019
ZuivelNL page
22
2005 2006 2007 2008 2009 2010 2011 2012 2013 2014 2015 2016 2017 2018
20
40
60
80
100
0
5
10
15
20
25
30
0
Milk transport Milk processingDairy farming
Dairy farms (milk and meat production) Milk processing (including milk transport and packaging)
Production of raw materials (especially feed and fertilizer)
2% reduction line
7,44
13,33
1,46
Greenhouse gas emissions in Mton CO2 equivalents
m3 a.e. per 1,000 kg milk
1990 2010 2011 2012 2013 2014 2015 2016 2017 2018

NITROGEN PRODUCTION IN ANIMAL MANURE PHOSPHATE PRODUCTION IN ANIMAL MANURE
million kg million kg
%
Source: Statistics Netherlands (CBS)
Source: Sustainable Dairy Chain, 2018 Report
DDDANAT 1
DEVELOPMENT OF AVERAGE ANTIBIOTIC USE BY DAIRY FARMS ACCORDING TO THE NETHERLANDS VETERINARY MEDICINES INSTITUTE
OUTDOOR GRAZING
40
60
50
70
80
90
100
81.2%Goal
83.0
%
Source: Sustainable Dairy Chain, ZuivelNL
279.7 75.5
Sector ceiling dairy farming 281.8 million kg Sector ceiling dairy farming 84.9 million kg
DUTCH DAIRY IN FIGURES
2019
ZuivelNL page
24
page
25
Sustainability
0 0
50
100
150
200
100
200
300
400
500
600
Dairy farming Dairy farming
Outdoor grazing
Other Other
Partly outdoor grazing
2018 20182019 20192017 20172016 20162015 20152014 20142013 20132012 20122011 20112010 2010
2009 201820172016201520142013201220112010
1
0
2
3
4
5
6
7
2013 20172014 20182012 20162015 2019
1 Defined Daily Dose Animal, National
3.0Sector ceiling Sector ceiling

Trade
Export
The total export value increased by
more than 2% in 2019 to more than
of €7.8 billion. This increase is mainly
attributable to the cheese product
group, where an increase of over
€200 million (+6%) was realised. The
export value of skimmed milk powder
also rose sharply, by almost €67 million
(+25%). After increasing by almost
5% in 2018, the export value of butter
and butter oil fell by more than 9%
in 2019. In the case of non-skimmed
milk powder, a shrinkage (-2%) was
realised in the value of exports.
The increase in the export value of
cheese was the result of both higher
prices and an increase in the quantity
exported. The latter amounted to
almost 911 thousand tonnes, more than
4% more than in 2018. A significant
part of the increase was due to trade
with EU Member States. There were
more sales especially in Germany,
Belgium, France and Spain. The export
to destinations outside the
EU borders increased slightly. The
decrease in the export value of butter
and butter oil was price-related, as the
volume increased by 6%. In contrast
to cheese, the growth in the export
volume of butter and butter oil was
largely achieved outside the European
Union. Third-country exports increased
by no less than 34% in 2019.
In the case of non-skimmed milk
powder, the fall in export value was
entirely due to a decrease in volume
(-9%). An increase in the average price
level partially offset this. The sharp
rise in the export value of skimmed
milk powder was caused both by the
significantly higher average price level
and by the substantial increase in the
volume of exports (+10%). The increase
in volume was achieved almost entirely
within the EU.
The EU is structurally the most
important sales region for Dutch
dairy products. In 2019, intra-trade
accounted for more than €5.6 billion,
almost three-quarters of the total
export value. With a joint share of over
70%, Belgium, Germany and France
are the most important sales markets.
In addition, of all EU member states,
the Netherlands is the most active on
the world market. The Dutch share in
the world trade, which amounted to
82.2 billion kg of milk equivalents in
2019, was almost 5%. This puts the
Netherlands among the world’s top
five largest dairy exporters, together
with New Zealand, the United States,
Belarus and Germany.
The top five destinations for Dutch
dairy exports outside the EU were,
as in 2018, all in Asia, namely China
(including Hong Kong), United Arab
Emirates, Saudi Arabia, South Korea
and Japan.
POSITION OF DUTCH DAIRY EXPORTS ON THE WORLD MARKET
OVERVIEW OF EU DAIRY EXPORTS TO THIRD COUNTRIES
Dutch exports to third countries: 3.9 billion kg In % of world trade: 4.7%
Source: Statistics Netherlands (CBS), Eurostat
Source: Statistics Netherlands (CBS), Eurostat, Comtrade, ZuivelNL
Export shares of the most important dairy exporting countries (in % of total world trade, expressed in milk equivalents)
Total EU-28: 28.5%
DUTCH DAIRY IN FIGURES
2019
ZuivelNL page
26
page
27
Trade
Netherlands
Germany
France
Belgium
Ireland
Other EU-28
OtherBelarus
Argentina
New Zealand
USA Switzerland
Australia
Uruguay
Turkey
Netherlands
billion kg milk equivalents
0
1
2
3
4
5
Germany France Belgium Ireland Poland Denmark Italy United Kingdom Other EU-28
TOTAL
82.2 BILLION KG
MEQ
25.0 %14.5 %
16.6 %
4.7 % 4.7 %
4.2 %
3.1 %
2.2 %
9.7 %
5.1 %
4.2 %
1.0 %
1.2 %
1.9 %
2.0 %
2015 2017 20192016 2018

*) Cheese, butter and butteroil, fermented products,
concentrated milk, milk and cream, whey and whey
products and products with milk constituents (HS-codes
0401-0406 and 17021)
POSITIVE TRADE BALANCE
TOTAL (all products) 56.0
Agricultural products 28.7
Of which dairy products * 4.0
billion euro
TOP-5 DESTINATIONS DUTCH EXPORTS IN VALUE
DESTINATION VALUE %
EU-28 3,059.6 83.7%
of which: Germany 1,197.1 32.8%
Belgium 476.0 13.0%
France 372.8 10.2%
Spain 224.3 6.1%
Italy 130.8 3.6%
Japan 97.7 2.7%
USA 81.7 2.2%
Mexico 38.0 1.0%
Egypt 33.4 0.9%
Other 344.4 9.4%
Total 3,654.8 100.0%
DESTINATION VALUE %
EU-28 1,183.1 86.9%
of which: Germany 407.5 29.9%
France 309.0 22.7%
Belgium 179.7 13.2%
Italy 71.3 5.2%
United Kingdom 66.9 4.9%
Indonesia 21.2 1.6%
Japan 20.1 1.5%
Singapore 16.8 1.2%
Syria 8.8 0.6%
Other 110.7 8.1%
Total 1,360.7 100.0%
DESTINATION VALUE %
EU-28 121.5 36.6%
of which: Belgium 29.1 8.7%
Germany 27.5 8.3%
Italy 19.5 5.9%
France 14.0 4.2%
Spain 10.6 3.2%
Philippines 21.6 6.5%
Saudi Arabia 20.5 6.2%
China (incl. Hong Kong) 20.3 6.1%
Indonesia 17.2 5.2%
Other 131.3 39.5%
Total 332.3 100.0%
CHEESE BUTTER AND BUTTEROIL
SKIMMED MILK POWDER
Source: Statistics Netherlands (CBS), Eurostat
million euro
DESTINATION VALUE %
EU-28 153.2 26.2%
of which: Germany 38.4 6.6%
Belgium 35.0 6.0%
France 25.1 4.3%
United Kingdom 15.5 2.7%
Italy 13.2 2.3%
Kuwait 69.4 11.9%
China (incl. Hong Kong) 44.7 7.6%
Nigeria 33.0 5.6%
Angola 30.5 5.2%
Other 254.0 43.4%
Total 584.8 100.0%
NON-SKIMMED MILK POWDER
IMPORTS
TOTAL (all products) 460.0
Agricultural products 63.1
Of which dairy products * 3.8
billion euroTRADE BALANCE 2019
EXPORTS
Source: Statistics Netherlands (CBS), Eurostat
TOTAL (all products) 516.0
Agricultural products 91.8
Of which dairy products * 7.8
billion euro
DUTCH DAIRY IN FIGURES
2019
ZuivelNL page
28
page
29
Trade

Netherlands. Dutch export of infant
nutrition to this country represented
a value of almost €1.7 billion in 2019.
DUTCH EXPORTS INFANT FORMULAExcluding intra trade, HS-code 190110
million kg
million euro
Source: Eurostat
Source: Statistics Netherlands (CBS), Eurostat
Source: Statistics Netherlands (CBS), Eurostat
COUNTRIES OF ORIGIN OF DUTCH IMPORTS
DEVELOPMENT DUTCH IMPORTS (including intra trade)
IMPORT VALUE
€3.8 billion
In addition to the export of regular
dairy products, the Netherlands also
exports many products with a high
dairy content, including infant nutrition.
What is striking in this context is
that over the years, China (including
Hong Kong) has been by far the most
important export destination for the
page
31
TradeDUTCH DAIRY IN FIGURES
2019
ZuivelNL page
30
2018 201920172016201520142013201220112010
0
50
100
150
200
250
38.2 %
19.8 %
11.4 %
8.5 %
4.3 %
4.1 %
4.1 %
2.1 %6.3 %
Germany
Ireland
Italy
United Kingdom
Belgium
France
Denmark
Poland
Other EU-28
Other countries of origin
0
200
400
600
800
1,000
1,200
1,400
2018 20192017201620152010
CHEESE
0
100
200
300
400
500
600
700
800
2018 20192017201620152010
BUTTER AND BUTTEROIL
0
50
100
150
200
250
300
350
2018 20192017201620152010
MILK AND CREAM*
0200400600800
1,0001,2001,4001,6001,800
2018 20192017201620152010
OTHER**
* In small packages for consumers** Milk powder, condensed milk, fermented products, whey and whey products, milk and cream (in bulk)
1,309
279
622
1,603
1.2 %
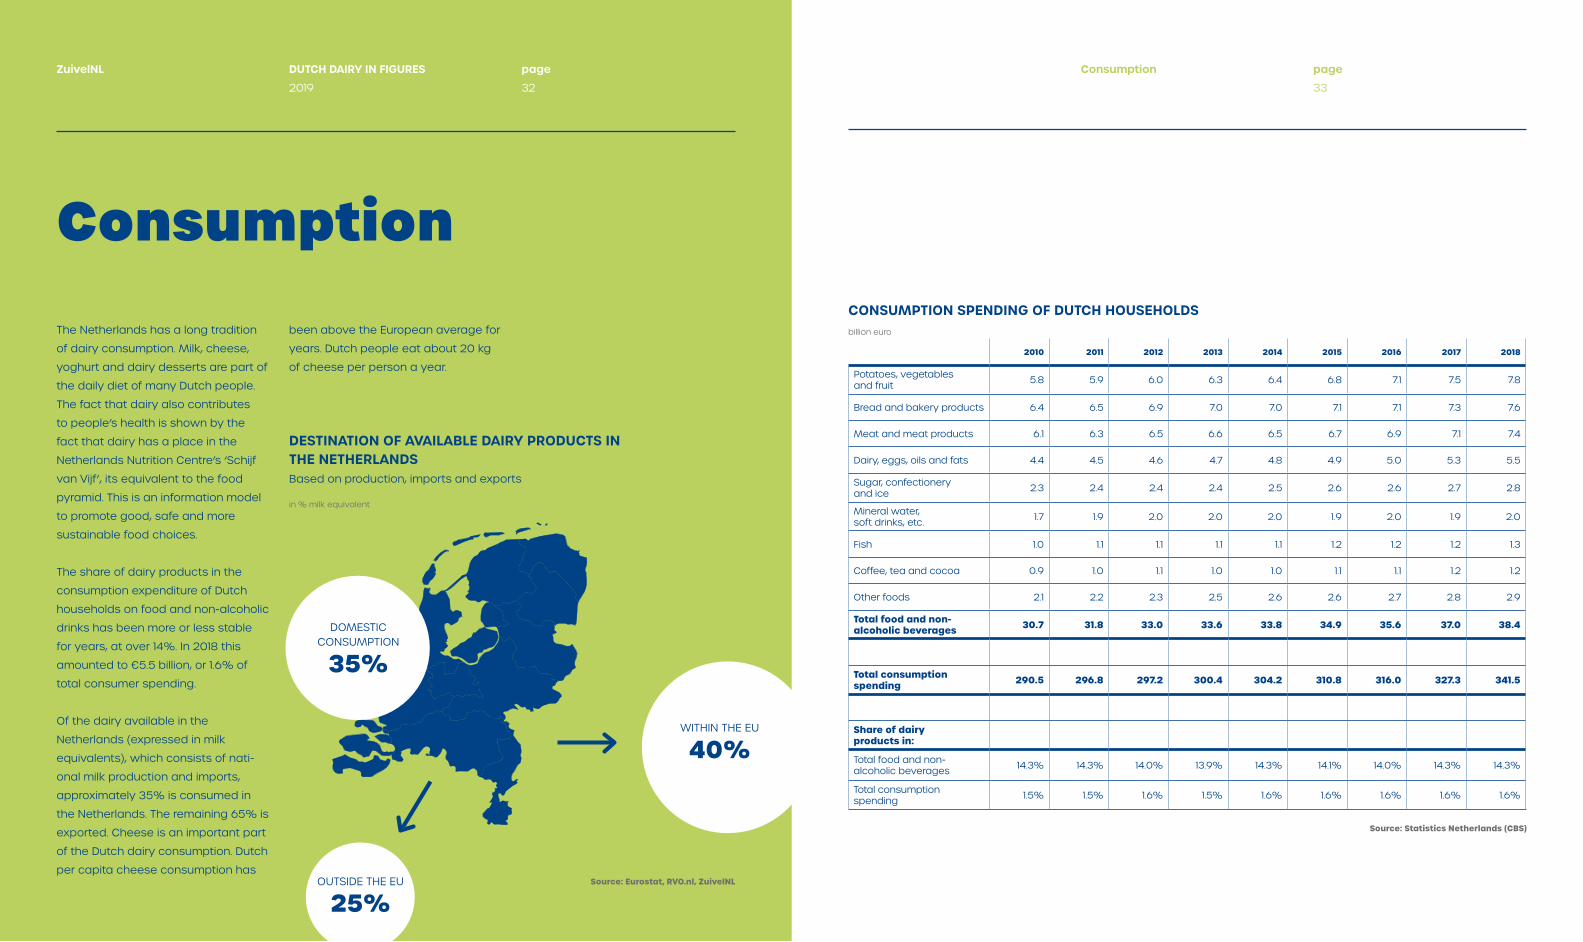
ConsumptionThe Netherlands has a long tradition
of dairy consumption. Milk, cheese,
yoghurt and dairy desserts are part of
the daily diet of many Dutch people.
The fact that dairy also contributes
to people’s health is shown by the
fact that dairy has a place in the
Netherlands Nutrition Centre’s ‘Schijf
van Vijf’, its equivalent to the food
pyramid. This is an information model
to promote good, safe and more
sustainable food choices.
The share of dairy products in the
consumption expenditure of Dutch
households on food and non-alcoholic
drinks has been more or less stable
for years, at over 14%. In 2018 this
amounted to €5.5 billion, or 1.6% of
total consumer spending.
Of the dairy available in the
Netherlands (expressed in milk
equivalents), which consists of nati-
onal milk production and imports,
approximately 35% is consumed in
the Netherlands. The remaining 65% is
exported. Cheese is an important part
of the Dutch dairy consumption. Dutch
per capita cheese consumption has
been above the European average for
years. Dutch people eat about 20 kg
of cheese per person a year.2010 2011 2012 2013 2014 2015 2016 2017 2018
Potatoes, vegetables and fruit 5.8 5.9 6.0 6.3 6.4 6.8 7.1 7.5 7.8
Bread and bakery products 6.4 6.5 6.9 7.0 7.0 7.1 7.1 7.3 7.6
Meat and meat products 6.1 6.3 6.5 6.6 6.5 6.7 6.9 7.1 7.4
Dairy, eggs, oils and fats 4.4 4.5 4.6 4.7 4.8 4.9 5.0 5.3 5.5
Sugar, confectionery and ice 2.3 2.4 2.4 2.4 2.5 2.6 2.6 2.7 2.8
Mineral water, soft drinks, etc. 1.7 1.9 2.0 2.0 2.0 1.9 2.0 1.9 2.0
Fish 1.0 1.1 1.1 1.1 1.1 1.2 1.2 1.2 1.3
Coffee, tea and cocoa 0.9 1.0 1.1 1.0 1.0 1.1 1.1 1.2 1.2
Other foods 2.1 2.2 2.3 2.5 2.6 2.6 2.7 2.8 2.9
Total food and non- alcoholic beverages 30.7 31.8 33.0 33.6 33.8 34.9 35.6 37.0 38.4
Total consumption spending 290.5 296.8 297.2 300.4 304.2 310.8 316.0 327.3 341.5
Share of dairy products in:
Total food and non- alcoholic beverages 14.3% 14.3% 14.0% 13.9% 14.3% 14.1% 14.0% 14.3% 14.3%
Total consumption spending 1.5% 1.5% 1.6% 1.5% 1.6% 1.6% 1.6% 1.6% 1.6%
CONSUMPTION SPENDING OF DUTCH HOUSEHOLDS
DESTINATION OF AVAILABLE DAIRY PRODUCTS IN THE NETHERLANDSBased on production, imports and exports
billion euro
DOMESTIC CONSUMPTION
35%
WITHIN THE EU
40%
OUTSIDE THE EU
25%Source: Eurostat, RVO.nl, ZuivelNL
in % milk equivalent
Source: Statistics Netherlands (CBS)
page
33
DUTCH DAIRY IN FIGURES
2019
ZuivelNL page
32
Consumption

2019
ZUIVELNL
BENOORDENHOUTSEWEG 46
2596 BC THE HAGUE
THE NETHERLANDS
+31 (0)70 2191600
WWW.ZUIVELNL.ORG KVK 59667222
Dutch dairy in figures 2019 is a publication of ZuivelNL. It provides an overview in figures of
the key developments in the Dutch Dairy Sector.
ZuivelNL is the chain organisation of the Dutch dairy sector and is active in areas where
cooperation between the links in the dairy chain creates added value. Activities include
financing and initiating research & innovation in the dairy farming and dairy chain,
financing and facilitating development and programme management in the field of
sustainability and animal health & welfare. Examples include the Sustainable Dairy Chain,
the KringloopWijzer and KoeMonitor. In the context of food safety, ZuivelNL finances the
research programme Gemeenschappelijk Research Zuivel. ZuivelNL publishes market
information on the international dairy market and Dutch dairy farming and facilitates the
export of dairy products. ZuivelNL focuses with educational programmes on dairy farmers,
employees in the dairy industry and on education through educational programmes.