impact matrix analysis and cost benefit calculations to improve … · 2017-11-12 · • 30...
TRANSCRIPT
The research leading to these results has received funding from the European Union’s Seventh Framework Programme for research, technological development and demonstration under grant agreement n° 311824
Impact matrix analysis and cost-benefit calculations to improve management practices regarding health status in
organic dairy farming Project Number: 311824
- Deliverable -
D6.5 & D6.6 – Customer satisfaction analysis
Due Date of Deliverable: 31.05.2016
Actual submission to EC date: 30.09.2016
Deliverable Lead Partner: P1 University of Kassel
Deliverable Author(s): Susanne Hoischen-Taubner, Mariska van der Voort, Niall O`Leary
Executive Summary
This document describes the course and outcome of the test-phase for the IMPRO toolbox. 23 farmer, 15 veterinarians and 3 advisors in the United Kingdom and The Netherlands were involved and provided their assessment on the usefulness and usability of the tools. Most of the participants (56 %) valued the toolbox as a useful addition to their usual process of decision making, providing a better understanding of the herd health situation. The assessment revealed valuable insights on weak points in the tools to be used for further improvements. At the same time it became clear that a new approach which is a tedious task because it forces participants to leave old path, change perspectives and deal with complexity and uncertainty, will only be broadly valued if other stakeholders (particularly retailers) put more pressure on the goal to reduce the prevalence of production diseases in organic dairy production which is urgently needed to justify the premium prices of organic labelled products.
Dissemination Level
PU Public PU

FP7 - 311824 IMPRO Deliverable D6.5 / D6.6
IMPRO FP7-KBBE-2012-6 Page 2 of 27
Table of Contents 1 Introduction ...................................................................................................................................................3
1.1 Aim of the toolbox .................................................................................................................................3
1.2 Usability assessment ............................................................................................................................3
2 Course of the test phase ..............................................................................................................................4
2.1 Farm selection in The Netherlands .......................................................................................................4
2.2 Farm selection in the United Kingdom ..................................................................................................5
2.3 Tested configuration of the toolbox ......................................................................................................5
2.4 Assessment of the tools ........................................................................................................................6
3 Results ..........................................................................................................................................................7
3.1 Technical, economic and herd health figures of participating farms ....................................................7
3.2 Evaluation of questionnaires.................................................................................................................7
3.3 Reports from farm visits ..................................................................................................................... 10
3.3.1 Comments from farm visits in UK .............................................................................................. 10
3.3.2 Comments from farm visits in NL............................................................................................... 11
4 Feedback for improvements ...................................................................................................................... 12
4.1 Health status report ........................................................................................................................... 12
4.2 Impact Matrix tool .............................................................................................................................. 12
4.3 Cost benefit tool ................................................................................................................................. 12
5 Workshops in The Netherlands and the United Kingdom ......................................................................... 12
5.1 IMPRO Dissemination Workshop in the United Kingdom ................................................................. 12
5.2 IMPRO Dissemination Workshop in the Netherlands ........................................................................ 13
6 Conclusions ............................................................................................................................................... 13
Annex 1 - herd health report .............................................................................................................................. 15
Annex 2 - Outline for farm Visits in Test-phase WP6 ........................................................................................ 23
Annex 3 - Questionnaire on the usefulness of the IMPRO toolbox ................................................................... 24
List of figures Course of the test-phase ......................................................................................................................................4
Reduced variable set for the demonstration of the impact matrix approach in the test-phase ............................6
Frequency of ratings in Likert scales for tools ......................................................................................................8
Ratings for the profitability assessment ................................................................................................................8
Ratings for the tested toolbox ...............................................................................................................................9
Usefulness of the toolbox compared to other tools and techniques .....................................................................9
List of tables Performance aspects linked to principles for usability assessments according to ISO 9241 ..............................6
Herd size, performance and herd health figures of participating farms ................................................................7
Mean, median and maximum permissible range values for Likert Scales, plus Cronbach’s Alpha Coefficient, for the whole sample .............................................................................................................................................8
Correlation of assessment of single tools and overall assessment of usefulness ............................................ 10
FP7 - 311824 IMPRO Deliverable D6.5 / D6.6
IMPRO FP7-KBBE-2012-6 Page 3 of 27
1 Introduction
1.1 Aim of the toolbox
The IMPRO project revealed huge variation in the prevalence of production diseases in European organic dairy farms within and between European countries despite common rules for organic dairy farming. At the same time factors affecting the emergence of production diseases in organic dairy farming systems have been shown to be very heterogeneous between farms. A farm centric and equifinal approach is recommended to reduce production diseases, based on the principle that the same end (low level of PDs) can be achieved via many different paths. The IMPRO project has developed tools to support farmers in identifying the most effective and efficient measures within their farm system to improve the animal health status by reducing the prevalence of production diseases. Integral parts of the new approach are the diagnosis at farm level via a participatory approach including an analysis of the farm system by an impact matrix, the assessment of the animal health situation based on milk recording data as well as economic assessments. Furthermore, the development of farm specific health plans and application of proactive monitoring and preventive protocols and improved treatment strategies.
These steps are supported by tools, developed within the project consortium. The scope and prefiguration of the IMPRO Software Toolbox is described in D6.4 Herd health management tool.
The purpose of the toolbox is to provide tailored support to individual organic dairy farmers in their efforts by supporting their decisions in reducing the prevalence of production diseases. The toolbox is designed to:
• Foster reflection on the farm structure, processes and internal management decision-making in relation to animal health,
• Provide a framework within which the complexity of each farm situation can be understood and relevant data brought to bear,
• Provide support to both the farm decision maker and external advisers, facilitating the incorporation of different perspectives.
By this means the toolbox fulfils the primary ‘knowledge transfer’ objective of the IMPRO project, i.e. bringing the achievements of the research to farm practice. Accordingly, achievement of this goal depends largely on the usefulness of the elaborated tools and the extent to which farmers and their advisers are able and willing to implement these tools in practice. These issues might be summed up in the question of the ‘usability’ of the toolbox in the application environment, i.e. its effectiveness, efficiency, and level of user satisfaction.
1.2 Usability assessment
In a test-phase farmer, veterinarians and advisors were asked to put tools from the IMPRO toolbox to use and to evaluate the usability. The test-phase is an important step in the iterative process of software development. Results from the assessment will be used to improve the software applications.
The international standard ISO 9241 presents the ergonomic requirements for designing software. It groups these requirements into seven principles: suitability for the task, self-descriptiveness, controllability, conformity with user expectations, error tolerance, suitability for individualizations, and suitability for learning. Several ISO 9241-based tools are available to test the usability of software.

FP7 - 311824 IMPRO Deliverable D6.5 / D6.6
IMPRO FP7-KBBE-2012-6 Page 4 of 27
The IMPRO toolbox differs from other software applications in two aspects. The current prefiguration of the toolbox is a collection of working tools which are not yet combined into one application. Each of the tools requires extensive training to get familiar with the software and the method. Furthermore, the tools are designed to support a participatory approach to elaborate farm specific strategies aiming at a reduced prevalence of production diseases. Therefore, it is no standalone software but embedded in a methodological approach for a new advisory concept. Due to the time-restrictions in the test phase, it was not possible to enable “playing- around” with the tools. Therefore, testing the usability could only be tested to a limited degree. The focus was more on the usefulness, which in contrast, could be determined within the test-phase. Participants were presented with the data/information and had a first go in dealing with it, expressed opinions and started a discussion.
Taking this into account the ISO 9241-based tools needed to be adapted to assess the performance of the tools and the approach.
2 Course of the test phase
The usability and usefulness of the current version was tested on 23 organic farms in The Netherlands (NL) and the United Kingdom (UK). The farms were visited twice by the researchers (one researcher in NL and in UK, respectively) (Figure 1). In the first visit the researcher collected farm specific data to prepare the tools for the application in the 2nd visit. These were milk recording data for at least the year 2015 and economic data. In the 2nd farm visit three applications of the toolbox were used by the farmer and his veterinarian / advisor.
A protocol was developed to ensure a uniform approach for the farms visits in NL and UK. This protocol was tested on a Dutch organic dairy farm. After the testing several adjustments were needed and finally it was standardized for the farm visits in NL and UK (Annex 2). At the end of the 2nd visit the farmer and the veterinarian / advisor filled answered a questionnaire on performance aspects of the toolbox.
Figure 1: Course of the test-phase
2.1 Farm selection in The Netherlands
• 30 organic dairy farms were randomly selected from a dataset of 358 Dutch organic dairy farms.
• In December 2015 a letter was sent to all 30 dairy farmers to inform them about the project and asking them for their interest in cooperating in the project.
• After approximately 7 days the 30 dairy farmers were contacted by telephone. We refer to the letter, explain the project and ask them if they want to cooperate.
FP7 - 311824 IMPRO Deliverable D6.5 / D6.6
IMPRO FP7-KBBE-2012-6 Page 5 of 27
o If yes, we explained that several requirement needed to be fulfilled before admitted to the study:
� Milk recording data needs to be available by CRV for at least the year 2015. � Farmer needs to give permission for using the milk recording data during the
project � A minimum herd-size of 30 and a maximum of 200 is required. � Dairy farming needs to be a main activity on the farm � Participation of the veterinarian
o If not, we will asked their reason
• When the farmer met the requirement the veterinarian of the farmer was contacted for their interest in cooperating in the project. When the veterinarian was willing to cooperate the farmer was selected to be involved in the project.
From the first 30 randomly selected organic dairy farms, a total of 10 farms were willing to participate in the study and fulfilled the requirements. Ten new dairy farms were randomly selected in January from the dataset of 358 organic dairy farms and were contacted as described earlier. Two more dairy farms could be selected that wanted to participate in the study and fulfilled the requirements. A total of 12 dairy farms were selected for farms visits.
2.2 Farm selection in the United Kingdom
• On May 3rd the researcher presented and introduced IMPRO to a group of farmers with high SCC levels who were already meeting to discuss to lower their SCC.
• 17 organic dairy farms were selected from Coombe farm milk pool (about half the suppliers). The selection was not random with the milk pool manager selecting farmers thought to be in need of improvement and those who might be most receptive.
• James Hanks of Panveeru consulting group provided milk recording records of the farmers and Coombe Farm provided additional information about disease prevalence to pre populate the tools as much as possible before farm visits were completed to collect outstanding data.
• Farmers chosen to participate were obliged to do so by the supply pool manager and so none declined to participate.
• Vets of each participant were contacted and invited to participate. As the farmers were in a relatively small geographical area, many shared the same vet. Vets proved unwilling to participate more than once. Andy King and Esther Jones of Coombe farm assumed the role of adviser for the farms were vets were not available or declined to participate.
From the 17 selected organic dairy farms, a total of 16 participated in the study and fulfilled the requirements. There were two cases where 3 farms were part of a larger group. Thus, 12 independent farm managers participated, representing 16 farms.
2.3 Tested configuration of the toolbox
The toolbox contains tools for different aspects of the complex challenge of herd health management. The tools are designed to be used by farm advisors and veterinarians as well as dairy farmers in a participatory manner. Therefore, farmers as well as their veterinarians and advisors were involved in the test-phase.
The limitations of a test-phase (e.g. short time period with no option for follow up consultations and checks) made it necessary to focus on four out of the six tools in the toolbox which could be tested

FP7 - 311824 IMPRO Deliverable D6.5 / D6.6
IMPRO FP7-KBBE-2012-6 Page 6 of 27
during one farm visit and to limit the scope of the application due to time-restrictions. The following tools and overviews were applied in the test-phase:
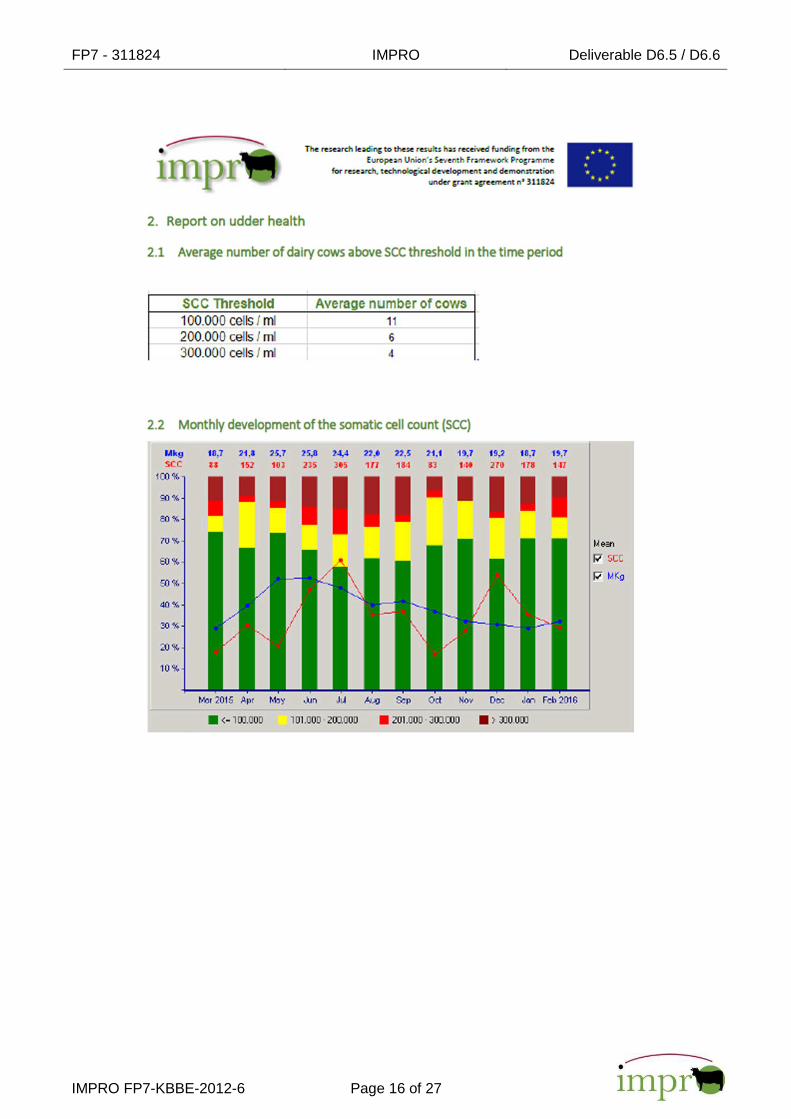
An overview on the herd health status was prepared with “HERDEplus” for each farm. The overview was based on the farms milk recording data and contained information on milk yield, somatic cell counts, udder health, nutrient supply, fertility and culling rates. The information was supplemented by results from the profitability assessment (Annex 1).
In the test phase, the impact matrix tool was applied with a limited set of variables to reduce the time requirements. Based on experiences in WP2, variables were merged to enable the demonstration and application of the approach (Figure 2). The reduced variable set, including definitions and indicators, was integrated in the software tool.
The cost-calculation tool was applied in its enhanced version (compared to the application in WP2), which includes the assessment of preventive costs and effects (see D5.3).
2.4 Assessment of the tools
In order to assess the usefulness and aspects of usability, a questionnaire was developed. Likert scales were used to assess the performance of each tool. A set of questions was elaborated to assess different aspects of the performance: the ease of use, ease of understanding, accuracy, new information, new insights, identification of key issues, lead to better / common understanding, increase awareness, time demands. The first three items are more linked to the performance of the software in terms of the ergonomic requirements covered by usability assessments. The latter performance aspects focus on the usefulness of the approach and the output of the tools. However, even these are linked to the principles which are important in terms of usability. Table 1 shows the relation between performance aspects measured with the questionnaire and the principles of usability.
Table 1: Performance aspects linked to principles fo r usability assessments according to ISO 9241
Performance aspects assessed suita
bilit
y
for
the
task
self-
desc
riptiv
enes
s
cont
rolla
bilit
y
conf
orm
ity w
ith
user
exp
ecta
tions
erro
r to
lera
nce
suita
bilit
y fo
r in
divi
dual
izat
ions
suita
bilit
y
for
lear
ning
Ease of use
Ease of understanding
Accuracy
New information
New insights
Identify the key issues
Leading to better / common understanding
Increases awareness
Time demands
= aspect of usability = aspect of usefulness
ISO 9241 principle s
Figure 2: Reduced variable set for the demonstration of the impact matrix approach in the test-phase

FP7 - 311824 IMPRO Deliverable D6.5 / D6.6
IMPRO FP7-KBBE-2012-6 Page 7 of 27
The questionnaire consisted of four parts: a set of Likert items for each tool to be answered on a five point scale from “Strongly agree” to “strongly disagree” and three Likert type questions on how the participants value the toolbox (Annex 3).
3 Results
3.1 Technical, economic and herd health figures of participating farms
All participating farms were organic dairy farms with a herd size from 36 to 468 dairy cows. The herd size differed considerably with bigger herds in UK, while the average milk production was slightly higher in NL farms (Table 2). UK farms reported more clinical cases of mastitis and a higher prevalence of lame cows.
Table 2: Herd size, performance and herd health fig ures of participating farms
UK NL
Average number of dairy cows Mean 253 71
Min - Max 118 468 36 117
Annual milk production per cow Mean 6.748 7.034
Min - Max 4.601 8.103 5.400 8.578
SCC 100.000 - 200.000 Mean 14% 38%
Min - Max 5% 23% 22% 55%
SCC 200.000 - 300.000 Mean 6% 21%
Min - Max 4% 12% 9% 36%
SCC > 300.000 Mean 11% 13%
Min - Max 5% 27% 6% 26%
Clinical mastitis cases Mean 32% 9%
Min - Max 13% 61% 3% 25%
Cases of ketosis Mean 12% 15%
Min - Max 0% 53% 1% 31%
Cases of severe lameness last year Mean 10% 6%
Min - Max 1% 26% 0% 17%
Cases of moderate lameness last year Mean 16% 9%
Min - Max 3% 63% 0% 19%
Calving interval Mean 386 391
Min - Max 107 436 368 437
3.2 Evaluation of questionnaires
In total 41 questionnaires on the toolbox were answered by the participants. 11 Farmers and 10 veterinarians from NL and 12 farmers, 3 advisors and 5 veterinarians from UK gave their feedback. Veterinarians and advisor were merged to one group for further assessments. Answers were assessed with SPSS 24. Answers were coded from 1 to 5, higher value for a more negative attitude.
Answers to Likert items were tested for reliability and items with poor corrected item-total correlation were excluded from the scales. Statistics are reported in Table 3.

FP7 - 311824 IMPRO Deliverable D6.5 / D6.6
IMPRO FP7-KBBE-2012-6 Page 8 of 27
Table 3: Mean, median and maximum permissible range values for Likert Scales, plus Cronbach’s Alpha Coefficient, for the whole sample
n
Number of questions included
in the scale
Maximum permissible
range Sample mean Sample median Chronbach’s Alpha
(Standardised)
Health status report 40 6 6 - 30 15.6 15.0 0.898
Impact matrix tool 39 10 10 - 50 30.7 30.0 0.899
Cost Benefit tool 39 9 9 - 45 21.5 21.0 0.928
The cost benefit tool was valued by the majority of the participants (65% answers in the two highest categories), followed by the health status report (50% positive answers). The impact matrix arrived at 34% positive answers.
Figure 3: Frequency of ratings in Likert scales for tools
The approach of the profitability assessment was demonstrated to the participants by the output of calculations based on their farm data. 49% of the participants valued the approach because it increased awareness of the options to improve in the farm specific context. 46% saw a support in management decisions.
Figure 4: Ratings for the profitability assessment
FP7 - 311824 IMPRO Deliverable D6.5 / D6.6
IMPRO FP7-KBBE-2012-6 Page 9 of 27
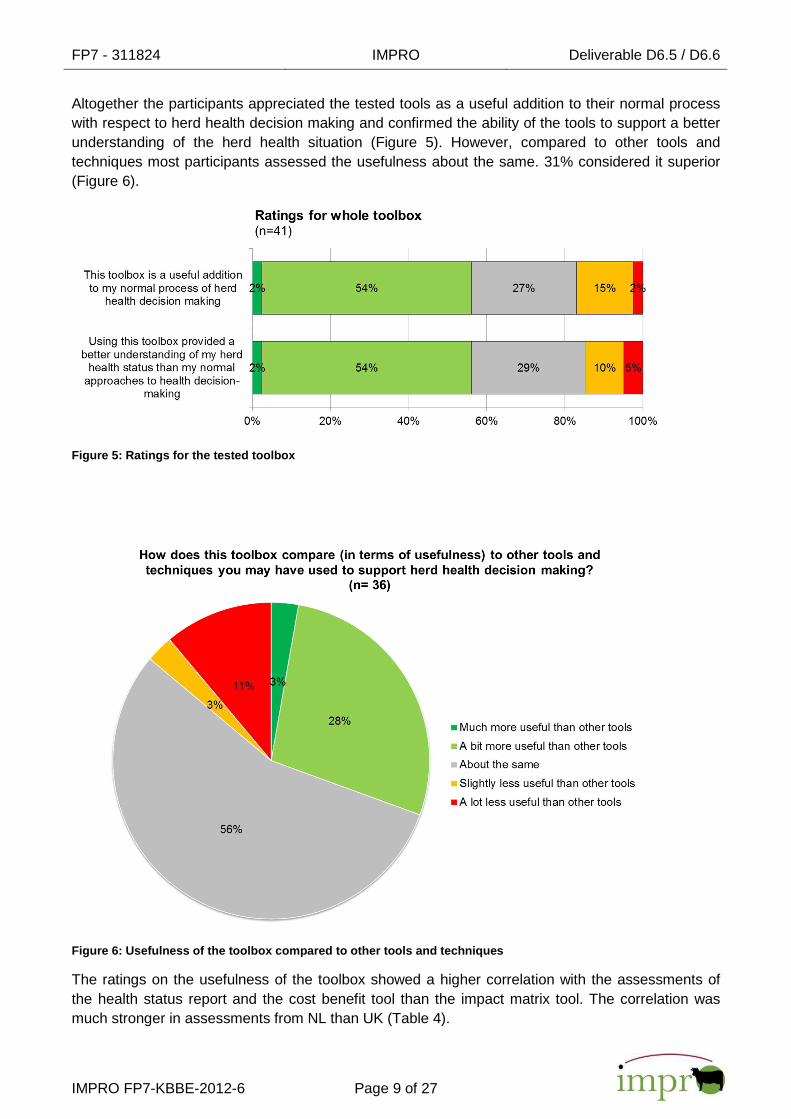
Altogether the participants appreciated the tested tools as a useful addition to their normal process with respect to herd health decision making and confirmed the ability of the tools to support a better understanding of the herd health situation (Figure 5). However, compared to other tools and techniques most participants assessed the usefulness about the same. 31% considered it superior (Figure 6).
Figure 5: Ratings for the tested toolbox
Figure 6: Usefulness of the toolbox compared to oth er tools and techniques
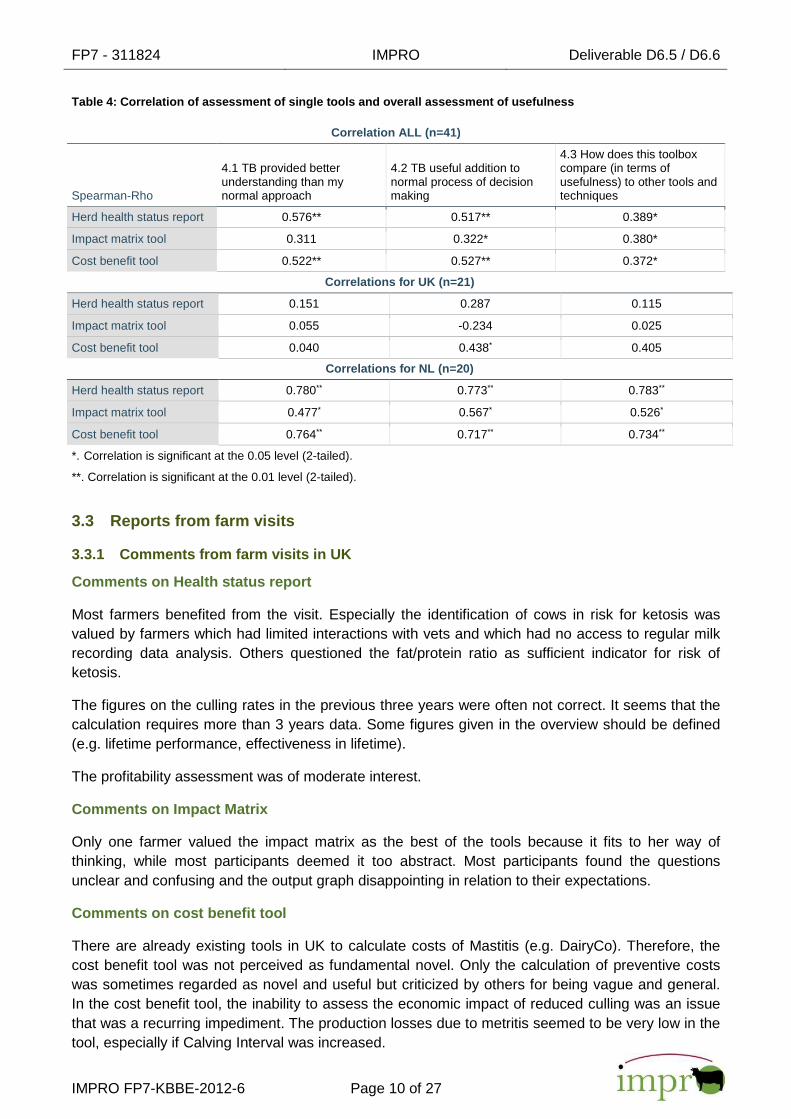
The ratings on the usefulness of the toolbox showed a higher correlation with the assessments of the health status report and the cost benefit tool than the impact matrix tool. The correlation was much stronger in assessments from NL than UK (Table 4).
FP7 - 311824 IMPRO Deliverable D6.5 / D6.6
IMPRO FP7-KBBE-2012-6 Page 10 of 27
Table 4: Correlation of assessment of single tools and overall assessment of usefulness
Correlation ALL (n=41)
Spearman-Rho
4.1 TB provided better understanding than my normal approach
4.2 TB useful addition to normal process of decision making
4.3 How does this toolbox compare (in terms of usefulness) to other tools and techniques
Herd health status report 0.576** 0.517** 0.389*
Impact matrix tool 0.311 0.322* 0.380*
Cost benefit tool 0.522** 0.527** 0.372*
Correlation s for UK (n=21)
Herd health status report 0.151 0.287 0.115
Impact matrix tool 0.055 -0.234 0.025
Cost benefit tool 0.040 0.438* 0.405
Correlation s for NL (n=20)
Herd health status report 0.780** 0.773** 0.783**
Impact matrix tool 0.477* 0.567* 0.526*
Cost benefit tool 0.764** 0.717** 0.734**
*. Correlation is significant at the 0.05 level (2-tailed).
**. Correlation is significant at the 0.01 level (2-tailed).
3.3 Reports from farm visits
3.3.1 Comments from farm visits in UK
Comments on Health status report
Most farmers benefited from the visit. Especially the identification of cows in risk for ketosis was valued by farmers which had limited interactions with vets and which had no access to regular milk recording data analysis. Others questioned the fat/protein ratio as sufficient indicator for risk of ketosis.
The figures on the culling rates in the previous three years were often not correct. It seems that the calculation requires more than 3 years data. Some figures given in the overview should be defined (e.g. lifetime performance, effectiveness in lifetime).
The profitability assessment was of moderate interest.
Comments on Impact Matrix
Only one farmer valued the impact matrix as the best of the tools because it fits to her way of thinking, while most participants deemed it too abstract. Most participants found the questions unclear and confusing and the output graph disappointing in relation to their expectations.
Comments on cost benefit tool
There are already existing tools in UK to calculate costs of Mastitis (e.g. DairyCo). Therefore, the cost benefit tool was not perceived as fundamental novel. Only the calculation of preventive costs was sometimes regarded as novel and useful but criticized by others for being vague and general. In the cost benefit tool, the inability to assess the economic impact of reduced culling was an issue that was a recurring impediment. The production losses due to metritis seemed to be very low in the tool, especially if Calving Interval was increased.

FP7 - 311824 IMPRO Deliverable D6.5 / D6.6
IMPRO FP7-KBBE-2012-6 Page 11 of 27
The two representatives of the supply pool who accompanied all farm visits judged the toolbox and especially the impact matrix tool generally negative.
3.3.2 Comments from farm visits in NL
Comments on Health status report
Some of the figures do not match with the data of the farmers. In the original CRV data, for example, the SCC is estimated on different ways. The health report does not make clear, which of the specific data they used. This will be important to be considered in future reports. In The Netherlands different cut-off values are used to identify healthy udders, new infections and heifer mastitis (250.000 for dairy cattle and 150.000 for heifers).
The results on F/P ratio are of interest. However in The Netherlands, CRV reports beside F/P ratio also if the cow is diagnosed with ketosis. The results presented may be outdated for Dutch dairy farmers.
The figure on the relation between milk protein and milk urea was positively conceived by the farmers and veterinarians. They make a nice distinction between summer and winter feeding.
Several farmers did recognize themselves in the numbers presented in the fertility data and analysis of culling. In the future it is particularly important that the definitions are made much clearer and that the farmers know exactly which data of CRV are used.
The comparison of sub-groups was received differently. Mainly when a clear difference was seen in milk production, farmers and veterinarians were interested in the results. Besides, the assessment was sometimes hampered by very small groups which makes a good comparison less convincing.
The profitability assessment was very interesting, although for some farmers the assessment provided weird results and asked for more information on the figures used and the calculation procedure. Providing the data which are required for the herd health report was quite a challenge for most farmers.
Comments on Impact Matrix
Although the implementation of the impact matrix was a struggle for both veterinarians and farmers, there were many positive feedbacks on the impact matrix. After going through the matrix, farmers and vets liked the way of thinking. Some farmers/veterinarians did not see the relevance of the whole process. Although it was perceived positive, a veterinarian indicated that it would not be suitable to go through with every farmers and that it is very time consuming. Therefore, it would be interesting to do it ones a year. Some variables were not relevant for some farmers, while other farmers missed variables which seemed important to them. Creating farm specific variables might be beneficial.
Comments on cost benefit tool
The reactions on the cost-benefit analysis were different. Some really appreciated the tool, others where less interested in it. Going through the possible prevention measures was really appreciated.
FP7 - 311824 IMPRO Deliverable D6.5 / D6.6
IMPRO FP7-KBBE-2012-6 Page 12 of 27
4 Feedback for improvements
4.1 Health status report
• Include data from more than 3 years • Eliminate bugs in data transfer • Explain indicators (e.g. fat / protein) • Provide definitions • Make cut-offs adjustable to national figures? • Improve quality of figures • More information on profitability assessment
4.2 Impact Matrix tool
• Provide documentation and introduction • Enable own variable sets • (provide different sets of variables)
4.3 Cost benefit tool
• Include impact of reduced culling rates • Review costs for metritis, accounting for increased calving interval • Ensure doubled waiting periods for organic farms
5 Workshops in The Netherlands and the United Kingd om
5.1 IMPRO Dissemination Workshop in the United King dom
The Dissemination Workshop in Great Britain took place at Abbey Manor Business Centre, Yeovil on 28 September 2016. Only four farmers and two advisors attended the workshop. Project team members presented summarized key findings of the final IMPRO workshop in Brussels as well as a summary from the test phase in The Netherlands and the United Kingdom.
In the discussion, the validity of cell count >200,000, the fat/protein ratio and 'all lameness' measure were questioned. In a discussion on better welfare indicators lameness was suggested but how it is measured needs to be carefully specified. Mastitis should be based on clinical cases based rather than cell count alone. A measure of cows with injuries – eg. hock damage was suggested as well as the number of cows who stop milking within 30/100 days of calving / first calving.
Another topic of the discussion was on the topic of organics perception with consumer as having better welfare. Participants pointed out that organic never really focused on welfare - its more about how you manage the land. Suggested: research on how organic dairy farmers perceive the welfare on their farm. The impact of farmer attributes; education, attitudes, beliefs and personality were discussed to have a high predictive power with welfare. Participants were more concerned in future changes in consumer’s views than the status quo - even though status is not satisfactory.
In the discussion of how to reach the goal of reduced prevalence of diseases, the participants requested information on bonus and penalty structure in different EU countries as the probable driver of difference in SCC. Participants preferred finance based rather legislative drivers because

FP7 - 311824 IMPRO Deliverable D6.5 / D6.6
IMPRO FP7-KBBE-2012-6 Page 13 of 27
they would be easier to do and more motivating. How to get those who purchase milk to implement was not discussed or the fact it is often sold as a commodity.
Regarding the toolbox the participants suggested that different tools should link together. A more mastitis specific impact matrix variable list could be gained from a UK mastitis management tool.
5.2 IMPRO Dissemination Workshop in the Netherlands
The IMPRO dissemination workshop took place on January 18, 2017 at the BioBeurs in the Netherlands. The Biobeurs is yearly organic national trade fair for those that do serious business on the organic market. Different organic businesses, non-governmental organisations, research institutes and universities are found on this event presenting the latest food products, technical innovations and research findings. Different workshops and presentation are organised during this fair and many different organisations demonstrate their products. Last year there were more than 9000 thousand visitors. From those 9000 visitors about 3500 are organic farmers and cultivators, 700 farmers who are changing to organic, 1000 from stores and retail, 400 are from the food service industry, 1600 are from wholesale business, 1500 from knowledge and research organisation, 400 from education, 250 from media and 200 from governmental organisations. This year the number of visitors increased with more than 8%.
The workshop was organised by Bionext together with Wageningen University & Research. Bionext is an organisation which connect the organic chain from farmer to consumer and are founded by “Biohuis” (farmers and horticulturists), “BioNederland” (producers and retail), “Biowinkelvereniging” (retailer association). The workshop took 2 hours in which Henk Hogeveen, Felix van Soest and Mariska van der Voort presented the background information of the IMPRO-project, the farm visits that took place in the Netherlands and the UK, the tools that were used, and the results of these farm visits. The last half hour of the workshop an interactive discussion with the audience based on several statements and questions took place. This resulted in a lively discussion about what the goal and dreams were of the participants concerning animal health in organic dairy farming and what was needed to achieve these goals. Around 30 people participated in the workshop, which were farmers, veterinarians, researchers and students.
6 Conclusions
The farm centric approach of the IMPRO project requires comprehensive data to calculate herd health figures, to perform the profitability assessment and to calculate failure and preventive costs with the cost-benefit module. In the test-phase it became clear that data formats and national conventions in calculating and reporting specific figures are a major challenge in the development of a software tool. The adjustment of an interface to import national milk recording data into “HERDEplus” required extensive exchange with national organisations. Even if the import of data was achieved, some assumptions remained unclear (e.g. differences between reported average number of dairy cows and number of cows in milk recording data).
While milk recoding data are standardized to some degree (at least at the national level), the figures on costs and revenues of the dairy business of a farm (to perform the profitability assessment) were difficult to obtain and raised several questions. The same applied for some information which is required for the cost-benefit module (e.g. the average feed price/costs, including concentrates and roughage or the replacement value of a dairy cow).

FP7 - 311824 IMPRO Deliverable D6.5 / D6.6
IMPRO FP7-KBBE-2012-6 Page 14 of 27
The groups of farmers and advisors as well as the national conditions varied between NL and UK. While farmers in NL volunteered for participation, the farms in UK were selected by the milk pool manager based on current health issues. This might partly explain differences in the assessments.
For both countries applies that in the current socio economic framework dairy farming aims at increased production and reduced costs, even in organic farming. The IMPRO tools are not aiming at production traits in the first place but at reducing the prevalence of production diseases, emerging from interaction in a farm system, while considering costs and benefits. This is a quite different approach in comparison to the predominant agricultural or even veterinary advisory approaches. Therefore, it was to be expected that the tools would not match all expectations the participants might have in mind for a decision support tool for dairy farming. Taking this into account the assessments are promising.
The test phase revealed valuable insights on weak points in the tools and the feedback are very valuable to be used for further improvements. At the same time it became clear that a new approach which is a tedious task because it forces participants to leave old path, change perspectives and deal with complexity and uncertainty, will only be broadly valued if other stakeholders (particularly retailers) put more pressure on the goal to reduce the prevalence of production diseases in organic dairy production which is urgently needed to justify the premium prices of organic labelled products.

FP7 - 311824 IMPRO Deliverable D6.5 / D6.6
IMPRO FP7-KBBE-2012-6 Page 15 of 27
Annex 1 - herd health report
FP7 - 311824 IMPRO Deliverable D6.5 / D6.6
IMPRO FP7-KBBE-2012-6 Page 16 of 27

FP7 - 311824 IMPRO Deliverable D6.5 / D6.6
IMPRO FP7-KBBE-2012-6 Page 17 of 27

FP7 - 311824 IMPRO Deliverable D6.5 / D6.6
IMPRO FP7-KBBE-2012-6 Page 18 of 27

FP7 - 311824 IMPRO Deliverable D6.5 / D6.6
IMPRO FP7-KBBE-2012-6 Page 19 of 27

FP7 - 311824 IMPRO Deliverable D6.5 / D6.6
IMPRO FP7-KBBE-2012-6 Page 20 of 27

FP7 - 311824 IMPRO Deliverable D6.5 / D6.6
IMPRO FP7-KBBE-2012-6 Page 21 of 27

FP7 - 311824 IMPRO Deliverable D6.5 / D6.6
IMPRO FP7-KBBE-2012-6 Page 22 of 27

FP7 - 311824 IMPRO Deliverable D6.5 / D6.6
IMPRO FP7-KBBE-2012-6 Page 23 of 27
Annex 2 - Outline for farm Visits in Test-phase WP6
2nd visit
Aim: test application of tools, assess usability and usefulness
Participants Farmer, Vet / Advisor, Researcher
Topic Duration
1 Explaining Usability test, goal of the test-phase, (handing out questions?)
Researcher 5 min
2 Short introduction of the toolbox
Researcher 5 min
3
Presentation of herd health situation based on milk recording data (The report includes the results from DSP profitability analysis on the last page, which should only be discussed later)
15 min
4 Fill in the Impact Matrix Farmer, Advisor 30 min
5 Short discussion on outcome of the Impact Matrix Researcher 10 min
6 Application of the Cost calculation tool Animal Health 30 min
7 Result from DSP Profitability assessment 10 min
8 Filling in questionnaire on usability
20 min
2’05

FP7 - 311824 IMPRO Deliverable D6.5 / D6.6
IMPRO FP7-KBBE-2012-6 Page 24 of 27
Annex 3 - Questionnaire on the usefulness of the IM PRO toolbox
IMPRO Farm No
Questionnaire answered by Farmer � Advisor �
I Please indicate your level of agreement or disagreement with the following statements regarding the Herd Health Status report
Strongly Agree
Agree Neutral Disagree Strongly Disagree
1.1 The figures in the health status report are easy to read. � � � � �
1.2 The information in the Health Status Report was easy to understand. � � � � �
1.3 The information in the herd health status report was a good representation of the herd health situation in my / this farm. � � � � �
1.4 The health status report provided me new information on the herd health situation on the farm. � � � � �
1.5 The Health Status Report increased my insight on the level of production diseases on my / this farm. � � � � �
1.6 The health status report helped me to identify those key issues that I most needed to focus on to manage herd health more effectively � � � � �
1.7 The health status report supported a better understanding of the herd health situation. � � � � �
1.8 The health status report increased awareness of the herd health condition. � � � � �
1.9 Reading and understanding the health status report was worth the time. � � � � �
1.10 The profitability assessment increased awareness of the options to improve in the farm specific context.. � � � � �
1.11 The information provided by the profitability assessment supports management decisions. � � � � �
FP7 - 311824 IMPRO Deliverable D6.5 / D6.6
IMPRO FP7-KBBE-2012-6 Page 25 of 27
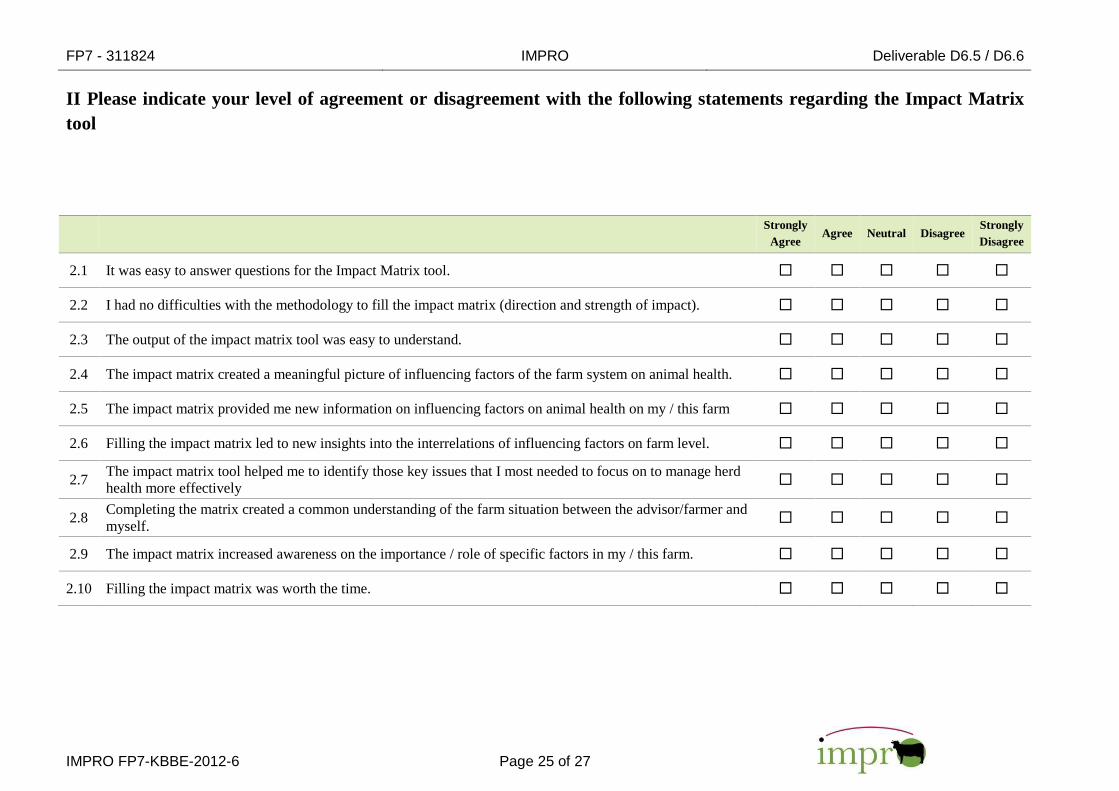
II Please indicate your level of agreement or disagreement with the following statements regarding the Impact Matrix tool
Strongly Agree
Agree Neutral Disagree Strongly Disagree
2.1 It was easy to answer questions for the Impact Matrix tool. � � � � �
2.2 I had no difficulties with the methodology to fill the impact matrix (direction and strength of impact). � � � � �
2.3 The output of the impact matrix tool was easy to understand. � � � � �
2.4 The impact matrix created a meaningful picture of influencing factors of the farm system on animal health. � � � � �
2.5 The impact matrix provided me new information on influencing factors on animal health on my / this farm � � � � �
2.6 Filling the impact matrix led to new insights into the interrelations of influencing factors on farm level. � � � � �
2.7 The impact matrix tool helped me to identify those key issues that I most needed to focus on to manage herd health more effectively � � � � �
2.8 Completing the matrix created a common understanding of the farm situation between the advisor/farmer and myself. � � � � �
2.9 The impact matrix increased awareness on the importance / role of specific factors in my / this farm. � � � � �
2.10 Filling the impact matrix was worth the time. � � � � �
FP7 - 311824 IMPRO Deliverable D6.5 / D6.6
IMPRO FP7-KBBE-2012-6 Page 26 of 27
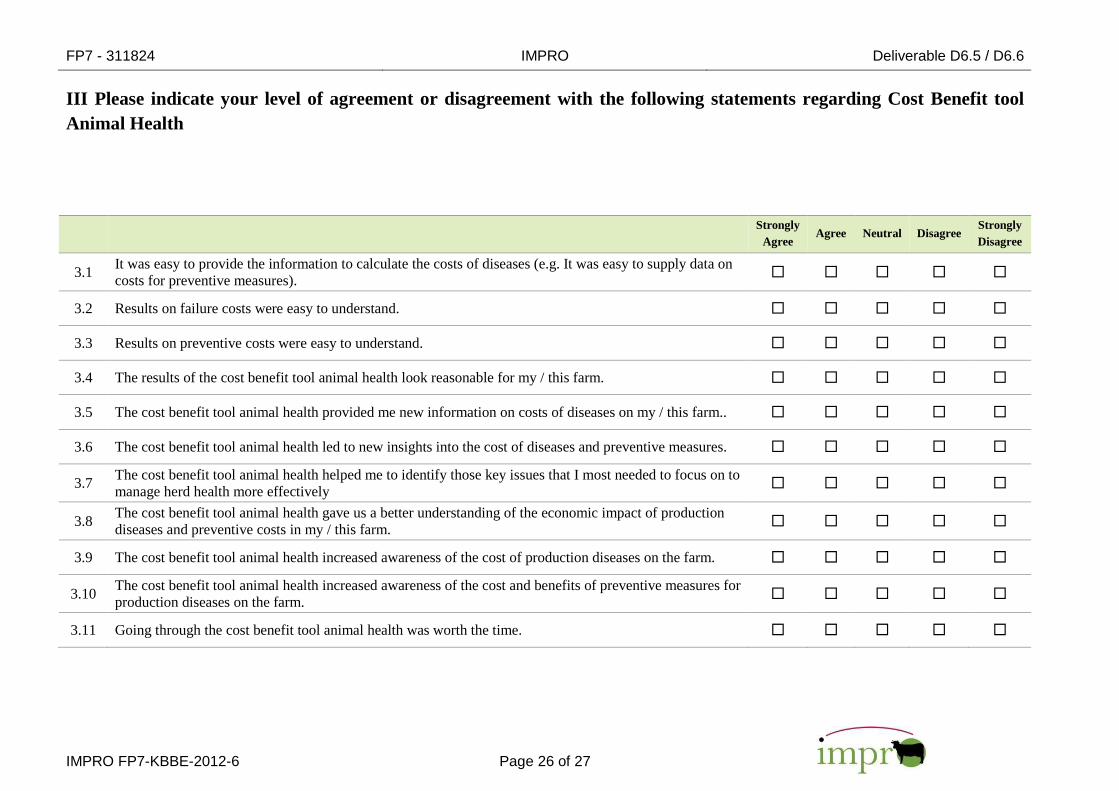
III Please indicate your level of agreement or disagreement with the following statements regarding Cost Benefit tool Animal Health
Strongly Agree
Agree Neutral Disagree Strongly Disagree
3.1 It was easy to provide the information to calculate the costs of diseases (e.g. It was easy to supply data on costs for preventive measures). � � � � �
3.2 Results on failure costs were easy to understand. � � � � �
3.3 Results on preventive costs were easy to understand. � � � � �
3.4 The results of the cost benefit tool animal health look reasonable for my / this farm. � � � � �
3.5 The cost benefit tool animal health provided me new information on costs of diseases on my / this farm.. � � � � �
3.6 The cost benefit tool animal health led to new insights into the cost of diseases and preventive measures. � � � � �
3.7 The cost benefit tool animal health helped me to identify those key issues that I most needed to focus on to manage herd health more effectively � � � � �
3.8 The cost benefit tool animal health gave us a better understanding of the economic impact of production diseases and preventive costs in my / this farm. � � � � �
3.9 The cost benefit tool animal health increased awareness of the cost of production diseases on the farm. � � � � �
3.10 The cost benefit tool animal health increased awareness of the cost and benefits of preventive measures for production diseases on the farm. � � � � �
3.11 Going through the cost benefit tool animal health was worth the time. � � � � �
FP7 - 311824 IMPRO Deliverable D6.5 / D6.6
IMPRO FP7-KBBE-2012-6 Page 27 of 27
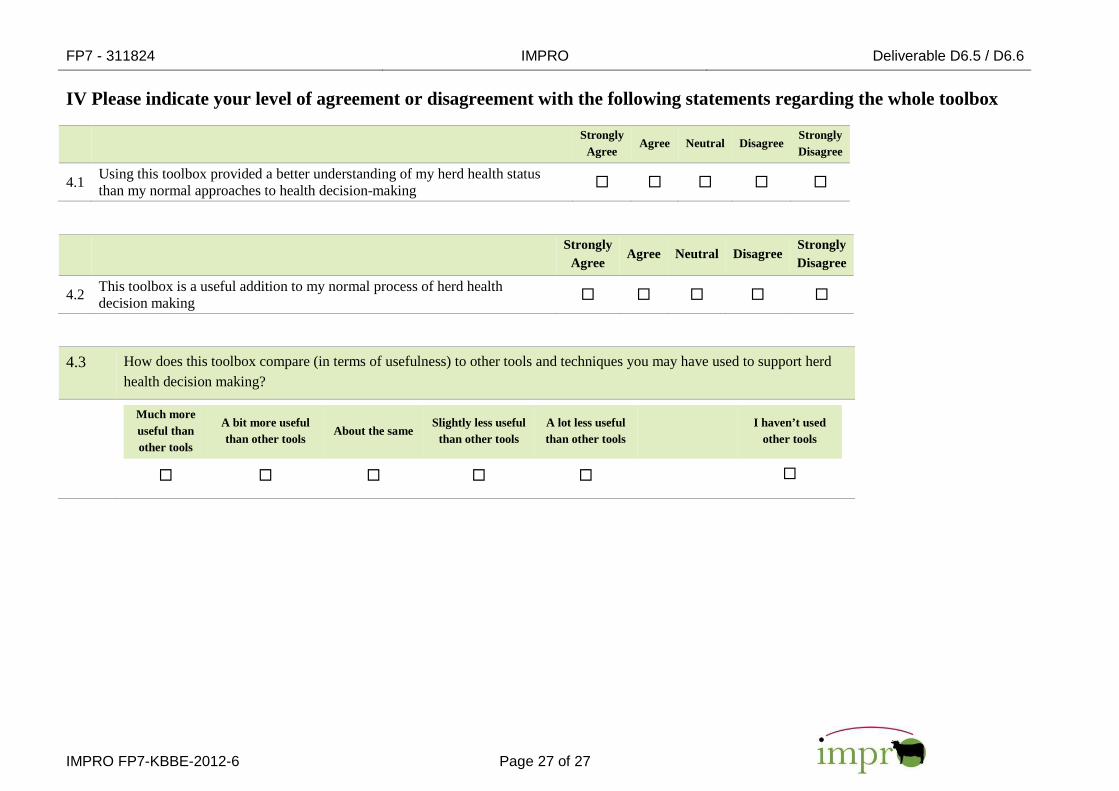
IV Please indicate your level of agreement or disagreement with the following statements regarding the whole toolbox
Strongly Agree
Agree Neutral Disagree Strongly Disagree
4.1 Using this toolbox provided a better understanding of my herd health status than my normal approaches to health decision-making � � � � �
Strongly
Agree Agree Neutral Disagree
Strongly Disagree
4.2 This toolbox is a useful addition to my normal process of herd health decision making � � � � �
4.3 How does this toolbox compare (in terms of usefulness) to other tools and techniques you may have used to support herd health decision making?
Much more useful than other tools
A bit more useful than other tools
About the same Slightly less useful
than other tools A lot less useful than other tools
I haven’t used
other tools
� � � � � �