drivers of seasonal and event scale doc dynamics at the
TRANSCRIPT
1
Drivers of seasonal and event scale DOC dynamics at the outlet of
mountainous peatlands revealed by high frequency monitoring Thomas Rosset 1, Stéphane Binet 2, Jean-Marc Antoine 3, Emilie Lerigoleur 3, François Rigal 4, Laure
Gandois 1
1 EcoLab, Université de Toulouse, CNRS, Toulouse, 31326, France 5 2 Université d’Orléans, CNRS/INSU, BRGM, ISTO Orléans, 45071, France 3 GEODE, Université de Toulouse, CNRS, Toulouse, 31058, France 4 IPREM, Université de Pau et des Pays de l'Adour, CNRS, Pau, 64000, France
Correspondence to: Thomas Rosset ([email protected])
Abstract. Peatlands store about 20 % of the global soil organic carbon stock and are an important source of dissolved organic 10
carbon (DOC) for inland waters. Recent improvements for in situ optical monitoring revealed that the DOC concentration in
streams draining peatlands is highly variable, showing seasonal variation and short and intense DOC concentration peak
periods. This study aimed to determine the variables driving stream DOC concentration variations at seasonal and event scales.
Two mountainous peatlands (one fen and one bog) were monitored in the French Pyrenees to capture their outlet DOC
concentration variability at a high frequency rate (30 min). Abiotic variables including precipitation, stream temperature and 15
water level, water table depth and peat water temperature were also monitored at high frequency and used as potential
predictors to explain DOC concentration variability. Results show that at both sites, DOC concentration time series can be
decomposed into a seasonal baseline interrupted by many short and intense peaks of higher concentrations. The DOC
concentration baseline is driven, at the seasonal scale, by peat water temperature. At the event scale, DOC concentration
increases are mostly driven by water table increases within the peat at both sites. Univariate linear models between DOC 20
concentration and peat water temperature or water table increases show greater efficiency at the fen site. Water recession times
were derived from water level time series using master recession curve coefficients. They vary greatly between bog and fen
but also within one peatland site. They partly explain the differences between DOC dynamics in the studied peatlands,
including porewater DOC concentrations and the links between stream DOC concentration and water table rise. This highlights
that peatland complexes are composed of a mosaic of heterogeneous peat units distinctively producing or transferring DOC to 25
streams.
1. Introduction
Aquatic carbon transfer from terrestrial ecosystems to inland waters is receiving increasing attention as it plays a major role in
the watershed carbon balance (Webb et al., 2018) and in the global carbon cycle (Cole et al., 2007; Drake et al., 2017). The
origin of aquatic carbon has been tracked and wetlands have been shown to be the main organic carbon suppliers to rivers at 30
both local (Hope et al., 1997; Laudon et al., 2004; Ledesma et al., 2017) and continental scales (Hope et al., 1994; Spencer et
al., 2013). Peatlands are specific wetlands which have accumulated organic matter through slow vegetation decomposition
https://doi.org/10.5194/bg-2019-372Preprint. Discussion started: 8 October 2019c© Author(s) 2019. CC BY 4.0 License.
2
processes (Joosten and Clarke, 2002; Limpens et al., 2008). Peatlands grow under different climates (Broder et al., 2012;
Dargie et al., 2017; Gorham, 1991; Page et al., 2011) and store about 21% of the total global soil carbon stock (Leifeld and
Menichetti, 2018). Stream outlets of peatlands have been monitored at different latitudes (Billett et al., 2006; Leach et al.,
2016; Moore et al., 2013) in order to quantify and understand the aquatic carbon transfer between these organic carbon rich
pools and their draining streams. Dissolved organic carbon (DOC) is a key component of these fluxes as it contributes to more 5
than 80% of the aquatic carbon exported from peatlands (Dinsmore et al., 2010; Hope et al., 2001; Müller et al., 2015; Roulet
et al., 2007). At the outlet of peatlands, DOC is not only considered for its role in the carbon balance but also because it may
be an issue for water treatment quality (Ritson, 2015) and a conveyor of potentially harmful elements along inland waters
(Broder and Biester, 2017; Rothwell et al., 2007; Tipping et al., 2003).
Variability in the DOC concentration signals at the outlet of peatlands has been observed at the inter-annual (Fenner and 10
Freeman, 2011; Köhler et al., 2008), the seasonal (Leach et al., 2016; Tipping et al., 2010) and even the event scales (Austnes
et al., 2010; Dyson et al., 2011). Different drivers have been identified depending on the latitude of the studied peatland sites
and the time scale considered. DOC concentrations were found to be negatively correlated with discharge in boreal systems
(Köhler et al., 2008), positively correlated with discharge in temperate areas (Clark et al., 2007) or non-correlated with
discharge in mountainous areas (Rosset et al., 2019). Temperature was also reported as an important driver of seasonal 15
variations of DOC concentration in field (Billett et al., 2006) and mesocosm (Pastor et al., 2003) experiments since DOC
production is boosted by a greater microbial activity during warmer periods. Higher temperatures were also shown to enhance
evapotranspiration from peatland resulting in a rise in DOC concentration in peat porewater and stream waters during dry
summer periods (Fraser et al., 2001). Finally, other studies documented the importance of water table level fluctuations
(Bernard-Jannin et al., 2018; Kalbitz et al., 2002; Strack et al., 2008) and acrotelm oxygenation (Freeman et al., 2001) in DOC 20
production and mobilization to streams.
DOC concentration monitoring at the outlet of peatlands has generally consisted in a weekly or monthly stream water sampling
routine (Clark et al., 2008; Juutinen et al., 2013). Higher frequency sampling has been restricted to specific high precipitation
events (Austnes, 2010; Clark et al., 2007) or snowmelt (Laudon et al., 2004). Recently, new optical in situ sensors (Rode et
al., 2016) were used to track DOC concentration at a high frequency rate (~30 minutes) at the outlet of peatlands (Koehler et 25
al., 2009; Ryder et al., 2014; Tunaley et al., 2016), highlighting the strong variability of the DOC concentration signal over a
year. While diel DOC concentration cycles have been analyzed under steady hydrological conditions (Tunaley et al., 2018),
no analysis has yet been performed to understand the high frequency variability of the DOC concentration at a multi-year scale.
Mountains host many small peatland areas that are often neglected in global peatland assessments but which drastically
influence stream chemistry in headwater catchments (Rosset et al., 2019).The harsh mountainous climatic conditions (from 30
the montane to the alpine belt (Holdridge, 1967)) and the relief of those areas generate high gradients of different abiotic
parameters (temperature, precipitation, hydrology). Furthermore, seasonal climatic conditions are contrasted, making it
possible to differentiate seasonal from event scale stream DOC concentration variability. The present study aimed at
disentangling the mechanisms driving DOC concentration observed at the outlet of two peatlands in the French Pyrenees
https://doi.org/10.5194/bg-2019-372Preprint. Discussion started: 8 October 2019c© Author(s) 2019. CC BY 4.0 License.
3
mountains. A bog and a fen were monitored for stream DOC concentration using an optical high frequency in situ sensor
placed at their outlet. The scientific objectives of this study were (1) to identify the main abiotic parameters driving stream
DOC concentration variability at each site, (2) to identify the temporal scale of these drivers, and (3) to compare the DOC
concentration patterns between a bog and a fen.
2. Study sites 5
The peatland of Bernadouze (Fig.1-b) is situated in the Eastern part of the French Pyrenean mountains (42°48'9" N; 1°25'25"
E). The peatland lies at 1343 m.a.s.l. It belongs to a 1.4 km² watershed on limestone rocks dominated by the Mont Ceint =2088
m.a.s.l. and particularly steep (average slope=50%). From a post-glacial lake, a fen developed for 10 000 years at Bernadouze
site, reaching a peat accumulation depth of 2 m in average and more than 9.5 m at extreme locations (Jalut et al., 1982; Reille,
1990). As surficial runoff contributes to the water supply of the peatland, it is considered as a soligenous (minerotrophic) fen 10
(Joosten and Clarke, 2002). The fen is subject to an oceanic climatic influence but weather conditions can locally be contrasted
due to the specific mountainous topography. For the years 2015 to 2018, the mean annual temperature was 7.9±0.3 °C and the
mean annual precipitation was 1797±265 mm. Sub-zero temperatures and snow events are regularly observed at Bernadouze
site from mid-October to mid-May with a snow cover lasting around 85 days (Gascoin et al., 2015) from December to April
and sometimes exceeding 2m in height. Beech forest is the dominant vegetation cover in the watershed, except for the highest 15
grassland areas (> 1800 m) and the 4.7 ha of the peatland. Vegetation on the peatland is mainly composed of species
characteristic of minerotrophic peatlands such as Carex demissa and Equisetum fluviatile. However, some ombrotrophic
species such as Sphagnum palustre and Sphagnum capillifolium are observed on the southern part of the peatland, forming
small hummocks and revealing a progressive disconnection with the stream and the water table supply. Logging activities were
carried out during the autumn 2016 in the lowest forested area surrounding the peatland. 20
The peatland of Ech (Fig.1-c) culminates at 710 m.a.s.l. in the west-central part of the French Pyrenees (43°4'59" N; 0°5'39"
W). Dominated to the North by mount Cossaout (1099 m.a.s.l.), the peatland depends on a 0.86 km² watershed principally
composed of grasslands and grazing areas. The bog area is 5.3 ha and the peat deposit reaches 3.3 m in the center (Millet et
al., 2012). Peat formation started about 8200 years ago from a post glacial lake dammed by a recessional moraine in the South
(Rius et al., 2012). The peatland is classified as a bog since the surface vegetation depends only on water supplied by 25
precipitation. The site experiences a mountainous oceanic climate characterized by an average annual temperature of 11±0.2
°C and an annual precipitation of 1242±386 mm (data from 2015 to 2018). Sub-zero daily mean temperatures are rare (~10
days a year) and snow events are sparse in Ech. From the model of (Gascoin et al., 2015), the average duration of snow cover
does not exceed 10 days at this altitude in the Pyrenees. The vegetation observed is typical of ombrotrophic bogs with a large
blanket of Sphagnum Capillifolium and Sphagnum Compactum. Small birches and hummocks of Molinia caerulea have started 30
to develop within the peatland. Many burning events have been reported on the peatland since its formation (Rius et al., 2012).
Nowadays, agro-pastoral practices still use fire to limit the vegetation height and Molinia caerulea extension. The last burning
https://doi.org/10.5194/bg-2019-372Preprint. Discussion started: 8 October 2019c© Author(s) 2019. CC BY 4.0 License.
4
event at the Ech site occurred 8 weeks before the stream monitoring in April 2017 and concerned the North Eastern half of the
peatland. A second burning event occurred in February 2019 in the Western area of the site. It was decided to stop data
acquisition just before the fire to avoid potential shifts in DOC concentration induced by this anthropogenic disturbance
(Brown et al., 2015).
3. Material and methods 5
3.1. Site instrumentation
This article presents high frequency data monitored from the 1st September 2015 to 31st December 2018 at Bernadouze site
and from 22nd May 2017 to 19th February 2019 at Ech site. Precipitation (liquid and solid) and air temperature were recorded
every 30 minutes at Bernadouze (Gascoin and Fanise, 2018) and every 60 minutes at Ech by automatic weather stations located
respectively 300 and 15 meters from the peatlands in open areas. At both sites, sensor failures prevented data acquisition and 10
gap-filling models were used to complete the datasets. For precipitation data, a linear model (r²=0.99, p-value< 0.01) based on
cumulative precipitation recorded in Saint Girons (414 m.a.s.l, 42°58'58”N, 1°8'45”E) was built to generate total daily
precipitation in Bernadouze. A similar model was built in Ech (r²=0.99, p-value< 0.01) based on data recorded in Ossen (517m,
43°4’0”N, 0°4‘0”W). Missing air temperature data were estimated at Bernadouze from a linear regression model (r²=0.99, p-
value< 0.01) based on data monitored at the same rate under the forest canopy 100 m away from the main weather station. In 15
Ech, daily mean temperatures were estimated using a linear regression model (r²=0.88, p-value< 0.01) with daily mean
temperature recorded in Tarbes (360 m.a.s.l. 43°10’55”N, 0°0’2”W).
At the outlet of each peatland, a multiparameter probe (Ysi Exo2, USA) measured fluorescence of the organic matter (fDOM,
λexcitation=365±5 nm / λemission=480±40 nm), turbidity, water level and temperature every 30 minutes. Wiper sensors
prevented the optical sensors from biofouling before each measurement and the probes were inspected and calibrated monthly. 20
At both sites, a network of piezometer wells (8 in Bernadouze and 4 in Ech) were used to record hourly the water table depth
and the water temperature with automatic probes (Orpheus Mini Water Level Logger, OTT HydroMet, Germany). Piezometer
locations were defined to be representative of the different topographic and vegetation surfaces observed on each peatland
(hummocks, lawns, river banks).
3.2. Water sampling and DOC calibration 25
Grab water sampling was performed every two weeks at the outlet of Bernadouze peatland and every two months at the outlet
of Ech. Piezometer wells ([1.5, 2.5] m depth (Fig.1)), were used to sample peat water on four occasions (2013, 2014, 2015,
2018) in Bernadouze and on two occasions (2017, 2019) in Ech during stream baseflow periods. Grab water was collected
using a manual peristaltic pump and was directly filtered on site using 0.22 µm cellulose acetate filters (GSWP04700, Merck-
Millipore, USA). To avoid contamination from cellulose, the first millimeters of filtered water were discarded. Water samples 30
were brought back to the laboratory in a cool box and were stored at 6°C until analysis. High resolution water sampling was
https://doi.org/10.5194/bg-2019-372Preprint. Discussion started: 8 October 2019c© Author(s) 2019. CC BY 4.0 License.
5
performed during 9 flood events at the outlet of Bernadouze and once at Ech using automatic water samplers (ISCO 3700,
USA) to collect water during various hydrological conditions. Each flood sampling event consisted in collecting 24 samples
of raw water (950 mL) at a frequency defined thanks to the observed timelag of discharge (1 hour for rainfall and 4 hours for
snowmelt driven flood events). Flood water samples were collected within the 48 hours following the previous sampling and
processed as grab water samples at the laboratory. 5
For all samples (grab and flood samples), non-purgeable organic carbon (NPOC, referred to hereafter as DOC) concentration
was analyzed in filtered samples after acidification to pH 2 with a TOC-5000A analyzer (Shimadzu, Japan). The quantification
limit was 1 mg. L-1. Reference material included ION-915 and ION96.4 (Environment and Climate Change Canada, Canada).
The fluorescence of DOM (fDOM) data was explored for potential adjustments for temperature, inner filter effect and turbidity
(Downing et al., 2012; de Oliveira et al., 2018; Watras et al., 2011). fDOM data were corrected for temperature as described 10
by (de Oliveira et al., 2018). The inner filter effect was adjusted at Ech for data showing absorbance values at 254 nm higher
than 0.6 (de Oliveira et al., 2018). Lastly, fDOM data recorded during the turbidity events (>20 FNU) were ignored in the
analysis as the fluorescence can be drastically attenuated by the presence of particles (Downing et al., 2012). High frequency
DOC concentrations were calculated at each site using a site specific linear model ([DOC]=a*fDOM+b) linking corrected
fDOM data to DOC concentration in flood and grab-water samples. The two models are respectively described by the following 15
parameters: (a=0.192, b=-0.031, number of observations =174, r²=0.93, p-value<0.001) for Bernadouze and (a=0.294, b=-
1.39, number of observations =27, r²=0.78, p-value<0.001) for Ech.
3.3. Water level fluctuation characterization
In order to provide an overall characterization of the peatlands, a mean water table depth, as well as a mean water temperature
was calculated at each site by averaging water table depths and water temperature data at a given time from the set of 20
piezometer probes. Calculations were performed only when all sensors were running (94% of the time period in Bernadouze
and 100% in Ech). Hereafter, the mean water temperature in the piezometers is assimilated to peat water temperature.
Master Recession Curve (MRC) analyses were performed on water table and stream level time series, using the MRCTools
v3.1 software (Posavec et al., 2017). The MRC represents the average recession of the water level observed when only
discharge flow occurs (no recharge). An exponential master recession curve was used to adjust the observed average MRC 25
and to define a specific recession coefficient (α, unit=day-1) characteristic of each monitoring point (Eq.(1)).
𝑀𝑎𝑠𝑡𝑒𝑟 𝑅𝑒𝑐𝑒𝑠𝑠𝑖𝑜𝑛 𝐶𝑢𝑟𝑣𝑒 ⇔ 𝑊𝑎𝑡𝑒𝑟 𝑙𝑒𝑣𝑒𝑙 = 𝑓(𝑡) = 𝐾 ∗ 𝑒−𝛼𝑡 (1)
The exponential recession coefficient corresponds to the inverse of the average water recession time, called recession time, in
the area of a piezometer or in a stream after a precipitation event. In the following, the recession time coefficient (1/α) is used
to characterize the hydraulic properties of peatlands and stream. 30
https://doi.org/10.5194/bg-2019-372Preprint. Discussion started: 8 October 2019c© Author(s) 2019. CC BY 4.0 License.
6
3.4. DOC peak selection and characterization
Peak selections in the DOC concentration time line were performed running Python 3.6 (Python Software Foundation, 2019)
scripts using the function find_peak available in the ScipY Signal library (Jones et al., 2001) and the arithmetic mean of the
DOC concentration signal (DOC_mean) as an input parameter. Peak selection criteria were: to reach DOC_mean concentration
and have a prominence higher than 0.25 times DOC_mean. Peaks occurring during an interval shorter than 12 hours apart were 5
grouped under the highest DOC concentration peak. Each DOC concentration peak was defined by the time period delimited
by the two nearest low points surrounding the peak event. Low points were located on the DOC concentration time lines by
applying the find_peak function on the negatively transformed (-1*) DOC concentration signal previously processed with a
Savitzky-Golay filter (window-length=23 and polyorder=2). Low points occurring during an interval shorter than 12 hours
apart were grouped under the lowest DOC concentration point. Lastly, the DOC peak period could be manually adjusted to fit 10
or correct a peculiar peak pattern. A DOC concentration peak period was characterized by different metrics (Fig.2): its initial
value corresponding to the DOC concentration of the low point at the start of the peak period (DOC_initial), its maximum
value corresponding to the DOC peak value (DOC_max), its range (DOC_increase) which was calculated by subtracting the
initial value from the maximum value and finally by the rising time duration (rising_limb) which separates the initial low point
time from the peaking time. In this study, initial values and increases of DOC were the targeted variables to be explained. 15
Initial values of DOC were used to determine a DOC concentration baseline (Fig.2). The following classification was used to
describe seasonal variations: winter (December, January, February), spring (March, April, May), summer (June, July, August),
and autumn (September, October, November).
3.5. Explanatory variables selection and characterization
In order to investigate DOC concentration variabilities (at two temporal scales: peak event and seasonal), nine explanatory 20
variables were selected. These variables were extracted from DOC concentration, stream water level, mean water table, stream
temperature, air temperature, peat water temperature and precipitation time lines measured at each site. DOC peak events were
reported on each time line and variables were calculated for each event using metrics similar to those previously described in
the DOC peak characterization section (Fig.2).
The variables were chosen because they have been reported in the literature to have an explanatory potential for stream DOC 25
concentration variability (Table 1). Two categories of variables were distinguished depending on whether the process they
described was related to the production of DOC within peatlands or to the transfer of DOC from peatlands to streams. After
sensitivity tests and in accordance with the observations of (Tunaley et al., 2018), a mean of seven days prior to the event was
defined as the best operator to characterize air and stream water temperatures.
https://doi.org/10.5194/bg-2019-372Preprint. Discussion started: 8 October 2019c© Author(s) 2019. CC BY 4.0 License.
7
3.6. Correlation and statistical modeling
Relationships between targeted variables (DOC_increase and DOC_initial) and the explanatory variables were investigated
using ordinary least squares (OLS) multiple regression analyses. Prior to the analyses, variables which did not satisfy a normal
distribution were log or square root transformed to improve normality (Table 1). Multicollinearity was assessed among all the
predictors using Pearson correlation with a threshold |r<0.7| following (Dormann et al., 2013). When two variables were found 5
to be collinear, we selected the one that displayed the highest absolute correlation with the targeted variables. Then at both
sites, all variables were standardized to a mean of zero and a standard deviation of one to derive comparable estimates in the
following analysis. We performed a backward stepwise selection procedure on the full model (i.e. the model including the
variables retained after removing multicollinearity) to capture the best set of variables explaining each targeted variable. At
each step of the procedure, the non-significant variables (p-value>0.05) with the highest p-value were dropped from the model 10
and the resulting reduced model was re-evaluated. This process was continued until there were no non-significant variables
remaining in the final model. To account for the time dependency of the variables in the analyses, time was also included as
an explanatory variable in the full model. This variable corresponds to the duration which separates each DOC peak event
from the start of the time line. Residuals of the final models were surveyed in order to detect deviations from normality and
homoscedasticity and to identify outliers. No specific deviations or outliers were detected. Model residuals were also checked 15
for autocorrelation to verify the absence of any cyclical variation in the variables set. When more than one variable was retained
in the final model , the relative contribution of each variable was assessed using hierarchical variance partitioning (Chevan
and Sutherland, 1991). According to the previous predictor selections for the MLR models of DOC concentration increases
(DOC_increase), OLS regression analyses were performed at each piezometer plot of a peatland site, replacing the mean water
table increase variable by the specific water level increase values of each plot. Similar OLS regression analyses were performed 20
at the outlet of streams by replacing the mean water table increase variable by the stream water level increase when necessary.
R² and relative importance (%) of the water level increase variable were reported for each OLS regression tested. All the
analyses were undertaken in R (R Core team, 2019) using the package rms (Harell, 2019) and relaimpo (Groemping and
Matthias, 2018).
4. Results 25
4.1. Description of temperature, precipitation, water table and DOC time series
Climatic variables are contrasted between the two studied areas. In 2018, temperatures were higher in Ech than in Bernadouze
with an annual mean air temperature, water temperature and peat water temperature respectively of 11.3, 10.7,11.9 °C
compared to 7.9, 7.1, 7.7 °C. This contrasted with total precipitation which reached 2151 mm in Bernadouze and 1140 mm in
Ech. In these steep mountainous headwaters, short and intense flood events were triggered by strong precipitation events and/or 30
the snowmelt. Over the whole timelines, the maximum and mean of the stream water level were respectively 1.36 and 0.35 in
https://doi.org/10.5194/bg-2019-372Preprint. Discussion started: 8 October 2019c© Author(s) 2019. CC BY 4.0 License.
8
Ech and 0.81 and 0.10 m in Bernadouze. These short flood events were followed by recession sequences revealed by the slow
decreases in the water table at both sites, especially in late summer and autumn (Fig.3-c). The average and minimum of the
water table depth in the two piezometer networks were respectively -0.23 and -0.43 m at Ech, and -0.15 and -0.45 m in
Bernadouze. At both sites, no clear relationship was observed between the stream and the water table time series. For a given
precipitation amount, the water levels responded differently depending on the season. For instance, a strong flood observed in 5
the stream can be contiguous with a low or high water table rise (i.e. July 2016 and February 2017 events in Bernadouze)
(Fig.3 b -c).
DOC concentration was highly variable at both sites during the monitored periods as highlighted by the numerous short DOC
peak events (~30 hours duration) in the two time series (Fig.3 and Table 2). At Bernadouze site, DOC concentration peaks
showing higher values were more frequent from April to November while this was less obvious at Ech site where DOC 10
concentration also peaked during winter. In 2018, the arithmetic means and flow weighted averages of DOC concentration
were clearly higher at the outlet of Ech, reaching 7.1±6.1 and 4.6 mg L-1, than in Bernadouze where they were 2.0±1.5 and 1.7
mg L-1.
4.2. DOC concentration peaks characterization
Peak characterization (Table 2) revealed that the increases and maxima of DOC concentration peaks were on average two 15
times higher in Ech than in Bernadouze. However, the ratio between the mean increase and the mean initial value of DOC
concentration was higher in Bernadouze (2.3) compared to Ech (1.9). DOC concentration peaks occurred more often at
Bernadouze compared to Ech (0.24 vs 0.16 peak per day in average) while their duration was slightly longer (32±14 vs 28±16
hours). Rising limbs of DOC concentration peaks lasted on average 10±5 and 13±14 hours at Bernadouze and Ech respectively
and they were slightly longer than the stream water rising limb averages monitored at the outlet of the two peatlands. In 20
contrast, rising limb duration of the water table in Ech was clearly longer (22 ±12) compared to Bernadouze (13±7 hours).
General mean and seasonal means of initial DOC concentrations were 2.5 and 3.1 times higher at Ech compared to Bernadouze
(Table 3). However, at both sites, DOC_initial showed a clear seasonal variability. The lowest values were observed in spring
and the highest in autumn while in summer and winter DOC concentration was close to the annual mean. DOC peak event 25
frequencies also varied at the seasonal scale (Table 3). The highest frequencies were reported in autumn at both sites. The
lowest peak frequencies were observed in winter at Bernadouze and in summer at Ech.
4.3. DOC concentration variations models
Prior to multiple regression analyses, the air temperature over 7 days, the stream water level maximum and the initial level of
the water table were excluded from the analysis because of their strong correlation with other variables (Pearson’s correlation 30
|r > 0.7|) (Fig.A1). Multiple linear regressions (MLR) followed by backward stepwise selections showed that respectively 55%
and 44% of the seasonal variation of DOC (DOC_initial) was explained by the final models at Bernadouze and Ech (Table 3).
https://doi.org/10.5194/bg-2019-372Preprint. Discussion started: 8 October 2019c© Author(s) 2019. CC BY 4.0 License.
9
Peat water temperature was reported as an important predictor at both sites (72% of the variance explained by the final model
at Ech and 44% at Bernadouze). In Bernadouze, variance is similarly explained by the time between two peaks (44%). Along
the two years of monitoring in Ech, the strong DOC concentration values observed during the dry autumn 2018 (Fig.2) created
a positive general trend in the DOC concentration baseline. This peculiar trend drastically influenced the statistical analysis
and consequently the variable “time” became a significant predictor at the seasonal scale. Considering the high relative 5
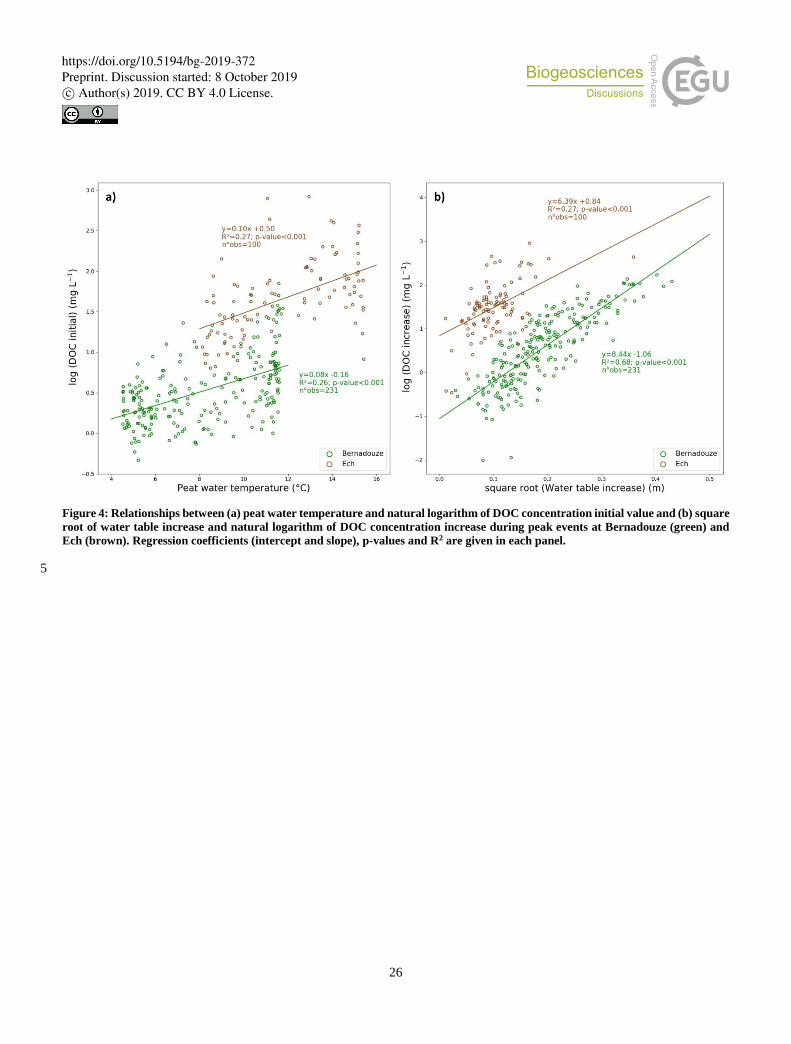
importance of the peat water temperature in the two final models, two simple linear models (Fig.4 a) were built based on this
variable to illustrate the seasonal DOC concentration behavior in Bernadouze (slope=0.08, intercept=-0.16, n=231, R²=0.26,
p-value<0.001) and in Ech (slope=0.10 intercept=0.50, n=100, R²=0.27, p-value<0.001). For the DOC concentration increase
final models, water table increase was the most important variable at Bernadouze (67% of the variance explained) and the
single variable at Ech. In Bernadouze, other variables such as water temperature, water level increase and the time between 10
two peaks were significant enough to be integrated in the reduced DOC_increase model. The R2 associated to the models
varied strongly between the two sites, reaching 0.77 in Bernadouze and only 0.27 in Ech. Since water table increase was the
main explanatory variable for the DOC concentration increase model, two simple linear models were built (Fig.4b) with the
following parameters in Bernadouze (slope=8.44, intercept=-1.06, n=231, R²=0.68, p-value<0.001) and in Ech (slope=6.39,
intercept=0.84, n=100, R²=0.27, p-value<0.001). 15
4.4. Relationships between DOC dynamics and recession time
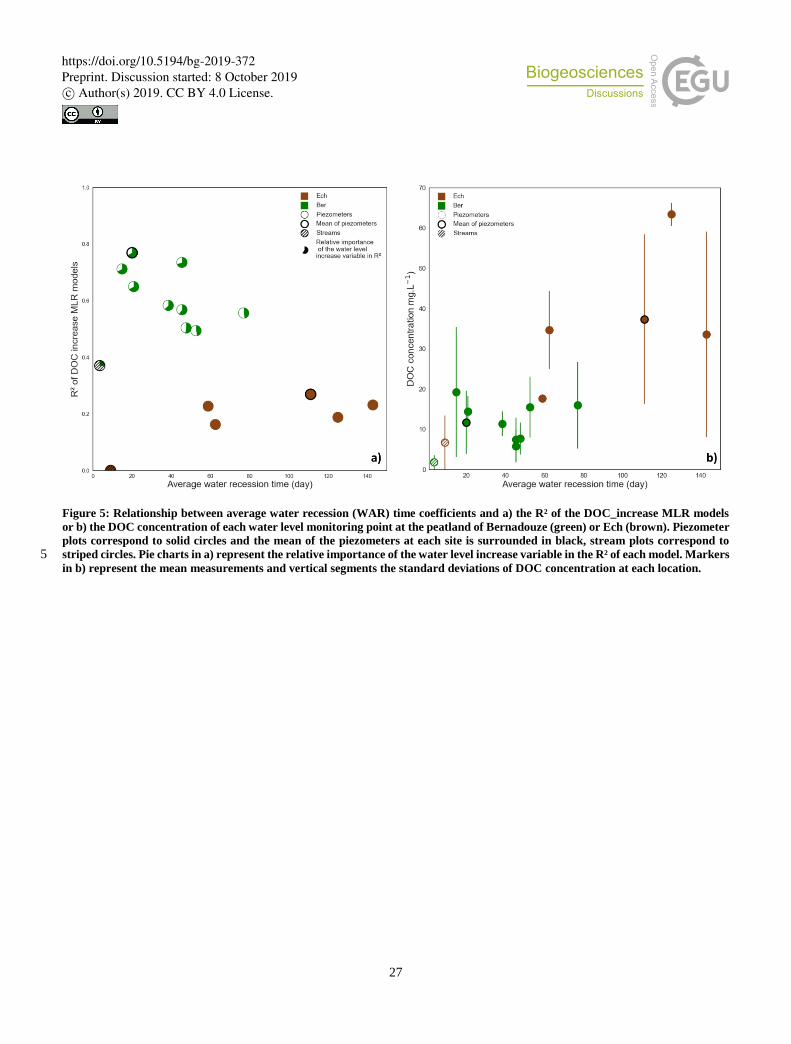
In the fen of Bernadouze the recession times in the peat ranged from 15 to 77 days whereas in the bog of Ech they were longer,
ranging from 53 to 143 days (Fig.5). Stream recession times were clearly shorter at both sites reaching 4 days in Bernadouze
and 9 days in Ech. Results of the OLS regressions conducted at each water level monitoring plot using DOC increase final 20
models, revealed that recession time influenced the model’s efficiency (Fig.5 a). Piezometers characterized by shorter recession
times showed greater determination coefficients R² (Fig.5 a). Water table increase was the most important predictor (pie charts
Fig.5 a) for all piezometer plots, contributing at least 47% of the explained variance of the DOC increase models. In
Bernadouze, the model based on stream level was weaker (R²=0.37) than the models based on water table data while in Ech
the model based on stream level was unable to explain at all the DOC increase variation (R²=0). Recession times showed a 25
positive relationship with DOC concentration measured in the piezometer and in the streams. Stronger concentrations were
observed for longer recession times (Fig. 5 b).
5. Discussion
5.1. Methodological breakthrough
To our knowledge, this is the first time that stream DOC concentration and abiotic drivers, including water table depth 30
fluctuations, have been analyzed at peatland sites on a multi-year period at such a frequency (30 min). Previously, DOC
https://doi.org/10.5194/bg-2019-372Preprint. Discussion started: 8 October 2019c© Author(s) 2019. CC BY 4.0 License.
10
concentration variability had already been investigated but this was done either at lower frequencies (Clark, 2005; Dawson et
al., 2011) or during shorter periods (Austnes et al., 2010; Koehler et al., 2009; Tunaley et al., 2016; Worrall et al., 2002). The
originality of this study was to sequence DOC concentration peaks, considered as biogeochemical “hot moments “ (McClain
et al., 2003) within the peatland carbon cycle, to disentangle event and seasonal drivers of DOC concentration variability.
Thanks to the high frequency monitoring, a large number of events (252 peaks in Bernadouze and 101 peaks in Ech) were 5
captured at all seasons (Table 2), enhancing the representativeness of both seasonal and event scale statistical models.
5.2. Peat water temperature controls seasonal DOC concentration baseline
Clear seasonal variations in the DOC concentration baseline were observed at both sites (Fig.3 and Table 2). These variations
are mostly driven by peat water temperature (Table 3). Baseline DOC concentration increased in late spring, peaked in autumn,
decreased during winter to reach the lowest levels in early spring. Similar seasonal DOC concentration patterns have been 10
observed at other peatland sites in temperate regions (Austnes, 2010; Broder and Biester, 2015; Clark et al., 2005; Tunaley et
al., 2016; Worrall et al., 2006; Zheng et al., 2018) or after the snowmelt event in boreal areas (Jager et al., 2009; Köhler et al.,
2008; Laudon et al., 2004; Olefeldt and Roulet, 2012; Whitfield et al., 2010). The higher DOC concentration observed in
summer could be explained by evapotranspiration processes which concentrate solutes in stream water. However, the
evapotranspiration rates in these mountainous environments are low (<300 mm year-1) compared to precipitation (>1200 mm 15
year-1) and should not drastically influence the seasonal DOC concentration baseline. In Bernadouze, DOC concentration
remained extremely low when the fen was snow-covered and it did not drop drastically during the spring snowmelt as has been
observed in boreal areas (Laudon et al., 2004; Leach et al., 2016). This pattern can be explained by (1) the low initial DOC
concentration which prevents a clear dilution being observed during the snowmelt event, (2) the snowmelt regime in this
Pyrenean catchment which may be less sudden than in boreal regions and occurs from the early snow deposit to the beginning 20
of the growing season, continuously diluting the low winter DOC production within the peatland.
Temperature is often identified as a DOC concentration driver in peatlands at the seasonal scale (Billett et al., 2006; Clark et
al., 2008; Dawson et al., 2011; Koehler et al., 2009). Warmer temperatures directly enhance DOC production by stimulating
vegetation and microbial activity (Kalbitz et al., 2000; Pastor et al., 2003). Warmer temperatures are also indirectly linked to
DOC production processes in temperate and northern peatlands since they often correspond to dry periods that lower water 25
table levels. When the water table decreases, the “enzymic latch” (Freeman et al., 2001) is initiated on a greater volume of
oxygenated peat and enhances DOC production within the upper peat layers. In these two mountainous peatlands, peat water
temperature was shown to be the main predictor of the seasonal stream DOC concentration baseline (Table 3). Similar DOC
concentration relationships with peat water temperature have already been described in an acidic fen in France (Leroy et al.,
2017) and in blanket peatlands from the North Pennine uplands in the UK (Clark et al., 2005); however, in these cases DOC 30
concentrations were measured in peat porewater. A complementary study in the North Pennines (Clark et al., 2008) showed
that peat porewater DOC concentrations and stream DOC concentration were strongly correlated, meaning that, by extension,
the relationship between peat temperature and stream DOC concentration could be verified for these sites.
https://doi.org/10.5194/bg-2019-372Preprint. Discussion started: 8 October 2019c© Author(s) 2019. CC BY 4.0 License.
11
In the present study, both stream and peat pore water DOC concentrations were higher in the bog than in the fen (Table 2 and
Fig.5 b). This is consistent with mesocosm (Pastor et al., 2003) or field (Chanton et al., 2008; Chasar et al., 2000; Moore,
1988) porewater observations. Differences in the seasonal DOC concentration baseline (DOC initial) models can be explained
by the variation in the leachable DOC pool within peatlands. The influence of temperature on DOC production appears similar
at both sites since the slopes of the univariate models were comparable (Fig.4 a). However, the lower altitude and the southern 5
orientation of Ech peatland influenced overall temperatures positively compared to Bernadouze. Therefore, DOC production
was able to occur at a high rate over longer periods at Ech. DOC production also depends on vegetation types (Armstrong et
al., 2012; Leroy et al., 2017; Vestgarden et al., 2010). Sphagnum species, which are dominant on bogs, produce relatively less
labile and reactive DOC than vascular plants, which are more abundant on fens (Chanton et al., 2008; D’Andrilli et al., 2010).
In Bernadouze, contrary to the initial hypothesis (Table 1), time between peaks was a negative significant predictor in both 10
seasonal and event DOC concentration models (Table 3). This is considered as an indirect consequence of the seasonal
temperature control on DOC concentration. Indeed, snow cover and the low temperatures associated to high water table
positions prevent the occurrence of DOC peaks in winter, creating large time gaps between two events (Table 2) of low initial
values. In contrast, DOC production is amplified in warmer periods resulting in more frequent stream DOC concentration
peaks starting at higher initial values. In Ech, where average annual temperatures are higher, the initial hypothesis was verified 15
since DOC concentrations were stronger in autumn after the long summer times between peaks (Table 2). However, the
variable was not significant enough to be integrated in any final model.
5.3. Water table increase controls DOC concentration peaks at the event scale
This study, coupling high frequency stream DOC concentration and water table depth monitoring at both peatland sites,
revealed that water table increase is a strong predictor of stream DOC concentration increase at the event scale (Table 3 and 20
Fig. 4 b). Stream DOC concentration variability at the event scale has been investigated in terms of discharge but never in
terms of water table variation. Several studies have reported stream DOC concentration increases at the outlet of peatlands
during flood events (Austnes, 2010; Ryder et al., 2014; Tranvik and Jansson, 2002; Yang et al., 2015), whereas others showed
dilution during high flow events (Clark et al., 2007; Grayson and Holden, 2012; Laudon et al., 2004; Worrall et al., 2002). In
Bernadouze, stream water level only poorly contributed to explaining the variability of DOC increases during flood events 25
(Table 3 and Fig.5 a) and in Ech, it did not contribute at all. This is in line with the studies reporting a non-linear flow-DOC
concentration relationship at the outlet of peatlands (Roulet et al., 2007; Tunaley et al., 2016).
Water table is usually considered as a DOC production driver as it controls the oxygenated acrotelm volume (Billett et al.,
2006; Freeman et al., 2001; Ritson et al., 2017). Therefore, different studies attempted to quantify the effect of water table
position on DOC production rate in peatlands. On the one hand, Pastor et al., (2003) observed no DOC concentration variation 30
in the stream water after a water table decrease in a fen and a bog mesocosm. On the other hand, increasing DOC concentrations
were observed during the re-wetting phase of the acrotelm at fen sites in Germany (Kalbitz et al., 2002), in Canada (Strack et
al., 2008) and in the USA (Hribljan et al., 2014). Finally, Clark et al., (2009) reported similar observations after re-wetting
https://doi.org/10.5194/bg-2019-372Preprint. Discussion started: 8 October 2019c© Author(s) 2019. CC BY 4.0 License.
12
peat cores in controlled laboratory conditions. Our results are in line with these studies, since they highlight the role of rising
water table for DOC transfer from peatlands to streams.
Nevertheless, this study contrasts with former studies which considered single time water table position or seasonal variations
at peatland sites. At the seasonal scale, water table level is only an indicator of the potential occurrence of a DOC peak event.
For instance, DOC peak events are prevented or minimized during winter and early spring since the water table is high (Fig.2 5
b), whereas DOC concentration increases are strongest during the low water table periods in summer and autumn. Using high
frequency monitoring, it was possible to quantify the rise of water in the upper peat layers and the volume of peat rewetted
during an event. The models developed in this study show that stream DOC concentration is proportional to the volume of
rewetted peat (Fig. 4 b). This means that the water table increase within the peatland is the limiting factor of DOC concentration
increase in the streams. This is in line with practices for degraded peatland restoration, where a general rise of the water table 10
is recommended to limit water table increases and induced DOC concentration peaks at their outlets (Höll et al., 2009; Strack
and Zuback, 2013).
5.4. Contrasted DOC dynamics related to recession times
Spatial analysis of water table variation within the peatland revealed that the studied sites are composed by several peat units,
characterized by contrasted recession times. In these mountainous peatlands, recession times are related to DOC dynamics, 15
driving model efficiency between DOC concentration increase and water table rise and explaining DOC concentration in peat
pore water.
In average the bog of Ech presented a longer recession time (111 days) than the fen of Bernadouze (20 days). However, the
range of recession times is wide in a peatland complex presenting simultaneously bog and fen characteristics. For instance, a
specific unit in the fen of Bernadouze was characterized by a long recession time of 77 days. This unit showed surface bog 20
vegetation and topographic patterns but was surrounded by typical fen units characterized by clear lower recession times
(Fig.5). Thus a peatland complex must be considered as a patchwork of different units and not as a uniform peat entity.
At the event scale, the univariate model between DOC concentration and water table increase showed a non-negligible intercept
at Ech contrasting with the model of Bernadouze (Fig.4 b). Therefore, in Ech, DOC concentration increases could occur
without being associated with water table increases. In this case, DOC is transferred from the upper peat layers via fast runoff 25
flows without any water table level fluctuation. Such a phenomenon is consistent with the hydraulic properties associated to
the bog and estimated via the recession times (Fig.5). Indeed, the long recession times of bog units suggest slow percolation
rates. During precipitation events, the infiltration capacities of the surface peat layers of bog units are rapidly saturated,
enhancing surface runoffs and preventing or delaying water table increases (Table 2). In contrast, DOC stored in the upper
peat layers of fen units is transferred to the stream by fast percolating water, which raises the water table levels and supplies 30
the sub-surface flows in these zones (Fig.6). This explains why the DOC increase final model based on water table increase is
particularly efficient for fen units characterized by short recession times (Fig.5 a). Recession times also explain the differences
in peat porewater DOC concentration observed between bog and fen sites. In the fen, recession times are short, meaning that
https://doi.org/10.5194/bg-2019-372Preprint. Discussion started: 8 October 2019c© Author(s) 2019. CC BY 4.0 License.
13
the upper peat layers are rapidly washed by precipitations, inducing sudden DOC pool depletions of the peat porewater (Fig.3
c). At the bog site, DOC stored in the upper peat layers is slowly released to the stream after precipitation events and contributes
to maintaining a high stream baseline (Fig.3 c) and peat pore water DOC concentrations (Fig.5 a).
Thus, stream DOC concentration modelling at the outlet of peatlands must account for different proportions of fen-like or bog-
like units in peatland complexes to fit the real seasonal and event DOC concentration variability. Each unit supplies DOC to 5
the stream at a different rate depending on its volume, distance from the stream and recession time (Fig.6). This end member
mix concurs with the model of Binet et al., (2013) describing event and seasonal water table variability in peatlands using a
double porosity parametrization. In that sense, recession time appears as a new physical parameter able to characterize peatland
units otherwise than by the binary typology: bog or fen. This would surely improve the efficiency of hydrological and
biogeochemical models. In the case of peatland complexes characterized by long recession times, further investigations of 10
peatland runoffs and sub-surface flows are needed, analyzing denser and stream directed piezometer transects in order to build
stronger DOC concentration models.
6. Conclusion
This study reports an analysis of the stream DOC concentration variability at the outlet of two mountainous peatlands. Multi-
year in situ high frequency (30 minutes) monitoring revealed that at both sites, DOC concentration time series can be 15
decomposed in a seasonal baseline interrupted by many short, intense peaks of higher concentrations. At the seasonal scale,
DOC concentration baseline variations are mainly explained by peat water temperature which controls integrative DOC
production processes within the peatland. During the “hot moments” of peak events, DOC concentrations are well explained
at both sites by water table increases within the peatlands.
Recession time is a relevant parameter to explain peat porewater DOC concentration and the different model performances 20
observed between bog and fen sites. Recession time assessments in different locations on the two studied sites showed that
peatlands are composed of different units presenting contrasted water recession properties. Thus, peatlands should not be
considered as uniform landscapes. Distinct peatland units within the same peatland complex contribute differently to the DOC
transfer processes to inland waters. Recession time assessment in piezometers appears to be a simple and promising tool to
investigate hydrological processes occurring in peatlands over time and space. Indeed, water table time series are often under-25
used and only account for a seasonal mean or minimum depth. Assessing recession times on peatlands is a first step to taking
peatland water table dynamics into consideration and to explaining potentially related biogeochemical processes.
https://doi.org/10.5194/bg-2019-372Preprint. Discussion started: 8 October 2019c© Author(s) 2019. CC BY 4.0 License.
14
7. Data availability
The data used in this manuscript are described and available on the Pangaea® data repository at:
https://doi.pangaea.de/10.1594/PANGAEA.905838
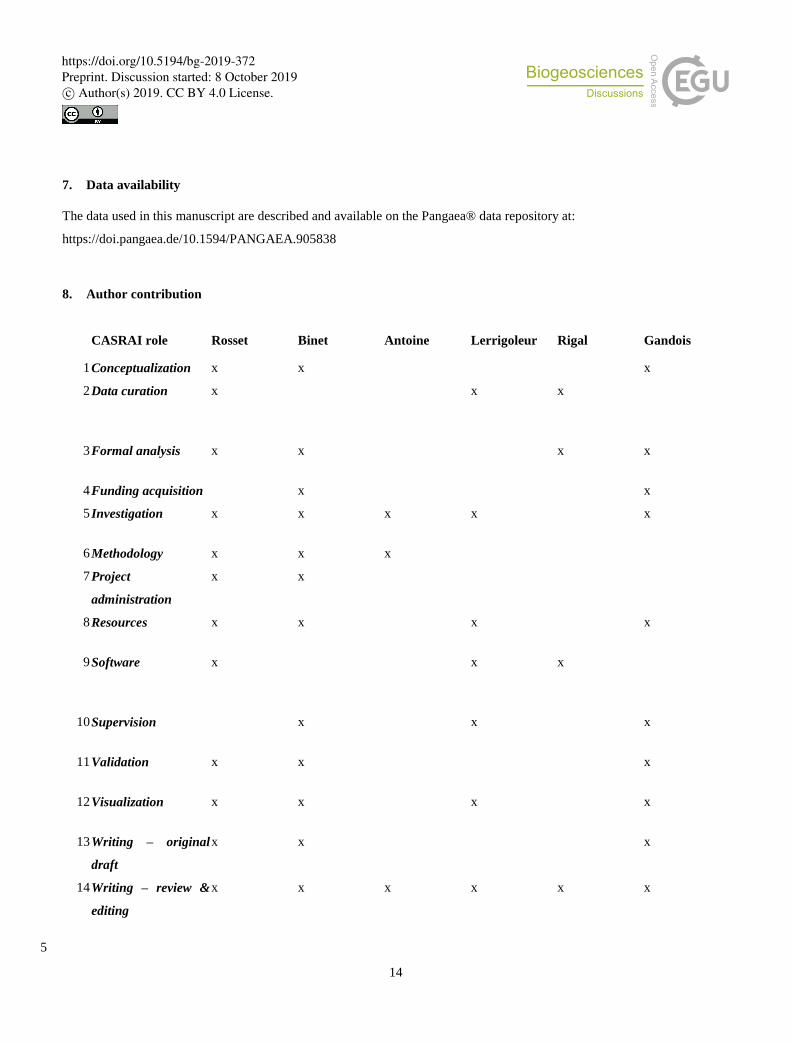
8. Author contribution
5
CASRAI role Rosset Binet Antoine Lerrigoleur Rigal Gandois
1 Conceptualization x x x
2 Data curation x x x
3 Formal analysis x x x x
4 Funding acquisition x x
5 Investigation x x x x x
6 Methodology x x x
7 Project
administration
x x
8 Resources x x x x
9 Software x x x
10 Supervision x x x
11 Validation x x x
12 Visualization x x x x
13 Writing – original
draft
x x x
14 Writing – review &
editing
x x x x x x
https://doi.org/10.5194/bg-2019-372Preprint. Discussion started: 8 October 2019c© Author(s) 2019. CC BY 4.0 License.
15
9. Competing interest
The authors declare that they have no conflict of interest.
10. Acknowledgment
All the carbon analyses were performed at the PAPC platform (EcoLab). The authors wish to thank: L.Plagnet for permitting
the access to the peatland of Ech, V. Payré-Suc, F. Julien, D. Lambrigot, W. Amblas for assisting in stream organic carbon 5
concentration analysis; F. De Vleeschouwer, D. Allen, P. Durantez Jimenez, T. Camboulive for assisting in water sampling;
G.Susong and the Regional Natural reserve of Pibeste-Aoulhet for piezometer maintenance, S. Gascoin, P. Fanise, the CESBIO
laboratory and the OSR Toulouse for providing the meteorological data, D. Galop for assisting in site preparation and
communication with local policy makers, E. Rowley-Jolivet for English language assistance.
This project was made possible with the support of the LabEx DRIIHM , French programme "Investissements d'Avenir" (ANR-10
11-LABX-0010) which is managed by the ANR and funds the Ph.D of T. Rosset; LabEx DRIIHM OHM Haut Vicdessos/
Haute Vallée des Gaves, REPLIM OPCC, ANR JCJC TRAM (ANR JCJC 15-CE01-008 TRAM), which funded the
investigations at both sites.
References
Armstrong, A., Holden, J., Luxton, K. and Quinton, J. N.: Multi-scale relationship between peatland vegetation 15
type and dissolved organic carbon concentration, Ecol. Eng., 47, 182–188, doi:10.1016/j.ecoleng.2012.06.027,
2012.
Austnes, E.: Effects of storm events on mobilisation of dissolved organic matter (DOM) in a Welsh peatland
catchment, Biogeochemistry, 99(1), 157–173, doi:10.1007/s10533-009-9399-4, 2010.
Austnes, K., Evans, C. D., Eliot-Laize, C., Naden, P. S. and Old, G. H.: Effects of storm events on mobilisation 20
and in-stream processing of dissolved organic matter (DOM) in a Welsh peatland catchment, Biogeochemistry,
99(1–3), 157–173, doi:10.1007/s10533-009-9399-4, 2010.
Bernard-Jannin, L., Binet, S., Gogo, S., Leroy, F., Défarge, C., Jozja, N., Zocatelli, R., Perdereau, L. and
Laggoun-Défarge, F.: Hydrological control of dissolved organic carbon dynamics in a rehabilitated Sphagnum-
dominated peatland: a water-table based modelling approach, Hydrol. Earth Syst. Sci., 22(9), 4907–4920, 25
doi:https://doi.org/10.5194/hess-22-4907-2018, 2018.
Billett, M. F., Deacon, C. M., Palmer, S. M., Dawson, J. J. C. and Hope, D.: Connecting organic carbon in stream
water and soils in a peatland catchment, J. Geophys. Res. Biogeosciences, 111(G2), doi:10.1029/2005JG000065,
2006.
https://doi.org/10.5194/bg-2019-372Preprint. Discussion started: 8 October 2019c© Author(s) 2019. CC BY 4.0 License.
16
Binet, S., Gogo, S. and Laggoun-Défarge, F.: A water-table dependent reservoir model to investigate the effect of
drought and vascular plant invasion on peatland hydrology., J. Hydrol., 499, 132–139,
doi:10.1016/j.jhydrol.2013.06.035, 2013.
Broder, T. and Biester, H.: Hydrologic controls on DOC, As and Pb export from a polluted peatland – the
importance of heavy rain events, antecedent moisture conditions and hydrological connectivity, Biogeosciences, 5
12(15), 4651–4664, doi:10.5194/bg-12-4651-2015, 2015.
Broder, T. and Biester, H.: Linking major and trace element concentrations in a headwater stream to DOC release
and hydrologic conditions in a bog and peaty riparian zone, Appl. Geochem., 87, 188–201,
doi:10.1016/j.apgeochem.2017.11.003, 2017.
Broder, T., Blodau, C., Biester, H. and Knorr, K. H.: Peat decomposition records in three pristine ombrotrophic 10
bogs in southern Patagonia, Biogeosciences, 9(4), 1479–1491, doi:10.5194/bg-9-1479-2012, 2012.
Brown, L. E., Holden, J., Palmer, S. M., Johnston, K., Ramchunder, S. J. and Grayson, R.: Effects of fire on the
hydrology, biogeochemistry, and ecology of peatland river systems, Freshw. Sci., 34(4), 1406–1425,
doi:10.1086/683426, 2015.
Chanton, J. P., Glaser, P. H., Chasar, L. S., Burdige, D. J., Hines, M. E., Siegel, D. I., Tremblay, L. B. and 15
Cooper, W. T.: Radiocarbon evidence for the importance of surface vegetation on fermentation and
methanogenesis in contrasting types of boreal peatlands, Glob. Biogeochem. Cycles, 22(4),
doi:10.1029/2008GB003274, 2008.
Chasar, L. S., Chanton, J. P., Glaser, P. H., Siegel, D. I. and Rivers, J. S.: Radiocarbon and stable carbon isotopic
evidence for transport and transformation of dissolved organic carbon, dissolved inorganic carbon, and CH4 in a 20
northern Minnesota peatland, Glob. Biogeochem. Cycles, 14(4), 1095–1108, doi:10.1029/1999GB001221, 2000.
Chevan, A. and Sutherland, M.: Hierarchical Partitioning, Am. Stat., 45(2), 90–96,
doi:10.1080/00031305.1991.10475776, 1991.
Clark, J. M.: Enviromental Controls on the Production and Export of Dissolved Organic Carbon in an Upland
Peat Catchment, Ph.D., University of Leeds. [online] Available from: 25
https://ethos.bl.uk/OrderDetails.do?uin=uk.bl.ethos.503248 (Accessed 17 May 2019), 2005.
Clark, J. M., Chapman, P. J., Adamson, J. K. and Lane, S. N.: Influence of drought-induced acidification on the
mobility of dissolved organic carbon in peat soils, Glob. Change Biol., 11(5), 791–809, doi:10.1111/j.1365-
2486.2005.00937.x, 2005.
Clark, J. M., Lane, S. N., Chapman, P. J. and Adamson, J. K.: Export of dissolved organic carbon from an upland 30
peatland during storm events: Implications for flux estimates, J. Hydrol., 347(3–4), 438–447,
doi:10.1016/j.jhydrol.2007.09.030, 2007.
Clark, J. M., Lane, S. N., Chapman, P. J. and Adamson, J. K.: Link between DOC in near surface peat and stream
water in an upland catchment, Sci. Total Environ., 404(2), 308–315, doi:10.1016/j.scitotenv.2007.11.002, 2008.
https://doi.org/10.5194/bg-2019-372Preprint. Discussion started: 8 October 2019c© Author(s) 2019. CC BY 4.0 License.
17
Clark, J. M., Ashley, D., Wagner, M., Chapman, P. J., Lane, S. N., Evans, C. D. and Heathwaite, A. L.: Increased
temperature sensitivity of net DOC production from ombrotrophic peat due to water table draw-down, Glob.
Change Biol., 15(4), 794–807, doi:10.1111/j.1365-2486.2008.01683.x, 2009.
Cole, J. J., Prairie, Y. T., Caraco, N. F., McDowell, W. H., Tranvik, L. J., Striegl, R. G., Duarte, C. M.,
Kortelainen, P., Downing, J. A., Middelburg, J. J. and Melack, J.: Plumbing the Global Carbon Cycle: Integrating 5
Inland Waters into the Terrestrial Carbon Budget, Ecosystems, 10(1), 172–185, doi:10.1007/s10021-006-9013-8,
2007.
D’Andrilli, J., Chanton, J. P., Glaser, P. H. and Cooper, W. T.: Characterization of dissolved organic matter in
northern peatland soil porewaters by ultra high resolution mass spectrometry, Org. Geochem., 41(8), 791–799,
doi:10.1016/j.orggeochem.2010.05.009, 2010. 10
Dargie, G. C., Lewis, S. L., Lawson, I. T., Mitchard, E. T. A., Page, S. E., Bocko, Y. E. and Ifo, S. A.: Age,
extent and carbon storage of the central Congo Basin peatland complex, Nature, 542(7639), 86–90,
doi:10.1038/nature21048, 2017.
Dawson, J. J. C., Tetzlaff, D., Speed, M., Hrachowitz, M. and Soulsby, C.: Seasonal controls on DOC dynamics
in nested upland catchments in NE Scotland, Hydrol. Process., 25(10), 1647–1658, doi:10.1002/hyp.7925, 2011. 15
Dinsmore, K. J., Billett, M. F., Skiba, U. M., Rees, R. M., Drewer, J. and Helfter, C.: Role of the aquatic pathway
in the carbon and greenhouse gas budgets of a peatland catchment, Glob. Change Biol., 16(10), 2750–2762,
doi:10.1111/j.1365-2486.2009.02119.x, 2010.
Dormann, C. F., Elith, J., Bacher, S., Buchmann, C., Carl, G., Carré, G., Marquéz, J. R. G., Gruber, B.,
Lafourcade, B., Leitão, P. J., Münkemüller, T., McClean, C., Osborne, P. E., Reineking, B., Schröder, B., 20
Skidmore, A. K., Zurell, D. and Lautenbach, S.: Collinearity: a review of methods to deal with it and a simulation
study evaluating their performance, Ecography, 36(1), 27–46, doi:10.1111/j.1600-0587.2012.07348.x, 2013.
Downing, B. D., Pellerin, B. A., Bergamaschi, B. A., Saraceno, J. F. and Kraus, T. E. C.: Seeing the light: The
effects of particles, dissolved materials, and temperature on in situ measurements of DOM fluorescence in rivers
and streams, Limnol. Oceanogr. Methods, 10(10), 767–775, doi:10.4319/lom.2012.10.767, 2012. 25
Drake, T. W., Raymond, P. A. and Spencer, R. G. M.: Terrestrial carbon inputs to inland waters: A current
synthesis of estimates and uncertainty, Limnol. Oceanogr. Lett., n/a-n/a, doi:10.1002/lol2.10055, 2017.
Dyson, K. E., Billett, M. F., Dinsmore, K. J., Harvey, F., Thomson, A. M., Piirainen, S. and Kortelainen, P.:
Release of aquatic carbon from two peatland catchments in E. Finland during the spring snowmelt period,
Biogeochemistry, 103(1), 125–142, doi:10.1007/s10533-010-9452-3, 2011. 30
Fenner, N. and Freeman, C.: Drought-induced carbon loss in peatlands, Nat. Geosci., 4(12), 895–900,
doi:10.1038/ngeo1323, 2011.
Fraser, C. J. D., Roulet, N. T. and Lafleur, M.: Groundwater flow patterns in a large peatland, J. Hydrol., 246(1–
4), 142–154, doi:10.1016/S0022-1694(01)00362-6, 2001.
https://doi.org/10.5194/bg-2019-372Preprint. Discussion started: 8 October 2019c© Author(s) 2019. CC BY 4.0 License.

18
Freeman, C., Ostle, N. and Kang, H.: An enzymic “latch” on a global carbon store, Nature, 409(6817), 149–149,
doi:10.1038/35051650, 2001.
Gascoin, S. and Fanise, P.: Bernadouze meteorological data, , doi:10.6096/DV/UQITZ4, 2018.
Gascoin, S., Hagolle, O., Huc, M., Jarlan, L., Dejoux, J.-F., Szczypta, C., Marti, R. and Sánchez, R.: A snow
cover climatology for the Pyrenees from MODIS snow products, Hydrol. Earth Syst. Sci., 19(5), 2337–2351, 5
doi:https://doi.org/10.5194/hess-19-2337-2015, 2015.
Gorham, E.: Northern Peatlands: Role in the Carbon Cycle and Probable Responses to Climatic Warming, Ecol.
Appl., 1(2), 182–195, doi:10.2307/1941811, 1991.
Grayson, R. and Holden, J.: Continuous measurement of spectrophotometric absorbance in peatland streamwater
in northern England: implications for understanding fluvial carbon fluxes, Hydrol. Process., 26(1), 27–39, 10
doi:10.1002/hyp.8106, 2012.
Groemping, U. and Matthias, L.: relaimpo: Relative Importance of Regressors in Linear Models. [online]
Available from: https://CRAN.R-project.org/package=relaimpo (Accessed 22 May 2019), 2018.
Harell, F. E.: rms: Regression Modeling Strategies. [online] Available from: https://CRAN.R-
project.org/package=rms (Accessed 22 May 2019), 2019. 15
Holdridge, L. R.: Life zone ecology., Life Zone Ecol., ((rev. ed.)) [online] Available from:
https://www.cabdirect.org/cabdirect/abstract/19670604180 (Accessed 23 July 2018), 1967.
Höll, B. S., Fiedler, S., Jungkunst, H. F., Kalbitz, K., Freibauer, A., Drösler, M. and Stahr, K.: Characteristics of
dissolved organic matter following 20years of peatland restoration, Sci. Total Environ., 408(1), 78–83,
doi:10.1016/j.scitotenv.2009.08.046, 2009. 20
Hope, D., Billett, M. F. and Cresser, M. S.: A review of the export of carbon in river water: fluxes and processes,
Environ. Pollut., 84(3), 301–324, 1994.
Hope, D., Billett, M. F. and Cresser, M. S.: Exports of organic carbon in two river systems in NE Scotland, J.
Hydrol., 193(1), 61–82, doi:10.1016/S0022-1694(96)03150-2, 1997.
Hope, D., Palmer, S. M., Billett, M. F. and Dawson, J. J. C.: Carbon dioxide and methane evasion from a 25
temperate peatland stream, Limnol. Oceanogr., 46(4), 847–857, doi:10.4319/lo.2001.46.4.0847, 2001.
Hribljan, J. A., Kane, E. S., Pypker, T. G. and Chimner, R. A.: The effect of long-term water table manipulations
on dissolved organic carbon dynamics in a poor fen peatland, J. Geophys. Res. Biogeosciences, 119(4), 577–595,
doi:10.1002/2013JG002527, 2014.
Jager, D. F., Wilmking, M. and Kukkonen, J. V. K.: The influence of summer seasonal extremes on dissolved 30
organic carbon export from a boreal peatland catchment: Evidence from one dry and one wet growing season,
Sci. Total Environ., 407(4), 1373–1382, doi:10.1016/j.scitotenv.2008.10.005, 2009.
https://doi.org/10.5194/bg-2019-372Preprint. Discussion started: 8 October 2019c© Author(s) 2019. CC BY 4.0 License.
19
Jalut, G., Delibrias, G., Dagnac, J. and Mardones, M.: A palaeoecological approach to the last 21 000 years in the
Pyrénées: the peat bog of Freychinède (alt. 1350 m, Ariège, south France), Palaeogeogr. Palaeoclimatol.
Palaeoecol., 1982.
Jones, E., Oliphant, T. and Peterson, P.: SciPy: Open Source Scientific Tools for Python. [online] Available from:
https://www.scipy.org/ (Accessed 1 July 2019), 2001. 5
Joosten, H. and Clarke, D.: Wise use of mires and peatlands: background and principles including a framework
for decision-making, International Peat Society ; International Mire Conservation Group, Jyväskylä] :
[Greifswald., 2002.
Juutinen, S., Väliranta, M., Kuutti, V., Laine, A. M., Virtanen, T., Seppä, H., Weckström, J. and Tuittila, E.-S.:
Short-term and long-term carbon dynamics in a northern peatland-stream-lake continuum: A catchment approach, 10
J. Geophys. Res. Biogeosciences, 118(1), 171–183, doi:10.1002/jgrg.20028, 2013.
Kalbitz, K., Solinger, S., Park, J.-H., Michalzik, B. and Matzner, E.: CONTROLS ON THE DYNAMICS OF
DISSOLVED ORGANIC MATTER IN SOILS: A REVIEW, Soil Sci., 165(4), 277, 2000.
Kalbitz, K., Rupp, H. and Meissner, R.: N-, P- and DOC-dynamics in soil and groundwater after restoration of
intensively cultivated fens, in Wetlands in Central Europe: Soil Organisms, Soil Ecological Processes and Trace 15
Gas Emissions, edited by G. Broll, W. Merbach, and E.-M. Pfeiffer, pp. 99–116, Springer Berlin Heidelberg,
Berlin, Heidelberg., 2002.
Koehler, A.-K., Murphy, K., Kiely, G. and Sottocornola, M.: Seasonal variation of DOC concentration and
annual loss of DOC from an Atlantic blanket bog in South Western Ireland, Biogeochemistry, 95(2–3), 231–242,
doi:10.1007/s10533-009-9333-9, 2009. 20
Köhler, S. J., Buffam, I., Laudon, H. and Bishop, K. H.: Climate’s control of intra-annual and interannual
variability of total organic carbon concentration and flux in two contrasting boreal landscape elements, J.
Geophys. Res. Biogeosciences, 113(G3), doi:10.1029/2007JG000629, 2008.
Laudon, H., Köhler, S. and Buffam, I.: Seasonal TOC export from seven boreal catchments in northern Sweden,
Aquat. Sci., 66(2), 223–230, doi:10.1007/s00027-004-0700-2, 2004. 25
Leach, J. A., Larsson, A., Wallin, M. B., Nilsson, M. B. and Laudon, H.: Twelve year interannual and seasonal
variability of stream carbon export from a boreal peatland catchment, J. Geophys. Res. Biogeosciences, 121(7),
2016JG003357, doi:10.1002/2016JG003357, 2016.
Ledesma, J. L. J., Futter, M. N., Blackburn, M., Lidman, F., Grabs, T., Sponseller, R. A., Laudon, H., Bishop, K.
H. and Köhler, S. J.: Towards an Improved Conceptualization of Riparian Zones in Boreal Forest Headwaters, 30
Ecosystems, 1–19, doi:10.1007/s10021-017-0149-5, 2017.
Leifeld, J. and Menichetti, L.: The underappreciated potential of peatlands in global climate change mitigation
strategies, Nat. Commun., 9(1), 1071, doi:10.1038/s41467-018-03406-6, 2018.
https://doi.org/10.5194/bg-2019-372Preprint. Discussion started: 8 October 2019c© Author(s) 2019. CC BY 4.0 License.
20
Leroy, F., Gogo, S., Guimbaud, C., Bernard-Jannin, L., Hu, Z. and Laggoun-Défarge, F.: Vegetation composition
controls temperature sensitivity of CO2 and CH4 emissions and DOC concentration in peatlands, Soil Biol.
Biochem., 107, 164–167, doi:10.1016/j.soilbio.2017.01.005, 2017.
Limpens, J., Berendse, F., Blodau, C., Canadell, J. G., Freeman, C., Holden, J., Roulet, N., Rydin, H. akan and
Schaepman-Strub, G.: Peatlands and the carbon cycle: from local processes to global implications–a synthesis, 5
Biogeosciences, 5(5), 1475–1491, 2008.
McClain, M. E., Boyer, E. W., Dent, C. L., Gergel, S. E., Grimm, N. B., Groffman, P. M., Hart, S. C., Harvey, J.
W., Johnston, C. A., Mayorga, E., McDowell, W. H. and Pinay, G.: Biogeochemical Hot Spots and Hot Moments
at the Interface of Terrestrial and Aquatic Ecosystems, Ecosystems, 6(4), 301–312, doi:10.1007/s10021-003-
0161-9, 2003. 10
Millet, L., Rius, D., Galop, D., Heiri, O. and Brooks, S. J.: Chironomid-based reconstruction of Lateglacial
summer temperatures from the Ech palaeolake record (French western Pyrenees), Palaeogeogr. Palaeoclimatol.
Palaeoecol., 315–316, 86–99, doi:10.1016/j.palaeo.2011.11.014, 2012.
Moore, S., Evans, C. D., Page, S. E., Garnett, M. H., Jones, T. G., Freeman, C., Hooijer, A., Wiltshire, A. J.,
Limin, S. H. and Gauci, V.: Deep instability of deforested tropical peatlands revealed by fluvial organic carbon 15
fluxes, Nature, 493(7434), 660–663, doi:10.1038/nature11818, 2013.
Moore, T. R.: DISSOLVED IRON AND ORGANIC MATTER IN NORTHERN PEATLANDS, Soil Sci.,
145(1), 70, 1988.
Müller, D., Warneke, T., Rixen, T., Müller, M., Jamahari, S., Denis, N., Mujahid, A. and Notholt, J.: Lateral
carbon fluxes and CO2 outgassing from a tropical peat-draining river, Biogeosciences, 12(20), 5967–5979, 20
doi:https://doi.org/10.5194/bg-12-5967-2015, 2015.
Olefeldt, D. and Roulet, N. T.: Effects of permafrost and hydrology on the composition and transport of dissolved
organic carbon in a subarctic peatland complex, J. Geophys. Res. Biogeosciences, 117(G1),
doi:10.1029/2011JG001819, 2012.
de Oliveira, G., Bertone, E., Stewart, R., Awad, J., Holland, A., O’Halloran, K. and Bird, S.: Multi-Parameter 25
Compensation Method for Accurate In Situ Fluorescent Dissolved Organic Matter Monitoring and Properties
Characterization, Water, 10(9), 1146, doi:10.3390/w10091146, 2018.
Page, S. E., Rieley, J. O. and Banks, C. J.: Global and regional importance of the tropical peatland carbon pool,
Glob. Change Biol., 17(2), 798–818, doi:10.1111/j.1365-2486.2010.02279.x, 2011.
Pastor, J., Solin, J., Bridgham, S. D., Updegraff, K., Harth, C., Weishampel, P. and Dewey, B.: Global warming 30
and the export of dissolved organic carbon from boreal peatlands, Oikos, 100(2), 380–386, doi:10.1034/j.1600-
0706.2003.11774.x, 2003.
Posavec, K., Giacopetti, M., Materazzi, M. and Birk, S.: Method and Excel VBA Algorithm for Modeling Master
Recession Curve Using Trigonometry Approach, Groundwater, 55(6), 891–898, doi:10.1111/gwat.12549, 2017.
https://doi.org/10.5194/bg-2019-372Preprint. Discussion started: 8 October 2019c© Author(s) 2019. CC BY 4.0 License.
21
Python Software Foundation: Python.org, Python Software Foundation. [online] Available from:
https://www.python.org/ (Accessed 24 June 2019), 2019.
R Core team: R: A Language and Environment for Statistical Computing., [online] Available from:
https://www.r-project.org/ (Accessed 18 March 2019), 2019.
Raymond, P. A., Saiers, J. E. and Sobczak, W. V.: Hydrological and biogeochemical controls on watershed 5
dissolved organic matter transport: pulse-shunt concept, Ecology, 97(1), 5–16, doi:10.1890/14-1684.1, 2016.
Reille, M.: Nouvelles recherches pollenanalytiques à Freychinède, Pyrénées ariegeoises, France, Lab. Bot. Hist.
Palynol. Novembre 1990 Pp 1-10 Annex., 1990.
Ritson, J. P.: The impact of climate change and management practices on dissolved organic carbon (DOC) flux
and drinking water treatment in peatland catchments., 2015. 10
Ritson, J. P., Brazier, R. E., Graham, N. J. D., Freeman, C., Templeton, M. R. and Clark, J. M.: The effect of
drought on dissolved organic carbon (DOC) release from peatland soil and vegetation sources, Biogeosciences,
14(11), 2891–2902, doi:https://doi.org/10.5194/bg-14-2891-2017, 2017.
Rius, D., Vanniére, B. and Galop, D.: Holocene history of fire, vegetation and land use from the central Pyrenees
(France), Quat. Res., 77(01), 54–64, doi:10.1016/j.yqres.2011.09.009, 2012. 15
Rode, M., Wade, A. J., Cohen, M. J., Hensley, R. T., Bowes, M. J., Kirchner, J. W., Arhonditsis, G. B., Jordan,
P., Kronvang, B., Halliday, S. J., Skeffington, R. A., Rozemeijer, J. C., Aubert, A. H., Rinke, K. and Jomaa, S.:
Sensors in the Stream: The High-Frequency Wave of the Present, Environ. Sci. Technol., 50(19), 10297–10307,
doi:10.1021/acs.est.6b02155, 2016.
Rosset, T., Gandois, L., Le Roux, G., Teisserenc, R., Durantez Jimenez, P., Camboulive, T. and Binet, S.: 20
Peatland contribution to stream organic carbon exports from a montane watershed, J. Geophys. Res.
Biogeosciences, 2019.
Rothwell, J. J., Evans, M. G., Daniels, S. M. and Allott, T. E. H.: Baseflow and stormflow metal concentrations
in streams draining contaminated peat moorlands in the Peak District National Park (UK), J. Hydrol., 341(1), 90–
104, doi:10.1016/j.jhydrol.2007.05.004, 2007. 25
Roulet, N. T., Lafleur, P. M., Richard, P. J. H., Moore, T. R., Humphreys, E. R. and Bubier, J.: Contemporary
carbon balance and late Holocene carbon accumulation in a northern peatland, Glob. Change Biol., 13(2), 397–
411, doi:10.1111/j.1365-2486.2006.01292.x, 2007.
Ryder, E., de Eyto, E., Dillane, M., Poole, R. and Jennings, E.: Identifying the role of environmental drivers in
organic carbon export from a forested peat catchment, Sci. Total Environ., 490, 28–36, 30
doi:10.1016/j.scitotenv.2014.04.091, 2014.
Spencer, R. G. M., Aiken, G. R., Dornblaser, M. M., Butler, K. D., Holmes, R. M., Fiske, G., Mann, P. J. and
Stubbins, A.: Chromophoric dissolved organic matter export from U.S. rivers, Geophys. Res. Lett., 40(8), 1575–
1579, doi:10.1002/grl.50357, 2013.
https://doi.org/10.5194/bg-2019-372Preprint. Discussion started: 8 October 2019c© Author(s) 2019. CC BY 4.0 License.
22
Strack, M. and Zuback, Y. C. A.: Annual carbon balance of a peatland 10 yr following restoration,
Biogeosciences, 10(5), 2885–2896, doi:10.5194/bg-10-2885-2013, 2013.
Strack, M., Waddington, J. M., Bourbonniere, R. A., Buckton, E. L., Shaw, K., Whittington, P. and Price, J. S.:
Effect of water table drawdown on peatland dissolved organic carbon export and dynamics, Hydrol. Process.,
22(17), 3373–3385, doi:10.1002/hyp.6931, 2008. 5
Tipping, E., Smith, E. J., Lawlor, A. J., Hughes, S. and Stevens, P. A.: Predicting the release of metals from
ombrotrophic peat due to drought-induced acidification, Environ. Pollut., 123(2), 239–253, doi:10.1016/S0269-
7491(02)00375-5, 2003.
Tipping, E., Billett, M. F., Bryant, C. L., Buckingham, S. and Thacker, S. A.: Sources and ages of dissolved
organic matter in peatland streams: evidence from chemistry mixture modelling and radiocarbon data, 10
Biogeochemistry, 100(1–3), 121–137, doi:10.1007/s10533-010-9409-6, 2010.
Tranvik, L. J. and Jansson, M.: Climate change (Communication arising): Terrestrial export of organic carbon,
Nature, 415(6874), 861–862, doi:10.1038/415861b, 2002.
Tunaley, C., Tetzlaff, D., Lessels, J. and Soulsby, C.: Linking high-frequency DOC dynamics to the age of
connected water sources, Water Resour. Res., 52(7), 5232–5247, doi:10.1002/2015WR018419, 2016. 15
Tunaley, C., Tetzlaff, D., Wang, H. and Soulsby, C.: Spatio-temporal diel DOC cycles in a wet, low energy,
northern catchment: Highlighting and questioning the sub-daily rhythms of catchment functioning, J. Hydrol.,
563, 962–974, doi:10.1016/j.jhydrol.2018.06.056, 2018.
Vestgarden, L. S., Austnes, K. and Strand, L. T.: Vegetation control on DOC, DON and DIN concentrations in
soil water from a montane system, southern Norway, 2010. 20
Watras, C. J., Hanson, P. C., Stacy, T. L., Morrison, K. M., Mather, J., Hu, Y.-H. and Milewski, P.: A
temperature compensation method for CDOM fluorescence sensors in freshwater, Limnol. Oceanogr. Methods,
9(7), 296–301, doi:10.4319/lom.2011.9.296, 2011.
Webb, J. R., Santos, I. R., Maher, D. T. and Finlay, K.: The Importance of Aquatic Carbon Fluxes in Net
Ecosystem Carbon Budgets: A Catchment-Scale Review, Ecosystems, doi:10.1007/s10021-018-0284-7, 2018. 25
Whitfield, C. J., Aherne, J., Gibson, J. J., Seabert, T. A. and Watmough, S. A.: The controls on boreal peatland
surface water chemistry in Northern Alberta, Canada, Hydrol. Process., 24(15), 2143–2155,
doi:10.1002/hyp.7637, 2010.
Worrall, F., Burt, T. P., Jaeban, R. Y., Warburton, J. and Shedden, R.: Release of dissolved organic carbon from
upland peat, Hydrol. Process., 16(17), 3487–3504, doi:10.1002/hyp.1111, 2002. 30
Worrall, F., Burt, T. P. and Adamson, J. K.: Trends in Drought Frequency – the Fate of DOC Export From
British Peatlands, Clim. Change, 76(3–4), 339–359, doi:10.1007/s10584-006-9069-7, 2006.
https://doi.org/10.5194/bg-2019-372Preprint. Discussion started: 8 October 2019c© Author(s) 2019. CC BY 4.0 License.
23
Yang, L., Chang, S.-W., Shin, H.-S. and Hur, J.: Tracking the evolution of stream DOM source during storm
events using end member mixing analysis based on DOM quality, J. Hydrol., 523, 333–341,
doi:10.1016/j.jhydrol.2015.01.074, 2015.
Zheng, Y., Waldron, S. and Flowers, H.: Fluvial dissolved organic carbon composition varies spatially and
seasonally in a small catchment draining a wind farm and felled forestry., Sci. Total Environ., 626, 785–794, 5
doi:10.1016/j.scitotenv.2018.01.001, 2018.
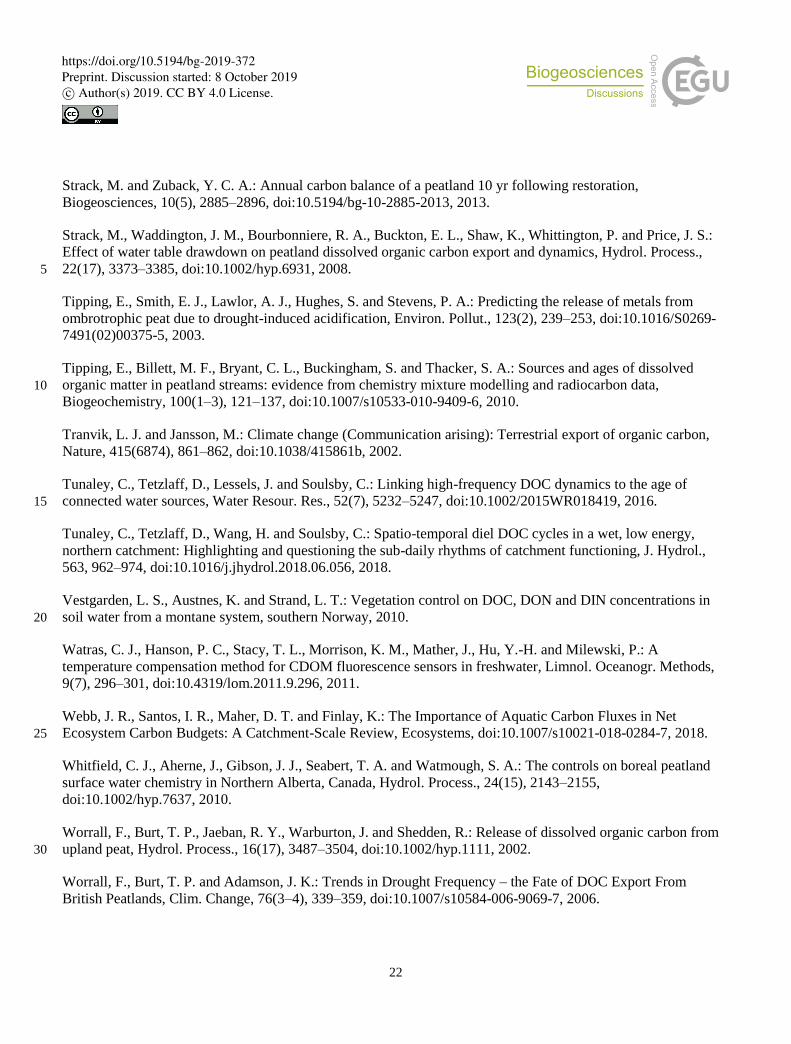
Figure 1: a) Location map of Ech Bog (brown plot) and Bernadouze fen (green plot) in South Western Europe. Satellite views of the
peatlands of Bernadouze b) and Ech c) and location of the site instrumentation. Map source: Esri, DigitalGlobe, Geoeye, Earthstar 10 Geographics, CNES/Airbus DS, USDA, USGS, AEX, Getmapping, Aerogrid, IGN, IGP, swisstopo, and the GIS User Community.
https://doi.org/10.5194/bg-2019-372Preprint. Discussion started: 8 October 2019c© Author(s) 2019. CC BY 4.0 License.
24
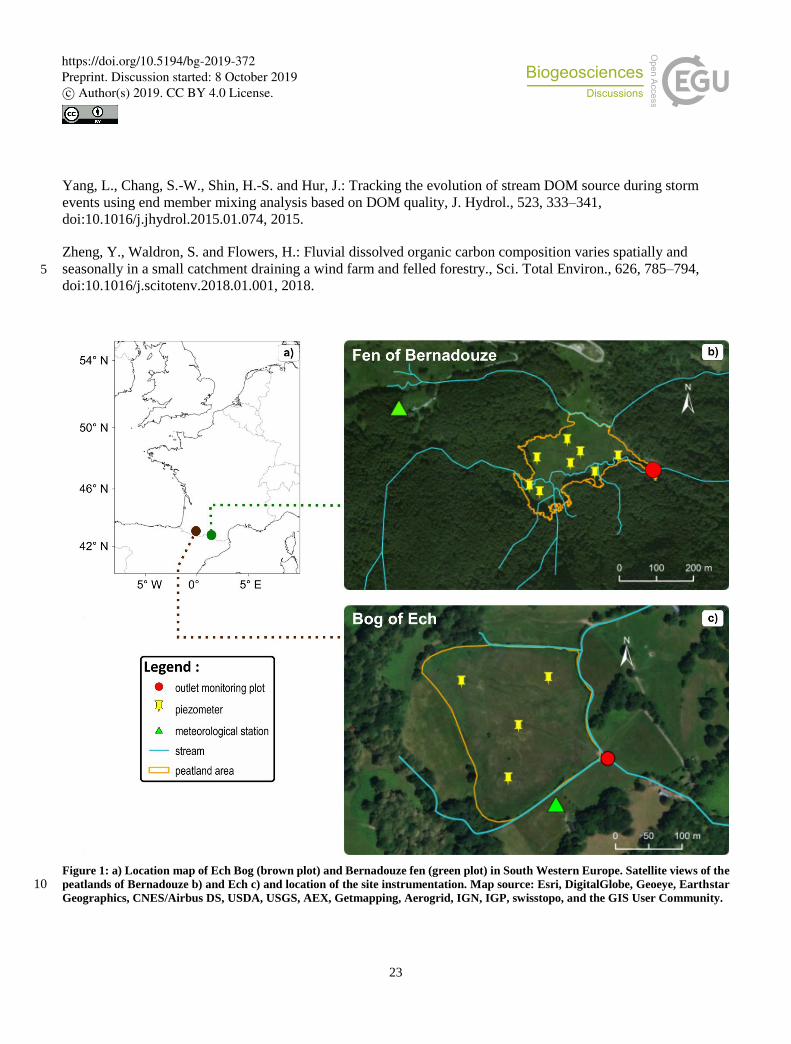
Figure 2: Characterization of DOC concentration peaks. Peak events are identified on the DOC concentration time line in blue. Each
DOC concentration peak event is defined by an initial concentration (green points) and a maximum one (red points). DOC
concentration increase is calculated by subtracting the initial from the maximum concentration. The time between 2 maximum DOC
concentrations corresponds to the duration (seconds) separating two events and is used as an explanatory variable. The DOC 5 concentration baseline (orange dotted line) corresponds to the time series defined by all the initial values of each DOC concentration
peak.
https://doi.org/10.5194/bg-2019-372Preprint. Discussion started: 8 October 2019c© Author(s) 2019. CC BY 4.0 License.
25
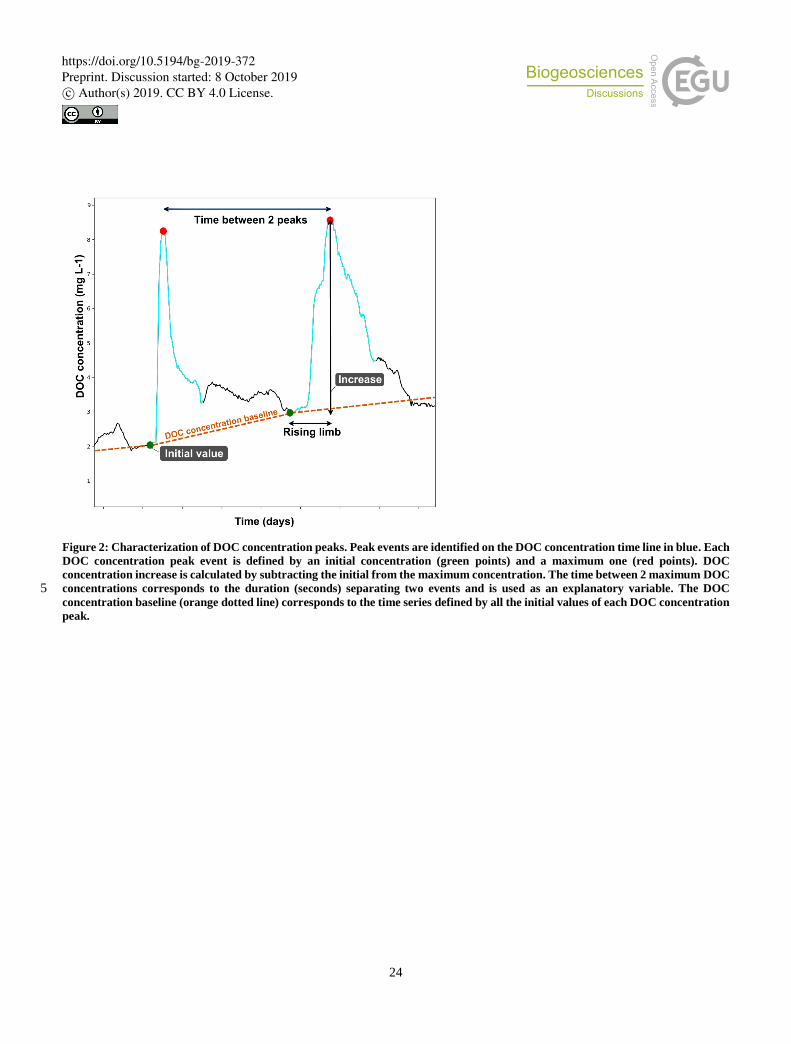
Figure 3: Precipitation and air temperature (a), stream temperature and water level (b) high frequency DOC concentration (c),
mean water table depth variation and peat water temperature (d). Time series observed at the outlet of the Bernadouze fen (left
panel) from 1st September 2015 to 31st December 2018, at the outlet of Ech bog (right panel) from 22nd May 2015 to 13th February
2019. The vertical grey lines represent a change of year. Green (for Bernadouze) and brown (for Ech) plots in time series (c) refer 5 to DOC concentration measured in grab water samples and automated flood samples.
https://doi.org/10.5194/bg-2019-372Preprint. Discussion started: 8 October 2019c© Author(s) 2019. CC BY 4.0 License.
26
Figure 4: Relationships between (a) peat water temperature and natural logarithm of DOC concentration initial value and (b) square
root of water table increase and natural logarithm of DOC concentration increase during peak events at Bernadouze (green) and
Ech (brown). Regression coefficients (intercept and slope), p-values and R2 are given in each panel.
5
https://doi.org/10.5194/bg-2019-372Preprint. Discussion started: 8 October 2019c© Author(s) 2019. CC BY 4.0 License.
27
Figure 5: Relationship between average water recession (WAR) time coefficients and a) the R² of the DOC_increase MLR models
or b) the DOC concentration of each water level monitoring point at the peatland of Bernadouze (green) or Ech (brown). Piezometer
plots correspond to solid circles and the mean of the piezometers at each site is surrounded in black, stream plots correspond to
striped circles. Pie charts in a) represent the relative importance of the water level increase variable in the R² of each model. Markers 5 in b) represent the mean measurements and vertical segments the standard deviations of DOC concentration at each location.
https://doi.org/10.5194/bg-2019-372Preprint. Discussion started: 8 October 2019c© Author(s) 2019. CC BY 4.0 License.
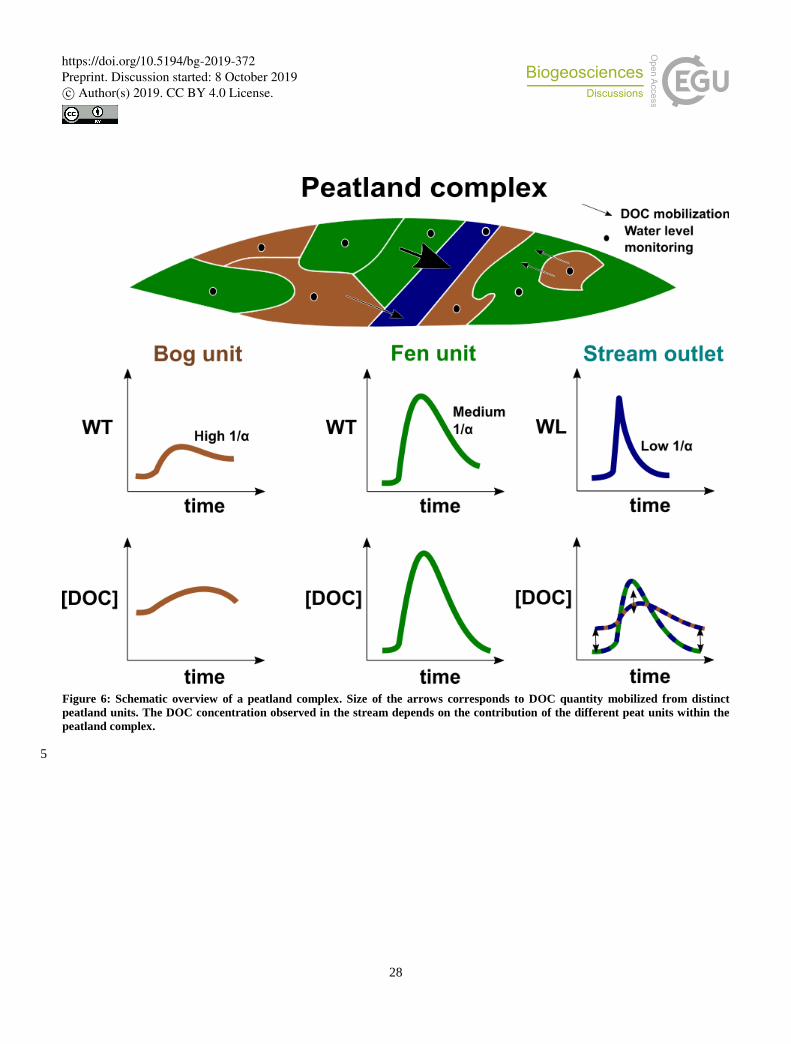
28
Figure 6: Schematic overview of a peatland complex. Size of the arrows corresponds to DOC quantity mobilized from distinct
peatland units. The DOC concentration observed in the stream depends on the contribution of the different peat units within the
peatland complex.
5
https://doi.org/10.5194/bg-2019-372Preprint. Discussion started: 8 October 2019c© Author(s) 2019. CC BY 4.0 License.
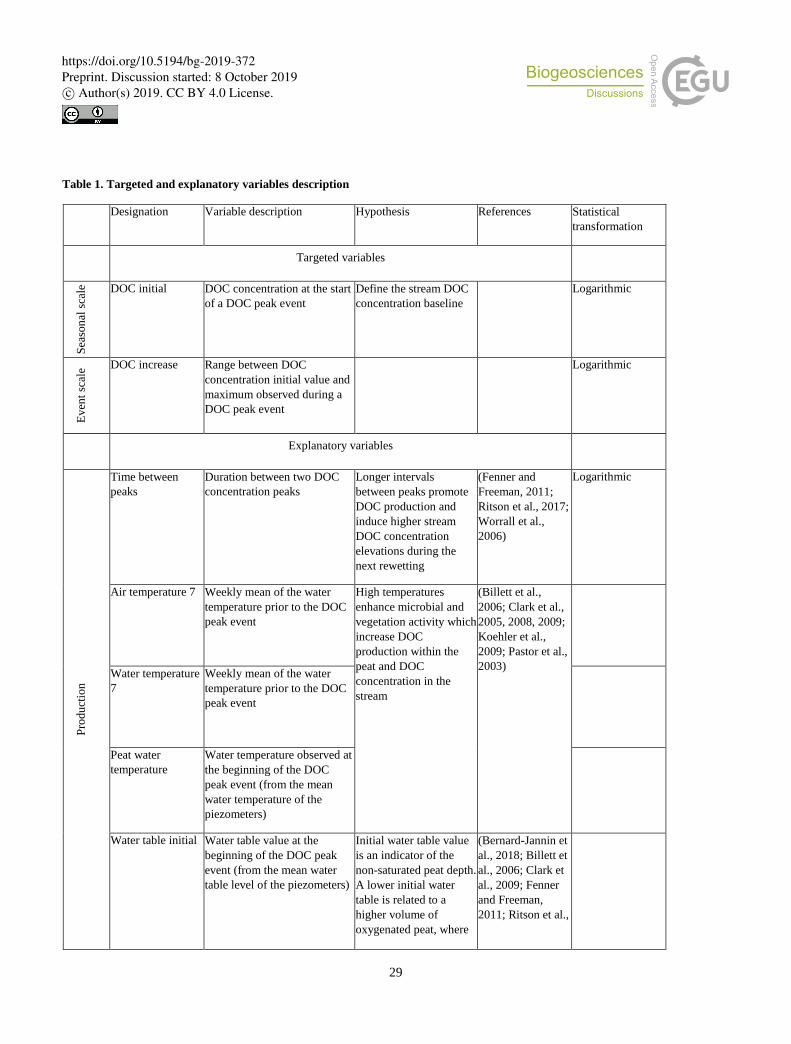
29
Table 1. Targeted and explanatory variables description
Designation Variable description Hypothesis References Statistical
transformation
Targeted variables
Sea
son
al s
cale
DOC initial DOC concentration at the start
of a DOC peak event
Define the stream DOC
concentration baseline
Logarithmic
Ev
ent
scal
e DOC increase Range between DOC
concentration initial value and
maximum observed during a
DOC peak event
Logarithmic
Explanatory variables
Pro
du
ctio
n
Time between
peaks
Duration between two DOC
concentration peaks
Longer intervals
between peaks promote
DOC production and
induce higher stream
DOC concentration
elevations during the
next rewetting
(Fenner and
Freeman, 2011;
Ritson et al., 2017;
Worrall et al.,
2006)
Logarithmic
Air temperature 7 Weekly mean of the water
temperature prior to the DOC
peak event
High temperatures
enhance microbial and
vegetation activity which
increase DOC
production within the
peat and DOC
concentration in the
stream
(Billett et al.,
2006; Clark et al.,
2005, 2008, 2009;
Koehler et al.,
2009; Pastor et al.,
2003)
Water temperature
7
Weekly mean of the water
temperature prior to the DOC
peak event
Peat water
temperature
Water temperature observed at
the beginning of the DOC
peak event (from the mean
water temperature of the
piezometers)
Water table initial Water table value at the
beginning of the DOC peak
event (from the mean water
table level of the piezometers)
Initial water table value
is an indicator of the
non-saturated peat depth.
A lower initial water
table is related to a
higher volume of
oxygenated peat, where
(Bernard-Jannin et
al., 2018; Billett et
al., 2006; Clark et
al., 2009; Fenner
and Freeman,
2011; Ritson et al.,
https://doi.org/10.5194/bg-2019-372Preprint. Discussion started: 8 October 2019c© Author(s) 2019. CC BY 4.0 License.
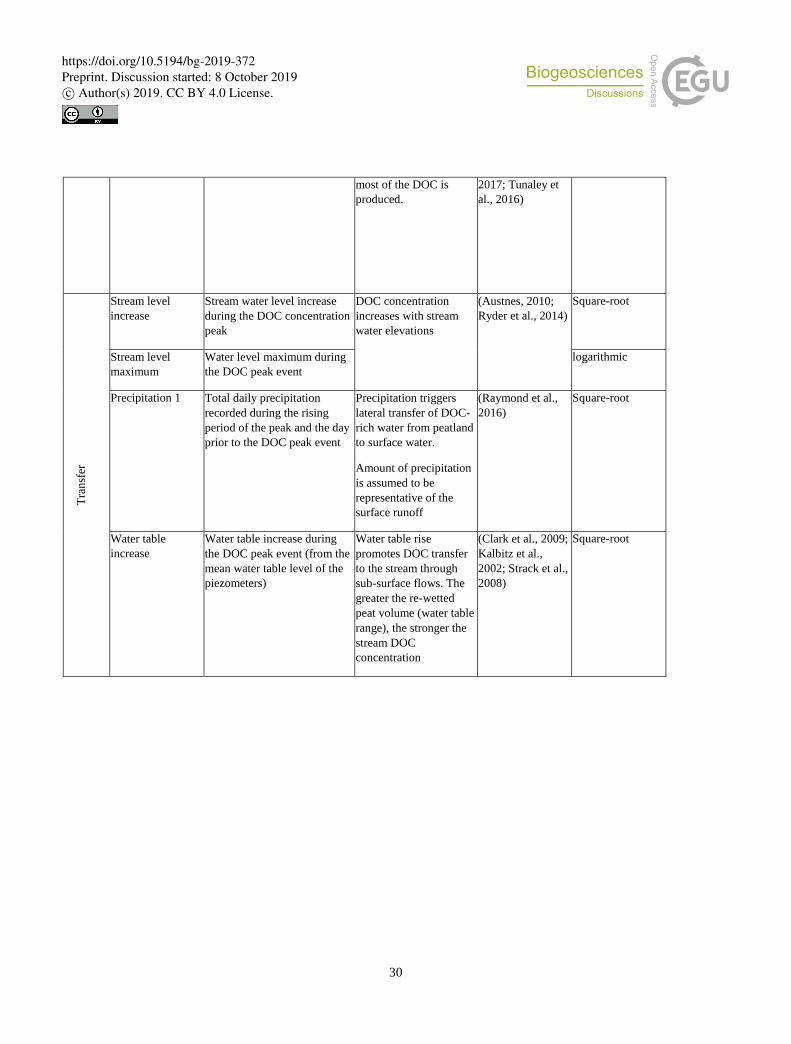
30
most of the DOC is
produced.
2017; Tunaley et
al., 2016)
Tra
nsf
er
Stream level
increase
Stream water level increase
during the DOC concentration
peak
DOC concentration
increases with stream
water elevations
(Austnes, 2010;
Ryder et al., 2014)
Square-root
Stream level
maximum
Water level maximum during
the DOC peak event
logarithmic
Precipitation 1 Total daily precipitation
recorded during the rising
period of the peak and the day
prior to the DOC peak event
Precipitation triggers
lateral transfer of DOC-
rich water from peatland
to surface water.
Amount of precipitation
is assumed to be
representative of the
surface runoff
(Raymond et al.,
2016)
Square-root
Water table
increase
Water table increase during
the DOC peak event (from the
mean water table level of the
piezometers)
Water table rise
promotes DOC transfer
to the stream through
sub-surface flows. The
greater the re-wetted
peat volume (water table
range), the stronger the
stream DOC
concentration
(Clark et al., 2009;
Kalbitz et al.,
2002; Strack et al.,
2008)
Square-root
https://doi.org/10.5194/bg-2019-372Preprint. Discussion started: 8 October 2019c© Author(s) 2019. CC BY 4.0 License.
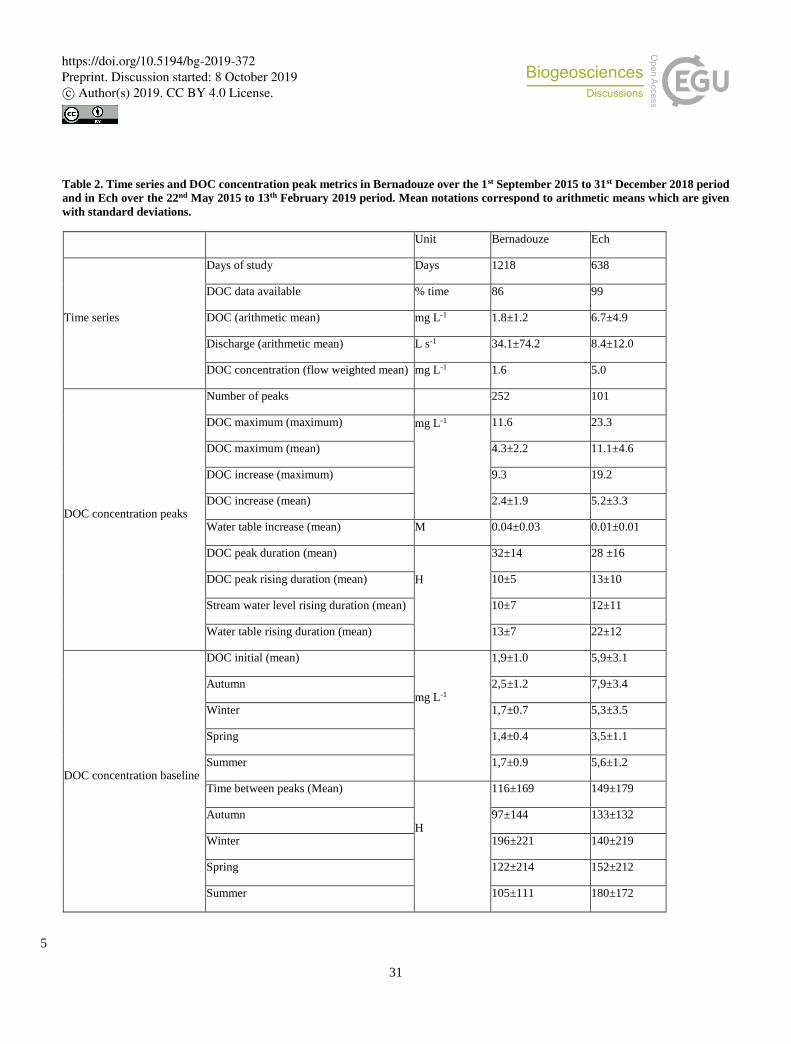
31
Table 2. Time series and DOC concentration peak metrics in Bernadouze over the 1st September 2015 to 31st December 2018 period
and in Ech over the 22nd May 2015 to 13th February 2019 period. Mean notations correspond to arithmetic means which are given
with standard deviations.
Unit Bernadouze Ech
Time series
Days of study Days 1218 638
DOC data available % time 86 99
DOC (arithmetic mean) mg L-1 1.8±1.2 6.7±4.9
Discharge (arithmetic mean) L s-1 34.1±74.2 8.4±12.0
DOC concentration (flow weighted mean) mg L-1 1.6 5.0
DOC concentration peaks
Number of peaks 252 101
DOC maximum (maximum) mg L-1
11.6 23.3
DOC maximum (mean) 4.3±2.2 11.1±4.6
DOC increase (maximum) 9.3 19.2
DOC increase (mean) 2.4±1.9 5.2±3.3
Water table increase (mean) M 0.04±0.03 0.01±0.01
DOC peak duration (mean)
H
32±14 28 ±16
DOC peak rising duration (mean) 10±5 13±10
Stream water level rising duration (mean) 10±7 12±11
Water table rising duration (mean) 13±7 22±12
DOC concentration baseline
DOC initial (mean)
mg L-1
1,9±1.0 5,9±3.1
Autumn 2,5±1.2 7,9±3.4
Winter 1,7±0.7 5,3±3.5
Spring 1,4±0.4 3,5±1.1
Summer 1,7±0.9 5,6±1.2
Time between peaks (Mean)
H
116±169 149±179
Autumn 97±144 133±132
Winter 196±221 140±219
Spring 122±214 152±212
Summer 105±111 180±172
5
https://doi.org/10.5194/bg-2019-372Preprint. Discussion started: 8 October 2019c© Author(s) 2019. CC BY 4.0 License.
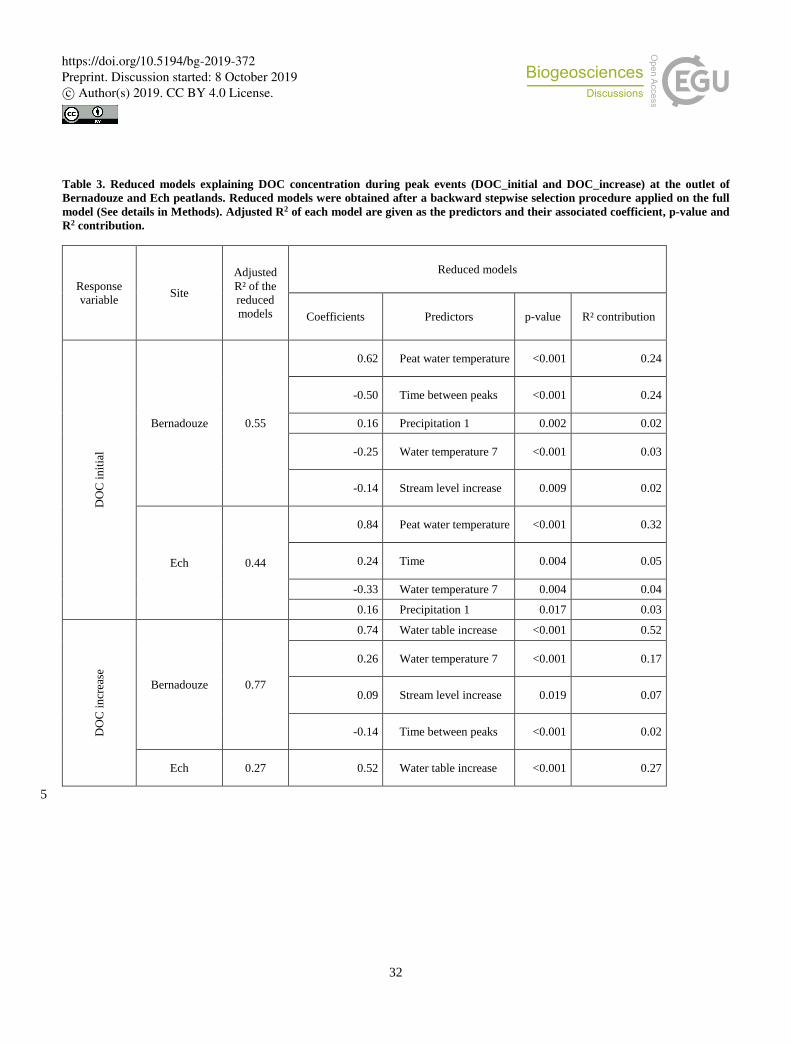
32
Table 3. Reduced models explaining DOC concentration during peak events (DOC_initial and DOC_increase) at the outlet of
Bernadouze and Ech peatlands. Reduced models were obtained after a backward stepwise selection procedure applied on the full
model (See details in Methods). Adjusted R2 of each model are given as the predictors and their associated coefficient, p-value and
R2 contribution.
Response
variable Site
Adjusted
R² of the
reduced
models
Reduced models
Coefficients Predictors p-value R² contribution
DO
C i
nit
ial
Bernadouze 0.55
0.62 Peat water temperature <0.001 0.24
-0.50 Time between peaks <0.001 0.24
0.16 Precipitation 1 0.002 0.02
-0.25 Water temperature 7 <0.001 0.03
-0.14 Stream level increase 0.009 0.02
Ech 0.44
0.84 Peat water temperature <0.001 0.32
0.24 Time 0.004 0.05
-0.33 Water temperature 7 0.004 0.04
0.16 Precipitation 1 0.017 0.03
DO
C i
ncr
ease
Bernadouze 0.77
0.74 Water table increase <0.001 0.52
0.26 Water temperature 7 <0.001 0.17
0.09 Stream level increase 0.019 0.07
-0.14 Time between peaks <0.001 0.02
Ech 0.27 0.52 Water table increase <0.001 0.27
5
https://doi.org/10.5194/bg-2019-372Preprint. Discussion started: 8 October 2019c© Author(s) 2019. CC BY 4.0 License.

33
Figure A1. Pearson correlation matrices between the DOC concentration targeted variables and common explanatory variables at
Bernadouze a) and Ech b). In view of their strong correlation with other variables (Pearson’s correlation |r > 0.7|), the air
temperature over 7 days (air_temp_bf7d), the stream water level maximum (log_water_level_max) and the initial water table level
(piezo_level_initial) were excluded from the analysis. The air temperature over 7 days was preferentially excluded compared to 5 water temperature over 7 days because of data reliability (air temperature was gap-filled at Ech).
https://doi.org/10.5194/bg-2019-372Preprint. Discussion started: 8 October 2019c© Author(s) 2019. CC BY 4.0 License.