seasonal variations in trophic dynamics of nanoflagellates and
TRANSCRIPT

AQUATIC MICROBIAL ECOLOGYAquat Microb Ecol
Vol. 51: 263–274, 2008doi: 10.3354/ame01196
Published June 16
INTRODUCTION
Since the early 1970s, bacteria have been recognizedas an important energy and carbon source in marinepelagic ecosystems (Pomeroy 1974). This knowledgehas greatly expanded our view of plankton communitystructure and ecology, and Azam et al. (1983) formal-ized the concept of a microbial loop that recoversenergy and carbon shunted from a phytoplankton-based food web through the bacterioplankton. Bacte-ria are generally the most abundant component of thepicoplankton (0.2 to 2 µm) size fraction, though they donot change much in density (Tsai et al. 2005), and theirnumbers vary by less than 1 order of magnitude over
the course of a year (Cole & Caraco 1993). Althoughbacteria, generally considered to be a significant com-ponent of planktonic food webs, mediate key pro-cesses in biogeochemical cycles (Cole 1999), the tem-poral and spatial change of mechanisms that regulatetheir biomass are still poorly understood. Experimentalfield studies of the relatively low seasonal variation inbacterial abundance in aquatic ecosystems havedemonstrated that their abundance is tightly regulatedby factors such as substrate supply (Murrell 2003),nutrients (Billen et al. 1990), predation (Tsai et al.2005), temperature (Shiah & Ducklow 1994) and viralinfections (Weinbauer & Peduzzi 1995). Furthermore,due to the generally negative covariation between
© Inter-Research 2008 · www.int-res.com*Corresponding author. Email: [email protected]
Seasonal variations in trophic dynamics ofnanoflagellates and picoplankton in coastal waters
of the western subtropical Pacific Ocean
An-Yi Tsai1, Kuo-Ping Chiang1, 3, 4,*, Jeng Chang2, 3, Gwo-Ching Gong3
1Institute of Environmental Biology and Fishery Science, 2Institute of Marine Biology, 3Institute of Marine EnvironmentalChemistry and Ecology, and 4Center for Marine Bioscience and Biotechnology, National Taiwan Ocean University,
Keelung 202-24, Taiwan, ROC
ABSTRACT: This investigation was undertaken between August 2002 and July 2003 at a coastal sta-tion on the southern edge of the East China Sea. We found a 2-phase (warm season, >25°C [June toOctober] and cold season, <25°C [November to May]) seasonal cycle with a 10-fold variation in thegrowth of bacteria (heterotrophic bacteria only) and picophytoplankton, primarily coccoid cyanobac-teria (Synechococcus spp.), and nanoflagellate grazing rates upon them. Growth rate in bacteria andSynechococcus spp. appeared to be affected by changes in temperature, and the nanoflagellate graz-ing rate was controlled by concentrations of bacteria and Synechococcus spp. The seasonal cycles ofabundance in bacteria and Synechococcus spp. were a reflection of their changing net growth rates(i.e. picoplankton growth rates – nanoflagellate grazing rates), which were highest at the beginningof the warm season. During the warm season, nanoflagellates consumed an equal amount of bacteriaand Synechococcus spp.; therefore, growth in both groups was affected equally by grazing in thewarm season. However, during the cold season, bacteria contributed more to nanoflagellate carbonconsumed than did Synechococcus spp. because the growth rate of Synechococcus spp. was low. Weconclude that during the warm season a significant part of bacteria and Synechococcus spp. carbonis channeled through the microbial loop, possibly making it an important link between primary pro-duction and higher trophic levels.
KEY WORDS: Synechococcus spp. · Picoplankton · Nanoflagellate · Microbial loop
Resale or republication not permitted without written consent of the publisher

Aquat Microb Ecol 51: 263–274, 2008
nutrient concentration and seawater temperature (Tsaiet al. 2005), these observations suggest that bacterialproduction rates are weakly related to temperatureover the summer, but strongly affected by temperatureduring cold months. Similarly, Ochs et al. (1995) foundthat bacterial growth rates were unrelated to tempera-tures above 14°C, which was further confirmed byShiah & Ducklow (1994). Their findings suggest thattemperature might control bacterial growth activityduring the colder months. Growth in the warmer sea-sons seems to be controlled by factors such as substratesupply or availability of nutrients (Keil & Kirchman1991). Tsai et al. (2005) found a significant diel varia-tion in bacterial growth, but there is a lack of data onthe seasonal variation in bacterial growth and ofnanoflagellate grazing rates, and on factors controllingthe effect of nanoflagellate grazing on bacteriathroughout the year. One study (Choi 1994), however,suggested that water temperature and prey density areamong the most important factors regulating the sea-sonal grazing rate on bacteria by protists.
Picophytoplankton, predominantly coccoid cyano-bacteria (Synechococcus spp.), on the other hand, canmake up a major proportion of the phytoplankton bio-mass and production in oceanic waters (Olson et al.1990), and contribute up to 90% of total phytoplanktonbiomass in oligotrophic waters (Probyn 1985). Chianget al. (2002) demonstrated that temperature controlledthe seasonal variation of Synechococcus spp. in theEast China Sea. Chang et al. (1996) also suggested thatthe abundance of Synechococcus spp. in the subtropi-cal western Pacific Ocean coastal ecosystem wasclosely related to water temperature.Moreover, Tsai et al. (2005) confirmedthe results of Chang et al. (1996) anddemonstrated a diel fluctuation in Syne-chococcus spp. abundance at water tem-peratures above 25°C in a subtropicaloligotrophic coastal ecosystem. Ourresults support these conclusions, andwe found bacteria and Synechococcusspp. growth to be controlled by tempera-ture and nutrients. Wikner et al. (1990)reported grazing to be an importantremoval process for the picoplanktoncommunity in aquatic ecosystems; theconsumption of picoplankton by phago-trophic protists has been recognized as amajor pathway of carbon flow (Nagata1988, Dolan & 2imek 1999, Sanders et al.2000, Tsai et al. 2005). Thus, top-downcontrols such as grazing are thought toset limits on picoplankton biomass andabundance. In summary, the seasonal ordiel oscillation in the abundance of
picoplankton is controlled by 2 different processes:top-down grazing and bottom-up growth.
Bacteria and Synechococcus spp. make up the majorproportion of the picoplankton community (Tsai et al.2005). The study on the microbial loop in the subtropicalwestern Pacific coastal waters was limited to theabundances of the bacteria Synechococcus spp. andnanoflagellates during a series of samplings over 4 yr(Tsai et al. 2005). Those authors, however, lacked suffi-cient information to discuss the seasonality of growth ofbacteria and Synechococcus spp. or nanoflagellategrazing rates upon them. The present study seeks tomeasure and explore mechanisms controlling the annualdynamic growth of bacteria and Synechococcus spp. andgrazing rates upon both groups by nanoflagellates.
MATERIALS AND METHODS
Sampling. Samples were collected at a coastal sta-tion (25° 09.4’ N, 121° 46.3’ E) on a rocky shore of north-east coast of Taiwan (Fig. 1). In our previous study(Tsai et al. 2005), we collected a series of morning(09:00 to 10:00 h) and evening (21:00 to 22:00 h) sam-ples on the same day on a weekly basis over a period ofabout 4 yr (data shown in Fig. 2).
Samples for this study of seasonal patterns of thegrowth of bacteria and Synechococcus spp. and nano-flagellate grazing rates were collected bimonthly fromAugust 2002 to July 2003. On each sampling day, sea-water was collected twice, from 09:00 to 10:00 h in themorning and 21:00 to 22:00 h in the evening (local
264
Fig. 1. Sampling site at the northern end of Taiwan and surrounding area inthe East China Sea
Tsai et al.: Seasonal variations in plankton trophic dynamics
time). Water temperature was measured immediatelyafter the sampling bucket was cast. All samples werebrought to the laboratory within 30 min.
Plankton abundance and nitrate. Samples for themeasurement of pico- and nanoplankton quantitieswere fixed immediately by adding glutaraldehyde togive a final concentration of 1% (v/v). Using a 0.45 µmpore size Millipore filter as a pad to obtain a uniformdistribution of cells and low pressure (<100 mm Hg),2 ml of each sample was filtered onto a 0.2 µm pore sizeblack Nuclepore filter to be used to measure bacterialnumber. Also, 20 to 40 ml samples were filtered onto a0.8 µm pore size black Nuclepore filter to enumeratenanoflagellates. The cells left on the filter mem-branes were stained with 4’6-diamidino-2-phenylin-dole (DAPI) at a final concentration of 1 µg ml–1 (Porter& Feig 1980), and examined at 1000× by means of anepifluorescence microscope (Nikon Optiphot-2). Bacte-ria and non-pigmented nanoflagellates were identified
by their blue fluorescence under UV illumination.Autotrophic picoplankton (cyanobacteria Synechococ-cus spp.) in 4 to 10 ml of seawater were collected on a0.2 µm pore size Nuclepore filter without staining.Cyanobacteria and pigmented nanoflagellates wereidentified by their orange and red autofluorescence asobserved under the blue excitation light. To obtain reli-able estimates of abundance, at least 100 nanoflagel-lates, 400 Synechococcus spp. and 800 bacteria werecounted per sample. Nitrate was reduced to nitrite withcadmium wires activated by means of a copper sulfatesolution, and the nitrite was converted to the pink azodye for colorimetric determination (Gong et al. 1995).
Growth and grazing rates. Using the differential fil-tration method (Wright & Coffin 1984), we estimatedthe growth and grazing rates from August 2002 to July2003. Samples were treated twice to remove predators ofdifferent sizes. A 2 µm pore polycarbonate filter wasused to remove predators of bacteria and Synechococcusspp., and a 10 µm pore polycarbonate filter was used toremove predators of nanoflagellates. The filtration pro-cess was designed to exclude picoplankton grazers(grazer-free) from the 2 µm filtered fraction and allowedthem to remain in the 10 µm fraction; however, when weexamined the influence of fractionation on nanoflagel-lates, we found that about 5 to 12% of the nanoflagellatecells passed through the 2 µm filtered fraction. We de-termined that this number would not significantly affectour estimates of picoplankton growth rates. Each sizefraction was then transferred into triplicate polycarbon-ate bottles to a volume of 125 ml in each bottle. Allewaltet al. (2006) suggested that the half-saturation light in-tensity for maximum photosynthesis of Synechococcusspp. was 70 to 220 µmol quanta m–2 s–1. Thus, for samplescollected in the morning, the bottles were incubated in awater bath at in situ temperature and under continuousillumination at ca. 150 µmol quanta m–2 s–1 for 6 h. Forthose collected in the evening, the bottles were in-cubated in darkness for the same length of time. At thebeginning and end of each incubation period, triplicatesamples (50 ml each) were used in our count of bacteria,Synechococcus spp. and nanoplankton according toprocedures described previously.
Growth rates (μ, h–1) of bacteria and Synechococcusspp. were calculated based on the results from the<2 µm filtrates, and those of nanoflagellates were cal-culated from the <10 µm filtrates according to thefollowing equation:
μ = (ln Nf × ln Ni)/(Tf – Ti)
where Ni and Nf are cell concentrations (cells ml–1) atthe beginning (Ti) and end (Tf) of the incubation periodin corresponding size fractions.
Microbial abundance was converted into carbon bio-mass (B, µg C l–1) using the following equation:
265
5
6
7
Lo
g b
acte
ria(c
ells
ml–1
)
3
4
5
6
Lo
g S
ynec
hoco
ccus
(cel
ls m
l–1)
2Oct Feb Jun Oct Feb Jun Sep Jan May Sep Feb Jun
Oct Feb Jun Oct Feb Jun Sep Jan May Sep Feb Jun
Oct Feb Jun Oct Feb Jun Sep Jan May Sep Feb Jun
3
4
5
Month/year
Log
nan
ofla
gel
late
s(c
ells
ml–1
)
1999 2000 2001 2002 2003
A
B
C
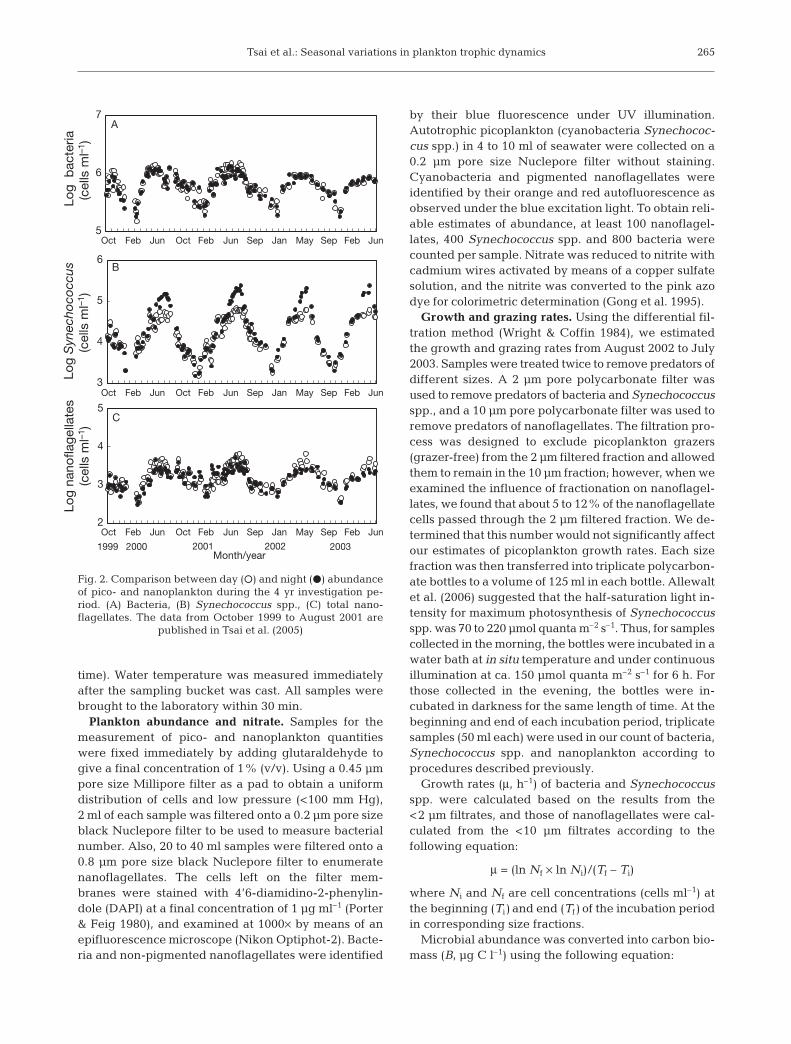
Fig. 2. Comparison between day (s) and night (d) abundanceof pico- and nanoplankton during the 4 yr investigation pe-riod. (A) Bacteria, (B) Synechococcus spp., (C) total nano-flagellates. The data from October 1999 to August 2001 are
published in Tsai et al. (2005)
Aquat Microb Ecol 51: 263–274, 2008
B = N × C
where N = cell concentration (cells ml–1) and C = esti-mated cell carbon content (fg C cell–1). Carbon contentsfor bacteria were taken from Caron et al. (1995) andDucklow & Carlson (1992), and those for Synechococcusspp. from Cuhel & Waterbury (1984) and Børsheim &Bratbak (1987) (see ‘Discussion’). Also, a value of 220 fgC µm–3 for nanoflagellates (Børsheim & Bratbak 1987)was used to estimate carbon biomass. For cell volume ofnanoflagellates, linear dimensions (length and width) ofat least 20 cells were measured in each sample, and cellvolume was calculated as an elliptical sphere.
Production rates (P, µg C l–1 h–1) of bacteria andSynechococcus spp. were estimated from the <2 µmfiltrates using the following equation:
P = μ × Bi
where Bi is the in situ cell biomass (µg C l–1) at thesampling time.
Consumption rate of nanoflagellates (G, µg C l–1 h–1)on bacteria and Synechococcus spp. was calculatedaccording to the following equation:
G = (Ppico)2µm – (Ppico)10µm
where (Ppico)2µm and (Ppico)10µm are the production rates(µg C l–1 h–1) of picoplankton (bacteria and Syne-chococcus spp.) in the <2 µm and the <10 µm filtrates,respectively.
Then, the ingestion rate of nanoflagellates (I, cellsflagellate–1 h–1) on bacteria and Synechococcus spp.was calculated according to the following equation:
I = G/(mean flagellate × C)
where C = estimated cell carbon content of bacteria andSynechococcus spp. and mean flagellate was estimatedusing the following equation (Gurung et al. 2000):
mean flagellate = (flagellatef – flagellatei)/ln(flagellatef / flagellatei)
where flagellatef and flagellatei are final and initialabundance of total nanoflagellates, respectively.Clearance rate (nl flagellate–1 h–1) was calculated bydividing the ingestion rate by the concentration ofbacteria or Synechococcus spp.
RESULTS
Seasonal patterns of bacteria, Synechococcus spp.and nanoflagellates
Surface water temperature at our sampling siteaveraged 16°C in March and increased gradually to
29°C in June, stabilized from June to September, andthen decreased thereafter. Water temperature wasconstantly above 25°C from June to October (warmseason) and below 25°C from November to May (coldseason). During the warm season, daytime tempera-ture was generally 0.5°C to 1.5°C higher than night-time temperature. Salinity ranged from 33.1 to34.3 psu annually. A drop in salinity level to below 34was probably caused by rainfall. Monthly average ofnitrate concentration was highest between Novemberand May, when it reached 12 µmol l–1. From June toOctober, average nitrate concentration decreased toabout 1 µmol l–1. There was also a similar seasonalcycle in abundance of bacteria, Synechococcus spp.and nanoflagellates (Fig. 2). High abundances of bac-teria, Synechococcus spp. and nanoflagellates werealways observed during the warm season throughoutour 4 yr investigation. Bacterial abundance rangedfrom 0.2–0.4 × 10⁶ to about 1 × 10⁶ cells ml–1. Theabundance was maintained at a relatively high levelfrom June to October (Fig. 2A) and then valuesdropped drastically and fluctuated between 0.2 × 10⁶
cells ml–1 and 0.6 × 10⁶ cells ml–1 from November toMay. Abundance of Synechococcus spp. was low(0.2–0.7 × 10⁴ cells ml–1) during periods of low tem-perature (January to March). When temperature roseabove 25°C at the beginning of June, Synechococcusspp. increased to 5 × 10⁴ cells ml–1, which was main-tained until October. Between June and October, theabundance of Synechococcus spp. was always higherat night than during the day, especially in July andAugust (Fig. 2B). However, the seasonal variation inabundance of the total nanoflagellates was similar tothat of bacteria, >2 × 10³ cells ml–1 between June andOctober and <1 × 10³ cells ml–1 between Novemberand May (Fig. 2C).
Seasonal changes in growth rate of bacteria andSynechococcus spp.
The growth rate of bacteria ranged from 0.005 to0.062 h–1 during the day and from 0.001 to 0.031 h–1 atnight (Fig. 3A). During the warm season, daytimegrowth rate of bacteria was higher than nighttimegrowth rate (paired t-test, p < 0.05). The maximumgrowth rate occurred during the warm period(Table 1). Furthermore, there was also a clear positiverelationship between bacterial growth rate and tem-perature between 16 and 25°C (Fig. 4A), though a fur-ther increase in temperature may not result in higherbacterial growth.
Growth rates of Synechococcus spp. ranged between0.003 and 0.046 h–1 during the day and from 0.005 to0.058 h–1 at night (Fig. 3B). The seasonal and diel cycles
266

Tsai et al.: Seasonal variations in plankton trophic dynamics
of growth rate in Synechococcus spp. were also highbetween June and October and low during the otherperiod. However, in contrast to bacterial growth rates,the growth rate of Synechococcus spp. was somewhat
higher at night (paired t-test, p < 0.05) (Fig. 3B). Weshowed that a linear relationship exists between Syne-chococcus spp. growth and temperature (Fig. 4B).
Seasonal changes in grazing rate of nanoflagellateson picoplankton and clearance rate of bacteria and
Synechococcus spp.
Grazing rates on bacteria by nanoflagellatesbetween August 2002 and July 2003 ranged from 0.004to 0.063 h–1 during the day (Fig. 5A), which was gener-ally higher than at night (0.002 to 0.030 h–1) (paired t-test, p < 0.05), and higher between June and October(August to October 2002 and June to July 2003). A sim-ilar seasonal variation was found in Synechococcusspp., generally with a higher grazing rate when watertemperature was high (>25°C) (Fig. 5B). However, incontrast to nanoflagellate grazing rates on bacteria, thegrazing rates on Synechococcus spp. were higher atnight between June and October (Day: 0.014 to0.03 h–1, night: 0.031 to 0.076 h–1) (paired t-test, p <0.05). Our plots of ingestion rates of nanoflagellatesagainst prey concentration (bacteria and Synechococ-cus spp.) indicate that nanoflagellate ingestion is sen-sitive to prey concentrations (Fig. 6).
Overall, our results show that clearance rate of bacte-ria by nanoflagellates is responsive to increase in bacte-ria abundance (Fig. 7A) and was somewhat though notsignificantly higher during the day (Fig. 7A). As indi-cated in Fig. 7B, the clearance rate in nanoflagellates ofSynechococcus spp. below 5 × 10⁴ cells ml–1 is higher atnight than during the day.
Comparison of picoplankton growth and nanoflagellate grazing
Regardless of day or night, there was a strong in-phase 1:1 relationship between bacterial growth andnanoflagellate grazing (Fig. 8A). High growth ratescorresponded with high grazing rate on bacteria(paired t-test, p > 0.05). As for Synechococcus spp.,growth rate was higher during the day (Fig. 8B) (pair t-test, p < 0.05), and, unlike the bacteria growth rate, itwas not in-phase with nanoflagellate grazing rate. Fur-ther, the monthly average net growth rates (picoplank-ton growth × nanoflagellate grazing) of bacteria andSynechococcus spp. indicated a clear seasonal pattern(Fig. 9), with the lowest rates occurring in November,and the highest in April and May. On the whole, netgrowth rates of bacteria and Synechococcus spp. dur-ing the warm season were negligible (<0.005 h–1), sogrowth in this season was probably balanced by lossesto nanoflagellate grazing (Fig. 9).
267
0
0.02
0.04
0.06
0.08
0.1
0Aug Oct Dec Feb Apr Jun
Aug Oct Dec Feb Apr Jun
0.02
0.04
0.06
0.08
0.1
Gro
wth
rat
e (h
–1)
Month/year20032002
A
B
Fig. 3. Comparison between day (s) and night (d) growthrate in picoplankton between August 2002 and July 2003 for(A) bacteria and (B) Synechococcus spp. Error bars are ±SD
Bacteria SynechococcusGrowth Grazing Growth Grazing
Warm seasonJun 2003 0.040 0.038 0.037 0.036Jul 2003 0.046 0.046 0.039 0.036Aug 2002 0.039 0.038 0.049 0.047Sep 2002 0.037 0.035 0.050 0.050Oct 2002 0.036 0.036 0.037 0.039Mean 0.040 0.039 0.042 0.042SD 0.004 0.004 0.006 0.007
Cold seasonNov 2002 0.014 0.017 0.015 0.025Dec 2002 0.003 0.005 0.006 0.008Jan 2003 0.005 0.004 0.007 0.008Feb 2003 0.006 0.005 0.004 0.001Mar 2003 0.008 0.004 0.011 0.007Apr 2003 0.018 0.013 0.015 0.009May 2003 0.027 0.017 0.026 0.021Mean 0.012 0.009 0.012 0.011SD 0.009 0.006 0.008 0.008
Table 1. Growth and grazing loss rates of bacteria and Syne-chococcus spp. during June to October (warm season) and
November to May (cold season); units are h–1

Aquat Microb Ecol 51: 263–274, 2008
DISCUSSION
This is the first report to describe diel variation ingrowth of bacteria and Synechococcus spp. and graz-ing rates upon them by nanoflagellates throughout afull year at our study site. We found that bacterial andSynechococcus spp. growth rates in this subtropicalcoastal ecosystem ranged between 0.005 and 0.062 h–1
and between 0.003 and 0.058 h–1 annually, respec-tively (Fig. 3). Nanoflagellate grazing rates on bacteriaand Synechococcus spp. ranged from 0.004 to 0.063and 0.002 to 0.076 h–1 annually, respectively (Fig. 5).
We compared the picoplankton growth and nano-plankton grazing rates reported by different authorsfrom different oceanic waters using different methods(Table 2). A wide, mostly seasonal, range in growthand grazing rates was evident. While each one of thesemethods, e.g. size fractionation, has inherent advan-tages and limitations, some values may be under-estimated if the predator-free environment (<2 µm) istaken into consideration, as the grazing activity of pro-tozoa may stimulate bacterial growth (Chase & Price1997, Gurung et al. 2000, Metzler et al. 2000). How-ever, Gasol & Moran (1999) had an opposite view and
268
y = –0.0001x3 + 0.007x2 – 0.16x + 1.2R2 = 0.94 (Day)
R2 = 0.95 (Night)y = –0.0001x3 + 0.009x2 – 0.19x + 1.4
0
0.02
0.04
0.06
0.08
0.1
y = 0.0042x – 0.07
y = 0.0035x – 0.06R2 = 0.94 (Day)
R2 = 0.87 (Night)
015 20 25 30
15 20 25 30
0.02
0.04
0.06
0.08
0.1
Temperature (°C)
A
B
Gro
wth
rat
e (h
–1)
Fig. 4. Relationship between temperature and day (s) andnight (d) growth rate of picoplankton between August 2002and July 2003 for (A) bacteria and (B) Synechococcus spp.
0
0.02
0.04
0.06
0.08
0.1
0Aug Oct Dec Feb Apr Jun
Aug Oct Dec Feb Apr Jun
0.02
0.04
0.06
0.08
0.1
Gra
zing
rate
(h–1
)
Month/year20032002
A
B
Fig. 5. Comparison between day (s) and night (d) nanofla-gellate grazing rate on picoplankton between August 2002and July 2003 for (A) bacteria and (B) Synechococcus spp.
Error bars are ±SD
0
50
100
00
0 0.5 1
5 10 15
5
10
15y = 0.7x – 0.2, R2 = 0.80 (Day)y = 1.1x + 0.6, R2 = 0.81 (Night)
y = 102.2x – 18.5, R2 = 0.69 (Day)y = 67.4x – 10.8, R2 = 0.61 (Night)
A
B
Inge
stio
n ra
te (c
ells
flag
ella
te–1
h–1
)
Prey abundance(Synechococcus 104 cells ml–1)
Prey abundance(Bacteria 106 cells ml–1)
Fig. 6. Relationship between day (s) and night (d) abun-dance of picoplankton and nanoflagellate ingestion rate for
(A) bacteria and (B) Synechococcus spp.

Tsai et al.: Seasonal variations in plankton trophic dynamics
showed that the size fractionation method may causecell damage, which may then increase the amount ofdissolved organic matter present, inducing a possibleincrease in bacterial growth. In addition, Sherr et al.(1992) indicated that the grazing rate on picoplanktonshowed an overestimation because of the trophic cas-cade effect. These sources of error in commonly usedmethods have been extensively discussed in previouspapers (Chase & Price 1997, Gasol & Moran 1999).However, it is often difficult to identify specific sourcesof error under individual incubation conditions.
In our study, the ingestion rates were mostly in therange of 2 to 75 bacteria flagellate–1 h–1 and clearancerates were from 7 to 98 nl flagellate–1 h–1. The only ex-ception was at one data point in the warm season (in-gestion: 90 bacteria flagellate–1 h–1, clearance: 125 nlflagellate–1 h–1) (Fig. 6A). Boenigk & Arndt (2002) re-ported that the nanoflagellate capture rate is 5 to 10bacteria flagellate–1 h–1 at a food concentration of about106 bacteria ml–1, but they also indicated that the range
269
y = 89.9x + 8.4 R2 = 0.44 (Day)y = 42.5x + 21.8 R2 = 0.12 (Night)
00 0.2 0.4 0.6 0.8 1
50
100
150
200
00 5 10 15
50
100
150
200
250
Prey abundance(Synechococcus 104 cells ml–1)
Prey abundance(Bacteria 106 cells ml–1)
Cle
aran
ce r
ate
(nl f
lage
llate
–1 h
–1)
A
B
Fig. 7. Relationship between day (s) and night (d) abun-dance of picoplankton and nanoflagellate clearance rate for
(A) bacteria and (B) Synechococcus spp.
0
0.02
0.04
0.06
0.08
0.1
00 0.02 0.04 0.06 0.08 0.1
0 0.02 0.04 0.06 0.08 0.1
0.02
0.04
0.06
0.08
0.1
Growth rate (h–1)
Gra
zing
rat
e (h
–1)
A
B
Fig. 8. Comparison between day (s) and night (d) growthof picoplankton and nanoflagellate grazing rate betweenAugust 2002 and July 2003 for (A) bacteria and (B) Syne-
chococcus spp.
–0.015
–0.01
–0.005
–0.015
–0.01
–0.005
0
0.005
0.01
0.015
0
0.005
0.01
0.015
Aug Sep OctNov Dec Ja
nFe
bM
ar AprM
ay Jun Ju
l
Net
gro
wth
rat
es (
h–1)
2002 2003Month/year
A
B
Fig. 9. Changes in picoplankton net growth rate in an annualcycle for (A) bacteria and (B) Synechococcus spp. Errror
bars are ±SD

Aquat Microb Ecol 51: 263–274, 2008
of maximum ingestion rate was 30 to80 bacteria flagellate–1 h–1. Anotherstudy showed that the ingestion ratewas 11 to 67 bacteria flagellate–1 h–1
(Vaqué et al. 2002). In contrast, thehighest ingestion rates and clearancerates of nanoflagellates on Syne-chococcus spp. in our study wasabout 10 Synechococcus flagellate–1
h–1 and 200 nl flagellate–1 h–1, re-spectively. This value is higher thanthat reported by Kuosa (1991) in thedaytime (2.6 Synechococcus flagel-late–1 h–1). However, Sherr et al.(1991) reported that the rates ofclearance on fluorescently labeledalgae (FLA) ranged from negligibleto 20 to 830 nl flagellate–1 h–1. Fromthese results, the maximum inges-tion rate of picoplankton by nanofla-gellates in our study did not signifi-cantly differ from values reported inother studies. Our results show thatgrowth of and grazing on bacteriaand Synechococcus spp. in the mi-crobial loop has strong seasonal os-cillations. Values in our study arewithin the range of those reported inthe literature (Table 2).
Growth of bacteria andSynechococcus spp. and
nanoflagellate grazing rates
The seasonal variations in thegrowth of bacteria and Synechococ-cus spp. and nanoflagellate grazingrates upon these picoplankton aregenerally correlated with environ-mental factors that limit the rates.Experimental field studies haveidentified resources (organic carbonand inorganic nutrients) and tem-perature to be the main factors lim-iting the growth of bacteria andSynechococcus spp. (Carlsson &Caron 2001). The day and nightgrowth rates of Synechococcus spp.were strongly related to tempera-ture in our study (Fig. 4B), whichsuggests that the seasonal variationof Synechococcus spp. growth iscontrolled by seasonal fluctuation intemperature, a conclusion that has
270
Tem
per
atu
reA
bu
nd
ance
G
row
th r
ate
Pro
du
ctio
nG
razi
ng
rat
e G
razi
ng
los
sS
ourc
e an
d m
eth
od(°
C)
(106
cell
s m
l–1 )
(h–
1 )(1
04ce
lls
ml–
1h
–1 )
(h–
1 )(1
04ce
lls
ml–
1h
–1 )
Bac
teri
aS
ub
arct
ic–1
.8–
00.
06–
0.33
0.00
8–
0.04
0.00
2–
0.03
An
der
son
& R
ivk
en (
2001
)a
Su
bar
ctic
–1.7
–2.4
(Ja
n–
Feb
)0.
65–1
.10
–30
0–1
9.6
Vaq
ué
et a
l. (
2002
)b
Su
bar
ctic
0–1
2.5
0.83
–3.
580.
011
–28.
6H
ein
änen
(19
92)a
Su
bar
ctic
0–2
00.
2–1
.90
–6
0–
6W
ikn
er &
Hag
strö
m (
1991
)a
Tem
per
ate
–2–1
40.
2–1
0.00
3–
0.03
50
–0.
027
Pu
tlan
d (
2000
)c
Tem
per
ate
0.7
–23.
3–
0.00
4–
0.01
Ku
osa
(199
1)d
Tem
per
ate
9–2
50.
4–2
0.01
–0.
070.
37–1
2.42
0.37
–15.
542
oliç
& K
rstu
lovi
ç (1
994)
d
Tem
per
ate
5–
7(M
ay t
o A
ug
ust
)1.
6–1
2.4
5–
36C
hoi
et
al. (
2003
)a
Tem
per
ate
5–>
251.
4–
3.7
9–
35S
chu
ltz
et a
l. (
2003
)a
Tem
per
ate
5.3
–>30
1–
61
–18
Joh
nso
n &
War
d (
1997
)b
Tem
per
ate
8.6~
140.
24–1
.20.
1–
3.5
Hal
l et
al.
(19
99)a
Tem
per
ate
11.1
–20.
81.
6–2
.30.
002
–0.
027
ns–
0.04
Mu
rrel
l &
Hol
lib
aug
h (
1998
)c
Tem
per
ate
13–2
00.
31–1
.10.
024
–0.
048
Lee
et
al. (
2001
)c
Tem
per
ate
16–
300.
5–
3n
s–18
0.2
–1.2
5C
hoi
et
al. (
2002
)a
Su
btr
opic
al18
–29
0.1
–1.0
0.00
5–
0.06
20.
05–
5.45
0.00
4–
0.06
30.
05–
5.55
Th
is s
tud
yd
Syn
ech
oco
ccu
s sp
p.
Tem
per
ate
11.1
–20.
83.
9–1
20
–0.
037
Mu
rrel
l &
Hol
lib
aug
h (
1998
)c
Tem
per
ate
–2–1
40.
07–1
.90.
003
–0.
010.
008
–0.
014
Pu
tlan
d (
2000
)c
Tem
per
ate
0.7
–23.
30.
7–
750
–0.
023
0.00
17–2
.97
Ku
osa
(199
1)d
Tem
per
ate
5–2
50.
05–
60.
008
–0.
06A
gaw
in e
t al
. (19
98)e
Tem
per
ate
9–2
00.
01–
0.03
0.00
9–
0.02
7X
iure
n &
Vau
lot
(199
2)f
Su
btr
opic
al12
–26
<0.
1–
60.
008
–0.
028
0.00
3–
0.01
7C
han
g e
t al
. (20
03)f
Su
btr
opic
al16
–29
0.22
–11
0.01
2–
0.04
3K
uo
(un
pu
bl.
dat
a)e
Su
btr
opic
al16
–29
0.21
–14
0.00
3–
0.05
80
–0.
520.
002
–0.
076
0–
0.8
Th
is s
tud
yd
a [3 H
] th
ymid
ine;
b[3 H
] le
uci
ne;
c dil
uti
on; d
size
fra
ctio
nat
ion
; e FD
C; f in
hib
itor
Tab
le 2
.S
easo
nal
var
iati
ons
of a
bu
nd
ance
, g
row
th o
f b
acte
ria
or S
ynec
hoc
occu
ssp
p.
and
nan
opla
nk
ton
gra
zin
g f
eatu
res
wit
h d
iffe
ren
t en
viro
nm
enta
l co
nd
itio
ns
det
erm
ined
by
the
cult
ure
met
hod
s in
th
e li
tera
ture

Tsai et al.: Seasonal variations in plankton trophic dynamics
been demonstrated by previous studies (Agawin et al.1998, Murrell 2003). Moreover, other factors, such aslight, can modulate the growth of Synechococcus spp.In our study area, the daytime mean light intensitywas 729 µmol quanta m–2 s–1 during the warm season,and 98 µmol quanta m–2 s–1 during the cold season(K.-P. Chiang unpubl. data). According to Allewalt etal. (2006) the saturation level of light intensity ofSynechococcus spp. is 70 to 220 µmol quanta m–2 s–1.Based on this value, our incubation at 150 µmolquanta m–2 s–1 should not generate growth rates thatdeviate far from field values for Synechococcus spp.Moreover, in our study, the in situ bacterial growthoccurred over a wide range of temperatures between16 and 29°C and was poorly correlated with temp-erature beyond 25°C (Fig. 4A). This temperature-independent range of bacterial growth was higherthan the ranges reported by Shiah & Ducklow (1994)and Carlsson & Caron (2001). Shiah & Ducklow (1994)found that temperature was not an important determi-nant of bacterial production rate when above 12°C,and Carlsson & Caron (2001) suggested that whenless than ca. 20°C, temperature played a more impor-tant role than did substrate supply in limiting bac-terial growth. The higher temperature-independentrange at our study site is probably due to higherannual range of water temperature.
Because most studies have not focused on the sea-sonal variation of nanoflagellate grazing rates on bac-teria or Synechococcus spp., the mechanisms that reg-ulate the seasonal variation of grazing rates are stillpoorly understood. An examination of our field dataindicates a positive relationship between nanoflagel-late ingestion rate and the abundances of bacteria andSynechococcus spp. (Fig. 6). Some studies considerwater temperature and prey density to be among themost important factors regulating the seasonal inges-tion rate of nanoflagellates (Choi 1994). However, inour study, these correlations were weak betweenobserved grazing rates on bacteria or Synechococcusspp. and water temperatures (data not shown). Fromour results, we conclude that the ingestion rate ofnanoflagellates is most probably affected by theconcentration of bacteria and Synechococcus spp.(Fig. 6). A similar conclusion was reported by Landryetal. (1984) and Nagata (1988).
From the present study, we know that the seasonalcycle of picoplankton growth and nanoflagellate pre-dation are controlled by different mechanisms(Fig. 10). The growth of picoplankton (bacteria andSynechococcus spp.) is controlled by temperature inthe cold season, but in the warm season, the controlfactor of Synechococcus spp. growth is temperature,and that of bacteria is substrate supply. The varia-tions in nanoflagellate ingestion of bacteria and
Synechococcus spp. follow the changes in prey con-centration.
Seasonal changes in the abundance and net growthrates of bacteria and Synechococcus spp.
If bacterial production is not balanced by grazing,other sources of bacterial losses, such as cell death,viruses and sedimentation (Pace 1988), may accountfor the imbalance. In our study, an apparent balancebetween bacterial growth and grazing suggests thatnanoflagellates are major consumers (Fig. 8A). 2imeket al. (1990) observed that ciliates contributed an aver-
271
Synechococcus
0.60–0.71
Bacteria
Nanoflagellate
9 µg C l–1
Nanoflagellate
2 µg C l–1
12–16 µg C l–1
Bacteria
4.5–6 µg C l–1
18–21 µg C l–1
Synechococcus
0.9–1.1 µg C l–1
0.61–0.81
0.09–0.12 0.02–0.023
0.55–0.73 0.58–0.68
0.03–0.040.12–0.16
A
B
Temperature
Temperature Temperature
Substratesupply
Fig. 10. Schematic carbon flow diagrams depicting warm sea-sonal variations in energy transfer of picoplankton productionto nanoflagellates in a subtropical western Pacific coastalecosystem from (A) June to October and (B) November toMay. The numbers within individual phytoplankton, pico-plankton and nanoflagellate boxes refer to their biomass. Thenumbers next to looped arrows represent picoplankton pro-duction rates (µg C l–1 h–1). Straight arrows pointing tonanoflagellates show their grazing rates (µg C l–1 h–1).The controlling factors of growth are indicated within theellipses. Arrow thickness represents the level of production
or grazing rates

Aquat Microb Ecol 51: 263–274, 2008
age of 71% to the total protozoan bacterivory and bal-anced bacterial production in the summer period.However, the importance of ciliates in our study is notcertain because their numbers are so low (Chen 2003).Chen (2003) also reported that ciliates account for theremoval of only about 3% of Synechococcus spp. pro-duction. Thus, the potential effect of nanoflagellatepredation on the removal of picoplankton in our studyappears to be substantial. The dynamics of the bacteriaand Synechococcus spp. community were affected byboth growth and grazing rates. In this study of subtrop-ical coastal waters, the abundances of bacteria, Syne-chococcus spp. and nanoflagellates clearly varied withtime, with higher abundances occurring during thewarm season (>25°C). However, the seasonal varia-tions in picoplankton growth rate and nanoflagellategrazing rate showed a phase shift of 1 mo (Table 1). Infact, seasonal cycles of bacteria and Synechococcusspp. abundances are a reflection of the changing netgrowth rates (growth rate – grazing rate). The highestnet growth rate for both bacteria and Synechococcusspp. occurred from March to May (Table 1, Fig. 9),when abundance was at its lowest and the temperaturebegan to rise. During this period, the abundance of thebacteria and Synechococcus spp. community sharplyincreased. Abundance peaked in June and then netgrowth gradually decreased and finally approachedzero in October. During this period, the abundance ofpicoplankton remained at a high and stable level.Later, because the temperature dropped after October,the net growth rate was negative, while the bacteriaand Synechococcus spp. abundance also declined(Table 1, Fig. 9).
Based on these findings, the observed seasonal vari-ations in abundance can be explained by the followingscenario in which both water temperature and nanofla-gellate grazing influence the dynamics of the bacteriaand Synechococcus spp. community. In addition, thegrazing effect is controlled by prey concentrations.During the change from cold to warm seasons (Marchto April), the growth rates of bacteria and Synechococ-cus spp. increased with increasing temperature, whilethe nanoflagellate grazing rate was low due to lowconcentration of prey, resulting in a gradual increasein the net picoplankton growth rate (April to June).The increase of net growth rate caused increases intheir abundances. When abundances reached thepeak in June, the growth rate and grazing rate were inbalance, and the net growth rate approached zero.When prey concentration and temperature graduallydecreased in the later part of the warm season, the rateof grazing upon them increased and exceeded theirgrowth rate, and their net rate of growth becamenegative. Hence, the abundance of bacteria and Syne-chococcus spp. gradually decreased.
Seasonal pattern of carbon flow in themicrobial loop
In this study of a subtropical coastal area, we found asignificant difference in bacteria and Synechococcusspp. community dynamics between the warm (>25°C,June to October) and cold seasons (<25°C, Novemberto May). During the warm season, there was diel vari-ation in the growth of bacteria and Synechococcus spp.and nanoflagellate grazing rates (Figs. 3 & 5). Thisphenomenon was caused by nanoflagellates thatlargely depend on bacteria as an energy source duringthe daytime, but depend on Synechococcus spp. atnight during the warm season. In contrast, diel varia-tion was not found during the cold season. We believethat the different ecological characteristics occurringin these 2 seasons are driven by 2 types of carbon fluxpatterns.
Nanoflagellates are now known to have the potentialto regulate the production and abundance of pico-plankton and are, therefore, thought to play a key rolein the transfer of picoplanktonic carbon to highertrophic levels (Hahn & Hofle 2001). In our approach toevaluate how the dynamics of bacteria, Synechococcusspp. and nanoflagellates affect the energy flow in themicrobial loop, growth and grazing rates were con-verted to carbon fluxes. Carbon contents for bacteriawere taken from Caron et al. (1995) (15 fg C cell–1) andDucklow & Carlson (1992) (20 fg C cell–1), and those forSynechococcus spp. were from Cuhel & Waterbury(1984) (294 fg C cell–1) and Børsheim & Bratbak (1987)(250 fg C cell–1). For bacteria, the production and graz-ing carbon fluxes ranged from 0.55 to 0.73 and 0.61 to0.81 µg C l–1 h–1, respectively (Fig. 10A). For Syne-chococcus spp., the ranges of production and grazingcarbon fluxes were 0.58 to 0.68 and 0.60 to 0.71 µg C l–1
h–1, respectively (Fig. 10A). The bacteria and Syne-chococcus spp. fluxes of production and grazing werelower during the cold season and higher in the warmseason (Fig. 10B). For bacteria, the production rate andgrazing carbon fluxes dropped drastically and fluctu-ated between 0.02 and 0.26 µg C l–1 h–1 and between<0.01 and 0.21 µg C l–1 h–1, respectively. For Syne-chococcus spp., the production and grazing carbonfluxes dropped to a low level in the cold season, withranges of 0.02 to 0.023 and 0.03 to 0.04 µg C l–1 h–1,respectively (Fig. 10B). Based on these findings, weconclude that both bacteria and Synechococcus spp.production and loss from grazing show a balanced sit-uation in which bacteria and Synechococcus spp. pro-duction can be completely consumed by nanoflagel-lates within the warm season. We also found thatbacteria contributed more to nanoflagellate carbonconsumed than did Synechococcus spp. during thecold season because the growth rate of Synechococcus
272
Tsai et al.: Seasonal variations in plankton trophic dynamics
spp. was low. From these results, we postulate thatbacteria and Synechococcus spp. are equally impor-tant energy sources for nanoflagellates (Boissonneault-Cellineri et al. 2001, Callieri et al. 2002) during thewarm season. During the cold season, however, bacte-ria are the major food source. This trend was alsodemonstrated by Christaki et al. (2002) (Fig. 10A,B).We conclude that during the warm season a significantpart of bacteria and Synechococcus spp. carbon ischanneled through the microbial loop, possibly mak-ing it an important link between primary productionand higher trophic levels.
Acknowledgements. This study was supported by a grant(NSC 91-2313-B-019-031) from the National Science Council,Republic of China.
LITERATURE CITED
Agawin NSR, Duarte CM, Agustí S (1998) Growth and abun-dance of Synechococcus sp. in a Mediterranean Bay: sea-sonality and relationship with temperature. Mar Ecol ProgSer 170:45–53
Allewalt JP, Bateson MM, Revsbech NP, Slack K, Ward DM(2006) Effect of temperature and light on growth of andphotosynthesis by Synechococcus isolates typical of thosepredominating in the octopus spring microbial matcommunity of Yellowstone National Park. Appl EnvironMicrobiol 72:544–550
Anderson MR, Rivken BR (2001) Seasonal patterns in grazingmortality of bacterioplankton in polar oceans: a bipolarcomparison. Aquat Microb Ecol 25:195–206
Azam F, Fenchel T, Field JG, Gray JS, Meyer-Reil LA,Thingstad F (1983) The ecological role of water-columnmicrobes in the sea. Mar Ecol Prog Ser 10:257–263
Billen G, Servais P, Becquevort S (1990) Dynamics of bacterio-plankton in oligotrophic and eutrophic aquatic environ-ments: bottom-up or top-down control? Hydrobiologia207:37–42
Boenigk J, Arndt H (2002) Bacterivory by heterotrophicflagellates: community structure and feeding strategies.Antonie Leeuwenhoek 81:465–480
Boissonneault-Cellineri KR, Mehta M, Lonsdale DH, CaronDA (2001) Microbial food web interactions in two LongIsland embayments. Aquat Microb Ecol 26:139–155
Børsheim KY, Bratbak G (1987) Cell volume to cell carbonconversion factors for a bacterivorous Monas sp. enrichedfrom seawater. Mar Ecol Prog Ser 36:171–175
Callieri C, Karjalainen SM, Passoni S (2002) Grazing by cili-ates and heterotrophic nanoflagellates on picocyanobac-teria in Lago Maggiore, Italy. J Plankton Res 24:785–796
Carlsson P, Caron DA (2001) Seasonal variation of phospho-rus limitation of bacterial growth in a small lake. LimnolOceanogr 46:108–120
Caron DA, Kremer HGP, Lessard EJ, Madin LP and others(1995) The contribution of microorganisms to particulatecarbon and nitrogen in surface waters of the Sargasso Seanear Bermuda. Deep-Sea Res II 42:943–972
Chang J, Chung CC, Gong GC (1996) Influences of cycloneson chlorophyll a concentration and Synechococcus abun-dance in a subtropical western Pacific coastal ecosystem.Mar Ecol Prog Ser 140:199–205
Chang J, Lin KH, Chen KM, Gong GC, Chiang KP (2003)Synechococcus growth and mortality rates in the EastChina Sea: range of variations and correlation with envi-ronmental factors. Deep-Sea Res II 50:1265–1278
Chase Z, Price NM (1997) Metabolic consequences of irondeficiency in heterotrophic marine protozoa. LimnolOceanogr 42:1673–1684
Chen KM (2003) Ciliate grazing on Synechococcus in acoastal and shelf marine ecosystem: spatial-temporal vari-ations and importance to biological carbon cycling. PhDdissertation, National Taiwan Ocean University, Keelung
Chiang KP, Kuo MC, Chang J, Wang RH, Gong GC (2002)Spatial and temporal variation of the Synechococcus pop-ulation in the East China Sea and its contribution to phyto-plankton biomass. Cont Shelf Res 22:3–13
Choi DH, Park JS, Hwang CY, Huh SH, Cho BC (2002) Effectsof thermal effluents from a power station on bacteria andheterotrophic nanoflagellates in coastal waters. Mar EcolProg Ser 229:1–10
Choi DH, Hwang CY, Cho BC (2003) Comparison of virus-and bacterivory-induced bacterial mortality in theeutrophic Masan Bay, Korea. Aquat Microb Ecol 30:117–125
Choi JW (1994) The dynamic nature of protistan ingestionresponse to prey abundance. J Eukaryot Microbiol 41:137–146
Christaki U, Courties C, Karayanni H, Giannakourou A, Mar-avelias C, Kormas KA, Lebaron P (2002) Dynamic charac-teristics of Prochlorococcus and Synechococcus consump-tion by bacterivorous nanoflagellates. Microb Ecol 43:341–352
Cole JJ (1999) Aquatic microbiology for ecosystem scientists:new and recycled paradigms in ecological microbiology.Ecosystems 2:215–225
Cole JJ, Caraco NF (1993) The pelagic food web of oligo-trophic lakes. In: Ford TE (ed) Aquatic microbiology.Blackwell, New York, p 101–111
Cuhel R, Waterbury JB (1984) Biochemical composition andshort term nutrient incorporation patterns in a unicel-lular marine cyanobacterium, Synechococcus (WH7803).Limnol Oceanogr 29:370–374
Dolan JR, 2imek K (1999) Diel periodicity in Synechococcuspopulations and grazing by heterotrophic nanoflagellates:analysis of food vacuole contents. Limnol Oceanogr44:1565–1570
Ducklow HW, Carlson CA (1992) Oceanic bacterial produc-tion. In: Marshal KC (ed) Advances in microbial ecology,Vol 12. Plenum Press, New York, p 113–181
Gasol JM, Morán XAG (1999) Effects of filtration on bacterialactivity and picoplankton community structure as as-sessed by flow cytometry. Aquat Microb Ecol 16:251–264
Gong GC, Liu KK, Pai SJ (1995) Prediction of nitrate concen-tration from two end member mixing in the Southern EastChina Sea. Deep-Sea Res I 15:827–842
Gurung TK, Nakanishi M, Urabe J (2000) Seasonal and verti-cal difference in negative and positive effects of grazerson heterotrophic bacteria in Lake Biwa. Limnol Oceanogr45:1689–1696
Hahn MW, Hofle MG (2001) Grazing of protozoa and its effecton populations of aquatic bacteria. FEMS Microbiol Ecol35:113–121
Hall JA, James MR, Bradford-Grieve JM (1999) Structure anddynamics of the pelagic microbial food web of the Sub-tropical Convergence region east of New Zealand. AquatMicrob Ecol 20:95–105
Heinänen A (1992) Bacterioplankton in a subarctic estuary: theGulf of Bothnia (Baltic Sea). Mar Ecol Prog Ser 86:123–131
273

Aquat Microb Ecol 51: 263–274, 2008
Johnson MD, Ward AK (1997) Influence of phagotrophic pro-tistan bacterivory in determining the fate of dissolvedorganic matter (DOM) in a wetland microbial food web.Microb Ecol 33:149–162
Keil RG, Kirchman DL (1991) Contribution of dissolved freeamino acids and ammonium to the nitrogen requirementsof heterotrophic bacterioplankton. Mar Ecol Prog Ser73:1–10
Kuosa H (1991) Picoplanktonic algae in the northern Balticsea: seasonal dynamics and flagellate grazing. Mar EcolProg Ser 73:269–276
Landry MR, Hass LW, Fagerness VL (1984) Dynamics ofmicrobial plankton communities: experiments in KaheoneBay, Hawaii. Mar Ecol Prog Ser 16:127–133
Lee CW, Kudo I, Yanada M, Maita Y (2001) Bacterial abun-dance and production and their relation to primaryproduction in Funka Bay. Plankton Biol Ecol 48(1):1–9
Metzler PM, Glibert PM, Gaeta SA, Ludlam JM (2000) Con-trasting effects of substrate and grazer manipulations onpicoplankton in oceanic and coastal waters off Brazil.J Plankton Res 22:77–90
Murrell MC (2003) Bacterioplankton dynamics in a subtropi-cal estuary: evidence for substrate limitation. AquatMicrob Ecol 32:239–250
Murrell MC, Hollibaugh JT (1998) Microzooplankton grazingin northern San Francisco Bay measured by the dilutionmethod. Aquat Microb Ecol 15:53–63
Nagata T (1988) The microflagellate–picoplankton food link-age in the water column of Lake Biwa. Limnol Oceanogr33:504–517
Ochs CA, Cole JJ, Liken GE (1995) Population dynamics ofbacterioplankton in an oligotrophic lake. J Plankton Res17:365–391
Olson RJ, Chisholm SW, Zettle ER, Altabet MA, DusenberryJA (1990) Spatial and temporal distributions of prochloro-phyte picoplankton in the North Atlantic Ocean. Deep-Sea Res A 37:1033–1051
Pace ML (1988) The problem of bacterial death rates.Hydrobiologia 159:41–49
Pomeroy LR (1974) The ocean’s food web, a changing para-digm. BioScience 24:499–504
Porter KG, Feig YS (1980) The use of DAPI for identifying andcounting aquatic microflora. Limnol Oceanogr 25:943–948
Probyn TA (1985) Nitrogen uptake by size-fractionatedphytoplankton populations in the southern Benguelaupwelling system. Mar Ecol Prog Ser 22:249–258
Putland JN (2000) Microzooplankton herbivory and bac-terivory in Newfoundland coastal waters during spring,summer and winter. J Plankton Res 22:253–277
Sanders RW, Berninger UG, Lim EL, Kemp PF, Caron DA(2000) Heterotrophic and mixotrophic nanoplankton
predation on picoplankton in the Sargasso Sea and onGeorges Bank. Mar Ecol Prog Ser 192:103–118
Schultz GE Jr, White ED III, Ducklow HW (2003) Bacterio-plankton dynamics in the York River estuary: primaryinfluence of temperature and freshwater inputs. AquatMicrob Ecol 30:135–148
Sherr BF, Sherr EB, McDaniel J (1992) Effect of protistangrazing on the frequency of dividing cells in bacterio-plankton assemblages. Appl Environ Microbiol 58:2381–2385
Sherr EB, Sherr BF, McDaniel J (1991) Clearance rates of<6 µm fluorescently labeled algae (FLA) by estuarineprotozoa: potential grazing impact of flagellates andciliates. Mar Ecol Prog Ser 69:81–92
Shiah FK, Ducklow HW (1994) Temperature regulation of het-erotrophic bacterioplankton abundance, production, andspecific growth rate in Chesapeake Bay. Limnol Oceanogr39:1243–1258
2imek K, Macek M, Vyhnálek V (1990) Uptake of bacteria-sized fluorescent particles by natural protozoan assem-blage in a reservoir. Arch Hydrobiol Beih Ergebn Limnol34:275–281
2olic M, Krstulovic N (1994) Role of predation in controllingbacterial and heterotrophic nanoflagellate standing stocksin the coastal Adriatic Sea: seasonal patterns. Mar EcolProg Ser 114:219–235
Tsai AY, Chiang KP, Chang J, Gong GC (2005) Seasonal dielvariations of picoplankton and nanoplankton in a subtrop-ical western Pacific coastal ecosystem. Limnol Oceanogr50:1221–1231
Vaqué D, Calderón-Paz JI, Guixa-Boixereu N, Pedró-Alió C(2002) Spatial distribution of microbial biomass and activ-ity (bacterivory and bacterial production) in the northernWeddell Sea during the austral summer (January 1994).Aquat Microb Ecol 29:107–121
Weinbauer MG, Peduzzi P (1995) Significance of viruses ver-sus heterotrophic nanoflagellates for controlling bacterialabundance in the northern Adriatic Sea. J Plankton Res17:1851–1856
Wikner J, Hagström Å (1991) Annual study of bacterioplank-ton community dynamics. Limnol Oceanogr 36:1313–1324
Wikner J, Rassoulzadegan F, Hagström Å (1990) Periodic bac-terivore activity balances bacterial growth in the marineenvironment. Limnol Oceanogr 35:313–324
Wright RT, Coffin RB (1984) Measuring microzooplanktongrazing on planktonic marine bacteria by its impact onbacterial production. Microb Ecol 10:137–149
Xiuren N, Vaulot D (1992) Estimating Synechococcus spp.growth rates and grazing pressure by heterotrophicnanoplankton in the English Channel and the Celtic Sea.Acta Oceanol Sin 11:255–273
274
Editorial responsibility: Klaus Jürgens,Rostock, Germany
Submitted: April 30, 2007; Accepted: March 18, 2008Proofs received from author(s): May 30, 2008