soil fungal hyphal dynamics and seasonal hypogeous
TRANSCRIPT

AN ABSTRACT OF THE THESIS OF
Gary Alan Hunt for the degree of Doctor of Philosophy in Botany and
Plant Pathology presented on May 2, 1985
Title: SOIL FUNGAL HYPHAL DYNAMICS AND SEASONAL HYPOGEOUS SPOROCARP
PRODUCTION IN WESTERN OREGON DOUGLAS -FIR FORESTS
Abstract approved: Redacted for privacyDr. James M. Trappe
Total length and biomass of fungal mycelium in the soil of a
young Douglas-fir stand in the central Oregon Coast Range were
estimated over 27 months with the agar-film technique. In a second
study, phenology and taxonomy of hypogeous (belowground) sporocarps
were studied over 32 months in a nearby, young Douglas-fir stand.
Mycelial mass was at maximum in fall and spring and significantly
lower in summer. Melanized hyphae dominated those with other
colors, averaging 66 percent of monthly litter and 73.7 percent of
soil hyphal weight. The mycorrhizal fungus Cenococcum geophilum Fr.
had significantly larger average diameter than other hyphae and
contributed from 1.2 to 64.8 percent of monthly hyphal volume.
Multiple regression analyses with temperature, moisture, and
litterfall produced no adequate predictive equations for monthly
fungal biomass.
Nine ascomycete and 21 basidiomycete species were collected
during the sporocarp phenology study. Production was dominated by

a small number of species; taxa accounting for 5 percent or more of
total annual dry weight were Gautieria monticola, Hysterangium
crassum, H. separabile, and Melanogaster ambiguus. Annual
productivity estimates ranged from 5,815 to 6,648 sporocarps ha-1
and 2.0 to 3.2 kg dry weight ha-1. Peaks in production generally
resulted from a large contribution by one or two species.
Pronounced seasonal trends in production were not evident, but
sporocarp number and biomass were greater in spring than fall.
Annual fruiting period for individual species ranged from only three
months for some species to as much as 11 months for others.
Fungi produce the greatest biomass of all soil organisms in
temperate coniferous forests. Mycelium and sporocarps are nutrient
and energy sources for decomposers and consumers. In addition, they
are essential as mycorrhizal symbionts to the growth of most
forest-dwelling vascular plants. Consequently, ecosystem studies
dealing with nutrient allocation, turnover rates, or mycophagy by
soil fauna or vertebrate populations need to account for the
contributions of fungal hyphae, sporocarps, and/or mycorrhizae.
Because fungal biomass typically fluctuates widely over short
periods, frequent sampling and long term study are needed to asses
the importance of fungi in ecosytems.

Soil Fungal Hyphal Dynamics and Seasonal Hypogeous Sporocarp
Production in Western Oregon Douglas-fir Forests
by
Gary Alan Hunt
A THESIS
submitted to
Oregon State University
in partial fulfillment of
the requirements for the
degree of
Doctor of Philosophy
Completed: May 2, 1985
Commencement June 1985
APPROVED:
Redacted for privacy
Professor of Est Science in chaTTof major
Redacted for privacyHead of Department of-Botany
Redacted for privacy
bean of Graduate ooi
Date thesis presented May 2, 1985

ACKNOWLEDGMENTS
I most sincerely appreciate the unfailing support of Dr. James
Trappe throughout my graduate program and his being so giving of his
time and invaluable ideas. I thank the members of my graduate
committee for their guidance and advice: Drs. William Denison,
William Chilcote, David Perry, Kermit Cromack Jr., and David
Loomis. I am grateful to Dr. Robert Fogel who provided the
opportunity for me to begin mycological research and who has freely
given encouragement and valuable suggestions during the course of
this work. Michael Castellano helped with the taxonomy of
Hysterangium, Charlene Crocker invaluably assisted with the field
work, and Ginny Bissell typed the thesis and advised on thesis
format. I also thank Joyce Eberhart and John Chamard for their
patience and for continuing our ongoing research during the final
months of my program.
I owe special thanks to Dr. Randy Molina, Dan Luoma, Dr. Robert
Frenkel, and Chris Maser, who, through valuable discussions, have
contributed to my research.
Siuslaw National Forest and Starker Forests allowed use of their
land. The research could not have been conducted without the
financial support of the National Science Foundation and cooperation
of the United States Forest Service, Pacific Northwest Forest and
Range Experiment Station, Corvallis, Oregon. Pergamon Press Ltd.
gave permission to reprint Chapter I from Soil Biology and
Biochemistry, 15:641-649; 1983.

INTRODUCTION
TABLE OF CONTENTS
Page
1
CHAPTER I
FUNGAL HYPHAL DYNAMICS IN A
WESTERN OREGON DOUGLAS-FIR STAND 5
Abstract 6
Introduction 6
Materials and Methods 7
The site 7
Sampling and preparation method 9
Results 10Hyphae in litter and surface soil 10
Vertical distribution of soil hyphae 11
Color groups 12Discussion 13
Hyphal length 14
Hyphal diameter 16
Hyphal biomass 17
Color groups 20
Correlation with environmental factors 23
References 37
CHAPTER II
SEASONAL HYPOGEOUS SPOROCARP PRODUCTION IN AWESTERN OREGON DOUGLAS-FIR STAND 40
Abstract 41
Introduction 41
Materials and Methods 42
The site 42
Sampling and specimen processing 44
Results 44Discussion 47
Sampling considerations 47
Comparison of taxa 51
Production 59
Seasonality 63
References 85
SUMMARY AND CONCLUSIONS 91
BIBLIOGRAPHY 94
APPENDIX 104

LIST OF FIGURES
Figure Page
CHAPTER I
I.1 Total monthly length (A) and weight (B) of hyphaein litter at Dinner Creek, Oregon
1.2 Total monthly length (A) and weight (B) of hyphaein soil at Dinner Creek, Oregon
1.3 Seasonal length (top) and mean annual length(bottom) of hyphae at different soil depths atDinner Creek, Oregon.
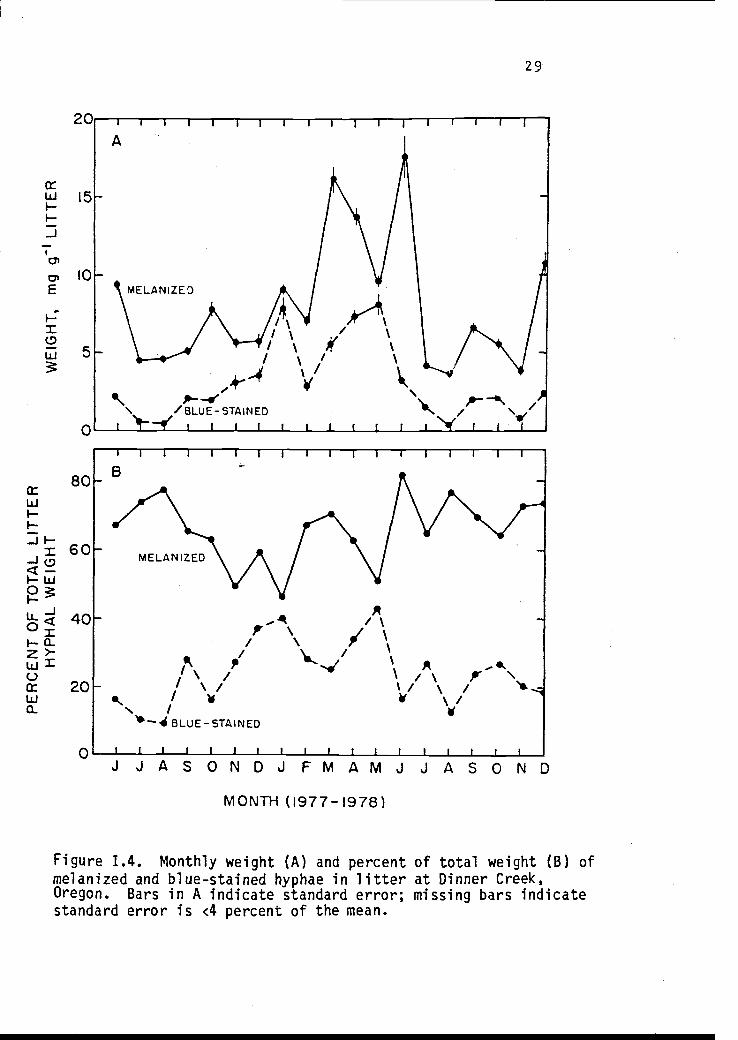
1.4 Monthly weight (A) and percent of total weight (B)of melanized and blue-stained hyphae in litter atDinner Creek, Oregon
1.5 Monthly weight (A) and percent of total weight (B)of melanized and blue-stained hyphae in soil atDinner Creek, Oregon
CHAPTER II
26
27
28
29
30
II.1 Monthly production of hypogeous and epigeoussporocarps in a western Oregon Douglas-fir stand 73
11.2. Cumulative number of hypogeous fungal species withtime and area sampled in a western OregonDouglas-fir stand 74
11.3 Major factors influencing hypogeous sporocarpproduction in western Oregon 75

LIST OF TABLES
Table Page
I.4a
I.4b
1.5
11.2
11.3
CHAPTER I
Soil weight and range in hyphal length and weightin the soil profile at Dinner Creek, Oregon 31
Mean weight and proportion of total weight of hyphaeof three color categories at Dinner Creek, Oregon 32
Mean diameter and proportion of total mycelial massof Cenococcum geophilum and all other hyphae at DinnerCreek, Oregon 33
Mycelial length for some temperate conifer forestsites 34
Hyphal biomass from some temperate coniferous forestsites 35
Independent variables made available in multipleregression analyses 36
CHAPTER II
Species list and productivity estimates forhypogeous fungi collected during two years in awestern Oregon Douglas-fir stand 76
Species accounting for 5 percent or more ofproductivity of hypogeous fungi in a western OregonDouglas-fir stand 77
Middates of fruiting for selected species ofhypogeous fungi in a western Oregon Douglas-firstand 78
Similarity of hypogeous fungal taxa betweendifferent stands of Douglas-fir in western Oregon 79
Variability in annual production by some majorspecies of hypogeous fungi over five years in westernOregon 80
Hypogeous sporocarp production in some coniferousforests 81
Peak standing crops of sporocarps produced byhypogeous and epigeous mycorrhizal species in awestern Oregon Douglas-fir stand 82

Table
11.8
11.9
ComparisonproductionOregon
Comparisonsporocarps
LIST OF TABLES(continued)
of annual epigeous and hypogeous sporocarpin two stands of Douglas-fir in western
Page
83
of spring and fall production of hypogeousin western Oregon 84

SOIL FUNGAL HYPHAL DYNAMICS AND SEASONAL HYPOGEOUS SPOROCARPPRODUCTION IN WESTERN OREGON DOUGLAS-FIR FORESTS
INTRODUCTION
Studies of belowground processes of forests have shown that
fungi are predominant agents of decomposition (Dickinson and Pugh
1974) and essential to the growth of forest trees as mycorrhizal
symbionts (Trappe and Fogel 1977, Harley and Smith 1983). Moreover,
fungi have the greatest biomass of all soil organisms in temperate
coniferous forests and thus are important links in nutrient cycles
by immobilizing plant nutrients (Baath and Soderstrom 1979; Fogel
and Hunt 1979, 1983; Hunt and Fogel 1983), having rapid turnover,
and serving as food for part of the soil fauna and vertebrate
populations. Clearly, ecosystem studies dealing with biomass,
nutrient allocation, and turnover must take into account the
contributions of fungal hyphae, sporocarps, and mycorrhizae.
Gathering data for establishing the contribution of higher fungi
(basidiomycetes and ascomycetes) to forest ecosystems presents
challenges not encountered in study of aboveground forest
components. Vascular plant communities are described by sampling a
recognizable and relatively homogeneous and stable vegetation
segment. By comparision, the mycoflora (mycota) consists of species
groups distributed nonrandomly and separated spatially and
temporally within many microhabitats in the general environment.
Individuals cannot be delimited by vegetative structures, so
collection of ephemeral sporocarps is the only means by which
species populations can be studied. Sporocarp production is

2
generally erratic. Fungal species may fruit suddenly where they
have not been seen before but presumably have been present for an
indefinite time in the vegetative state.
Many if not most terrestrial species of higher fungi in forests
are mycorrhizal and thus are root inhabitants that act as extensions
of root systems and are required by forest trees for absorption of
adequate nutrients from soil (Marks and Kozlowski 1973, Sanders et
al. 1975, Trappe and Fogel 1977, Harley and Smith 1983).
Fungi producing sporocarps aboveground (epigeous) are easier to
study than those that fruit belowground (hypogeous) fungi. As a
result, many more studies have been done on the former (Hering 1966,
Richardson 1970, Endo 1972, Lange 1978, Watling 1978). Fogel (1981)
has reviewed the literature on epigeous sporocarp production.
Description of ectomycorrhizal fungal communities requires
determination of the species present and their relative abundance,
yet few studies of hypogeous fungi have gathered these data or
considered related areas of their ecology (Fogel 1981). Production
by individual hypogeous species was reported in one study (Fogel
1976). The hypogeous mycota associated with different communities
or geographical areas has been reported (Ceruti et al. 1967, Gross
1969, Fogel 1976, States 1983, 1984) and relationships of hypogeous
sporocarp production to climatic or soil factors have been
considered (Setchell and Watson 1926, Ceruti et al. 1967,
Montacchini and Caramiello 1968, Fogel 1976).
The hypogeous fungi are members of the ascomycetes and
basidiomycetes. A few members of the Endogonaceae (Zygomycetes)

3
produce small hypogeous sporocarps but are not generally abundant in
coniferous forests. The hypogeous basidiomycetes and ascomycetes
(excluding some secotioid forms) are characterized by having
sporogenous tissues completely enclosed in a peridium and lacking
forcible spore discharge. Most are subglobose in shape and all are
presumed to be ectomycorrhizal (Miller 1983, Trappe 1971).
Hypogeous fungi require animal mycophagy for spore dispersal and
possess odor compounds which attract mammals (Marin et al. 1984,
Trappe and Maser 1977). Some mammals strongly rely on hypogeous
fungi as a primary food, and many use them as a supplemental food
(Fogel and Trappe 1978, Maser et al. 1978a, Trappe and Maser 1977).
Data on species and production of hypogeous sporocarps are
useful in developing important principles in community ecology
(Seifert 1981). For example, determining ectomycorrhizal species
richness in various plant communities and soil types permits
inferences about the occurrence of specific host-fungus associations
and their biogeographical distributions. Other research areas in
which data on sporocarps are relevant include those relating
environmental factors to sporocarp production, investigations of
successional patterns of ectomycorrhizal fungi in plant communities
(Watling 1981) and in physiological studies of interference and
exploitation competition (Gadgil and Gadgil 1975, Marx 1972,
Robinson 1972). Data on hypogeous sporocarp production are also
potentially important in forest management, e.g., to establish the
potential food resource for mycophagists (Fogel and Trappe 1978) or
to determine the ectomycorrhizal species of potential value for
commercial reforestation (Trappe 1977).

4
A primary goal of mycoecologists is to integrate studies of
fungi into development of ecological theory and ultimately to reach
an understanding of the contribution of fungi to the structure and
function of whole ecosystems (States 1981). Descriptive studies
designed to quantify both the vegetative fungal component (hyphae)
and reproductive structures (sporocarps) in various plant
communities are necessary preliminary steps in realizing this goal.
The objectives of my studies were (1) to assess seasonal total
lengths and biomass of fungal mycelium in the soil of a young
Douglas-fir stand in the central Oregon Coast Range (Chapter 1) and
(2) to determine the species and phenology of hypogeous sporocarps
in a second Douglas-fir stand (Chapter 2).

5
CHAPTER I
FUNGAL HYPHAL DYNAMICS IN A
WESTERN OREGON DOUGLAS-FIR STAND
by
Gary A. Hunt
College of ForestryDepartment of Forest Science
Oregon State UniversityCorvallis, Oregon 97331
and
Robert Fogel
University of Michigan HerbariumAnn Arbor, MI 48109
This chapter has been reproduced from Soil Biolo y and Biochemistry15:641-649, 1983 with permission of thila is er.

6
ABSTRACT
Total length and biomass of fungal mycelium in the soil of a
young stand of second-growth Douglas-fir in the central Oregon Coast
Range were estimated over 27 months with the agar-film technique.
Mycelial mass was at maximum in fall and spring and significantly
lower in summer. Melanized hyphae dominated other colors, averaging
66 percent of monthly litter and 73.7 percent of soil hyphal
weight. The mycorrhizal fungus Cenococcum geophilum Fr. had
significantly larger average diameter than other hyphae and
contributed from 1.2 to 64.8 percent of the monthly hyphal volume.
Multiple regression analyses with temperature, moisture, and
litterfall produced no adequate predictive equations for monthly
fungal biomass. Large biomass fluctuations over short periods
necessitate frequent sampling and long-term study to fully assess
the importance of fungal hyphae in ecosystems.
INTRODUCTION
Little is yet known about the distribution of fungal hyphae in
coniferous forest soils, though data on mycelial biomass are
important to understanding the contribution fungi make in
decomposition and nutrient cycling, and as mycorrhizal symbionts.
We have reported the allocation of biomass and turnover time for
fungi in a young, second-growth stand of western Oregon Douglas-fir

7
and have described the contribution of fungi to nutrient cycling in
the same stand (Fogel and Hunt 1979, 1983). We here report an
extended study of 27 consecutive months of litter and soil analysis,
and describe monthly biomass fluctuations and seasonal changes in
fungal hyphae throughout the soil profile.
MATERIALS AND METHODS
The site
The 1.2-ha Dinner Creek site is 11.3 km southwest of Philomath,
Oregon, U.S.A. at 44°28'30"N, 123°29'W and at 305-m elevation.
Aspect is south; slope ranges from 0 to 60 percent (mean 40
percent). The area is characterized by warm, dry summers and mild,
wet winters without extensive snow cover (mean temperatures 2.7°C in
January and 18.5°C in July). Annual precipitation averages 1905 mm
but was substantially below average (848mm) during the first year of
the study (September 1976 to August 1977) and slightly below (1775
mm) during the second year. Maximum predawn plant moisture stress
of the overstory reached -1.35 MPa in September 1977 and -0.99 MPa
in September 1978.
The stand, an overstocked, second-generation forest of 35- to
50-year old Douglas-fir (Pseudotsuga menziesii (Mirb.) Franco), was
established naturally after clearcutting and burning. Douglas-fir
stems greater than 10.2 cm dia at 1.3 m aboveground number
-11626 ha (basal area 4.59 m
-2ha
-1and bole volume

8
423 m-3
ha-1
). A few golden chinquapin (Castanopsis
Chrysophylla (Dougl.) A Dc.) and red alder (Alnus rubra Bong.) are
scattered in the understory (basal area 3.2 m-2
ha-1
). The
sparse, shaded understory consists of a few Oregon grape (Berberis
nervosa Pursh) and bear-grass (Zerophyllum tenax (Pursh) Nutt.).
The Bohannon soil type of the site is a well-drained, moderately
deep (100 cm to bedrock), gravelly loam formed on colluvial
materials weathered from Tyee sandstone (Knezevich 1975). Poorly
developed organic layers, averaging 1.8 cm in depth, are a mull
humus type. The A00 (L) horizon, a thin layer of freshly fallen
needles, is underlain by a scant A01 (F) layer. The A02 (H)
horizon, well mixed with surface mineral soil by the activity of
earthworms and microarthropods, forms a soft, friable Al horizon
down to 25 cm. This zone of maximum rooting contains about 18
percent pebbles. The A3 horizon extends from 25 to 45 cm and
forms a smooth boundary with the B horizon, which extends to 90-110
cm. A distinctive feature of the Bohannon series is a buried A
horizon found between 60-90 cm which contributes increased organic
matter at the base of the profile. Average carbon (measured by loss
on ignition at 850°C for 4 h) is 0-20 cm, 2.91 percent; 20-40 cm,
1.44 percent; 40-60 cm, 0.57 percent; 60-80 cm, 1.38 percent; 80-100
cm, 0.56 percent. All horizons are strongly acid: pH 5.5 in the
litter layer and 5.7 in the Al horizon.

9
Sampling and preparation method
Mycelial length was measured by the Jones and Mollison (1948)
agar-film technique as modified by Nagel-de Boois and Jansen
(1971). Litter and mineral soil samples to 5 cm deep were collected
on the first of each month at five sampling stations. Samples were
also taken seasonally at 20 cm increments to a depth of 1 m at three
randomly chosen locations. A portion of each sample (2 g litter or
5 g soil) was combined with 50 ml distilled water, then homogenized
in a Waring knife blender at maximum speed (litter solutions 10 min
and soil soulutions 5 min). The supernatant was added to 50 ml of
hot 2.5 percent water-agar and mixed at low speed on a magnetic
stirring plate as samples were pipetted into the well of a Howard
mold-counting chamber producing a film 0.1 mm deep. The films were
stained for 1 h in phenolic aniline blue, rinsed with 95 percent
ETOH, and examined with phase-contrast microscopy (1000x).
Each month, 20 randomly chosen fields on each of two slides, one
for litter and one for soil, from each of the five stations were
observed. Hyphal lengths and diameters were measured with a net
micrometer disc. All lengths were expressed as mg-1
dry weight
(dw) soil.
To convert mycelial length to biomass, the mean monthly
biovolume over 20 sample fields of litter and surface soil was first
calculated by computer with the formula of Baath and Soderstrom
(1979b):
20
mean biovolume (pM- 3 = E d.2
x w x li/20,
2

10
where di is diameter and li is length of individual hyphal
fragments in micrometers. The resulting values were converted to
mm3g-1
dw soil.
For seasonal samples from different depths in the soil profile,
we used mean hyphal diameters determined from the agar-film
preparations: 3.0 pm for 10, 30 and 50 cm and 2.7 pm for 70 and 90
cm. Thus, volume (mm3g-1
dw soil) = hyphal length (m g-1
) x
r2x 10-3 .
For conversion of biovolume to biomass (mg g-1
), we used the
factors fresh weight hyphal density = 1.1 g cm-3 (Saito 1955) and
dry weight mycelium = 15 percent wet weight (Cochrane 1958, de Boois
1976). Thus, biomass (mg g-1
) = volume (mm3g-1
) x 1.1 x
0.15. Horizon weights from measurements of whole-soil bulk density,
1903.4 g m-2
for litter and 34 x 103
g m-2
for soil surface,
were used to convert hyphal biomass from mg g-1
to g m-2
. Soil
weights (based on bulk density samples) used for seasonal profile
samples are given in Table 1.1
RESULTS
Hyphae in litter and surface soil
Litter hyphal length (Fig. 1.1a) was high in fall and spring and
low in summer and winter throughout the study. Maximum length
recorded (November 1976) was 12,502 * 2131 m g-1 dw litter.
Minimum length (August 1978) was 2831 * 271 m g-1. Litter hyphal

11
weight (Fig. I.1b) peaked twice during the study: at 22.13 * 5.8 mg
g-1
(November 1976) and 23.17 * 7.2 mg g-1 (March 1978), the
maximum reached during the study. Minimum weight was 5.19 * 1.2 mg
g-1
(August 1978).
Soil hyphae fluctuated seasonally but neither length nor weight
decreased during winter 1977-1978. After July 1977, hyphal length
(Fig. I.2b) followed a similar pattern, increasing during the winter
of 1977-1978 to a peak in April of 1.50 * 0.36 mg g-1
. The summer
low occurred in Augut 1978 at 0.35 * 0.11 mg g-1
.
Vertical distribution of soil hyphae
Hyphae were sampled to 1-m depth in winter, spring, and summer;
but because fall samples were lost in an electrical failure, data
for fall (to 50 cm) were estimated from linear regression equations
with soil moisture and temperature as independent variables. Hyphal
length fluctuated most near the surface--the annual range from 141
to 750 mg g-1 (Fig. 1.3). Distinct seasonal differences occurred
down to 50 cm, where hyphal lengths ranged from 118 to 264 mg-1
.
Below 50 cm, hyphal mass remained fairly stable, about 80 mg-1
at
70 cm and 38 mg-1
at 90 cm. The mean curve from six sampling
dates shows a highly significant negative logarithmic correlation
with depth (Fig. 1.3). Maximum and minimum mycelial length and
weight (Table I.1) generally decreased with increasing depth.
Minimum weight increased from the surface down to 60 cm (6.47 -
28.12 g m-2
), then decreased to 2.19 gm-2
at 90 cm.

12
Color groups
Hyphae were categorized by color after staining with phenolic
aniline blue into "melanized" (brown, black and gray),
"blue-stained," and "other" hyphae (primarily hyaline). For 19
months, melanized hyphae dominated (Table 1.2). The weights of
melanized litter hyphae ranged from 4.0 * 0.22 mg g-1
to a peak of
17.84 * 1.33 mg g -1. Blue-stained litter hyphae ranged from 0.55
* 0.03 mg g-1
to 8.44 * 0.64 mg g -1. Figure 1.4 shows the
monthly weight and the proportion of the total weight of melanized
and blue-stained hyphae in litter.
Weights of melanized hyphae in soil ranged from 220 * 8
pgg-1
. Blue-stained soil hyphae ranged from 400 * 3 4gg-1
to
330 * 20 4gg-1
(Table 1.2, Fig. 1.5)
The ubiquitous and morphologically distinctive mycorrhizal
fungus Cenococcum geophilum Fr. (Trappe 1964) was recorded
separately. In transmitted light, the thick-walled hyphae are
bronze to purple. Data for Cenococcum and and all other hyphae for
1 yr show that Cenococcum composed a larger proportion of mycelial
volume than of length (Table 1.3). For 19 months, it contributed
from 13.4 to 45.5 percent of litter mycelial volume and from 1.2 to
64.8 percent of soil hyphal volume.

13
DISCUSSION
Results of different hyphal studies are not easily compared
because of differences in techniques such as the preparation of
Jones and Mollison slides (Thomas et al. 1965, Nagel-de Boois and
Jansen 1971) or hyphal measurement, magnification, lighting
(Frankland 1974), and calculation of hyphal volume (Baath and
Soderstrom 1979b). Moreover, within-sample variation is typically
large. For example, monthly coefficients of variation (standard
deviation as a percentage of the mean) for litter hyphal length
ranged from 16 to 65 percent during this study. In order to reduce
this to an average 10 percent, monthly sampling should increase from
100 to 6588 fields, according to Stein's two-stage estimate of
sample size for P <0.05 (Steel and Torrie 1960). It should also be
noted that the Jones-Mollison technique results in an underestimate
of mycelial mass because of incomplete maceration of organic matter
(inevitable in most homogenizers and tissue grinders) and incomplete
separation of hyphal fragments from inorganic soil particles, so
that hyphae are pulled to the bottom of the suspension by sinking
particles. In addition, some hyphae are masked by soil particles
incorporated in the finished preparations. The work of Baath and
Soderstrom (1979a) may be most directly compared with our work
because of similar techniques in knife blending, phenolic analine
blue-staining, phase contrast microscopy and high magnification
(1000x), and because we calculated biovolume by the same method.

14
Hyphal length
Despite pronounced fluctuation in hyphal length during the wet
months of the year (Fig. 1.1), seasonality is shown primarily by low
summer values. The sharp drop in litter hyphal length and volume
from November to December 1976 is apparently a "dilution effect"
from a large input of uncolonized needle litter during November.
Comparison with other work is difficult because few studies have
been extended over time. Nagel-de Boois and Jansen (1971) measured
mycelial lengths monthly for 3 yr in an oak-beech forest and found
no conclusive evidence of seasonal change. Hyphal length was
maximum during autumn and winter in an English Scots pine forest
(Nicholas et al. 1965) and in spring in a European black pine
plantation (Parkinson et al. 1968). Seasonal samples in a Spanish
beech forest (Martinez and Ramirez 1978) revealed a spring maximum
in litter hyphae and a fall maximum in the A11 horizon. Laursen
and Miller (1977) found spring maxima and summer minima in tundra at
Barrow, Alaska, seemingly a reflection of soil moisture and
temperature.
The summer drop in hyphal length in Alaska and on our site
indicates that seasonal drought influences hyphal biomass. However,
it is important to note that monthly increment and decrement of
total hyphae may not necessarily represent growth differences but
may be influenced by decomposition and soil fauna grazing. Our
measurements do not indicate whether the primary cause of
fluctuation is rate of growth, mycophagy, or other processes.

15
Differences in vegetation, climate, and soils make between-site
comparisons difficult (Table 1.4 a,b). Different soil structures,
for example, do not permit direct comparison of hyphal lengths of
our study with those of Baath and Soderstrom (1979a). The mull
humus of our site--A01
and A02
horizons (F and H
respectively)--is inseparable and poorly developed compared to the
distinct mor humus layers at the Swedish site; therefore, hyphal
biomass of the litter there greatly exceeds ours. Our maximum value
for surface soil (A1) is the same order of magnitude as the A2
value of the Swedish site.
Seasonal measurements of hyphal length through the soil profile
(Fig. 1.3) show the highest biomass in the fall, followed by spring,
winter and summer. This surface hierarchy is maintained to 50 cm,
which indicates that conditions fluctuate sufficiently at that depth
to affect hyphal growth significantly. Soil moisture at 50 cm did
not change significantly except during the driest part of
summer--26.3 percent dw in August 1978, near 35 percent in other
seasons. Below 50 cm, hyphal values are nearly the same in all
seaons, reflecting the more buffered environment toward the bottom
of the profile. The presence of hyphae at 90-100 cm shows that
nutrient supplies are sufficient to sustain some growth. Although
some nutrients may be transported from surface horizons to this
depth, the hyphae may also derive nutrition from the buried A
horizon. No comparable data for a seasonal profile are available
for comparison, but several studies have documented a decrease in
hyphae with depth (Burges and Nicholas 1961, Nagel-de Boois and

16
Jansen 1967, Nicholas and Parkinson 1967, Parkinson et al. 1968,
Wadden and Parkinson 1973, Baath and Soderstrom 1979a).
Hyphal diameter
Baath and Soderstrom (1979a), in the only other publication of
mean hyphal diameter through the soil profile that we know, report
2.63 pm in the organic layers and 1.90 0 in the mineral horizons
(A2 and B) of a Swedish Scots pine forest. They suggest three
possible reasons for narrower hyphae in mineral soil: fewer
nutrients, different fungal species inhabiting different horizons
(Soderstrom 1975, Bissett and Parkinson 1979a), and abiotic
conditions that may be less suitable for growth. Our data support
the nutrient hypothesis, in that diameter does not change greatly
through the profile. Mean diameter (3.01 4m) is the same to 50 cm,
below which it decreases only modestly to 2.7 vm (P <0.2).
Moreover, the mean diamter of Cenococcum does not change
significantly in the profile. These changes can be explained in
terms of organic-matter distribution. Extensive mixing of humus
with surface soil by arthropods and earthworms eliminates the
distinct differentiation between organic layers and mineral soil
apparent at the Swedish site, where most nutrients are in the mor
humus layers. In addition, the buried A horizon of our study site
means that organic matter increases slightly from 50 to 70 cm; thus,
more uniform distribution may preclude diameter differences based on
available nutrients. The mean diameter of 3.01 i 0.05 um of this
study is at the top of the ranges 1.6-3.0 4m and 2.66-3.01 pm

17
reported respectively by Baath and Soderstrom (1979a) and Visser and
Parkinson (1975).
Hyphal biomass
Biomass data best express fungal mass because they incorporate
measures of diameter and thus volume. Baath and Soderstrom (1979
a,b) have discussed the importance of accurate measurement of hyphal
diameter in calculating volume; because radius is squared, a
relatively small difference in dimeter can result in a significant
change in volume. For example, weight calculated from volume based
on the overall mean dimater, 3.01 pm, and a length of 3366 m g-1,
is 10.21 g m-2
. Weight calculated with separate fragments is
15.80 g m-2
, 35 percent larger.
In our study, values based on mean dimeter of litter hyphae were
11-41 percent smaller than the values derived with the
fragment-volume method. Corresponding decreases for surface soil
hyphae were 1-47 percent. The difference in values apparently
results from the thicker hyphae, which break into longer pieces
during maceration (the longest fragments tend to be the widest).
During 5 months, fragments 1-10 pm long averaged 3.02 * 0.11 pm dia;
those more than 50 pm long averaged 4.54 * 0.26 pm dia. Use of a
single mean diameter does not account for short-term changes which
may occur with changes in species dominance. In May 1978, the mean
diameter of litter hyphae 1-10 pm long was 2.60 * 0.14 pm; in
December 1977, the mean diameter was 3.09 * 0.18 pm.

18
Although hyphal biomass and length fluctuate comparably from
season to season, notable monthly differences reflect changes in
mean volume of fragments. Between January and February 1977,
mycelial length in the surface soil decreased 1.82 times, weight
(mg g-1) 3.47 times. This indicates an increase in the proportion
of narrow hyphae.
The summer increase in mycelial weight (g m-2
) from the
surface to 60cm (Table I.1) is probably a manifestation of greater
soil bulk density, particularly from 20-40 cm where length decreases
from 141 to 133 m g-1
but biomass (m-2) increases slightly.
Extensive hyphal growth near the soil surface in the fall results in
hyphal weight (g m-2) decreasing down the profile despite the
increase in soil bulk density from the surface to 60 cm. The effect
of a moisture gradient on mycelial mass down the profile cannot be
determined from our data, but the moisture gradient (percent dw) is
minimal during wettest and driest periods. In August 1978, moisture
was 21.65 * 0.31 percent in the top 10 cm and 26.49 * 0.20 percent
at 90 cm, a range of only 4.84 percent. A similar narrow range,
recorded in May 1978, was from 38.37 * 0.66 percent at the surface
to 34.50 i 0.44 percent at 90 cm. In this clay soil, differences of
this magnitude do not significantly change water availability.
Distribution of hyphal mass in the profile shifts distinctly
with seasons (Table I.1), which indicates the importance of seasonal
profile sampling to accurate description of distribution. During
the fall, about 73 percent of the weight (g m-2) is in the top 40
cm of soil, in the summer about 54 percent.

19
Our site may potentially produce 6666 kg ha-1 yr
-1of fungal
mass, most of which turns over in one year (Fogel and Hunt 1979).
The hyphae that decompose annually contain 2.1 percent of the total
N stock for the stand (Fogel and Hunt 1983). Thus, soil hyphae
constitute a rapidly cycling pool of nutrients and may contribute to
ecosystem stability by immobilizing nutrients and thus reducing
leaching from the root zone.
Table 1.4 a,b shows data for mycelial biomass from other sites.
Values from the only comparable study, a complete soil profile from
Sweden (Baath and Soderstrom 1979a), generally agree with the Dinner
Creek values for mineral soil if they are expressed in mg g-1
. A
definite contrast appears, however, in the organic layers. Mean
annual hyphal weight of litter from Dinner Creek is only one-fifth
to one-third that of the Swedish sites, and the fall maximum of 15
mg g-1 is only slightly over half of the Swedish value for Scots
pine. However, total mycelial mass in the soil profile, expressed
at g m-2, is much greater at our site due to the greater depth
(about 40 cm rather than 5 cm) and the greater hyphal productivity
of the A horizon. The annual range of mycelial biomass at Dinner
Creek is about 49 to 226 g m-2
, the value at the Swedish Scots
pine site is 8.6 g m-2
. Hyphal biomass in the B horizon is
similar at both sites--89 g m-2 in Sweden and 41-82 g m-2 at
Dinner Creek. Clearly, the significantly greater mycelial mass at
Dinner Creek (annual mean 216 g m-2
vs 141 g m-2) is due to the
larger annual production in the A horizon.

20
Color groups
The amount of blue-stained hyphae in the litter and surface soil
was recorded for comparison (Table 1.2, Fig. 1.5). The work of
Frankland (1975) and Soderstrom (1979) has shown that blue-stained
hyphae do not accurately represent the living fraction. Frankland
reported that 34-60 percent of hyphae in an English deciduous forest
stained blue (mean: 45 percent in litter, 54 percent in the A
horizon); only 15-37 percent contained cytoplasm. Soderstrom found
that the proportion of living hyphae (Fluorescein diacetate-active)
was about 3-6.5 times less than the proportion of blue-stained
hyphae. Melanized hyphae do not stain blue; apparently the stain is
not taken up or is masked by other pigments. Length of blue-stained
hyphae in Soderstrom's study was 12-16 percent of the total hyphal
length in the A01 -A02, A2 and B horizons. Nagel-de Boois and
Jansen (1971) reported a marked decrease in blue-stained mycelium
from samples of the L, F, H and A horizons--80, 17, 5 and 4 percent
of total length, respectively. Baath and Soderstrom (1979a) found
that blue-stained mycelium ranged from 1-53 percent in four Swedish
sites. Means for the Scots pine site were 17, 12 and 13 percent of
total length in the organic layers, A2 and B horizons,
respectively.
Our percentages of blue-stained hyphae (Fig. 1.5, Table 1.2) are
calclulated on total weight rather than length, but within this
color group, mean total weight and length did not differ
significantly (P >0.05). Percentages ranged from 9 to 43 in litter
and from 7 to 30 in the surface soil, decreasing slightly from

21
organic horizons to mineral soil. The values are reasonably close
to those of the reports just cited.
Baath and Soderstrom (1979a) reported that melanized hyphae
averaged 18 percent of the total hyphal length in the organic layers
and 15 percent in the surface soil (A2) at the Scots pine site.
Burges and Nicholas (1961) reported that the number of melanized
hyphal fragments decreased sharply from the H to the Al horizon in
a glacial sand humus-podozol soil planted to Pinus sylvestris in
England. Melanized hyphae comprised 91 percent of the fragments in
a September sample of the H horizon and 76 percent in the Al
horizon (calculated from Table 1.5, Burges and Nicholas, 1961). Our
data show a much higher contribution by the melanized group than
that found in Sweden: 46.6-72.8 percent of the total length in
litter (mean 59.9 t 1.48 percent) and 52.0-90.4 percent in soil
(mean 68.9 * 2.5 percent). The proportion of melanized hyphae in
litter, calculated on total weight (Table 2), differs significantly
(13 <0.05) from the proportion of the total length (59.9 percent vs
66.0 percent). Comparable values for surface soil do not differ.
The high proportion of melanized hyphae at our site may be due
to the summer drought conditions. Mycorrhizae of Cenococcum
geophilum, a heavily melanized species more abundant during dry
summers, apparently compete poorly with other fungi in moist soil
(Palmer, unpublished data, 1954). Worley and Hacskaylo (1959) found
that Cenococcum increased its mycorrhiza-forming capability as soil
moisture was experimentally reduced. Meyer (1964) concluded that
the abundance of Cenocuccum in strongly rooted mor humus results

22
from a widely fluctuating water economy. Mexal and Reid (1973)
reported that Cenococcum tolerated low water potential and grew best
at -1.5 MPa, unlike two hylaine species, Suillus luteus (Fr.) S.F.
Gray and Thelephora terrestris (Ehrh.) Fr., which grew best at -0.5
MPa. The abundance of melanized hyphae in our seasonally dry
climate may indicate that pigmentation is an adaptive advantage for
surviving the droughty season. Mikola (1948) reported an optimum
growing temperature of 25°C for Cenococcum, and we found that an
isolate of Cenococcum from the central Oregon Coast Range grew best
at 24°C, about 6°C higher than optimum temperature for a hyaline
species from the same location, Laccaria laccata Fr. ex. Berk. and
Br. (Hunt, unpublished data, 1981). Another factor contributing to
this abundance may be that pigmented hyphae decompose more slowly
than hyaline hyphae (Bloomfield and Alexander 1967, Kuo and
Alexander 1967, Hurst and Wagner 1969).
Cenococcum hyphae compose a significantly larger proportion of
total hyphal volume (P <0.05) than of total length, which reflects a
significantly larger diameter than that of other color categories
(Table 1.3). Clearly, when Cenococcum is abundant (maximum: 64.8
percent of total soil hyphal volume, December 1977), the mean hyphal
diameter of soil samples would be significantly affected; therefore,
calculations based on a single mean diameter might seriously
underestimate biomass in some months.
The physiological significance of the larger diameter is
unknown. Surface area is greater than that of most other hyphae,
but the surface-to-volume ratio is smaller. Lumen volume is
probably not significantly greater than that of most other hyphae.

23
Correlation with environmental factors
Monthly changes in hyphal biomass were analyzed through simple
and multiple regression. Length (m g-1
) and weight (mg g-1
) for
each substrate served as dependent variables, and 13 abiotic
factors--which except for literfall were derived from temperature
and moisture data--served as independent variables (Table 1.5).
The 27 hyphal values for litter and soil (top 5 cm) were
regressed against abiotic factors separately. Four curve types were
fitted in each case: linear (y = a bx), exponential (y = aebx),
logarithmic (y = a b In x), and power (y = axb). Coefficients
of determination (r2) did not exceed 0.39 for any pair tested.
Multiple regression equations were generated by the stepwise
addition of the Statistical Package for the Social Sciences
available at Oregon State University. Each equation contained three
to six independent variables.
Two environmental factors, maximum soil moisture and net
precipitation, appeared in all four equations and nine of thirteen
independent variables were used (Table 1.5). The amount of
variation accounted for was 41.84 percent (m g1) and 45.81
percent (mg g1) for litter hyphae, 54.92 percent (m g
-1) and
66.00 percent (mg g-1) for soil hyphae. We know of only one other
multiple regression analysis of hyphal mass. Dowding and Widden
(1974) accounted for 44 percent of the variation in mycelial length
in terms of soil moisture, pH and temperature.
Temperature and moisture are most often correlated with changing
hyphal mass. Moisture and soil organic matter are highly

24
correlated, so their separate influence is nearly impossible to
determine. Soil moisture (and organic matter) is cited as the
primary controlling factor by Soderstrom (1979), Parkinson et al.
(1968), Laursen and Miller (1977), and Dowding and Widden (1974).
Flanagan and Van Cleve (1977) concluded that temperature was most
important in an Alaskan black spruce taiga ecosystem. Bissett and
Parkinson (1979b) used multiple regression analyses to determine the
variables most affecting distribution and community composition of
soil fungi in three Canadian alpine habitats. They concluded that
temperature, moisture, available potassium, and soil pH were most
important. Nicholas et al. (1965) noted an increase in mycelial
production 1-2 months after maximum litterfall followed by rain
leaching in England.
Our results indicate that available data cannot produce an
adequate model to explain the biomass fluctuations observed.
Several possibly confounding elements can be mentioned. First,
large standard errors make monthly means difficult to ascertain.
Second, the data set of 27 monthly values is too small for the
number of independent variables; ideally, each independent variable
would be represented by ten data points. Third, as we have noted,
measurement of total hyphae does not necessarily indicate production
because decomposition and grazing by soil fauna are not taken into
account. Also, all possible influencing environmental factors have
not been measured--for example, the effect of root exudates on
growth of associated mycorrhizal fungi. Finally, a drought during
the first year of this study (precipitation 45 percent of normal)

25
may have drastically altered typical fungal growth patterns. Our
results support the view of Dowding and Widden (1974) that
relationships between fungal growth and the environment are so
complex that analyses of linear relationships are not likely to
provide satisfactory explanations. Because fungal species vary
greatly in their response to the complex of environmental factors,
more useful information may be obtained by study of individual
species.

26
15 r I II I T 1 r ri r rr 1 1 1111111
I0
5
0
A
0 I 1 1111111111 I I I 1 1 1 1 I I I 1 1 ION D JFMAMJJASONDJFMAMJ J ASONDMONTH (1976 -1977 )
Figure 1.1. Total monthly length (A) and weight (B) of hyphae inlitter at Dinner Creek, Oregon. Bars indicate standard error offive samples

W_J
_J
a_)- >-=-J -0 'a,
E(I)
27
ONDJFMAMJJASONDJFMAMJJASONDMONTH (1976-1978)
Figure 1.2. Total monthly length (A) and weight (B) of hyphae insoil at Dinner Creek, Oregon. Bars indicate standard error of fivesamples.

50
100
0
UJO
50
1000
28
SUMMER1
WINTER SPRING FALL
=0
MEN
HYPHA L LENGTH = 743.79 154.65 ( Ln
r =1.0
P < 0.01
100 200 300 400 500 600
HYPHAE (m 9-1)
700 800
Figure 1.3. Seasonal length (top) and mean annual length (bottom)
of hyphae at different soil depths at Dinner Creek, Oregon.Horizontal bars are standard error of six samples.
20
15
10
29
0
80
I-= 60
-1
I- III0o el 40
i- a-z >-Li
tr 20
0 JJASONDJFMAMJJASONDMONTH (1977-1978)
Figure 1.4. Monthly weight (A) and percent of total weight (B) ofmelanized and blue-stained hyphae in litter at Dinner Creek,Oregon. Bars in A indicate standard error; missing bars indicatestandard error is <4 percent of the mean.

1(.9
0 W
Ls_ j0 cl1zn.
Wa_ o
30
100
50
0
,all1)- "-S., \lik BLUE STAINED / .."11 9 --- 411(\ /\ /... 1- --0.... _AI.,'O. Nr -4
JJASONDJFMAMJJASONDMONTH (1977-1978)
Figure I.S. Monthly weight (A) and percent of total weight (B) ofmelanized and blue-stained hyphae in litter at Dinner Creek,Oregon. Bars in A indicate standard error; missing bars indicatestandard error is <4 percent of the mean.

Table 1.1. Soil weight and range in hyphal length and weight in the soil
profile at Dinner Creek, Oregon
Sampling
depth
Soil weight Hyphal lengthrd-.2)
(m g-1)
Hyphal weight
(mg g ) (g m-2
)
1
A /00
A01
1903.4 2831 - 12,502 3.400 - 15.03 6.47 - 28.61
Al 0- 20 cm 136 x 103
141 - 750 0.170 - 0.90 23.12 - 122.40
Al 20- 40 cm 188 x 103
113 - 456 0.136 - 0.55 25.57 - 103.40
B 40- 60 cm 198 x 103
118 - 264 0.142 - 0.32 28.12 - 63.36
B 60- 80 cm 164 x 103
69 - 79 0.0672 - 0.077 11.02 - 12.63
B 80-100 cm 150 x 103
15 - 38 0.0146 - 0.037 2.19 - 5.55
1g m
-2x 10 = kg ha
-1

Table 1.2. Mean weight and proportion of total weight (% + SE) of hyphae of
three color categories at Dinner Creek, Oregon
Blue-stained Melanized Other
(mg 9-1
) (%) (mg g-/ ) (%) (mg g-1
) (%)
Litter
Soil (top 5 cm)
3.3(0.23)
0.14(0.01)
24.3
16.7
8.2(0.40)
0.6(0.04)
66.0
73.7
1.26(0.43)
0.07(0.035)
9.7
9.6

Table 1.3. Mean diameter and proportion of total mycelial mass (% + SE) ofCenococcum geophilum and all other hyphae at Dinner Creel, Oregon
Litter SoilMean Mean
diameter % volume % length diameter % volume % length
Cenococcum 4.52(0.10) 23.7(1.7) 12.4(0.7) 4.17(0.12) 29.4(4.0) 16.4(1.9)Other 3.01(0.05) 76.3(7.6) 87.6(9.6) 3.04(0.07) 70.6(7.1) 83.6(9.2)

Table I.4a. Mycelial length for some temperate conifer forest sites (highest
value from each source1
)
Black Lodgepole
Eastern Lodgepole spruce pine Scots
white pine pine Canada (2) Canada (3) pine Douglas-fir
Horizon Canada (1) Canada (1) (m g1 dry weight) Sweden (4) U.S.A. (4)
A00 5,800 12,845
2
A01
28,600 18,700
A02
210 2,699 2,749 7,500
Al 2,085 909
A2
16 351 384 650
B 140 159 390 264
1Source: (1) Widden and Parkinson (1973); Visser in Baath and Soderstrom
(1979a); (3) Widden and Parkinson (1973): (4) Baath and Soderstrom (1979a).2A00
and A01
combined.

Table I.4b. Hyphal biomass from some temperate coniferous forest sites (highest value from
each source1
)
Norway spruce
Scots pine Scots pine Black spruce Aspen Douglas-fir
Sweden (4) Sweden (4) Alaska (6) Canada (7) U.S.A. (5)
Horizon-
(mg T ) (mg g-1
) (g m-2
) (g m-2
) (g m-2
) (1)m-2)
Organic 54.4 29.3 43.4 5.7 34.0 9.2 17.5
A 1.3 0.3 8.6 0.82 137.2
B 1.4 0.2 89.0 0.33 61.4
1Source: (4) Baath and Soderstrom (1979a); (5) this study; (6) Flanagan and Van Cleve (1977);
(7) Visser and Parkinson (1975).

Table 1.5. Independent variables made available in multiple regression
analyses
Variables
For the month
Maximum air temperature1Minimum air temperature
1Mean air temperature
1Maximum soil temperature
1Minimum soil temperature
Mean soil temperature1Maximum soil temperature
1Minimum soil temperature
1Mean soil moisture
1Throughfal1
Litterfall1Net precipitation
For the season1Heat sum
Explanation
Maximum daily mean
Minimum daily mean
Mean hourly temperature
Maximum daily mean
Minimum daily mean
Mean hourly temperature
Maximum weekly sample
Mimimum weekly sample
Mean of weekly samples
Total (mm)
Total dry weight captured (g)
Throughfall minus evaporation
Cumulative sum of mean soil temperatures
1Used at least once in hyphal model equations.

37
REFERENCES
Baath, E. and Soderstrom, B. E. 1979a. Fungal biomass and fungal
immobilization of plant nutrients in Swedish coniferous forestsoils. Revue d'Ecologie et de Biologie du Sol, 16:477-489.
Baath, E. and Soderstrom, B. E. 1979b. The significance of hyphal
diameter in calculation of fungal biovolume. Oikos, 33:11-14.
Bissett, J. and Parkinson, D. 1979a. Fungal community structure in
some alpine soils. Canadian Journal of Botany, 57:1630-1641.
Bissett, J. and Parkinson, D. 1979b. Functional relationships
between soil fungi and environment in alpine tundra. Canadian
Journal of Botany, 51:1642-1659.
Bloomfield, B. J. and Alexander, M. 1967. Melanins and resistance
of fungi to lysis. Journal of Bacteriology, 93:1276-1280.
Boois, H. M. de. 1976. Fungal development on oak leaf litter anddecomposition potentialities of some fungal species. Revue
d'Ecologie et du Biologie du Sol, 13:437-499.
Burges, A. and Nicholas, D. P. 1961. The use of soil sections instudying the amount of fungal hyphae in soil. Soil Science,
92:25-29.
Cochrane, V. W. 1958. Phisology of fungi. Wiley, New York.
Dowding, P. and Widden, P. 1974. Some relationships between fungi
and their environment in tundra regions. In Soil Organisms and
Decomposition in Tundra, (A. J. Holding, OtW., Heal, S. F.Maclean Jr. and P. W. Flanagan, Eds.), pp. 123-150. Tundra
Biome Steering Committee, Stockholm, Sweden.
Flanagan, P. W. and Van Cleve, K. 1977. Microbial biomass,respiration and nutrient cycling in a black spruce taigaecosystem. In Soil Organisms as Components of Ecosystems, (U.Lohm and T. TErsson, Eds.). Ecological Bulletin, 25:261-273.
Fogel, R. and Hunt G. 1979. Fungal and arboral biomass in a
Western Oregon Douglas-fir ecosystem: distribution patterns andturnover. Canadian Journal of Forest Research, 9:245-256.
Fogel, R. and Hunt, G. 1983. Contribution of mycorrhizae and soil
fungi to nutrient cycling in a Douglas-fir ecosystem. Canadian
Journal of Forest Research, 13:219-232.
38
Frankland, J. C. 1974. Importance of phase-contrast microscopy forestimation of total fungal biomass by the agar-film technique.Soil Biology and Biochemistry, 6:409-410.
Frankland, J. C. 1975. Estimation of live fungal biomass. Soil
Biology and Biochemistry, 7:339-340.
Hurst H. M. and Wagner, G. H. 1969. Decomposition ofC14-labeled wall and cytoplasmic fractions from hyaline andmelanic fungi. Soil Science Society of America Proceedings,33:707-711.
Jones, P. C. T. and Mollison, J. E. 1948. A technique for thequantitative estimation of soil micro-organisms. Journal ofGeneral Microbiology, 2:54-69.
Knezevich, C. A. 1975. Soil Survey of Benton County, Area,Oregon. U.S. Department of Agriculture, Soil ConservationService, U.S. Government Printing Office, Washington, D.C.
Kuo, M. J. and Alexander M. 1967. Inhibition of the lysis of fungiby melanins. Journal of Bacteriology, 94:624-629.
Laursen, G. A. and Miller, O. K. Jr. 1977. The distribution offungal hyphae in arctic soil on the tundra biome site, Barrow,Alaska. In The Belowground Ecosystem: A Synthesis of PlantAssociated Processes, (J. K. Marshall, Ed.), pp. 205-214. Range
Science Department, Science Series No. 26, Colorado StateUniversity, Fort Collins.
Martinez, A. T. and Ramierez, C. 1978. Microfungal biomass andnumber of propagules in an andosol. Soil Biology andBiochemistry, 10:529-531.
Mexal, J. and Reid, C. P. P. 1973. The growth of selectedmycorrhizal fungi in response to induced water stress. CanadianJournal of Botany, 51:1579-1588.
Meyer, F. H. 1964. The role of the fungus Cenococcum graniforme(Sow.) Ferd. et Winge in the formation of mor. In Soil
Micromorphology (A. Jongerius, Ed.), pp. 23-31. Elsevier,Amsterdam.
Mikola, P. 1948. On the physiology and ecology of Cenoccumgraniforme especilly as a mycorrhizal fungus of birch.Communications Instituti Forestalis Fenniae, 36:1-104.
Nagel-de Boois, H. M. and Jansen, E. 1967. Hyphal activity in mulland mor of an oak forest. In Progress in Soil Biology, (0.Graff and J. E. Satchell, EdT.), pp. 27-36. Verlag Friedrich,Braunschweig.

39
Nagel-de Boois, H. M. and Jansen, E. 1971. The growth of fungal
mycelium in forest soil layers. Revue d'Ecologie et de Biologiedu Sol, 8:509-520.
Nicholas, D. P. and Parkinson, D. 1967. A comparison of methods
for assessing the amount of fungal mycelium in soil samples.Pedobiologia, 7:23-41.
Nicholas, D. P., Parkinson D. and Burges, N. A. 1965. Studies offungi in a podzol II. Application of the soil sectioningtechnique to the study of amounts of fungal mycelium in thesoil. Journal of Soil Science, 16:258-269.
Parkinson, D., Balasooriya, I. and Winterhalder, K. 1968. Studies
on fungi in a pinewood soil III. Fungal growth and totalmicrobial activity. Revue d'Ecologie et de Biologie du Sol,4:637-645.
Saito, T. 1955. The significance of plate counts of soil fungi andthe detection of their mycelia. Ecological Review, 14:69-74.
Soderstrom, B. E. 1975. Vertical distribution of microfungi in aspruce forest soil in the South of Sweden. Transactions of theBritish Mycological Society, 65:419-425.
Soderstrom, B. E. 1979. Some problems in assessing the fluoresceindiacetate-active fungal biomass in the soil. Soil Biology andBiochemistry, 11:147-148.
Steel, R. G. D. and Torrie, J. H. 1960. Principles and Proceduresof Statistics. McGraw-HIll, New York.
Thomas, A., Nicholas, D. P. and Parkinson, D. 1965. Modificationsof the agar film technique for assaying lengths of mycelium insoil. Nature, 205:105.
Trappe, J. M. 1964. Mycorrhizal hosts and distribution ofCenococcum graniforme. Lloydia, 27:100-106.
Visser, S. and Parkinson, D. 1975. Fungal succession on aspenpoplar leaf litter. Canadian Jounral of Botany, 53:1640-1651.
Widden, P. and Parkinson, D. 1973. Fungi from Canadian coniferousforest soils. Canadian Journal of Botany, 51:2275-2290.
Worley, J. F. and Hacskaylo, E. 1959. The effect of available soilmoisture on the mycorrhizal association of Virginia pine.Forest Science, 5:267-268.

40
CHAPTER II
SEASONAL HYPOGEOUS SPOROCARP PRODUCTION IN A
WESTERN OREGON DOUGLAS-FIR STAND
by
Gary Alan Hunt
Department of Forest ScienceOregon State UniversityCorvallis, Oregon 97331
and
James M. Trappe
U. S. Department of Agriculture Forest ServicePacific Northwest Forest and Range Experiment Station
Forestry Sciences Laboratory3200 Jefferson Way
Corvallis, Oregon 97331

41
ABSTRACT
Hypogeous fungal sporocarps were collected in randomly located
plots over 32 months in a 35- 50-year-old Douglas-fir stand in
western Oregon. Nine ascomycete and 21 basidiomycete species were
collected during the study. Production was dominated by a few
species: taxa accounting for 5 percent or more of total annual dry
weight were Gautieria monticola, Hysterangium crassum, H.
separabile, and Melanogaster ambiguus. Annual productivity
estimates ranged from 5,815 to 6,648 sporocarps ha-1 and 2.0 to
3.2 kg dry weight ha-1. Peaks in production generally resulted
from a large contribution by one or two species. Pronounced
seasonal trends in production were not evident, although standing
crops decreased in winter. Annual fruiting period varied greatly
between different species, ranging from 3 to 11 months.
INTRODUCTION
Understanding the importance of fungal sporocarp production to
forest ecosystems requires quantitative data on species abundance
and phenological patterns of fruiting. Such data are needed to
establish recognizable and consistent patterns in ectomycorrhizal
fungal communities in different ecosystems. Scarcity of
quantitative sporocarp data limits our understanding of the
contribution by fungi to ecosystem nutrient cycling and their
importance as a food resource to mammals and other forest animals.

42
Recent reports having quantitative data on epigeous
(aboveground) sporocarp production include Richardson (1970), Endo
(1972), Fogel and Hunt (1979), and Vogt et al. (1981). Earlier
studies have been summarized by Lange (1948), and Cooke (1948,
1953). Fogel (1976) published the only quantitative study of
belowground (hypogeous) sporocarps, combining data on species
composition with estimates of production. He reported hypogeous
sporocarp phenology over three years in a 40-65-year-old Douglas-fir
stand in western Oregon. Vogt and others (1981) listed production
estimates of hypogeous genera for one-year in 23- and 180-year-old
Abies amabilis Dougl. (Forbes) stands in western Washington.
We herein present data describing the hypogeous mycoflora and
phenological patterns of production over two years and eight months
in a young Douglas-fir stand. Our data complement those of Fogel
(1976) and, together, the two studies characterize the hypogeous
fungal community of this young Douglas-fir forest type to a degree
unattained for any other ecosystem.
MATERIALS AND METHODS
The site
The study site is located 14 km west of Philomath, Oregon (R7W,
T12S) at an elevation of 381 m on the north side of Mary's Peak.
Aspect is north and slope averages 40 percent.

43
The climate is characterized by mild winters and warm, dry summers
(mean air temperature of 2.7 and 18.5°C in January and July,
respectively). Annual precipitation averages 1905 mm; the occasional
winter snowfall is seldom heavy. Neither temperature or precipitation
patterns deviated substantially from normal during the study.
The stand is a second-generation (36-50 years old) Douglas-fir
(Pseudotsuga menziesii) (Mirb.) Franco.) forest established after
clear-cutting. The 600 live trees per hectare have a basal area of
60.5 m2 ha-1
and a bole volume of 808.8 m3
ha-1
. Other tree
species are scattered: red alder (Alnus rubra Bong.), western hemlock
(Tsuga heterophylla (Raf.) Sarg.), and western red cedar (Thuja
plicata Donn.). The patchy understory (resulting from openings caused
by Phellinus weirii (Murr.) Gilb. root rot of Douglas-fir) consists of
vine maple (Acer circinatum Pursh), Oregon grape (Berberis nervosa
Pursh), Sword fern (Polystichum munitum (Kaulf.) Persl.), and bracken
fern (Pteridium aquilinum (L.) Kuhn.). Fallen trees and stumps
greater than 12.7 cm diam comprise a volume of 151 m3
ha-1
and
debris between 2.5 and 12.7 cm diam was estimated (2 percent sample)
to be 37.3 m3
ha-1
.
The Slickrock gravelly loam soil of the site is a deep (100-150 cm
to bedrock), well-drained colluvium soil weathered from sandstone
(Knezevich 1975). Surface organic layers (A00, A01) are
moderately well developed (averaging 3.2 cm in depth) and are
associated with moss over most of the site. The A02
(humus) layer
is well mixed (mull humus type) with surface mineral soil by the
activity of earthworms and microarthropods. The A horizon (the zone

44
of maximum rooting) extends to a depth of 15 cm and is friable,
slightly sticky, and contains 20 percent fine pebbles. Both organic
and mineral horizons are strongly acid ranging from pH 5.5 to 5.7.
Sampling and specimen processing
Monthly production was estimated from 12 randomly located 4 m2
quadrats sampled without replacement. Litter was completely removed
from each plot and the mineral soil turned to a depth of 5-10 cm with
a rake. Sporocarps present were placed in waxed-paper bags for
transport to the laboratory. A soft brush was used to remove adhering
soil from sporocarps. Specimens were cut in half and dried in a
forced-air oven at 60°C for 48 h; dry weight of each collection was
then recorded.
RESULTS
Eight ascomycete and 18 basidiomycete species were collected
during the first two years of the study (Table II.1). Four more
species (1 ascomycete, 3 basidiomycetes) were found during eight
additional months of collecting: Genea harknessii Gilkey,
Rhizopogon colossus A. H. Smith, Rhizopogon hawkeri A. H. Smith, and
Zelleromyces gilkeyae Sing. and Smith. Genera represented by the
most species were Rhizopogon with six species, and Tuber and
Hysterangium, each with five. The single collection of Tuber sp. in
year 1 was too immature for identification. Four undescribed

45
species were collected: one Tuber, one Rhizopogon, and two species
of Hysterangium. One collection each of Hymenogaster and Martellia
could not be identified to described species; further investigation
is needed to determine if they are undescribed.
Number of sporocarps collected monthly ranged from 625 (November
1981) to 16,664 per hectare (April 1982) while monthly biomass
ranged between 0.15 (November 1981) and 17.5 (October 1980) kg dry
weight ha-1 (Fig. II.1). Annual productivity estimates (Table
II.1) ranged from 5,815 to 6,648 sporocarps ha-1
and 2.0 to 3.2 kg
dry weight ha-1
. Sporocarp number and weight fluctuated greatly
between consecutive sample dates throughout the study. Numbers
remained relatively constant during only two periods: September
through December 1981 and September through December 1982. Biomass
fluctuated little over the last 15 sample dates. Peaks in
production frequently resulted from a large contribution by one or
two species, most often Hysterangium crassum, H. separabile, or
Gautieria monticola. For example, 53 percent of the 65 sporocarps
collected for September 1980 were Hysterangium crassum.
Hysterangium crassum and H. separabile were the only species
collected in April 1982 when the highest number (80) of sporocarps
were collected. October 1980, and June and July 1981 had higher
biomass production than other months of the study. For these
months, Gautieria monticola composed 89 percent, 70 percent, and 57
percent, respectively, of monthly production. Neither weight or
number of hypogeous sporocarps showed the distinct seasonal peaks
characteristic of epigeous sporocarps (Fig. II.1), but a decrease in
number and weight of hypogeous sporocarps occurred each winter.

46
Correlation between number and weight of sporocarps is low,
reflecting the high variability of mean sporocarp dry weight both
between and within species (Table II.1). The correlation
coefficient of determination (r2) was 0.15 for number and weight
data over the entire study.
Species contributing five percent or more to total annual weight
or sporocarp number (Table 11.2) were considered major species
(Hering 1966). Biomass of Hysterangium crassum was surpassed the
first year by Gautieria monticola, but was highest in year 2,
contributing 40.4 percent of annual production. The high value for
Gautieria monticola in year 1 resulted largely from one month of
high biomass (October 1980). Number of major species are few (7 in
year 1, 4 in year 2), but compose a high percentage of annual
production; percentage by weight ranged from 77.6 to 91.3.
Seasonal productivity on individual species (Table 11.3) can be
examined by obtaining middates of fruiting from the formula
m = (d(n)/N)
where m is the midpoint in days after the starting point, n is the
number or weight of sporocarps collected d days after the starting
point and N is the total number or weight recorded. Average
middates for spring (March-June) and fall (September-December) peaks
were 16 April and 12 October, respectively. Individual species
middates generally did not differ more than 7 wks between years
except for Hysterangium crassum and Melanogaster ambiguus.
Hysterangium crassum and H. separabile appear to be capable of
fruiting any month while others are restricted to fall (e.g.,

47
Truncocolumella citrina) or spring (e.g., Barssia oregonensis).
Sporocarp number and biomass were greater in spring than in fall for
1981 and 1982 (Fig. II.1, Table 11.9). Average middate for all
ascomycetes (12 July) compared to all basidiomycetes (2 August) did
not differ significantly (P >0.05).
The species-area curve for our study (Fig. 11.2) shows species
number was still increasing at the end of the study. Twenty species
were collected by the end of year one, 26 species after two years,
and 30 by the end of the study.
DISCUSSION
Sampling considerations
Sampling hypogeous sporocarps presents problems not encountered
in sampling aboveground components of plant communities, because
sporocarp populations are ephemeral and constantly change both
quantitatively and qualitatively. No good method for predicting
sporocarp location is known. In addition, individuals are typically
distributed in clusters rather than homogeneously. Fogel (1976,
1981) described three types of sporocarp clustering occurring in the
Oregon Coast Range. Stand size may limit sample size because
quadrats cannot be resampled during a study. New quadrats are
required each sampling date because harvesting by raking disturbs
litter layers and surface mineral soil.

48
While no absolutely objective guide exists for establishing
sample size or number, a "minimal area" quadrat size (i.e., the
smallest area on which species composition of a community can be
adequately represented) can be estimated from a species-area curve
(Mueller-Dombois and Ellenberg 1974). Cain's method (in
Mueller-Dumbois and Ellenberg 1974), for example, establishes a
point on the curve at which an increase of 10 percent in total
sample area yields 10 percent more species of the total recorded for
the study; this is a sample of 509 m2
for our stand. Another
method is to set an objective standard based on total number of
species collected and require the sample quadrat to contain 95
percent of that number. From our species-area curve, this is
1402 m2
. While these methods can be used as general guides to
establishing sample size, technically they cannot be applied to
sampling hypogeous sporocarps because two basic criteria are not
met. Minimal area can only be determined in communities which are
not fragmented (i.e., not lacking species usually present in the
recurring assemblage) and are relatively homogeneous in distribution
(Mueller-Dombois and Ellenberg 1974). Moreover, only species-area
curves that level off can be used for minimal area determination.
Thus, for hypogeous sporocarps, sample area and quadrat size are
determined by what is practical and manageable given stand size,
stand composition, and time limitations. Consequently, our
relatively small sample of 48 m2/mo sample may underestimate
sporocarp production. Because sampling of hypogeous fungi requires
considerable time and area, data sets can seldom meet the

49
assumptions for standard statistical procedures. Data reported by
Fogel (1981) suggest that larger quadrats are better to quantify
biomass or numbers, while a large number of smaller quadrats is best
for documenting species number. Because many hypogeous fungi do not
fruit every year and some may fruit only once in five or ten years,
collecting over extended time may be more important than the area
sampled.
Large biomass fluctuation between monthly samples partly
reflects sampling technique but also expresses the highly variable
spatial and temporal distribution of sporocarps. Rapid biomass
decreases can result from senescence influenced by weather
conditions or harvesting by mammals. Biomass peaks are most often
attributable to one or two species. Documenting the occurrence of
biomass peaks and low points could be improved with information on
sporocarp longevity. While no studies of longevity have been
reported, our field observations and herbarium data show high
variability between species. Most ascomycetes have a longer period
of maturation than basidiomycetes. Tuber gibbosum, for example,
typically first appears in October, when most specimens are
immature, having little odor and a pale gleba. Maturation continues
over four to five months; most collections from late December and
January are fully mature with noticeable odor and gleba dark from
matured spores. Sporocarps of the ascomycete Elaphomyces (not
collected in this study, but occurring in the Coast Range) probably
last many months because they have a thick, firm peridium and mature
slowly (Trappe 1976). The basidiomycete Truncocolumella citrina, by
50
contrast, is much more ephemeral. Fully mature and senescent
specimens can be found within two weeks after fruiting begins.
While sporocarps of most basidiomycete species in the Oregon Coast
Range may last about a month, a few species probably last much
longer. Sporocarps of Hysterangium crassum and Gautieria monticola,
major species both years of our study (Table 11.7), are associated
with dense rhizomorph mats (Cromack et al. 1979) that are
hydrophobic and may protect sporocarps from high moisture levels
reached in adjacent soil.
Variation between samples might be reduced by sampling twice
monthly or stratifying samples. Occasionally, a large biomass
change occurs in a short time that may be missed by monthly
sampling. Fogel (1976) found a decrease form 3.9 to 0.1 kg ha-1
in samples taken 17 days apart during December. Samples could be
stratified to reflect microhabitat variation in a stand. For
example, habitats such as drainages, open spaces, or areas adjacent
to woody debris could be sampled systematically and compared.
Peaks in biomass frequently result from "blooms" of one
species. The large crop of Gautieria monticola in October 1980, for
example, (89 percent of October biomass) resulted in that month
contributing 49 percent of total annual production. Without this
large fruiting, October would have had 29.5 percent of the annual
production. Fogel and Hunt collected 78.1 g dry weight/100 m2
(201 sporocarps) of Truncocolumella citrina in November 1976 from a
Douglas-fir stand at Dinner Creek, 3 km from our site. This sample
comprised 35 percent of the total hypogeous sporocarp biomass for
the year.

51
Comparison of taxa
Similarity of taxa between two stands can be examined by
calculation of the Jaccard Similarity Coefficient, s (Janson and
Vegelius 1981):
s . a/a b c
where a is the number of taxa in common to both stands, b the number
of taxa in stand one but not in stand two, and c, the number in
stand two but not one. Multiplying s x 100 gives the percentage of
taxa in common to two stands.
Species data are available from two other studies conducted
longer than one year (Fogel 1976, Fogel and Hunt unpublished data
1978). Fogel found 24 species (11 ascomycetes, 13 basidiomycetes)
over three years of monthly collecting in a Douglas-fir stand
located 250 m from our site. Because our stand and that of Fogel
have a comparable environment and are of similar age and
composition, our study can be considered an extension of his and the
total data applicable to this Douglas-fir habitat type. The
combined species list totals 36 (13 ascomycetes, 23 basidiomycetes)
representing five years and eight months of study. Our species-area
curve (Fig. 11.2) did not reach a stable plateau during this study,
indicating that not all species were recorded. Inability to
document all species is not unique to mycologists and occurs in
ecosystem level taxonomic studies of most all organism groups. So
long as sampling methods are standardized, however, it is generally
valid to compare species lists from different locations and studies.

52
Available data permit comparison of species occurrence in three
stands on Mary's Peak by use of the Jaccard Similarity Coefficient.
The three stands can be considered as two pairs; the two north side
stands on Woods Creek (ours and Fogel's (1975)) and the second pair
consisting of our stand and the Dinner Creek stand on the south side
of Mary's Peak (Fogel and Hunt 1979). Our Woods Creek stand was not
far from Fogel's and the two resembled each other much more closely
than either resembled the Dinner Creek stand in overall habitat and
structure. Thus we hypothesized that the hypogeous mycota of our
stand was more like that of Fogel's Woods Creek stand than that of
Dinner Creek. A comparison of the mean percentages of total taxa in
common and major taxa in common shows some trend in support of the
hypothesis (Table 11.4).
Similarity of total and major species between the Woods Creek
stands is lower than expected. High year-to-year variability in
sporocarp abundance appears to explain differences in major species
between the two stands (Table 11.5). Consequently, a species may
dominate production one year and be of little consequence other
years. For example, five species of ascomycetes were among major
producers during Fogel's study, but no ascomycetes were major
species during our study. The pattern of occasional fruiting
exhibited by numerous species suggests one reason why lists of total
species for the two stands are dissimilar. Of thirteen species not
shared by the two stands, ten fruited once in three years.
Hysterangium occidentale Harkn. is an example of a species which
fruits rarely. Only two collections of this species have been

53
recorded from the Coast Range, one obtained in 1966 by J. Trappe on
the north side of Mary's Peak and the second collected by Fogel
(1976). Fruiting periodicity data indicate that long term studies
are essential to documenting species occurrence, even in small
stands.
Fruiting periodicity is controlled by numerous factors (Fig.
11.3) including conditions of the general environment as well as
those of microhabitats. Although the general environment of the
Woods Creek stands is similar, differing climatic conditions during
the two studies may have contributed to differences in mycota.
Fogel's site is less steep than ours and has a northwest aspect,
conditions that would make his site dryer and influence microhabitat
conditions important to fruiting.
The alternative explanation for dissimilarity in species between
the Woods Creek stands is that the mycotas may actually be
dissimilar and continued sampling would not result in highly similar
species lists. This would imply that some species are restricted to
narrowly defined microhabitats and are not readily established away
from these areas. Moreover, it suggests a danger in generalizing
research results from one stand to others even though sites are
generally similar.
Major differences in the hypogeous mycota exist between our
north-facing stand and the south-facing Dinner Creek stand. Fewer
species were found at Dinner Creek, 15 in total (one ascomycete, 14
basidiomycetes) over 27 months of collecting (see Appendix).
Monthly sample size at Dinner Creek was 100 m2
. Major species

54
differed greatly between the two stands (Table 11.4): none were in
common for major species by weight and only one (Truncocolumella
citrina) of nine was the same for major species by number.
Leucogaster rubescens Zeller and Dodge and Leucophleps magnata
Harkn. (Fogel 1979) occurred abundantly (major species both years)
at Dinner Creek, but were absent at our site. Herbarium records
indicate that these genera have not been collected from the north
side of Mary's Peak. The two stands have major differences that
could influence species composition and production. Amount of
precipitation is similar (about 1900 mm mean/yr) but was
substantially below normal (848 mm) the first year of the Dinner
Creek study. While soils are similar at both sites (gravelly loam;
18-20 percent pebbles) soil moisture is lower at Dinner Creek due to
the south aspect and scant litter layer.
Few studies have documented species of hypogeous fungi in
forests and none have compared epigeous and hypogeous species in one
stand. States (1983, 1984) has recorded six ascomycetes and 18
basidiomycetes to date in an ongoing study of pure and mixed stands
of Pinus ponderosa (Laws.) in Arizona. Over two years of spring and
fall sampling, Hunt and Luoma (unpublished data 1984) have collected
nine species of ascomycetes and 36 basidiomycetes from ten stands
representing a range of age classes and moisture conditions. These
are mixed conifer stands dominated by Douglas-fir in the central
Oregon Cascades. Terwilliger (1985) collected seven ascomycetes and
15 basidiomycetes over four months of sampling in an Abies grandis
(Dougl.) Lindl. dominated stand (1463 m elev.) in western Idaho.
55
Number of aboveground (epigeous) mushroom species is probably
greater than hypogeous species in a given area, but this requires
confirmation. Because all hypogeous species are probably
ectomycorrhizal (Trappe and Maser 1977, Miller 1983) comparison to
epigeous ectomycorrhizal species is the most meaningful. Maas and
Stuntz (1970) reported 134 epigeous species from a mixed conifer
(Pseudotsuga, Abies, Pinus) stand on serpentine soil in the
Washington Cascades. Of these, 22 (16 percent) were putative
ectomycorrhizal species (Trappe 1962a). Twelve of 28 (43 percent)
epigeous species from a Scots pine stand in Scotland listed by
Richardson (1970) were presumably mycorrhizal. Vogt and others
(1981) reported numbers of epigeous species and hypogeous genera
from two stands of Abies amabilis (Dougl.) Forbes in central
Washington. During six months of collecting they recorded 48
epigeous species and two hypogeous genera (Rhizopogon and Genea) in
a 23-year-old stand and 50 epigeous species and one hypogeous genus
(Elaphomyces) from a 180-year-old stand. Fogel (1981) reviews
fungal taxa lists from studies in Europe and Japan.
Evidence indicates that diversity of putative ectomycorrhizal
epigeous and hypogeous species increases with stand age. This
suggests that fungal succession proceeds toward increased diversity
as host trees mature, at least up to a point. Studies of epigeous
fungi conducted by Miller (1983) in western white pine (Pinus
monticola Dougl. ex D. Don) revealed five, 37, and 78 putative
ectomycorrhizal species in 15, 30-40, and 175-215 year-old stands,
repectively. Hunt and Trappe (unpublished data 1983) have

55
identified one hypogeous species from five-year-old clear-cut and
planted stands, 13 species from 85 year-old stands, and 15 and 32
species from 120 and 250 year-old stands, respectively, after two
seasons of collecting in stands dominated by Douglas-fir. While
reasons for increased fungal species diversity with stand age remain
to be enumerated, data suggest several possible influencing
factors. Specificity between some ectomycorrhizal fungi and their
hosts is well documented although little is known about mechanisms
of recognition between compatable partners (Molina 1981). For
example, Alnus and its ectomycorrhizal fungi are strongly specific.
This specialization may limit species of ectomycorrhizal fungi on
sites dominated by alder (Molina 1981). Competition among
ectomycorrhizal fungi for root colonization sites may influence
fungal species composition in a stand, but this is not known. Fine
root biomass varies with stand age (Karizume 1968; Persson 1978,
1980; Grier et al. 1981; Vogt et al. 1981) and productivity (Vogt et
al. 1983). Vogt and others (1983) found that fine root biomass in
Abies amabilis reached maximum near the time of canopy closure
(stands 40-70 years old) and thereafter decreased substantially in
more productive stands (site class II). Less productive sites
(nutrient poor, site class IV) showed a decrease in fine root
biomass after canopy closure, but maintained significantly higher
fine root mass compared to class II sites. The authors attribute
these biomass differences to lower nutrient availability in low site
quality stands, a condition requiring more roots to obtain adequate
nutrients. Growing evidence indicates that succession in higher

57
plant communities is not the driving force of ectomycorrhizal
succession but that fungi, by influencing interactions between roots
of plants, may act as agents of changing ecosystem structure (Bowen
1980, Janos 1985, Perry 1985).
Success of ectomycorrhizal fungi on a particular site is
influenced by numerous factors including competition with other
ectomycorrhizal fungi (Perry 1985), light and temperature (Pilz and
Perry 1984), soil-litter chemistry (Handley 1963, Shoenberger and
Perry 1982, Rose et al. 1983, Gardner and Malajczuk 1985), and site
productivity and disturbance (Shoenberger and Perry 1982, Pilz and
Perry 1984, Perry 1985). Growth of ectomycorrhizal fungi in pure
culture may be stimulated, suppressed, or unchanged by presence of
litter leachates, the response depending on species of fungus,
litter type, and leachate concentration (Rose et al. 1983). Buildup
of litter and consequent biochemical changes may alter types of
fungi present (Gardner and Malajczuk 1985) and produce stratified
rooting zones in litter, humus layers, and mineral soil (Cole
1981). Trappe (1962b) found that Cenococcum geophilum becomes
increasingly dominant in sites with increasing hazard of temperature
or moisture stress. In addition, ectomycorrhizal fungi may alter
their own biochemical environment by influencing foliage terpene
concentration (Perry 1985).
Diversity and stability of ectomycorrhizal communities in the
Oregon Cascades are influenced by degree and type of disturbance
resulting from differing logging practices (Schoenberger and Perry
1982, Pilz and Perry 1984, Perry 1985). Soil structure probably

58
influences distribution of some fungal species. Our observations of
species that produce abundant rhizomorphs (e.g., Hysterangium
crassum and Gautieria monticola) indicate that they occur more
commonly in loose clay loam soil than in compact or heavy clay soil.
Individual trees and whole ecosystems undergo various changes as
they progress from juvenile to mature and finally to senescence
(Bormann and Likens 1979, Kramer and Kozlowski 1979). As trees age,
orderly and progressively degradative physiological changes occur
(Kramer and Kozlowski 1979) and may directly or indirectly influence
ectomycorrhizal symbionts. Changes in food, water, mineral, and
hormonal relations resulting from declining photosynthetic output
and increased respiration from accumulating sapwood contribute to a
metabolic shift. Decreasing metabolism results in declining rates
of shoot, cambial,and root growth and decreasing annual dry weight
increment. Successional changes in ecosystems may be related to a
successional sequence of ectomycorrhizal fungi (Mason et al. 1983).
It is logical to assume that changes in fungal species richness
would occur as ecosystems pass through major structural changes.
Major stages in stand development, by increasing age, have been
named (Bormann and Likens 1979): "Reorganization," "Aggradation,"
"Transition," and "Shifting-Mosaic Steady State." Because different
ectomycorrhizal species are adapted to different conditions (Perry
1985), it follows that increased habitat diversity would increase
species richness. Habitat diversity remains fairly low during
Aggradation, the stage of relatively even-aged trees, low plant
species diversity, and uniform environmental conditions. Habitat

59
diversity increases as dominants fall and openings are created
(Transition stage). Greatest habitat diversity occurs during the
attainment of the Shifting-Mosaic Steady State which is
characterized as an array of irregular forest patches composed of
relatively diverse vegetation of different ages, well developed
litter layers, and abundant woody debris. Richness of
ectomycorrhizal species probably peaks in forests of this type.
Ecosystem development from young to mature stages gives rise to
the hypothesis that young stands favor ectomycorrhizal fungi (and
vascular plants) with high growth and reproductive potential, those
species better adapted to disturbance and comparatively rapidly
changing environmental conditions ("r" selection). More mature
stages of ecosystem development would favor species ("K" selection)
having lower growth and reproductive potential but with higher
capability of competitive survival in older, "fully occupied"
forests (Odum 1969, Bormann and Likens 1979, Grime 1979). Whether
this range of "strategies" actually exists within ectomycorrhizal
fungi is unexplored.
Production
Estimates of net hypogeous sporocarp production are not possible
because losses cannot be measured. Biomass losses occur from
decompositon, grazing by soil fauna, and consumption by mammals
(mycophagy). Consequently, production values are obtained by
summing totals or calculating means from sample plots. Estimates of
annual production can be derived by three methods: (1) by

60
converting monthly standing crops (biomass or sporocarp number) to a
hectare basis and summing all months for the year, (2) by
accumulating monthly standing crops (grams or number collected) and
the area sampled for all months and converting to a hectare basis at
years end, and (3) by calculating the mean of monthly standing crops
(kg ha-1) for the year.
Calculating monthly standing crops of sporocarps by averaging
individual plot values or deriving annual production as a mean of
monthly standing crops is of limited use because variation is
typically high and significant differences between means are seldom
evident. Method one is the most commonly used of the three, but
probably gives an overestimate of production in most cases. Use of
method one assumes that the sporocarp population is completely
replaced each sampling period, probably an uncommon occurrence. The
equivalent annual totals per hectare in Table II.1 were derived by
method two, which gives a lower annual production value compared to
method one. In year one of our study, for example, method one
results in a production of 35.4 kg ha-1
yr-1
(Table 11.6) and
method two, 3.2 kg ha-1
yr-1
. We feel method one overestimates
production in our stand because longevity of highly productive
Hysterangium and Gautieria species likely exceeds one month.
Available estimates of hypogeous sporocarp standing crops and
production (Table 11.6) range from 1.4 to 142 kg ha-1 for single
sample estimates and 22 to 380 kg ha-1 yr-1 for annual
production (calculated as a sum of monthly kg ha-1
). Annual
production in Douglas-fir ranges from 24 to 43.9 kg ha-1 yr-1.

61
The high value for Pacific Silver fir (Vogt et al. 1981) is probably
due to two factors. Elaphomyces, the only hypogeous taxon collected
in their 180-year-old stand, produces exceptionally heavy
sporocarps. Data from the Oregon Cascades show that mean sporocarp
dry weight of Elaphomyces granulatus was 1.12 g compared to 0.37 g
for all other species combined (Hunt unpublished data 1983). In
addition, the authors calculated annual production as a sum of
monthly crops (method one above) which probably substantially
overestimates production of these long-lived sporocarps.
Maximum standing crops of sporocarps produced by hypogeous
species compared to epigeous mycorrhizal species (Table 11.7) were
similar in range. Peak monthly biomass over three years ranged from
3.2 to 17.5 kg ha-1 and 8.7 to 19.6 for hypogeous and epigeous
sporocarps, respectively. However, large differences in biomass
occurred between hypogeous and epigeous mycorrhizal species during
two of three years (Table 11.7). Available data show that hypogeous
sporocarp biomass can peak any month from May to November, but
epigeous sporocarps consistently reach maximum only during fall
months (October to December). Peak production in biomass of
hypogeous sporocarps occurred in July or October in our study but
maxima for epigeous sporocarps (Table 11.7) were always in fall
(October or November). Biomass of hypogeous and epigeous
mycorrhizal sporocarps peaked (10.1 and 16.8 kg ha-1,
respectively) during November in the first year of a study by Fogel
and Hunt (1979, and unpublished data 1978) but hypogeous sporocarps
peaked in August (2.7 kg ha-1
) and epigeous in October (33.4 kg

62
ha-1
during year two. Hypogeous sporocarp biomass peaked in May
during two of three years and in June one year during Fogel's (1976)
study. Large differences in peak standing crops between epigeous
and hypogeous sporocarps in the same year were found by Fogel and
Hunt (unpublished data 1978). In 1977, for example, maximum monthly
standing crop of hypogeous sporocarps was 2.7 kg ha-1 (August)
whereas sporocarps of epigeous mycorrhizal species peaked at 33.4 kg
ha-1 in October. In contrast, peak sporocarp standing crops of
hypogeous and epigeous mycorrhizal species were similar in the first
year of the Fogel and Hunt (1979) study when maxima were 10.1 and
16.8 kg ha-1
, respectively, both occurring in November.
Comparison of annual epigeous and hypogeous sporocarp production
(Table 11.8) shows high variablity. Biomass of hypogeous sporocarps
was greater than the weight of epigeous mycorrhizal species both
years of our study; 76 and 18 percent greater for year one and two,
respectively. By contrast, weight of epigeous mycorrhizal species
was substantially higher than hypogeous (48 and 633 percent higher
for year one and two, respectively) during a study by Fogel and Hunt
(1983). The large decrease in hypogeous sporocarp production (from
21.1 to 6.2 kg ha 1) during the second year of that study may
reflect the abnormally dry year preceeding this drop (rainfall was
45 percent of normal), however weight of both total and mycorrhizal
species of epigeous sporocarps increased modestly the year following
the drought (Table 11.8).
Most available data indicate that a substantial majority of
epigeous sporocarp biomass results from mycorrhizal species. Of the

63
total epigeous sporocarp biomass in our study (Table 11.8), 71.1 to
79.7 percent resulted from mycorrhizal species. This compares with
a range of 73.7 to 96.3 percent recorded by Fogel and Hunt
(unpublished data 1978). Vogt and others (1981) reported that in
two stands of Abies amabalis, 71 percent (23-year-old stand) and 87
percent (180-year-old stand) of epigeous sporocarp dry weight was
produced by mycorrhizal fungi. Of the total epigeous sporocarp
biomass (16-30 kg ha1yr
-1) reported by Richardson (1970), over
- 1half (9.8-19.4 kg ha
-1yr ) resulted from mycorrhizal species.
Seasonality
The relationship of sporocarp production to temperature and
precipitation seems empirical, but clearly many other factors affect
fruiting (Fig. 11.3). Major factors likely to influence seasonal
abundance of sporocarps include energy and nutrient reserves of host
plants and mycelium (Krueger and Trappe 1967), mycophagy, and
physiological interactions of the mycorrhizal association (Hatch
1937, Handley and Sanders 1962). Fogel (1976) found that spring and
fall peaks in hypogeous sporocarp production were associated with
temperature and precipitation patterns. Production in spring seemed
dependent on temperature and began when mean minimum air temperature
exceeded 0°C (6°C mean maximum temperature). Production ceased when
mean minimum and maximum air temperature reached 6°C and 23°C,
respectively, which occurred after precipitation dropped below 5 cm
month-1
and evaporative demand was relatively high. Fall
production began when precipitation was at least 0.5 cm month-1

64
and increased until mean minimum air temperature dropped to 4°C
(18°C mean maximum). Although Fogel (1981) found significant linear
correlations between sporocarp biomass and temperature, and biomass
with temperature plus precipitation, r2
values did not exceed
0.685.
Hypogeous sporocarp production in our study was not well defined
seasonally compared to epigeous sporocarps (Fig. II.1). Epigeous
sporocarps showed a consistent fall peak in October, November, or
December, followed by rapid decline and low production through
spring, reaching zero (or nearly so) in summer. No epigeous
sporocarps appeared in 13 of 30 months (43.3 percent). Production
of hypogeous sporocarps, in contrast, was more uniform. Production
showed no seasonal peaks and never reached zero at any sample
month. Data collected by Fogel and Hunt (1979, unpublished data
1978) showed a similar trend; epigeous sporocarp production was zero
during 41.4 percent of sample months (12 of 29 months) compared to
7.4 percent of (2 of 27 months) for hypogeous sporocarps. Greater
uniformity in monthly production by hypogeous fungi compared to
epigeous is partly because some hypogeous species fruit consistently
during winter, summer, or both seasons. Hymenogaster parksii (Table
11.3), for example, is a winter and early spring fruiting species in
the coast range. Leucogaster rubescens can fruit any season (Fogel
and Hunt unpublished data 1979), but is often present during the
driest months (July-September). Three species common on our site
(Gautieria monticola, Hysterangium crassum, H. separabile) appear to
be fruiting "opportunists" and capable of fruiting any month. They

65
produce dense rhizomorph mats that not only modify the physical and
chemical soil environment (Cromack et al. 1979), but may store
substantial amounts of nutrients and energy that can be relatively
quickly mobilized for sporocarp production. In contrast,
Truncocolumella citrina, a species having a very restricted fruiting
period (Table 11.3) produces little if any supporting rhizomorph
network so that fruiting may depend on a flux of nutrients or other
materials from host trees.
Our data on fruiting periods for common hypogeous species (Table
11.3) can be extended with results obtained by Fogel (1976). Tuber
murinum, for example, fruited from May to September during our study
and from February to July during Fogel's study. Thus, the
documented occurrence for this species is February to September in
these adjacent stands. Fruiting periods for five additional species
(Barssia oregonensis, Hymenogaster parksii, Hysterangium crassum, H.
separabile, and Truncocolumella citrina) were likewise extended by
Fogel's data.
Calculation of fruiting middate for a species over a number of
years indicates consistency of fruiting habit. For five years
(combining our data with that of Fogel (1976)), the middate of
fruiting for Hysterangium separabile was in April, even though the
fruiting period extends all year for this species. Fruiting of
Truncocolumella citrina is always restricted to fall
(September-December) so fruiting middate consistently fell during
the period from September to November. Four species collected in
both our study and that of Fogel (1976) (Barssia oregonensis, Tuber

66
murinum, Hymenogaster parksii, and Hysterangium crassum) had mean
fruiting middates that differed between years by more than one
month. For the three years in which Hymenogaster parksii occurred
(combining data for the two studies), fruiting middate varied from 9
November to 14 March. Comparably, middate for Hysterangium crassum
ranged from 28 March to 13 July. Clearly, there is a high degree of
variability in annual fruiting patterns both between and within some
species.
Comparative data for each of six years (Table 11.9) show biomass
and number of hypogeous sporocarps was always higher in spring than
in fall although seasonal means did not differ significantly
(P >0.05) for weight or number of sporocarps. Sporocarp numbers
ranged from 2.8 (1977) to 8.0 (1981) times greater in spring than in
fall (mean of 3.1 times more). Greater sporocarp numbers in spring
compared to fall is partly due to fruiting of spring ascomycetes
(e.g., Genabea cerebriformis and Genea intermedia) which tend to be
smaller than sporocarps of most basidiomycetes. In addition, some
hypogeous species that fruit both spring and fall produce smaller
sporocarps in spring. Comparison of spring and fall mean sporocarp
weights for the genus Hysterangium, for example, showed a
significant difference (P <0.05). Mean sporocarp weight for all
Hysterangium species combined was 0.19 in spring compared to 0.39 in
fall. Mean sporocarp dry weight of all hypogeous species combined
did not differ (P >0.05) between spring and fall.
Reasons for seasonal fruiting patterns are not clear. Although
hypogeous ascomycetes, as a group, are generally thought of as

67
spring fungi, the fruiting middate for all ascomycetes in our study
(12 July) did not differ significantly (P >0.05)from the middate for
basidiomycetes (2 August). If there are fruiting "strategies," they
are probably adaptations of species rather than genera or larger
groups. Species capable of fruiting year around may have sufficient
stored nutrients and energy in rhizomorphs to permit fruiting during
brief periods of favorable weather. Species that fruit only in fall
or spring may be responding to a combination of abiotic and biotic
factors such as changing temperature and moisture conditions, cold
conditioning, or a nutrient and/or hormonal flux from roots of host
plants. Winter and early spring fruiting species (e.g.,
Hymenogaster parksii) may have a lower optimum metabolic temperature
compared to other species and thus avoid fruiting at times when
competition for nutrients is high. In addition, spores of winter
fruiting species may be readily dispersed by small mammals because
sporocarps of most other fungi are in short supply.
It is clear that a strong interdependence exists between mammals
and hypogeous fungi. This relationship appears to be highly evolved
in many cases and may have developed over more than one hundred
million years of coexistance between gymnosperms and mammals (Trappe
1977, Raven et al. 1981). Substantial evidence indicates that
hypogeous fungi are derived from epigeous taxa (Savile 1968).
Evolution of the hypogeous habit was accompanied by notable
morphological changes from epigeous forms. Sporogenous tissue of
hypogeous fungi is typically enclosed in a continuous peridium and
most species lack the ability to forcibly discharge spores. Unlike

68
epigeous fungi, hypogeous taxa need not uplift spore bearing tissue
above ground so somatic stipe and pileal tissues are absent or
greatly reduced. This allows diversion of energy and nutrient
resources to production of spores and hymenial tissues. A chemical
change which may have evolved with the hypogeous habit is production
of new odor compounds but this remains unexplored. Clearly, odor is
the primary means by which mammals locate hypogeous fungi. There is
little detectable odor on immature sporocarps, but as spores mature,
odor intensifies often becoming nearly overwhelming to humans. The
diversity and structure of mushroom odor compounds is poorly
understood, but a few have been identified (Benedict and Stuntz
1975, Claus et al. 1981, Marin et al. 1984). For example,
eight-carbon alcohol compounds such as oct-len-3-ol are common in
both epigeous and hypogeous mushrooms (Marin et al. 1984). A
steroid identical to a sexual pheromone of the boar has been
identified from the European black truffle, (Tuber melanosporum)
(Claus et al. 1981). This suggests that this truffle has evolved an
odor compound that specifically attracts mammalian mycophagists.
Although hypogeous fungi depend on mycophagy for spore dispersal, it
is unknown if any require spores to pass through a digestive tract
before germination. Spores are viable as ectomycorrhizal inoculum
after passing through digestive tracts of Tassel-eared squirrels
(Kotter and Farentinos 1984), white-footed mice (Miller 1985), bear,
elk, and deer (Trappe unpublished data 1985). Because spores of
ectomycorrhizal fungi germinate poorly under any conditions, effects
of passage through a digestive tract are difficult to determine,

69
although fresh Rhizopogon spores are as effective a mycorrhizal
inoculum as those that have gone through an animal (Trappe and
Castellano, unpubl. data 1985). Inducing spore germination often
requires stress treatment such as low temperature or wetting and
drying (Sussman and Halvorson 1966, Lamb and Richards 1974). Spore
dormancy can sometimes be broken by exposure to extracts or living
roots, or co-culture with other organisms and activated charcoal
(Bowen and Theodorou 1973; Fries 1981, 1983; Fries and Birraux
1980). While mycophagy has not been demonstrated to affect spore
dormancy, digestive tract conditions such as heat, enzymatic action,
and co-culture with microorganisms may potentially stimulate
germination (Fogel and Trappe 1978).
A number of morphological and behavioral adaptations of small
mammals may directly relate to mycophagy. For example, highly
developed olfaction allows detection of fungal odor compounds.
Fossorial animals not only can extract sporocarps from soil
efficiently but also can defecate in burrows thereby placing fungal
inoculum near host roots (Fogel and Trappe 1978, Trappe 1977). In
addition, some mammals in which ectomycorrhizal fungi compose a
significant part of the diet have molars which are rooted rather
than ever-growing (C. Maser, pers. comm.). These mycophagists
include members of the Sciuridae (chipmunks and squirrels),
Cricetidae (native mice), and some members of the family Aricolidae
(voles). Apparently one set of rooted molars lasts a life-time when
the primary diet is soft food such as fungi or mast (nuts).
Analysis of small mammal stomach and fecal samples shows a clear

70
feeding preference for hypogeous over epigeous fungi (Maser et al.
1978a, Sanders 1984). Maser and others (1978a) found a
preponderance of hypogeous taxa compared to epigeous (88 percent
frequency compared to 9 percent, respectively) in animals sampled
when both types of sporocarps were abundant. This suggests that
odor, palatability, or nutritional value may be involved in
preferential selection of hypogeous fungi. Data on food value of
fungi compared to nuts and fruits show that on a dry weight basis,
fungi compare favorably with fruits and nuts in protein,
carbohydrates, and minerals (Fogel and Trappe 1978). Fungi have
less fat than nuts so caloric value is correspondingly less.
However, concentrations of minerals, niacin, and riboflavin in fungi
exceed most nuts and fruits. Comparative food value data alone are
of limited value in determining the relative dietary importance of
fungi because little is known about digestibility of different
fungal and plant tissues. Fungal hyphal cell walls and cytoplasm
are digested but apparently spores are not (Fogel and Trappe 1978).
Limited available data (Fogel and Trappe 1978, Sanders 1984) show
food value of epigeous compared to hypogeous fungi does not differ
significantly. Clearly, by what ever means, hypogeous fungi have
evolved as a more attractive food source to small mammals than
epigeous fungi.
Phenological patterns of hypogeous fungus fruiting may to some
degree reflect the compelling interdependence of small mammals and
fungi. Clearly, hypogeous fungi are a primary or important
alternative food source for numerous mammal species (Fogel and

71
Trappe 1978; Maser et al. 1978a, 1978b; Ure and Maser 1982; McIntire
1984; Maser et al. in press). Despite inadequate quantitative data
for many mammal species, it is clear that mycophagy is a significant
energy source and nutrient transfer mechanism in many ecosystems.
Extremes in abiotic factors of the environment are probably
important "driving forces" in the natural selection and evolution of
hypogeous fungi (Savile 1968). Harsh conditions present at high
elevations, for example, would obviously be buffered in the
belowground environment. In contrast, it seems unlikely that the
comparatively mild climatic conditions characteristic of the Oregon
Coast Range could produce dramatically contrasting selective
pressures favoring the hypogeous habit. It is possible, in areas of
mild climate, that mycophagy has significantly influenced evolution
toward the hypogeous habit. Spore transfer by mammals may be
significantly more efficient than haphazard dispersal by wind. This
could be due to more strategic placement of spore inoculum as well
as possible favorable effects of mycophagy on spore germination and
viability. An additional advantage in dispersal by animals may have
come about with reduction of supportive somatic tissues resulting in
more spores per unit weight of sporocarp. The hypogeous habit is
conducive to an extended fruiting period resulting in greater year
around sporocarp availability for mycophagists. Thus, annual
dispersal period is lengthened and total number of spores dispersed
is increased. Fruiting during the "off-seasons" (winter and summer)
may have evolved partly as a response to competition from other
fungi during the growing season, but also could have been influenced

72
by mycophagy. Demand for sporocarps by mycophagists intensifies as
fungus production decreases when winter and summer climatic
conditions arrive. During late fall near timberline on Mt. Hood,
for example, "soil pits" where mammals have dug for fungi are
abundant, but we seldom find sporocarps. Apparently sporocarps are
virtually all consumed this time of year. It follows that fungi
able to fruit during comparatively unfavorable times would be
assured of spore dispersal by mammals.

I00
cal 80E
- 60
Z 40
20
0100
80
60
40
20
co 0100
80
60
40
20
0 5 7 9 1 1 1 3 5 7 911 1 35 7911
73
" 1 1 1 1 1 f i t i l i T t I l 111111 1 1 I 1 11111B WEIGHT OF HYPOGEOUS SPOROCARPS
C WEIGHT OF EPIGEOUS SPOROCARPS
MONTH (1980-1982)
Fig. II. 1. Monthly production of hypogeous and epigeous
sporocarps in a western Oregon Douglas-fir stand.

30
20
I0
04/192 8/384 12/576 16/768 20/960 24/1152 28/1344 32/1536
MONTHS /AREA ( m2 1
Fig. 11.2. Cumulative number of hypogeous fungal species with time and area
sampled in a western Oregon Douglas-fir stand.

BIOTICENVIRONMEN
ABIOTIC ENVIRONMENTSoil organic matterSoil nutrient status
Soil structureSoil moistureWoody debrisPrecipitationTemperature
75
MycophagyFungal competitionSymbiotic bacteriaAntagonistic organismsUnderstory vegetation
SPOROCARPPRODUCTION
FUNGUS
Water reserveEnergy reserve
Nutrient reserveycorrhizal association
aprophytic abilityHormones
HOSTPLANTS
Stand ageRooting depthRoot tip numberHost specificitySpecies diversity
Physiological statusPercent cover
Fig. 11.3. Major factors influencing hypogeous sporocarp
production in western Oregon.

76
Table II.1. Species list and productivity estimates for hypogeous fungi collected during two years
in a western Oregon Douglas-fir stand.
S ecies
Mean
dry weight Equivalent
Total Equivalent of sporocarps dry weight
Year s orocar s no./ha
Total 1 307 5815 0.55 3221
2 351 6648 0.30 1998Elarssia oregonensis Gilkey 1 5 95 0.54 51
2 2 42 0.19 8Genabea cerebriformis (Harkn.) Trappe '4 1 1 19 0.14 3
2 2 42 0.06 3Genea intermedia Gilkey 1 0 0 0.00 0
2 6 125 0.08 10Tuber gibbosum Harkn. 1 1 19 0.12 2
2 0 0 0.00 0Tuber levissimum Gilkey 1 0 0 0.00 0
2 1 21 0.07 1
Tuber murinum Hesse 1 7 133 0.22 30
2 11 229 0.16 37Tuber rufum (Vitt.) Fischer 1 11 208 0.15 31
2 3 62 0.08 5
Tuber sp. 1 4 76 0.06 52 0 0 0.00 0
Tuber sp. nov. 1 4 76 0.32 24
2 0 0 0.00 0
Gautieria monticola (Harkn.) Harkn. 1 28 530 2.88 15272 17 354 2.11 769
Hymenogaster gilkeyae Zeller & Dodge 1 0 0 0.00 02 1 21 0.22 5
Hymenogaster parksil Zeller & Dodge 1 9 170 0.49 832 0 0 0.00 0
Hymenogaster sp. 1 0 0 0.00 02 2 42 0.58 24
Hysterangium crassirhachis Zeller & Dodge 1 10 189 0.72 1362 1 21 0.52 11
Hysterangium crassum (Tul. & Tul.) Fisher 1 129 2443 0.31 746
2 181 3770 0.22 842
Hysterangium separabile Zeller 1 20 379 0.28 1062 88 1833 0.11 204
Hysterangium sp. nov. 1 1 24 455 0.18 82
2 6 114 0.27 34
Hysterangium sp. nov. 2 1 0 0 0.00 0
2 3 62 0.17 13
Martellia biunnescens Sing. & Sm. 1 1 19 0.07 1
2 1 21 0.71 15
Martellia ellipsospora (Zeller) Sing. & Sm. 1 6 114 0.05 6
2 0 0 .00 0Martellia sp. 1 3 57 0.05 3
2 0 0 0.00 0Melanopster ambiguus (Vitt.) Tul. & Tul. 1 7 133 1.70 225
2 3 62 1.73 108Rhizonumparksii Sm. 1 3 57 0.22 13
2 3 62 0.15 9
Rhizopogon villosulus Zeller 1 16 303 0.10 31
2 0 0 0.00 0
Rhizopogon vinicolor Sm. 1 2 38 0.06 2
2 0 0 0.00 0Rhizopogon sp. nov. 1 1 0 0 0.00 0
2 2 42 0.12 5Truncocolumella citrina Zeller 1 16 303 0.37 112
2 5 104 0.03 4

77
Table 11.2. Species accounting for 5 percent or more ofproductivity of hypogeous fungi in awestern Oregon Douglas-fir stand.
Species
Percentage of total weightyear 1 year 2
Gautieria monticola 47.4 35.9
Hysterangium crassum 23.2 40.4
Hysterangium separabile -- 9.8
Meianogaster mibiguus 7.0 5.2
Total 77.6 91.3
Percentage of total sporocarp no.
Gautieria monticola 9.1 5.0
Hysterangium crassum 42.0 53.6
Hysterangium separabile 6.5 26.0
Hysterangium sp. nov. 1 7.8
Rhizopogon villosulus 5.2
Truncocalumella citrina 5.2
Total 75.8 84.6

78
Table 11.3. Middates of fruiting for selected species of hypogeous
fungi in a western Oregon Douglas-fir stand.
Species Year 1 Year 2 Mean
Standard
deviation
Fruiting
period
Barssia oregonensis 2 July 5 June 18 June 19 June-July
Tuber murinum 23 July 15 June 3 July 27 May-Sept.
Gautieria monticola 21 July 16 June 3 July 25 Apr.-Nov.
Hymenogaster parksii 14 Mar. Nov.-Apr.
Hysterangium crassum 13 July 10 Apr. 26 May 66 Feb.-Dec.
Hysterangium separabile 29 Apr. 17 Apr. 22 Apr. 8 Feb.-Nov.
Melanogaster ambiguus 20 July 3 June 16 June 33 May-Aug.
Rhizopogon parksii 3 Nov. 4 Dec. 18 Nov. 22 Sept.-Dec.
Truncocolumella citrina 16 Oct. 26 Sept. 5 Oct. 14 Sept.-Nov.
Spring peak 26 Apr. 5 Apr. 16 Apr. 15
Fall peak 30 Sept. 23 Oct. 12 Oct. 16

Table 11.4. Similarity of hypogeous fungal taxa between different stands of Douglas-fir in
western Oregon.
Stand pairs2
Total taxa
in common (%)
Species Genera
Major taxa1
Major taxa1
in common (7.) in common (%)
by weight by number
Species Genera Species Genera
North slope no. 1, North slope no. 2 54 75 38 33 27 22
North slope no. 1, South slope 32 69 0 17 11 40
1Taxa composing 5% or more of annual production on the basis of weight and number of sporocarps,
respectively.2Data for stand 1 are this study, data for stand 2 and the south slope are from Fogel 1976 and
Fogel and Hunt 1979, respectively.

80
Table 11.5. Variability in annual production by
some major species of hypogeous fungi
over five years in western Oregon.
Species
Grams/ha/yr
high low mean
Genabea cerebriformis 21 1 7
Tuber gibbosum 380 2 152
Hysterangium crassum 1206 517 820
Gautieria monticola 1527 13 569
Hymenogaster parksii 435 76 239
Truncocolumella citrina 2336 4 515

81
Table 11.6. Hypogeous sporocarp production in some coniferous
forests.
Single sample Annual
maximum production
kg/ha kg/ha/yr1
9.6
10.1
1.4
1.7
17.5
4.6
142.0
43.9
24.0
35.4
Forest
type Reference
Douglas-fir
Douglas-fir
Douglas-fir
Douglas-fir
Douglas-fir
Fogel 1976
Fogel and Hunt 1979
Luoma (unpubl. 1984)
Hunt (unpubl. 1983)
This study
Grand fir Terwilliger 1985
380.0 Pacific Silver fir Vogt et al. 1981
22.0 Ponderosa pine States 1985
1Calculated by summing monthly kg/ha.

82
Table 11.7. Peak standing crops of sporocarps
produced by hypogeous and epigeous
mycorrhizal species in a western
Oregon Douglas-fir stand.
Year
Hypogeous Epigeous
kg/ha month kg/ha month
1 17.5 Oct. 9.0 Nov.
2 6.1 July 8.7 Oct.
3 3.2 July 19.6 Oct.

83
Table 11.8 Comparison of annual epigeous and hypogeous sporocarp
production in two stands of Douglas-fir in western Oregon.
Epigeous Hypogeous
weight (kg/ha/yr) percent weight
Year total mycorrhizal mycorrhizal (kg/ha/yr) Reference
1 21.4 15.3 71.1 35.4 This study
2 23.4 18.7 79.7 22.0 This study
1 42.6 31.4 73.7 21.1 Fogel and Hunt 1983
2 45.4 43.7 96.3 6.2 Fogel and Hunt 1983

84
Table 11.9. Comparison of spring and fall production of hypogeous
sporocarps in western Oregon.
Year
Springl Fall
Reference
Number2
no./ha
weight2
kg/ha
Number
no./ha
weight
kg/ha
1972 153,600 23.35 21,200 13.18 Fogel 1976
1973 83,400 17.36 19,200 8.98 Fogel 1976
1974 105,200 14.75 13,800 5.83 Fogel 1976
1976 36,100 17.14 Fogel and Hunt 1979
1977 12,700 3.37 4,600 2.72 Fogel and Hunt 1979
1978 1,300 0.34 Fogel and Hunt 1979
1980 30,412 24.98 This study
1981 31,662 10.40 3,958 1.14 This study
1982 38,953 7.45 6,457 3.26 This study
1Spring includes March-June. Fall includes September-December.
2Values are sums of monthly production per hectare
85
REFERENCES
Benedict, R. G. and Stuntz, D. E. 1975. Mushroom odors. Pacific
Search, pp. 42-43.
Bormann, F. H. and Likens, G. E.. 1979. Pattern and process in a
forested ecosystem. Springer-Verlag, New York. 253 pp.
Bowen, G. D. 1980. Mycorrhizal roles in tropical plants and
ecosystems. In Mikola, P., (Ed.), Tropical MycorrhizaResearch. Oxford Univ. Press, Oxford, pp. 165-190.
Bowen, G. D. and Theodorou, C. 1973. Growth of ectomycorrhizal
fungi around seeds and roots. In Marks, G. C., andKozlowski, T. T., (Eds.), EctomTorrhizae-their ecology andphysiology. Academic Press, N. Y., pp. 107-150.
Claus, R., Hoppen, H. O. and Karg, H. 1981. The secret of
truffles: A steroidal pheromone Experientia 37:1178-1179.
Cole, D. W. 1981. Nitrogen uptake and translocation by forest
ecosystems. Ecol. Bull. 33:219-232.
Cooke, W. B. 1948. A survey of the literature on fungus sociologyand ecology, I. Ecology, 29:376-382.
Cooke, W. B. 1953. A survey of the literature on fungus sociologyand ecology, II. Ecology, 34:211-222.
Cromack, K., Sollins, P., Gaustein, W., Sperdel, C. K., Todd, A. W.,Spycher, G., Li, C. Y. and Todd, R. L. 1979. Calcium
oxalate accumulation and soil weathering in mats of thehypogeous fungus Hysterangium crassum. Soil Biol. Biochem.
11:463-468.
Endo, M. 1972. Plant sociological observations on the terrestrial
larger fungi in an evergreen broad-leaved forest, (inJapanese). Japan J. Ecol. 22:51-61.
Fogel, R. 1976. Ecological studies of hypogeous fungi. II.Sporocarp phenology in a western Oregon Douglas fir stand.Can. J. Bot. 54:1152-1162.
Fogel, R. 1979. The genus Leucophleps (Basidiomycotina,Leucogastrales). Can. J. Bof. 57:1718-1728.
Fogel, R. 1981. Quantification of sporocarps produced by hypogeousfungi. In Wicklow, D. T. and Carroll, G. C., (Eds.), TheFungal Community, its Organization and Role in theEcosystem. Marcel Dekker, N. Y. pp. 553-567.

86
Fogel, R. and Hunt, G. 1979. Fungal and arboreal biomass in awestern Oregon Douglas-fir ecosystem: distribution patterns andturnover. Can. J. For. Res. 9:245-256.
Fogel, R. and Hunt, G. 1983. Contribution of mycorrhizae and soil
fungi to nutrient cycling in a Douglas-fir ecosystem. Can. J.
For. Res. 13:219-232.
Fogel, R. and Trappe, J. M. 1978. Fungus consumption (mycophagy)by small mammals. Northwest Sci. 52:1-31.
Fries, N. 1983. Basidiospore germination in species ofBoletaceae. Mycotaxon 18:345-354.
Fries, N. and Birraux, D. 1980. Spore germination in Hebeloma
simulated by living plant roots. Experientia 36:1056-1057.
Gardner, J. H. and Malzjczuk, N. 1985. Succession of
ectomycorrhizal fungi associated with eucalyptus onrehabilitated bauxite mines in south western Australia. In
Molina, R., (Ed.), Proceedings of the 6th North AmericanConference on Mycorrhizae. Forest Research Laboratory,Corvallis, OR. p. 265.
Grime, J. P. 1979. Plant strategies and vegetation processes.John Wiley and Sons, New York, 222 p.
Handley, W. R. C. 1963. Mycorrhizal associations and Callunaheathland afforestation. Bull. For. Comm. Lond. no A, /0 pp.
Handley, W. R. C. and Sanders, C. J. 1962. The concentration ofeasily soluble reducing substances in roots and the formation ofectotrophic mycorrhizal associations--a re-examination ofBjorkman's hypothesis. Plant and Soil 16:42-61.
Hatch, A. B. 1937. The physical basis of mycotrophy in Pinus. The
Black Rock Forest Bull. No. 6, 168 pp.
Hering, T. F. 1966. The tericolous higher fungi of four Lake
District woodlands. Trans. Brit. Mycol. Soc. 49:369-383.
Janos, D.P. 1985. Mycorrhizal fungi: Agents or symptoms of
tropical community composition In Molina, R., (Ed.),Proceedings of the 6th North AmeriFan Conference onMycorrhizae. Forest Research Laboratory, Corvallis, OR. p.98-103.
Janson, S. and Vegelius, J. 1981. Measures of ecological
associations. Oceologia 49:371-376.

87
Karizumi, N. 1968. Estimation of root biomass in forests bysoil block sampling. In Ghilarov, M. S., Kovda, V. A.,Novichova-Ivanova, L. NT, Rodin, L. E. and Sveshnikova, V. M.(Eds.), Methods of Productivity Studies in Root Systems andRhizosphere Organisms. Navka, Leningrad, pp. 79-86.
Knezevich, C. A. 1975. Soil survey of Benton County area, Oregon.U. S. Dept. Agric., Soil Conserv. Serv., U. S. Gov. Print. Off.,Washington, D.C.
Kotter, M. M. and Farentinos, R. C. 1984. Formation of Ponderosa
pine ectomycorrhizae after inoculation with feces oftassel-eared squirrels. Mycotaxon 7(4):758-760.
Kramer, P. J. and Kozlowski, T. T. 1979. Physiology of woody
plants. Academic Press, New York. 811 p.
Krueger, K. W. and Trappe, J. M. 1967. Food reserves and seasonal
growth of Douglas-fir seedlings. Forest Science 13:192-202.
Lamb, R. J. and Richards, B. N. 1974. Survival potential of sexual
and asexual spores of ectomycorrhizal fungi. Brit. Mycol. Soc.Trans. 62:181-191.
Lange, M. 1948. The agrics of Maglemose. Danske Bot. Ark.13:1-141.
Maas, J. L. and Stuntz, D. E. 1970. Mycoecology on serpentine
soil. Mycologia 61:1106-1116.
Marin, A. B., Libbey, L. M. and Morgan, M. E. 1984. Truffles: on
the scent of buried treasure. Mcllvainea 6:34-38.
Maser, C., Trappe, J. M. and Nussbaum, R. A. 1978a. Fungal-small
mammal interrelationships with emphasis on Oregon coniferousforests. Ecology 59:799-809.
Maser, C., Trappe, J. M. and Ure, D. C. 1978b. Implications of
small mammal mycophagy to the management of western coniferousforests. 43rd North American Wildlife and Natural ResourcesConference, Wildlife Management Institute, Washington, D.C; pp.78-88.
Maser, Z., Maser, C. and Trappe, J. M. In Press. Food habits of
the northern flying squirrel (Glaucomys sabrinus) in Oregon.
Mason, P. A., Wilson, J., Last, F. T. and Walker, C. 1983. The
concept of succession in relation to the spread of sheathingmycorrhizal fungi in inoculated tree seedlings growing inunsterile soil. Plant and Soil, 71:247-256.

88
McIntire, P. W. 1984. Fungus consumption by the siskiyou chipmunkwithin a variously treated forest. Ecology, 65:137-146.
Miller, L. 1985. Rodent pellets as ectomycorrhizal inoculum fortwo Tuber spp. In Molina, R., (Ed.), Proceedings of the 6thNorth American Conference on Mycorrhizae. Forest ResearchLaboratory, Corvallis, OR. p. 273.
Miller, O. K., Jr. 1983. Ectomycorrhizae in the Agaricales andGasteromycetes. Can. J. Bot. 61:909-916.
Molina, R. 1981. Ectomycorrhizal specificity in the genus Alnus.Can. J. Bot. 59:325-334.
Mueller-Dombois, D. and Ellenberg, H. 1974. Aims and methods ofvegetation ecology. Wiley, New York, 547 p.
Odum, E. P. 1969. The stategy of ecosystem development. Science164:262-270.
Perry, D. S. 1985. Mycorrhizae in temperate communities:Maxwell's ecological demon. In Molina, R., (Ed.), Proceedingsof the 6th North American Conference on Mycorrhizae. ForestResearch Laboratory, Corvallis, OR. pp. 104-106.
Persson, H. 1978. Root dynamics in a young Scots pine stand incentral Sweden. Oikos 30:508-519.
Persson, H. 1980. Spatial distribution of fine-root growth,mortality and decomposition in a young Scots pine stand incentral Sweden. Oikos 34:77-87.
Pilz, D. P. and Perry, D. A. 1984. Impact of clearcutting and
slash-burning on ectomycorrhizal associations of Douglas-firseedlings. Can. J. For. Res. 14:94-100.
Raven, P. H., Evert, R. F., and Curtis, H. 1981. Biology of
plants, third edition. Worth Publishers, Inc., New York. 686 p.
Richardson, M. J. 1970. Studies on Russula emetica and otheragarics in a Scotts pine plantation. Trans. rit. Mycol. Soc.55:217-229.
Rose, S. L., Perry, D. A., Pilz, D. and Shoenberger, M. M. 1983.Allelopathic effects of litter on growth and colonization ofmycorrhizal fungi. J. Chem. Ecol. 9:1153-1162.
Sanders, S. D. 1984. Mycophagy by Douglas tree squirrels:nutrients in truffles and mushrooms. Annual meeting of theAmerican Society of Mammalogists, (abstract) 64:56.

89
Savile, D. B. O. 1968. Possible interrelationships between fungalgroups. In Ainsworth, A. G. and Sussman, A. S., (Eds.), TheFungal PoRation. Academic Press, pp. 649-675.
Schoenberger, M. M. and Perry, D. A. 1982. The effect of soildisturbance on growth and ectomycorrhizae of Douglas-fir andwestern hemlock seedlings: A greenhouse bioassay. Can. J. For.Res. 12:343-353.
States, J. S. 1983. New Records of hypogeous ascomycetes inArizona. Mycotaxon 16:396-402.
States, J. S. 1984. New records of false truffles in pine forestsof Arizona. Mycotaxon 19:351-367.
States, J. S. 1985. Hypogeous mycorrhizal fungi associated withPonderosa pine: sporocarp phenology. In Molina, R., (Ed.),Proceedings of the 6th North American Conference onMycorrhizae. Forest Research Laboratory, Corvallis, OR. p. 271.
Sussman, A. S. and Halvorson, H. O. 1966. Spores: their dormancyand germination. Harper and Row, New York, 354 p.
Terwilliger, Lori. 1985. Hypogeous fungal diet of the red-tailedchipmunk (Eutamias ruficaudus). Master's thesis. WashingtonState University, Dept. of Zoology, 46 pp.
Trappe, J. M. 1962a. Fungus associates of ectotrophic mycorrhizae.Bot. Rev. 28:538-606.
Trappe, J. M. 1962b. Cenococcum graniforme--its distribution,ecology, mycorrhiza formation, and inherent variation. Ph.D.
Thesis, University of Washington.
Trappe, J. M. 1976. Notes on Japanese hypogeous ascomycetes.Trans. Mycol. Soc. Japan 17:209-217.
Trappe, J. M. 1977. Selection of fungi for ectomycorrhizalinoculation in nurseries. Ann. Rev. Phytopathol. 15:203-222.
Trappe, J. M. and Maser, C. 1977. Ectomycorrhizal fungi:interactions of mushrooms and truffles with beasts and trees.In Walters, T. (Ed.), Mushrooms and Man: An InterdisciplinaryXiTproach to Mycology. Linn Benton Community College. Albany,OR, pp. 165-178.
Ure, D. C. and Maser, C. 1982. Mycophagy of red-backed voles inOregon and Washington. Can. J. Zool. 60:3307-3315.

90
Vogt, K. A., Edmonds, R. L. and Grier, C. C. 1981. Biomass andnutrient concentrations of sporocarps produced by mycorrhizaland decomposer fungi in Abies amabilis stands. Oceologia50:170-175.
Vogt, K. A., Moore, E. E., Vogt, D. J., Redlin, M. J. and Edmonds R.L. 1983. Conifer fine root and mycorrhizal root biomass withinthe forest floors of Douglas-fir stands of different ages andsite productivities. Can. J. For. Res. 13:429-437.

91
SUMMARY AND CONCLUSIONS
Hyphal length is easier to measure than hyphal biomass, but the
latter best expresses the amount of fungal mass in soil because
measures of diameter and thus volume are included. Hyphal volume
should be calculated from each fragment separately, rather than by
use of a mean diameter of all hyphae, to avoid underestimates of
mycelial mass.
Hyphal biomass fluctuated greatly during the study, but was
higher in fall and spring than in summer and winter. Hyphal biomass
in litter ranged from 5.19 to 23.17 mg g1
and from 0.35 to
1.5 mg g-1 in soil. High within-sample variation made significant
differences between means in hyphal biomass difficult to
demonstrate. Significantly lower mycelial mass in summer apparently
results from seasonal drought conditions. Weight of mycelium in the
soil profile to a depth of 100 cm shifted significantly with season
and was highest in fall and lowest in summer.
Melanized hyphae composed more than 50 percent of total hyphal
weight throughout most of the study. This may indicate that
pigmentation is an adaptive advantage for surviving the droughty
season. Also, melanized hyphae probably decompose more slowly than
hyaline hyphae.
Multiple regression analyses, with independent variables derived
from temperature, moisture, and litterfall data produced no adequate

92
predictive equations for monthly hyphal biomass.
The large mycelial mass in soils of coniferous forests
constitutes a rapidly cycling pool of nutrients which contributes to
ecosystem stability by immobilizing nutrients and thus reducing
leaching from the root zone.
Gathering data for establishing the contribution of higher fungi
to forest ecosystems is difficult compared to study of aboveground
forest components. The community of higher fungi consists of
species groups distributed nonrandomly and separated spatially and
temporally within many microhabitats in the general environment.
Moreover, individuals cannot be delimited by vegetative structures
so collection of sporocarps is the only means by which populations
can be studied. Documenting all species of hypogeous fungi in a
forest stand requires collecting over a long period. New species
were recorded during the final four months of our study. Erratic
fruiting and patchy distribution of sporocarps indicate that
hypogeous fungi respond to microhabitat conditions within the
seemingly uniform general environment of the forest. Because of
difficulty in sampling, identification of sporocarps, and time
required, few quantitative or taxonomic studies of hypogeous fungi
have been conducted.
Nine ascomycete and 21 basidiomycete species were recorded over
32 months of sporocarp collecting. Production was dominated by
relatively small number of species. Species accounting for 5
percent or more of annual sporocarp number or dry weight were
Gautieria monticola, Hysterangium crassum, H. separabile, H. sp.
nov., Melanogaster ambiguus, Rhizopogon villosulus, and
Truncocolumella citrina.

93
Estimates of monthly hypogeous sporocarp standing crop ranged
from 0.15 to 17.51 kg ha-1
and estimates of annual production were
22.0 and 35.4 kg ha-1
yr-1
(calculated as a sum of monthly
production).
In contrast to epigeous sporocarps, biomass and number of
hypogeous sporocarps showed no well defined seasonal peaks, and was
more uniform throughout the year. Monthly standing crops of both
hypogeous and epigeous sporocarps decreased in winter. Fruiting
period of some hypogeous species is strictly seasonal (e.g., Barssia
oregonensis in spring and Truncocolumella citrina in fall) while a
few are capable of fruiting year-around (e.g., Hysterangium
crassum). Ability to fruit during any month may partly result from
nutrients and energy stored in rhizomorph mats produced by these
species. The middate of fruiting for all ascomycete species
compared to basidiomycetes did not differ significantly. Data for
six years show that biomass and number of hypogeous sporocarp were
higher in spring than in fall, but spring and fall means did not
differ significantly (P >0.05).
Data on species and production of hypogeous sporocarps are
useful in developing important principles in community ecology.
Examples include determining fungal species richness, making
inferences about the occurrence of specific ectomycorrhizal
host-fungus associations, relating sporocarp production to
environmental factors, determining successional patterns of
ectomycorrhizal fungi, and establishing the potential food resource
for mycophagists.

94
BIBLIOGRAPHY
Baath, E. and Soderstrom, B. E. 1979a. Fungal biomass and fungalimmobilization of plant nutrients in Swedish coniferous forestsoils. Revue d'Ecologie et de Biologie du Sol, 16:477-489.
Baath, E. and Soderstrom, B. E. 1979b. The significance of hyphaldiameter in calculation of fungal biovolume. Oikos, 33:11-14.
Benedict, R. G. and Stuntz, D. E. 1975. Mushroom odors. PacificSearch, pp. 42-43.
Bissett, J. and Parkinson, D. 1979a. Fungal community structure insome alpine soils. Canadian Journal of Botany, 57:1630-1641.
Bissett, J. and Parkinson, D. 1979b. Functional relationshipsbetween soil fungi and environment in alpine tundra. CanadianJournal of Botany, 51:1642-1659.
Bloomfield, B. J. and Alexander, M. 1967. Melanins and resistanceof fungi to lysis. Journal of Bacteriology, 93:1276-1280.
Boois, H. M. de. 1976. Fungal development on oak leaf litter anddecomposition potentialities of some fungal species. Revued'Ecologie et du Biologie du Sol, 13:437-499.
Bormann, F. H. and Likens, G. E.. 1979. Pattern and process in aforested ecosystem. Springer-Verlag, New York. 253 pp.
Bowen, G. D. 1980. Mycorrhizal roles in tropical plants andecosystems. In Mikola, P., (Ed.), Tropical MycorrhizaResearch. Oxford Univ. Press, Oxford, pp. 165-190.
Bowen, G. D. and Theodorou, C. 1973. Growth of ectomycorrhizalfungi around seeds and roots. In Marks, G. C., and Kozlowski,T. T., (Eds.), Ectomycorrhizae-Tfieir ecology and physiology.Academic Press, N. Y., pp. 107-150.
Burges, A. and Nicholas, D. P. 1961. The use of soil sections in
studying the amount of fungal hyphae in soil. Soil Science,92:25-29.
Ceruti, A., Montacchini, F. and Duployez, C. 1967. Ecologia dei
funghi upogei dell' "Arboretum Taurinense". Allionia 13:89-105.
Claus, R., Hoppen, H. O. and Karg, H. 1981. The secret oftruffles: A steroidal pheromone Experientia 37:1178-1179.
Cochrane, V. W. 1958. Phisology of fungi. Wiley, New York.

95
Cole, D. W. 1981. Nitrogen uptake and translocation by forestecosystems. Ecol. Bull. 33:219-232.
Cooke, W. B. 1948. A survey of the literature on fungus sociologyand ecology, I. Ecology, 29:376-382.
Cooke, W. B. 1953. A survey of the literature on fungus sociologyand ecology, II. Ecology, 34:211-222.
Cromack, K., Sollins, P., Gaustein, W., Sperdel, C. K., Todd, A. W.,Spycher, G., Li, C. Y. and Todd, R. L. 1979. Calcium oxalateaccumulation and soil weathering in mats of the hypogeous fungusHysterangium crassum. Soil Biol. Biochem. 11:463-468.
Dickinson, C. H. and Pugh, G. J. F. (Eds.), 1974. Biology of plant
litter decompostion. Academic Press, New York, 175 p.
Dowding, P. and Widden, P. 1974. Some relationships between fungi
and their environment in tundra regions. In Holding, A. J.,Heal, O. W., Maclean S. F., Jr. and FlanagT, P. W., (Eds.),Soil Organisms and Decomposition in Tundra, pp. 123-150.Tundra Biome Steering Committee, Stockholm, Sweden.
Endo, M. 1972. Plant sociological observations on the terrestrial
larger fungi in an evergreen broad-leaved forest, (inJapanese). Japan J. Ecol. 22:51-61.
Flanagan, P. W. and Van Cleve, K. 1977. Microbial biomass,
respiration and nutrient cycling in a black spruce taigaecosystem. In Lohm, U. and Persson, T. (Eds.), Soil Organismsas Componentiof Ecosystems. Ecological Bulletin, 25:261-273.
Fogel, R. 1976. Ecological studies of hypogeous fungi. II.Sporocarp phenology in a western Oregon Douglas fir stand. Can.
J. Bot. 54:1152-1162.
Fogel, R. 1979. The genus Leucophleps (Basidiomycotina,Leucogastrales). Can. J. Bot. 57:1718-1728.
Fogel, R. 1981. Quantification of sporocarps produced by hypogeousfungi. In Wicklow, D. T. and Carroll, G. C., (Eds.), The FungalCommunity, its Organization and Role in the Ecosystem. Marcel
Dekker, N. Y. pp. 553-567.
Fogel, R. and Hunt G. 1979. Fungal and arboreal biomass in aWestern Oregon Douglas-fir ecosystem: distribution patterns andturnover. Canadian Journal of Forest Research, 9:245-256.
Fogel, R. and Hunt, G. 1983. Contribution of mycorrhizae and soilfungi to nutrient cycling in a Douglas-fir ecosystem. CanadianJournal of Forest Research, 13:219-232.

96
Fogel, R. and Hunt, G. 1979. Fungal and arboreal biomass in awestern Oregon Douglas-fir ecosystem: distribution patterns andturnover. Can. J. For. Res. 9:245-256.
Fogel, R. and Hunt, G. 1983. Contribution of mycorrhizae and soilfungi to nutrient cycling in a Douglas-fir ecosystem. Can. J.
For. Res. 13:219-232.
Fogel, R. and Trappe, J. M. 1978. Fungus consumption (mycophagy)by small mammals. Northwest Sci. 52:1-31.
Frankland, J. C. 1974. Importance of phase-contrast microscopy forestimation of total fungal biomass by the agar-film technique.Soil Biology and Biochemistry, 6:409-410.
Frankland, J. C. 1975. Estimation of live fungal biomass. Soil
Biology and Biochemistry, 7:339-340.
Fries, N. 1981. Recognition reactions between basidiospores andhyphae in Leccinum. Trans. Br. Mycol. Soc. 77:9-14.
Fries, N. 1983. Bisidiospore germination in species ofBoletaceae. Mycotaxon 18:345-354.
Fries, N. and Birraux, D. 1980. Spore germination in Hebelomasimulated by living plant roots. Experientia 36:1056-1057.
Gadgil, R. L. and Gadgil, P. D. 1975. Suppression of litter
decomposition by mycorrhizal roots of Pinus radiata. NewZealand Journal of Forestry Science 5:33-41.
Gardner, J. H. and Malzjczuk, N. 1985. Succession ofectomycorrhizal fungi associated with eucalyptus onrehabilitated bauxite mines in south western Australia. In
Molina, R., (Ed.), Proceedings of the 6th North AmericanConference on Mycorrhizae. Forest Research Laboratory,Corvallis, OR. p. 265.
Grier, C. C., Vogt, K. A., Keyes, M. R. and Edmonds, R. L. 1981.
Biomass distribution and above-and below-ground production inyoung and mature Abies amabilis zone ecosystems of theWashington Cascades. Can. J. For. Res. 11:155-167.
Grime, J. P. 1979. Plant strategies and vegetation processes.John Wiley and Sons, New York, 222 p.
Gross, G. 1969. Einiges uber die hypogaenuche. Z. Pilzkunde35:13-20.
Handley, W. R. C. 1963. Mycorrhizal associations and Callunaheathiand afforestation. Bull. For. Comm. Lond. no 36, 70 pp.

97
Handley, W. R. C. and Sanders, C. J. 1962. The concentration of
easily soluble reducing substances in roots and the formation ofectotrophic mycorrhizal associations--a re-examination ofBjorkman's hypothesis. Plant and Soil 16:42-61.
Harley, J. L. and Smith, S. E. 1983. Mycorrhizal symbiosis.
Academic Press, New York, 496 pp.
Hatch, A. B. 1937. The physical basis of mycotrophy in Pinus. The
Black Rock Forest Bull. No. 6, 168 pp.
Hering, T. F. 1966. The tericolous higher fungi of four Lake
District woodlands. Trans. Brit. Mycol. Soc. 49:369-383.
Hunt, G. A. and Fogel, R. 1983. Fungal hyphal dynamics in a
western Oregon Douglas-fir stand. Soil Biol. Biochem.15:641-649.
Hurst H. M. and Wagner, G. H. 1969. Decomposition ofC14-labeled wall and cytoplasmic fractions from hyaline andmelanic fungi. Soil Science Society of America Proceedings,33:707-711.
Janos, D.P. 1985. Mycorrhizal fungi: Agents or symptoms of
tropical community composition In Molina, R., (Ed.),
Proceedings of the 6th North AmeriEn Conference onMycorrhizae. Forest Research Laboratory, Corvallis, OR. p.98-103.
Janson, S. and Vegelius, J. 1981. Measures of ecological
associations. Oceologia 49:371-376.
Jones, P. C. T. and Mollison, J. E. 1948. A technique for thequantitative estimation of soil micro-organisms. Journal of
General Microbiology, 2:54-69.
Karizumi, N. 1968. Estimation of root biomass in forests bysoil block sampling. In Ghilarov, M. S., Kovda, V. A.,Novichova-Ivanova, L. AT, Rodin, L. E. and Sveshnikova, V. M.(Eds.), Methods of Productivity Studies in Root Systems andRhizosphere Organisms. Navka, Leningrad, pp. 79-86.
Knezevich, C. A. 1975. Soil survey of Benton County area, Oregon.
U. S. Dept. Agric., Soil Conserv. Serv., U. S. Gov. Print. Off.,Washington, D.C.
Kotter, M. M. and Farentinos, R. C. 1984. Formation of Ponderosapine ectomycorrhizae after inoculation with feces oftassel-eared squirrels. Mycotaxon 7(4):758-760.

98
Kramer, P. J. and Kozlowski, T. T. 1979. Physiology of woody
plants. Academic Press, New York. 811 p.
Krueger, K. W. and Trappe, J. M. 1967. Food reserves and seasonal
growth of Douglas-fir seedlings. Forest Science 13:192-202.
Kuo, M. J. and Alexander M. 1967. Inhibition of the lysis of fungiby melanins. Journal of Bacteriology, 94:624-629.
Lamb, R. J. and Richards, B. N. 1974. Survival potential of sexual
and asexual spores of ectomycorrhizal fungi. Brit. Mycol. Soc.Trans. 62:181-191.
Lange, M. 1948. The agrics of Maglemose. Danske Bot. Ark.13:1-141.
Lange, Morten, 1978. Fungus flora in August, ten yearsobservations in a Danish Beech wood district. Tidsskrift73:21-54.
Laursen, G. A. and Miller, O. K. Jr. 1977. The distribution of
fungal hyphae in arctic soil on the tundra biome site, Barrow,Alaska. In Marshall, J. K. (Ed.), The Belowground Ecosystem: ASynthesis of Plant Associated Processes, pp. 205-214. Range
Science Department, Science Series No. 26, Colorado StateUniversity, Fort Collins.
Maas, J. L. and Stuntz, D. E. 1970. Mycoecology on serpentinesoil. Mycologia 61:1106-1116.
Marin, A. B., Libbey, L. M. and Morgan, M. E. 1984. Truffles: on
the scent of buried treasure. Mcllvainea 6:34-38.
Marks, G. C. and Kozlowski, T. T. 1973. Ectomycorrhizae.Academic Press, New York, 444 p.
Martinez, A. T. and Ramierez, C. 1978. Microfungal biomass and
number of propagules in an andosol. Soil Biology andBiochemistry, 10:529-531.
Marx, D. H. 1972. Biological control of root diseases in foresttree nurseries with emphasis on the role of mycorrhizae. In
Nordin, V. J., (Ed.), XV I.U.F.R.O. Congress Porc., Subj. GroupZ, "Biological Control of Forest Diseases"; pp. 55-65.
Maser, C., Trappe, J. M. and Nussbaum, R. A. 1978a. Fungal-small
mammal interrelationships with emphasis on Oregon coniferousforests. Ecology 59:799-809.

99
Maser, C., Trappe, J. M. and Ure, D. C. 1978b. Implications of
small mammal mycophagy to the management of western coniferousforests. 43rd North American Wildlife and Natural ResourcesConference, Wildlife Management Institute, Washington, D.C; pp.78-88.
Maser, Z., Maser, C. and Trappe, J. M. In Press. Food habits ofthe northern flying squirrel (Glaucomys sabrinus) in Oregon.
Mason, P. A., Wilson, J., Last, F. T. and Walker, C. 1983. The
concept of succession in relation to the spread of sheathingmycorrhizal fungi in inoculated tree seedlings growing inunsterile soil. Plant and Soil, 71:247-256.
McIntire, P. W. 1984. Fungus consumption by the siskiyou chipmunk
within a variously treated forest. Ecology, 65:137-146.
Mexal, J. and Reid, C. P. P. 1973. The growth of selected
mycorrhizal fungi in response to induced water stress. Canadian
Journal of Botany, 51:1579-1588.
Meyer, F. H. 1964. The role of the fungus Cenococcum graniforme(Sow.) Ferd. et Winge in the formation of mor. In Jongerius,
A., (Ed.), Soil Micromorphology pp. 23-31. Else iv Amsterdam.
Mikola, P. 1948. On the physiology and ecology of Cenoccum
Communications
especilly as a mycorrhizal fungus of birch.Communications Instituti Forestalis Fenniae, 36:1-104.
Miller, L. 1985. Rodent pellets as ectomycorrhizal inoculum fortwo Tuber spp. In Molina, R., (Ed.), Proceedings of the 6thNorth American COiference on Mycorrhizae. Forest Research
Laboratory, Corvallis, OR. p. 273.
Miller, O. K., Jr. 1983. Ectomycorrhizae in the Agaricales andGasteromycetes. Can. J. Bot. 61:909-916.
Molina, R. 1981. Ectomycorrhizal specificity in the genus Alnus.Can. J. Bot. 59:325-334.
Montacchini, F. and Caramiello, R. 1968. Ecologia del Tubermagnatum Pico in Piemonte. Allinoia 14:1-29.
Mueller-Dombois, D. and Ellenberg, H. 1974. Aims and methods of
vegetation ecology. Wiley, New York, 547 p.
Nagel-de Boois, H. M. and Jansen, E. 1967. Hyphal activity in mulland mor of an oak forest. In Graff, O. and Satchell, J. E.,(Eds.), Progress in Soil Biology, pp. 27-36. Verlag Friedrich,Braunschweig.

100
Nagel-de Boois, H. M. and Jansen, E. 1971. The growth of fungalmycelium in forest soil layers. Revue d'Ecologie et de Biologiedu Sol, 8:509-520.
Nicholas, D. P. and Parkinson, D. 1967. A comparison of methodsfor assessing the amount of fungal mycelium in soil samples.Pedobiologia, 7:23-41.
Nicholas, D. P., Parkinson D. and Burges, N. A. 1965. Studies of
fungi in a podzol II. Application of the soil sectioningtechnique to the study of amounts of fungal mycelium in thesoil. Journal of Soil Science, 16:258-269.
Odum, E. P. 1969. The stategy of ecosystem development. Science164:262-270.
Parkinson, D., Balasooriya, I. and Winterhalder, K. 1968. Studies
on fungi in a pinewood soil III. Fungal growth and total
microbial activity. Revue d'Ecologie et de Biologie du Sol,4:637-645.
Perry, D. S. 1985. Mycorrhizae in temperate communities:
Maxwell's ecological demon. In Molina, R., (Ed.), Proceedingsof the 6th North American ConTirence on Mycorrhizae. Forest
Research Laboratory, Corvallis, OR. pp. 104-106.
Persson, H. 1978. Root dynamics in a young Scots pine stand incentral Sweden. Oikos 30:508-519.
Persson, H. 1980. Spatial distribution of fine-root growth,mortality and decomposition in a young Scots pine stand incentral Sweden. Oikos 34:77-87.
Pilz, D. P. and Perry, D. A. 1984. Impact of clearcutting and
slash-burning on ectomycorrhizal associations of Douglas-firseedlings. Can. J. For. Res. 14:94-100.
Pugh, G. J. F. 1980. Strategies in fungal ecology. Trans. Br.
Mycol Soc. 75:1-14.
Raven, P. H., Evert, R. F., and Curtis, H. 1981. Biology of
plants, third edition. Worth Publishers, Inc., New York. 686 p.
Richardson, M. J. 1970. Studies on Russula emetica and otheragarics in a Scotts pine plantation Trans. 7TFit. Mycol. Soc.55:217-229.
Robinson, R. K. 1972. The production by roots of Calluna vulgarisof a factor inhibitory to growth of some mycorrfiTETTungi. J.
Ecol 60:219-224.

101
Rose, S. L., Perry, D. A., Pilz, D. and Shoenberger, M. M. 1983.
Allelopathic effects of litter on growth and colonization ofmycorrhizal fungi. J. Chem. Ecol. 9:1153-1162.
Saito, T. 1955. The significance of plate counts of soil fungi andthe detection of their mycelia. Ecological Review, 14:69-74.
Sanders, F. E., Mosse, B. and P. B. Tinker. 1975.
Endomycorrhizas. Academic Press, New York. 626 p.
Sanders, S. D. 1984. Mycophagy by Douglas tree squirrels:nutrients in truffles and mushrooms. Annual meeting of the
American Society of Mammalogists, (abstract) 64:56.
Savile, D. B. O. 1968. Possible interrelationships between fungalgroups. In Ainsworth, A. G. and Sussman, A. S., (Eds.), TheFungal PolaTlation. Academic Press, pp. 649-675.
Schoenberger, M. M. and Perry, D. A. 1982. The effect of soil
disturbance on growth and ectomycorrhizae of Douglas-fir andwestern hemlock seedlings: A greenhouse bioassay. Can. J. For.
Res. 12:343-353.
Seifert, R. P. 1981. Applications of a mycological data base to
principles and concepts of population and community ecology. In
Wicklow, D. T. and Carroll, G. C. (Eds.), The Fungal Community,Its Organization and Role in the Ecosystem. Marcel Dekker, NewYork, pp. 11-23.
Setchell, W. A. and Watson, M. G. 1926. Some ecological
relationships of the hypogeous fungi. Science 63:313-315.
Soderstrom, B. E. 1975. Vertical distribution of microfungi in a
spruce forest soil in the South of Sweden. Transactions of the
British Mycological Society, 65:419-425.
Soderstrom, B. E. 1979. Some problems in assessing the fluoresceindiacetate-active fungal biomass in the soil. Soil Biology and
Biochemistry, 11:147-148.
States, J. S. 1981. Useful criteria in the description of fungalcommunities. In Wicklow, D. T. and Carroll, G. C. (Eds.), TheFungal Community, Its Organization and role in the Ecosystem.Marcel Dekker, New York, pp. 185-199.
States, J. S. 1983. New Records of hypogeous ascomycetes inArizona. Mycotaxon 16:396-402.
States, J. S. 1984. New records of false truffles in pine forestsof Arizona. Mycotaxon 19:351-367.

102
States, J. S. 1985. Hypogeous mycorrhizal fungi associated withPonderosa pine: sporocarp phenology. In Molina, R., (Ed.),Proceedings of the 6th North American Conference onMycorrhizae. Forest Research Laboratory, Corvallis, OR. p. 271.
Steel, R. G. D. and Torrie, J. H. 1960. Principles and Proceduresof Statistics. McGraw-HIll, New York.
Sussman, A. S. and Halvorson, H. O. 1966. Spores: their dormancyand germination. Harper and Row, New York, 354 p.
Terwilliger, Lori. 1985. Hypogeous fungal diet of the red-tailed
chipmunk (Eutamias ruficaudus). Master's thesis. WashingtonState University, Dept. of Zoology, 46 pp.
Thomas, A., Nicholas, D. P. and Parkinson, D. 1965. Modificationsof the agar film technique for assaying lengths of mycelium insoil. Nature, 205:105.
Trappe, J. M. 1962a. Fungus associates of ectotrophic mycorrhizae.Bot. Rev. 28:538-606.
Trappe, J. M. 1962b. Cenococcum graniforme--its distribution,ecology, mycorrhiza formation, and inherent variation. Ph.D.
Thesis, University of Washington.
Trappe, J. M. 1964. Mycorrhizal hosts and distribution of
Cenococcum graniforme. Lloydia, 27:100-106.
Trappe, J. M. 1971. Mycorrhiza-forming ascomycetes. In Hacskaylo,
(Ed.), Mycorrhizae. U. S. Dept. of Agriculture Misc. Publ. No.1189, pp. 19-37.
Trappe, J. M. 1976. Notes on Japanese hypogeous ascomycetes.Trans. Mycol. Soc. Japan 17:209-217.
Trappe, J. M. 1977. Selection of fungi for ectomycorrhizalinoculation in nurseries. Ann. Rev. Phytopathol. 15:203-222.
Trappe, J. M. and Fogel, R. D. 1977. Ecosystematic functions of
mycorrhizae. In Marshal, J. K. (Ed.), The BelowgroundEcosystem: A Synthesis of Plant-Associated Processes. Range
Sci. Dept. Sci. Se. No. 26, Colorado St. University, FortCollins, CO, pp. 205-214.
Trappe, J. M. and Maser, C. 1977. Ectomycorrhizal fungi:interactions of mushrooms and truffles with beasts and trees.In Walters, T. (Ed.), Mushrooms and Man: An InterdisciplinaryApproach to Mycology. Linn Benton Community College. Albany,
OR, pp. 165-178.
103
Ure, D. C. and Maser, C. 1982. Mycophagy of red-backed voles inOregon and Washington. Can. J. Zool. 60:3307-3315.
Visser, S. and Parkinson, D. 1975. Fungal succession on aspen
poplar leaf litter. Canadian Jounral of Botany, 53:1640-1651.
Vogt, K. A., Edmonds, R. L. and Grier, C. C. 1981. Biomass and
nutrient concentrations of sporocarps produced by mycorrhizaland decomposer fungi in Abies amabilis stands. Oceologia50:170-175.
Vogt, K. A., Moore, E. E., Vogt, D. J., Redlin, M. J. and Edmonds R.L. 1983. Conifer fine root and mycorrhizal root biomass withinthe forest floors of Douglas-fir stands of different ages andsite productivities. Can. J. For. Res. 13:429-437.
Watling, R. 1978. The distribution of larger fungi in Yorkshire.Naturalist, 103:39-57.
Watling, R. 1981. Relationships between macromycetes and the
development of higher plant communities. In Wicklow, D. T. and
Carroll, G. C. (Eds.), The Fungal Community, Its Organizationand Role in the Ecosystem. Marcel Dekker, New York, pp. 427-458.
Widden, P. and Parkinson, D. 1973. Fungi from Canadian coniferous
forest soils. Canadian Journal of Botany, 51:2275-2290.
Worley, J. F. and Hacskaylo, E. 1959. The effect of available soil
moisture on the mycorrhizal association of Virginia pine.Forest Science, 5:267-268.

APPENDIX

104
APPENDIX
Species list and yearly productivity estimates for hypogeous fungi at Dinner Creek, Oregon
Species Year
Total
sporocarps
Equivalent
no./ha
Mean
dry weight
of sporocarps
g
Equivalent
dry weight
g/ha
Total
Gautieria sp.
1
2
1
2
1
2
1
2
1
2
1
2
1
2
1
2
1
2
1
2
1
2
1
2
1
2
1
2
1
2
508
85
4
4
5
0
3
0
8
3
70
35
62
10
2
0
1
0
93
31
5
1
0
1
247
0
3
0
5
0
4232
850
33
40
42
0
25
0
67
30
583
350
516
100
17
0
8
0
775
258
42
10
0
10
2058
0
25
0
42
0
0.44
0.68
0.24
2.13
0.18
0.00
0.08
0.00
0.62
0.33
0.54
0.97
0.37
0.21
0.75
0.00
1 :::
0.00
0.60
0.37
0.25
0.11
0.00
0.65
0.36
0.00
0:10300
0.98
0.00
18
8
85
7
0
2
0
41
10
316
338
189
21
12
0
12
0
463
116
10
1
0
6
749
0
3
0
41
0
Hymenogaster parksii Zeller 4 Dodge
Hysterangium crassum (Tul. & Tul.) Fisher
Hysterangium separabile Zeller
Leucogaster rubescens Zeller & Dodge
Leucophleps magnata Harkn.
Martellia parksii Sing & Sm.
Melanogaster sp.
Rhizopogon parksii Sm.
Rhizopogon vinicolor Sm.
Rhizopogon sp.
Truncocolumella citrina Zeller
Tuber sp.
Zelleromyces gilkeyae Sing. & Sm.