species richness, abundance, and composition of hypogeous
TRANSCRIPT

Species richness, abundance, and composition ofhypogeous and epigeous ectomycorrhizal fungalsporocarps in young, rotation-age, andold-growth stands of Douglas-fir (Pseudotsugamenziesii) in the Cascade Range of Oregon,U.S.A.
J.E. Smith, R. Molina, M.M.P. Huso, D.L. Luoma, D. McKay, M.A. Castellano,T. Lebel, and Y. Valachovic
Abstract: Knowledge of the community structure of ectomycorrhizal fungi among successional forest age-classesis critical for conserving fungal species diversity. Hypogeous and epigeous sporocarps were collected from threereplicate stands in each of three forest age-classes (young, rotation-age, and old-growth) of Douglas-fir(Pseudotsuga menziesii(Mirb.) Franco) dominated stands with mesic plant association groups. Over four fall andthree spring seasons, 48 hypogeous and 215 epigeous species or species groups were collected from sample areasof 6300 and 43 700 m2, respectively. Cumulative richness of hypogeous and epigeous species was similar amongage-classes but differed between seasons. Thirty-six percent of the species were unique to an age-class: 50 speciesto old-growth, 19 to rotation-age, and 25 to young stands. Seventeen species (eight hypogeous and nine epigeous)accounted for 79% of the total sporocarp biomass; two hypogeous species,Gautieria monticolaHarkn., andHysterangium crassirhachisZeller and Dodge, accounted for 41%. Average sporocarp biomass in young and rota-tion-age stands compared with old-growth stands was about three times greater for hypogeous sporocarps and sixtimes greater for epigeous sporocarps. Average hypogeous sporocarp biomass was about 2.4 times greater inspring compared with fall and for epigeous sporocarps about 146 times greater in fall compared with spring. Re-sults demonstrated differences in ectomycorrhizal fungal sporocarp abundance and species composition amongsuccessional forest age-classes.
Key words: ectomycorrhizal fungi, sporocarp production, forest succession,Pseudotsuga menziesii, Tsuga heterophyllazone, biodiversity.
204Résumé : La connaissance de la structure des communautés de champignons ectomycorhiziens au sein des classesd’âge dans la succession forestière est critique pour la conservation de la diversité des espèces. Les auteurs ontrécolté les sporocarpes hypogés et épigés dans trois répliques de peuplements pour chacune de trois classes d’âge(jeune, âge de rotation et surannée), dominés par le Douglas de Menzies (Pseudotsuga menziesii(Mirb.) Franco),avec des groupes d’associations végétales mésiques. Au cours de quatre automnes et trois printemps, les auteursont récolté 48 espèces hypogées et 215 espèces épigées (ou groupes d’espèces) à partir de places échantillonsayant des superficies de 6300 m2 et 43 700 m2, respectivement. La richesse cumulée en espèces hypogées et épi-gées est semblable au sein des classes d’âge, mais diffère avec les saisons. Trente-six pour cent des espèces sontliées à une classe d’âge : 50 espèces aux forêts surannées, 19 aux forêts en âge de rotation et 25 aux jeunes fo-rêts. Dix-sept espèces (8 hypogées, 9 épigées) constituent 79% de la biomasse totale en sporocarpes; deux espèceshypogées, leGautiera monticolaHarkn. et l’Hysterangium crassirhachisZeller et Dodge, en représentent 41%.Comparativement aux forêts surannées, la biomasse moyenne des sporocarpes dans les peuplements jeunes ou enâge de rotation est environ 3 fois plus grande pour les sporocarpes hypogés et 6 fois plus grande pour les sporo-carpes épigés. La biomasse moyenne des sporocarpes hypogés est environ 2.4 fois plus grande au printemps qu’à
Can. J. Bot.80: 186–204 (2002) DOI: 10.1139/B02-003 © 2002 NRC Canada
186
Received 17 May 2001. Published on the NRC Research Press Web site at http://canjbot.nrc.ca on 28 February 2002.
J.E. Smith,1 R. Molina, D. McKay, and M.A. Castellano. U.S. Department of Agriculture, Forest Service, Pacific NorthwestResearch Station, Forestry Sciences Laboratory, 3200 S.W. Jefferson Way, Corvallis, OR 97331, U.S.A.M.M.P. Huso and D.L. Luoma. Department of Forest Science, Oregon State University, Corvallis, OR 97331, U.S.A.T. Lebel. National Herbarium of Victoria, Royal Botanic Gardens Melbourne, Birdwood Avenue, South Yarra 3141, Victoria, Australia.Y. Valachovic. Agriculture and Natural Resources, University of California, 5630 S. Broadway, Eureka, CA 95503, U.S.A.
1Corresponding author (e-mail: [email protected]).
J:\cjb\cjb80\cjb-02\B02-003.vpMonday, February 25, 2002 9:55:12 AM
Color profile: Generic CMYK printer profileComposite Default screen
l’automne, et pour les sporocarpes épigés, environ 146 fois plus grande à l’automne qu’au printemps. Les résultatsdémontrent qu’il y a des différences dans l’abondance en sporocarpes des champignons ectomycorhiziens et dans lacomposition en espèces, entre les classes d’âges de la succession forestière.
Mots clés: champignons ectomycorhiziens, production de sporocarpes, succession forestière,Pseudotsuga menziesii,zone duTsuga heterophylla, biodiversitée.
[Traduit par la Rédaction] Smith et al.
Introduction
Knowledge about community structure and dynamicsof ectomycorrhizal (EM) fungi in natural environments islimited. Many factors influence EM fungal communitystructure, including host plant species composition andstand age, habitat conditions, and edaphic factors(Molina and Trappe 1982; Deacon et al. 1983; Molina etal. 1992; Vogt et al. 1992; Visser 1995; States and Gaud1997; Gehring et al. 1998; Claridge et al. 2000; Smith etal. 2000). Down wood in various stages of decay influ-ences fungal species occurrence and abundance (Harmonet al. 1994; Smith et al. 2000). Changes in plant speciescomposition from forest succession or large-scale distur-bances significantly affect EM species composition andtotal sporocarp production (Cooke 1955; Dighton andMason 1985; Arnolds 1988, 1991; Termorshuizen 1991;Vogt et al. 1992; Amaranthus et al. 1994; Visser 1995;North et al. 1997; Waters et al. 1997; Baar et al. 1999;Colgan et al. 1999).
EM fungal succession in forest types worldwide typi-cally is measured by repeated observations of sporocarpoccurrence as young stands age and by identifying andquantifying sporocarps in stands of different ages (Deaconet al. 1983; Dighton and Mason 1985; Dighton et al. 1986;Arnolds 1991; Luoma et al. 1991; Termorshuizen 1991;O’Dell et al. 1992; Amaranthus et al. 1994; Clarkson andMills 1994). In the Pacific Northwestern region of NorthAmerica, efforts to characterize EM fungal communitieshave been ongoing for only about the last two decades andhave focused mostly on sporocarps of hypogeous fungi inforests dominated by Douglas-fir (Pseudotsuga menziesii(Mirb.) Franco) (Fogel 1976; Fogel and Hunt 1979; Huntand Trappe 1987; Luoma et al. 1991; Amaranthus et al.1994; Clarkson and Mills 1994; North et al. 1997; Cazareset al. 1999; Colgan et al. 1999) and to a lesser extent bytrue fir (Abiesspp.) (Vogt et al. 1981; Waters et al. 1997).Epigeous sporocarps were recorded in thePinus ponder-osa (Dougl.), Pseudotsuga taxifolia(Mayr.) Shaw, andThuja–Tsugaforest vegetation zones by Cooke (1955), inthe Abies amabilisDougl. ex Forbes zone by Ammirati etal. (1994), and in theTsuga heterophylla(Raf.) Sarg. zoneby O’Dell et al. (1999). Most studies comparing EM fun-gal sporocarp communities among successional forestage-classes have lacked replication of forest age-classes(Vogt et al. 1981; Luoma et al. 1991) or sampling years(O’Dell et al. 1992; Amaranthus et al. 1994; Clarkson andMills 1994). Only a few published studies include bothhypogeous and epigeous EM species richness and abun-dance in successional age-classes of forests (O’Dell et al.1992; North et al. 1997).
Most field data on EM fungal species ecology arebased on occurrence of sporocarps. Sporocarp studies arethe primary bases for understanding ecosystem food webfunctions involving mammals and insects (Maser et al.1978; Ingham and Molina 1991) and for documentingfungal diversity. Sporocarp studies of EM fungal commu-nities typically underrepresent belowground EM fungaldiversity (Gardes and Bruns 1996; Dahlberg et al. 1997;Kårén et al. 1997; Gehring et al. 1998; Jonsson et al.1999; Horton and Bruns 2001) but are essential for dis-cerning rare species that form obvious sporocarps. Cur-rent conservation efforts regarding EM fungi (Arnolds1989; Castellano et al. 1999; Molina et al. 2001) rely oncomparison of current with historic sporocarp data toidentify trends in fungal communities and develop con-servation strategies.
Most studies on EM fungal succession in forest com-munities also have used sporocarp presence and produc-tion to measure changes and reflect dominance. Studiesof old field succession focused on sporocarps observednear parent trees of various ages (Last et al. 1984;Dighton et al. 1986) and explored factors such as soiland tree age responsible for observed patterns (see re-view by Deacon and Fleming 1992). Fungal communitydynamics are less well understood in forest successionwhere vegetation dynamics shape community recovery.For example, the rapid reestablishment of pioneering EMhost plants can maintain late-seral EM fungi (Perry et al.1989; Molina et al. 1992). Many fungi are presentthroughout forest stand development, although theirabundance and dominance may change with time or dis-turbance (Visser 1995; Molina et al. 1999). Comprehen-sive studies of fungal succession are needed in manyforest types to improve understanding of fungal commu-nity dynamics.
Federal land management agencies in the Pacific North-western region of the United States are concerned aboutthe effects of forest management practices on conserva-tion of fungal species, particularly species associated withdiminishing old-growth forests. Plant species richnesstends to remain constant or increase slowly with forestage-class in some physiographic provinces in the region(Spies 1991). In contrast, the response of fungal commu-nities to forest succession is largely unknown. The accu-rate comparison of mycological data in harvested andunharvested forests is essential for determining diversitypatterns of fungi, making science-based decisions regard-ing conservation of fungi (O’Dell et al. 1996; Molina etal. 2001), and developing models for predicting fungalspecies occurrence (Dreisbach et al. 2002).
© 2002 NRC Canada
Smith et al. 187
J:\cjb\cjb80\cjb-02\B02-003.vpMonday, February 25, 2002 9:55:12 AM
Color profile: Generic CMYK printer profileComposite Default screen

Our study was designed to examine changes in speciesrichness, abundance, and composition of both hypogeousand epigeous EM sporocarps among successional forestage-classes of Douglas-fir in mesic stands of theTsugaheterophyllazone. Our primary study objectives were todetermine (i) if EM fungal species richness increases withstand age, (ii ) whether EM fungal species composition anddominance shift as forest stands age, and (iii ) whethersome EM fungal species are closely associated withold-growth stands. Seasonal dichotomy in fruiting patterns,typical of the Pacific Northwest (Fogel 1976; Hunt andTrappe 1987; Luoma 1991; Luoma et al. 1991), influencesinterpretation of species composition and dominance. Con-sequently, we examine seasonal variation in hypogeous andepigeous sporocarp occurrence. We present data concerningthe influence of forest age on fungal sporocarp productionin nine forest stands that range in age from 30 to more than400 years.
Methods
Study areaThe study area was located in and adjacent to the H.J.
Andrews Experimental Forest, 80 km east of Eugene, Ore-gon, in the Willamette National Forest (Lane and Linncounties) along the west slope of the Cascade Range of Or-egon. The climate is maritime with mild, wet winters andwarm, dry summers. Temperatures range from –2°C (meanJanuary minima) to 28°C (mean July maxima). Annual pre-cipitation is about 230 cm, with about 90% falling betweenOctober and April (McKee and Bierlmaier 1987). Wintersnowpacks above 900 m elevation accumulate to a depth of1 m or more and may persist into June; snowpack meltsquickly below 900 m (Franklin and Dyrness 1984;Bierlmaier and McKee 1989). Soils are mainly Inceptisols(Brown and Parsons 1973; Franklin and Dyrness 1984).Parent materials are basalt and andesite (Franklin andDyrness 1984).
Nine stands were subjectively chosen to represent a rangeof age-classes and meet the criteria of study objectives froma list of possible sites suggested by the H.J. Andrews site
manager. The selected stands encompassed a range of mesicplant association groups for theTsuga heterophyllazone(Franklin and Dyrness 1984) and were dominated byDouglas-fir with western hemlock (Tsuga heterophylla) andOregon grape (Berberis nervosaPursh) in the understory.Stand data and plant association groups are presented in Ta-ble 1. Forest communities within theTsuga heterophyllazone are arranged along moisture gradients (Zobel et al.1976). Moist sites are typified by an understory that shows adominance of swordfern (Polystichum munitum(Kaulf.)Presl) and Oregon oxalis (Oxalis oreganaNutt.), mesic sitesby Oregon grape and Pacific rhododendron (RhododendronmacrophyllumG. Don.), and dry sites by salal (GaultheriashallonPursh) and ocean spray (Holodiscus discolor(Pursh)Maxim.) (Franklin and Dyrness 1984). Elevations of ourstands ranged from 430 to 1000 m (Table 1). Slope gradientsranged from 0 to 35°.
The study examined three age-classes: young withclosed canopy (30–35 years), rotation-age (ready for har-vest, 45–50 years), and old-growth (more than 400 years)(Table 1). The most rapid growth period in forest develop-ment is the first 50 years. Thus, even though a relativelysmall number of years separate the age-classes defined asrotation-age and young, differences in stand development,stem density, and tree size are evident (Table 1). Mean an-nual increment is approaching or at its peak in the youngage-class whereas it is steady or declining in the rota-tion-age. The rotation-age stands have reached maturityfrom a forest economic definition (steady or decreasingmean annual increment) but do not meet the ecologicalcriteria of mature stands in age or structure (Spies andFranklin 1991). The young and rotation-age stands areplantations that were previously clearcut, broadcastburned soon afterward, and allowed 2–4 years to regener-ate naturally before being replanted with Douglas-fir. Theold-growth stands were naturally established after cata-strophic wildfire.
Experimental design and sampling proceduresThe study design is a completely randomized design
with three replications (stands) of each of the three treat-
© 2002 NRC Canada
188 Can. J. Bot. Vol. 80, 2002
Site name Age-class* Basal area (m2/ha) Stem density (no./ha) Plant associations† Elevation (m) Aspect
L104 Y 27‡ 688 Tshe/Pomu–Will 550–610 NL201 Y 40 655 Tshe/Bene–Gash–Will 700–820 NWL202 Y 37 615 Tshe/Bene–Gash–Will 760–910 NNWMill Creek 1 RA 40 573 Tshe/Bene–Gash–Will 490–550 SWMill Creek 2 RA 35 527 Tshe/Bene–Gash–Will 730–790 SSEMill Creek 3 RA 36‡ 550‡ Tshe/Bene–Gash–Will 430–490 SWRef. Stand 15 OG 120 391 Tshe/Rhma–Bene–Will 730–820 SSWShorter Creek OG 105 354 Tshe/Libo2 730–850 SUpper Lookout OG 92‡ 332‡ Tshe/Bene–Gash–Will 850–1000 SW
Note: Stand data are from the Blue River Ranger District, Blue River, Oregon, and from the Forest Science databank at Oregon State University,Corvallis, Oreg. Plant associations follow Logan et al. (1987) and Hemstrom et al. (1987) for the Willamette National Forest.
*Y, young (30–35 years); RA, rotation-age (45–50 years); OG, old-growth (more than 400 years).†Tshe,Tsuga heterophylla; Bene,Berberis nervosa; Gash,Gaultheria shallon; Libo2, Linnea borealisL.; Pomu,Polystichum munitum; Rhma,
Rhododendron macrophyllum; Will, Willamette National Forest.‡Data not available. Estimates are from neighboring stands similar in age, elevation, and aspect.
Table 1. Description of stands in and adjacent to the H.J. Andrews Experimental Forest, Oregon.
J:\cjb\cjb80\cjb-02\B02-003.vpMonday, February 25, 2002 9:55:13 AM
Color profile: Generic CMYK printer profileComposite Default screen
ments (young, rotation-age, and old-growth). All standswere sampled for hypogeous and epigeous sporocarpsseven times (fall 1991, spring 1992, fall 1992, spring 1993,fall 1993, spring 1994, and fall 1994). Sampling was termi-nated due to the partial harvest of rotation-age stands in1995. Each measurement period occurred within 3 weeksfor all stands and constituted a “stand sample”. A standsample refers to the total collection area for a given standat a given seasonal harvest in a given year (Luoma et al.1991). Sporocarp sampling coincided with the peak of sea-sonal fruiting as determined from weather reports, reportsof field cooperators, and known sporocarp phenology(Smith 1975; Fogel 1976). Sampling was conducted in bothspring and fall to capture the seasonal dichotomy in fruit-ing patterns. Sporocarp production and diversity vary annu-ally, so stands were sampled over a period of several yearsto detect fluctuations. Volunteers worked in teams led byprofessional mycologists.
For each sample period, hypogeous and epigeous sporocarpswere collected from each of 25 circular plots (4 m2) withineach stand. A sporocarp collection comprised one to severalsporocarps of the same species within about a 20-cm radius ona single circular plot. In each stand, plots were distributedalong three systematically placed transects of eight, nine, andeight plots each (modified from Luoma et al. 1991). Transectswere stratified by upper, middle, and lower slope position.Plots were placed cross-slope at 25-m intervals along eachtransect. Circular plots were raked with hand tools to a depthof at least 5 cm into mineral soil to expose hypogeous sporo-carps. Raking also exposed not yet emergent epigeous sporo-carps, which also were collected. All plots were marked toavoid repeat sampling of the same area in subsequent seasons.Raked substrate was replaced. Hypogeous sporocarps were col-lected from a total area of 6300 m2.
Epigeous sporocarps were also collected from a totalarea of 700 m2 per stand per collecting season from sixstrip plots (2 × 50 m) and from the circular plots (describedabove). Strip plots for epigeous sporocarps were narrow inwidth to avoid trampling in the plot when collections weremade. Three permanent strip plots were randomly placedwithin each stand. Collections from permanent strip plotscomprised one to several epigeous sporocarps of the samespecies from each 1 m2 of the permanent plots. Three tem-porary strip plots were positioned in the upper, middle, andlower slopes of each stand and were placed cross-slope.
Temporary strip plots were stratified by slope position andmoved each sampling season. Temporary strip plots pro-vided increased sample area coverage throughout eachstand. Collections from temporary strip plots comprisedone to several epigeous sporocarps of the same specieswithin about a 20-cm radius from along each temporaryplot. In fall 1994, snow prevented sampling of four stripplots (two temporary and one permanent strip plot in a ro-tation-age stand and one permanent strip plot in a youngstand). Epigeous sporocarps were collected from a totalarea of 43 700 m2.
Specimen identification and processingAt the end of each field day, notes about fresh characters
were recorded and collections identified to the taxonomiclevel possible without the use of a compound microscope.Collections were dried in portable or on-site dehydrators forbetween 12 and 24 h and later weighed in the laboratory tothe nearest 0.01 g.
Further identification of collections, typically to specieslevel, was accomplished in the laboratory. Collections be-longing to genera not adequately monographed for the west-ern United States were placed into species complexes orgroups. Representative voucher collections of each identifiedspecies were accessioned into the Oregon State UniversityHerbarium.
Genera that were problematic because of a lack of re-gional taxonomic materials and abundant fruiting includedCortinarius, Inocybe, and Russula. Fresh collections ofthese genera were placed in broad subgenera or speciesgroups according to Arora (1986). Dried collections ofCortinarius (about 20%) andInocybe(about 10%) were ex-amined with compound microscopy to estimate the numberof species within each group.Cortinarius collections wereidentified by use of Ammirati (1983) andInocybecollec-tions by use of Stuntz (1965), Moser (1983), and Kuyper(1986). Nearly all dried collections ofRussulawere exam-ined with compound microscopy and identified using thekeys of Woo (1993) and Thiers (1994, 1997a, 1997b) (seeSmith and Lebel 2001).
Analysis
β diversity between standsThe Sorenson index, designed to equal 1 in cases of com-
plete similarity and 0 if the sites are dissimilar and have no
© 2002 NRC Canada
Smith et al. 189
Cumulative no. of taxa by age-class
Habit and season No. of taxa Old-growth Rotation-age Young
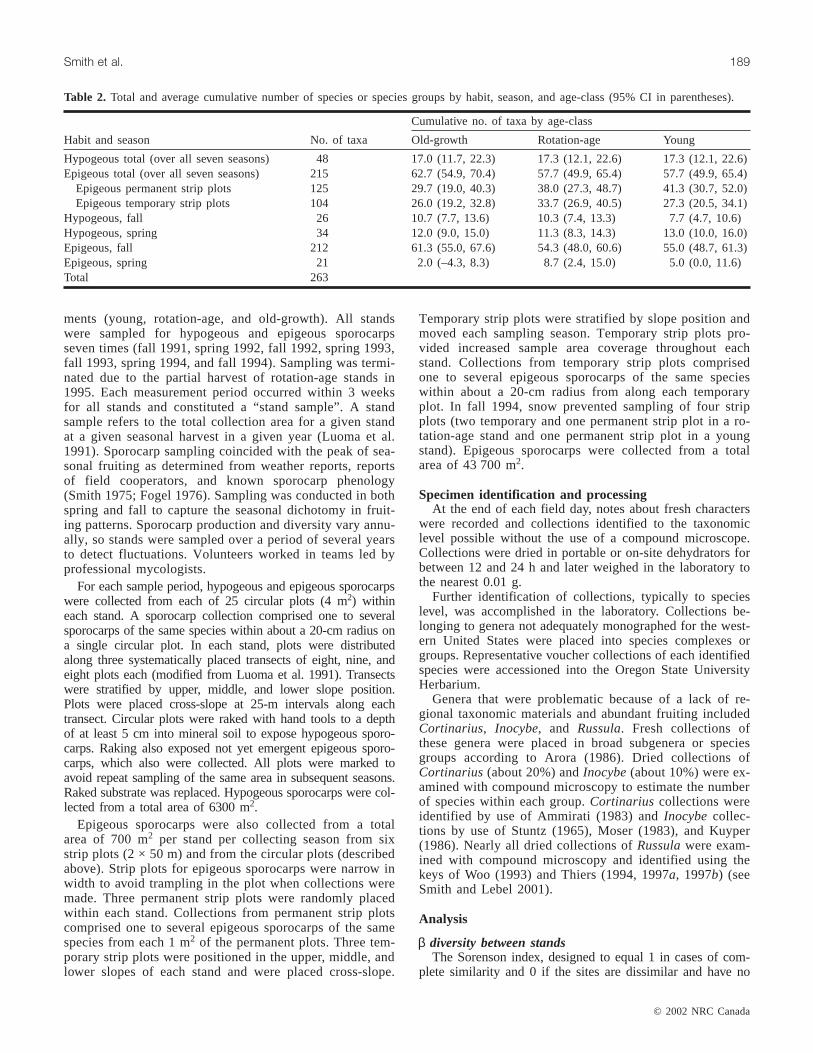
Hypogeous total (over all seven seasons) 48 17.0 (11.7, 22.3) 17.3 (12.1, 22.6) 17.3 (12.1, 22.6)Epigeous total (over all seven seasons) 215 62.7 (54.9, 70.4) 57.7 (49.9, 65.4) 57.7 (49.9, 65.4)
Epigeous permanent strip plots 125 29.7 (19.0, 40.3) 38.0 (27.3, 48.7) 41.3 (30.7, 52.0)Epigeous temporary strip plots 104 26.0 (19.2, 32.8) 33.7 (26.9, 40.5) 27.3 (20.5, 34.1)
Hypogeous, fall 26 10.7 (7.7, 13.6) 10.3 (7.4, 13.3) 7.7 (4.7, 10.6)Hypogeous, spring 34 12.0 (9.0, 15.0) 11.3 (8.3, 14.3) 13.0 (10.0, 16.0)Epigeous, fall 212 61.3 (55.0, 67.6) 54.3 (48.0, 60.6) 55.0 (48.7, 61.3)Epigeous, spring 21 2.0 (–4.3, 8.3) 8.7 (2.4, 15.0) 5.0 (0.0, 11.6)Total 263
Table 2. Total and average cumulative number of species or species groups by habit, season, and age-class (95% CI in parentheses).
J:\cjb\cjb80\cjb-02\B02-003.vpMonday, February 25, 2002 9:55:13 AM
Color profile: Generic CMYK printer profileComposite Default screen
species in common, was used to measureβ diversity(Magurran 1988). Similarity coefficients for species betweenall pairs of stands were assessed to examine the effects of as-pect or environmental conditions compared with stand age.
Total and average cumulative species richnessThe numbers of hypogeous and epigeous species or spe-
cies groups found were tallied separately for the four falland three spring collecting seasons to provide a measure ofthe cumulative seasonal richness in a stand. Because somespecies fruit in both spring and fall, a separate assessmentwas made of the total number of species or species groupsfound on a stand throughout the seven seasons of sampling.
Average cumulative richness was analyzed separately forhypogeous and epigeous fungi in a one-way analysis of vari-ance, with age-class (young, rotation-age, and old-growth) asthe single factor. No transformations of the data were necessaryto meet model assumptions. Analysis was conducted by usingthe SAS v. 7.0 MIXED procedure (SAS Institute Inc. 1996).
Average seasonal cumulative richness was analyzed sepa-rately for hypogeous and epigeous fungi in a weighted (4years for fall and 3 years for spring) two-way analysis ofvariance, with season (fall and spring) and age (young, rota-tion-age, and old-growth) as the two factors. No transforma-tions of the data were necessary to meet model assumptions.Analysis was conducted using the SAS v. 7.0 MIXED proce-dure (SAS Institute Inc. 1996).
Chi-square tests were used to compare numbers of speciesor species groups unique to the different age-classes andfound in more than one stand.
Sporocarp biomass and frequencySporocarp production for each stand sample was calcu-
lated by summing hypogeous and epigeous sporocarp bio-mass for each visit and standardizing the values to kilogramsper hectare for reporting habitat and seasonal results. Themasses of all hypogeous and epigeous sporocarps found infall were averaged over the four fall collecting seasons. Sim-ilarly, the masses of all hypogeous and epigeous sporocarpsfound in spring were averaged over the three spring collect-ing seasons. Average seasonal sporocarp biomass was ana-lyzed separately for hypogeous and epigeous sporocarps in aweighted two-way analysis of variance, with season (fall andspring) and age-class (young, rotation-age, and old-growth)as the two factors. The number of seasons over whichsporocarp production measurements were taken were theweights (4 years for fall and 3 years for spring). Data werelog transformed to stabilize variance. Analysis was con-ducted using the SAS v. 7.0 MIXED procedure (SAS Insti-tute Inc. 1996).
The total sporocarp biomass for a species in a season orage-class category was divided by the appropriate fraction ofa hectare sampled in that category to obtain equivalentsporocarp biomass on a grams dry mass per hectare basis.Relative species importance was measured by sporocarp bio-mass. Following Luoma et al. (1991), dominant species orgenera that are≥5% of the total sporocarp biomass are con-sidered “major” species or genera and those that are≥1% ofthe total are considered “important”.
Frequency of occurrence for the dominant species was de-termined as a percentage of the total number of stand sam-
ples (9 stands × 7 seasons = 63). Similarly, frequency of oc-currence within age-classes was determined as a percentageof the total number of stand samples within an age-class (3stands × 7 seasons = 21).
Results
Species richness
Overall patternsDuring the course of the study, 263 species or species
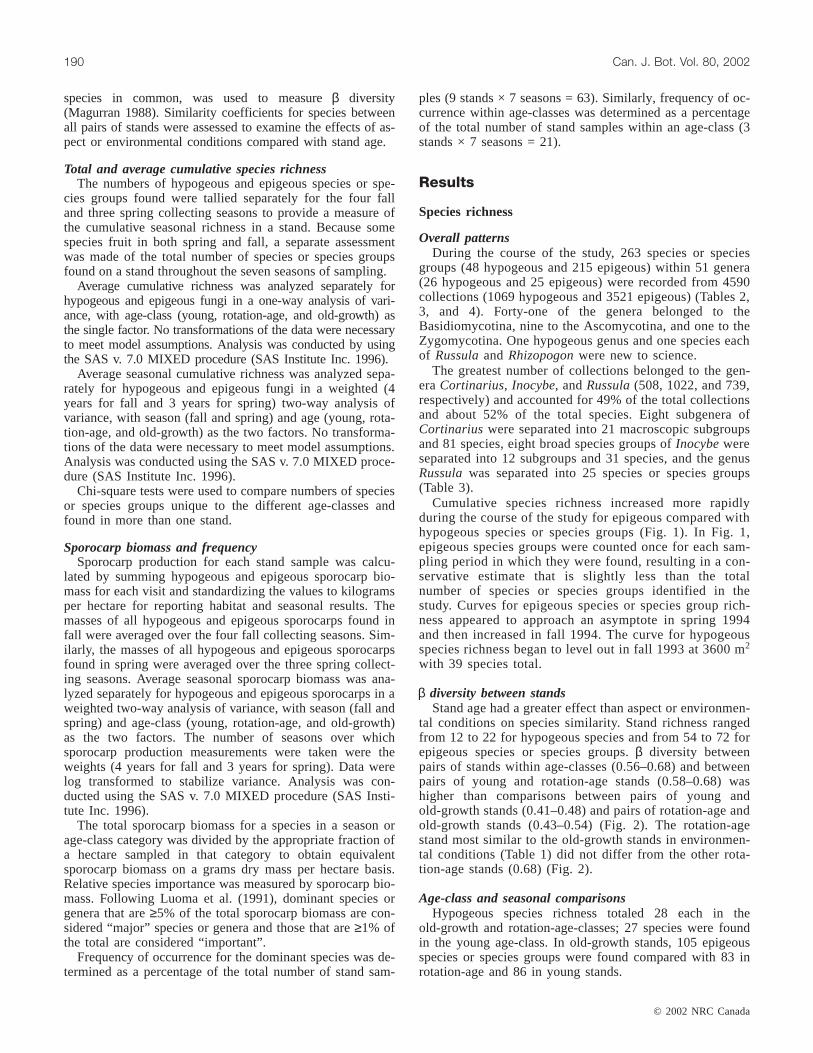
groups (48 hypogeous and 215 epigeous) within 51 genera(26 hypogeous and 25 epigeous) were recorded from 4590collections (1069 hypogeous and 3521 epigeous) (Tables 2,3, and 4). Forty-one of the genera belonged to theBasidiomycotina, nine to the Ascomycotina, and one to theZygomycotina. One hypogeous genus and one species eachof Russulaand Rhizopogonwere new to science.
The greatest number of collections belonged to the gen-eraCortinarius, Inocybe, andRussula(508, 1022, and 739,respectively) and accounted for 49% of the total collectionsand about 52% of the total species. Eight subgenera ofCortinarius were separated into 21 macroscopic subgroupsand 81 species, eight broad species groups ofInocybewereseparated into 12 subgroups and 31 species, and the genusRussulawas separated into 25 species or species groups(Table 3).
Cumulative species richness increased more rapidlyduring the course of the study for epigeous compared withhypogeous species or species groups (Fig. 1). In Fig. 1,epigeous species groups were counted once for each sam-pling period in which they were found, resulting in a con-servative estimate that is slightly less than the totalnumber of species or species groups identified in thestudy. Curves for epigeous species or species group rich-ness appeared to approach an asymptote in spring 1994and then increased in fall 1994. The curve for hypogeousspecies richness began to level out in fall 1993 at 3600 m2
with 39 species total.
β diversity between standsStand age had a greater effect than aspect or environmen-
tal conditions on species similarity. Stand richness rangedfrom 12 to 22 for hypogeous species and from 54 to 72 forepigeous species or species groups.β diversity betweenpairs of stands within age-classes (0.56–0.68) and betweenpairs of young and rotation-age stands (0.58–0.68) washigher than comparisons between pairs of young andold-growth stands (0.41–0.48) and pairs of rotation-age andold-growth stands (0.43–0.54) (Fig. 2). The rotation-agestand most similar to the old-growth stands in environmen-tal conditions (Table 1) did not differ from the other rota-tion-age stands (0.68) (Fig. 2).
Age-class and seasonal comparisonsHypogeous species richness totaled 28 each in the
old-growth and rotation-age-classes; 27 species were foundin the young age-class. In old-growth stands, 105 epigeousspecies or species groups were found compared with 83 inrotation-age and 86 in young stands.
© 2002 NRC Canada
190 Can. J. Bot. Vol. 80, 2002
J:\cjb\cjb80\cjb-02\B02-003.vpMonday, February 25, 2002 9:55:13 AM
Color profile: Generic CMYK printer profileComposite Default screen
© 2002 NRC Canada
Smith et al. 191
Age-class* Season†
Species OG RA Y Fall Spring
Epigeous taxaAmanita aspera + 1‡
Amanita muscaria, yellow + + 2Amanita pantherina + + 1 1Amanita porphyria + 1‡
Amanita silvicola + 1‡
Boletus chrysenterongp. + 1‡
Boletus mirabilis + + 2Boletus piperatus + + 4Boletus subtomentosus + 2Boletus zelleri + + + 1Camarophyllus borealis + 1‡
Cantharellus formosus 2 2 4 4Cantharellus subalbidus 1 2Chroogomphus tomentosus 1 + + 4Clavariadelphus ligula + 2Clavariadelphus mucronatus + 2Clavulina sp. + 1Cortinarius subgp.Bulbopodium(4 species) +§ +§ +§ 3 1
Cortinarius calyptratus + + + 2Cortinarius subgp.Bulbopodium-1 + 1
Cortinarius subgp.Cortinarius: C. violaceus + 2Cortinarius subgp.Dermocybe(5 species) +§ +§ +§ 3
Dermocybe cinnamomeusgp. + 1Dermocybe sanguinea + + + 2Dermocybe semisanguinea + 1‡
Cortinarius subgp.Leprocybe(9 species) +§ +§ +§ 2Cortinarius cotoneus + + 2Cortinarius subgp.Leprocybe-1 + 1Cortinarius subgp.Leprocybe-2 + + + 3
Cortinarius subgp.Myxacium(4 species) +§ +§ +§ 2Cortinarius subgp. Phlegmacium(17 species) 3§ 2§ +§ 4 2
Cortinarius latusvar. brevisporus + 1Cortinarius cf. multiformis gp. 3 + + 3Cortinarius subgp.Phlegmacium-1 + + 3Cortinarius subgp.Phlegmacium-2 + + 2Cortinarius subgp.Phlegmacium-3 + 2Cortinarius subgp.Phlegmacium-4 + 1‡
Cortinarius subgp.Sericeocybe(8 species) +§ +§ +§ 4Cortinarius cf. alboviolaceusgp. + + 1Cortinarius cf. anomalus + + 2Cortinarius subgp.Sericeocybe-3 +§ +§ +§ 2Cortinarius traganus + 1‡
Cortinarius subgp. Telamonia (33 species) 2§ +§ +§ 3 2Cortinarius cf. langier + 1‡
Cortinarius subgp.Telamonia-1 + 1Cortinarius subgp.Telamonia-2 + + + 1
Gomphidius glutinosus + 1‡
Gomphidius subroseus + 2 2 3Gomphus clavatus + 1‡
Gomphus floccosus + 1‡
Hebeloma crustuliniforme + + 1 4 1Hebeloma mesophaeumgp. + + 2Hebelomacf. sacchariolens + + + 2
Table 3. List of species or species groups, percent biomass within each age-class, and occurrenceby season.
J:\cjb\cjb80\cjb-02\B02-003.vpMonday, February 25, 2002 9:55:14 AM
Color profile: Generic CMYK printer profileComposite Default screen

© 2002 NRC Canada
192 Can. J. Bot. Vol. 80, 2002
Age-class* Season†
Species OG RA Y Fall Spring
Hydnum umbilicatum + + 2 1Hygrocybe flavescens + 1‡
Hygrocybe laeta + 1‡
Hygrocybe miniata + 1‡
Hygrophorus agathosmus + 1‡
Hygrophorus bakerensis + 2Hygrophoruscf. calyptraeformis + 1‡
Hygrophoruscf. camarophyllus + 1‡
Hygrophorus chrysodon + 1‡
Hygrophorus eburneus + 1Inocybecf. lanuginosa(7 species) +§ +§ +§ 3 2
Inocybecf. lanuginosa-1 + + + 3 2Inocybecf. lanuginosa-2 + + + 3Inocybecf. lanuginosa-3 + + + 3
Inocybe geophyllagp. (3 species) + 2 1 3 1Inocybe maculatagp.: I. cf. lanatodisca + 1‡
Inocybe mixtilis gp. (3 species) 2 1 3 3Inocybe pudicagp. (3 species) + + + 3Inocybe pyriodoragp. (1 species) + 1‡
Inocybe sororiagp. (22 species) +§ +§ +§ 3 3Inocybe sororia-1 + + 3 2
Inocybe suaveolensgp. (1 species) + 2Laccaria amethysteo-occidentalisgp. + + + 2Laccaria bicolor + 1‡
Laccaria laccata + + + 2Lactarius alnicolagp. + + 1Lactarius deliciosus + + 1 1Lactarius fallax + 1‡
Lactarius pallescens + 2Lactarius pseudodeceptivus + 1‡
Lactarius pseudomucidus + + + 2Lactarius rubrilacteus + 3 6 3 1Lactarius scrobiculatusgp. + + + 2Lactarius subflammeus + 1‡
Lactarius vinaceorufescens + + + 2Paxillus atrotomentosus + 1‡
Paxillus involutus + 1‡
Phaeocollybiasp. + + 1Phylloporus rhodoxanthus + + + 1 1Ramaria acrisiccesscens + 1‡
Ramaria celerivirescens + 2Ramaria claviramulata + 1‡
Ramaria cystidiophorav. fabiolens + 1‡
Ramaria fennica + 1Ramaria formosa + 2Ramaria sandaracinav. sandaracina + 1‡
Ramariagp. 1 + 1Ramaria gp. 2 4 + 3Ramaria gp. 3A 2 2Ramariagp. 3B + 1Ramariagp. 3C + 1Ramaria gp. 4 2 2Ramaria stuntzii + 1‡
Ramaria subbotrytis + 1Russula aeruginea + + + 3
Table 3 (continued).
J:\cjb\cjb80\cjb-02\B02-003.vpMonday, February 25, 2002 9:55:14 AM
Color profile: Generic CMYK printer profileComposite Default screen

© 2002 NRC Canada
Smith et al. 193
Age-class* Season†
Species OG RA Y Fall Spring
Russula albidula + + 2Russula albonigra 5 + + 4Russula alutaceagp. + 2 3 3Russula amoenolens + + 1Russula brevipes 3 1 3Russula cascadensis + + 2Russula cerolensgp. + + + 2Russula cessansgp. + 1 2 3Russulacf. cyanoxantha + + + 2Russula cremoricolor + 1Russula crenulata 3 + + 1Russula decolorans + + 2Russula densifolia 2 + + 1Russula dissimulans + + 1Russula ellenae + + + 1Russula fragilis + + + 3Russula fragrantissima 4 + 2Russula gracilis + 1‡
Russula integragp. + + + 3Russula laurocerai + 1Russula pectinatoides + 1‡
Russula placita + 1‡
Russula sanguinea + 2Russulasp.nov. “B” + + 1Suillus lakei + 2 8 3Suillus ponderosus + 1 2Thelephora terrestrisgp. + + 2Tricholomacf. aestuans + 1‡
Tricholoma flavovirens + 1Tricholoma pardinum + 1‡
Tricholoma saponaceum + 1Tricholoma sulphureum + + 2Tricholoma terreumgp. + + 2Tricholoma virgatumgp. + 1‡
Hypogeous speciesAlpova trappei + 2Balsamia magnata + 1‡
Barssia oregonensis + 2Cortinomyces sublilacinus + 1‡
Elaphomyces granulatus 12 + + 3 2Elaphomyces muricatus + + 2 1Endogone lactiflua + + + 2Gautieria caudata + 1‡
Gautieria monticola 2 23 15 3 3gen.nov. + 1‡
Genabea cerebriformis + + 2Genea intermedia + 1‡
Geopora cooperivar. cooperi + 3Hydnoplicata gautierioides + 1Hydnotrya variiformis + + 2HymenogasterF2514 + 1Hysterangium aureum + 1‡
Hysterangium coriaceum 3 4 4 1 3Hysterangium crassirhachis 1 26 32 4 3Hysterangium setchellii 3 6 1 4 3
Table 3 (continued).
J:\cjb\cjb80\cjb-02\B02-003.vpMonday, February 25, 2002 9:55:15 AM
Color profile: Generic CMYK printer profileComposite Default screen
Average cumulative richness, measured over seven sea-sons, did not differ among age-classes for hypogeous species(F[2,6] = 0.01, p = 0.99) or epigeous species or speciesgroups (F[2,6] = 0.83,p = 0.48) (Table 2). The average cumu-lative richness of epigeous species or species groups also didnot differ among age-classes when collected only from per-manent strip plots (F[2,6] = 1.90,p = 0.23) or only from tem-porary strip plots (F[2,6] = 2.17,p = 0.20) (Table 2).
Average seasonal cumulative richness of hypogeous spe-cies in stands was found to differ among age-classes (F[2,6] =14.27,p = 0.005). Seasonal richness of hypogeous specieswas similar in old-growth and rotation-age stands (Ta-ble 2). Seasonal richness of hypogeous species in youngstands was lower in fall and higher in spring than richnessin the other two age-classes (Table 2). In young stands,there were, on average, five species more in spring com-pared with fall (Table 2).
Average seasonal cumulative richness of epigeous speciesor species groups in a stand differed between seasons (F[1,6] =539.59,p < 0.0001) but not among age-classes (F[2,6] = 0.18,p = 0.84). There was no evidence of an interaction betweenseason and age-class (F[2,6] = 3.34, p = 0.11). Within any
age-class, about 50 more epigeous species or species groupswere found in the fall compared with spring (95% confi-dence interval (CI) = 46.1–57.0) (Table 2).
Sporocarp production
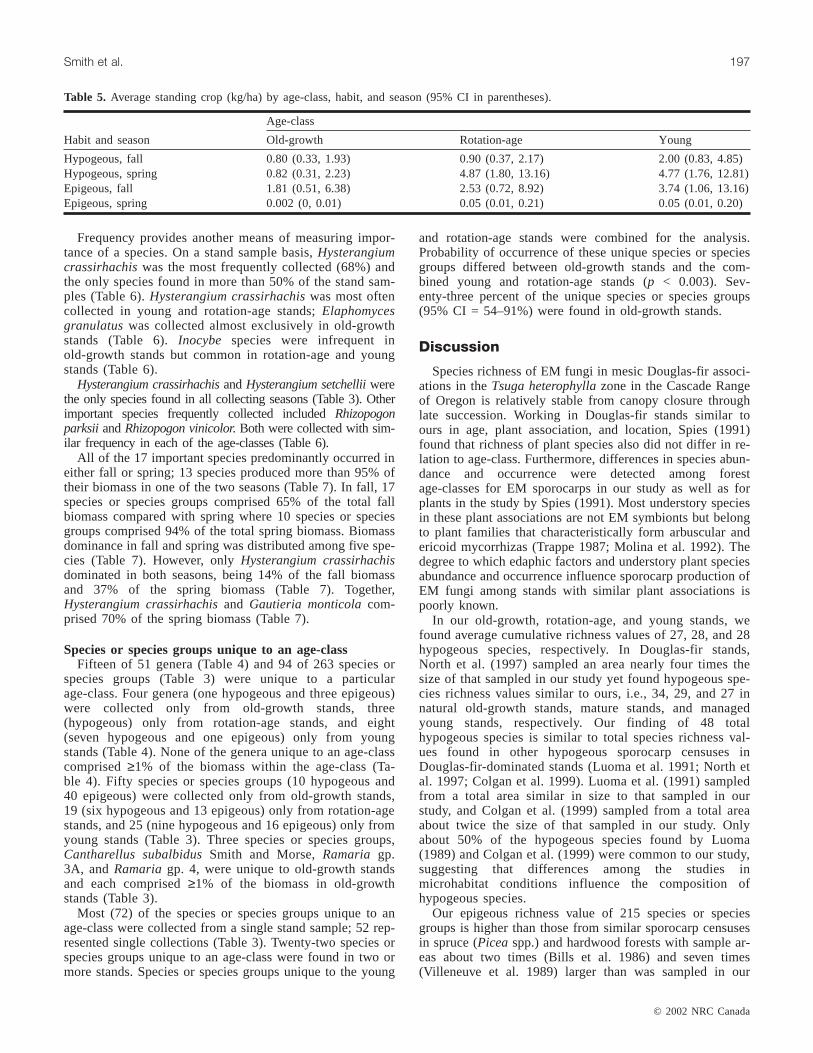
Hypogeous sporocarp productionHypogeous sporocarps yielded 2.44 kg/ha over all stand
samples: 1.43 kg/ha in fall and 3.8 kg/ha in spring. Themaximum single stand sample for hypogeous sporocarpswas 10.9 kg/ha from a young stand in spring.
Average seasonal biomass of hypogeous sporocarps in astand differed among age-classes (F[2,6] = 5.33,p = 0.047) andbetween seasons (F[2,6] = 9.37,p = 0.022). There was no strongevidence of an interaction among these factors (F[2,6] = 2.90,p= 0.131). Within a season, young and rotation-age stands hadsimilar average biomass (Table 5). These yields were aboutthree times greater (t6 = 3.13,p = 0.020, 95% CI = 1.28–7.61)than that of old-growth stands in the same season (Table 5).Within any age-class, average biomass of hypogeous sporo-carps in spring was about 2.4 times greater (t6 = 3.06, p =0.022, 95% CI = 1.19–4.72) compared with fall (Table 5).
© 2002 NRC Canada
194 Can. J. Bot. Vol. 80, 2002
Age-class* Season†
Species OG RA Y Fall Spring
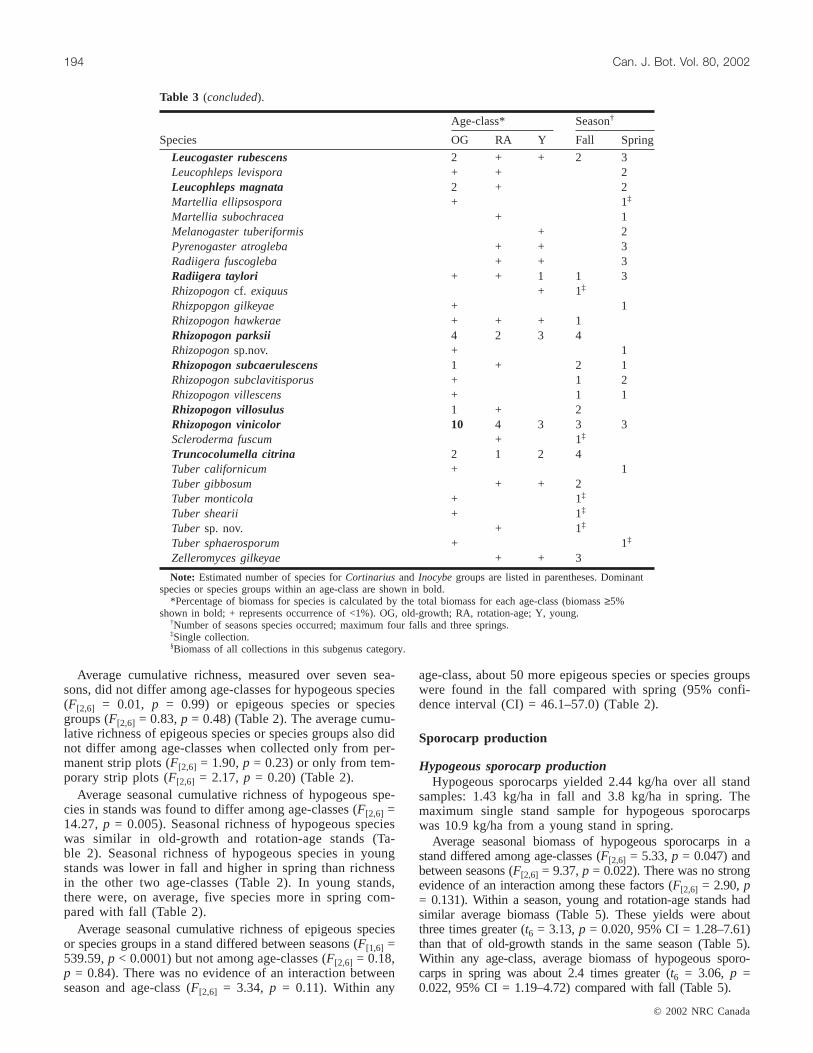
Leucogaster rubescens 2 + + 2 3Leucophleps levispora + + 2Leucophleps magnata 2 + 2Martellia ellipsospora + 1‡
Martellia subochracea + 1Melanogaster tuberiformis + 2Pyrenogaster atrogleba + + 3Radiigera fuscogleba + + 3Radiigera taylori + + 1 1 3Rhizopogoncf. exiquus + 1‡
Rhizpopgon gilkeyae + 1Rhizopogon hawkerae + + + 1Rhizopogon parksii 4 2 3 4Rhizopogonsp.nov. + 1Rhizopogon subcaerulescens 1 + 2 1Rhizopogon subclavitisporus + 1 2Rhizopogon villescens + 1 1Rhizopogon villosulus 1 + 2Rhizopogon vinicolor 10 4 3 3 3Scleroderma fuscum + 1‡
Truncocolumella citrina 2 1 2 4Tuber californicum + 1Tuber gibbosum + + 2Tuber monticola + 1‡
Tuber shearii + 1‡
Tuber sp. nov. + 1‡
Tuber sphaerosporum + 1‡
Zelleromyces gilkeyae + + 3
Note: Estimated number of species forCortinarius and Inocybegroups are listed in parentheses. Dominantspecies or species groups within an age-class are shown in bold.
*Percentage of biomass for species is calculated by the total biomass for each age-class (biomass≥5%shown in bold; + represents occurrence of <1%). OG, old-growth; RA, rotation-age; Y, young.
†Number of seasons species occurred; maximum four falls and three springs.‡Single collection.§Biomass of all collections in this subgenus category.
Table 3 (concluded).
J:\cjb\cjb80\cjb-02\B02-003.vpMonday, February 25, 2002 9:55:15 AM
Color profile: Generic CMYK printer profileComposite Default screen

Overall, hypogeous sporocarps were found in 37% of the1575 circular plots. Hypogeous sporocarps were found in27% of the plots in old-growth stands compared with 44% inrotation-age and 42% in young stands. Hypogeous sporo-carps were found in 52% of the plots in spring comparedwith 26% in fall.
Epigeous sporocarp productionEpigeous sporocarps yielded 1.6 kg/ha over all stand sam-
ples: 2.8 kg/ha in fall and 0.04 kg/ha in spring. The maxi-mum single stand sample for epigeous sporocarps was14.7 kg/ha from a young stand in fall.
Average seasonal biomass of epigeous sporocarps in astand differed among age-classes (F[2,6] = 6.82,p = 0.029)and between seasons (F[2,6] = 120.55,p < 0.0001). Therewas a weak interaction between age-class and season(F[2,6] = 3.41,p = 0.102). Within a season, young and rota-tion-age stands had similar average biomass (Table 5).These yields were about six times greater (t6 = 3.68, p =0.010, 95% CI = 1.81–19.14) than that of old-growthstands (Table 5). Within any age-class, average biomass ofepigeous sporocarps was about 146 times greater in fall (t6 =10.96,p < 0.0001, 95% CI = 48.0–444.0) compared withspring (Table 5).
Seasonal comparison of total sporocarp productionThe majority of species in our study showed strong sea-
sonal variation in relative sporocarp biomass. Similarsporocarp biomass was produced in fall (53%) and spring(47%) for combined hypogeous and epigeous sporocarps.Sporocarp biomass in fall was about twice as great forepigeous compared with hypogeous sporocarps and in springabout 84 times greater for hypogeous compared withepigeous sporocarps.
Dominant genera and speciesFour major genera (Gautieria, Hysterangium,
Rhizopogon, andRussula) comprised 68% of the total bio-mass;Hysterangium, Rhizopogon, andRussulawere domi-nant in all age-classes (Table 4). Most of the dominantgenera differed in relative percentage of biomass amongthe stand age-classes (Table 4).Cortinarius, Elaphomyces,Ramaria, Rhizopogon, and Russulaall had a higher per-centage of the biomass in the old-growth stands than in theyoung and rotation-age stands. In contrast,Gautieria andInocybehad a higher percentage of the biomass in the rota-tion-age and, to a lesser extent, the young stands comparedwith the old-growth stands.Hysterangiumhad a higher per-centage of the biomass in both the young and rotation-agestands compared with the old-growth stands.LactariusandSuillus both had a higher percentage of the biomass in theyoung and, to a lesser extent, rotation-age stands comparedwith old-growth stands.
Seventeen important species (nine epigeous and eighthypogeous) within 11 genera accounted for 79% of the totalsporocarp biomass; two major species (Gautieria monticolaHarkn. andHysterangium crassirhachisZeller and Dodge)accounted for 41% (Table 6). Summaries are provided sepa-rately for the important epigeous and hypogeous species(Appendix A) to facilitate comparison of results from thisstudy with study results where only epigeous or hypogeoussporocarps were reported.
© 2002 NRC Canada
Smith et al. 195
Genus % of total% of age-class biomassOG RA Y
EpigeousAmanita + + + +Boletus + 1 + +Camarophyllus + +Cantharellus 3 3 2 4Chroogomphus + 1 + +Clavariadelphus + +Clavulina + +Cortinarius 3 6 3 2Gomphidius 2 + 2 2Gomphus + +Hebeloma 1 + 1 1Hydnum + + +Hygrocybe + + +Hygrophorus + + + +Inocybe 4 + 5 3Laccaria + + + +Lactarius 5 1 4 7Paxillus + + +Phaeocollybia + + +Phylloporus + + + +Ramaria 2 11 +Russula 11 23 10 7Suillus 5 + 2 9Thelephora + + +Tricholoma + + 1 +
HypogeousAlpova + +Balsamia + +Barssia + +Cortinomyces + +Elaphomyces 2 13 + +Endogone + + + +Gautieria 16 2 23 15gen.nov + +Genabea + + +Genea + +Geopora + +Hydnoplicata + +Hydnotrya + + +Hymenogaster + +Hysterangium 32 7 36 37Leucogaster + 2 + +Leucophleps + 2 +Martellia + + +Melanogaster + +Pyrenogaster + + +Radiigera + + + 1Rhizopogon 9 21 7 6Scleroderma + +Truncolumella 2 2 1 2Tuber + + + 2Zelleromyces + + +
Note: Dominant genera within an age-class are shown in bold.Percentage of biomass for genera is calculated by the total biomass foreach age-class (biomass≥5% shown in bold; + represents occurrence of<1%). OG, old-growth; RA, rotation age; Y, young.
Table 4. Total percent biomass and percent biomass within eachage-class by genus.
J:\cjb\cjb80\cjb-02\B02-003.vpMonday, February 25, 2002 9:55:16 AM
Color profile: Generic CMYK printer profileComposite Default screen

© 2002 NRC Canada
196 Can. J. Bot. Vol. 80, 2002
The 17 important species comprised 86 and 82% of thebiomass in young and rotation-age stands, respectively,compared with only 46% in old-growth stands (Table 6).Elaphomyces granulatusFr. and Rhizopogon vinicolorSmith were major biomass dominants in old-growth stands,Gautieria monticola, Hysterangium crassirhachis, andHysterangium setchellii Fischer were major biomassdominants in rotation-age stands, andGautieria monticola,Hysterangium crassirhachis, Lactarius rubrilacteusSmithand Hesler, andSuillus lakei(Murr.) Smith and Thiers were
major biomass dominants in young stands (Tables 3 and 6).Eight of the 17 species (Cantharellus formosus, Gautieriamonticola, Hysterangium coriaceum, Hysterangiumcrassirhachis, Hysterangium setchellii, Rhizopogon parksiiSmith,Rhizopogon vinicolor, andTruncocolumella citrinaZeller) each comprised≥1% of the biomass within each ofthe age-classes (Table 6). These eight species comprised68 and 63% of the biomass in rotation-age and youngstands, respectively, compared with 26% in old-growthstands.
0
20
40
60
80
100
120
140
F1991 S1992 F1992 S1993 F1993 S1994 F1994
Epigeous: permanent strip plots Epigeous: temporary strip plotsHypogeous: circular plots
Cum
ulat
ive n
o. o
f tax
a
Fig. 1. Cumulative number of species or species groups by plot type. Epigeous species groups with multiple species were countedonce each sample time that they occurred. Cumulative number of species or species groups is largely a function of time on permanentstrip plots and a function of both time and area on temporary strip plots and circular plots. Epigeous species or species groups werecollected from a total area of 18 700 m2 each on temporary and permanent strip plots. Hypogeous species were collected from a totalarea of 6300 m2 on circular plots.
Y: L104 1.00 54 43 50 48 44 35 38 34
Y: L201 0.66 1.00 46 52 52 45 36 40 35
Y: L202 0.59 0.67 1.00 41 45 42 29 34 32
RA: MC1 0.60 0.66 0.59 1.00 53 45 40 40 32
RA: MC2 0.59 0.68 0.66 0.68 1.00 48 36 40 39
RA: MC3 0.58 0.63 0.67 0.68 0.68 1.00 34 34 39
OG: SC 0.43 0.46 0.42 0.51 0.47 0.47 1.00 49 44
OG: ST15 0.43 0.48 0.45 0.47 0.48 0.43 0.58 1.00 50
OG: ULO 0.41 0.45 0.46 0.46 0.50 0.54 0.56 0.59 1.00
Y: L104 Y: L201 Y: L202 RA: MC1 RA: MC2 RA: MC3 OG: SC OG: ST15 OG: ULO
Fig. 2. Matrix showingβ diversity between pairs of stands. Unshaded, similarity coefficients from the Sorenson index; shaded, numberof species in common; Y, young; RA, rotation-age; OG, old-growth.
J:\cjb\cjb80\cjb-02\B02-003.vpMonday, February 25, 2002 9:55:18 AM
Color profile: Generic CMYK printer profileComposite Default screen
Frequency provides another means of measuring impor-tance of a species. On a stand sample basis,Hysterangiumcrassirhachiswas the most frequently collected (68%) andthe only species found in more than 50% of the stand sam-ples (Table 6).Hysterangium crassirhachiswas most oftencollected in young and rotation-age stands;Elaphomycesgranulatuswas collected almost exclusively in old-growthstands (Table 6).Inocybe species were infrequent inold-growth stands but common in rotation-age and youngstands (Table 6).
Hysterangium crassirhachisandHysterangium setchelliiwerethe only species found in all collecting seasons (Table 3). Otherimportant species frequently collected includedRhizopogonparksii andRhizopogon vinicolor. Both were collected with sim-ilar frequency in each of the age-classes (Table 6).
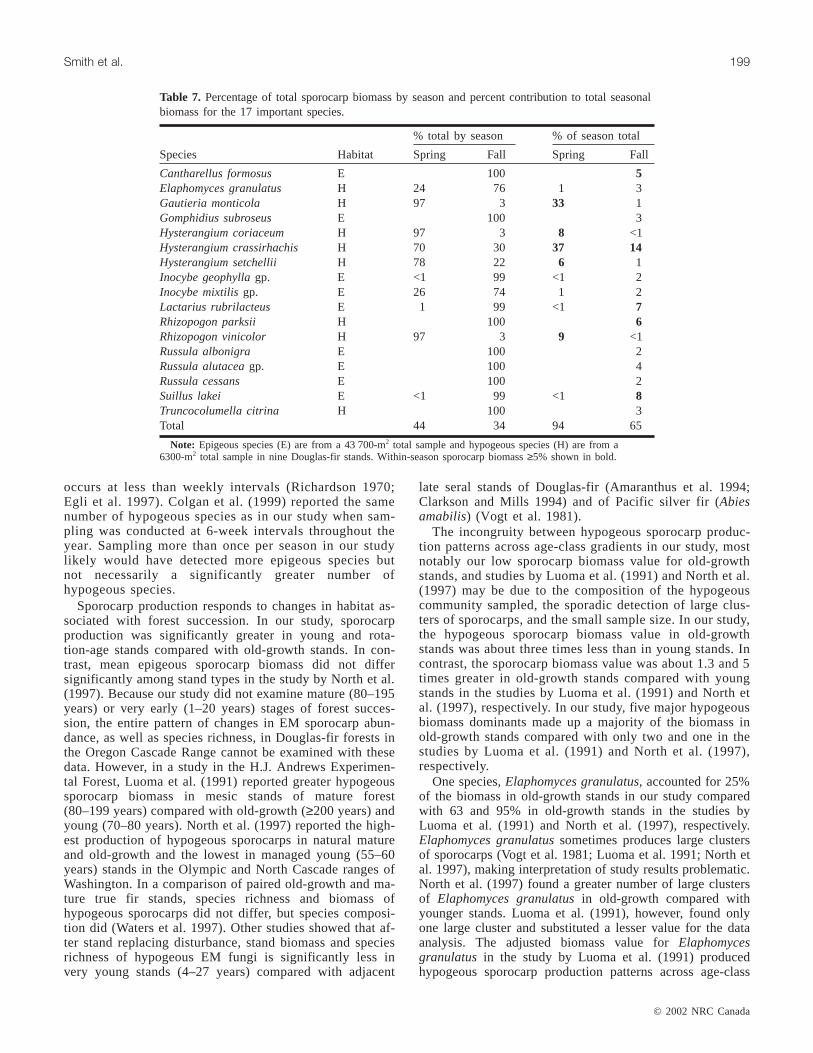
All of the 17 important species predominantly occurred ineither fall or spring; 13 species produced more than 95% oftheir biomass in one of the two seasons (Table 7). In fall, 17species or species groups comprised 65% of the total fallbiomass compared with spring where 10 species or speciesgroups comprised 94% of the total spring biomass. Biomassdominance in fall and spring was distributed among five spe-cies (Table 7). However, onlyHysterangium crassirhachisdominated in both seasons, being 14% of the fall biomassand 37% of the spring biomass (Table 7). Together,Hysterangium crassirhachisand Gautieria monticolacom-prised 70% of the spring biomass (Table 7).
Species or species groups unique to an age-classFifteen of 51 genera (Table 4) and 94 of 263 species or
species groups (Table 3) were unique to a particularage-class. Four genera (one hypogeous and three epigeous)were collected only from old-growth stands, three(hypogeous) only from rotation-age stands, and eight(seven hypogeous and one epigeous) only from youngstands (Table 4). None of the genera unique to an age-classcomprised≥1% of the biomass within the age-class (Ta-ble 4). Fifty species or species groups (10 hypogeous and40 epigeous) were collected only from old-growth stands,19 (six hypogeous and 13 epigeous) only from rotation-agestands, and 25 (nine hypogeous and 16 epigeous) only fromyoung stands (Table 3). Three species or species groups,Cantharellus subalbidusSmith and Morse,Ramaria gp.3A, and Ramariagp. 4, were unique to old-growth standsand each comprised≥1% of the biomass in old-growthstands (Table 3).
Most (72) of the species or species groups unique to anage-class were collected from a single stand sample; 52 rep-resented single collections (Table 3). Twenty-two species orspecies groups unique to an age-class were found in two ormore stands. Species or species groups unique to the young
and rotation-age stands were combined for the analysis.Probability of occurrence of these unique species or speciesgroups differed between old-growth stands and the com-bined young and rotation-age stands (p < 0.003). Sev-enty-three percent of the unique species or species groups(95% CI = 54–91%) were found in old-growth stands.
Discussion
Species richness of EM fungi in mesic Douglas-fir associ-ations in theTsuga heterophyllazone in the Cascade Rangeof Oregon is relatively stable from canopy closure throughlate succession. Working in Douglas-fir stands similar toours in age, plant association, and location, Spies (1991)found that richness of plant species also did not differ in re-lation to age-class. Furthermore, differences in species abun-dance and occurrence were detected among forestage-classes for EM sporocarps in our study as well as forplants in the study by Spies (1991). Most understory speciesin these plant associations are not EM symbionts but belongto plant families that characteristically form arbuscular andericoid mycorrhizas (Trappe 1987; Molina et al. 1992). Thedegree to which edaphic factors and understory plant speciesabundance and occurrence influence sporocarp production ofEM fungi among stands with similar plant associations ispoorly known.
In our old-growth, rotation-age, and young stands, wefound average cumulative richness values of 27, 28, and 28hypogeous species, respectively. In Douglas-fir stands,North et al. (1997) sampled an area nearly four times thesize of that sampled in our study yet found hypogeous spe-cies richness values similar to ours, i.e., 34, 29, and 27 innatural old-growth stands, mature stands, and managedyoung stands, respectively. Our finding of 48 totalhypogeous species is similar to total species richness val-ues found in other hypogeous sporocarp censuses inDouglas-fir-dominated stands (Luoma et al. 1991; North etal. 1997; Colgan et al. 1999). Luoma et al. (1991) sampledfrom a total area similar in size to that sampled in ourstudy, and Colgan et al. (1999) sampled from a total areaabout twice the size of that sampled in our study. Onlyabout 50% of the hypogeous species found by Luoma(1989) and Colgan et al. (1999) were common to our study,suggesting that differences among the studies inmicrohabitat conditions influence the composition ofhypogeous species.
Our epigeous richness value of 215 species or speciesgroups is higher than those from similar sporocarp censusesin spruce (Piceaspp.) and hardwood forests with sample ar-eas about two times (Bills et al. 1986) and seven times(Villeneuve et al. 1989) larger than was sampled in our
© 2002 NRC Canada
Smith et al. 197
Age-class
Habit and season Old-growth Rotation-age Young
Hypogeous, fall 0.80 (0.33, 1.93) 0.90 (0.37, 2.17) 2.00 (0.83, 4.85)Hypogeous, spring 0.82 (0.31, 2.23) 4.87 (1.80, 13.16) 4.77 (1.76, 12.81)Epigeous, fall 1.81 (0.51, 6.38) 2.53 (0.72, 8.92) 3.74 (1.06, 13.16)Epigeous, spring 0.002 (0, 0.01) 0.05 (0.01, 0.21) 0.05 (0.01, 0.20)
Table 5. Average standing crop (kg/ha) by age-class, habit, and season (95% CI in parentheses).
J:\cjb\cjb80\cjb-02\B02-003.vpMonday, February 25, 2002 9:55:18 AM
Color profile: Generic CMYK printer profileComposite Default screen

study. Species richness values in our managed forestage-classes were higher than those reported in forest typesbetween 55 and 70 years old in the studies by Bills et al.(1986) and Villeneuve et al. (1989), suggesting thatDouglas-fir and western hemlock forests are particularlyspecies rich. In old-growth stands, we found a number ofepigeous species, after estimating species numbers withinsubgroups ofCortinarius, similar to the number reported byO’Dell et al. (1999) in a 2-year study; total area sampled inthe two studies was similar.
Our finding of a greater percentage of the more commonunique species in old-growth stands is in keeping with ob-servations for succession of EM fungi with accumulations ofrecalcitrant plant litter (Last et al. 1984, 1987). The largenumber of species or species groups found uniquely, butonly rarely, in old-growth stands in our study is consistentwith that of O’Dell et al. (1999). Results of our study andthe study by O’Dell et. al (1999) suggest that old-growthstands contain many species of fungi that infrequently pro-duce sporocarps.
Some genera in our study contained species with nota-ble annual variability. For example, the number ofRussulaspecies varied from three to 23 per fall season, and 11were found only in a single fall season. Seven of thesewere found in the final fall collecting season, stronglycontributing to the continued increase in the diversitycurve (Fig. 1).
Our study shows that the number of sampling visits andarea sampled influence species richness values in dis-
persed plots. The increase in epigeous species or speciesgroups from permanent strip plots is largely a function oftime because the same area was sampled at each sampletime. Conversely, the increase in epigeous species or spe-cies groups from temporary strip plots and in hypogeousspecies from circular plots is a function of both time andarea sampled; new plots are installed each collecting sea-son. Our slightly higher cumulative epigeous species rich-ness collected from permanent strip plots compared withtemporary strip plots suggests that the number of times anarea is sampled may be more important to detecting spe-cies than sampling new area (Fig. 1). O’Dell et al. (1999)suggested that more species will be detected with thesame effort by sampling from noncontiguous plots. Wecannot rule out that sampling more dispersed plots orsampling more times per season may have evened out therichness values between plot types.
Our once-per-season sampling coincided with peakbiomass and species diversity in the Pacific Northwest(Fogel 1976; Hunt and Trappe 1987; Luoma 1991). It ispossible that the temporal peaks of sporocarp productiondiffered among stand ages. However, seasonal fruitingtypically commences and terminates within a few weeks,and stands within each age-class were sampled in mostweeks. Most EM sporocarp studies in this region sam-pled once or twice per season (Luoma et al. 1991; Northet al. 1997; Colgan et al. 1999; O’Dell et al. 1999). Thesporocarp longevity of most species is unknown (Weber2001). Species richness values decline when sampling
© 2002 NRC Canada
198 Can. J. Bot. Vol. 80, 2002
% of speciesbiomass by age-class
% of age-class biomassfor each species
Relative proportionby age-class (%)‡
Species HabitDry mass(g/ha)*
% of totalbiomass OG RA Y OG RA Y
Totalfrequency† OG RA Y
Cantharellus formosus E 200 3 10 25 65 2 2 4 38 25 29 46Elaphomyces granulatus H 163 2 93 6 1 12 <1 <1 14 78 11 11Gautieria monticola H 1310 16 2 55 43 2 23 15 38 21 50 29Gomphidius subroseus E 124 2 9 40 52 1 2 2 41 31 35 35Hysterangium coriaceum H 309 4 12 40 48 3 4 4 35 18 41 41Hysterangium crassirhachisH 2017 25 1 40 59 1 26 32 68 12 40 49Hysterangium setchellii H 285 4 12 70 19 3 6 1 37 26 52 22Inocybe geophyllagp. E 107 1 <1 56 44 <1 2 1 32 5 45 50Inocybe mixtilisgp. E 91 1 0 54 47 0 2 1 46 0 41 59Lactarius rubrilacteus E 317 4 1 34 65 <1 3 6 29 22 44 33Rhizopogon parksii H 241 3 21 31 48 4 2 3 43 33 30 37Rhizopogon vinicolor H 342 4 37 35 29 10 4 3 46 31 34 34Russula albonigra E 901 1 66 30 4 5 1 <1 17 45 36 18Russula alutaceagp. E 181 2 4 32 65 1 2 3 27 21 37 42Russula cessansgp. E 104 1 9 35 56 1 1 2 25 19 38 44Suillus lakei E 343 4 1 15 84 <1 2 8 22 14 43 43Truncocolumella citrina H 139 2 14 23 63 2 1 2 37 35 22 43Total 6362 79 9 41 50 46 82 86
Note: Epigeous species (E) are from a 43 700-m2 total sample and hypogeous species (H) are from a 6300-m2 total sample in nine Douglas-fir stands.Sporocarp biomass≥5% shown in bold. OG, old-growth; RA, rotation-age; Y, young.*Dry mass sporocarp biomass on an annual basis.†Frequency determined as a percentage of the total number of stand samples (9 stands × 7 seasons = 63).‡Relative proportion by age-class determined as a percentage of the number of occurrences in each age-class divided by the total number of occurrences.
Table 6. Sporocarp habit, biomass, percentage of total biomass, percentage of each species biomass distributed across age-class, per-centage of age-class biomass for each species, total frequency, and relative proportion by age-class for the 17 important species.
J:\cjb\cjb80\cjb-02\B02-003.vpMonday, February 25, 2002 9:55:19 AM
Color profile: Generic CMYK printer profileComposite Default screen
occurs at less than weekly intervals (Richardson 1970;Egli et al. 1997). Colgan et al. (1999) reported the samenumber of hypogeous species as in our study when sam-pling was conducted at 6-week intervals throughout theyear. Sampling more than once per season in our studylikely would have detected more epigeous species butnot necessarily a significantly greater number ofhypogeous species.
Sporocarp production responds to changes in habitat as-sociated with forest succession. In our study, sporocarpproduction was significantly greater in young and rota-tion-age stands compared with old-growth stands. In con-trast, mean epigeous sporocarp biomass did not differsignificantly among stand types in the study by North et al.(1997). Because our study did not examine mature (80–195years) or very early (1–20 years) stages of forest succes-sion, the entire pattern of changes in EM sporocarp abun-dance, as well as species richness, in Douglas-fir forests inthe Oregon Cascade Range cannot be examined with thesedata. However, in a study in the H.J. Andrews Experimen-tal Forest, Luoma et al. (1991) reported greater hypogeoussporocarp biomass in mesic stands of mature forest(80–199 years) compared with old-growth (≥200 years) andyoung (70–80 years). North et al. (1997) reported the high-est production of hypogeous sporocarps in natural matureand old-growth and the lowest in managed young (55–60years) stands in the Olympic and North Cascade ranges ofWashington. In a comparison of paired old-growth and ma-ture true fir stands, species richness and biomass ofhypogeous sporocarps did not differ, but species composi-tion did (Waters et al. 1997). Other studies showed that af-ter stand replacing disturbance, stand biomass and speciesrichness of hypogeous EM fungi is significantly less invery young stands (4–27 years) compared with adjacent
late seral stands of Douglas-fir (Amaranthus et al. 1994;Clarkson and Mills 1994) and of Pacific silver fir (Abiesamabilis) (Vogt et al. 1981).
The incongruity between hypogeous sporocarp produc-tion patterns across age-class gradients in our study, mostnotably our low sporocarp biomass value for old-growthstands, and studies by Luoma et al. (1991) and North et al.(1997) may be due to the composition of the hypogeouscommunity sampled, the sporadic detection of large clus-ters of sporocarps, and the small sample size. In our study,the hypogeous sporocarp biomass value in old-growthstands was about three times less than in young stands. Incontrast, the sporocarp biomass value was about 1.3 and 5times greater in old-growth stands compared with youngstands in the studies by Luoma et al. (1991) and North etal. (1997), respectively. In our study, five major hypogeousbiomass dominants made up a majority of the biomass inold-growth stands compared with only two and one in thestudies by Luoma et al. (1991) and North et al. (1997),respectively.
One species,Elaphomyces granulatus, accounted for 25%of the biomass in old-growth stands in our study comparedwith 63 and 95% in old-growth stands in the studies byLuoma et al. (1991) and North et al. (1997), respectively.Elaphomyces granulatussometimes produces large clustersof sporocarps (Vogt et al. 1981; Luoma et al. 1991; North etal. 1997), making interpretation of study results problematic.North et al. (1997) found a greater number of large clustersof Elaphomyces granulatusin old-growth compared withyounger stands. Luoma et al. (1991), however, found onlyone large cluster and substituted a lesser value for the dataanalysis. The adjusted biomass value forElaphomycesgranulatus in the study by Luoma et al. (1991) producedhypogeous sporocarp production patterns across age-class
© 2002 NRC Canada
Smith et al. 199
% total by season % of season total
Species Habitat Spring Fall Spring Fall
Cantharellus formosus E 100 5Elaphomyces granulatus H 24 76 1 3Gautieria monticola H 97 3 33 1Gomphidius subroseus E 100 3Hysterangium coriaceum H 97 3 8 <1Hysterangium crassirhachis H 70 30 37 14Hysterangium setchellii H 78 22 6 1Inocybe geophyllagp. E <1 99 <1 2Inocybe mixtilisgp. E 26 74 1 2Lactarius rubrilacteus E 1 99 <1 7Rhizopogon parksii H 100 6Rhizopogon vinicolor H 97 3 9 <1Russula albonigra E 100 2Russula alutaceagp. E 100 4Russula cessans E 100 2Suillus lakei E <1 99 <1 8Truncocolumella citrina H 100 3Total 44 34 94 65
Note: Epigeous species (E) are from a 43 700-m2 total sample and hypogeous species (H) are from a6300-m2 total sample in nine Douglas-fir stands. Within-season sporocarp biomass≥5% shown in bold.
Table 7. Percentage of total sporocarp biomass by season and percent contribution to total seasonalbiomass for the 17 important species.
J:\cjb\cjb80\cjb-02\B02-003.vpMonday, February 25, 2002 9:55:19 AM
Color profile: Generic CMYK printer profileComposite Default screen
gradients similar to those of our study as well as composi-tion of biomass dominant species and total biomass in mesicold-growth stands similar to those of our study. We foundno clusters ofElaphomyces granulatuslarge enough to con-sider adjusting the biomass.
It is unclear why we found less sporocarp biomass inold-growth stands compared with younger managed stands.Possible explanations include (i) a decrease in net primaryproduction or differences in belowground carbon allocationwith stand age (Waring and Schlesinger 1985; Waring andRunning 1998), (ii ) differences among forest age-classes thatinfluence microhabitat conditions contributing to the devel-opment of sporocarps, (iii ) a larger number of EM speciesnot producing conspicuous sporocarps in old-growth standscompared with younger stands, (iv) an artifact of the sin-gle-interval sampling method, and (v) a high level of smallmammal mycophagy in our old-growth stands. Small mam-mal population densities and small mammal mycophagy arehighly variable across stands and landscapes (Cazares et al.1999). However, mycophagy likely did not have a significanteffect on biomass because we sampled at times of sporocarpabundance (North et al. 1997).
The most dominant genera appeared in all age-classes.However, about 25% of the genera in our study appearedexclusively in either young or old-growth stands (Table 4),suggesting genus-level patterns of EM sporocarp succes-sion as forests age. Fox (1986) noted a EM genus-level dis-tinction between young and aging birch (Betula spp.)forests. However, many of the genera characterized as earlystage or late stage in the study by Fox (1986) were multi-stage in our study. Differences seen in age-class associationof genera in our study compared with those in the study byFox (1986) suggest that it is difficult to (i) to generalizepatterns of EM succession between different forest typesand (ii ) define ecological traits common to all specieswithin a genus. Nevertheless, sporocarp production occur-ring exclusively and repeatedly in a single age-class bysome genera suggests similar habitat requirements for spe-cies within those genera. Defining distribution patterns as-sociated with taxa at levels higher than species would behelpful for landscape-scale models of fungi occurrence(Dreisbach et al. 2002).
Each forest age-class, as well as our study overall, wascharacterized by a few biomass dominant species of bothhypogeous and epigeous sporocarps and a larger numberof less abundant species. This pattern of biomass domi-nance by a few species is common to many groups of or-ganisms and has been documented in EM sporocarpcommunities, especially among hypogeous fungi (Luomaet al. 1991; North et al. 1997; Waters et al. 1997; Colganet al. 1999). Many species appeared in greater abundancein a particular age-class (Table 6). Repeatedly detectedspecies provide a framework for exploring microhabitatvariables contributing to their occurrence and abundance.Such knowledge may provide insight into the habitat re-quirements of more rare species and is essential to speciesconservation efforts.
Other studies in Douglas-fir in our region also have re-ported higher biomass of hypogeous sporocarps in springcompared with fall (Fogel 1976; Luoma et al. 1991; North et
al. 1997; Cazares et al. 1999). Epigeous sporocarps showrelative rarity in seasons other than fall in our region (Fogeland Hunt 1979; North et al. 1997; O’Dell et al. 1999). Themore even production of hypogeous sporocarps in springand fall makes them a more reliable food supply formycophagists (North et al. 1997; Cazares et al. 1999).Colgan et al. (1999) reported that some species ofhypogeous fungi produce sporocarps throughout the winterwhen many food resources are scarce.
Species richness and patterns of EM community struc-ture reported in this study are based on the sporadic pro-duction of ephemeral fungal sporocarps and our ability todetect them. Describing EM communities by samplingsporocarps provides data essential for predicting impacts ofdisturbance and management on sporocarp diversity andproduction but not total EM diversity. Species richness,composition, and relative abundance likely would have dif-fered if we had sampled EM roots (Gardes and Bruns1996). To further increase knowledge of the community dy-namics of EM fungi, both sporocarp and root tip ap-proaches should be considered for determining EM speciesdiversity and dominance in future studies.
Knowledge of EM fungal communities improves ourability to maintain biological diversity in old-growth,managed rotation-age, and young stands. In summary, wefound (i) high EM species richness in forests in theTsuga heterophyllazone in the Cascade Range in Ore-gon, (ii ) a similar number of EM fungal species amongforest age-classes with similar plant association groups,(iii ) a change in abundance of some dominant species orspecies groups as forest stands age, and (iv) a greaterlikelihood for species or species groups unique to anage-class to occur in old-growth stands. Our results sug-gest that all age-classes of forests are important formaintaining the biological diversity of EM fungi and theorganisms they support.
Acknowledgements
We are grateful to the many volunteers who collectedfungi, especially B. Baennziger, B. Caldwell, J. Caruthers,W. Caruthers, W. Colgan III, F. Camacho, L. Dominguez,T. Dreisbach, J. Eberhart, R. Exeter, C. Fischer, D.Gerten, N. Higgins, A. Jumpponen, T. Lakhanpal, L. Mor-rison, P. Perez, C. Roberts, K. Smith, D. Thysell, and Y.Yunker. Special thanks to T. O’Dell for helping to initiatethis study in 1991, C. Roberts for preliminary identifica-tion of collections, S. Goldberg for data entry, and G. Gul-den, E. Nouhra, J. Trappe, and N.S. Weber for assistingwith identification of the various taxonomic groups. Wethank the staff at the H.J. Andrews Experimental Forest,especially site manager A. McKee, for suggesting standsappropriate for the study and G. Downing for providingaccommodations, often on short notice. We thank J.Mayo, J. Cissel, and others at the USDA Forest Service,Blue River Ranger District, and the Cascade Center forEcosystem Management for interest in and support of thisstudy. We thank W. Colgan, III, A. Dahlberg, T. Horton,C. Lefevre, and two anonymous reviewers for suggestionsand critical reviews of the manuscript.
© 2002 NRC Canada
200 Can. J. Bot. Vol. 80, 2002
J:\cjb\cjb80\cjb-02\B02-003.vpMonday, February 25, 2002 9:55:19 AM
Color profile: Generic CMYK printer profileComposite Default screen
References
Amaranthus, M.P., Trappe, J.M., Bednar, L., and Arthur, D. 1994.Hypogeous fungal production in mature Douglas-fir forest frag-ments and surrounding plantations and its relation to coarsewoody debris. Can. J. For. Res.24: 2157–2165.
Ammirati, J.F. 1983.Cortinarius. I. Generic description and com-ments on the subgenera. McIlvainea,3: 44–51.
Ammirati, J., Ammirati, S., Norvell, L., O’Dell, T., Puccio, M.,Seidl, M., Walker, G., Redhead, S., and Ginns, J. 1994. A pre-liminary report on the fungi of Barlow Pass, Washington.McIlvainea,2: 10–33.
Arnolds, E. 1988. The changing macromycete flora in the Nether-lands. Trans. Br. Mycol. Soc.90: 391–406.
Arnolds, E. 1989. A preliminary RED data list of macrofungi inthe Netherlands. Persoonia,14: 77–125.
Arnolds E. 1991. Decline of ectomycorrhizal fungi in Europe.Agric. Ecosyst. Environ.35: 209–244.
Arora, D. 1986. Mushrooms demystified. 2nd ed. Ten Speed Press,Berkeley, Calif.
Baar, J., Horton, T.R., Kretzer, A.M., and Bruns, T.D. 1999.Mycorrhizal colonization of Pinus muricata from resistantpropagules after a stand-replacing wildfire. New Phytol.143:409–418.
Bierlmaier, F.A., and McKee, A. 1989. Climatic summaries anddocumentation for the primary meteorological station, H.J. An-drews Experimental Forest, 1972 to 1984. U.S. For. Serv. Gen.Tech. Rep. No. PNW-GTR-242.
Bills, G.F., Holtzmann, G.I., and Miller, O.K., Jr. 1986. Compari-son of ectomycorrhizal basidiomycete communities in redspruce versus northern hardwood forests of West Virginia. Can.J. Bot. 64: 760–768.
Brown, R.P., and Parsons, R.B. 1973. Soil of the reference stands:Oregon IBP. US/IBP Conif. For. Biome Int. Rep. No. 128. Uni-versity of Washington, Seattle, Wash.
Castellano, M.A., Smith, J.E., O’Dell, T.E., Cazares, E., and Nu-gent, S. 1999. Handbook to strategy 1 fungal species in theNorthwest Forest Plan. U.S. For. Serv. Gen. Tech. Rep. No.PNW-GTR-476.
Cazares, E., Luoma, D.L., Amaranthus, M.P., Chambers, C.L.,and Lehmkuhl, J.F. 1999. Interaction of fungal sporocarp pro-duction with small mammal abundance and diet in Douglas-firstands of the southern Cascade Range. Northwest Sci.73:64–76.
Claridge, A.W., Barry, S.C., Cork, S.J., and Trappe, J.M. 2000. Di-versity and habitat relationships of hypogeous fungi. II. Factorsinfluencing the occurrence and number of taxa. Biodivers.Conserv.9: 175–199.
Clarkson, D.A., and Mills, L.S. 1994. Hypogeous sporocarps inforest remnants and clearcuts in southwest Oregon. NorthwestSci. 68: 259–265.
Colgan, W., III, Carey, A.B., Trappe, J.M., Molina, R., andThysell, D. 1999. Diversity and productivity of hypogeous fun-gal sporocarps in a variably thinned Douglas-fir forest. Can. J.For. Res.29: 1259–1268.
Cooke, W.B. 1955. Fungi, lichens and mosses in relation to vascu-lar plant communities in eastern Washington and adjacent Idaho.Ecol. Monogr.25: 119–180.
Dahlberg, A., Jonsson, L., and Nylund, J.E. 1997. Species diversityand distribution of biomass above and below ground amongectomycorrhizal fungi in an old Norway spruce forest in SouthSweden. Can. J. Bot.75: 1323–1335.
Deacon, J.W., and Fleming, L.V. 1992. Interactions ofectomycorrhizal fungi.In Mycorrhizal functioning: an integra-tive plant–fungal process.Edited byM.F. Allen. Chapman andHall, New York. pp. 249–300.
Deacon, J.W., Donaldson, S.J., and Last, F.T. 1983. Sequences andinteractions of mycorrhizal fungi on birch. Plant Soil,71:257–262.
Dighton, J., and Mason, P.A. 1985. Mycorrhizal dynamics duringforest tree development.In Developmental biology of higherfungi. Edited byD. Moore, L.A. Casselton, D.A. Wood, and J.C.Frankland. Cambridge University Press, New York.pp. 117–139.
Dighton, J., Poskitt, J.M., and Howard, D.M. 1986. Changes in oc-currence of basidiomycete fruit bodies during forest stand devel-opment: with specific reference to mycorrhizal species. Trans.Br. Mycol. Soc.87: 163–171.
Dreisbach, T.A., Smith, J.E., and Molina, R. 2002. Challenges ofmodeling fungal habitat: when and where do you findchanterelles?In Predicting species occurrences: issues of scaleand accuracy.Edited byJ.M. Scott, P.J. Heglund, M. Morrison,M. Raphael, J. Haufler, and B. Wall. Island Press, Covello, Ca-lif. In press.
Egli, S., Ayer, F., and Chatelain, F. 1997. The description of diver-sity of macromycetes. Results of fungal ecological longtermstudies in mycological reserve of La Chanéaz, FR, Switzerland.Mycol. Helv. 9: 19–32.
Fogel, R. 1976. Ecological studies of hypogeous fungi. II.Sporocarp phenology in a western Oregon Douglas-fir stand.Can. J. Bot.54: 1152–1162.
Fogel, R., and Hunt, G.A. 1979. Fungal and arboreal biomass in awestern Oregon Douglas-fir ecosystem: distribution patterns andturnover. Can. J. For. Res.9: 245–256.
Fox, F.M. 1986. Groupings of ectomycorrhizal fungi of birchand pine, based on establishment of mycorrhizas on seedlingsfrom spores in unsterile soils. Trans. Br. Mycol. Soc.87:371–380.
Franklin, J.F., and Dyrness, C.T. 1984. Forest zones of westernWashington and northwestern Oregon.In Natural vegetation ofOregon and Washington. Oregon State University Press,Corvallis, Oreg. pp. 53–109.
Gardes, M., and Bruns, T.D. 1996. ITS-RFLP matching for iden-tification of fungi. In Methods in molecular biology. Vol. 50.Edited byE.J. Clapp. Humana Press Inc., Totowa, N.J.
Gehring, C.A., Theimer, T.C., Whitham, T.G., and Keim, P. 1998.Ectomycorrhizal fungal community structure of pinyon pinesgrowing in two environmental extremes. Ecology,79:1562–1572.
Harmon, M.E., Sexton, J., Caldwell, B.A., and Carpenter, S.E.1994. Fungal sporocarp mediated losses of Ca, Fe, Mg, N, P,and Zn from conifer logs in the early stages of decomposition.Can. J. For. Res.24: 1883–1893.
Hemstrom, M.A., Logan, S.E., and Pavlat, W. 1987. Plant associa-tion and management guide: Willamette National Forest. U.S.For. Serv. Pac. NW Reg. R6-Ecol 257-B-86.
Horton, T.R., and Bruns, T.E. 2001. The molecular revolution inectomycorrhizal ecology: peeking into the black-box. Mol. Ecol.10: 1855–1871.
Hunt, G.A., and Trappe, J.M. 1987. Seasonal hypogeous sporocarpproduction in a western Oregon Douglas-fir stand. Can. J. Bot.65: 438–445.
Ingham, E.R., and Molina, R. 1991. Interactions amongmycorrhizal fungi, rhizosphere organisms, and plants.In Micro-bial mediation of plant–herbivore interactions.Edited by P.
© 2002 NRC Canada
Smith et al. 201
J:\cjb\cjb80\cjb-02\B02-003.vpMonday, February 25, 2002 9:55:20 AM
Color profile: Generic CMYK printer profileComposite Default screen
Barbosa, V.A. Kirsk, and C.G. Jones. John Wiley & Sons, Inc.,New York. pp.169–197.
Jonsson, L., Dahlberg, A., Nilsson, M.-C., Zackrisson, O., andKårén, O. 1999. Ectomycorrhizal fungal communities inlate-successional Swedish boreal forests, and their compositionfollowing wildfire. Mol. Ecol. 8: 205–215.
Kårén, O., Högberg, N., Dahlberg, A., Jonsson, L., and Nylund,J.E. 1997. Inter- and intraspecific variation in the ITS region ofrDNA of ectomycorrhizal fungi in Fennoscandia as detected byendonuclease analysis. New Phytol.136: 313–325.
Kuyper, T.W. 1986. A revision of the genusInocybein Europe. I.SubgenusInospermaand the smooth-spored species of subgenusInocybe. Persoonia Suppl.3: 1–247.
Last, F.T., Mason, P.A., Ingleby, K., and Fleming, L.V. 1984.Succession of fruiting bodies of sheathing mycorrhizal fungiassociated withBetula pendula. For. Ecol. Manage.9:229–234.
Last, F.T., Dighton, J., and Mason, P.A. 1987. Successions ofsheathing mycorrhizal fungi. Trends Ecol. Evol.6: 157–161.
Logan, S.E., Hemstrom, M.A., and Pavlat, W. 1987. Plant associa-tion and management guide: Willamette National Forest. U.S.For. Serv. Pac. NW Reg. R6-Ecol 257-A-86.
Luoma, D.L. 1989. Biomass and community structure of sporo-carps formed by hypogeous ectomycorrhizal fungi within se-lected forest habitats of the H.J. Andrews Experimental Forest,Oregon. Ph.D. thesis, Department of Geography, Oregon StateUniversity, Corvallis, Oreg.
Luoma, D.L. 1991. Annual changes in seasonal production ofhypogeous sporocarps in Oregon Douglas-fir forests.In Wildlifehabitat relationships in old-growth Douglas-fir forests.Coordi-nated by L.F. Ruggiero, K.B. Aubry, A.B. Carey, and M.H.Huff. U.S. For. Serv. Gen. Tech. Rep. No. PNW-GTR-285.pp. 83–89.
Luoma, D.L., Frenkel, R.E., and Trappe, J.M. 1991. Fruiting ofhypogeous sporocarps in Oregon Douglas-fir forests: seasonaland habitat variation. Mycologia,83: 335–353.
Magurran, A.E. 1988. Ecological diversity and its measurement.Princeton University Press, Princeton, N.J.
Maser, C., Trappe, J.M., and Nussbaum, R.A. 1978. Fungal – smallmammal interrelationships with emphasis on Oregon coniferousforests. Ecology,59: 799–809.
McKee, A., and Bierlmaier, F.A. 1987. H.J. Andrews ExperimentalForest, Oregon.In The climate of long-term ecological researchsites.Edited byD. Greenland. Occas. Pap. 44. Institute of Arcticand Alpine Research, University of Colorado, Boulder, Co.pp. 11–17.
Molina, R., and Trappe, J. M. 1982. Patterns of ectomycorrhizalhost specificity and potential among Pacific Northwest conifersand fungi. For. Sci.28: 423–458.
Molina, R., Massicotte, H., and Trappe, J.M. 1992. Specificityphenomena in mycorrhizal symbioses: community-ecologicalconsequences and practical implications.In Mycorrhizal func-tioning: an integrative plant–fungal process.Edited byM.F. Al-len. Chapman and Hall, New York. pp. 357–423.
Molina, R., Trappe, J.M., Grubisha, L.C., and Spatafora, J.W.1999.Rhizopogon. In Ectomycorrhizal fungi: key genera in pro-file. Edited by W.G. Cairney and S.M. Chambers.Springer-Verlag, Berlin. pp. 129–161.
Molina, R., Pilz, D., Smith, J., Dunham, S., Dreisbach, T.,O’Dell, T., and Castellano, M. 2001. Conservation and man-agement of forest fungi in the Pacific Northwestern UnitedStates: an integrated ecosystem approach.In Fungal conserva-tion: issues and solutions.Edited byD. Moore, M.M. Nauta,
and M. Rotheroe. Cambridge University Press, Cambridge, U.K.pp. 19–63.
Moser, M. 1983. Keys to agarics and boleti. 4th ed. Roger Phillips,London, U.K.
North, M., Trappe, J., and Franklin, J. 1997. Standing crop and an-imal consumption of fungal sporocarps in Pacific Northwest for-ests. Ecology,78: 1543–1554.
O’Dell, T.E., Luoma, D.L., and Molina, R.J. 1992. Ectomycorrhizalfungal communities in young, managed, and old-growthDouglas-fir stands. Northwest Environ. J.8: 166–168.
O’Dell, T.E., Smith, J.E., Castellano, M., and Luoma, D. 1996. Di-versity and conservation of forest fungi.In Managing forest eco-systems to conserve fungal diversity and sustain wild mushroomharvests.Edited byD. Pilz and R. Molina. U.S. For. Serv. Gen.Tech. Rep. No. PNW-GTR-371. pp. 5–18.
O’Dell, T.E., Ammirati, J.F., and Schreiner, E.G. 1999. Speciesrichness and abundance of ectomycorrhizal basidiomycetesporocarps on a moisture gradient in theTsuga heterophyllazone. Can. J. Bot.77: 1699–1711.
Perry, D.A., Amaranthus, M.P., Borchers, J.G., Borchers, S.L., andBrainerd, R.E. 1989. Bootstrapping in ecosystems. BioScience,39: 230–237.
Richardson, M.J. 1970. Studies ofRussula emiticaand otheragarics in a Scots pine plantation. Trans. Br. Mycol. Soc.55:217–229.
SAS Institute Inc. 1996. SAS®: system for mixed models. SAS In-stitute Inc., Cary, N.C.
Smith, A.H. 1975. A field guide to mushrooms. University ofMichigan Press, Ann Arbor, Mich.
Smith, J.E., and Lebel, T. 2001. A comparison of taxonomickeys to species within the genusRussula. McIlvainea. 15:9–22.
Smith, J.E., Molina, R., Huso, M.M.P., and Larsen, M.J. 2000.Occurrence ofPiloderma fallax in young, rotation-age, andold-growth stands of Douglas-fir (Pseudotsuga menziesii) inthe Cascade Range of Oregon, U.S.A. Can. J. Bot.78:995–1001.
Spies, T.A. 1991. Plant species diversity and occurrence in young,mature, and old-growth Douglas-fir stands in western Oregonand Washington.In Wildlife habitat relationships in old-growthDouglas-fir forests.Coordinated byL.F. Ruggiero, K.B. Aubry,A.B. Carey, and M.H. Huff. U.S. For. Serv. Gen. Tech. Rep. No.PNW-GTR-285. pp. 111–121.
Spies, T.A., and Franklin, J.F. 1991. The structure of naturalyoung, mature, and old-growth Douglas-fir forests in Oregonand Washington.In Wildlife habitat relationships in old-growthDouglas-fir forests.Coordinated byL.F. Ruggiero, K.B. Aubry,A.B. Carey, and M.H. Huff. U.S. For. Serv. Gen. Tech. Rep. No.PNW-GTR-285. pp. 91–109.
States, J.S., and Gaud, W.S. 1997. Ecology of hypogeous fungi as-sociated with ponderosa pine. I. Patterns of distribution andsporocarp production in some Arizona forests. Mycologia,89:712–721.
Stuntz, D.E. 1965.Inocybe (Fries) Fries, subgenusInocybium(Earle) Singer, sectionInocybiumStuntz. University of Wash-ington, Seattle, Wash.
Termorshuizen, A.J. 1991. Succession of mycorrhizal fungi instands ofPinus sylvestrisin the Netherlands. J. Veg. Sci.2:555–564.
Thiers, H.D. 1994. The subgenus Compactae ofRussulain Califor-nia. Mycol. Helv.6: 107–120.
Thiers, H.D. 1997a. The agaricales (gilled fungi) of California. 9.Russulaceae. I.Russula. Mad River Press, Inc., Eureka, Calif.
© 2002 NRC Canada
202 Can. J. Bot. Vol. 80, 2002
J:\cjb\cjb80\cjb-02\B02-003.vpMonday, February 25, 2002 9:55:20 AM
Color profile: Generic CMYK printer profileComposite Default screen
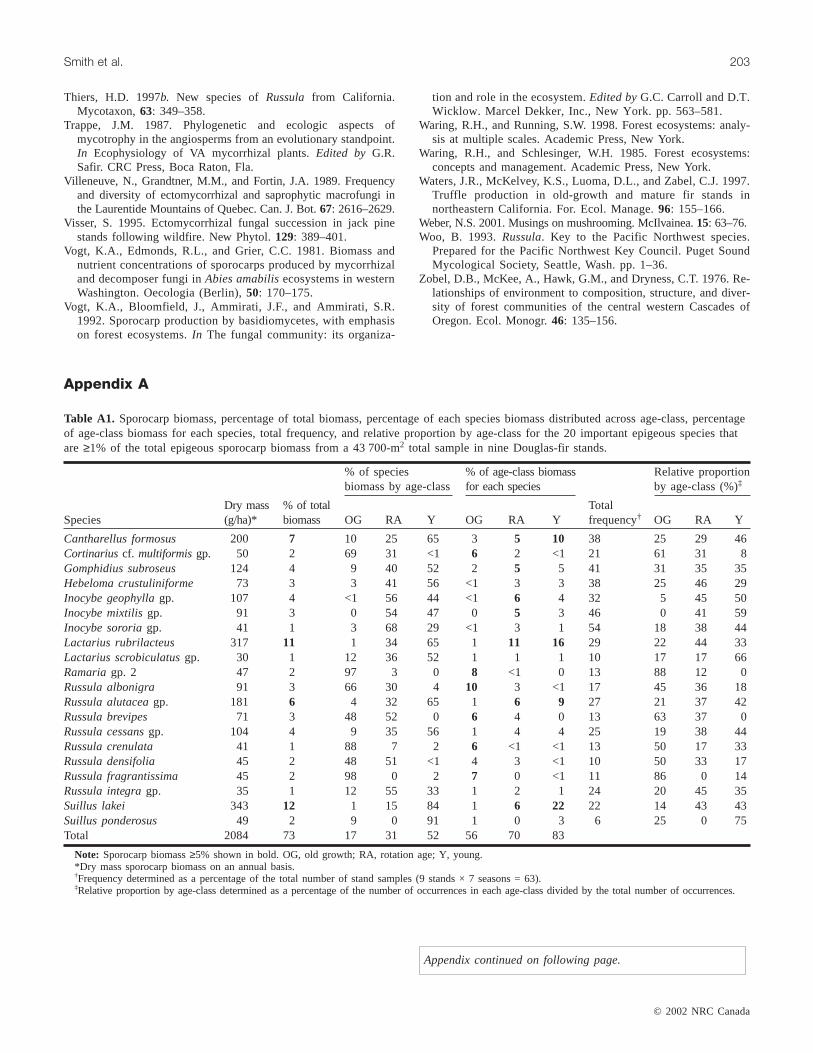
© 2002 NRC Canada
Smith et al. 203
Thiers, H.D. 1997b. New species ofRussula from California.Mycotaxon,63: 349–358.
Trappe, J.M. 1987. Phylogenetic and ecologic aspects ofmycotrophy in the angiosperms from an evolutionary standpoint.In Ecophysiology of VA mycorrhizal plants.Edited by G.R.Safir. CRC Press, Boca Raton, Fla.
Villeneuve, N., Grandtner, M.M., and Fortin, J.A. 1989. Frequencyand diversity of ectomycorrhizal and saprophytic macrofungi inthe Laurentide Mountains of Quebec. Can. J. Bot.67: 2616–2629.
Visser, S. 1995. Ectomycorrhizal fungal succession in jack pinestands following wildfire. New Phytol.129: 389–401.
Vogt, K.A., Edmonds, R.L., and Grier, C.C. 1981. Biomass andnutrient concentrations of sporocarps produced by mycorrhizaland decomposer fungi inAbies amabilisecosystems in westernWashington. Oecologia (Berlin),50: 170–175.
Vogt, K.A., Bloomfield, J., Ammirati, J.F., and Ammirati, S.R.1992. Sporocarp production by basidiomycetes, with emphasison forest ecosystems.In The fungal community: its organiza-
tion and role in the ecosystem.Edited byG.C. Carroll and D.T.Wicklow. Marcel Dekker, Inc., New York. pp. 563–581.
Waring, R.H., and Running, S.W. 1998. Forest ecosystems: analy-sis at multiple scales. Academic Press, New York.
Waring, R.H., and Schlesinger, W.H. 1985. Forest ecosystems:concepts and management. Academic Press, New York.
Waters, J.R., McKelvey, K.S., Luoma, D.L., and Zabel, C.J. 1997.Truffle production in old-growth and mature fir stands innortheastern California. For. Ecol. Manage.96: 155–166.
Weber, N.S. 2001. Musings on mushrooming. McIlvainea.15: 63–76.Woo, B. 1993.Russula. Key to the Pacific Northwest species.
Prepared for the Pacific Northwest Key Council. Puget SoundMycological Society, Seattle, Wash. pp. 1–36.
Zobel, D.B., McKee, A., Hawk, G.M., and Dryness, C.T. 1976. Re-lationships of environment to composition, structure, and diver-sity of forest communities of the central western Cascades ofOregon. Ecol. Monogr.46: 135–156.
% of speciesbiomass by age-class
% of age-class biomassfor each species
Relative proportionby age-class (%)‡
SpeciesDry mass(g/ha)*
% of totalbiomass OG RA Y OG RA Y
Totalfrequency† OG RA Y
Cantharellus formosus 200 7 10 25 65 3 5 10 38 25 29 46Cortinarius cf. multiformisgp. 50 2 69 31 <1 6 2 <1 21 61 31 8Gomphidius subroseus 124 4 9 40 52 2 5 5 41 31 35 35Hebeloma crustuliniforme 73 3 3 41 56 <1 3 3 38 25 46 29Inocybe geophyllagp. 107 4 <1 56 44 <1 6 4 32 5 45 50Inocybe mixtilisgp. 91 3 0 54 47 0 5 3 46 0 41 59Inocybe sororiagp. 41 1 3 68 29 <1 3 1 54 18 38 44Lactarius rubrilacteus 317 11 1 34 65 1 11 16 29 22 44 33Lactarius scrobiculatusgp. 30 1 12 36 52 1 1 1 10 17 17 66Ramariagp. 2 47 2 97 3 0 8 <1 0 13 88 12 0Russula albonigra 91 3 66 30 4 10 3 <1 17 45 36 18Russula alutaceagp. 181 6 4 32 65 1 6 9 27 21 37 42Russula brevipes 71 3 48 52 0 6 4 0 13 63 37 0Russula cessansgp. 104 4 9 35 56 1 4 4 25 19 38 44Russula crenulata 41 1 88 7 2 6 <1 <1 13 50 17 33Russula densifolia 45 2 48 51 <1 4 3 <1 10 50 33 17Russula fragrantissima 45 2 98 0 2 7 0 <1 11 86 0 14Russula integragp. 35 1 12 55 33 1 2 1 24 20 45 35Suillus lakei 343 12 1 15 84 1 6 22 22 14 43 43Suillus ponderosus 49 2 9 0 91 1 0 3 6 25 0 75Total 2084 73 17 31 52 56 70 83
Note: Sporocarp biomass≥5% shown in bold. OG, old growth; RA, rotation age; Y, young.*Dry mass sporocarp biomass on an annual basis.†Frequency determined as a percentage of the total number of stand samples (9 stands × 7 seasons = 63).‡Relative proportion by age-class determined as a percentage of the number of occurrences in each age-class divided by the total number of occurrences.
Table A1. Sporocarp biomass, percentage of total biomass, percentage of each species biomass distributed across age-class, percentageof age-class biomass for each species, total frequency, and relative proportion by age-class for the 20 important epigeous species thatare ≥1% of the total epigeous sporocarp biomass from a 43 700-m2 total sample in nine Douglas-fir stands.
Appendix A
Appendix continued on following page.
J:\cjb\cjb80\cjb-02\B02-003.vpMonday, February 25, 2002 9:55:21 AM
Color profile: Generic CMYK printer profileComposite Default screen

© 2002 NRC Canada
204 Can. J. Bot. Vol. 80, 2002
% of species biomassby age-class
% of age-class biomassfor each species
Relative proportionby age-class (%)‡
SpeciesDry mass(g/ha)*
% of totalbiomass OG RA Y OG RA Y
Totalfrequency† OG RA Y
Elaphomyces granulatus 1623 3 93 6 1 25 1 <1 14 78 11 11Gautieria monticola 1310 25 2 55 43 3 33 23 38 21 50 29Hysterangium coriaceum 309 6 12 40 48 6 6 6 35 18 41 41Hysterangium crassirhachis 2017 39 1 40 59 3 37 49 68 12 40 49Hysterangium setchellii 285 6 12 70 19 5 9 2 37 26 52 22Radiigera taylori 77 2 11 29 59 1 1 2 35 14 36 50Rhizopogon parksii 241 5 21 31 48 8 4 5 43 33 30 37Rhizopogon vinicolor 342 7 37 35 29 21 5 4 46 31 34 34Truncocolumella citrina 139 3 14 23 63 3 1 4 37 35 22 43Total 4882 94 9 44 47 76 97 95
Note: Sporocarp biomass≥5% shown in bold. OG, old-growth; RA, rotation-age; Y, young.*Dry mass sporocarp biomass on an annual basis.†Frequency determined as a percentage of the total number of stand samples (9stands x 7seasons = 63)‡Relative proportion by age-class determined as a percentage of the number of occurrences in each age-class divided total number of occurrences.
Table A2. Sporocarp biomass, percentage of total biomass, percentage of each species biomass distributed across age-class, percentage ofage-class biomass for each species, total frequency, and relative proportion by age-class for the nine hypogeous species that are≥1% ofthe total hypogeous sporocarp biomass from a 6300-m2 total sample in nine Douglas-fir stands.
J:\cjb\cjb80\cjb-02\B02-003.vpMonday, February 25, 2002 9:55:22 AM
Color profile: Generic CMYK printer profileComposite Default screen