drivers of credit losses in australasian banking slides prepared by kurt hess university of waikato...
TRANSCRIPT

Drivers of Credit Losses in Australasian Banking
Slides prepared by Kurt Hess
University of Waikato Management School, Department of Finance
Hamilton, New Zealand

Apr 19, 2023 Kurt Hess, WMS [email protected]
2
MotivationLiterature reviewCredit loss data AustralasiaMethodological issuesResultsConclusions
Topics

Apr 19, 2023 Kurt Hess, WMS [email protected]
3
Motivation Stability and integrity of banking
systems are of utmost importance to national economies
Credit losses, or more generally, asset quality problems have repeatedly been identified as the ultimate trigger of bank failures [e.g. in Graham & Horner (1988), Caprio & Klingebiel (1996)]
Apr 19, 2023 Kurt Hess, WMS [email protected]
4
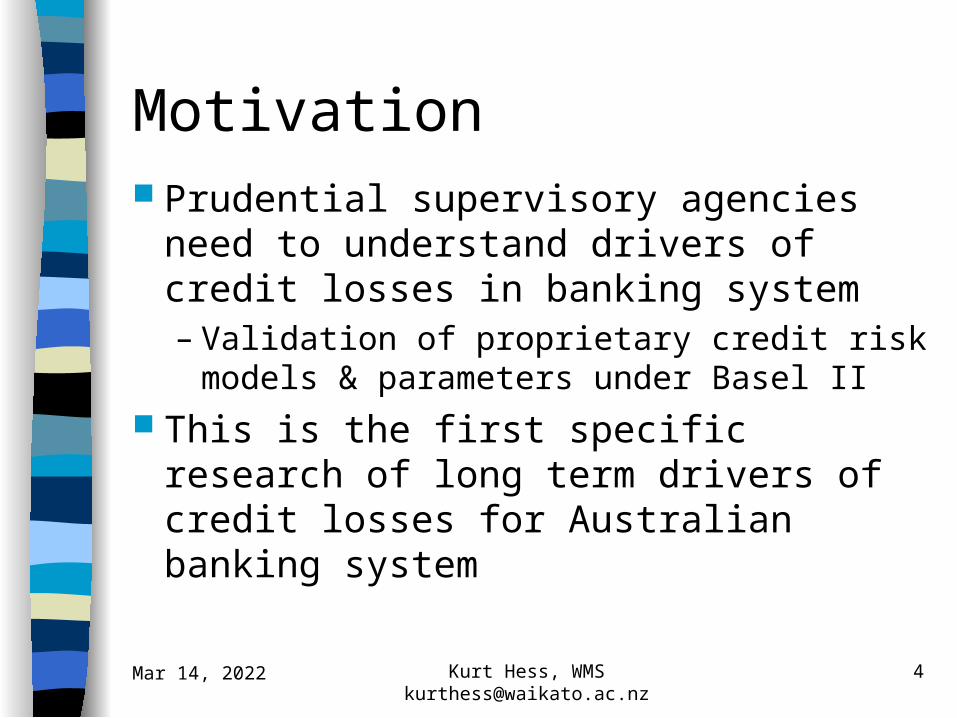
Motivation Prudential supervisory agencies need to
understand drivers of credit losses in banking system– Validation of proprietary credit risk models
& parameters under Basel II This is the first specific research of long
term drivers of credit losses for Australian banking system

Apr 19, 2023 Kurt Hess, WMS [email protected]
5
Literature review
1. Literature with regulatory focus looks at macro & micro factors
2. Literature looks discretionary nature of loan loss provisions and behavioural factors which affect them
Two main streams of research that analyse drivers of banks’ credit losses (or more specifically loan losses):

Apr 19, 2023 Kurt Hess, WMS [email protected]
6
Literature review
Behavioural hypotheses in the literature on the discretionary nature of loan loss provisions
– Income smoothing:Greenawalt & Sinkey (1988)
– Capital management: Moyer (1990)– Signalling: Akerlof (1970), Spence (1973)– Taxation Management

Apr 19, 2023 Kurt Hess, WMS [email protected]
7
Literature review Studies with global samples (using
commercial data providers):– Cavallo & Majnoni (2001),
Bikker & Metzemakers (2003)
Country-specific samples– Austria: Arpa et al. – (2001)– Italy: Quagliarello (2004)– Australia: Esho & Liaw (2002)
(in this APRA report the authors study level of impaired assets for loans in Basel I risk buckets for 16 Australian banks 1991 to 2001)
Apr 19, 2023 Kurt Hess, WMS [email protected]
8
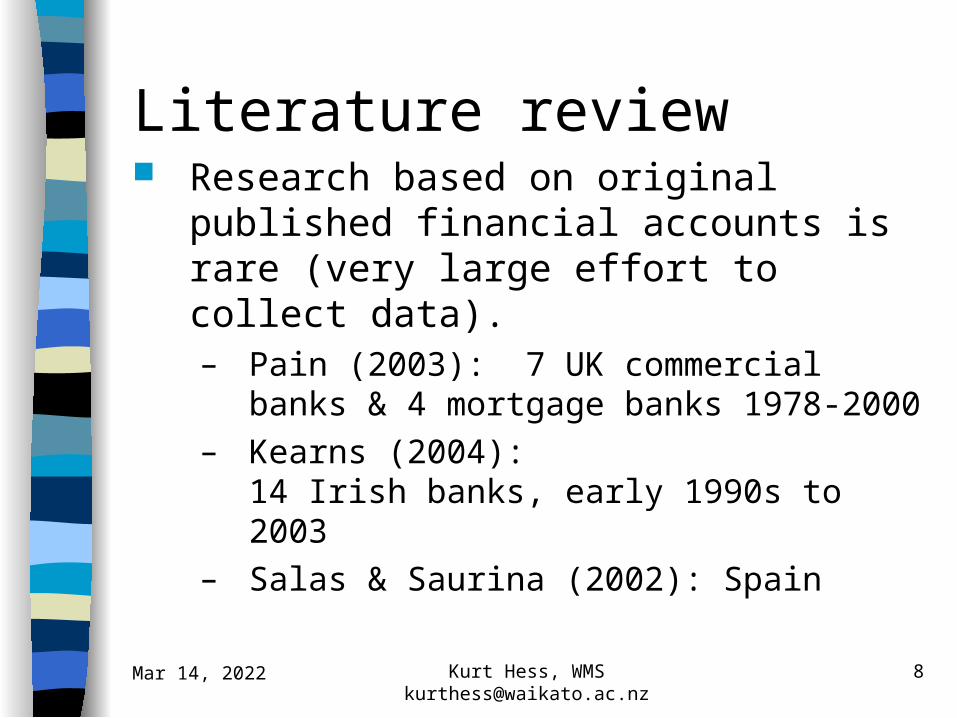
Literature review Research based on original published
financial accounts is rare (very large effort to collect data).– Pain (2003): 7 UK commercial banks &
4 mortgage banks 1978-2000– Kearns (2004):
14 Irish banks, early 1990s to 2003– Salas & Saurina (2002): Spain
Apr 19, 2023 Kurt Hess, WMS [email protected]
9
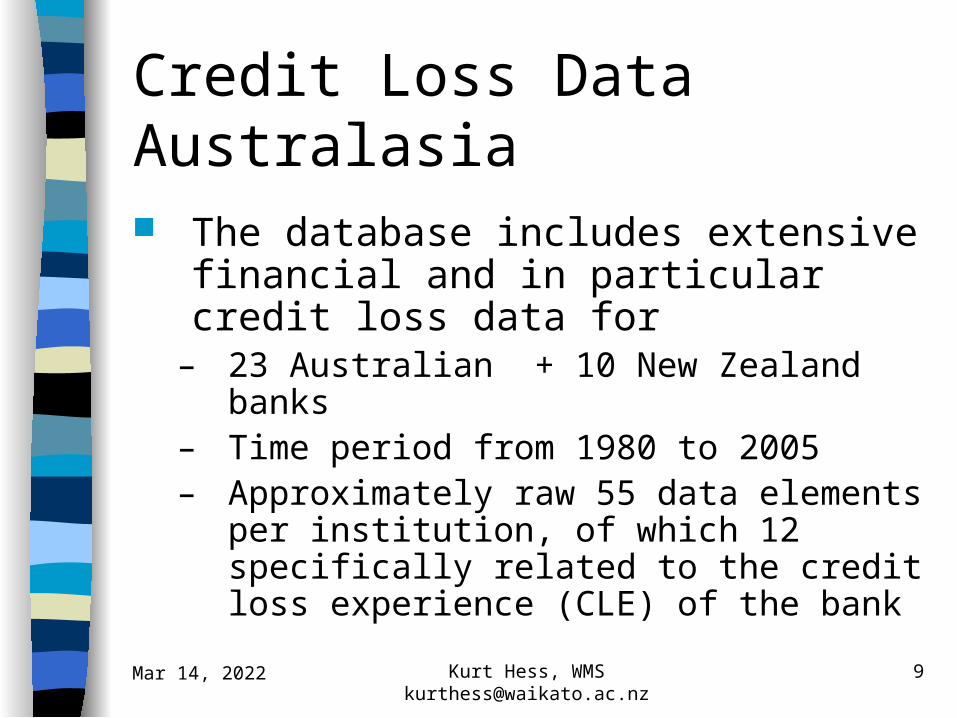
Credit Loss Data Australasia
The database includes extensive financial and in particular credit loss data for
– 23 Australian + 10 New Zealand banks– Time period from 1980 to 2005– Approximately raw 55 data elements per
institution, of which 12 specifically related to the credit loss experience (CLE) of the bank
Apr 19, 2023 Kurt Hess, WMS [email protected]
10
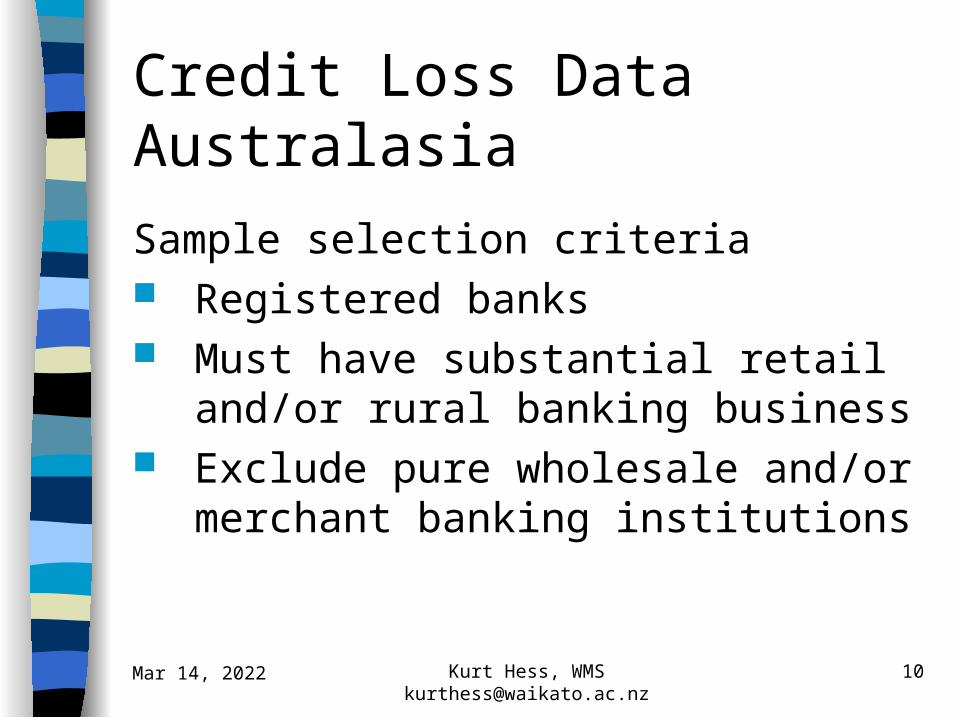
Credit Loss Data Australasia
Sample selection criteria Registered banks Must have substantial retail and/or
rural banking business Exclude pure wholesale and/or
merchant banking institutions

Apr 19, 2023 Kurt Hess, WMS [email protected]
11
Credit Losses and GDP Growth (New Zealand Banks)
Total Stock of Loan Loss Provisions as % of Loan Assets(excluding BNZ and Rural Bank)
0.0%
0.5%
1.0%
1.5%
2.0%
2.5%
Net Write offs/ Avg Loans(excl BNZ, Rural Bk)
Charge to P&L/ Avg Loans(excl BNZ, Rural Bk)
-5.0%
0.0%
5.0%
10.0%
GDP YoY% Real
Annual Debt Write-offs and Charges to P&L as % of Loan Assets(excluding BNZ and Rural Bank)
0.0%0.2%0.4%0.6%0.8%1.0%1.2%1.4%1.6%
19
80
19
81
19
82
19
83
19
84
19
85
19
86
19
87
19
88
19
89
19
90
19
91
19
92
19
93
19
94
19
95
19
96
19
97
19
98
19
99
20
00
20
01
20
02
Net Write offs/ Avg Loans(excl BNZ, Rural Bk)
Charge to P&L/ Avg Loans(excl BNZ, Rural Bk)
Provisioning/write-off behaviour correlated to macro factors
Note: chart for NZ Bank sub-sample only

Apr 19, 2023 Kurt Hess, WMS [email protected]
12
Credit Loss Data Australasia
AU ANZ, 1993, 2.6%
AU CoWthBk, 1993, 2.5%
AU Westpac, 1993, 3.7%
0.0%
0.5%
1.0%
1.5%
2.0%
2.5%
3.0%
3.5%
4.0%
1980 1985 1990 1995 2000
AU ANZ
AU CoWthBk
AU NAB
AU Westpac
(on average loans, annualized)
Drivers of Credit Losses in Australasian Banking
Methodology

Apr 19, 2023 Kurt Hess, WMS [email protected]
14
Principal Model
1,...., ;1,.....,
;q
1s)(
1k 0s)(
Tqtni
uCLExConstCLE itstis
K z
stkiksit
k
CLEit Credit loss experience for bank i in period txkit Observations of the potential explanatory variable k for bank i
and period tuit Random error term with distribution N(0,), Variance-covariance matrix of it error termsn Number of banks in sampleT Years in observation periodK Number of explanatory variableszk Maximum lag of the explanatory variable k of the modelq Maximum lag of the dependent variable of the model

Apr 19, 2023 Kurt Hess, WMS [email protected]
15
Principal Model
Principal model on previous slide allows for many potential functional forms.
There are choices with regard to– Dependent CLE proxy– Suitable drivers of credit losses and lags
for these drivers– Estimation techniques

Apr 19, 2023 Kurt Hess, WMS [email protected]
16
Determinants of Credit LossesMacro Factors (1)
Real GDP growth -ve Ability of borrowers to service debt determined by the economic cycle.
Unemployment rate
+ve Unemployment rate not only reflects the business cycle (like GDP growth) but also longer term and structural imbalances in economy.
Liabilities of households/firms as % of disp. income
+ve The more households and firms in the system are indebted, the more financially vulnerable they will be.

Apr 19, 2023 Kurt Hess, WMS [email protected]
17
Determinants of Credit LossesMacro Factors (2)
Asset prices / interest rates
Disturbances in the asset markets can impair the value of banks’ assets both directly and indirectly (i.e. through reduced collateral values). Experience shows that especially the property sector and the share markets may play a critical role in triggering losses in the banking system. Similar effects are expected in a volatile interest rate environment.
Housing price index (changes)
-ve
Return leading share indices
-ve
Change real/nominal interest ratesonly CPI growth
+ve
Apr 19, 2023 Kurt Hess, WMS [email protected]
18
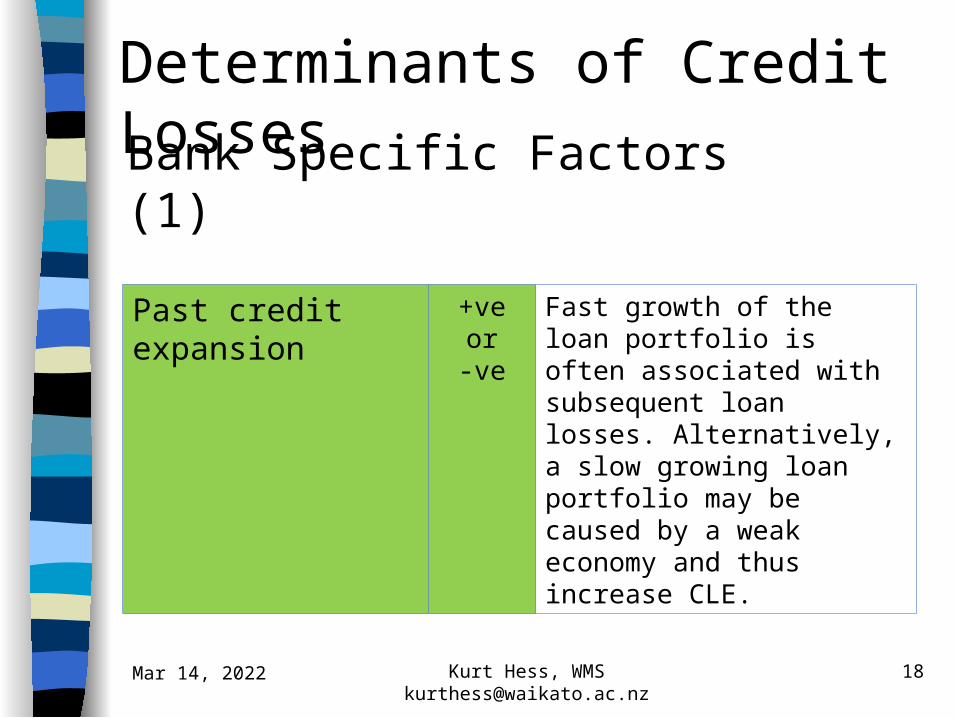
Determinants of Credit LossesBank Specific Factors (1)
Past credit expansion
+veor-ve
Fast growth of the loan portfolio is often associated with subsequent loan losses. Alternatively, a slow growing loan portfolio may be caused by a weak economy and thus increase CLE.
Apr 19, 2023 Kurt Hess, WMS [email protected]
19
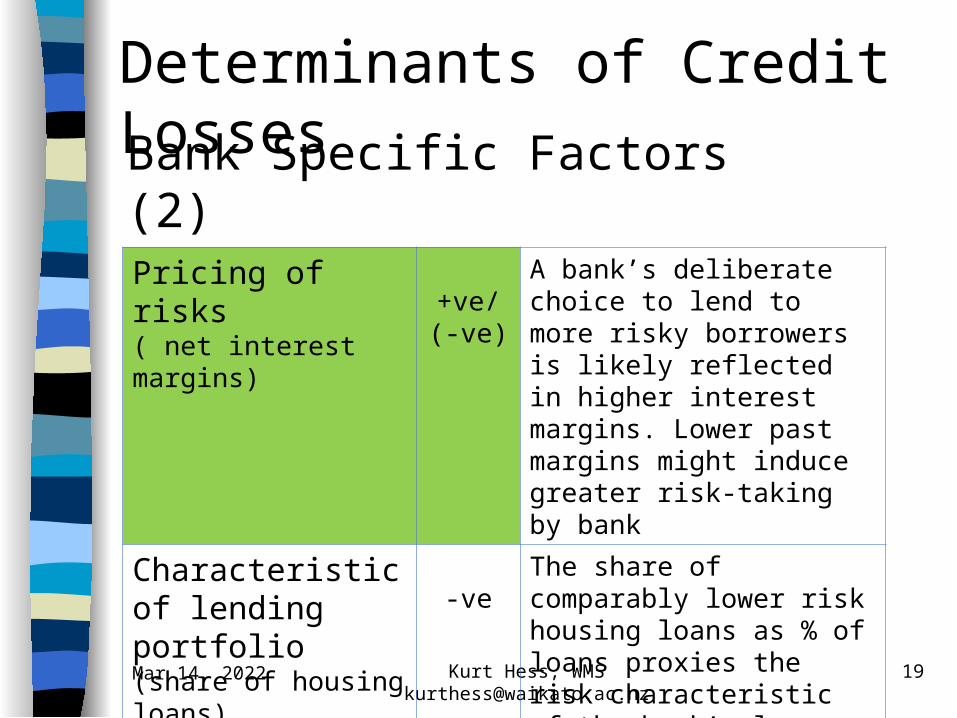
Determinants of Credit LossesBank Specific Factors (2)
Pricing of risks( net interest margins) +ve/
(-ve)
A bank’s deliberate choice to lend to more risky borrowers is likely reflected in higher interest margins. Lower past margins might induce greater risk-taking by bank
Characteristic of lending portfolio(share of housing loans)
-veThe share of comparably lower risk housing loans as % of loans proxies the risk characteristic of the bank’s loan portfolio.

Apr 19, 2023 Kurt Hess, WMS [email protected]
20
Determinants of Credit LossesBank Specific Factors (3)Diversification
Market power
-ve
+ve/(-ve)
A bank’s assets in proportion to the overall banking system assets provides a crude proxy for loan portfolio diversification or market power
Cost efficiency(cost-income ratio)
+ve/(-ve)
Inefficient banks can be expected to suffer greater credit losses. Alternatively, such banks could maintain an expensive credit monitoring procedure and will thus exhibit lower credit losses.
Apr 19, 2023 Kurt Hess, WMS [email protected]
21
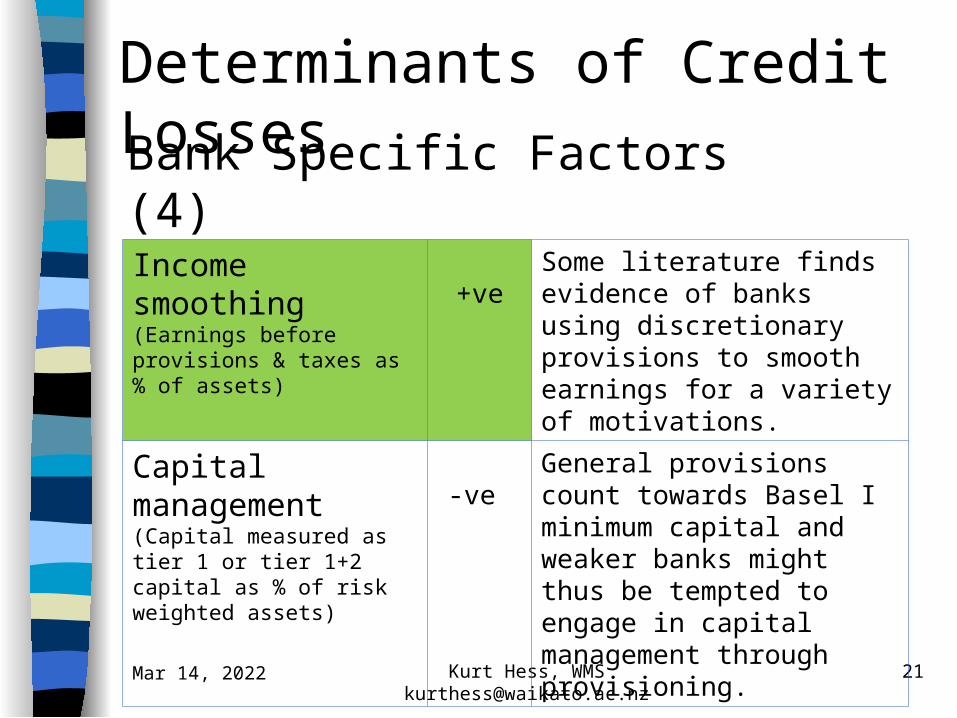
Determinants of Credit LossesBank Specific Factors (4)
Income smoothing(Earnings before provisions & taxes as % of assets)
+veSome literature finds evidence of banks using discretionary provisions to smooth earnings for a variety of motivations.
Capital management(Capital measured as tier 1 or tier 1+2 capital as % of risk weighted assets)
-ve General provisions count towards Basel I minimum capital and weaker banks might thus be tempted to engage in capital management through provisioning.

Apr 19, 2023 Kurt Hess, WMS [email protected]
22
Pooled regression model as per equation 1 in paper Dependent
– Impaired asset expense as CLE proxy Determinants (as per table next slide)
– Alternative macro factors: GDP growth, unemployment rate
– Alternative asset shock proxies: share index, house prices
– Misc. bank-specific proxies – Bank past growth

Apr 19, 2023 Kurt Hess, WMS [email protected]
23
Dependent variables in model
Variable Description Lags (yrs.)
GDPGRWUNEMP
Macro state proxies: GDP growth or level/change Unemployment rate
0 to -2
RET_SHINDX HPGRW
Asset price shock proxies: Return share index or change house prices
0 to -2
CPIGRW Change CPI 0 to -2
SH_SYSLNS Share of system loans (size proxy) 0
NIM Net interest margin 0 to -2
CIR Cost-income ratio 0 to -2
EBTP_AS Pre-provision/tax earnings / assets 0 to -2
ASGRW Bank past asset growth 0 to -4
Agg
rega
teB
anks
peci
fic

Drivers of Credit Losses in Australasian Banking
Empirical results

Apr 19, 2023 Kurt Hess, WMS [email protected]
25
Results macro state factors
GDP growth (GDPPGRW), change and level of the unemployment rate (UNEMP, UNEMP) have expected effect (not all lags significant)
Unemployment with best explanatory power for overall sample
see Table 8, 9,10 in papersee Table 8, 9,10 in paper

Apr 19, 2023 Kurt Hess, WMS [email protected]
26
Results macro state factors (2)
Country-specific differences between Australia and New Zealand– Australia’s results show much greater
sensitivities to GDP growth (see Table 9)– New Zealand results are less significant
and effects of GDP and UNEMP seem more delayed
see Table 8, 9,10 in papersee Table 8, 9,10 in paper

Apr 19, 2023 Kurt Hess, WMS [email protected]
27
Results asset price factors
Contemporaneous coefficient of share index return negative & significant for overall and Australia. Less significant for NZ.
Housing price index has less sigificanceIntuition: early 90s crises not rooted in particular problems of the housing sector
see Table 8, 9,10 in papersee Table 8, 9,10 in paper

Apr 19, 2023 Kurt Hess, WMS [email protected]
28
Results CPI growth
Positive, but not significant coefficients for most regressions, i.e. inflationary pressure tends to lift credit losses
Contemporaneous term negative and significant for Australian sub-sample, in line with evidence elsewhere that inflation may lead to temporary improvement of borrower quality (Tommasi, 1994)
see Table 8, 9,10 in papersee Table 8, 9,10 in paper

Apr 19, 2023 Kurt Hess, WMS [email protected]
29
Results size proxy
Higher level of provisioning for larger banks – no significance of coefficients, however
Intuition: portfolios of smaller institutions often dominated by (comparably) lower risk housing loans
see Table 8, 9,10 in papersee Table 8, 9,10 in paper

Apr 19, 2023 Kurt Hess, WMS [email protected]
30
Results net interest margin
Generally negative, contemporaneous and 2yr lagged term significant, i.e. – Lower past margins lead to higher subsequent
losses (induce risk taking)– Difficult to explain contemporaneous negative
term Inconclusive results also in comparable
studies, e.g. Salas & Saurina (2002) for Spain
see Table 8, 9,10 in papersee Table 8, 9,10 in paper

Apr 19, 2023 Kurt Hess, WMS [email protected]
31
Results net interest margin (2)
Endogenous nature of net interest margins as postulated by Ho & Saunders (1981) dealership model. Spread increases with …– Market power (inelastic demand)– Bank risk aversion– Larger size of transactions (loans/deposits)– Interest rate volatility
Net interest margins may thus control for other bank specific & market characteristics
see Table 8, 9,10 in papersee Table 8, 9,10 in paper
Apr 19, 2023 Kurt Hess, WMS [email protected]
32
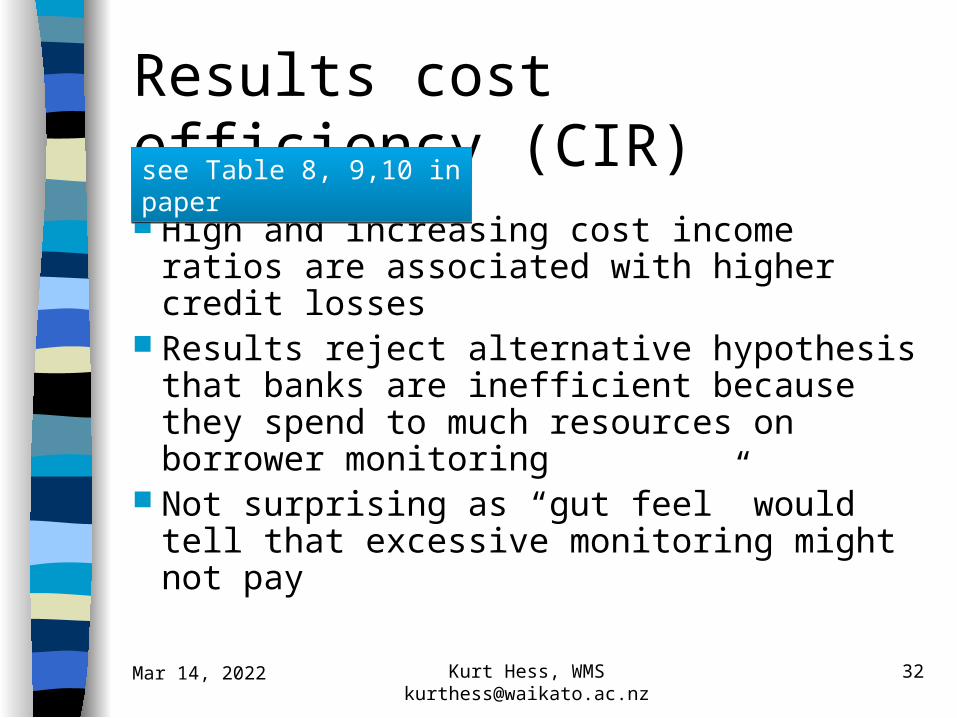
Results cost efficiency (CIR)
High and increasing cost income ratios are associated with higher credit losses
Results reject alternative hypothesis that banks are inefficient because they spend to much resources on borrower monitoring
Not surprising as “gut feel” would tell that excessive monitoring might not pay
see Table 8, 9,10 in papersee Table 8, 9,10 in paper

Apr 19, 2023 Kurt Hess, WMS [email protected]
33
Results earnings proxy
Very clear evidence of income smoothing activities, i.e. banks increase provisions in good years, withhold them in weak years.
Confirms similar results found in many other studies
see Table 8, 9,10 in papersee Table 8, 9,10 in paper
Apr 19, 2023 Kurt Hess, WMS [email protected]
34
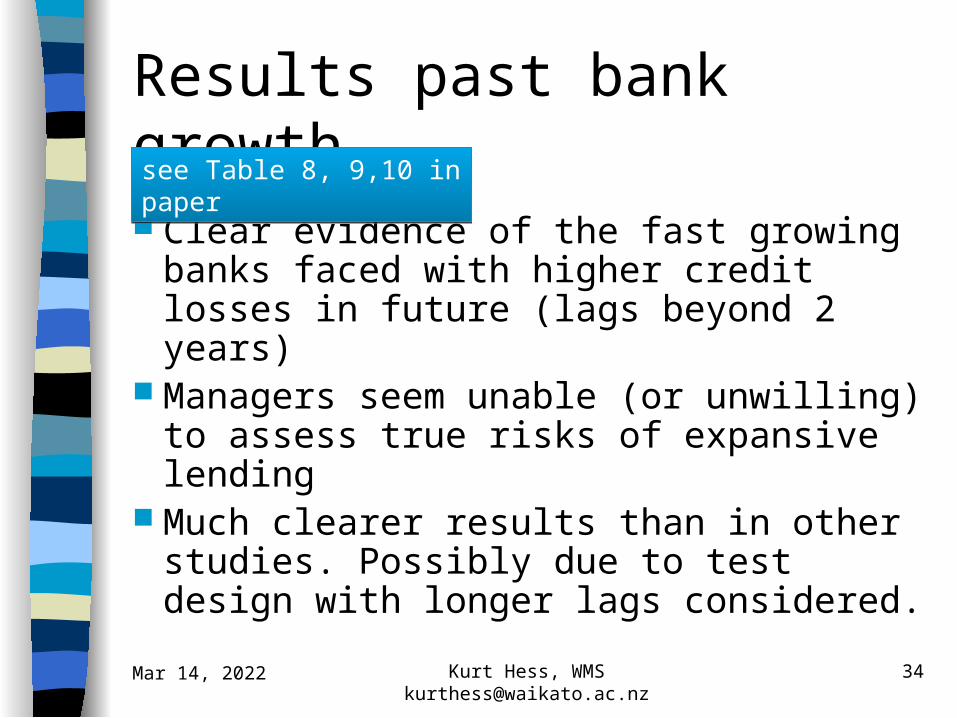
Results past bank growth
Clear evidence of the fast growing banks faced with higher credit losses in future (lags beyond 2 years)
Managers seem unable (or unwilling) to assess true risks of expansive lending
Much clearer results than in other studies. Possibly due to test design with longer lags considered.
see Table 8, 9,10 in papersee Table 8, 9,10 in paper

Apr 19, 2023 Kurt Hess, WMS [email protected]
35
Conclusions Model presented here is very suitable
for assessing general / global effects on impaired assets in the banking sector
The dynamics of this transmission seems to differ among systems
A study of particular effects might thus call for alternative models

Apr 19, 2023 Kurt Hess, WMS [email protected]
36
Conclusions (2) Income smoothing is a reality, possibly
also with new tighter IFRS provisioning rules as this ultimately remains a discretionary managerial decision

Apr 19, 2023 Kurt Hess, WMS [email protected]
37
Conclusions (3) Use data base for comparative studies
of alternative CLE dependent variables
First results show that they (in part) correlate rather poorly which means there must be caution comparing results of studies unless CLE is defined in exactly the same way

Credit Loss Experience of Australasian Banks
Back-up Slides

Apr 19, 2023 Kurt Hess, WMS [email protected]
39
Basel II PillarsPillar 1:
– Minimum capital requirementsPillar 2:
– A supervisory review processPillar 3:
– Market discipline (risk disclosure)

Apr 19, 2023 Kurt Hess, WMS [email protected]
40
Pages in New Basel Capital Accord (issued June 2004)
Basel II Pillars
Pillar 3 Market Discipline:16 of 216
pages
General: 6 of 216 pages
Pillar 2 Supervisory
Review Process: 15 of 216
pages
Pillar 1 Minimum
Capital Requirements
179 of 216 pages
Apr 19, 2023 Kurt Hess, WMS [email protected]
41
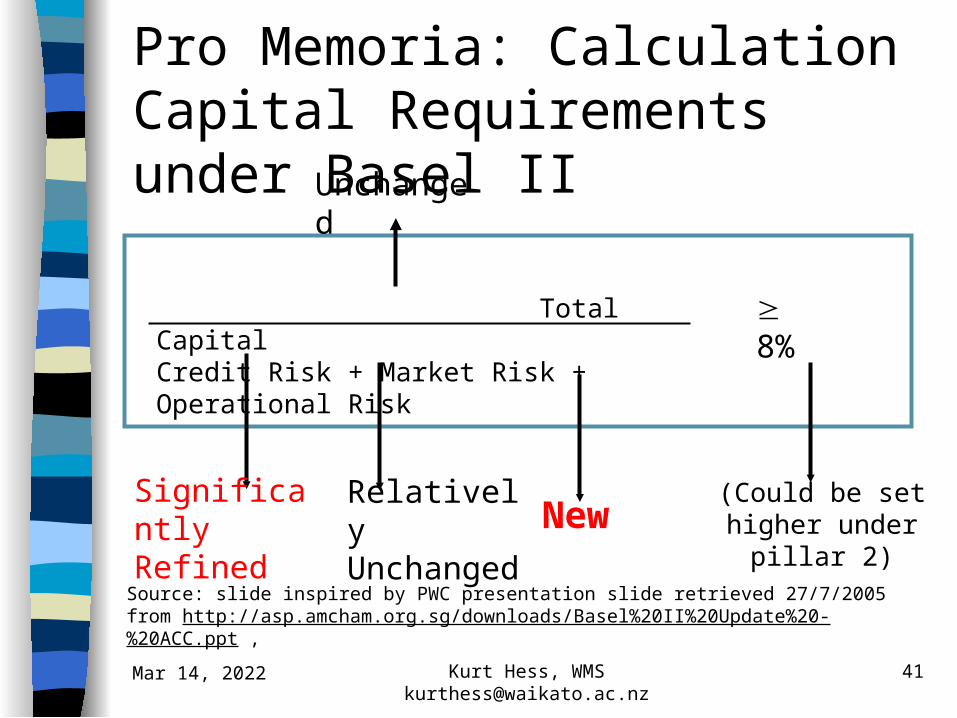
Pro Memoria: Calculation Capital Requirements under Basel II
Total CapitalCredit Risk + Market Risk + Operational Risk 8%
SignificantlyRefined
New
Unchanged
(Could be set higher under pillar 2)
RelativelyUnchanged
Source: slide inspired by PWC presentation slide retrieved 27/7/2005 from http://asp.amcham.org.sg/downloads/Basel%20II%20Update%20-%20ACC.ppt ,
Apr 19, 2023 Kurt Hess, WMS [email protected]
42
Basel II – IRB Approach
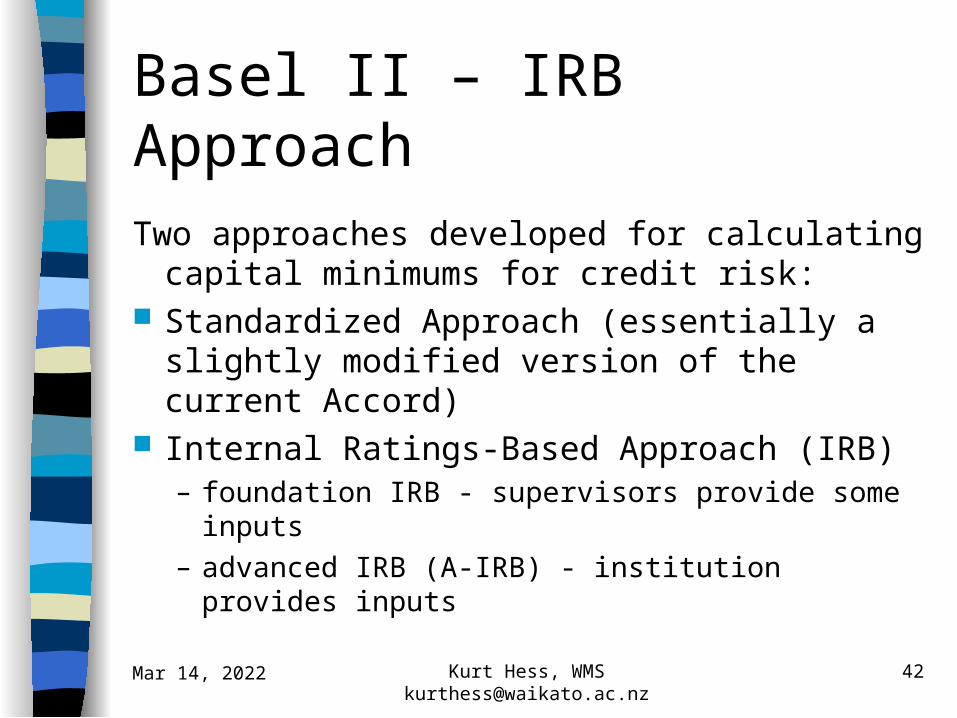
Two approaches developed for calculating capital minimums for credit risk:
Standardized Approach (essentially a slightly modified version of the current Accord)
Internal Ratings-Based Approach (IRB)– foundation IRB - supervisors provide some inputs– advanced IRB (A-IRB) - institution provides inputs

Apr 19, 2023 Kurt Hess, WMS [email protected]
43
Basel II – IRB Approach
Internal Ratings-Based Approach (IRB)– Under both the foundation and advanced
IRB banks are required to provide estimates for probability of default (PD)
– It is commonly known that macro factor are the main determinants of PD

Apr 19, 2023 Kurt Hess, WMS [email protected]
44
Primer Loan Loss AccountingBeginning of period Transactions during period End of period
Profit & loss statement (P&L) - Bad debt charge
Provision accountLoan balance Provisons initial balance Loan balanceGross loan amount + New provisions made Gross loan amount
- Debt write-offs + Recovery of debt previously written off
Net loan amount Provisons final balance Net loan amount
Gross loan accountOpening balance -/+ Loans issued/repaid - Debt write-offs + Recovery of debt previously written offEnding balance
- Provisions initial balance
- Provisions final balance

Apr 19, 2023 Kurt Hess, WMS [email protected]
45
Primer Loan Loss Accounting
Potential loan loss identified
Initiation of loan
Loan account
Cash account
Bad debt provision expense
1,000 +50950
1,000
General provision recognized
50
1,000 50 +350600
Additional specif ic provisons
Loan account
Bad debt provision expense
350
Loan write-off(derecognition)
1,000 400 - 400 - 400
600
Loan recovery
600 + 700 + 100
-
700
Cash account
Bad debt provisionrecovery income
- 100
Loan account Loan account

Apr 19, 2023 Kurt Hess, WMS [email protected]
46
Credit Loss Data Australasia
1984
1986
1988
1990
1993
18m
1995
1997
1999
2001
(200)0
200400600800
1,0001,2001,400
NZ$ million
Bad debt charge to P&L
Net write-offs
BNZ books bad debt credits 1994-1997
BNZ 1984 - 2002

Apr 19, 2023 Kurt Hess, WMS [email protected]
47
Credit Loss Data AustralasiaBanks in sample
AUSTRALIA: Adelaide Bank, Advance Bank, ANZ, Bendigo Bank, Bank of Melbourne, Bank West, Bank of Queensland, Commercial Banking Company of Sydney, Challenge Bank, Colonial State Bank, Commercial Bank of Australia, Commonwealth Bank, Elders Rural Bank, NAB, Primary Industry Bank of Australia, State Bank of NSW, State Bank of SA, State Bank of VIC, St. George Bank, Suncorp-Metway, Tasmania Bank, Trust Bank Tasmania, WestpacNEW ZEALAND: ANZ National Bank, ASB, BNZ, Countrywide Bank, NBNZ, Rural Bank, Trust Bank NZ, TSB Bank, United Bank, Westpac (NZ)

Apr 19, 2023 Kurt Hess, WMS [email protected]
48
Credit Loss Data Australasia
Data issues Macro level statistics
– Differing formats between NZ and Australiae.g. indebtedness of households / firms
– House price series back to 1986 only for Australia
– Balance sheets of M3 institutions only back to 1988 for New Zealand (use private sector credit statistics instead)

Apr 19, 2023 Kurt Hess, WMS [email protected]
49
Credit Loss Data Australasia
Data issues (2) Micro / bank specific data
– Lack of reporting limits choice of proxies(particularly through the very important crisis time early 1990)
– Comparability due to inconsistent reporting(e.g. segment credit exposures)

Apr 19, 2023 Kurt Hess, WMS [email protected]
50
Measuring CLE
Dedicated nature of database allows tests for many proxies for a bank’s credit loss experience (CLE)
– Level of bad debt provisions, impaired assets, past due assets
– Impaired asset expense (=provisions charge to P&L)
– Write-offs (either gross or net of recoveries)– Components of above proxies, e.g. general or
specific component of provisions (stock or expense)
Apr 19, 2023 Kurt Hess, WMS [email protected]
51
Med
ian
-0.2
5 S
tDan
d le
ss
Med
ian
-0.2
5 S
td to
Med
ian
Med
ian
to
Med
ian
+0.
25 S
tD
Med
ian
+0.
25 S
tD to
Med
ian
+0.
5 S
tD
Med
ian
+0.
5 S
tD to
Med
ian
+0.
75 S
tD
Med
ian
+0.
75 S
tD to
Med
ian
+1
StD
Med
ian
+1
StD
toM
edia
n +
1.25
StD
Med
ian
+1.
25 S
tD to
Med
ian
+1.
5 S
tD
Med
ian
+1.
5 S
tD to
Med
ian
+1.
75 S
tD
Med
ian
+1.
75 S
tD to
Med
ian
+2
StD
Med
ian
+2
StD
and
mor
e
Impaired assets / assets
Stock of provisions / loans
Net write-offs / loans
Imp. asset exp. / gross interest
Imp. asset expense / net interest
Impaired asset expense / loans
0
50
100
150
200
250
Measuring CLE
Med
ian
Histogram of selected CLE proxies
Pooled observations of Australian and NZ Banks 1980 - 2005

Credit Loss Experience of Australasian Banks
Selected References

Apr 19, 2023 Kurt Hess, WMS [email protected]
53
Selected ReferencesBikker, J. A., & Metzemakers, P. A. J. (2003).
Bank Provisioning Behaviour and Procyclicality, De Nederlandsche Bank Staff Reports, No. 111.
Caprio, G., & Klingebiel, D. (1996). Bank insolvencies : cross-country experience. Worldbank Working Paper WPS1620.
Cavallo, M., & Majnoni, G. (2001). Do Banks Provision for Bad Loans in Good Times? Empirical Evidence and Policy Implications, World Bank, Working Paper 2691.
Apr 19, 2023 Kurt Hess, WMS [email protected]
54
Selected ReferencesEsho, N., & Liaw, A. (2002). Should the
Capital Requirement on Housing Lending be Reduced? Evidence From Australian Banks. APRA Working Paper(02, June).
Graham, F., & Horner, J. (1988). Bank Failure: An Evaluation of the Factors Contributing to the Failure of National Banks, Federal Reserve Bank of Chicago.

Apr 19, 2023 Kurt Hess, WMS [email protected]
55
Selected ReferencesKearns, A. (2004). Loan Losses and the
Macroeconomy: A Framework for Stress Testing Credit Institutions’ Financial Well-Being, Financial Stability Report 2004. Dublin: The Central Bank & Financial Services Authority of Ireland.
Pain, D. (2003). The provisioning experience of the major UK banks: a small panel investigation. Bank of England Working Paper No 177, 1-45.

Apr 19, 2023 Kurt Hess, WMS [email protected]
56
Selected References
Salas, V., & Saurina, J. (2002). Credit Risk in Two Institutional Regimes: Spanish Commercial and Savings Banks. Journal of Financial Services Research, 22(3), 203 - 224.