
1
Sensor Management Problems of Nuclear Detection
Fred S. RobertsRutgers University

2
Effective Use of Sensors in Nuclear Detection Requires:
•Choosing right type of sensor•Putting it in the right place•Activating it at the right times•Interpreting the results of sensor alarms•Making decisions that balance risk and uncertainty

3
Multi-disciplinary, Multi-institutional Project
•Based at Rutgers University•Partners at Princeton, Texas State University – San Marcos•Collaborators at LANL, PNNL, Sandia•Supported by NSF and Domestic Nuclear Detection Office

4
Key Underlying Project Themes
•New developments in hardware are important in nuclear detection, but so are algorithms •Nuclear detection involves sorting through massive amounts of information•We need to make use of as many sources of information as possible.

5
We are Addressing these Issues Using Methods of the
Mathematical Sciences:
•Algorithmic methods •Dynamic programming methods•Bayesian and Multinomial regression•Machine learning methods•New data sampling strategies

6
Problem Domains
•Risk Assessment for Containers and Trucks at Borders and Seaports

7
Problem Domains
•Special Events

8
Problem Domains
•Moving Vehicles or Individuals

9
Research Thrusts1. Analysis of Archival and Non-Real-
Time Data: Trend Analysis and Dynamic Resource Allocation
2. Combining Archived and Real-time Data: Statistics and Machine Learning
3. Managing Networks of Static and Mobile Sensors: Models and Algorithms
4. Interpreting Sensor Data: Pattern Interpretation and Data Sampling Strategies

10
1. Analysis of Archival and Non-Real-Time Data: Trend Analysis
and Dynamic Resource Allocation
•Looking at two kinds of data:- Manifest data- Radiation sensor data from ports and border crossings

11
Working with Manifest Data•Manifest/bill of lading•Data either text or numerical/categorical•Increased emphasis by US Customs and Border Protection on documents submitted prior to a shipping container reaching the US•Data screened before ship’s arrival in US•Identifying mislabeled or anomalous shipments may prove useful in finding nuclear materials

12
Taking into Account Problem of “Nuisance” or “Innocent” Alarms• agricultural products like fertilizer• kitty litter• ceramic glazed materials • aircraft parts and counter weights• polishing compounds and abrasives• propane tanks• road salt• welding rods• camera lenses• ore and rock• smoke detectors• televisions• medical radioisotopes Slide courtesy of James Ely

13
Manifest Data
• We are developing machine learning algorithms to detect anomalies in manifest data.
• Making use of our Bayesian Binary and Multinomial Regression methods.
• Also making use of “higher order relations”: Higher order naïve Bayes (HONB) and higher order path analysis (HOPA)
• HONB, HOPA based on work of team member Pottenger and his students at Rutgers, showing models based on HONB and HOPA outperform existing approaches

14
Manifest Data• Manifest descriptions of products such as…
– Soft drink concentrates– Ten knockdown empty cartons– Ikea home furnishing products
• …should match classifications of container types, ship types, or port of departure types.
• Anomalies may be discoverable when product descriptions are closely associated with container, ship, or port classifications.
• E.g., a shipment of IKEA products may have more in common with specific container, ship, or port than a shipment containing airplane parts.

15
Manifest Data• Exploring methods for visualizing the manifest
data.• Hope to be able to visualize anomalous patterns
in the data.• Goal is to understand average daily contents
traffic of reported shipments to detect deviations.• Developing similarity measures to compare
contents of shipment vectors• Applying clustering methods based on similarity
measures

16
Port and Borders Radiation Sensor Data: Trend Analysis and Dynamic
Resource Allocation•Data collected at border crossings and seaports.•Some data is archived and analyzed after vehicle has passed.•Find patterns in data. •Applications:−Early warning of failing detectors−Anomaly detection−Help plan manpower/equipment allocations

17
Analysis of Archival Data: Radiation Portal Monitoring
Project – PNNL • Microsoft® Access™ database
files are produced nightly for each supervisory computer, including:– Time distributed background– Profiles for all vehicles (including
alarms)– Metadata for alarms (commodity,
RIID reading, medical isotopes, etc.)
– Event log (status of RPM, identifies errors)
– Parameters (settings and configuration)
Alarm printouts from Ludlum and SAIC data.
Slide courtesy of James Ely

18
Analysis of Archival Data: Approaches
•Trend Analysis: Analyze dual time series of sample readings from trucks and from background.•Classical problem.•But: challenge of finding trends in sensor readouts with complex chronological effects.•Characterization of subtle trends needed to mine for abnormalities.

19
Analysis of Archival Data: Approaches
•Trend Analysis: Using Bayesian methods for modeling spatio-temporal data •Crucial issue: computational•Challenge: Develop “online” Bayes methods
−Allow efficient computation – without having to redo analysis from scratch
•Exploring use of our methods for Bayesian Binary and Multinomial Regression from an earlier Monitoring Message Streams project for the intelligence community.•“World’s most efficient software for ultra-high dimensional Bayesian logistic regression”

20
Analysis of Archival Data: Approaches
•Dynamic Resource Allocation Methods:−Investigating use of “approximate dynamic programming” developed by Princeton members of our team−Use to help plan manpower and equipment, allocate inspectors and detectors−Use to help assign resources to tasks in presence of uncertain forecasts

21
2. Combining Archived and Real-time Data
•Portal radiation sensors capture the energy spectrum across a range of channels from low to high frequency•Statistical learning tools can help make fast decisions during routine screening•We have formulated a Bayesian model for the energy emitted by an unknown source and classifying it as belonging to one of K defined classes – including benign materials.

22
Combining Archived and Real-time Data
•Initial results through simulations show approach is very promising.•Hope this Bayesian learning approach can be easily extensible to newer portal devices and changes in design.

23
Combining Archived and Real-time Data
•Our Princeton team has developed new online statistical change detection and identification rules.•These rules identify pattern changes in sensor readings that indicate presence of hazardous materials.•Algorithms designed to:
-Operate in real time-Have low level of false alarms-Work with small amount of computational power

24
Combining Manifest Data and Sensor Data
• Can we learn from false alarms due to “innocent”materials?
• Combining data from different sources decreases probability of a false positive.
• Can we apply learning from manifest data and false alarms to check for anomalies/ inconsistencies with sensor data?
Photo courtesy of James Ely

25
Combining Manifest Data and Sensor Data
• We are exploring use together of manifest data and sensor (radiation portal monitor) data.
• Developing new machine learning classification algorithms
• Challenge: How to incrementally fuse together the data to proactively target specific containers
• Using discriminative learning for pre-port data, andgenerative classifier for port data
• Methods developed by consultant Sid Dalal

26
Big Challenge for Detection: Reducing # of false positives
Source Material
Location A % of Identified
Alarms
Location B % of Identified
Alarms
Location C % of Identified
Alarms Kitty litter 34% 25% - Medical (In, I, Tc, Tl) 16% - - Abrasives/Scouring pads 14% 5% - Refractory material 8% - - Mica 5% - - Fertilizer/Potash 5% 13% - Granite/Marble slabs 4% - 10% Ceramics/Tile/Toilets 4% 9% 28% Trucks/cars 2% - - Aluminum - 15% - Earth - 11% - Bentonite - 5% - Salt - 5% - Other metal - 3% - Televisions - - 27% Gas Tankers - - 13% Smoke Detectors - - 4% Other 6% 9% 18%
• Current Approach:– Improvement in hardware
• Our Approach– Combine multiple sources
of Data- from Manifest and Radiation Portal
– Construct new machine learning classification algorithms
– Advantages-• better detection, • adaptation to changing
cargo mix– Flexible and Easier to
implement

27
3. Managing Networks of Static and Mobile Sensors: Models and
Algorithms•Dynamic sensor management•Modeling the static sensor location
problem (SLP)•Algorithms for solving the SLP

28
Dynamic Sensor Management: Inspecting an Existing Sensor
Network•Sensors may deteriorate over time•Sensors may fail periodically (without our knowledge)•We may only be able to get readings at some of the sensors in our system – which ones? •We need efficient protocols for doing these things.•How do we manage a mobile inspector (person, team, robotic vehicle) to
−Inspect sensors for operability?−Get readings at various points?−Choose an order of inspection?

29
• To address these challenges, we have produced the “optimal inspector game,” which can be played manually or using a family of policies.
• Our automated policies outperform humans by wide margin.
Dynamic Sensor Management: “The Optimal Inspector Game”

30
Dynamic Sensor Management: Mobile Sensors
•General Problem: How can we make use of sensors that are mobile?− Carried by people− Carried by vehicles
•How can we move sensors from time to time in static sensor networks?•Can we develop algorithms for movement of sensors?
−Complication: Background changes when sensors are moved. −Need background learning techniques

31
Nuclear Detection using Taxi Cabs

32
Nuclear Detection Using Taxi Cabs - Design Plan
• Distribute GPS tracking and nuclear detection devices to taxi cabs in a metropolitan area.– Feasibility: New technologies are making
devices portable, powerful, and cheaper.– “Ubiquitous sensing” could include sensors on
police vehicles or cell phones • Send out signals if the taxi cabs are getting
close to nuclear sources. • Analyze the information (both locations and
nuclear signals) to detect potential location of a source.
• Carry out the tasks dynamically:– Continuous and real-time surveillance.

33A simulation of taxi cab locations
at morning rush hour
Manhattan, New York City
...........
.
.
.
.. .
.
.
.
.
.
..
.. .
.
.
.
..
+GPS tracking
deviceNuclear sensor
device
dirty bomb?
Nuclear Detectionusing Taxi Cabs

34
Taxi Cabs – Model Components• Source Signal Model
– Definition: random variable S - the indicator of nuclear signal from a source
– Values 1 (existence of source) or 0– The closer to the source, the higher the probability
P(S=1)• Source Detection Model
– Random variable D: – Values 1 (the sensor detects the source) or 0– Model parameter: Sensitivity P(D=1|S=1)
• The probability of detecting the true signal.– Model parameter: Specificity P(D=0|S=0)
• The probability of not detecting nonexistent signal.

35
Taxi Cabs – Clustering of Events• Definition of Clusters:
– Unusually large number of events/patterns clumping within a small region of time, space or location in a sequence
• Statistical methodology: – Formal tests: provide statistical significance against
random chance.• Traditional statistical method is via Scan Statistics
– Scan entire study area and seek to locate region(s) with unusually high likelihood of incidence
– E.g, use:• maximum number of cases in a fixed-size moving
window• Diameter of the smallest window that contains a fixed
number of cases

36
Taxi Cabs - Simulation• Generated data in Manhattan and
did a simulation – applying the clustering approach with success
• Used spatclus package in R: software package to detect clusters
• Need to improve the current method/ algorithm to make it more efficient and faster
• Need to develop ways to filter out alarms from “innocent” sources
• Need to explore different models for movements of taxis

37
Modeling the Static Sensor Location Problem
• Sensor Location Problem (SLP):– Context: special events,
malls, tunnels, neighborhoods
– Choose an appropriate mix of sensors
– decide where to locate them for best protection and early warning

38
The SLP: What is a Measure of Success of a Solution?
• A modeling problem.• Needs to be made precise.• Many possible formulations.

39
The SLP: What is a Measure of Success of a Solution?
• Identify and ameliorate false alarms.• Defending against a “worst case” attack or an
“average case” attack.• Minimize time to first alarm? (Worst case?)
(Average case?)• Cost: Given a mix of available sensors and a
fixed budget, what mix will best accomplish our other goals?
• Maximize “coverage” of the area.– Minimize geographical area not covered– Minimize size of population not covered– Minimize probability of missing an attack
40
Modeling the Static SLP
•We are developing models that make these things precise.
•Our models typically involve some sort of optimization problem. •Often multi-objective optimization.
•Many subtleties:– E.g., more sensors are not necessarily
better (more chance of a false positive)

41
Algorithms for Solving the Static SLP under Uncertainty
•Analyzing the SLP if we have an estimate of probability of an attack at a given location.•Simple “toy” model based on a network of locations located along a linear topology.
−Subway tunnel−Long, linear dock
•A priori estimate of probability of an “attack” at each point on the network.•Looking at locating sensors so that minimize the maximum expected distance from sensor to an attack.•Looking to extend results to more general topologies.

42
Algorithms for Solving the Static SLP: Future Work
•Greedy algorithms (building on work at Institute for Defense Analyses)•Modifying classic facility location and clustering algorithms•Building on “bichromatic clustering” and facility location algorithms used for placing sensors along highways•Extending combinatorial optimization approaches to equipment placement problems developed in telecom.

43
4. Interpreting Sensor Data: Pattern Interpretation and Data
Sampling Strategies•Interpreting Patterns of Sensor Activation
in Systems of Sensors•Data Sampling Strategies •Combining Information from Many Sources
44
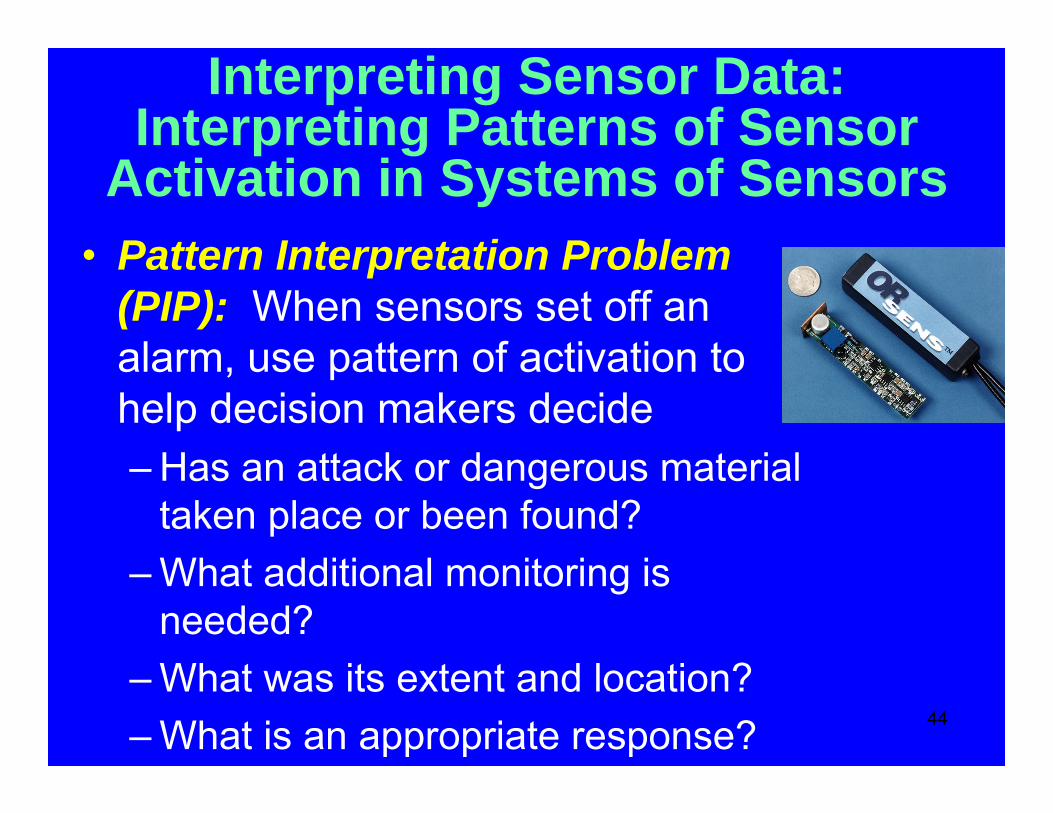
Interpreting Sensor Data: Interpreting Patterns of Sensor
Activation in Systems of Sensors• Pattern Interpretation Problem
(PIP): When sensors set off an alarm, use pattern of activation to help decision makers decide– Has an attack or dangerous material
taken place or been found?– What additional monitoring is
needed?– What was its extent and location?– What is an appropriate response?

45
Approaching the PIP: Using Decision Rules: Future Work
• For sensors using thresholds to sound an alarm:– Alternative decision rule: alarm if two
sensors reach 90% of threshold, three reach 75% of threshold, etc.
– One approach: use clustering algorithms for sounding an alarm based on a given distribution of clusters of sensors reaching a percentage of threshold (as in taxi cab model).

46
Approaching the PIP: Using Decision Rules: Future Work
• How to interpret signals from a group of sensors?• Most work has concentrated on the case of
stochastic independence of information available at two sensors – clearly violated in sensor location.
• Even with stochastic independence, finding “optimal” decision rules is nontrivial.
• There are promising approaches of Paul Kantor: study algorithms for decisions when stochastic independence is violated.– Developed in missile defense– Used in filtering problems in text analysis

47
Data Sampling Strategies: Optimal Measurements
• Challenges:– How do we “optimally
sample data in real-time?
– We need to collect information as efficiently as possible, typically in situations where we simply cannot measure everything even once.

48
• Responding to changing information– When did the information
change?– What caused the change?
Medical waste, or terrorist activity?
• Goals– We want to identify both the
timing of when a signal changes, and its cause, as quickly as possible.
– The technique has to be fast and easy to implement.
Optimal Measurements: Quickest Change Detection

49
Optimal Measurements
• Important dimensions– Are measurements correlated?
Independent measurements – For example, testing one technology (or sampling cargo at one port), tells us nothing about other technologies (or maybe even other ports).
– Are you managing a physical device to take measurements?
We have to think about the cost of a measurement, not just what we learn.

50
Optimal Measurements -Uncorrelated
• The knowledge gradient– How do we determine what we
should measure next?– We need to balance the cost of
the measurement against the value of the knowledge earned.
– The knowledge gradient is a simple and powerful calculation that guides the search process, esp. when you have a small measurement budget.
– In its simplest form, it ignores correlations in measurements, and the possibility that we have to physically move a sensor around.
0
1
2
3
4
5
6
1 2 3 4 5
Cho
ice mu
SigmaKG index
Value of knowledge gradient
Improvement due to KG over best alternative

51
With correlations
Without correlations
Optimal Measurements with Correlations
Measurement at one point tells us about neighboring points– Measuring radiation at one
location provides information about other locations.
– Evaluating the performance of one nuclear detector provides information about others using same technology. Our correlated knowledge
gradient procedure– Chooses measurements based
in part on what we learn about other potential measurements.
– A few measurements allow us to update knowledge about everything.
– Requires dramatically fewer measurements.

52
Combining Information from Many Sources
• Context: Detecting moving radiation sources
• How can we combine sensor information with information from other sources, e.g., cameras?
• If we use additional information, can a variety of data help us pinpoint which sensor to focus on next?

53
Combining Information from Many Sources
• An Approach: Combining sensing with imaging.
• A key issue is shape analysis.• Difficult to train a statistical
model to represent all possible shapes when viewed from different viewpoints.
• Challenge: How to combine shape space analysis with use of sensors.

54
Project Team• Rutgers University
– Fred Roberts– James Abello– Jerry Cheng (grad student)– Sid Dalal (RAND Corp, consultant)– Robert Davis (undergrad student)– Emilie Hogan (grad student)– Richard Mammone– Dimitris Metaxas– Alantha Newman (postdoc)– Bill Pottenger– Minge Xie
• Princeton University– Warren Powell– Savas Dayanik– Peter Frazier (grad student)– Ilya Rhyzov (grad student)– Kazutoshi Yamazaki (grad student)
• Texas State University – San Marcos
– Nate Dean– Jill Cochran (grad student)

55
Project Team: National Lab Partners(helping with advice, information, data)
• PNNL– Terence Critchlow– James Ely– Cliff Joslyn
• LANL– Frank Alexander– Nick Hengartner
• Sandia– Jon Berry– Bill Hart

56
Thank you


