© 2013 Cisco and/or its affiliates. All rights reserved. 1 © 2013 Cisco and/or its affiliates. All rights reserved. © 2013 Cisco and/or its affiliates. All rights reserved.
Dr. Robert Pepper Vice President Global Technology Policy 6 March 2013
ANZ Highlights from Cisco 2013 Mobile VNI Forecast and 2012 Cisco Global Cloud Index
© 2013 Cisco and/or its affiliates. All rights reserved. 2
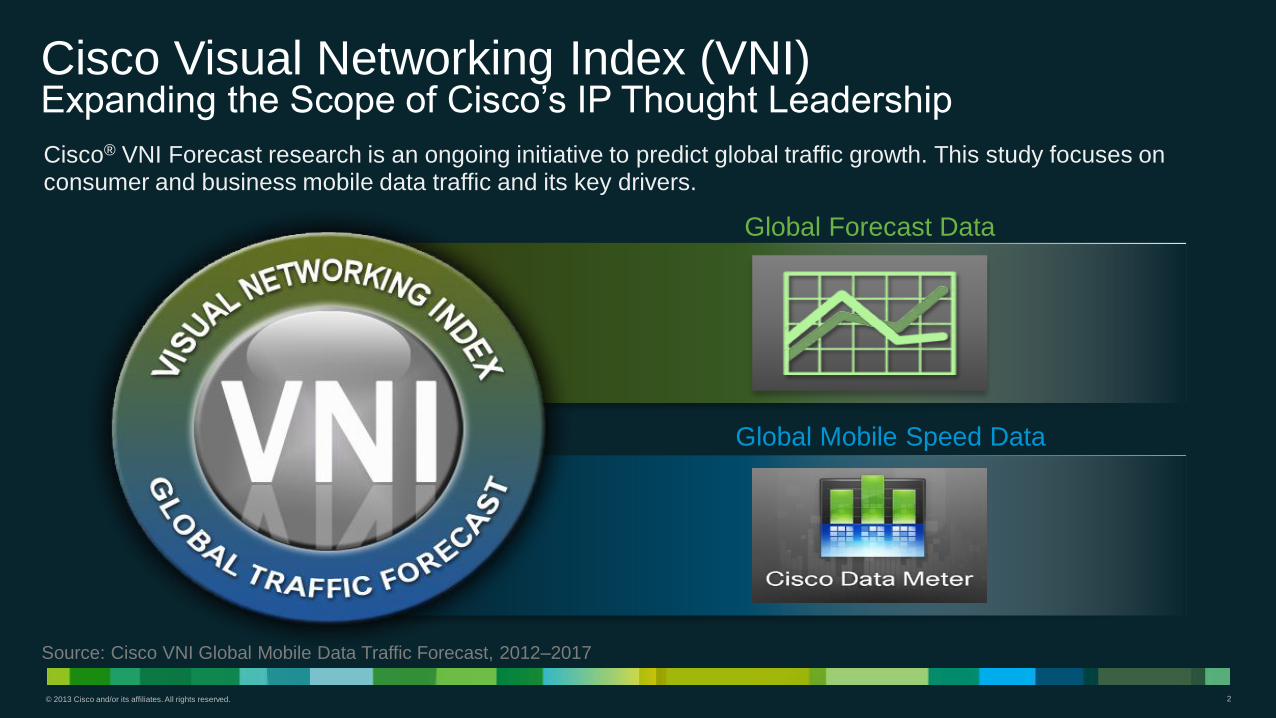
Cisco Visual Networking Index (VNI) Expanding the Scope of Cisco’s IP Thought Leadership
Cisco® VNI Forecast research is an ongoing initiative to predict global traffic growth. This study focuses on consumer and business mobile data traffic and its key drivers.
Source: Cisco VNI Global Mobile Data Traffic Forecast, 2012–2017
Global Mobile Speed Data
Global Forecast Data
© 2013 Cisco and/or its affiliates. All rights reserved. 3
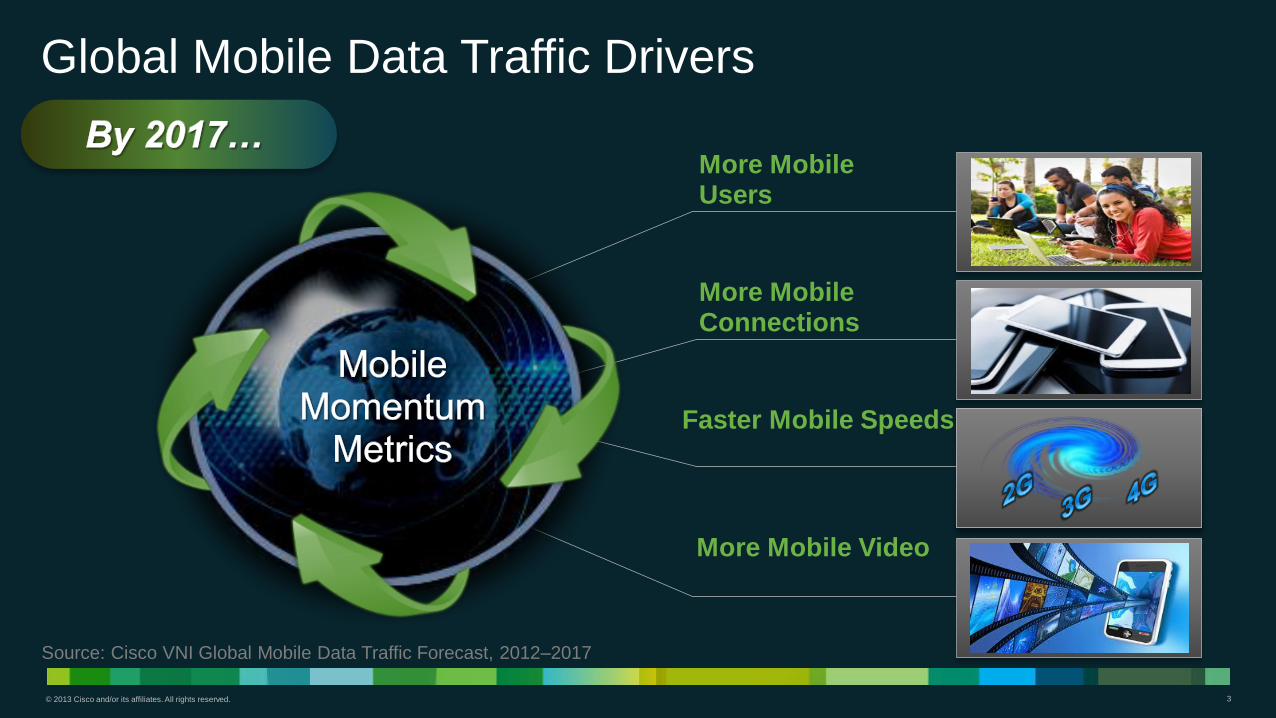
Global Mobile Data Traffic Drivers
More Mobile Users
Faster Mobile Speeds
More Mobile Connections
More Mobile Video
Source: Cisco VNI Global Mobile Data Traffic Forecast, 2012–2017
© 2013 Cisco and/or its affiliates. All rights reserved. 4
0.00
0.01
0.02
0.03
0.04
0.05
0.06
0.07
0.08
2012 2013 2014 2015 2016 2017
Exab
yte
s p
er
Mo
nth
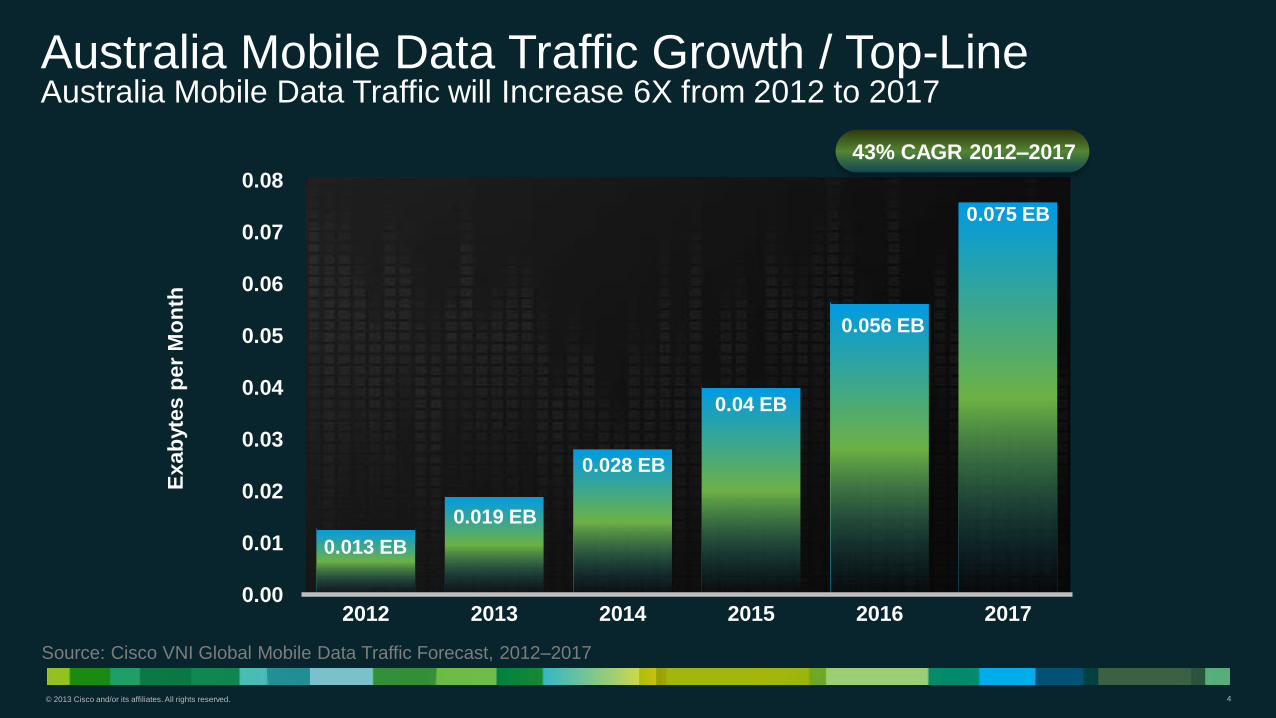
0.056 EB
0.013 EB
Australia Mobile Data Traffic Growth / Top-Line Australia Mobile Data Traffic will Increase 6X from 2012 to 2017
0.075 EB
0.04 EB
0.028 EB
0.019 EB
43% CAGR 2012–2017
Source: Cisco VNI Global Mobile Data Traffic Forecast, 2012–2017
© 2013 Cisco and/or its affiliates. All rights reserved. 5
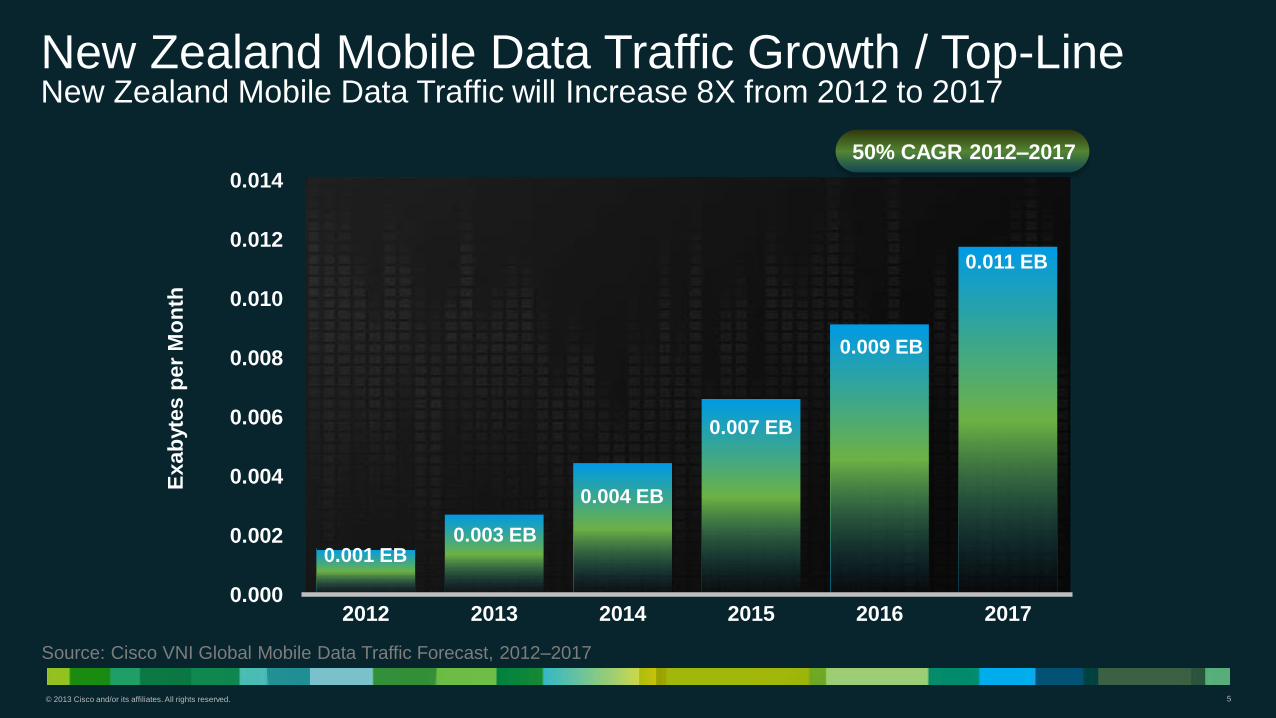
0.000
0.002
0.004
0.006
0.008
0.010
0.012
0.014
2012 2013 2014 2015 2016 2017
Exab
yte
s p
er
Mo
nth
0.009 EB
0.001 EB
New Zealand Mobile Data Traffic Growth / Top-Line New Zealand Mobile Data Traffic will Increase 8X from 2012 to 2017
0.011 EB
0.007 EB
0.004 EB
0.003 EB
50% CAGR 2012–2017
Source: Cisco VNI Global Mobile Data Traffic Forecast, 2012–2017
© 2013 Cisco and/or its affiliates. All rights reserved. 6
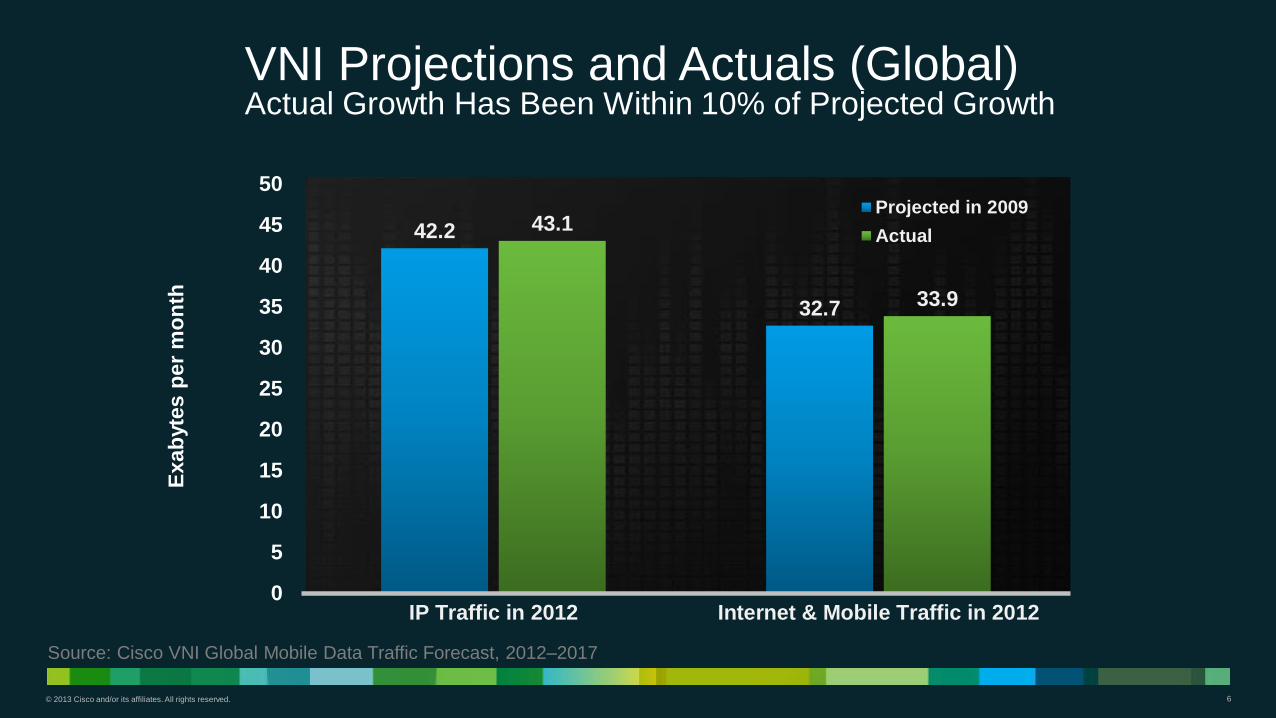
42.2
32.7
43.1
33.9
0
5
10
15
20
25
30
35
40
45
50
IP Traffic in 2012 Internet & Mobile Traffic in 2012
Exab
yte
s p
er
mo
nth
Projected in 2009
Actual
VNI Projections and Actuals (Global) Actual Growth Has Been Within 10% of Projected Growth
Source: Cisco VNI Global Mobile Data Traffic Forecast, 2012–2017

© 2013 Cisco and/or its affiliates. All rights reserved. 7
Top Trends
© 2013 Cisco and/or its affiliates. All rights reserved. 8
VNI Mobile Forecast Update, 2012–2017 Top 5 Mobile Networking Trends
Device Diversification
Impact of 4G Connections on Traffic
Traffic Offload from Mobile Networks to Fixed Networks
The (Mobile) Internet of Things
Mobile Video and Cloud readiness
© 2013 Cisco and/or its affiliates. All rights reserved. 9
0
2
4
6
8
10
12
2012 2013 2014 2015 2016 2017
Bil
lio
ns
of
Devic
es
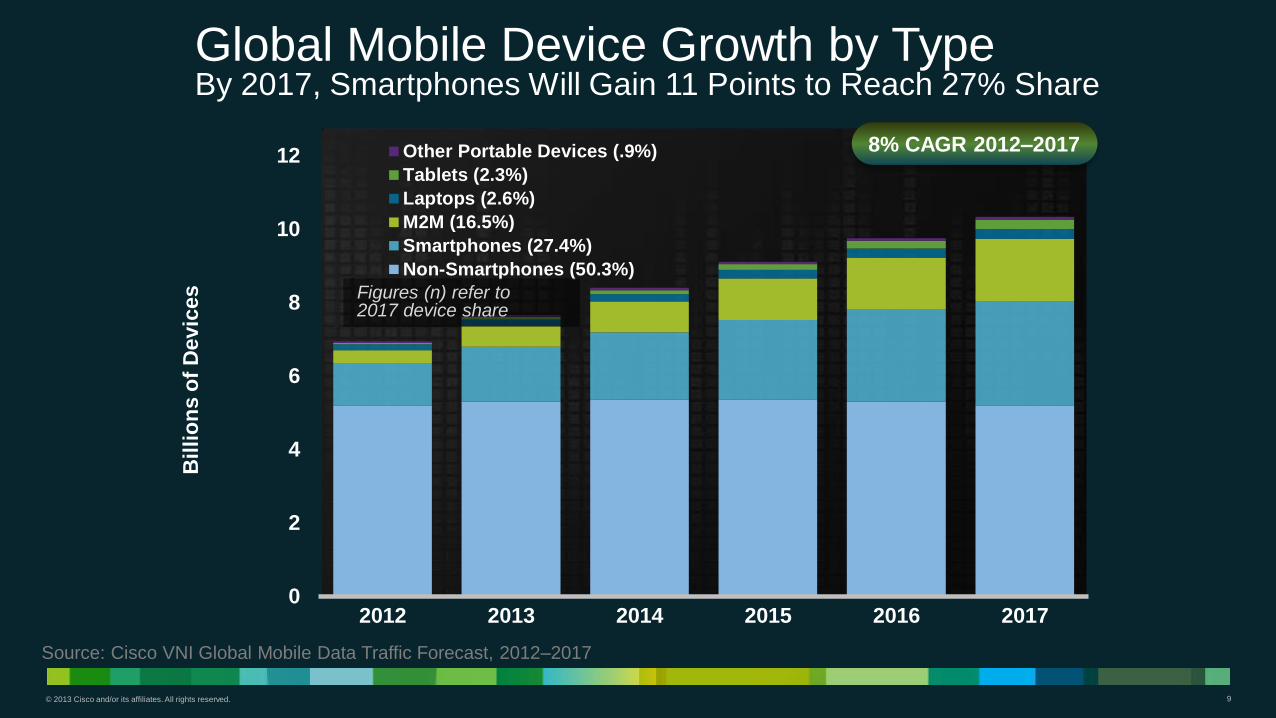
Other Portable Devices (.9%)
Tablets (2.3%)
Laptops (2.6%)
M2M (16.5%)
Smartphones (27.4%)
Non-Smartphones (50.3%)
Global Mobile Device Growth by Type By 2017, Smartphones Will Gain 11 Points to Reach 27% Share
Source: Cisco VNI Global Mobile Data Traffic Forecast, 2012–2017
8% CAGR 2012–2017
Figures (n) refer to 2017 device share
© 2013 Cisco and/or its affiliates. All rights reserved. 10
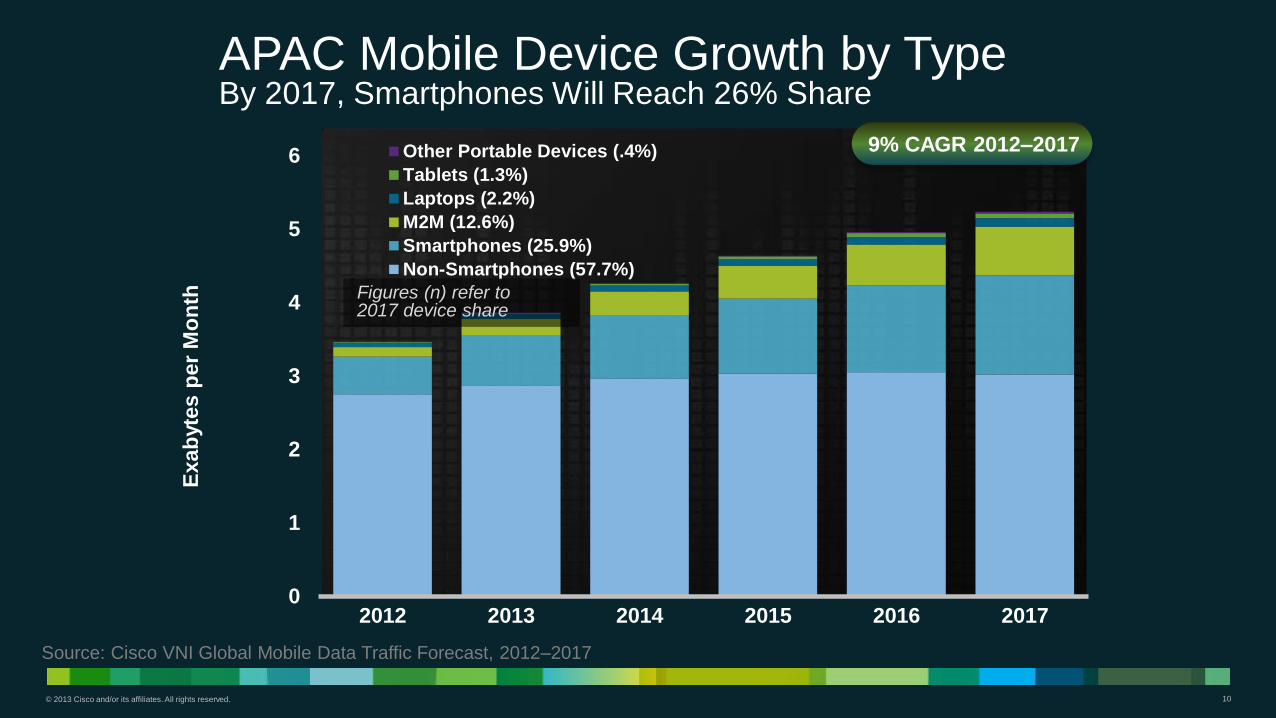
0
1
2
3
4
5
6
2012 2013 2014 2015 2016 2017
Exab
yte
s p
er
Mo
nth
Other Portable Devices (.4%)
Tablets (1.3%)
Laptops (2.2%)
M2M (12.6%)
Smartphones (25.9%)
Non-Smartphones (57.7%)
APAC Mobile Device Growth by Type By 2017, Smartphones Will Reach 26% Share
Figures (n) refer to 2017 device share
9% CAGR 2012–2017
Source: Cisco VNI Global Mobile Data Traffic Forecast, 2012–2017
© 2013 Cisco and/or its affiliates. All rights reserved. 11
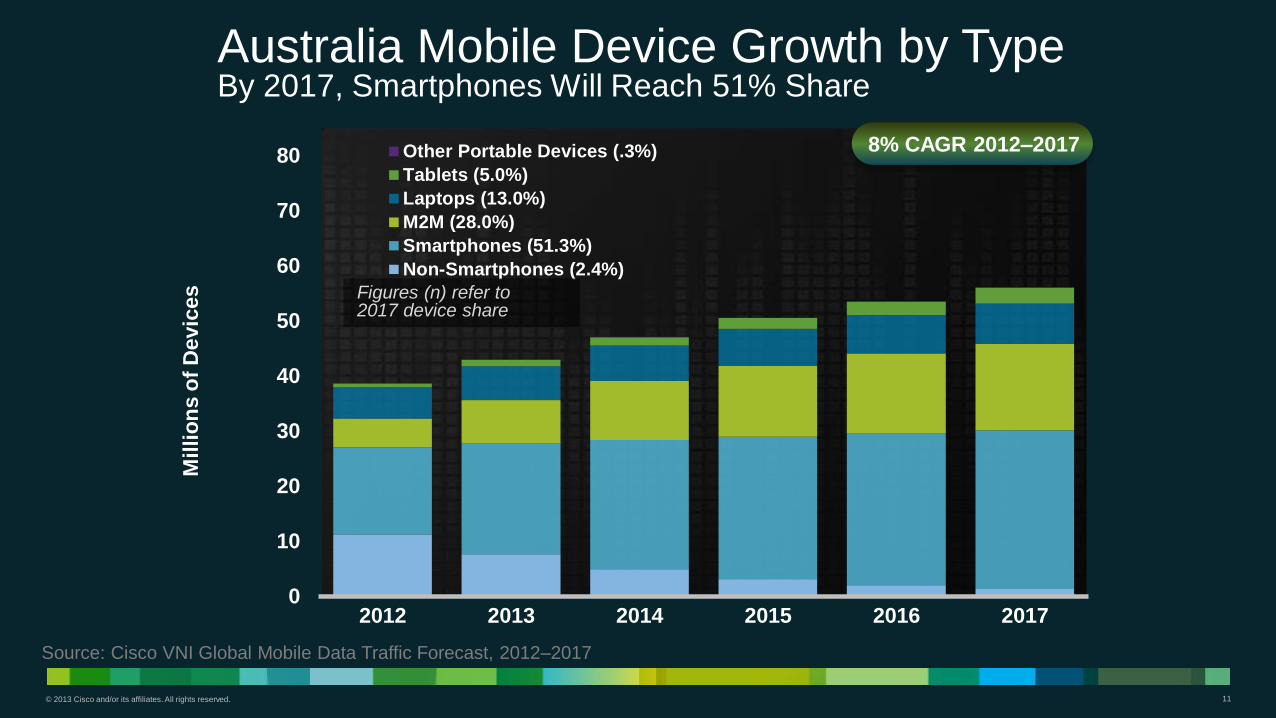
0
10
20
30
40
50
60
70
80
2012 2013 2014 2015 2016 2017
Mil
lio
ns
of
Devic
es
Other Portable Devices (.3%)
Tablets (5.0%)
Laptops (13.0%)
M2M (28.0%)
Smartphones (51.3%)
Non-Smartphones (2.4%)
Australia Mobile Device Growth by Type By 2017, Smartphones Will Reach 51% Share
Figures (n) refer to 2017 device share
8% CAGR 2012–2017
Source: Cisco VNI Global Mobile Data Traffic Forecast, 2012–2017
© 2013 Cisco and/or its affiliates. All rights reserved. 12
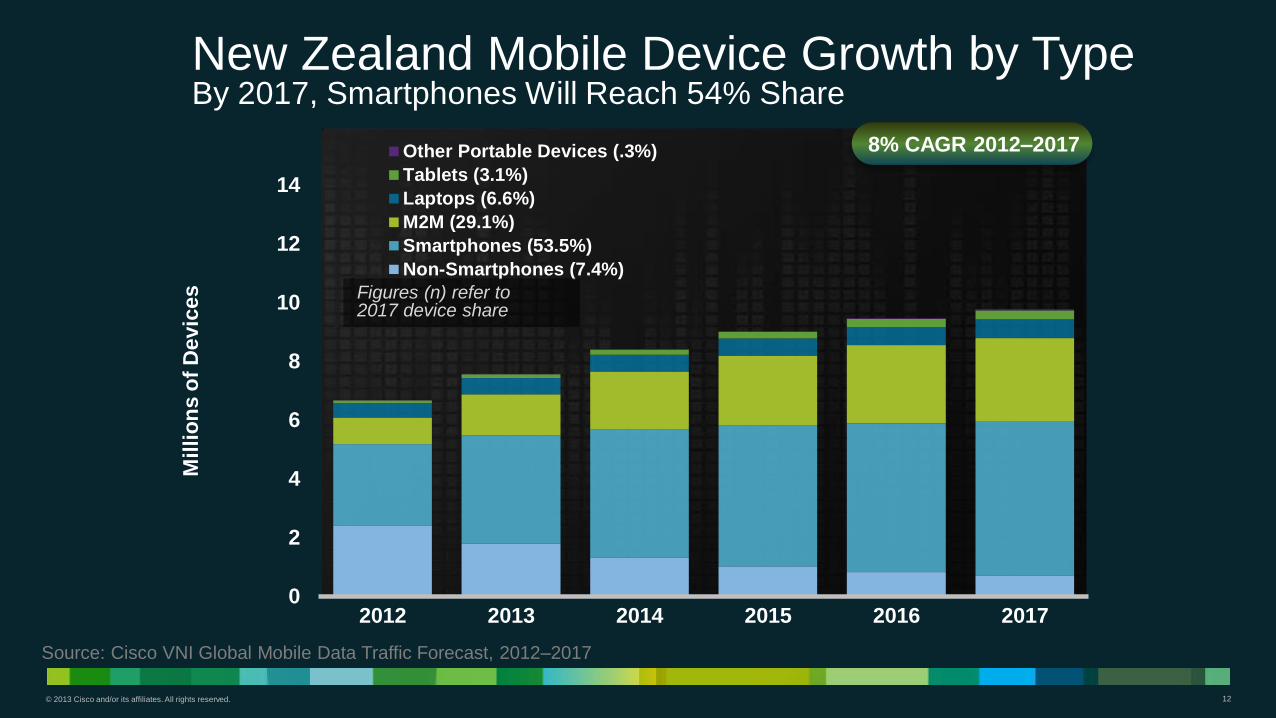
0
2
4
6
8
10
12
14
2012 2013 2014 2015 2016 2017
Mil
lio
ns
of
Devic
es
Other Portable Devices (.3%)
Tablets (3.1%)
Laptops (6.6%)
M2M (29.1%)
Smartphones (53.5%)
Non-Smartphones (7.4%)
New Zealand Mobile Device Growth by Type By 2017, Smartphones Will Reach 54% Share
Figures (n) refer to 2017 device share
8% CAGR 2012–2017
Source: Cisco VNI Global Mobile Data Traffic Forecast, 2012–2017
© 2013 Cisco and/or its affiliates. All rights reserved. 13
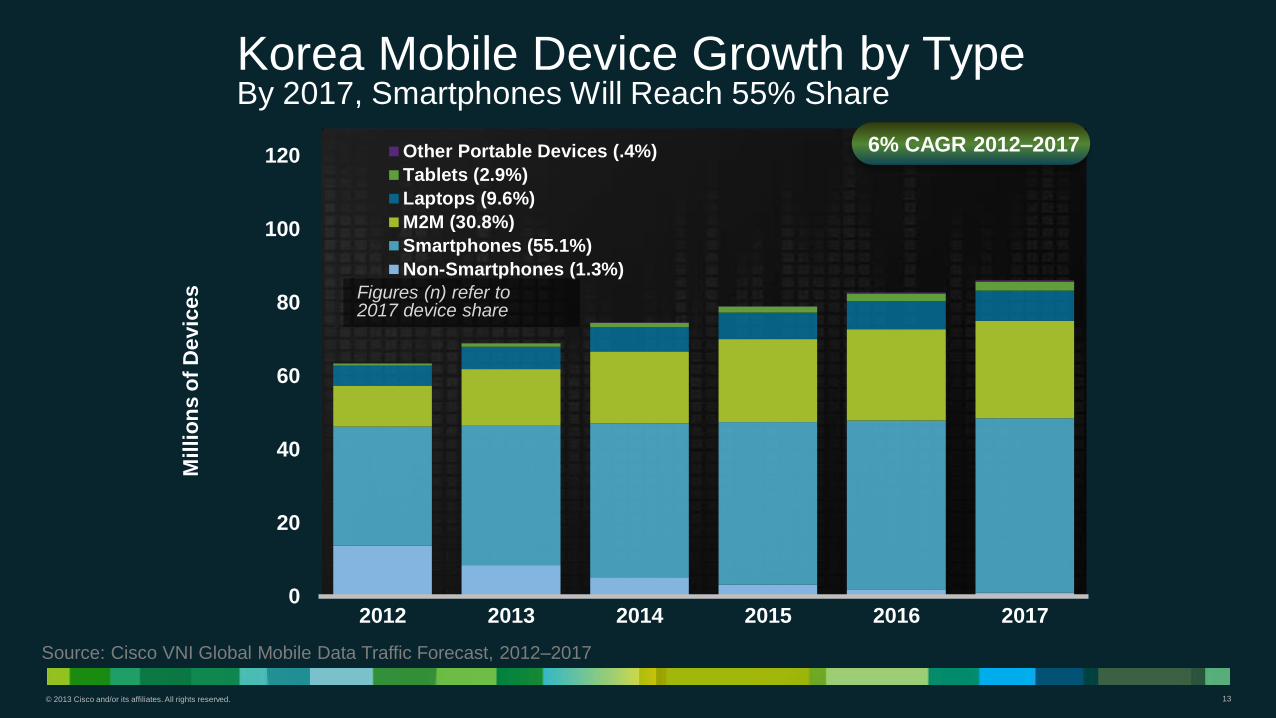
0
20
40
60
80
100
120
2012 2013 2014 2015 2016 2017
Mil
lio
ns
of
Devic
es
Other Portable Devices (.4%)
Tablets (2.9%)
Laptops (9.6%)
M2M (30.8%)
Smartphones (55.1%)
Non-Smartphones (1.3%)
Korea Mobile Device Growth by Type By 2017, Smartphones Will Reach 55% Share
Figures (n) refer to 2017 device share
6% CAGR 2012–2017
Source: Cisco VNI Global Mobile Data Traffic Forecast, 2012–2017
© 2013 Cisco and/or its affiliates. All rights reserved. 14
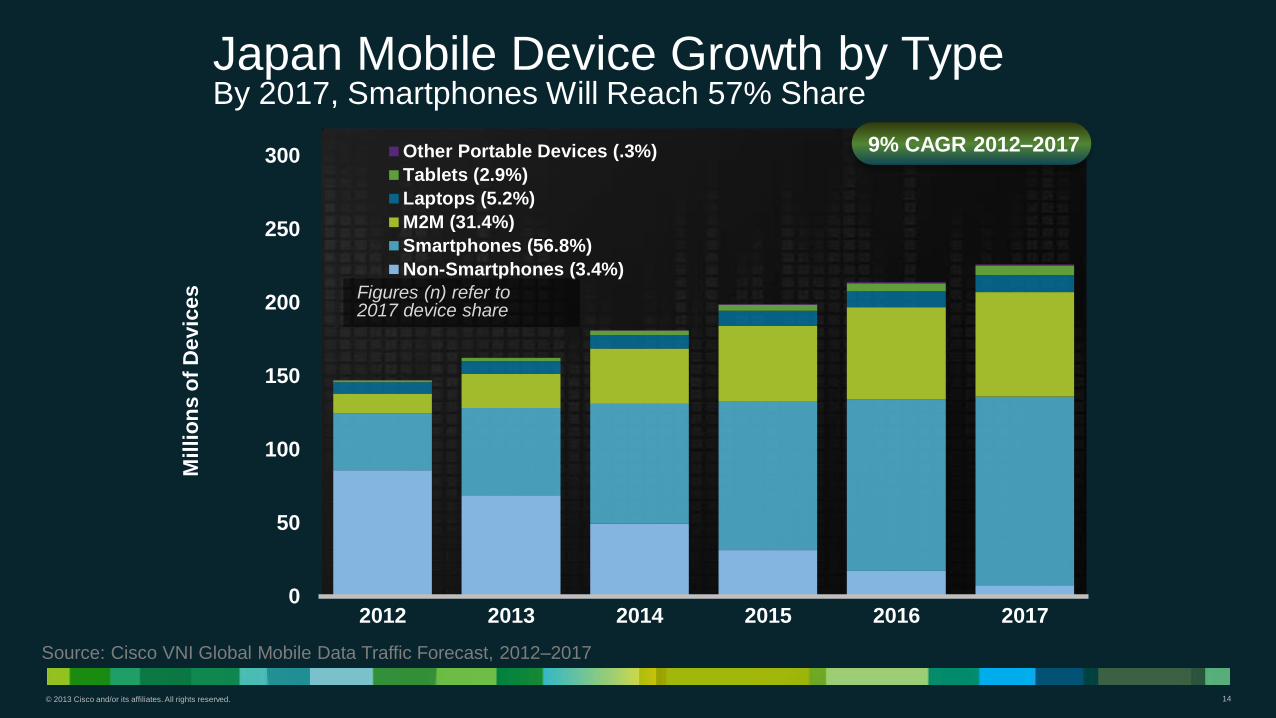
0
50
100
150
200
250
300
2012 2013 2014 2015 2016 2017
Mil
lio
ns
of
Devic
es
Other Portable Devices (.3%)
Tablets (2.9%)
Laptops (5.2%)
M2M (31.4%)
Smartphones (56.8%)
Non-Smartphones (3.4%)
Japan Mobile Device Growth by Type By 2017, Smartphones Will Reach 57% Share
Figures (n) refer to 2017 device share
9% CAGR 2012–2017
Source: Cisco VNI Global Mobile Data Traffic Forecast, 2012–2017
© 2013 Cisco and/or its affiliates. All rights reserved. 15
0.0
0.5
1.0
1.5
2.0
2.5
2012 2013 2014 2015 2016 2017
Bil
lio
ns
of
Devic
es
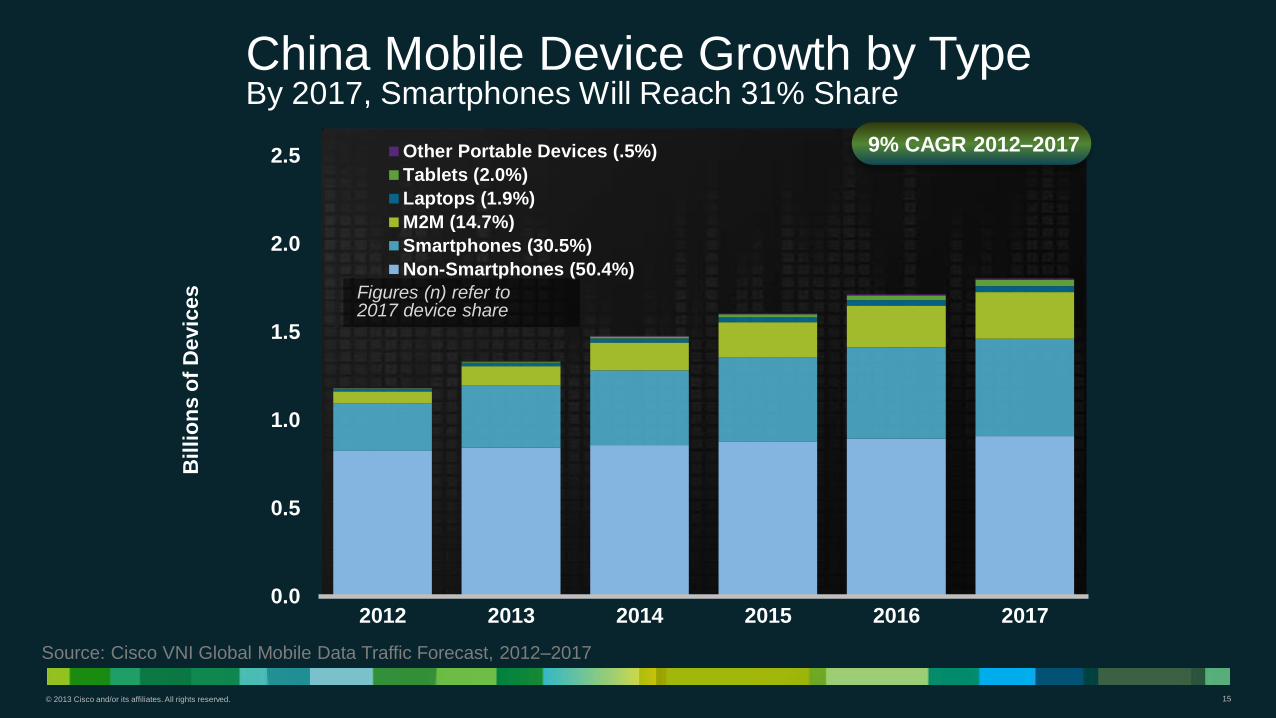
Other Portable Devices (.5%)
Tablets (2.0%)
Laptops (1.9%)
M2M (14.7%)
Smartphones (30.5%)
Non-Smartphones (50.4%)
China Mobile Device Growth by Type By 2017, Smartphones Will Reach 31% Share
Figures (n) refer to 2017 device share
9% CAGR 2012–2017
Source: Cisco VNI Global Mobile Data Traffic Forecast, 2012–2017
© 2013 Cisco and/or its affiliates. All rights reserved. 16
0.0
0.5
1.0
1.5
2.0
2.5
2012 2013 2014 2015 2016 2017
Bil
lio
ns
of
Devic
es
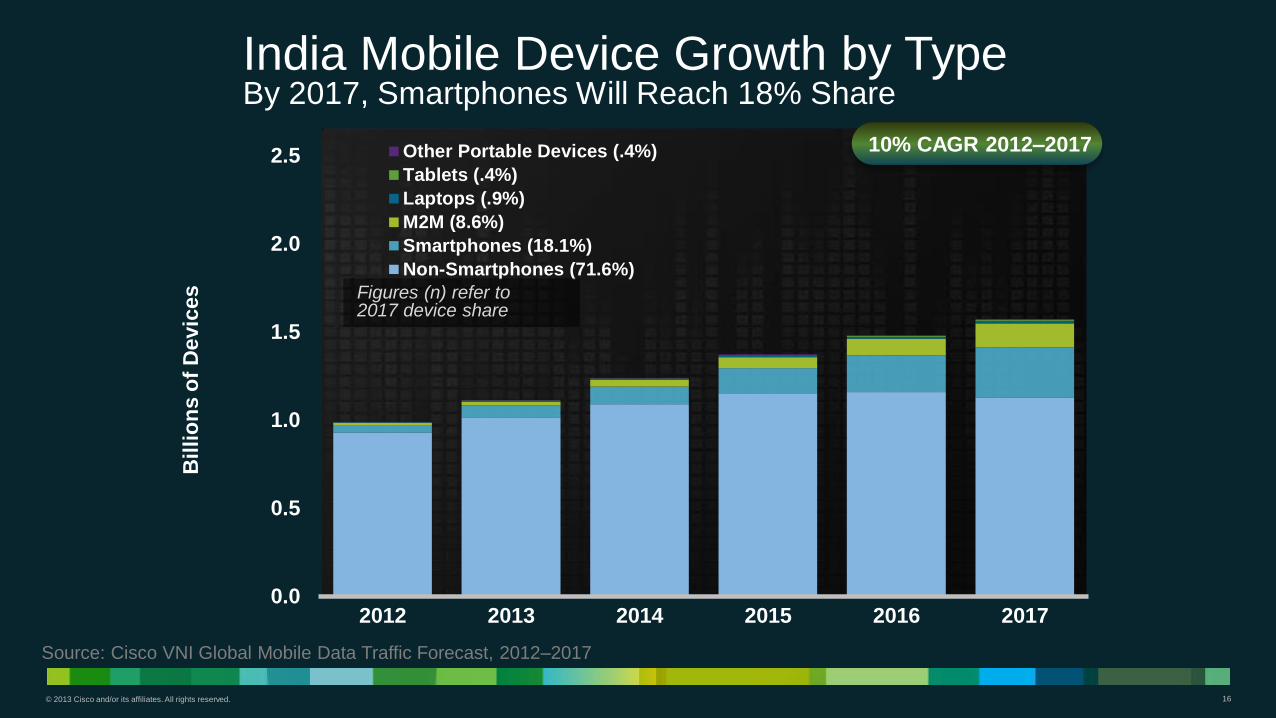
Other Portable Devices (.4%)
Tablets (.4%)
Laptops (.9%)
M2M (8.6%)
Smartphones (18.1%)
Non-Smartphones (71.6%)
India Mobile Device Growth by Type By 2017, Smartphones Will Reach 18% Share
Figures (n) refer to 2017 device share
10% CAGR 2012–2017
Source: Cisco VNI Global Mobile Data Traffic Forecast, 2012–2017
© 2013 Cisco and/or its affiliates. All rights reserved. 17
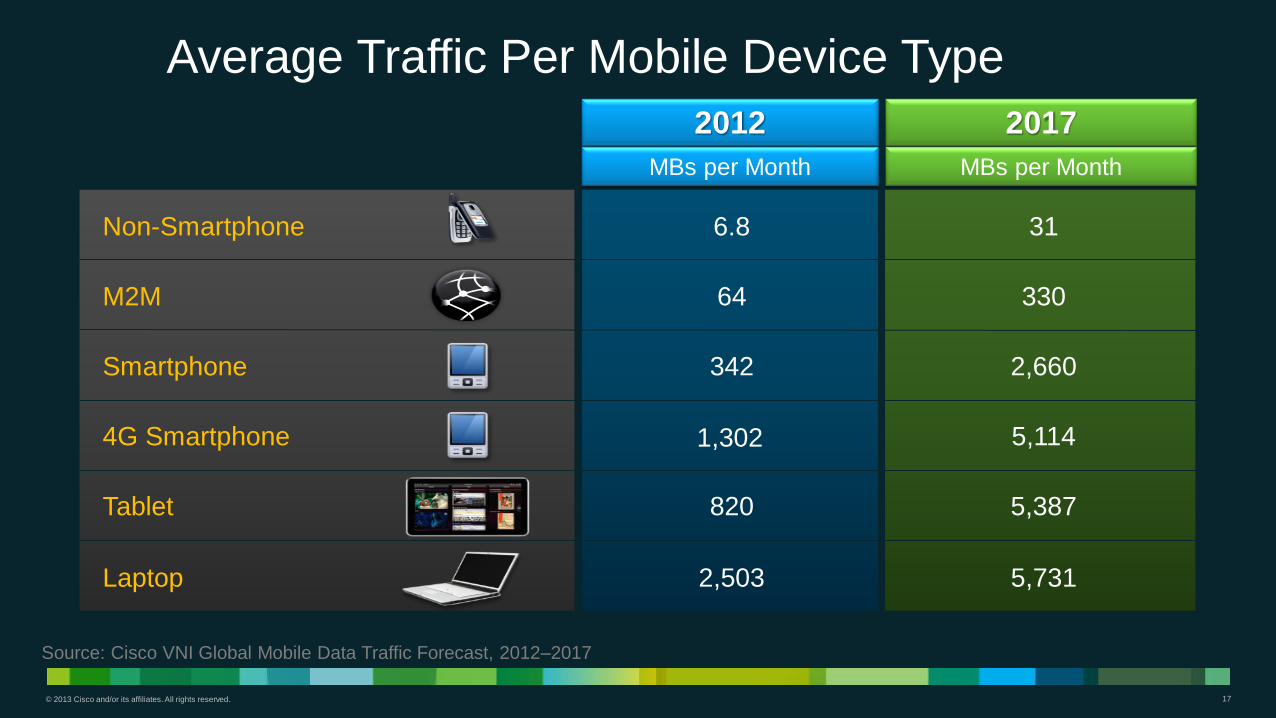
Average Traffic Per Mobile Device Type
Non-Smartphone
2017 2012
6.8 31
MBs per Month MBs per Month
M2M 64 330
Smartphone 342 2,660
4G Smartphone 1,302 5,114
Tablet 820 5,387
Laptop 2,503 5,731
Source: Cisco VNI Global Mobile Data Traffic Forecast, 2012–2017
© 2013 Cisco and/or its affiliates. All rights reserved. 18
0
2
4
6
8
10
12
2011 2012 2013 2014 2015 2016
Exab
yte
s p
er
Mo
nth
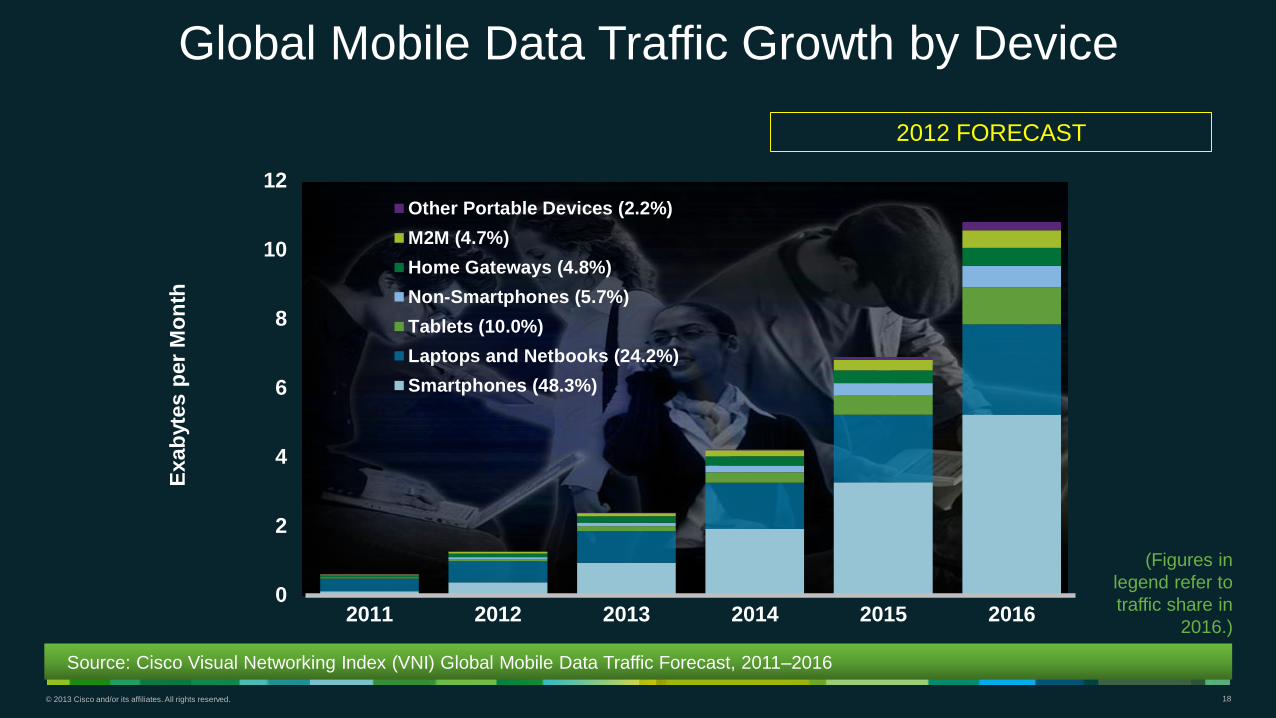
Other Portable Devices (2.2%)
M2M (4.7%)
Home Gateways (4.8%)
Non-Smartphones (5.7%)
Tablets (10.0%)
Laptops and Netbooks (24.2%)
Smartphones (48.3%)
Global Mobile Data Traffic Growth by Device
Source: Cisco Visual Networking Index (VNI) Global Mobile Data Traffic Forecast, 2011–2016
(Figures in
legend refer to
traffic share in
2016.)
2012 FORECAST
© 2013 Cisco and/or its affiliates. All rights reserved. 19
0
2
4
6
8
10
12
2012 2013 2014 2015 2016 2017
Ex
ab
yte
s p
er
Mo
nth
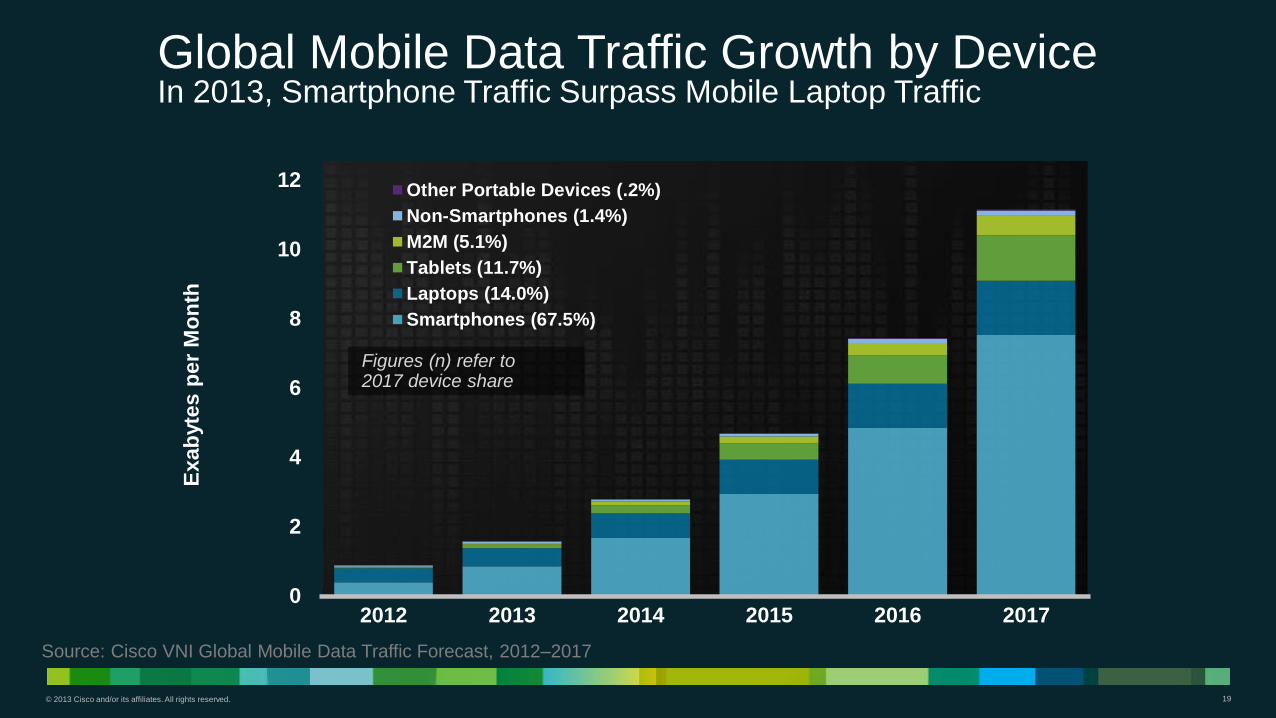
Other Portable Devices (.2%)
Non-Smartphones (1.4%)
M2M (5.1%)
Tablets (11.7%)
Laptops (14.0%)
Smartphones (67.5%)
Global Mobile Data Traffic Growth by Device In 2013, Smartphone Traffic Surpass Mobile Laptop Traffic
Figures (n) refer to 2017 device share
Source: Cisco VNI Global Mobile Data Traffic Forecast, 2012–2017
© 2013 Cisco and/or its affiliates. All rights reserved. 20
0.00
0.01
0.02
0.03
0.04
0.05
0.06
0.07
0.08
2012 2013 2014 2015 2016 2017
Exab
yte
s p
er
Mo
nth
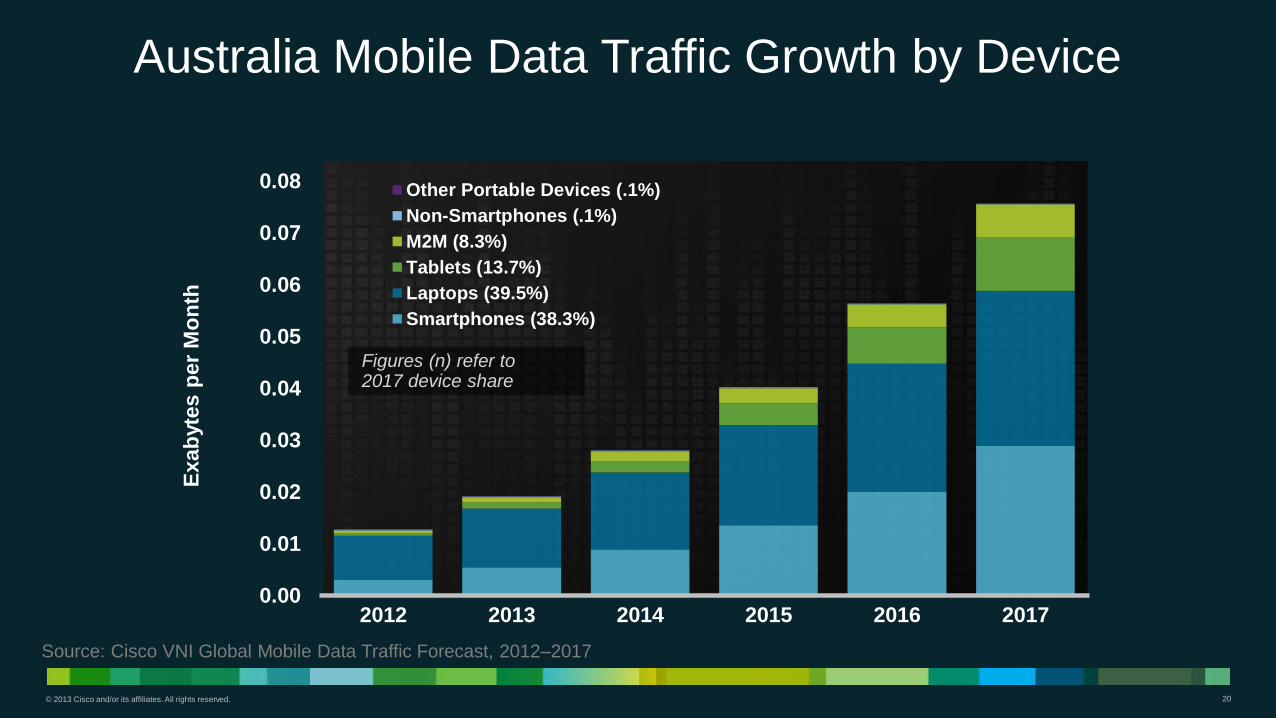
Other Portable Devices (.1%)
Non-Smartphones (.1%)
M2M (8.3%)
Tablets (13.7%)
Laptops (39.5%)
Smartphones (38.3%)
Australia Mobile Data Traffic Growth by Device
Figures (n) refer to 2017 device share
Source: Cisco VNI Global Mobile Data Traffic Forecast, 2012–2017
© 2013 Cisco and/or its affiliates. All rights reserved. 21
0.000
0.002
0.004
0.006
0.008
0.010
0.012
0.014
2012 2013 2014 2015 2016 2017
Exab
yte
s p
er
Mo
nth
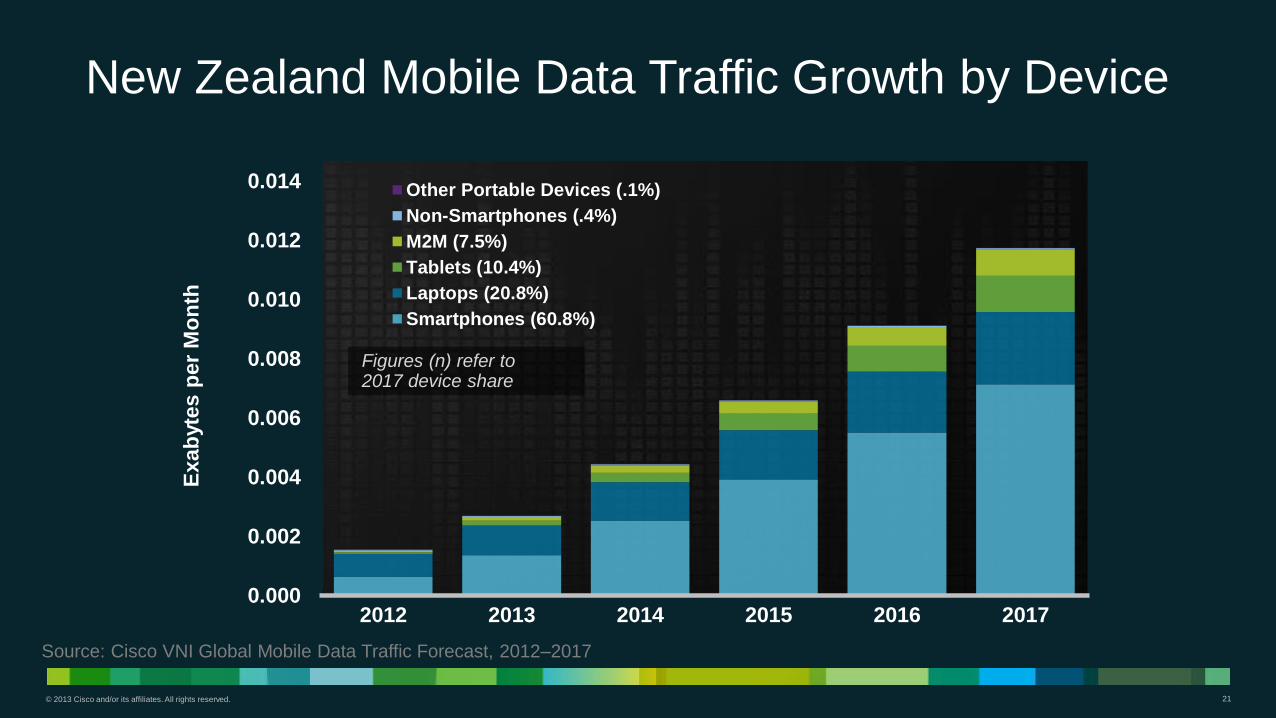
Other Portable Devices (.1%)
Non-Smartphones (.4%)
M2M (7.5%)
Tablets (10.4%)
Laptops (20.8%)
Smartphones (60.8%)
New Zealand Mobile Data Traffic Growth by Device
Figures (n) refer to 2017 device share
Source: Cisco VNI Global Mobile Data Traffic Forecast, 2012–2017
© 2013 Cisco and/or its affiliates. All rights reserved. 22
VNI Mobile Forecast Update, 2012–2017 Top 5 Mobile Networking Trends
Device Diversification
Impact of 4G Connections on Traffic
Traffic Offload from Mobile Networks to Fixed Networks
The (Mobile) Internet of Things
Mobile Video and Cloud readiness
© 2013 Cisco and/or its affiliates. All rights reserved. 23
0
1
2
3
4
5
6
7
2012 2013 2014 2015 2016 2017
Bil
lio
ns o
f D
evic
es o
r C
on
necti
on
s 4G
3G2G
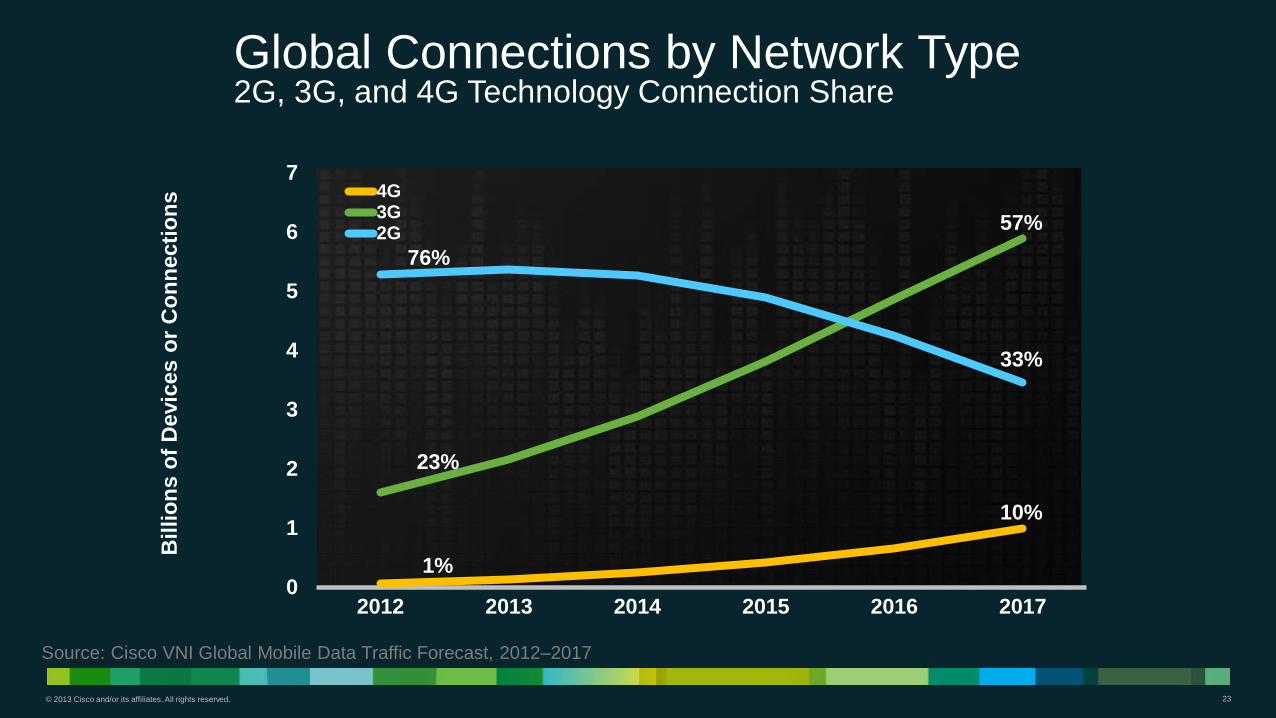
Global Connections by Network Type 2G, 3G, and 4G Technology Connection Share
57%
76%
23%
1%
33%
10%
Source: Cisco VNI Global Mobile Data Traffic Forecast, 2012–2017
© 2013 Cisco and/or its affiliates. All rights reserved. 24
0
5
10
15
20
25
30
35
40
45
50
2012 2013 2014 2015 2016 2017
Millio
ns o
f D
evic
es o
r C
on
necti
on
s 4G
3G2G
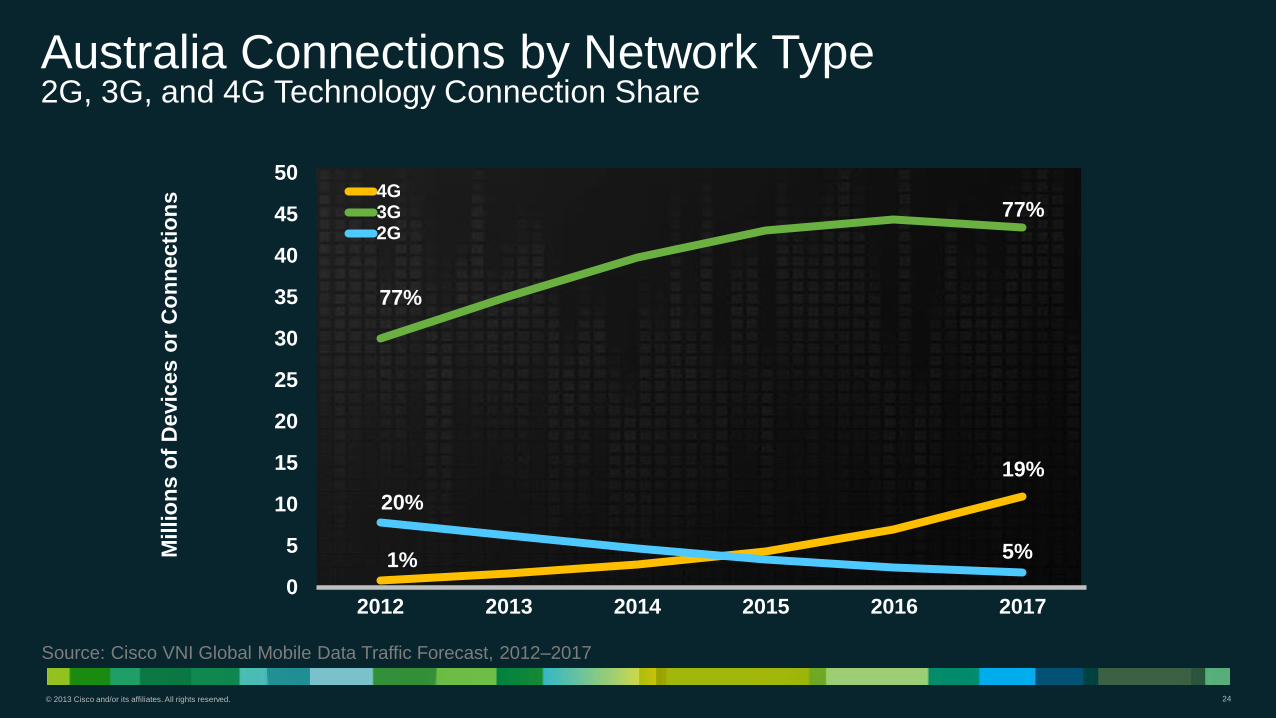
Australia Connections by Network Type 2G, 3G, and 4G Technology Connection Share
77%
77%
20%
1% 5%
19%
Source: Cisco VNI Global Mobile Data Traffic Forecast, 2012–2017
© 2013 Cisco and/or its affiliates. All rights reserved. 25
0
1
2
3
4
5
6
7
8
9
2012 2013 2014 2015 2016 2017
Millio
ns o
f D
evic
es o
r C
on
necti
on
s 4G
3G2G
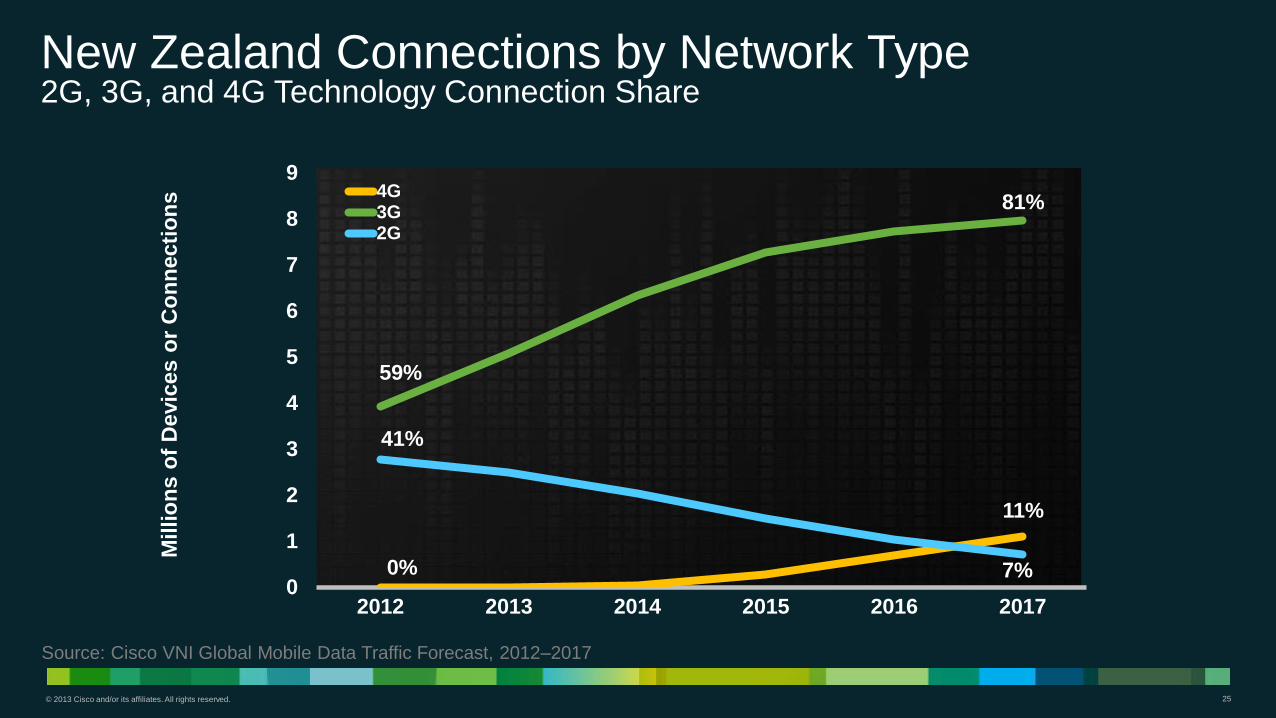
New Zealand Connections by Network Type 2G, 3G, and 4G Technology Connection Share
81%
59%
41%
0% 7%
11%
Source: Cisco VNI Global Mobile Data Traffic Forecast, 2012–2017
© 2013 Cisco and/or its affiliates. All rights reserved. 26
0
2
4
6
8
10
2012 2013 2014 2015 2016 2017
Exab
yte
s p
er
Mo
nth
2-2.5G
3-3.5G
4G
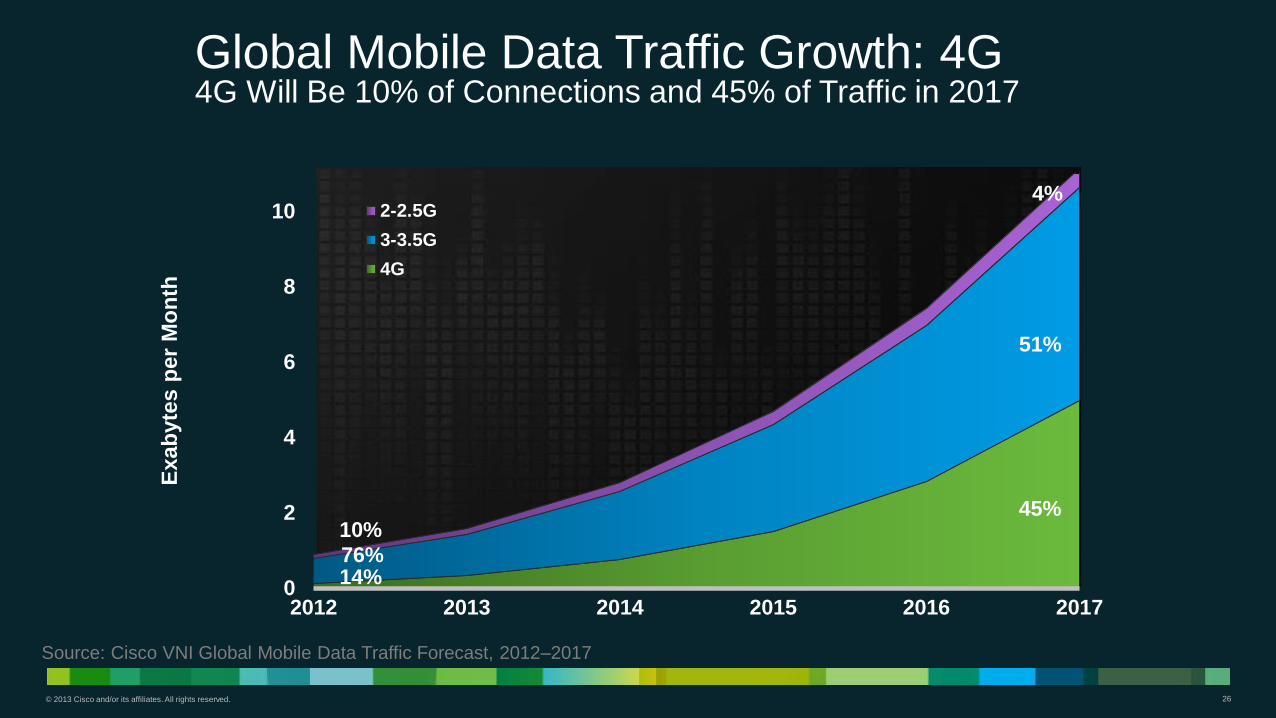
Global Mobile Data Traffic Growth: 4G 4G Will Be 10% of Connections and 45% of Traffic in 2017
14%
45%
51%
10%
76%
4%
Source: Cisco VNI Global Mobile Data Traffic Forecast, 2012–2017
© 2013 Cisco and/or its affiliates. All rights reserved. 27
0
0.01
0.02
0.03
0.04
0.05
0.06
0.07
0.08
2012 2013 2014 2015 2016 2017
Exab
yte
s p
er
Mo
nth
2-2.5G
3-3.5G
4G
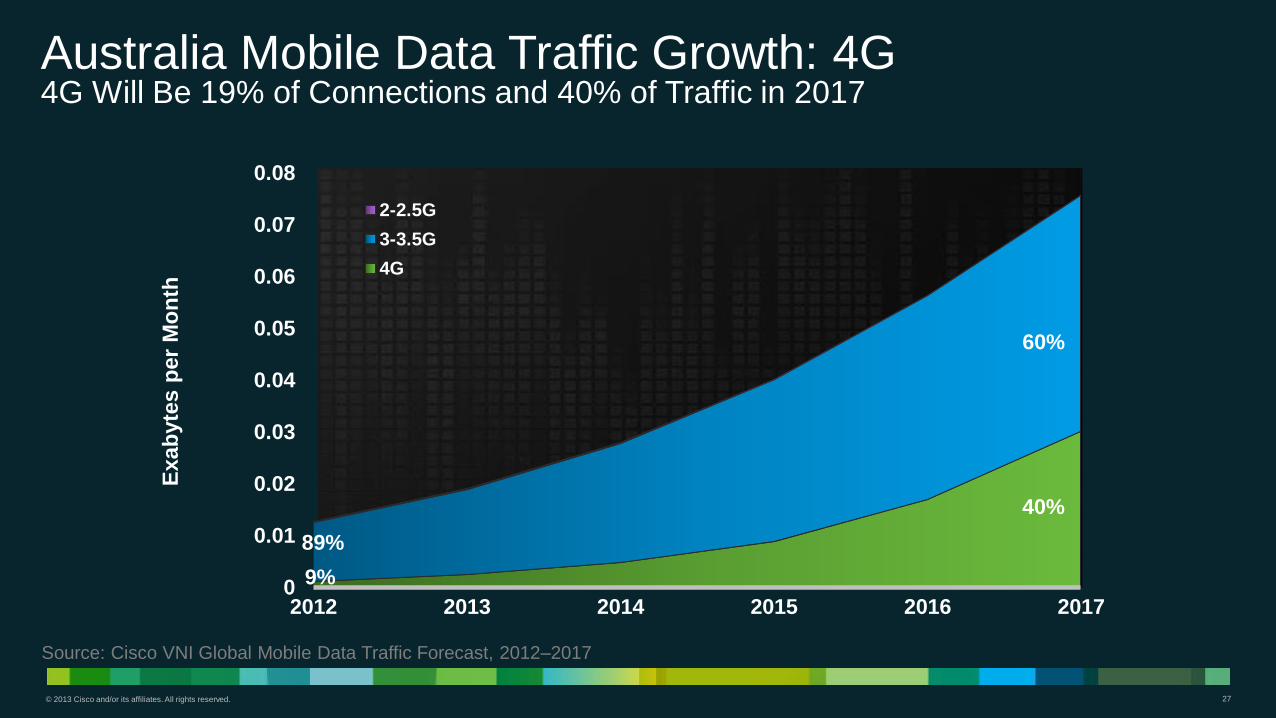
Australia Mobile Data Traffic Growth: 4G 4G Will Be 19% of Connections and 40% of Traffic in 2017
40%
60%
Source: Cisco VNI Global Mobile Data Traffic Forecast, 2012–2017
89%
9%
© 2013 Cisco and/or its affiliates. All rights reserved. 28
0
0.002
0.004
0.006
0.008
0.01
0.012
0.014
2012 2013 2014 2015 2016 2017
Exab
yte
s p
er
Mo
nth
2-2.5G
3-3.5G
4G
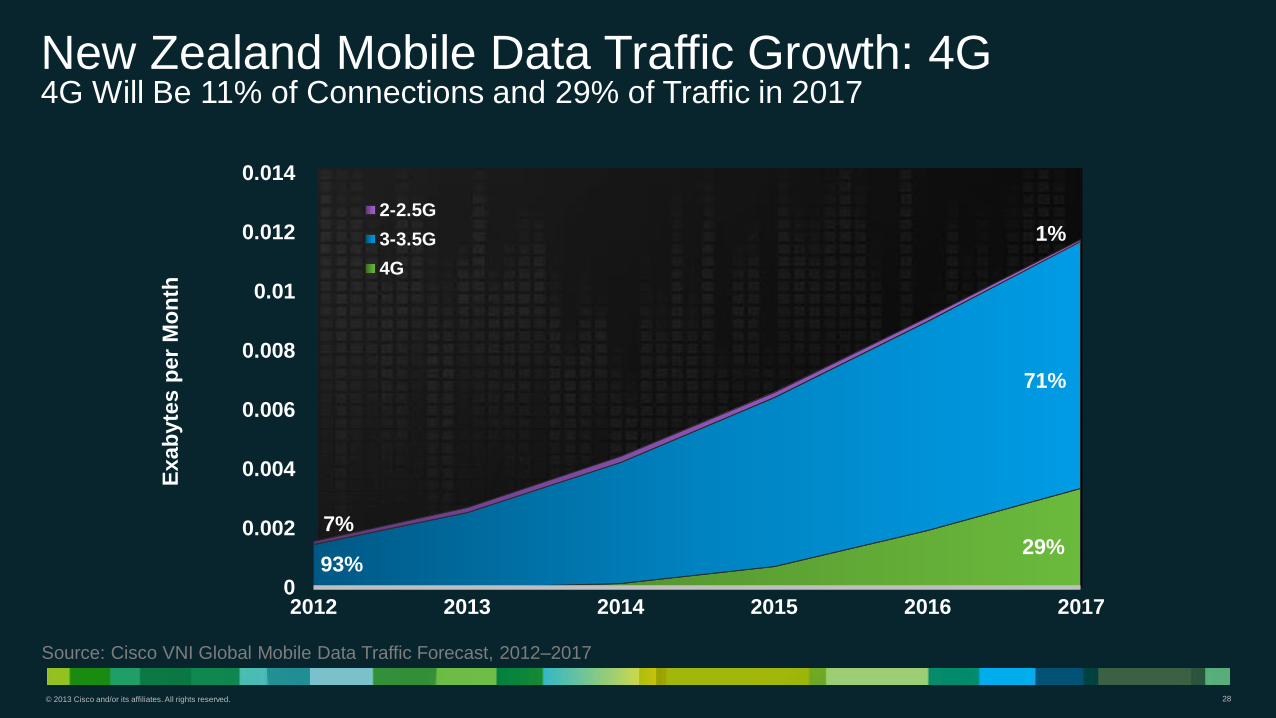
New Zealand Mobile Data Traffic Growth: 4G 4G Will Be 11% of Connections and 29% of Traffic in 2017
29%
71%
Source: Cisco VNI Global Mobile Data Traffic Forecast, 2012–2017
7%
93%
1%
© 2013 Cisco and/or its affiliates. All rights reserved. 29
VNI Mobile Forecast Update, 2012–2017 Top 5 Mobile Networking Trends
Device Diversification
Impact of 4G Connections on Traffic
Traffic Offload from Mobile Networks to Fixed Networks
The (Mobile) Internet of Things
Mobile Video and Cloud readiness
© 2013 Cisco and/or its affiliates. All rights reserved. 30
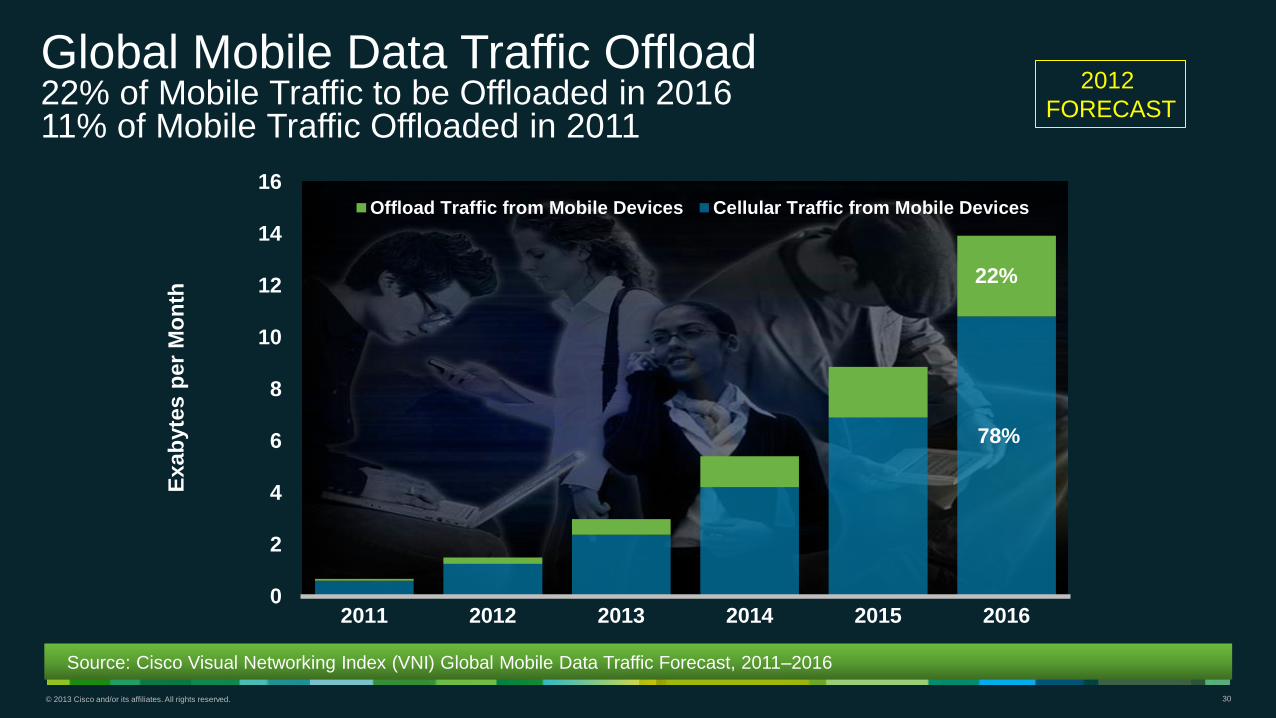
0
2
4
6
8
10
12
14
16
2011 2012 2013 2014 2015 2016
Exab
yte
s p
er
Mo
nth
Offload Traffic from Mobile Devices Cellular Traffic from Mobile Devices
Global Mobile Data Traffic Offload 22% of Mobile Traffic to be Offloaded in 2016 11% of Mobile Traffic Offloaded in 2011
22%
78%
Source: Cisco Visual Networking Index (VNI) Global Mobile Data Traffic Forecast, 2011–2016
2012
FORECAST
© 2013 Cisco and/or its affiliates. All rights reserved. 31
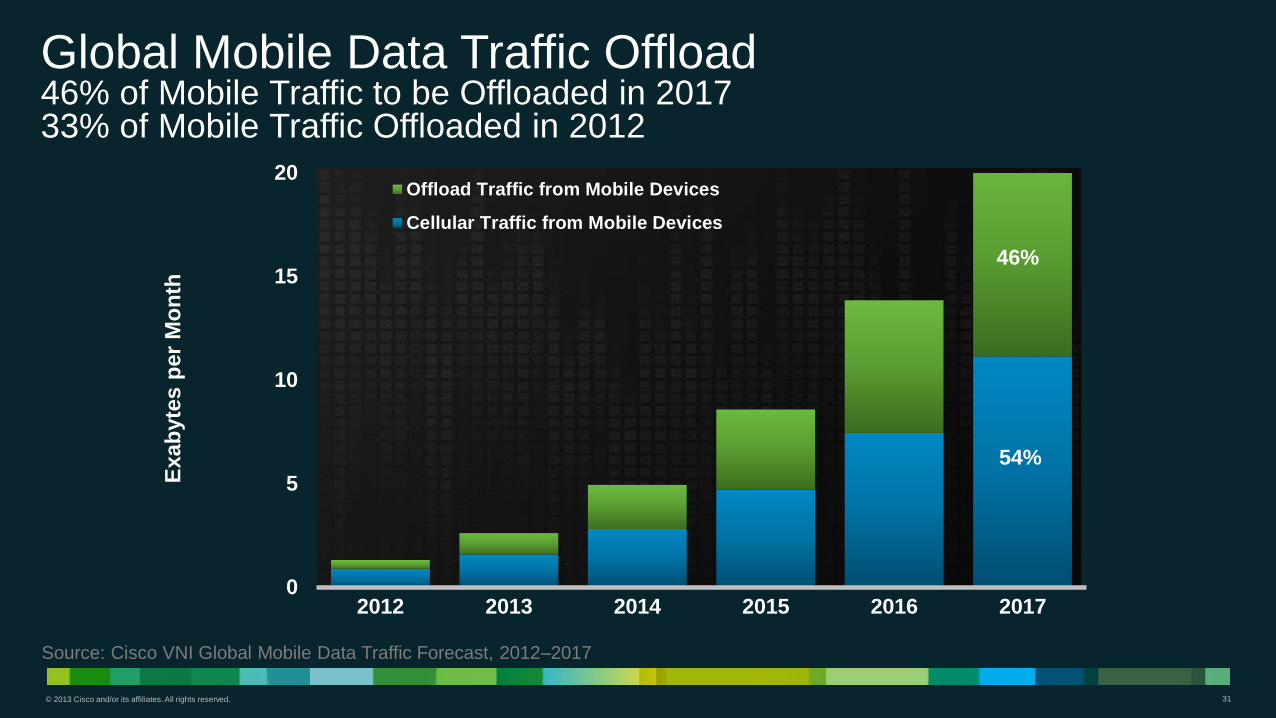
0
5
10
15
20
2012 2013 2014 2015 2016 2017
Exab
yte
s p
er
Mo
nth
Offload Traffic from Mobile Devices
Cellular Traffic from Mobile Devices
Global Mobile Data Traffic Offload 46% of Mobile Traffic to be Offloaded in 2017 33% of Mobile Traffic Offloaded in 2012
46%
54%
Source: Cisco VNI Global Mobile Data Traffic Forecast, 2012–2017
© 2013 Cisco and/or its affiliates. All rights reserved. 32
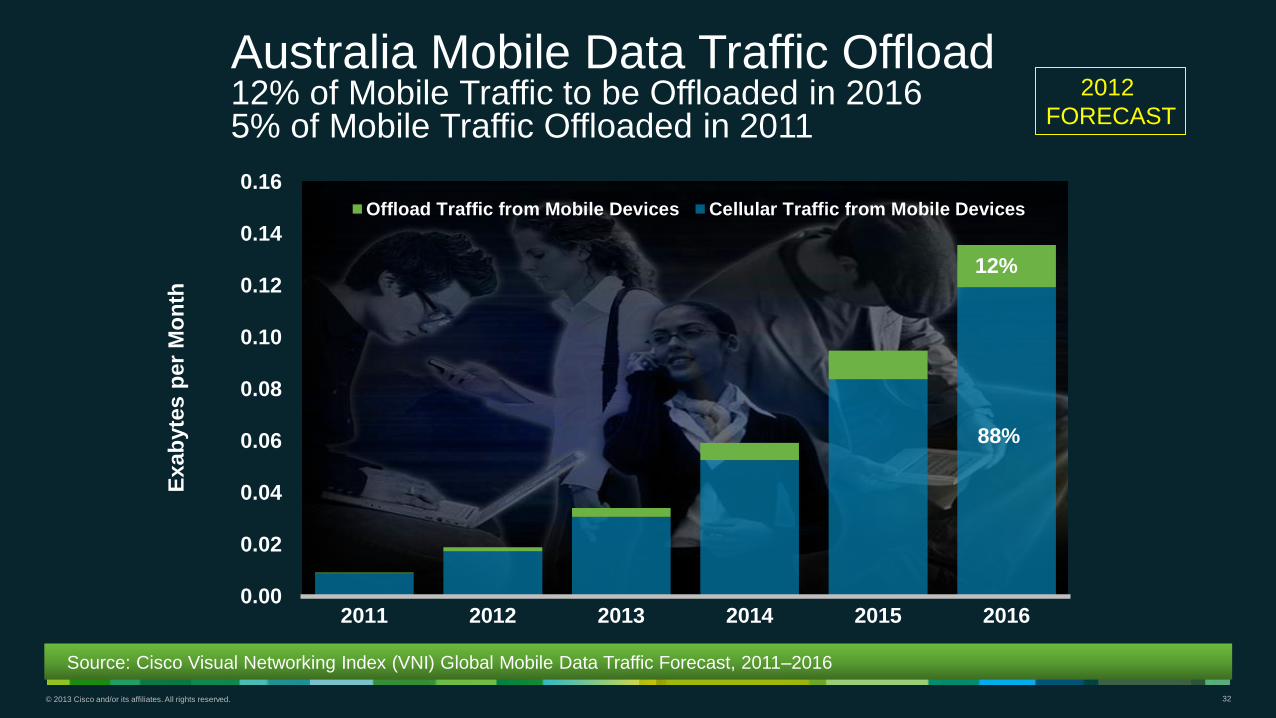
0.00
0.02
0.04
0.06
0.08
0.10
0.12
0.14
0.16
2011 2012 2013 2014 2015 2016
Exab
yte
s p
er
Mo
nth
Offload Traffic from Mobile Devices Cellular Traffic from Mobile Devices
Australia Mobile Data Traffic Offload 12% of Mobile Traffic to be Offloaded in 2016 5% of Mobile Traffic Offloaded in 2011
12%
88%
Source: Cisco Visual Networking Index (VNI) Global Mobile Data Traffic Forecast, 2011–2016
2012
FORECAST
© 2013 Cisco and/or its affiliates. All rights reserved. 33
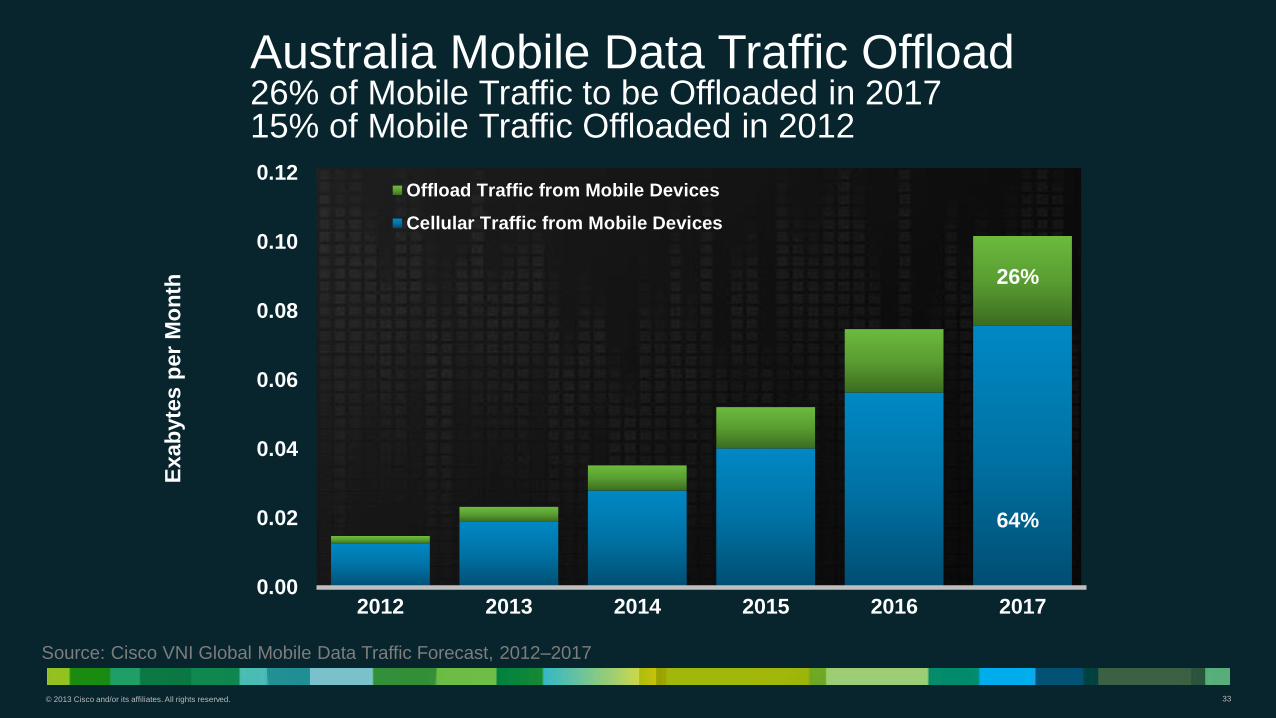
0.00
0.02
0.04
0.06
0.08
0.10
0.12
2012 2013 2014 2015 2016 2017
Exab
yte
s p
er
Mo
nth
Offload Traffic from Mobile Devices
Cellular Traffic from Mobile Devices
Australia Mobile Data Traffic Offload 26% of Mobile Traffic to be Offloaded in 2017 15% of Mobile Traffic Offloaded in 2012
26%
64%
Source: Cisco VNI Global Mobile Data Traffic Forecast, 2012–2017
© 2013 Cisco and/or its affiliates. All rights reserved. 34
0.0
1.0
2.0
3.0
4.0
5.0
6.0
2012 2013 2014 2015 2016 2017
Exab
yte
s p
er
Mo
nth
Offload Traffic from Mobile Devices
Cellular Traffic from Mobile Devices
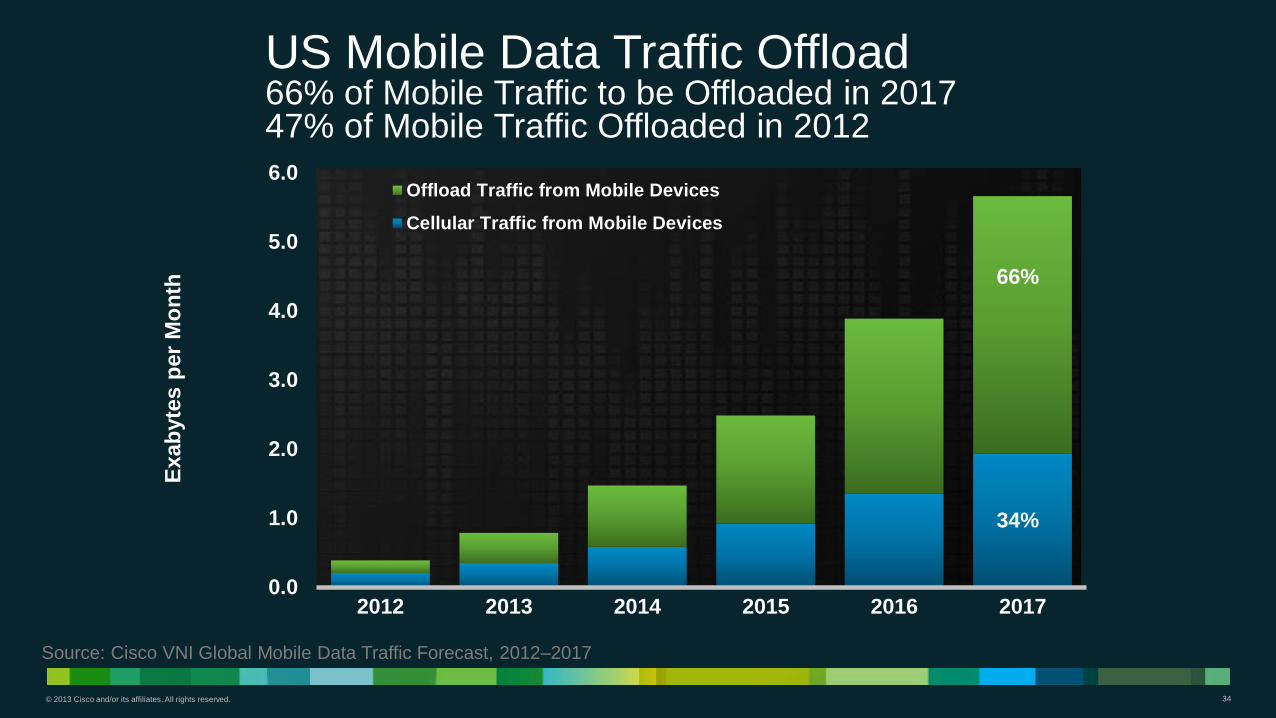
US Mobile Data Traffic Offload 66% of Mobile Traffic to be Offloaded in 2017 47% of Mobile Traffic Offloaded in 2012
66%
34%
Source: Cisco VNI Global Mobile Data Traffic Forecast, 2012–2017
© 2013 Cisco and/or its affiliates. All rights reserved. 35
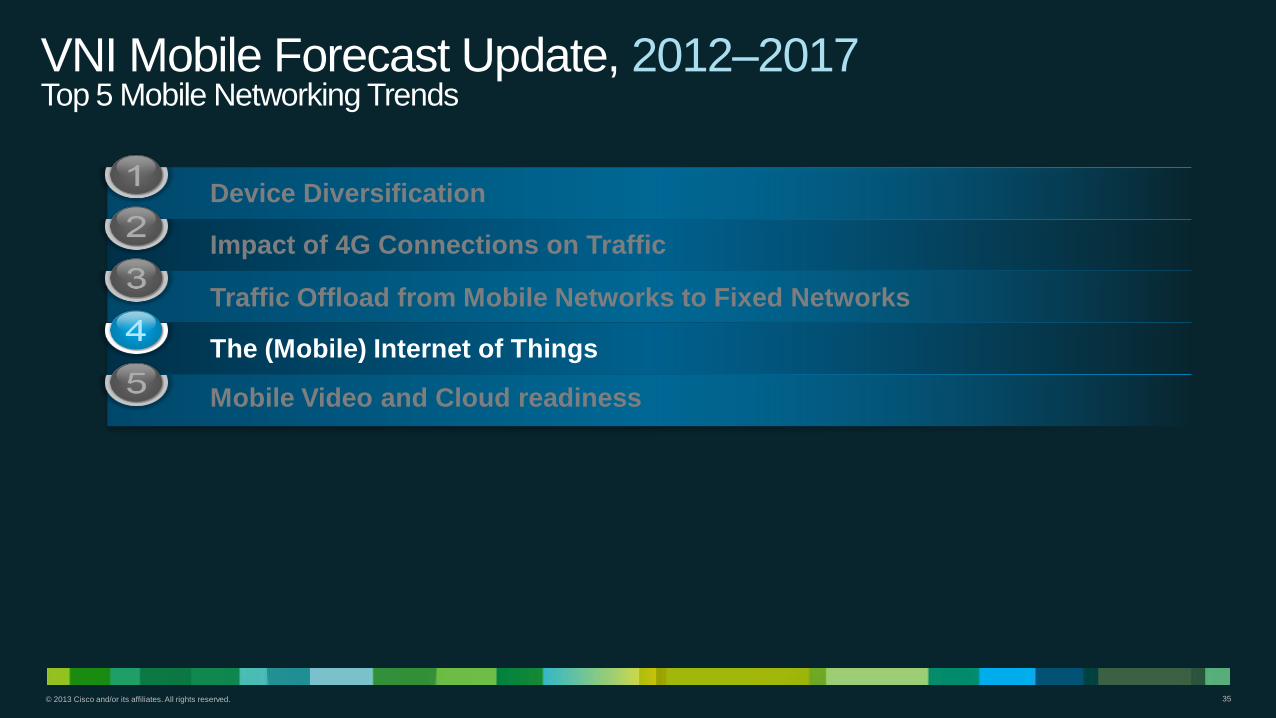
VNI Mobile Forecast Update, 2012–2017 Top 5 Mobile Networking Trends
Device Diversification
Impact of 4G Connections on Traffic
Traffic Offload from Mobile Networks to Fixed Networks
The (Mobile) Internet of Things
Mobile Video and Cloud readiness
© 2013 Cisco and/or its affiliates. All rights reserved. 36
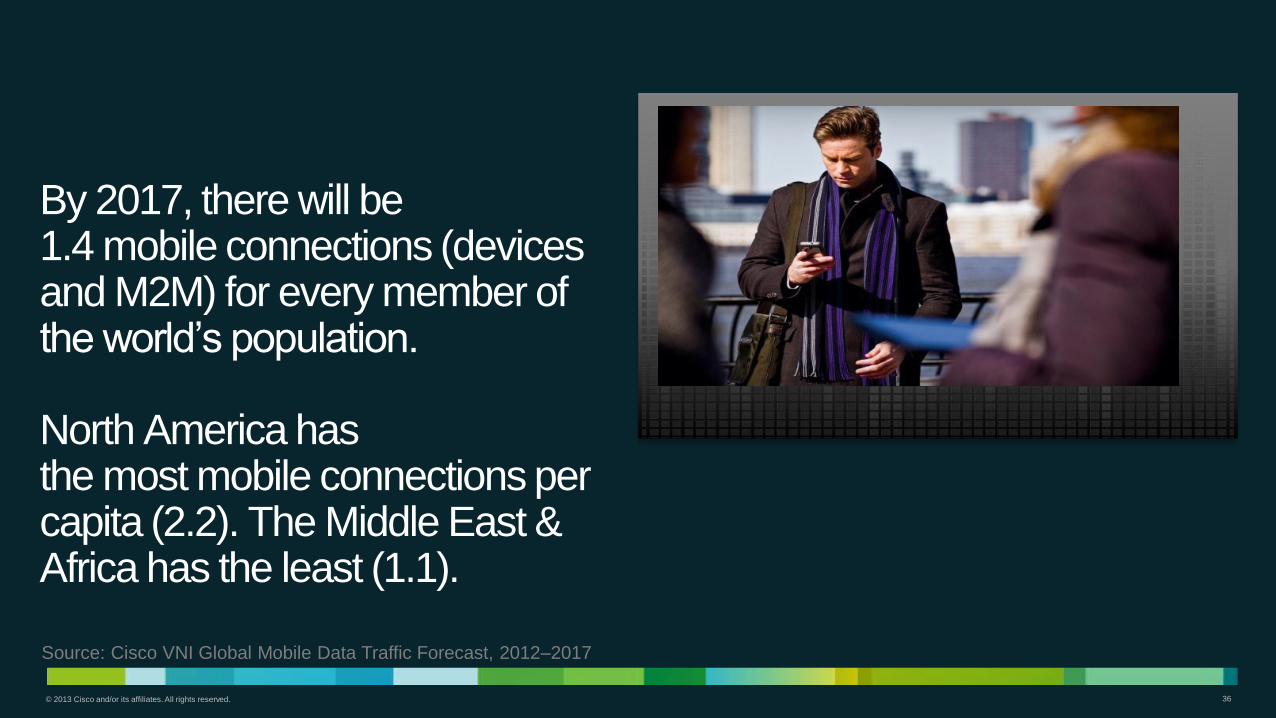
By 2017, there will be 1.4 mobile connections (devices and M2M) for every member of the world’s population. North America has the most mobile connections per capita (2.2). The Middle East & Africa has the least (1.1).
Source: Cisco VNI Global Mobile Data Traffic Forecast, 2012–2017
© 2013 Cisco and/or its affiliates. All rights reserved. 37
39
56
20 22
0
10
20
30
40
50
60
2012 2013 2014 2015 2016 2017
Mil
lio
ns
Devices
Users
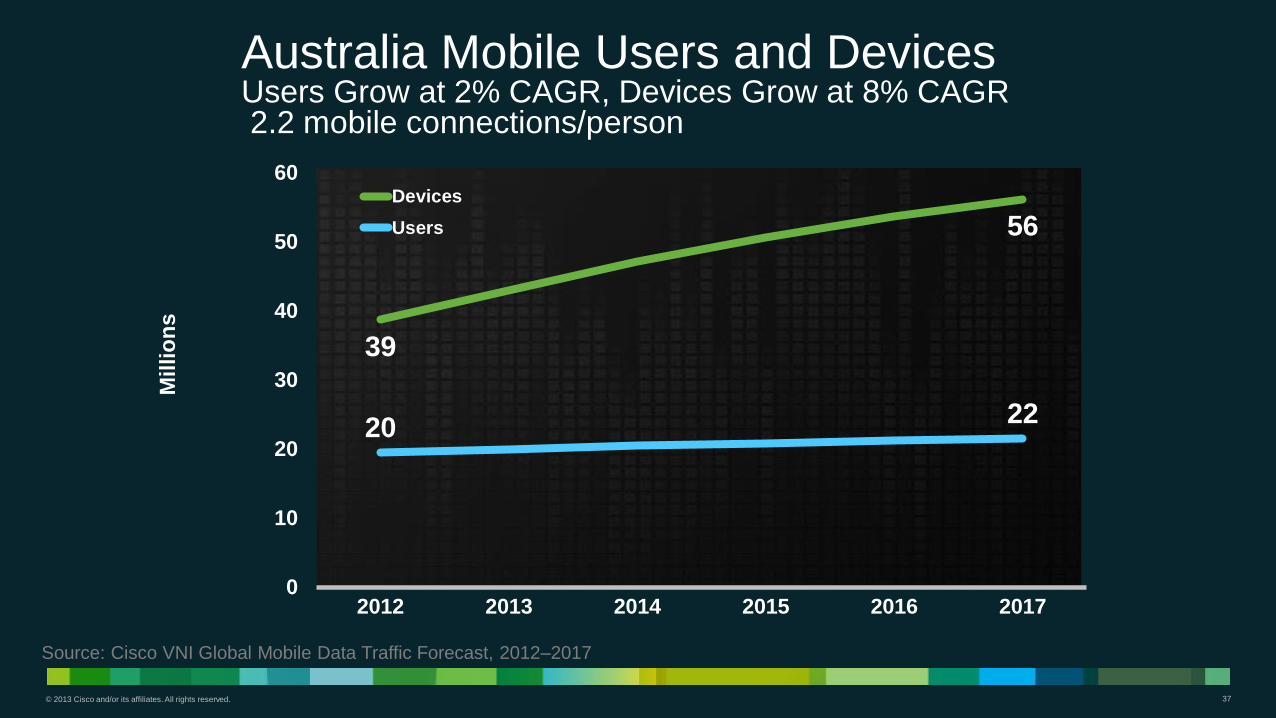
Australia Mobile Users and Devices Users Grow at 2% CAGR, Devices Grow at 8% CAGR 2.2 mobile connections/person
Source: Cisco VNI Global Mobile Data Traffic Forecast, 2012–2017
© 2013 Cisco and/or its affiliates. All rights reserved. 38
VNI Mobile Forecast Update, 2012–2017 Top 5 Mobile Networking Trends
Device Diversification
Impact of 4G Connections on Traffic
Traffic Offload from Mobile Networks to Fixed Networks
The (Mobile) Internet of Things
Mobile Video and Cloud Readiness
© 2013 Cisco and/or its affiliates. All rights reserved. 39
0.00
0.01
0.02
0.03
0.04
0.05
0.06
0.07
0.08
2012 2013 2014 2015 2016 2017
Exab
yte
s p
er
Mo
nth
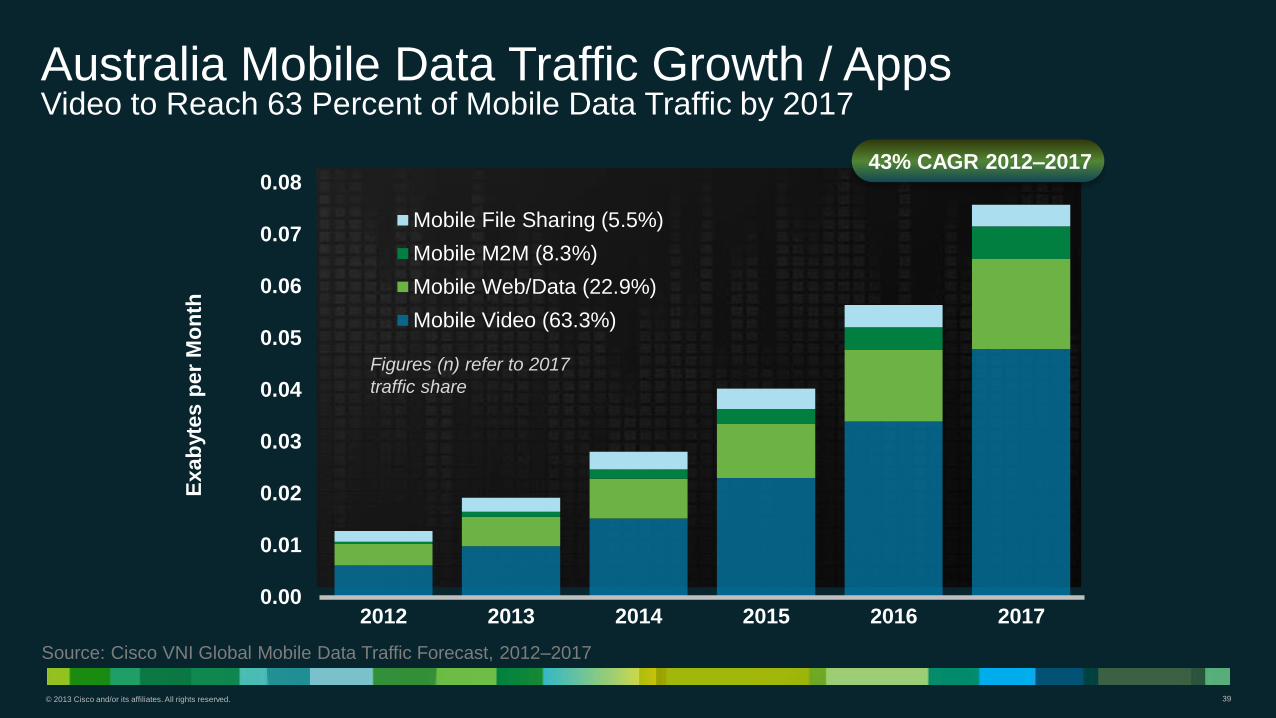
Mobile File Sharing (5.5%)
Mobile M2M (8.3%)
Mobile Web/Data (22.9%)
Mobile Video (63.3%)
43% CAGR 2012–2017
Australia Mobile Data Traffic Growth / Apps Video to Reach 63 Percent of Mobile Data Traffic by 2017
Figures (n) refer to 2017
traffic share
Source: Cisco VNI Global Mobile Data Traffic Forecast, 2012–2017
© 2013 Cisco and/or its affiliates. All rights reserved. 40
0.000
0.002
0.004
0.006
0.008
0.010
0.012
0.014
2012 2013 2014 2015 2016 2017
Exab
yte
s p
er
Mo
nth
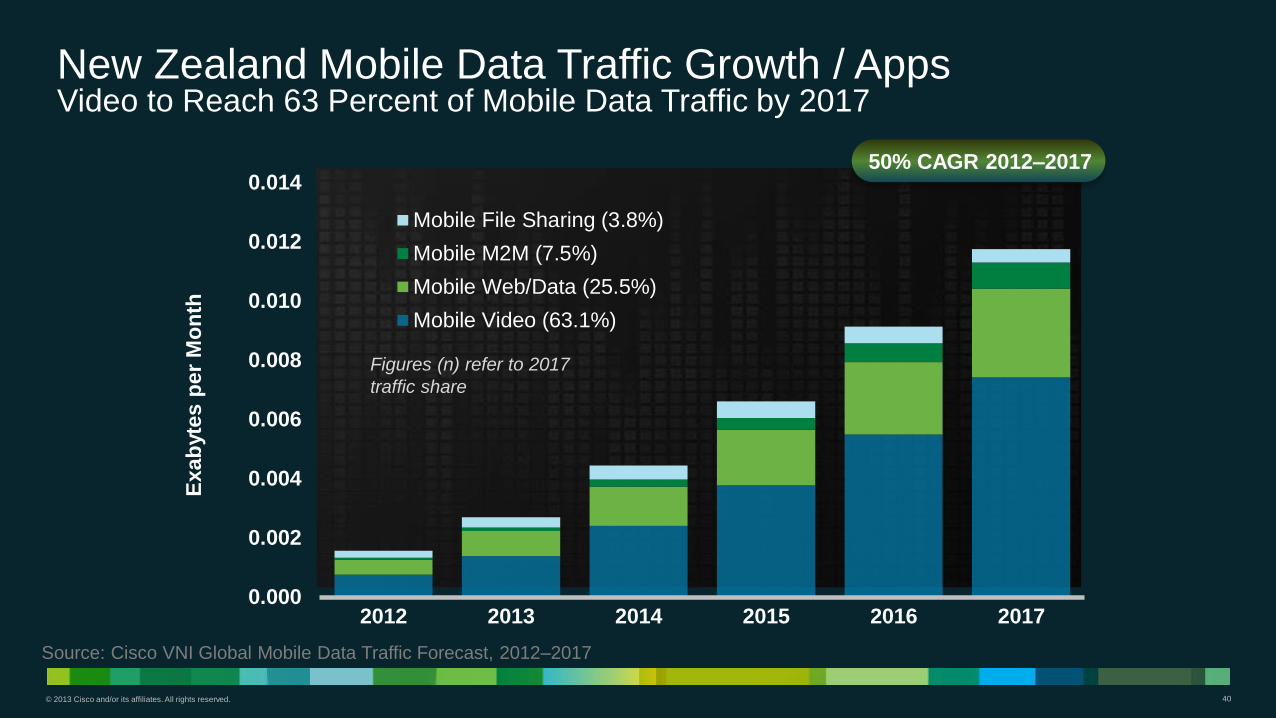
Mobile File Sharing (3.8%)
Mobile M2M (7.5%)
Mobile Web/Data (25.5%)
Mobile Video (63.1%)
50% CAGR 2012–2017
New Zealand Mobile Data Traffic Growth / Apps Video to Reach 63 Percent of Mobile Data Traffic by 2017
Figures (n) refer to 2017
traffic share
Source: Cisco VNI Global Mobile Data Traffic Forecast, 2012–2017
© 2013 Cisco and/or its affiliates. All rights reserved. 41
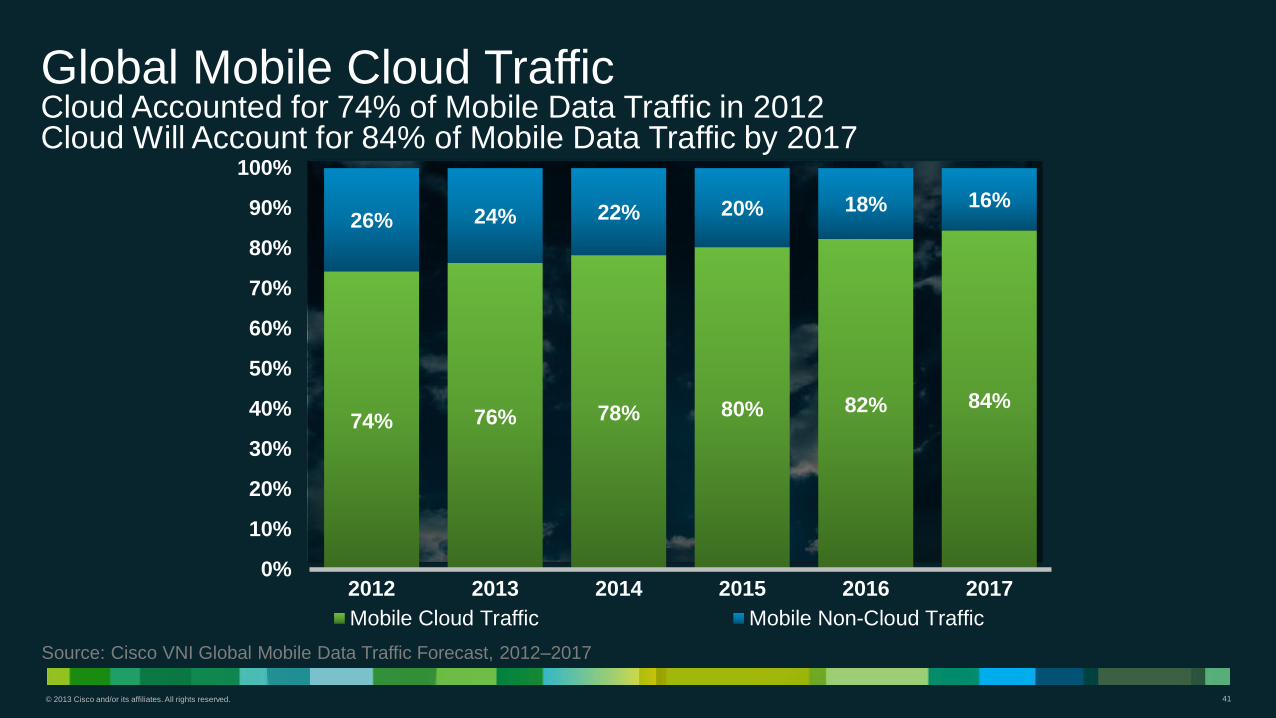
74% 76% 78% 80% 82% 84%
26% 24% 22% 20% 18% 16%
0%
10%
20%
30%
40%
50%
60%
70%
80%
90%
100%
2012 2013 2014 2015 2016 2017
Mobile Cloud Traffic Mobile Non-Cloud Traffic
Global Mobile Cloud Traffic Cloud Accounted for 74% of Mobile Data Traffic in 2012 Cloud Will Account for 84% of Mobile Data Traffic by 2017
Source: Cisco VNI Global Mobile Data Traffic Forecast, 2012–2017
© 2013 Cisco and/or its affiliates. All rights reserved. 42
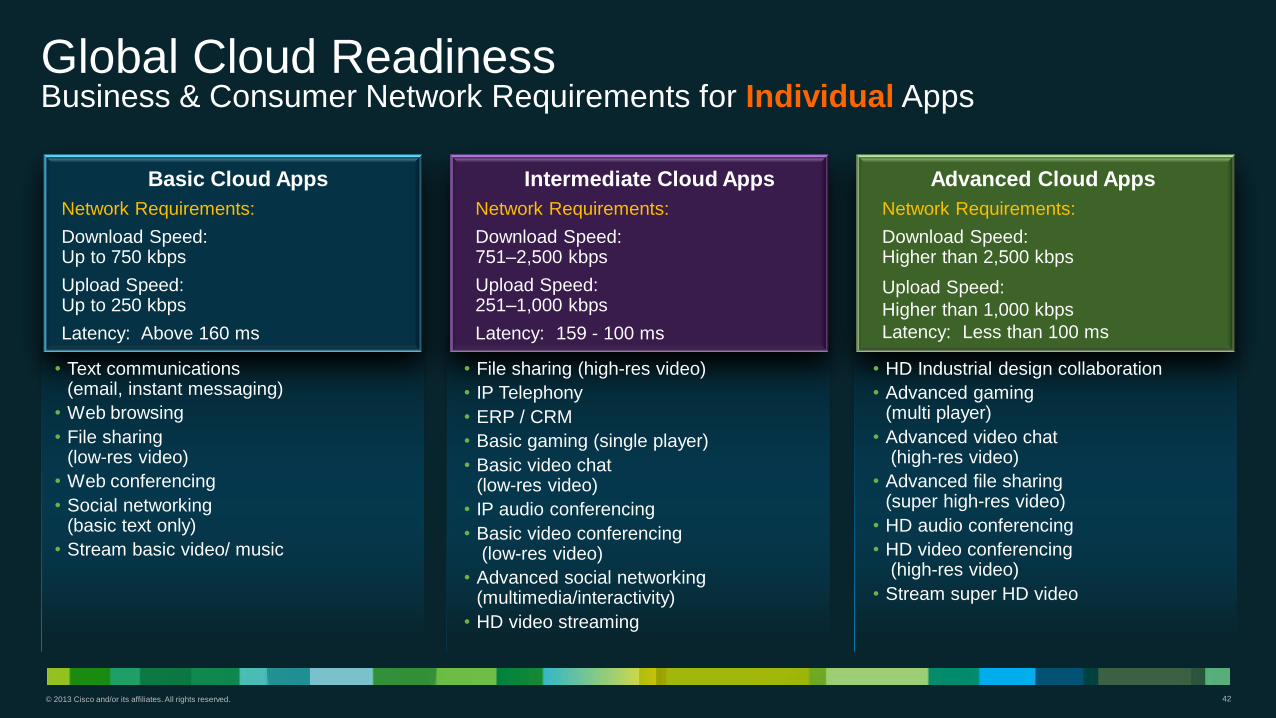
Global Cloud Readiness Business & Consumer Network Requirements for Individual Apps
Basic Cloud Apps
Network Requirements:
Download Speed: Up to 750 kbps
Upload Speed: Up to 250 kbps
Latency: Above 160 ms
Intermediate Cloud Apps
Network Requirements:
Download Speed: 751–2,500 kbps
Upload Speed: 251–1,000 kbps
Latency: 159 - 100 ms
Advanced Cloud Apps
Network Requirements:
Download Speed: Higher than 2,500 kbps
Upload Speed:
Higher than 1,000 kbps
Latency: Less than 100 ms
• Text communications (email, instant messaging)
• Web browsing
• File sharing (low-res video)
• Web conferencing
• Social networking (basic text only)
• Stream basic video/ music
• File sharing (high-res video)
• IP Telephony
• ERP / CRM
• Basic gaming (single player)
• Basic video chat (low-res video)
• IP audio conferencing
• Basic video conferencing (low-res video)
• Advanced social networking (multimedia/interactivity)
• HD video streaming
• HD Industrial design collaboration
• Advanced gaming (multi player)
• Advanced video chat (high-res video)
• Advanced file sharing (super high-res video)
• HD audio conferencing
• HD video conferencing (high-res video)
• Stream super HD video
© 2013 Cisco and/or its affiliates. All rights reserved. 43
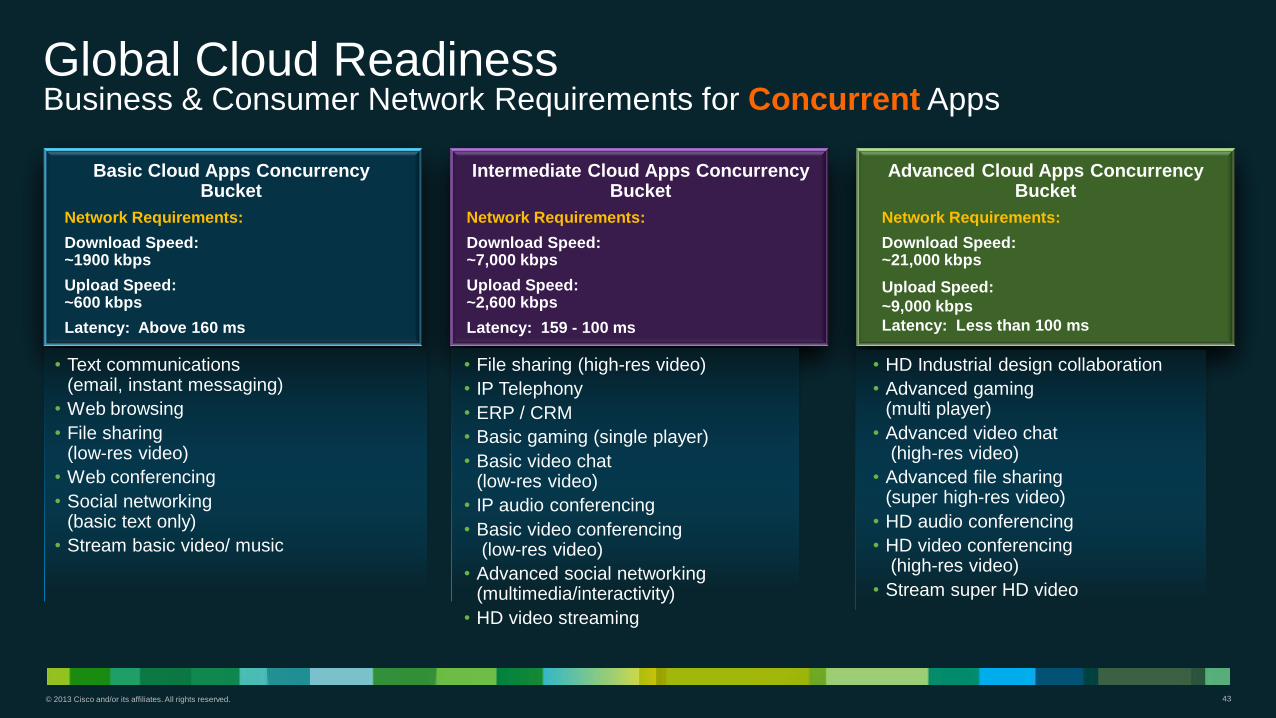
Global Cloud Readiness Business & Consumer Network Requirements for Concurrent Apps
Basic Cloud Apps Concurrency Bucket
Network Requirements:
Download Speed: ~1900 kbps
Upload Speed: ~600 kbps
Latency: Above 160 ms
Intermediate Cloud Apps Concurrency Bucket
Network Requirements:
Download Speed: ~7,000 kbps
Upload Speed: ~2,600 kbps
Latency: 159 - 100 ms
Advanced Cloud Apps Concurrency Bucket
Network Requirements:
Download Speed: ~21,000 kbps
Upload Speed:
~9,000 kbps
Latency: Less than 100 ms
• Text communications (email, instant messaging)
• Web browsing
• File sharing (low-res video)
• Web conferencing
• Social networking (basic text only)
• Stream basic video/ music
• File sharing (high-res video)
• IP Telephony
• ERP / CRM
• Basic gaming (single player)
• Basic video chat (low-res video)
• IP audio conferencing
• Basic video conferencing (low-res video)
• Advanced social networking (multimedia/interactivity)
• HD video streaming
• HD Industrial design collaboration
• Advanced gaming (multi player)
• Advanced video chat (high-res video)
• Advanced file sharing (super high-res video)
• HD audio conferencing
• HD video conferencing (high-res video)
• Stream super HD video
© 2013 Cisco and/or its affiliates. All rights reserved. 44
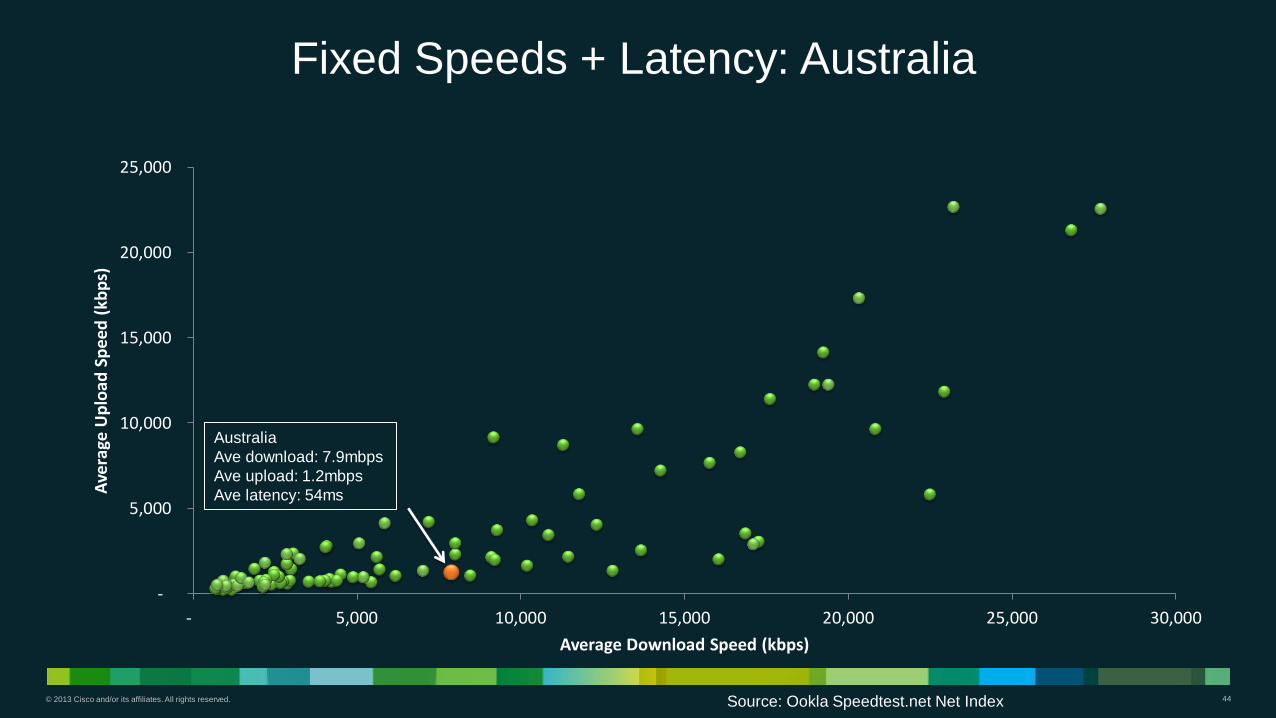
Fixed Speeds + Latency: Australia
Source: Ookla Speedtest.net Net Index
-
5,000
10,000
15,000
20,000
25,000
- 5,000 10,000 15,000 20,000 25,000 30,000
Ave
rage
Up
load
Sp
eed
(kb
ps)
Average Download Speed (kbps)
Australia
Ave download: 7.9mbps
Ave upload: 1.2mbps
Ave latency: 54ms
© 2013 Cisco and/or its affiliates. All rights reserved. 45
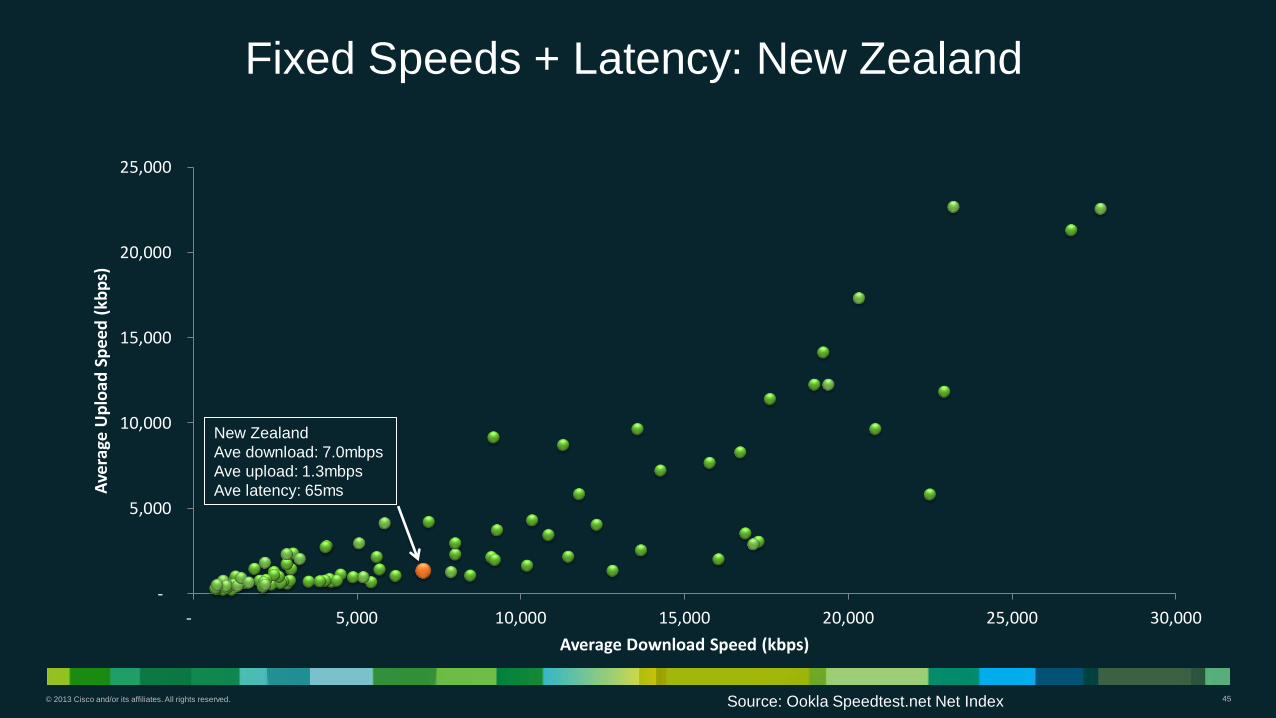
Fixed Speeds + Latency: New Zealand
Source: Ookla Speedtest.net Net Index
-
5,000
10,000
15,000
20,000
25,000
- 5,000 10,000 15,000 20,000 25,000 30,000
Ave
rage
Up
load
Sp
eed
(kb
ps)
Average Download Speed (kbps)
New Zealand
Ave download: 7.0mbps
Ave upload: 1.3mbps
Ave latency: 65ms
© 2013 Cisco and/or its affiliates. All rights reserved. 46
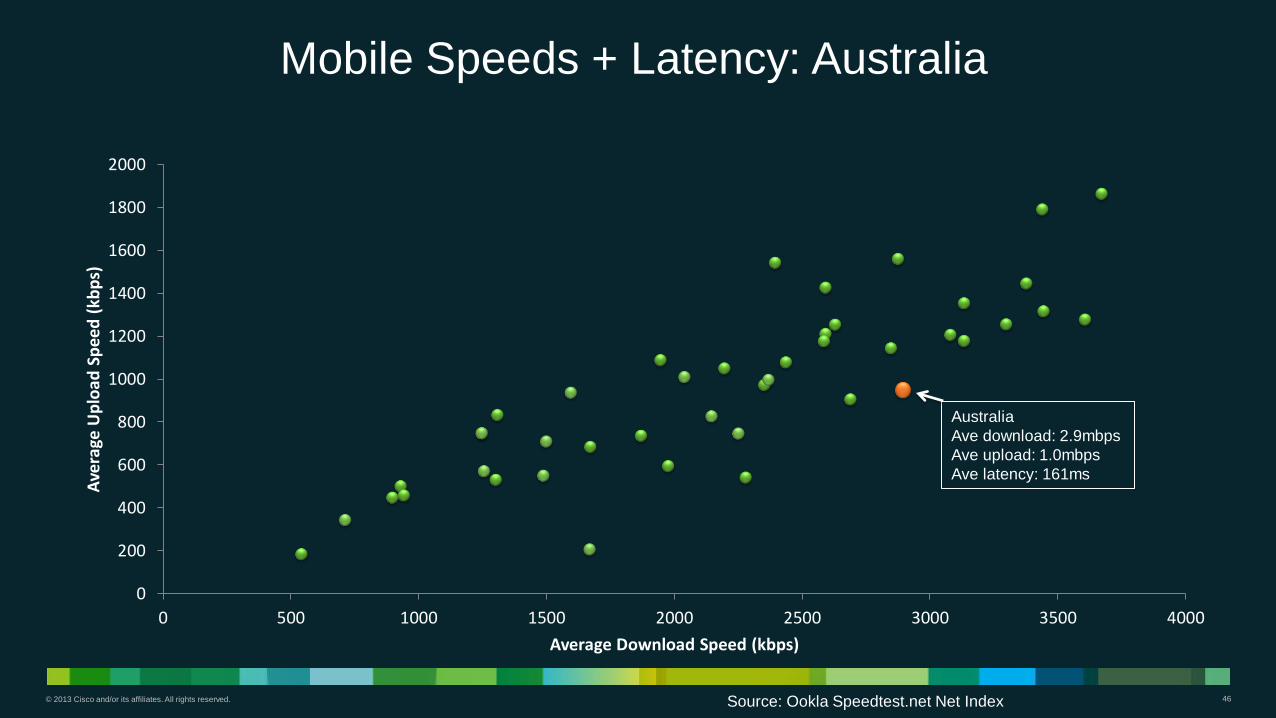
Mobile Speeds + Latency: Australia
Source: Ookla Speedtest.net Net Index
0
200
400
600
800
1000
1200
1400
1600
1800
2000
0 500 1000 1500 2000 2500 3000 3500 4000
Ave
rage
Up
load
Sp
eed
(kb
ps)
Average Download Speed (kbps)
Australia
Ave download: 2.9mbps
Ave upload: 1.0mbps
Ave latency: 161ms
© 2013 Cisco and/or its affiliates. All rights reserved. 47
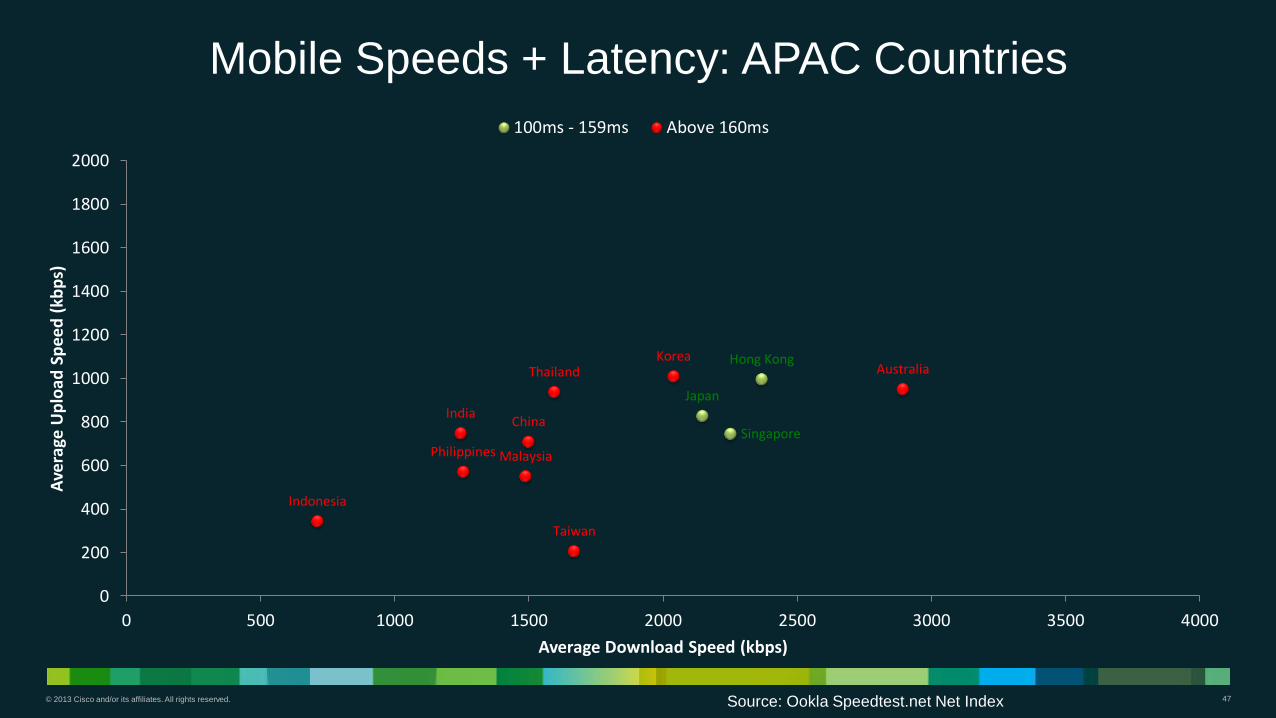
Mobile Speeds + Latency: APAC Countries
Source: Ookla Speedtest.net Net Index
Singapore
Hong Kong
Japan
Australia Korea
Thailand
Taiwan
Malaysia Philippines
India
Indonesia
China
0
200
400
600
800
1000
1200
1400
1600
1800
2000
0 500 1000 1500 2000 2500 3000 3500 4000
Ave
rage
Up
load
Sp
eed
(kb
ps)
Average Download Speed (kbps)
100ms - 159ms Above 160ms

© 2013 Cisco and/or its affiliates. All rights reserved. 48
Summary/Implications
© 2013 Cisco and/or its affiliates. All rights reserved. 49
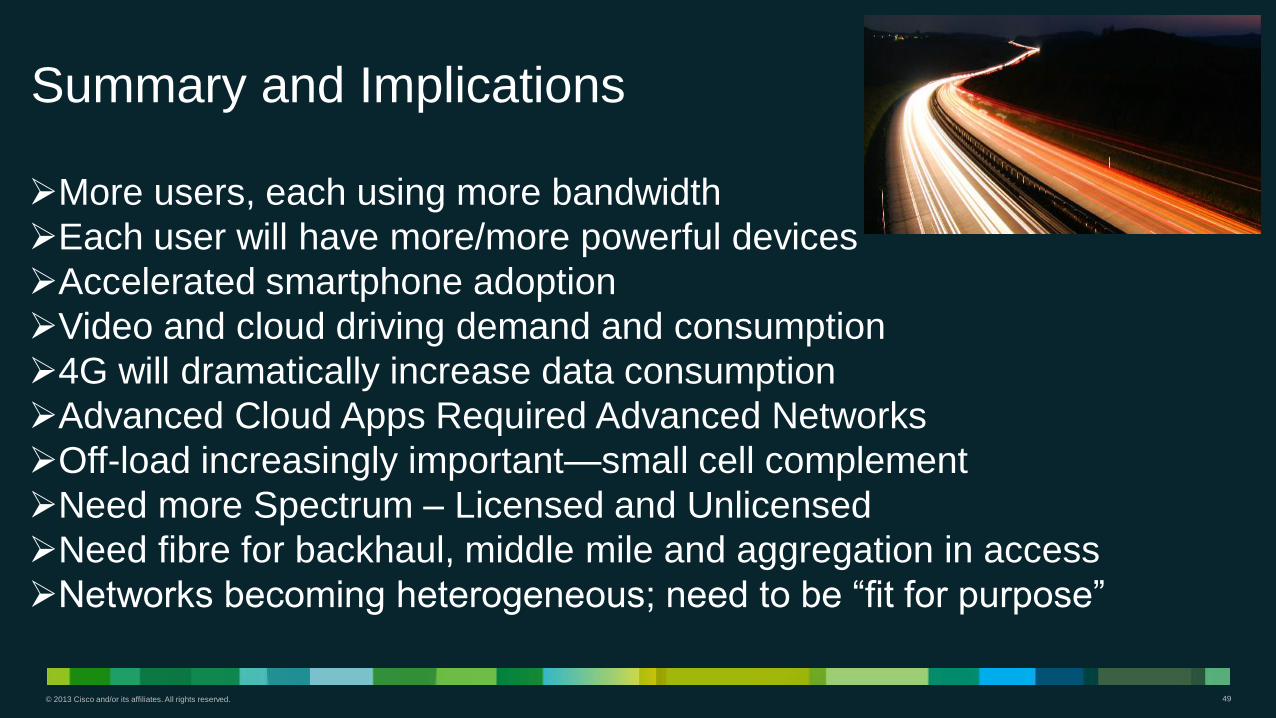
Summary and Implications
More users, each using more bandwidth
Each user will have more/more powerful devices
Accelerated smartphone adoption
Video and cloud driving demand and consumption
4G will dramatically increase data consumption
Advanced Cloud Apps Required Advanced Networks
Off-load increasingly important—small cell complement
Need more Spectrum – Licensed and Unlicensed
Need fibre for backhaul, middle mile and aggregation in access
Networks becoming heterogeneous; need to be “fit for purpose”

© 2013 Cisco and/or its affiliates. All rights reserved. 50
Thank you.
![P2P Offloading in Mobile Networks using SDNjmanbal/paper/p2p_slide.pdfSOURCE: [1] Cisco VNI Mobile, 2016 3 Mobile multimedia traffic on the rise. Cisco Forecast of mobile data traffic](https://cdn.vdocuments.site/doc/165x107/5f562376680a2d7e6f61393b/p2p-offloading-in-mobile-networks-using-jmanbalpaperp2pslidepdf-source-1.jpg)


