cisco visual networking index (vni) global mobile data traffic
TRANSCRIPT
© 2013 Cisco and/or its affiliates. All rights reserved. 1 1 © 2013 Cisco and/or its affiliates. All rights reserved. Cisco Confidential 1 © 2013 Cisco and/or its affiliates. All rights reserved.
Cisco Visual Networking Index (VNI) Global Mobile Data Traffic Forecast Update
Dr. Robert Pepper Vice President Global Technology Policy Mobile World Congress February 2013
© 2013 Cisco and/or its affiliates. All rights reserved. 2
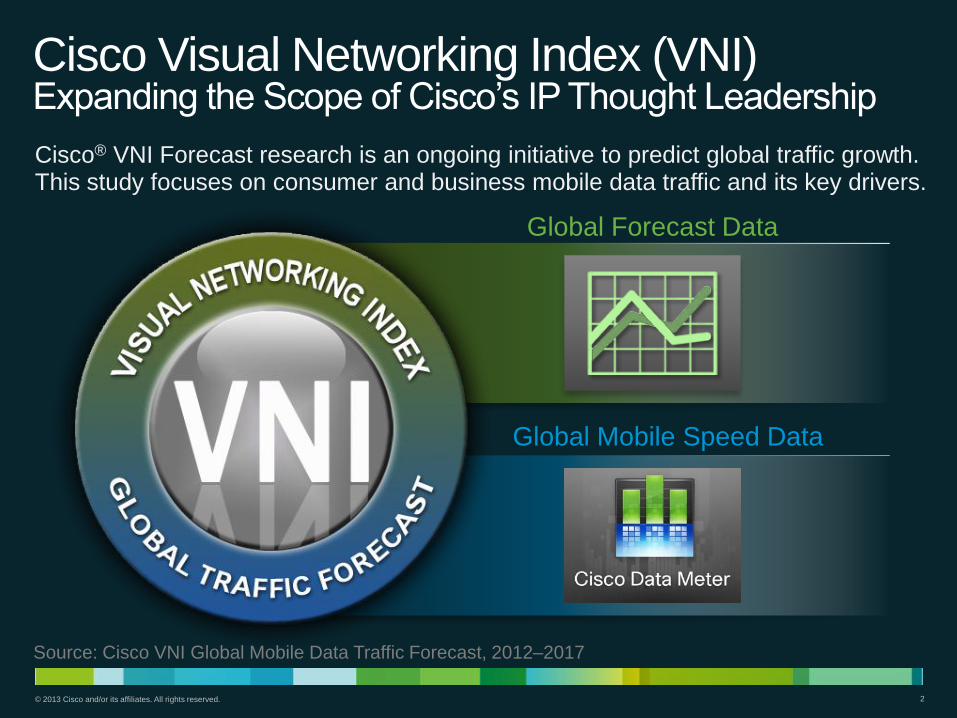
Cisco Visual Networking Index (VNI) Expanding the Scope of Cisco’s IP Thought Leadership
Cisco® VNI Forecast research is an ongoing initiative to predict global traffic growth. This study focuses on consumer and business mobile data traffic and its key drivers.
Source: Cisco VNI Global Mobile Data Traffic Forecast, 2012–2017
Global Mobile Speed Data
Global Forecast Data
© 2013 Cisco and/or its affiliates. All rights reserved. 3
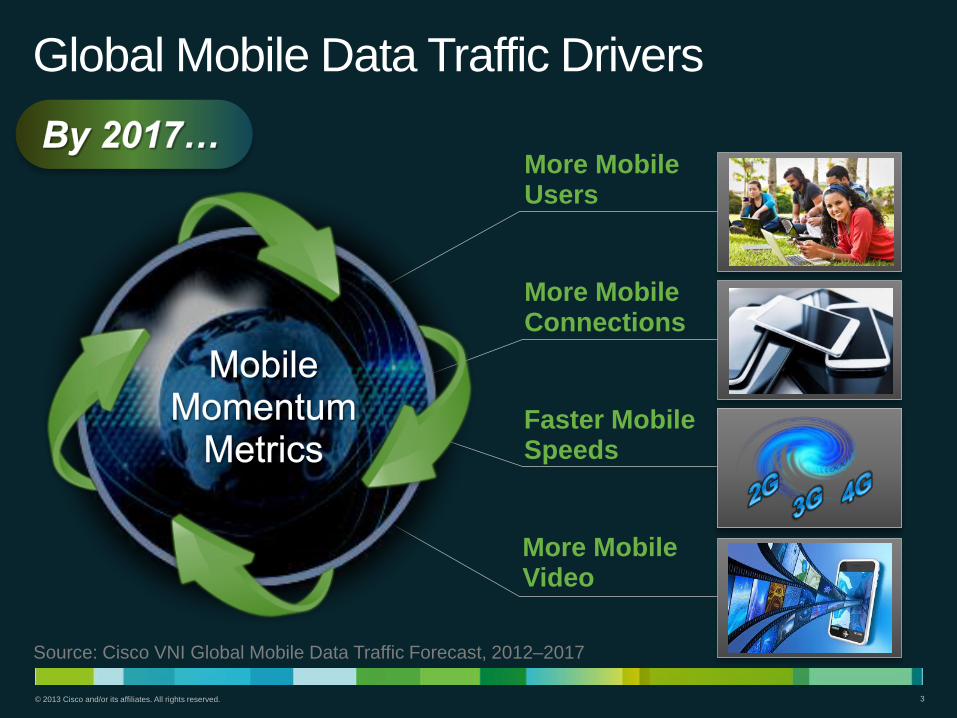
Global Mobile Data Traffic Drivers
More Mobile Users
Faster Mobile Speeds
More Mobile Connections
More Mobile Video
Source: Cisco VNI Global Mobile Data Traffic Forecast, 2012–2017

© 2013 Cisco and/or its affiliates. All rights reserved. 4 4
Overview
© 2013 Cisco and/or its affiliates. All rights reserved. 5
0
2
4
6
8
10
12
2012 2013 2014 2015 2016 2017
Exab
yte
s p
er
Mo
nth
7.4 EB
0.9 EB
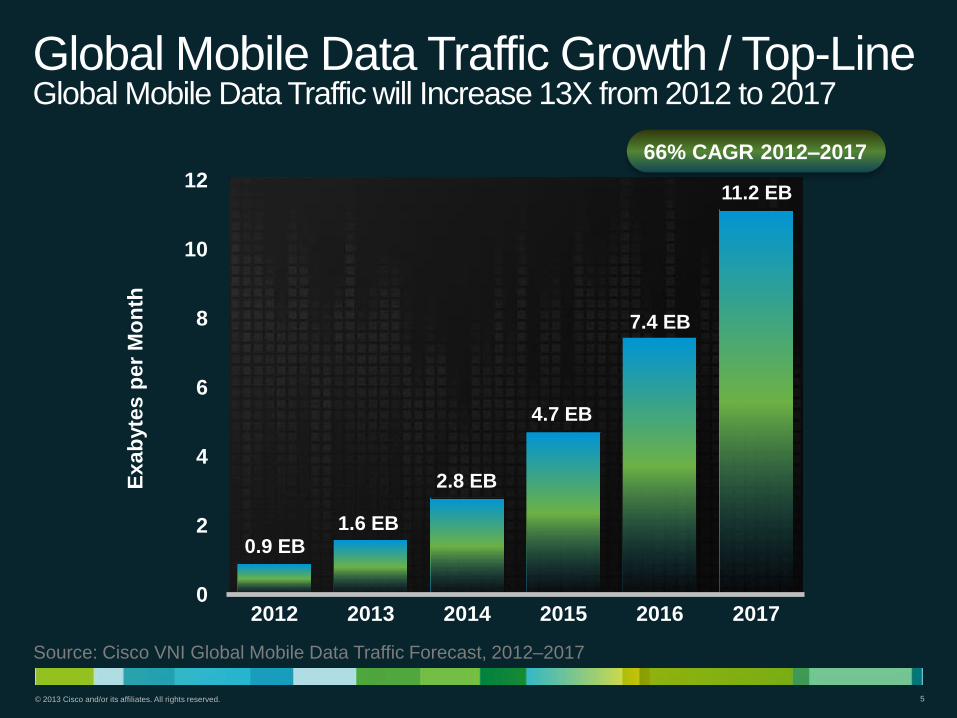
Global Mobile Data Traffic Growth / Top-Line Global Mobile Data Traffic will Increase 13X from 2012 to 2017
11.2 EB
4.7 EB
2.8 EB
1.6 EB
66% CAGR 2012–2017
Source: Cisco VNI Global Mobile Data Traffic Forecast, 2012–2017
© 2013 Cisco and/or its affiliates. All rights reserved. 6
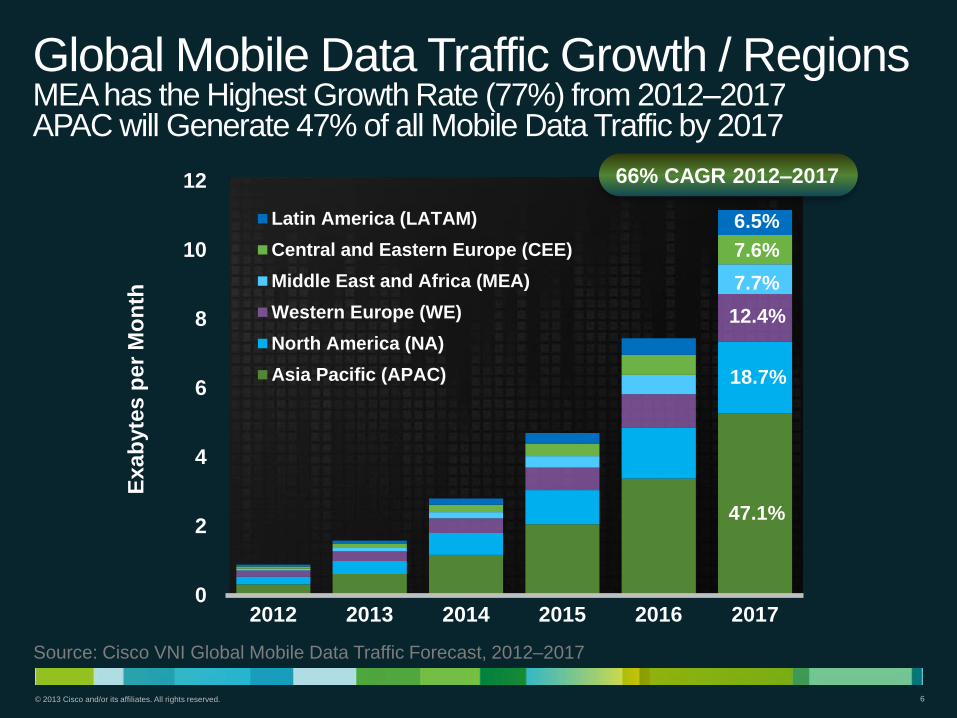
0
2
4
6
8
10
12
2012 2013 2014 2015 2016 2017
Ex
ab
yte
s p
er
Mo
nth
Latin America (LATAM)
Central and Eastern Europe (CEE)
Middle East and Africa (MEA)
Western Europe (WE)
North America (NA)
Asia Pacific (APAC)
Global Mobile Data Traffic Growth / Regions MEA has the Highest Growth Rate (77%) from 2012–2017 APAC will Generate 47% of all Mobile Data Traffic by 2017
18.7%
47.1%
12.4%
7.6%
6.5%
7.7%
66% CAGR 2012–2017
Source: Cisco VNI Global Mobile Data Traffic Forecast, 2012–2017

© 2013 Cisco and/or its affiliates. All rights reserved. 7 7
Top Trends
© 2013 Cisco and/or its affiliates. All rights reserved. 8
VNI Mobile Forecast Update, 2012–2017 Top 5 Mobile Networking Trends
Device Diversification
Impact of 4G Connections on Traffic
The Impact of Tiered Pricing—Shake-Up at the Top
Traffic Offload from Mobile Networks to Fixed Networks
Mobile Video and Cloud
© 2013 Cisco and/or its affiliates. All rights reserved. 9
0
2
4
6
8
10
12
2012 2013 2014 2015 2016 2017
Billio
ns
of
Devic
es
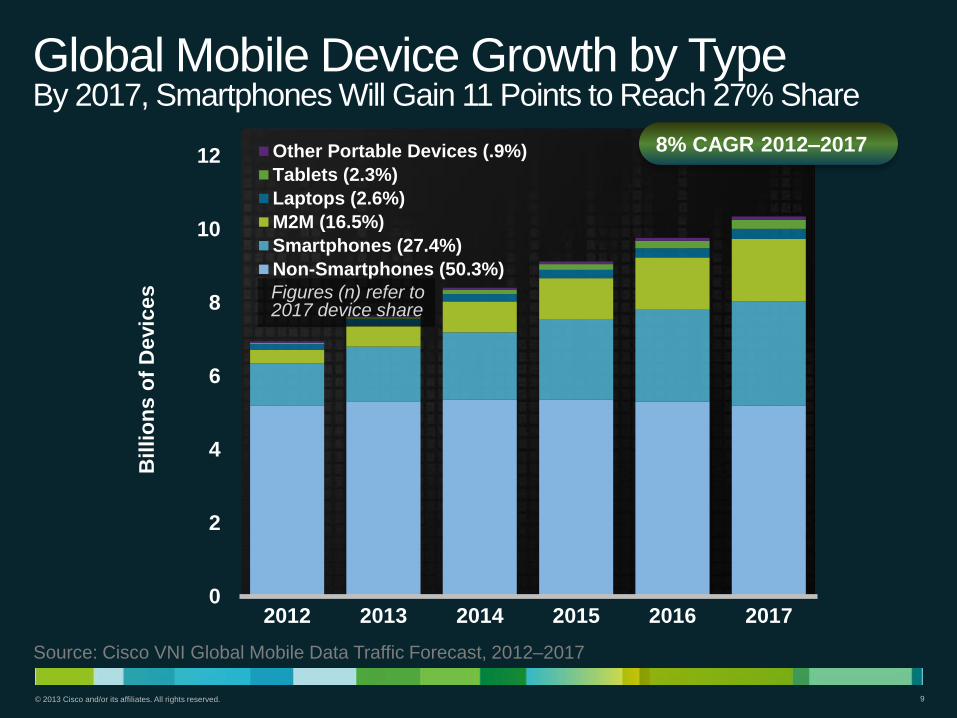
Other Portable Devices (.9%)
Tablets (2.3%)
Laptops (2.6%)
M2M (16.5%)
Smartphones (27.4%)
Non-Smartphones (50.3%)
Global Mobile Device Growth by Type By 2017, Smartphones Will Gain 11 Points to Reach 27% Share
Source: Cisco VNI Global Mobile Data Traffic Forecast, 2012–2017
8% CAGR 2012–2017
Figures (n) refer to 2017 device share
© 2013 Cisco and/or its affiliates. All rights reserved. 10
0
2
4
6
8
10
12
2012 2013 2014 2015 2016 2017
Exab
yte
s p
er
Mo
nth
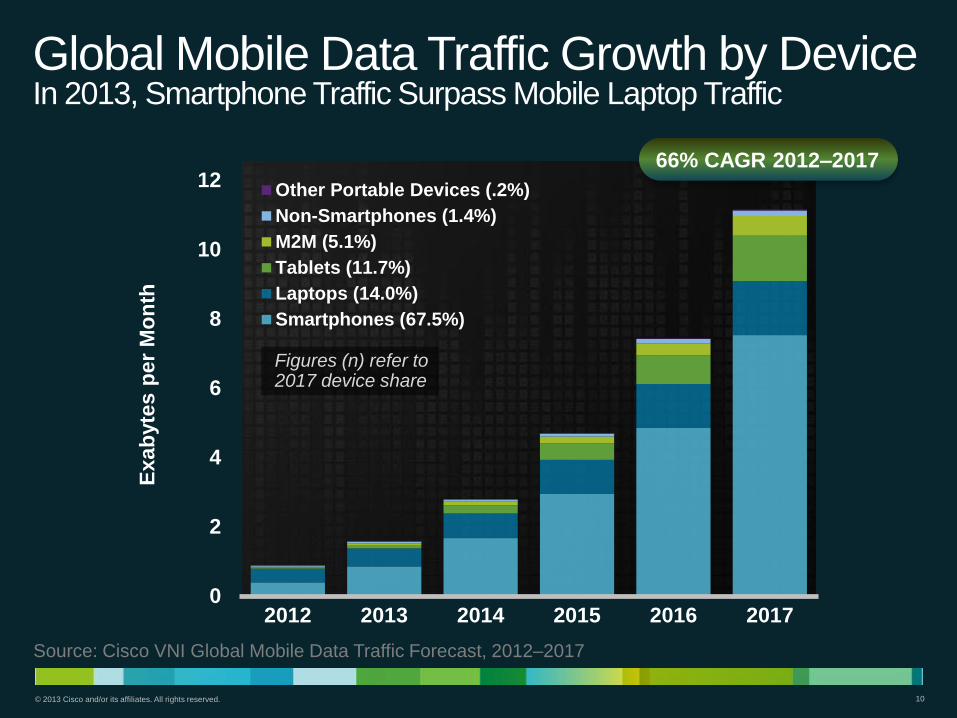
Other Portable Devices (.2%)
Non-Smartphones (1.4%)
M2M (5.1%)
Tablets (11.7%)
Laptops (14.0%)
Smartphones (67.5%)
Global Mobile Data Traffic Growth by Device In 2013, Smartphone Traffic Surpass Mobile Laptop Traffic
Figures (n) refer to 2017 device share
66% CAGR 2012–2017
Source: Cisco VNI Global Mobile Data Traffic Forecast, 2012–2017
© 2013 Cisco and/or its affiliates. All rights reserved. 11
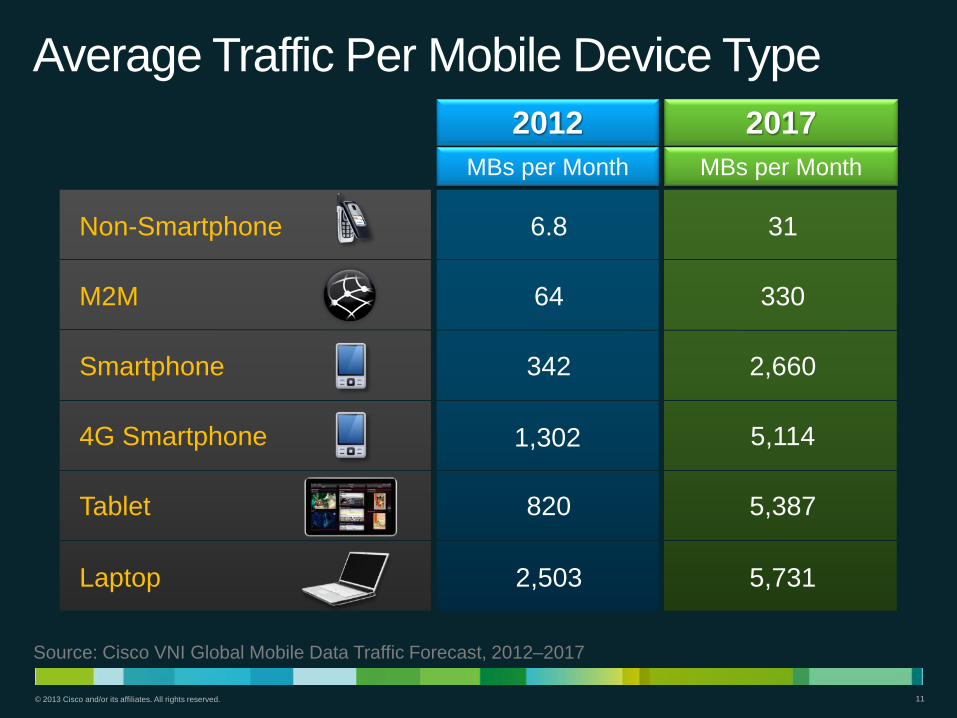
Average Traffic Per Mobile Device Type
Non-Smartphone
2017 2012
6.8 31
MBs per Month MBs per Month
M2M 64 330
Smartphone 342 2,660
4G Smartphone 1,302 5,114
Tablet 820 5,387
Laptop 2,503 5,731
Source: Cisco VNI Global Mobile Data Traffic Forecast, 2012–2017
© 2013 Cisco and/or its affiliates. All rights reserved. 12
0
2
4
6
8
10
12
14
2012 2013 2014 2015 2016 2017
Mb
ps
Tablets
Smartphones
All Mobile Devices
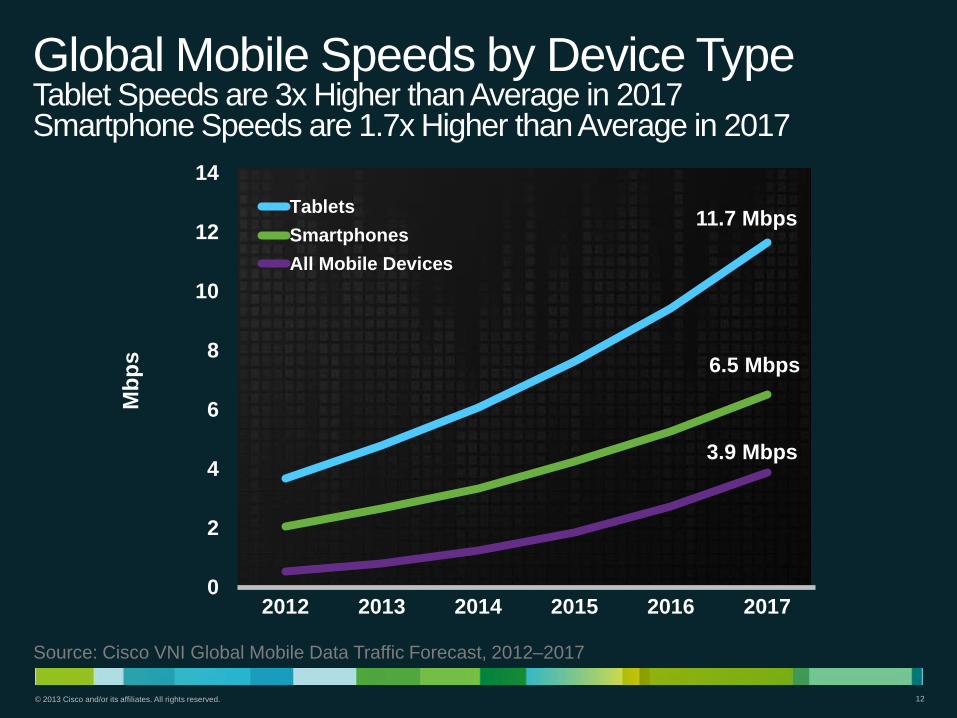
Global Mobile Speeds by Device Type Tablet Speeds are 3x Higher than Average in 2017 Smartphone Speeds are 1.7x Higher than Average in 2017
11.7 Mbps
6.5 Mbps
3.9 Mbps
Source: Cisco VNI Global Mobile Data Traffic Forecast, 2012–2017
© 2013 Cisco and/or its affiliates. All rights reserved. 13
0
5
10
15
20
25
2012 2013 2014 2015 2016 2017
Mb
ps
4G
3-3.5G
All Network Types
2-2.5G
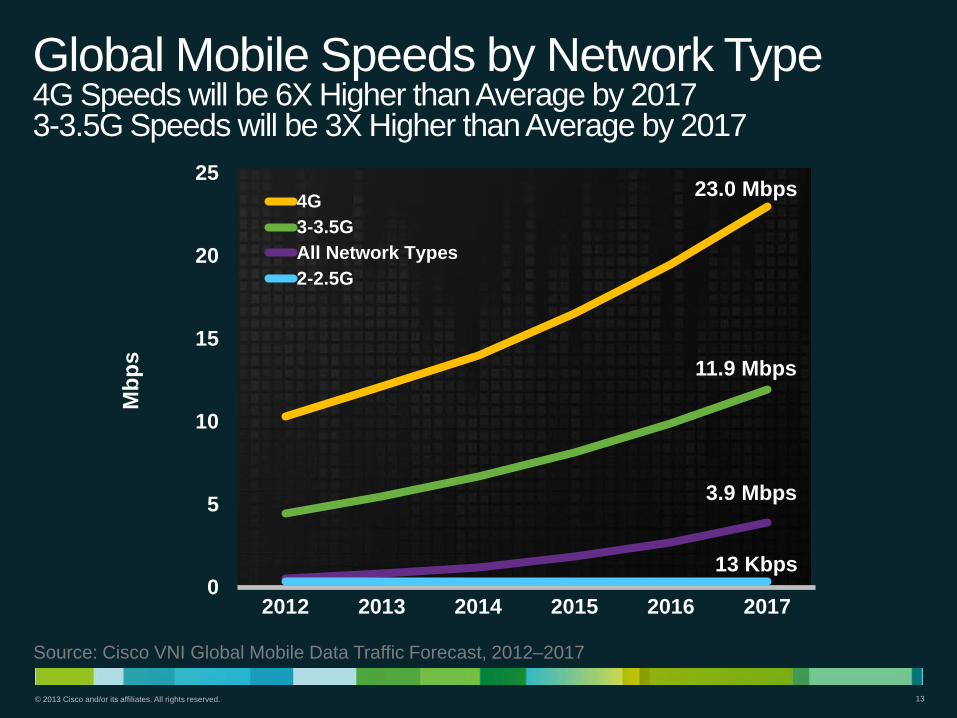
Global Mobile Speeds by Network Type 4G Speeds will be 6X Higher than Average by 2017 3-3.5G Speeds will be 3X Higher than Average by 2017
23.0 Mbps
11.9 Mbps
13 Kbps
3.9 Mbps
Source: Cisco VNI Global Mobile Data Traffic Forecast, 2012–2017
© 2013 Cisco and/or its affiliates. All rights reserved. 14
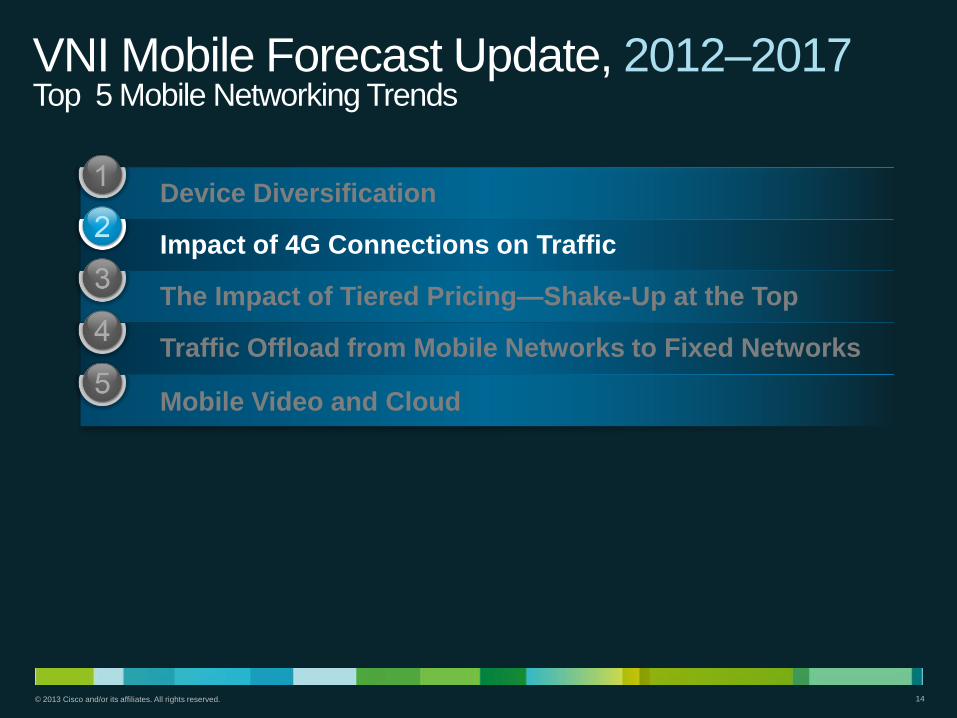
VNI Mobile Forecast Update, 2012–2017 Top 5 Mobile Networking Trends
Device Diversification
Impact of 4G Connections on Traffic
The Impact of Tiered Pricing—Shake-Up at the Top
Traffic Offload from Mobile Networks to Fixed Networks
Mobile Video and Cloud
© 2013 Cisco and/or its affiliates. All rights reserved. 15
0
1
2
3
4
5
6
7
2012 2013 2014 2015 2016 2017
Bil
lio
ns
of
Devic
es o
r C
on
nec
tio
ns
4G3G2G
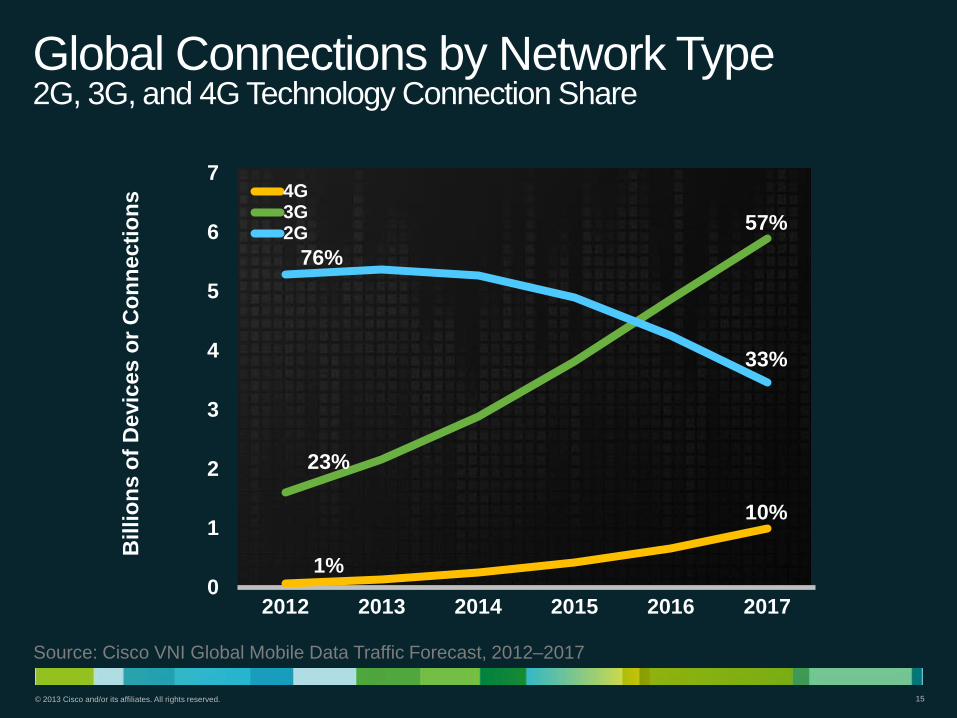
Global Connections by Network Type 2G, 3G, and 4G Technology Connection Share
57%
76%
23%
1%
33%
10%
Source: Cisco VNI Global Mobile Data Traffic Forecast, 2012–2017
© 2013 Cisco and/or its affiliates. All rights reserved. 16
0
2
4
6
8
10
2012 2013 2014 2015 2016 2017
Ex
ab
yte
s p
er
Mo
nth
2-2.5G
3-3.5G
4G
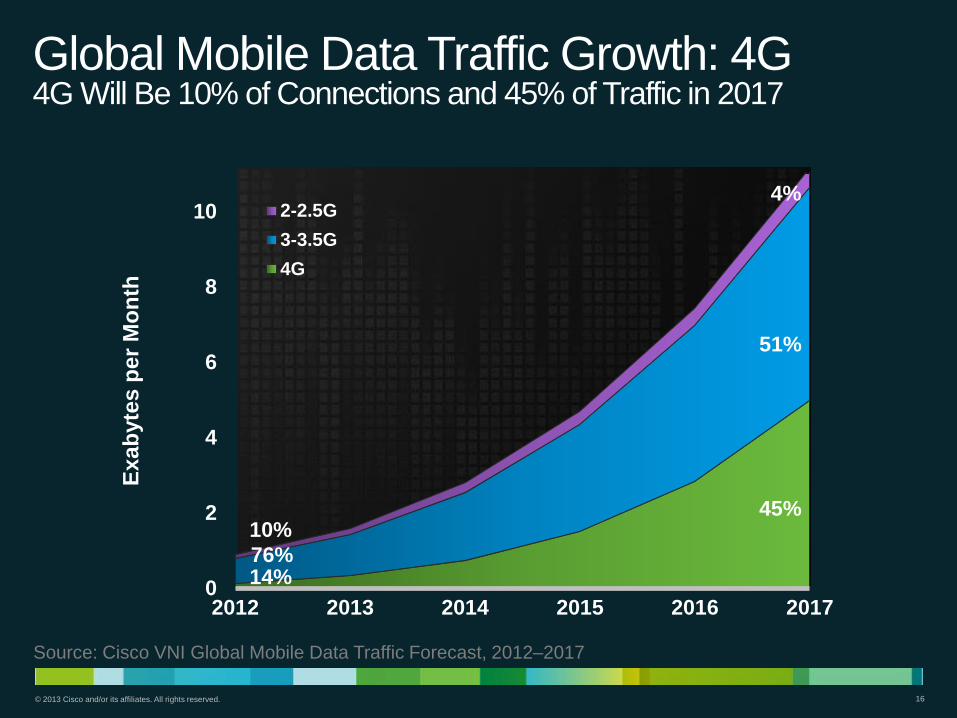
Global Mobile Data Traffic Growth: 4G 4G Will Be 10% of Connections and 45% of Traffic in 2017
14%
45%
51%
10%
76%
4%
Source: Cisco VNI Global Mobile Data Traffic Forecast, 2012–2017
© 2013 Cisco and/or its affiliates. All rights reserved. 17 17
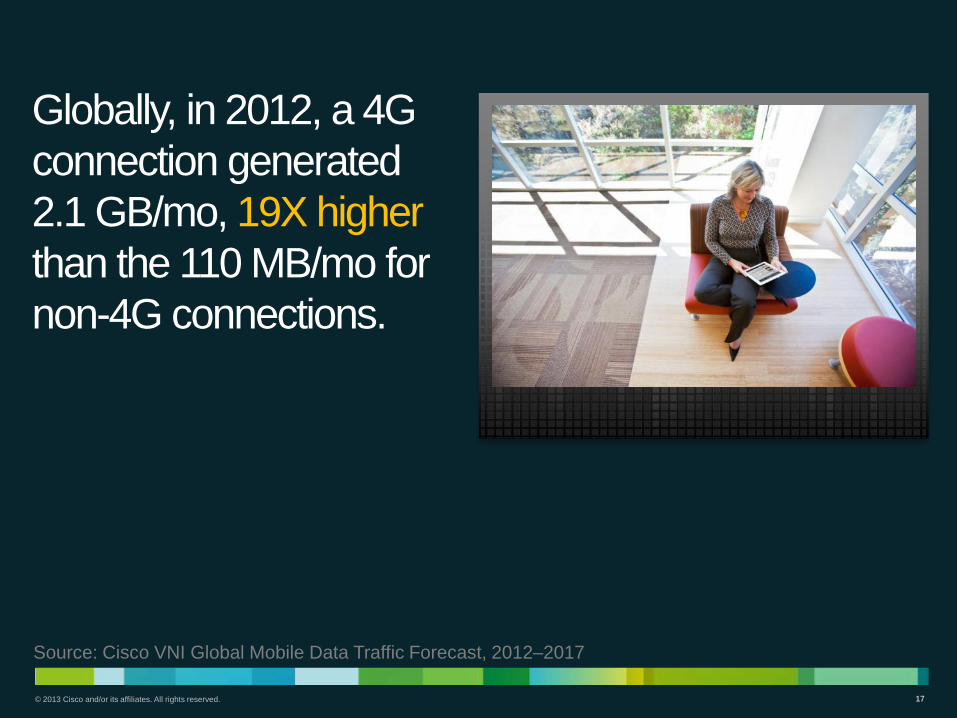
Globally, in 2012, a 4G
connection generated
2.1 GB/mo, 19X higher
than the 110 MB/mo for
non-4G connections.
Source: Cisco VNI Global Mobile Data Traffic Forecast, 2012–2017
© 2013 Cisco and/or its affiliates. All rights reserved. 18
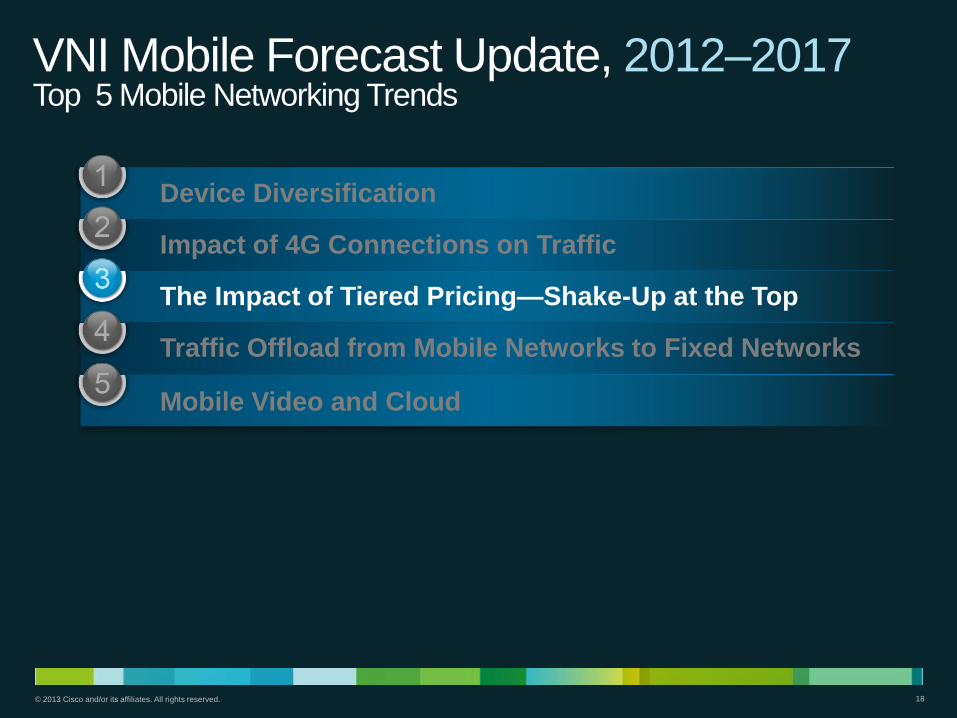
VNI Mobile Forecast Update, 2012–2017 Top 5 Mobile Networking Trends
Device Diversification
Impact of 4G Connections on Traffic
The Impact of Tiered Pricing—Shake-Up at the Top
Traffic Offload from Mobile Networks to Fixed Networks
Mobile Video and Cloud
© 2013 Cisco and/or its affiliates. All rights reserved. 19
0%
10%
20%
30%
40%
50%
60%
Jan-10 Sep-11 Sep-12
Pe
rcen
tag
e o
f to
p 1
Pe
rcen
t
to t
ota
l M
B/m
o
Top 1 percent
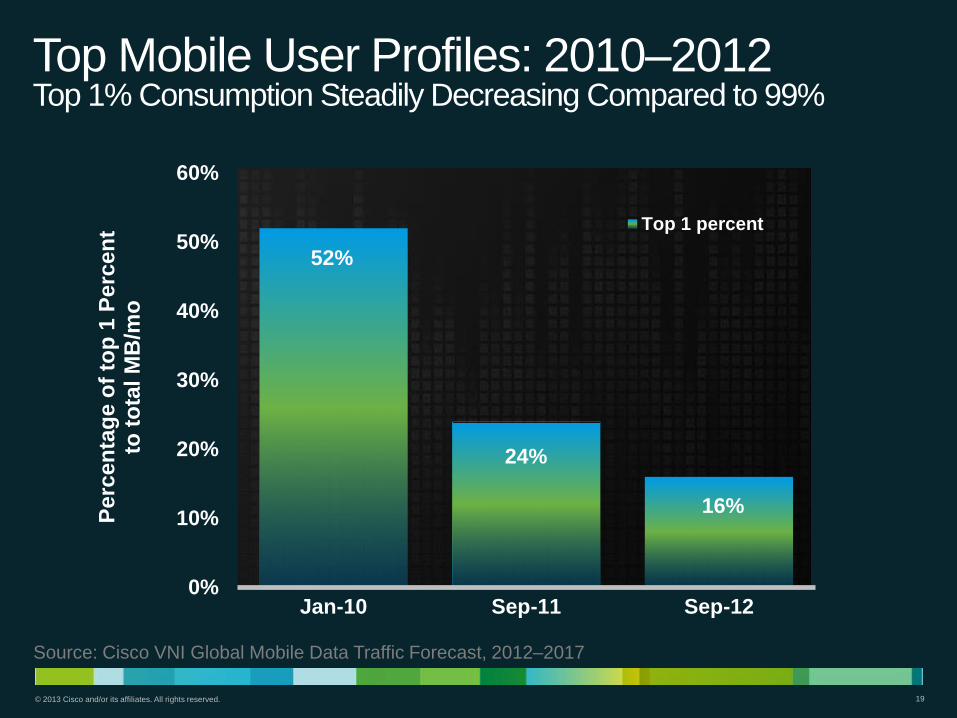
Top Mobile User Profiles: 2010–2012 Top 1% Consumption Steadily Decreasing Compared to 99%
24%
16%
52%
Source: Cisco VNI Global Mobile Data Traffic Forecast, 2012–2017
© 2013 Cisco and/or its affiliates. All rights reserved. 20
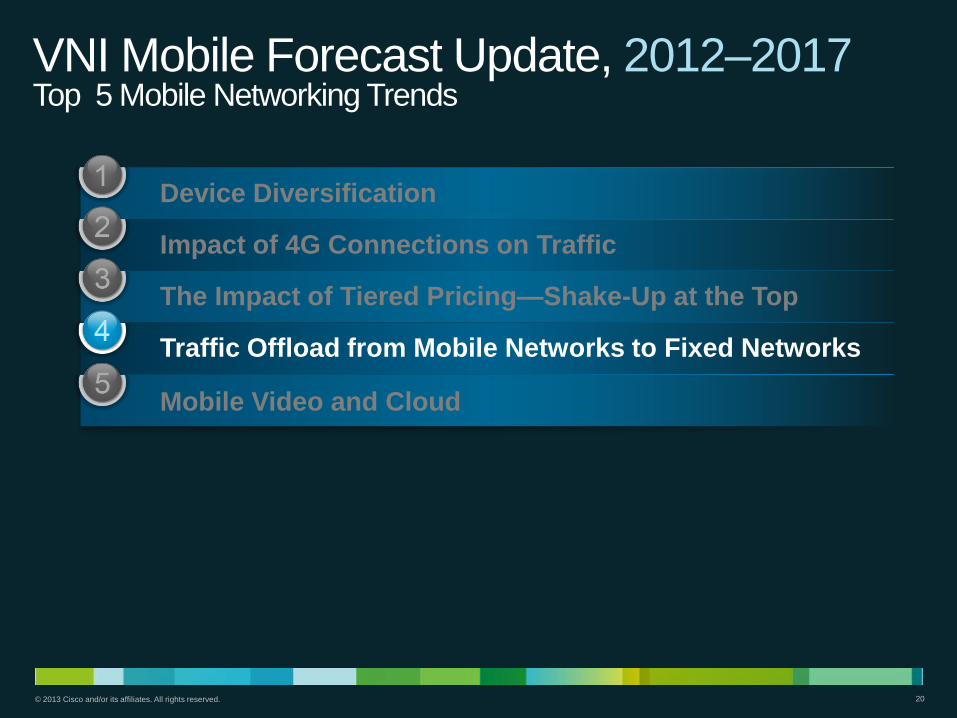
VNI Mobile Forecast Update, 2012–2017 Top 5 Mobile Networking Trends
Device Diversification
Impact of 4G Connections on Traffic
The Impact of Tiered Pricing—Shake-Up at the Top
Traffic Offload from Mobile Networks to Fixed Networks
Mobile Video and Cloud
© 2013 Cisco and/or its affiliates. All rights reserved. 21
0
5
10
15
20
2012 2013 2014 2015 2016 2017
Ex
ab
yte
s p
er
Mo
nth
Offload Traffic from Mobile Devices
Cellular Traffic from Mobile Devices
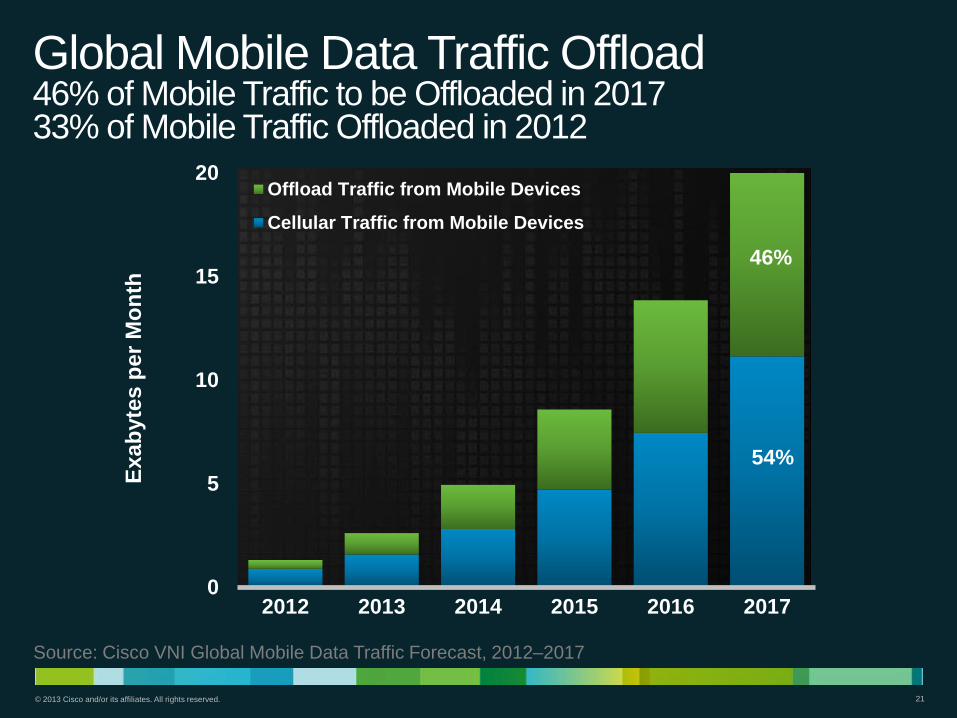
Global Mobile Data Traffic Offload 46% of Mobile Traffic to be Offloaded in 2017 33% of Mobile Traffic Offloaded in 2012
46%
54%
Source: Cisco VNI Global Mobile Data Traffic Forecast, 2012–2017
© 2013 Cisco and/or its affiliates. All rights reserved. 22 22
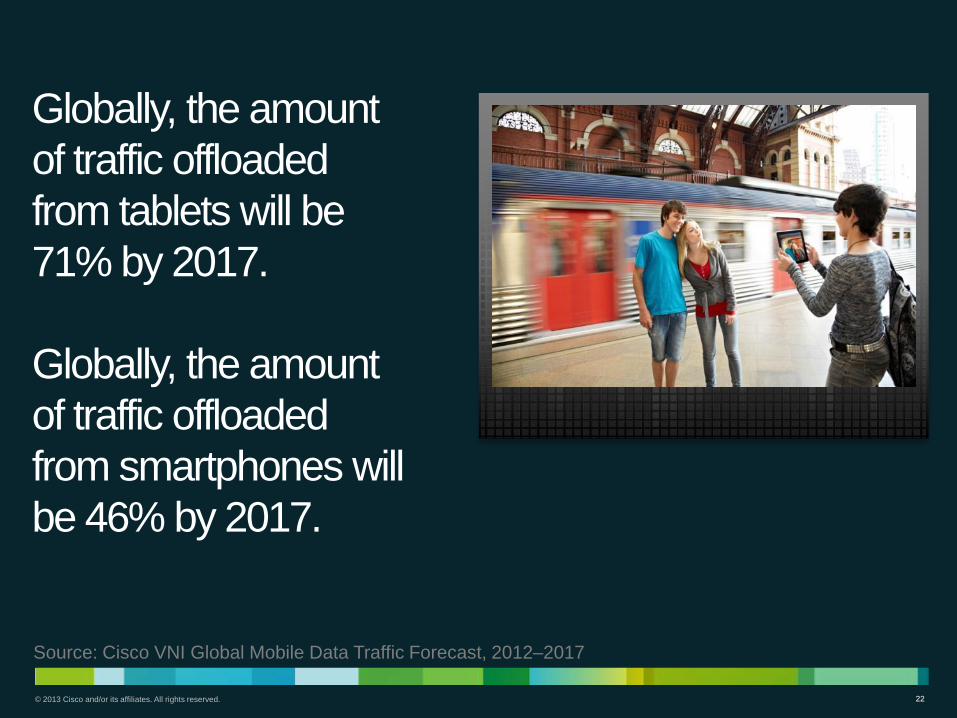
Globally, the amount
of traffic offloaded
from tablets will be
71% by 2017.
Globally, the amount
of traffic offloaded
from smartphones will
be 46% by 2017.
Source: Cisco VNI Global Mobile Data Traffic Forecast, 2012–2017
© 2013 Cisco and/or its affiliates. All rights reserved. 23
VNI Mobile Forecast Update, 2012–2017 Top 5 Mobile Networking Trends
Device Diversification
Impact of 4G Connections on Traffic
The Impact of Tiered Pricing—Shake-Up at the Top
Traffic Offload from Mobile Networks to Fixed Networks
Mobile Video and Cloud
© 2013 Cisco and/or its affiliates. All rights reserved. 24 24
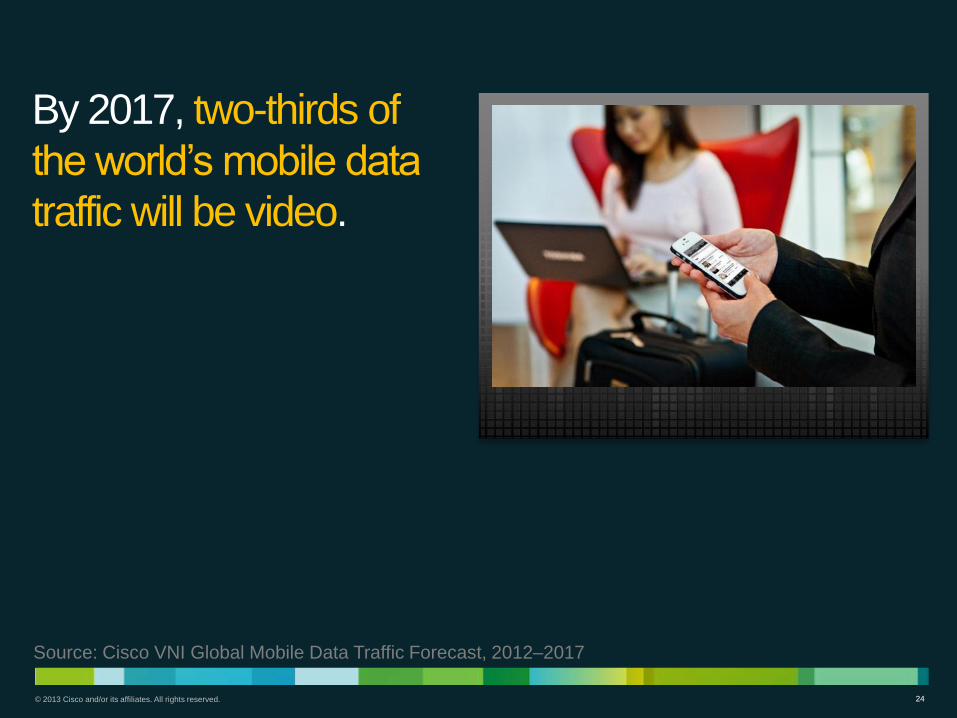
By 2017, two-thirds of
the world’s mobile data
traffic will be video.
Source: Cisco VNI Global Mobile Data Traffic Forecast, 2012–2017
© 2013 Cisco and/or its affiliates. All rights reserved. 25
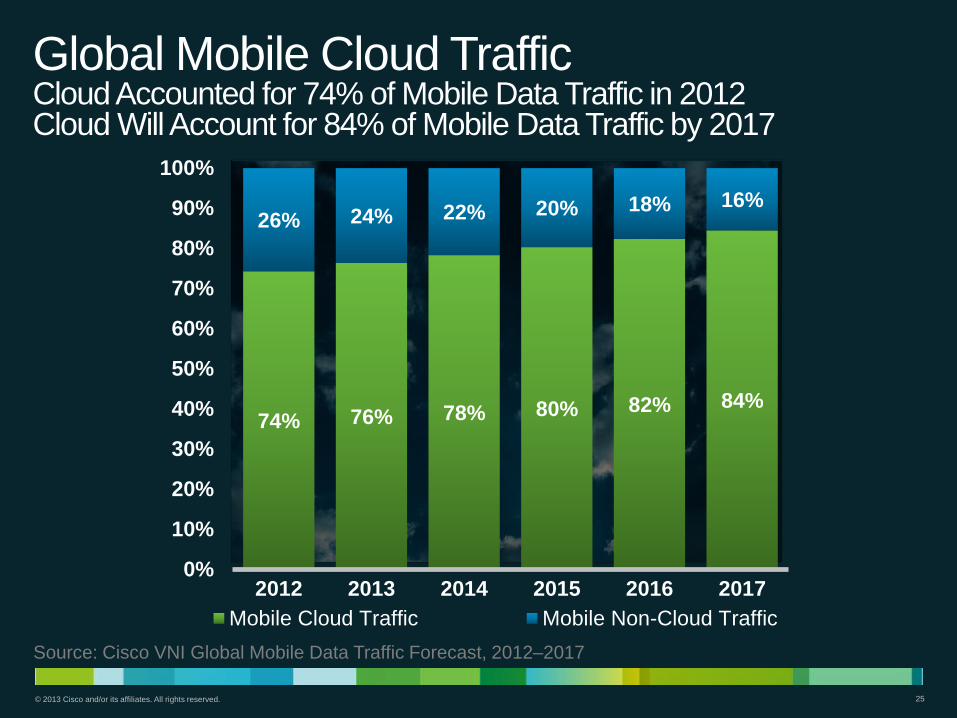
74% 76% 78% 80% 82% 84%
26% 24% 22% 20% 18% 16%
0%
10%
20%
30%
40%
50%
60%
70%
80%
90%
100%
2012 2013 2014 2015 2016 2017
Mobile Cloud Traffic Mobile Non-Cloud Traffic
Global Mobile Cloud Traffic Cloud Accounted for 74% of Mobile Data Traffic in 2012 Cloud Will Account for 84% of Mobile Data Traffic by 2017
Source: Cisco VNI Global Mobile Data Traffic Forecast, 2012–2017

© 2013 Cisco and/or its affiliates. All rights reserved. 26 26
Conclusion
© 2013 Cisco and/or its affiliates. All rights reserved. 27
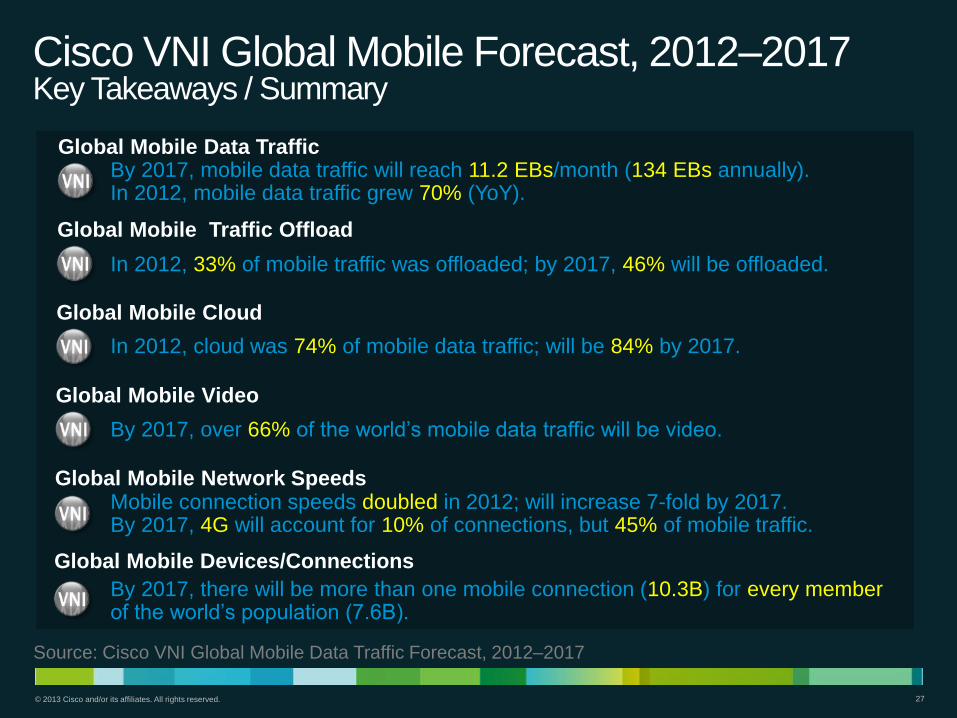
Cisco VNI Global Mobile Forecast, 2012–2017 Key Takeaways / Summary
By 2017, mobile data traffic will reach 11.2 EBs/month (134 EBs annually). In 2012, mobile data traffic grew 70% (YoY).
By 2017, there will be more than one mobile connection (10.3B) for every member of the world’s population (7.6B).
Mobile connection speeds doubled in 2012; will increase 7-fold by 2017. By 2017, 4G will account for 10% of connections, but 45% of mobile traffic.
By 2017, over 66% of the world’s mobile data traffic will be video.
In 2012, cloud was 74% of mobile data traffic; will be 84% by 2017.
Global Mobile Data Traffic
In 2012, 33% of mobile traffic was offloaded; by 2017, 46% will be offloaded.
Source: Cisco VNI Global Mobile Data Traffic Forecast, 2012–2017
Global Mobile Traffic Offload
Global Mobile Cloud
Global Mobile Video
Global Mobile Network Speeds
Global Mobile Devices/Connections
© 2013 Cisco and/or its affiliates. All rights reserved. 28
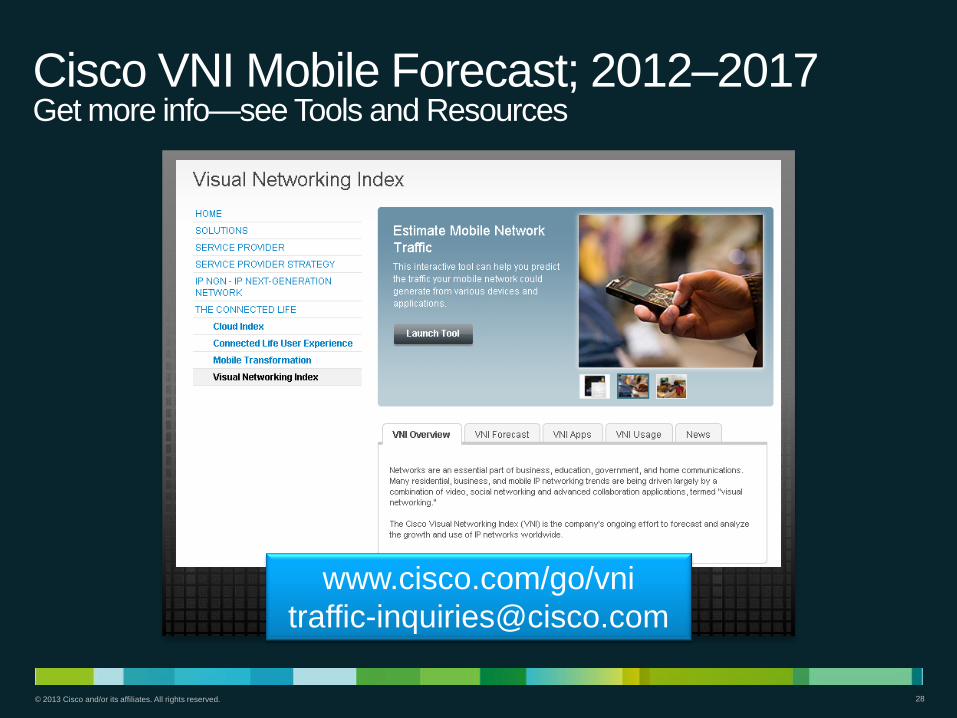
Cisco VNI Mobile Forecast; 2012–2017 Get more info—see Tools and Resources
www.cisco.com/go/vni

© 2013 Cisco and/or its affiliates. All rights reserved. 29
Thank you.

© 2013 Cisco and/or its affiliates. All rights reserved. 30 30
Drivers
© 2013 Cisco and/or its affiliates. All rights reserved. 31
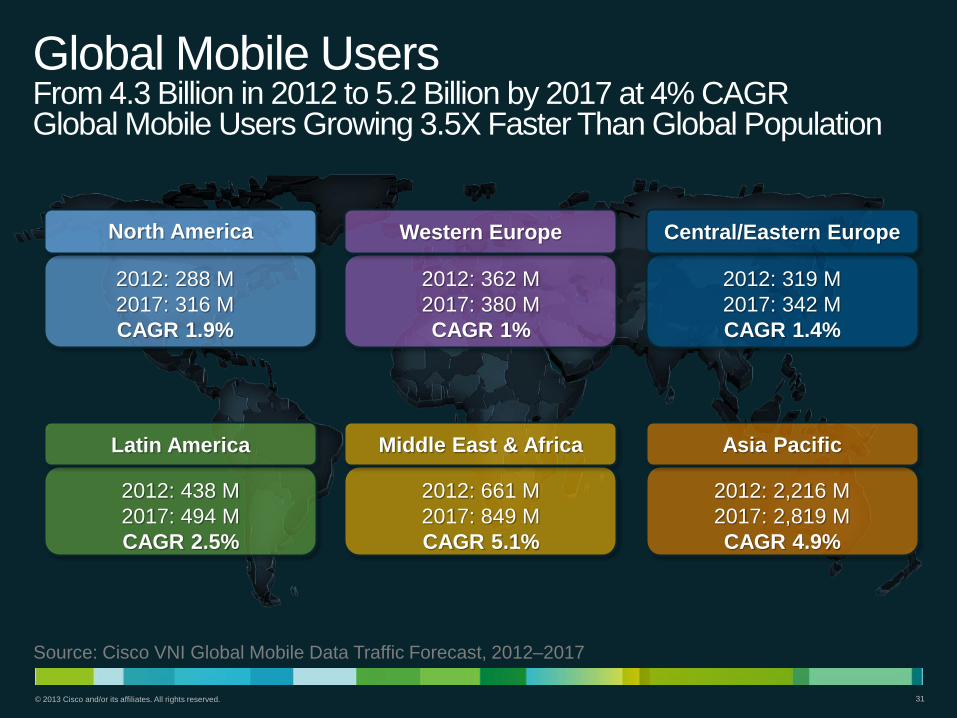
North America
2012: 288 M
2017: 316 M
CAGR 1.9%
Western Europe
2012: 362 M
2017: 380 M
CAGR 1%
Central/Eastern Europe
2012: 319 M
2017: 342 M
CAGR 1.4%
Latin America
2012: 438 M
2017: 494 M
CAGR 2.5%
Middle East & Africa
2012: 661 M
2017: 849 M
CAGR 5.1%
Asia Pacific
2012: 2,216 M
2017: 2,819 M
CAGR 4.9%
Global Mobile Users From 4.3 Billion in 2012 to 5.2 Billion by 2017 at 4% CAGR Global Mobile Users Growing 3.5X Faster Than Global Population
Source: Cisco VNI Global Mobile Data Traffic Forecast, 2012–2017
© 2013 Cisco and/or its affiliates. All rights reserved. 32
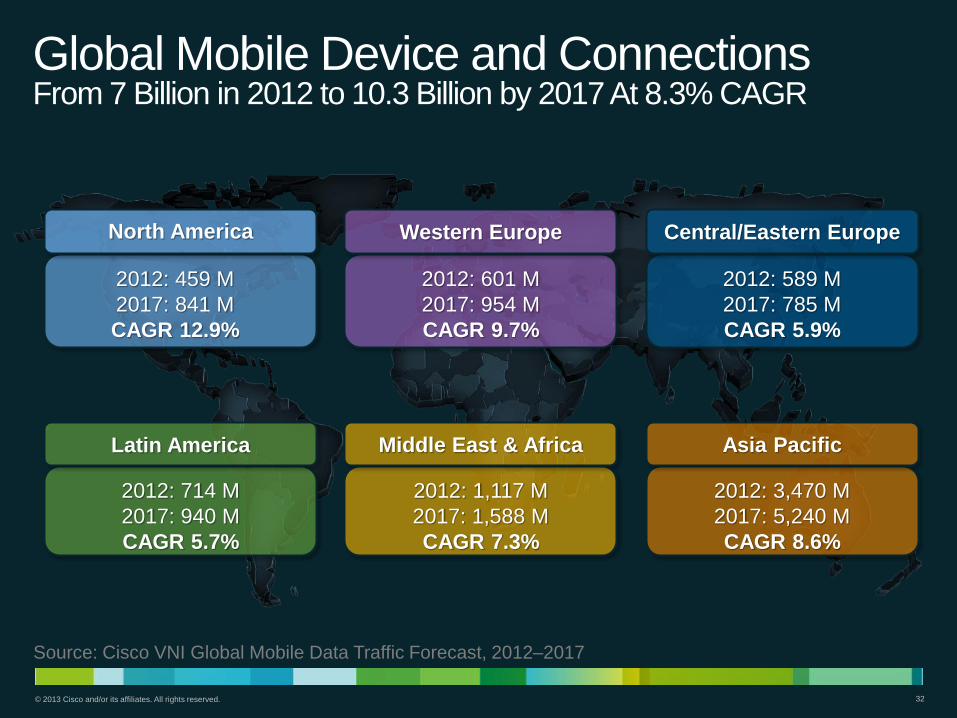
North America
2012: 459 M
2017: 841 M
CAGR 12.9%
Western Europe
2012: 601 M
2017: 954 M
CAGR 9.7%
Central/Eastern Europe
2012: 589 M
2017: 785 M
CAGR 5.9%
Latin America
2012: 714 M
2017: 940 M
CAGR 5.7%
Middle East & Africa
2012: 1,117 M
2017: 1,588 M
CAGR 7.3%
Asia Pacific
2012: 3,470 M
2017: 5,240 M
CAGR 8.6%
Global Mobile Device and Connections From 7 Billion in 2012 to 10.3 Billion by 2017 At 8.3% CAGR
Source: Cisco VNI Global Mobile Data Traffic Forecast, 2012–2017
© 2013 Cisco and/or its affiliates. All rights reserved. 33
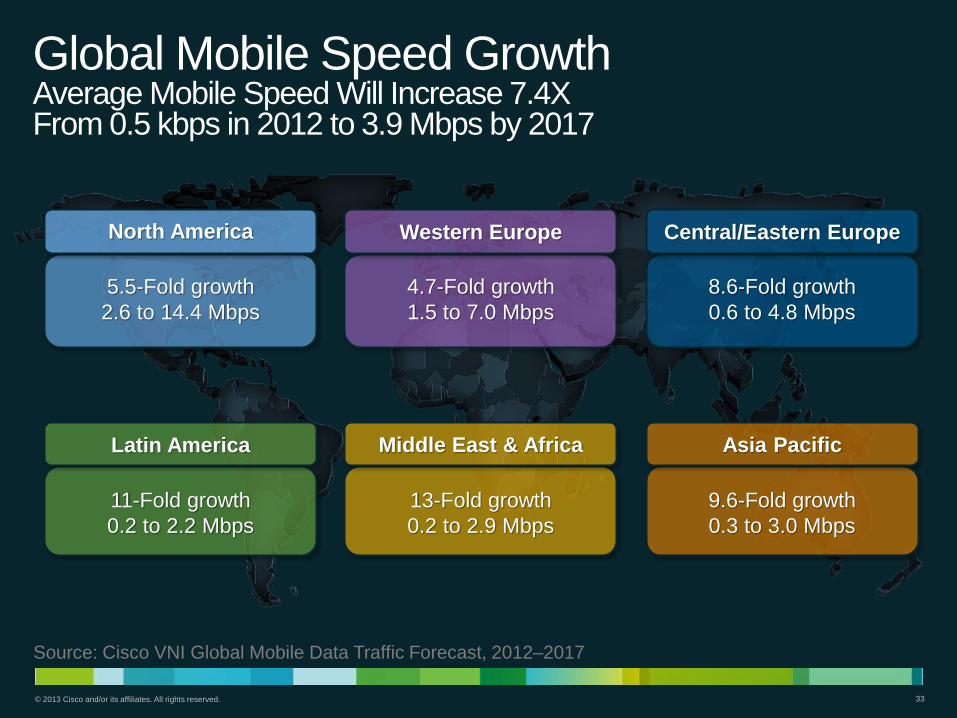
Global Mobile Speed Growth Average Mobile Speed Will Increase 7.4X From 0.5 kbps in 2012 to 3.9 Mbps by 2017
Source: Cisco VNI Global Mobile Data Traffic Forecast, 2012–2017
North America Western Europe Central/Eastern Europe
Latin America Middle East & Africa Asia Pacific
5.5-Fold growth
2.6 to 14.4 Mbps
4.7-Fold growth
1.5 to 7.0 Mbps
8.6-Fold growth
0.6 to 4.8 Mbps
11-Fold growth
0.2 to 2.2 Mbps
13-Fold growth
0.2 to 2.9 Mbps
9.6-Fold growth
0.3 to 3.0 Mbps
© 2013 Cisco and/or its affiliates. All rights reserved. 34
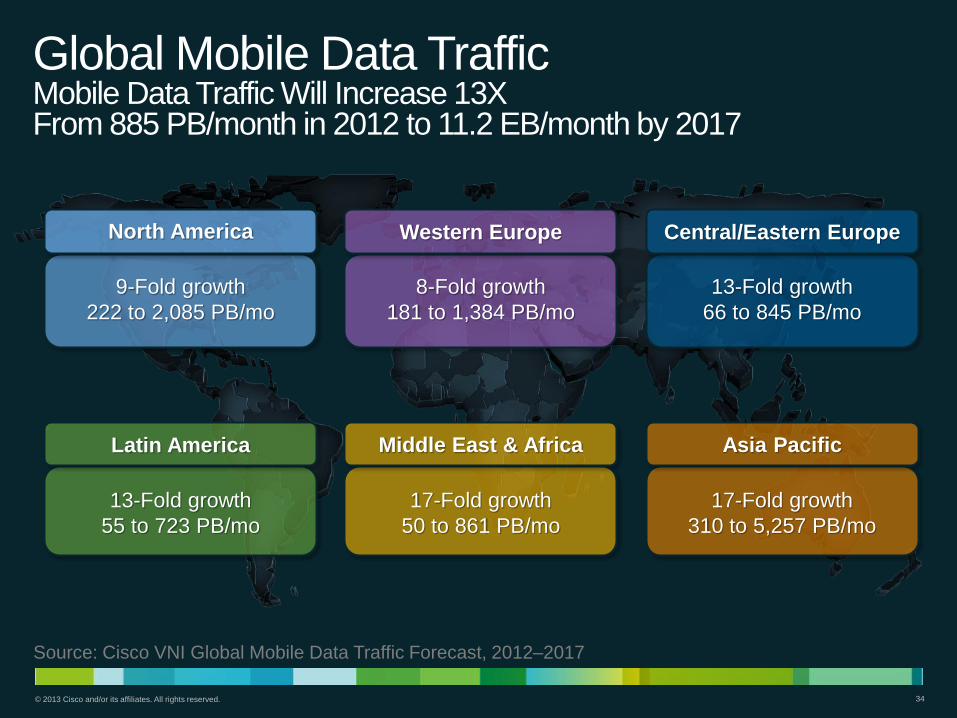
Global Mobile Data Traffic Mobile Data Traffic Will Increase 13X From 885 PB/month in 2012 to 11.2 EB/month by 2017
Source: Cisco VNI Global Mobile Data Traffic Forecast, 2012–2017
North America Western Europe Central/Eastern Europe
Latin America Middle East & Africa Asia Pacific
9-Fold growth
222 to 2,085 PB/mo
8-Fold growth
181 to 1,384 PB/mo
13-Fold growth
66 to 845 PB/mo
13-Fold growth
55 to 723 PB/mo
17-Fold growth
50 to 861 PB/mo
17-Fold growth
310 to 5,257 PB/mo