does the river continuum concept work in small … · 4 does the river continuum concept work in...
TRANSCRIPT
Does the River Continuum Concept work in small
rivers that begin from swamps?
Entry to the Stockholm Junior Water Prize 2008
Tiina Pippuri & Noora Nuutinen
Mikkelin Yhteiskoulun lukio
Finland
1
This study was made to find out if the original idea of river continuum concept works
also in northern coniferous forest areas in a small river, and if the idea can be used in environmental
ecology courses in upper secondary schools. The research was carried out in three different points
in Tampinjoki – Hanhijoki – Emolanjoki. Samples of biological and hydrological – morphological
factors were taken from every part of the river, analyzed and then compared to the original theory.
The study was made with simple equipment that can usually be found in schools, and at the time
when environmental ecology courses usually take place in schools. The results followed the river
continuum concept quite well with a little exception of invertebrates in the second research point.
By connecting the results with analyses made by the city of Mikkeli, current information of the
condition of the river was gotten. Invertebrates, vegetation and the analyses showed some signs of
eutrophication especially in the last part of the river. These results can also be used when planning
new constructions to the area or monitoring the development of the state of the river if the research
is continued annually by students. Protecting and developing the river with the help of these results
can help to maintain biodiversity and beauty of the environment, and allow the versatile use of the
area.
2
Table of Contents
Acknowledgements
Biographies
Introduction...........................................................................................4
Theoretical background.........................................................................4
Hypothesis.............................................................................................5
Research area.........................................................................................6
Carrying out the research.......................................................................6
Results and discussion...........................................................................8
References............................................................................................14
Attachments
3
Acknowledgements
We thank
Kirsi Idänpirtti, biology & geography teacher in Mikkelin Yhteiskoulun lukio, for helping to
organize this project, borrowing literature and mental support. Some of the photos were also taken
by Kirsi Idänpirtti.
Heikki Tanskanen, Environmental Services of the city of Mikkeli, for results from information
system Hertta .
Helena Erkkala, English teacher in Mikkelin Yhteiskoulun lukio, for correcting the English
version of this project.
Jouko Ahola, chemistry teacher in Mikkelin Yhteiskoulun lukio, for detailed information about
studying the sediment load.
Biography
Noora Nuutinen is a 17-year-old girl who studies at Mikkelin Yhteiskoulun lukio, an
upper secondary school in Finland. Her hobbies are riding and photographing. Tiina Pippuri is an
18-year-old-girl from Finland, who also studies at Mikkelin Yhteiskoulun lukio. She is interested
in music and riding. They both took part in the Combat Climate Change competition of National
Geographic, and in 2007 they participated in Youth Bios Olympiad in St. Petersburg.
4
Does the River Continuum Concept work insmall rivers that begin from swamps?
1. Introduction
In 1980 Robert Vannote developed a theory of The River Continuum Concept (RCC).
According to the theory, the functions of a river can not be understood by examining only a small
part of it, because the river changes constantly towards the lower reach. This theory disproved the
previous way to study a river like a lake.
The RiverLife-project, put into practice in Finland in 1998-2001 with the support of the
European Union, endeavored to maintain and improve the water quality of rivers. With the help of
the project, it was possible to advance ecologically sustainable land use, and create a basis for
monitoring the rivers in an economically profitable way.
The purpose of this study is to find out if the original river continuum concept idea is
valid enough also in northern coniferous forest areas, especially in rivers beginning from swamp
and in small drainage areas, and if the idea works despite the season. Another purpose of this study
is to develop a method suitable for river studies in environmental ecology courses of upper
secondary schools (National Core Curriculum for Upper Secondary Schools 2003) . The samples
were taken in late autumn, 4th of November. The exploratory area of this study is situated in South-
Savo, in the eastern part of Finland. The river begins from a drained swamp and streams through the
city, ending in the harbor area. The beginning of the river belongs to Natura 2000 –area. The
mission of the project is to protect the survival of certain species and environments in Europe.
2. Theoretical background
According to Vannote (1980) RCC studies the river as a whole longitudinal
ecosystem. The stream forms a balance between width, depth, velocity, biological factors, sediment
load and temperature. The pattern of the river can be predicted, because a small change in one of
these factors affects the whole system. In every phase of the river material is produced, released and
stored. Because of the availability of food, invertebrates show longitudinal variety. They are
divided in functional groups: shredders, collectors, grazers and predators. Predators are found in
every phase of the river. Later the theory has been tested and developed further in several studies.
(Leopold, Wolman & Miller. 1964)
RCC divides the river in three sections: headwaters, mid reach and lower reach. The
stream is shadowed by riparian vegetation at the headwaters, and that causes the stream to be
5
heterotrophic, because photosynthesis decreases. The ratio between producing and consumption is
less than 1. The fauna consists of shredders and collectors.
The stream changes from heterotrophic to autotrophic during the mid reach when the
shading influence of vegetation decreases. Producing is greater than consumption in this part of the
river. The river continuum theory divides headwaters and mid reaches in altogether six parts. In
deciduous and coniferous forests, this change takes place at about stream order three. In mid
reaches the fauna consists of grazers and collectors.
In the lower reaches the stream is full of whirls, and vegetation is not able to attach to
the bottom of the river. That’s why the river is no longer autotrophic. Some phytoplankton and
macrophytes can be found, but they are not enough to make the river autotrophic. The consumption
is again greater than producing. Also in the lower reaches the collectors are the biggest group of
organisms.
RCC was developed based on data from continental streams. Groff (2006) has earlier
found out that the patterns in the longitudinal variation matched RCC predictions but for example
total species richness, insect species richness and the percent composition of collecting organisms
did not in tropical small rivers. In Finnish Ostrobothnia the RiverLife-project (Karjalainen S. M. &
Heikkinen, K. 2005) had three target rivers. The goal of the project was to produce information
about the river ecosystems and suitable protection methods. Moreover, problem solving models for
rivers were looked for. Some problems that emerged were for example eutrophication and the
increase of sludge on the bottom. Also in the RiverLife-project the river was studied in pieces from
headwaters to lower reaches. According to the project, every part of the river influences its own
ecosystem.
The European Union has founded Natura 2000 –network (European Commission
1999), to ensure that the nature conservation is in a high enough level and that the decrease of
natural diversity will be stopped. In Finland, the Natura 2000 –project has an area of about 4, 8
million hectares.
The beginning of the river in this study belongs to Hanhilampi’s Natura 2000-area,
which is about 29 hectares. Primarily important targets for protection in this area are borealic
coniferous forests and the flying squirrel (Pteromys volans) The protection is carried out on grounds
of nature conservation law. (Suomen ympäristökeskus SYKE, 2006)
3. Hypothesis
The hypothesis is that river continuum theory modeling can be utilized in a Finnish
small river ecosystem that begins from a swamp, which is typical for Finnish rivers. How is the
6
river continuum theory suitable for a research target of environmental ecology in upper secondary
schools? How can the results be utilized in planning the land use and nature protection of the area?
And how can the students take part in this?
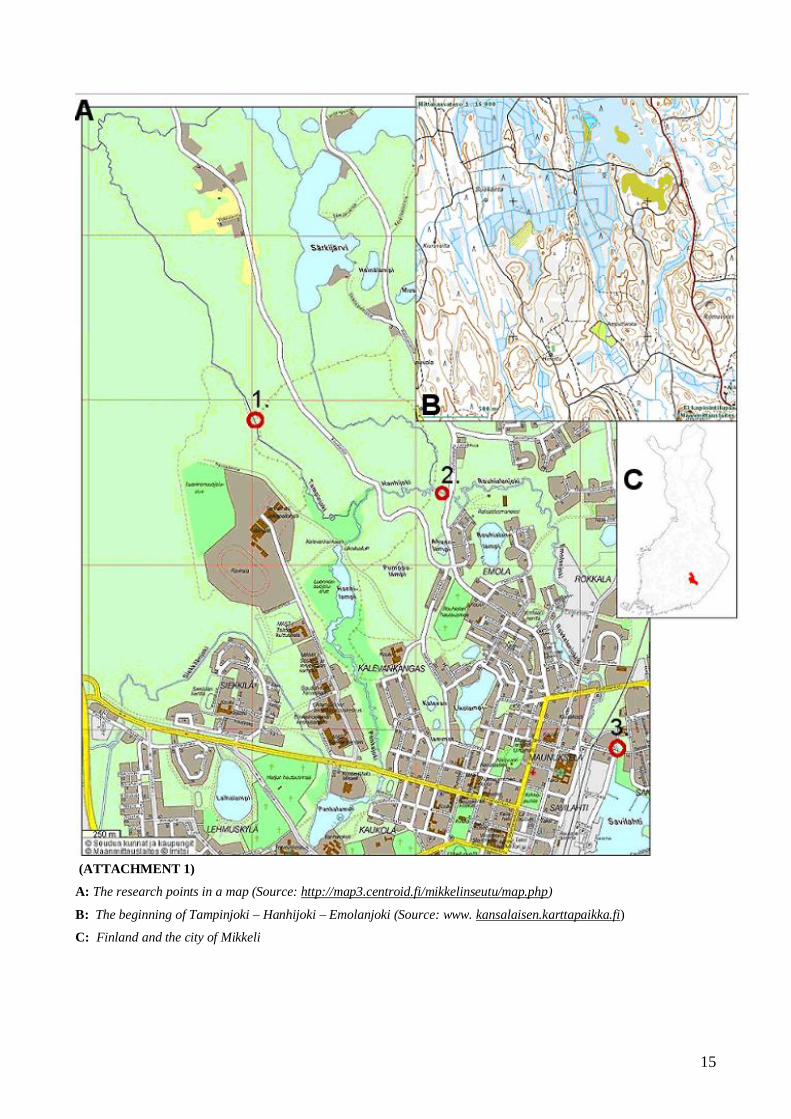
4. Research area
The research point is located in Mikkeli, 61° 5” N 27° E. The researched river
Tampinjoki – Hanhijoki – Emolanjoki is 9,7 kilometres long and has two tributaries. It begins from
a ditched swamp south of Mikkeli, and it continues in a riverbed bordered with rocks towards the
outdoor recreation area of Kalevankangas. Typical for the terrain are even sandy areas where
spruces grow, kettle holes and eskers. The research was done in three different points.
(ATTACHMENT 1) The first point, situated in the Kalevankangas forest area represents the
headwaters of the river. The area is in its natural state and belongs to the Natura 2000 –project.
Before the second point, another river, Siekkilänjoki – Pankajoki unites with
Tampinjoki from the south through Hanhilampi. The river changes its name to Hanhijoki.
Sirkkapuro unites with the river from the north, and the name changes again to Emolanjoki. It flows
in a riverbed in a terrain which is mainly covered with deciduous trees. The end of the riverbed is
modified. Some decades ago a dam was operating in Emolanjoki. Its hydroelectric power was used
by a mill. Lastly the river flows through settlement and industrial areas and flows into Mikkeli’s
dock which is a part of Finland’s biggest lake Saimaa. The beginning point of the river is 112
meters above the sea level, whereas the ending point flowing into Saimaa is 36 meters lower than
the beginning point. The altitude difference is therefore quite big.
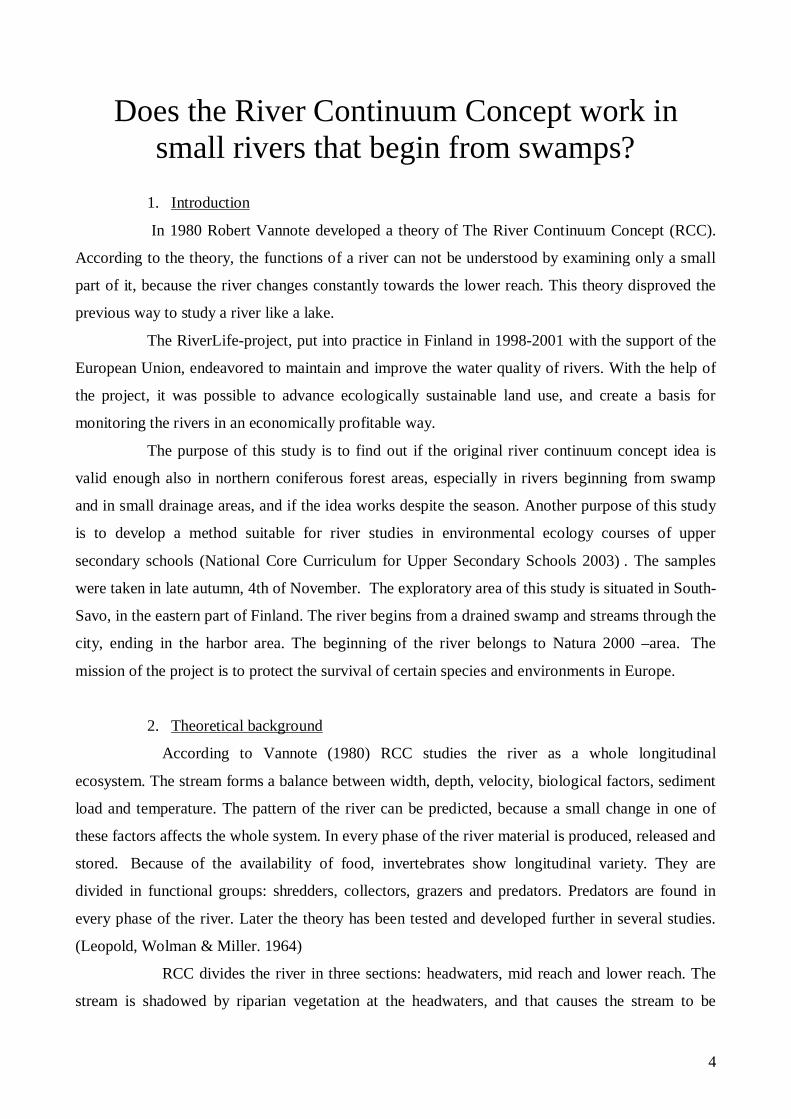
5. Carrying out the research
This research was
conducted in three different
points of the Tampinjoki –
Hanhijoki- Emolanjoki area.
The factors examined are
divided into three groups,
which are biological,
hydrological –
morphological and chemical – physical.
(FIG 1) 10 meters were measured from theriver.
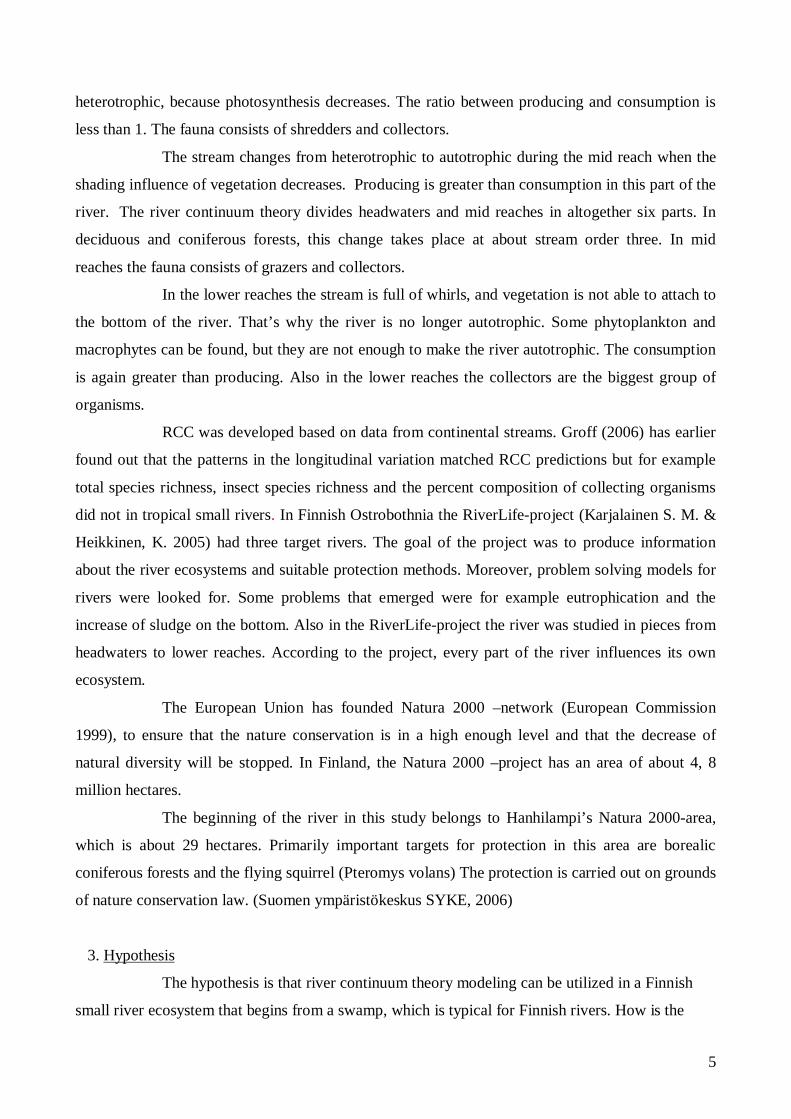
(FIG 2) The velocity was counted aftermeasuring.
7
Hydrological – morfological factors are velocity of the water, different obstacles like dams
and waterfalls, structure of the bank, sediment load, variety in depth and width and possible
groundwater formations. The depth was measured in the middle of the river. The velocity was
studied by measuring 10 meters from the river and counting the time it took a 5-centimeter-long
wooden stick to move that distance in the middle of the river. (Fig 1, Fig 2) River barriers and
groundwater formations were checked from a map. Sediment load was examined by placing a
plankton net horizontally against the river bottom for one minute. The matter was poured on a
glassy dish.
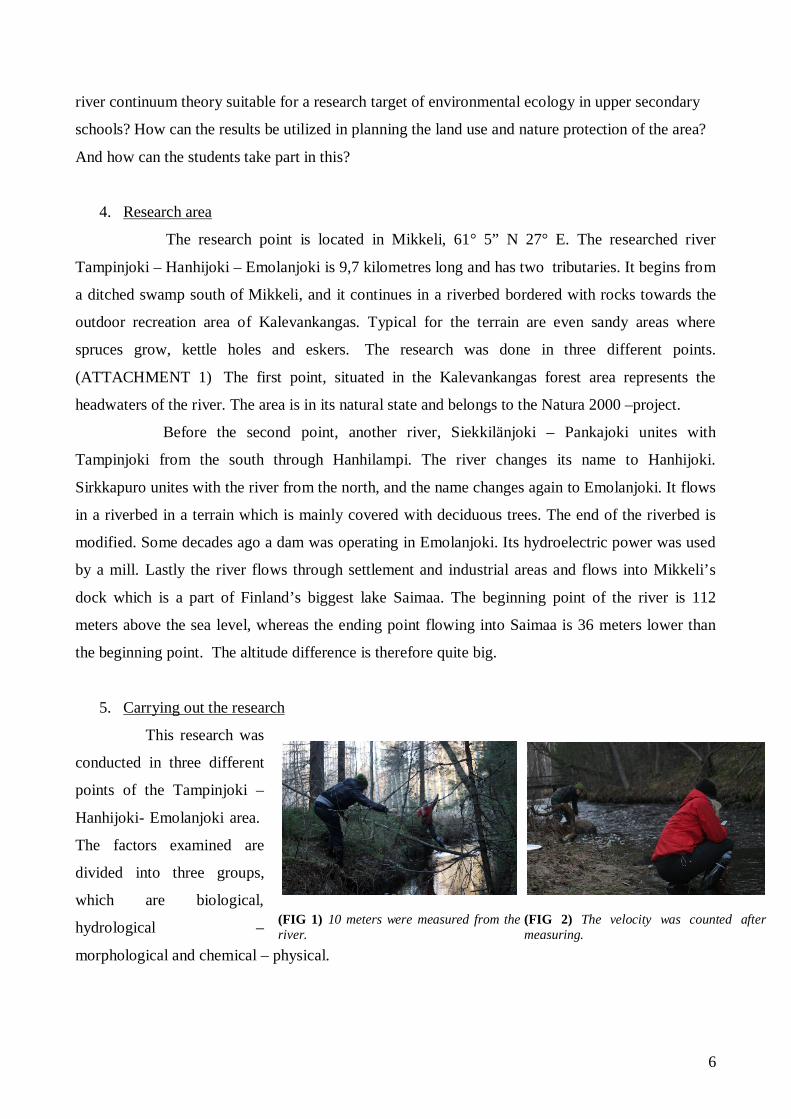
Biological
factors are water
vegetation, ground
fauna and fish. Fish
could not be
quantified with
school equipment.
The ground fauna was examined with a net whose diameter was 25 centimeters. The mesh size was
2 millimeters. The net was moved along the river bottom with sawing movements towards the
higher reaches. (Fig 3) The matter attached to the net was poured
into a flat dish and the invertebrates were collected with tweezers to a dish
containing ethanol. (Fig 4) The classification of water vegetation was done
in depth according to a profile drawn from a line.
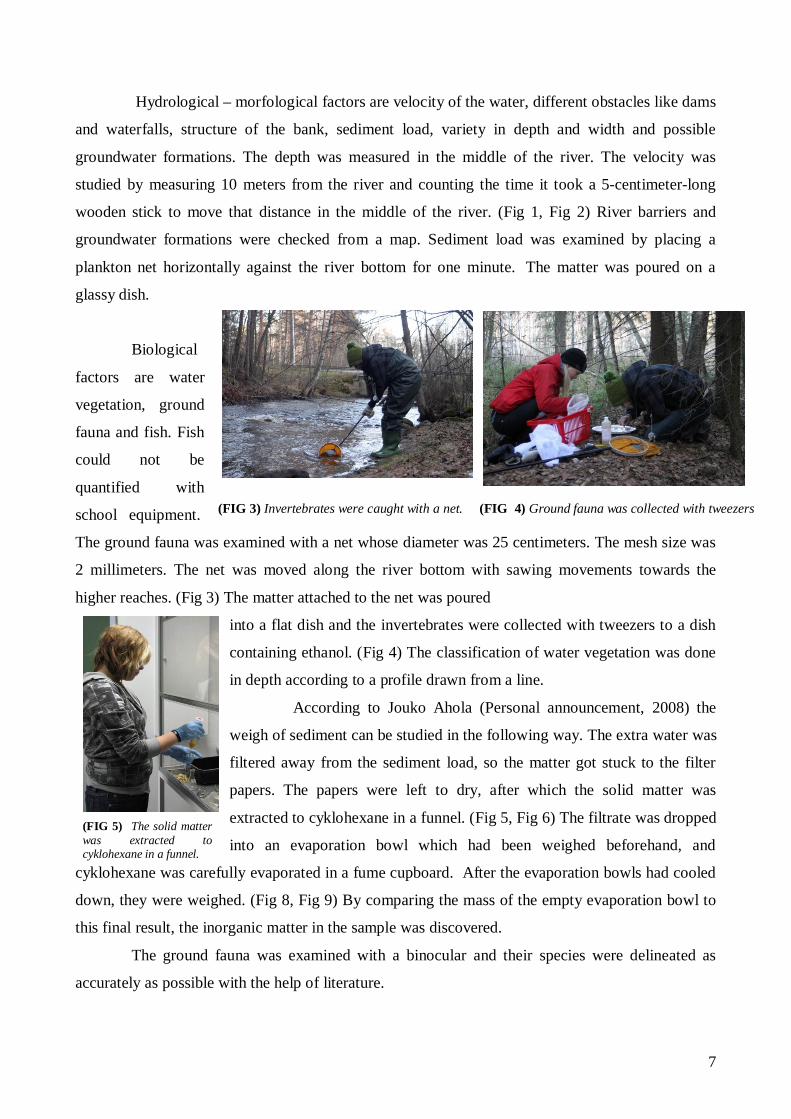
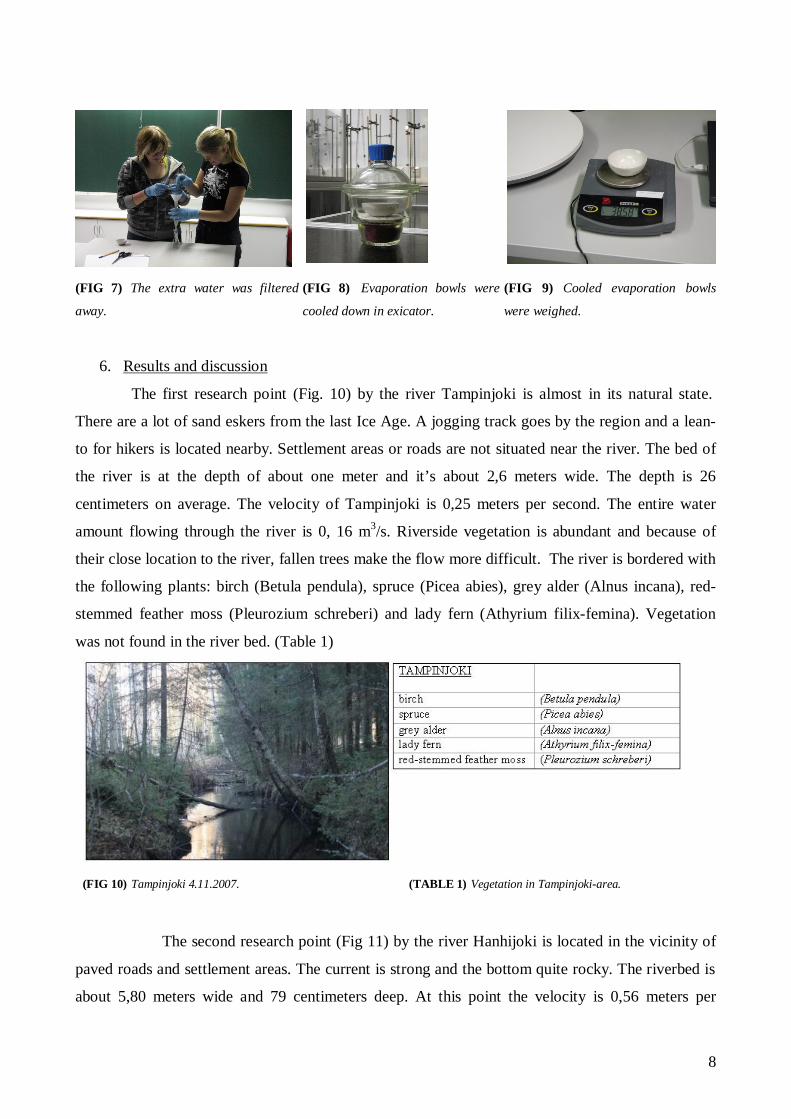
According to Jouko Ahola (Personal announcement, 2008) the
weigh of sediment can be studied in the following way. The extra water was
filtered away from the sediment load, so the matter got stuck to the filter
papers. The papers were left to dry, after which the solid matter was
extracted to cyklohexane in a funnel. (Fig 5, Fig 6) The filtrate was dropped
into an evaporation bowl which had been weighed beforehand, and
cyklohexane was carefully evaporated in a fume cupboard. After the evaporation bowls had cooled
down, they were weighed. (Fig 8, Fig 9) By comparing the mass of the empty evaporation bowl to
this final result, the inorganic matter in the sample was discovered.
The ground fauna was examined with a binocular and their species were delineated as
accurately as possible with the help of literature.
(FIG 3) Invertebrates were caught with a net. (FIG 4) Ground fauna was collected with tweezers
(FIG 5) The solid matterwas extracted tocyklohexane in a funnel.
8
6. Results and discussion
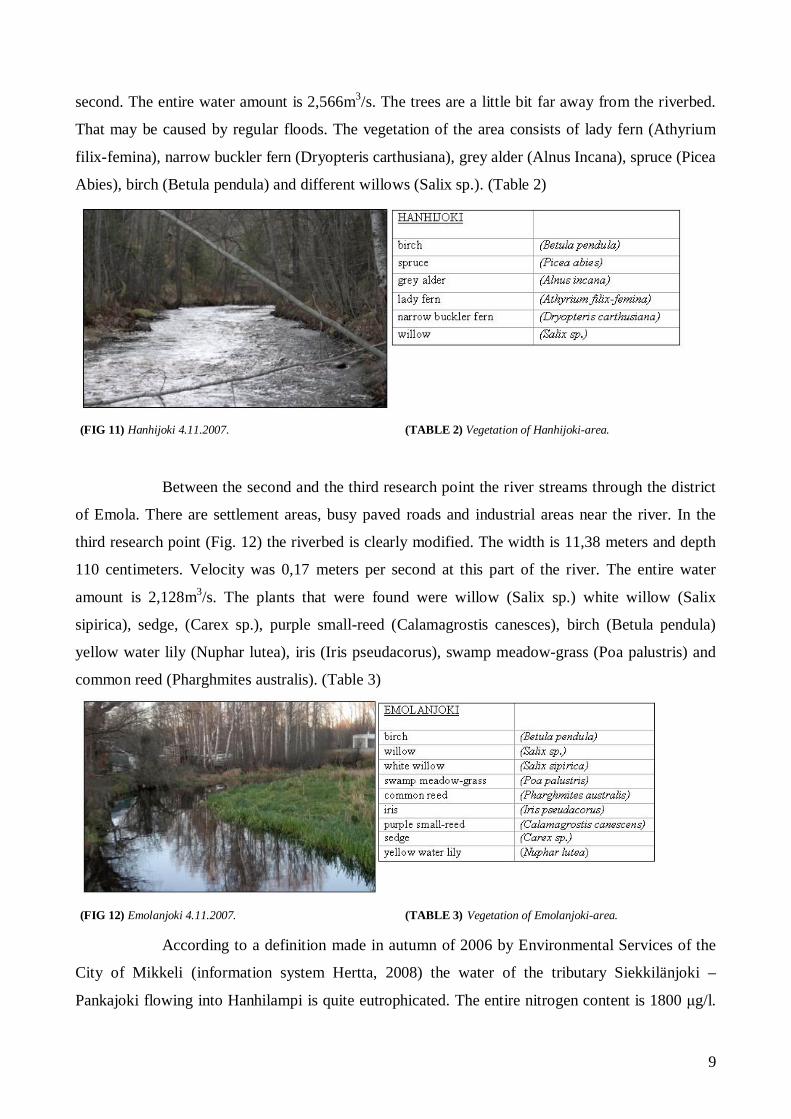
The first research point (Fig. 10) by the river Tampinjoki is almost in its natural state.
There are a lot of sand eskers from the last Ice Age. A jogging track goes by the region and a lean-
to for hikers is located nearby. Settlement areas or roads are not situated near the river. The bed of
the river is at the depth of about one meter and it’s about 2,6 meters wide. The depth is 26
centimeters on average. The velocity of Tampinjoki is 0,25 meters per second. The entire water
amount flowing through the river is 0, 16 m3/s. Riverside vegetation is abundant and because of
their close location to the river, fallen trees make the flow more difficult. The river is bordered with
the following plants: birch (Betula pendula), spruce (Picea abies), grey alder (Alnus incana), red-
stemmed feather moss (Pleurozium schreberi) and lady fern (Athyrium filix-femina). Vegetation
was not found in the river bed. (Table 1)
(FIG 10) Tampinjoki 4.11.2007. (TABLE 1) Vegetation in Tampinjoki-area.
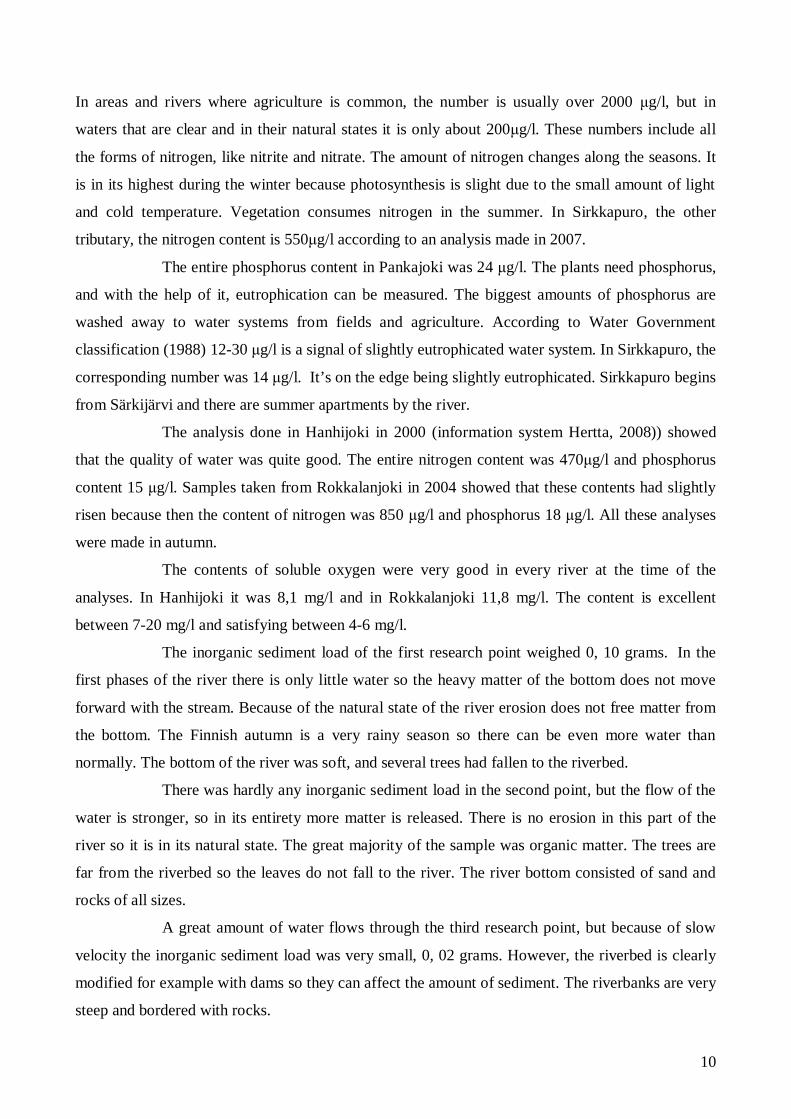
The second research point (Fig 11) by the river Hanhijoki is located in the vicinity of
paved roads and settlement areas. The current is strong and the bottom quite rocky. The riverbed is
about 5,80 meters wide and 79 centimeters deep. At this point the velocity is 0,56 meters per
(FIG 7) The extra water was filtered
away.
(FIG 8) Evaporation bowls were
cooled down in exicator.
(FIG 9) Cooled evaporation bowls
were weighed.
9
second. The entire water amount is 2,566m3/s. The trees are a little bit far away from the riverbed.
That may be caused by regular floods. The vegetation of the area consists of lady fern (Athyrium
filix-femina), narrow buckler fern (Dryopteris carthusiana), grey alder (Alnus Incana), spruce (Picea
Abies), birch (Betula pendula) and different willows (Salix sp.). (Table 2)
(FIG 11) Hanhijoki 4.11.2007. (TABLE 2) Vegetation of Hanhijoki-area.
Between the second and the third research point the river streams through the district
of Emola. There are settlement areas, busy paved roads and industrial areas near the river. In the
third research point (Fig. 12) the riverbed is clearly modified. The width is 11,38 meters and depth
110 centimeters. Velocity was 0,17 meters per second at this part of the river. The entire water
amount is 2,128m3/s. The plants that were found were willow (Salix sp.) white willow (Salix
sipirica), sedge, (Carex sp.), purple small-reed (Calamagrostis canesces), birch (Betula pendula)
yellow water lily (Nuphar lutea), iris (Iris pseudacorus), swamp meadow-grass (Poa palustris) and
common reed (Pharghmites australis). (Table 3)
(FIG 12) Emolanjoki 4.11.2007. (TABLE 3) Vegetation of Emolanjoki-area.
According to a definition made in autumn of 2006 by Environmental Services of the
City of Mikkeli (information system Hertta, 2008) the water of the tributary Siekkilänjoki –
Pankajoki flowing into Hanhilampi is quite eutrophicated. The entire nitrogen content is 1800 g/l.
10
In areas and rivers where agriculture is common, the number is usually over 2000 g/l, but in
waters that are clear and in their natural states it is only about 200 g/l. These numbers include all
the forms of nitrogen, like nitrite and nitrate. The amount of nitrogen changes along the seasons. It
is in its highest during the winter because photosynthesis is slight due to the small amount of light
and cold temperature. Vegetation consumes nitrogen in the summer. In Sirkkapuro, the other
tributary, the nitrogen content is 550 g/l according to an analysis made in 2007.
The entire phosphorus content in Pankajoki was 24 g/l. The plants need phosphorus,
and with the help of it, eutrophication can be measured. The biggest amounts of phosphorus are
washed away to water systems from fields and agriculture. According to Water Government
classification (1988) 12-30 g/l is a signal of slightly eutrophicated water system. In Sirkkapuro, the
corresponding number was 14 g/l. It’s on the edge being slightly eutrophicated. Sirkkapuro begins
from Särkijärvi and there are summer apartments by the river.
The analysis done in Hanhijoki in 2000 (information system Hertta, 2008)) showed
that the quality of water was quite good. The entire nitrogen content was 470 g/l and phosphorus
content 15 g/l. Samples taken from Rokkalanjoki in 2004 showed that these contents had slightly
risen because then the content of nitrogen was 850 g/l and phosphorus 18 g/l. All these analyses
were made in autumn.
The contents of soluble oxygen were very good in every river at the time of the
analyses. In Hanhijoki it was 8,1 mg/l and in Rokkalanjoki 11,8 mg/l. The content is excellent
between 7-20 mg/l and satisfying between 4-6 mg/l.
The inorganic sediment load of the first research point weighed 0, 10 grams. In the
first phases of the river there is only little water so the heavy matter of the bottom does not move
forward with the stream. Because of the natural state of the river erosion does not free matter from
the bottom. The Finnish autumn is a very rainy season so there can be even more water than
normally. The bottom of the river was soft, and several trees had fallen to the riverbed.
There was hardly any inorganic sediment load in the second point, but the flow of the
water is stronger, so in its entirety more matter is released. There is no erosion in this part of the
river so it is in its natural state. The great majority of the sample was organic matter. The trees are
far from the riverbed so the leaves do not fall to the river. The river bottom consisted of sand and
rocks of all sizes.
A great amount of water flows through the third research point, but because of slow
velocity the inorganic sediment load was very small, 0, 02 grams. However, the riverbed is clearly
modified for example with dams so they can affect the amount of sediment. The riverbanks are very
steep and bordered with rocks.
11
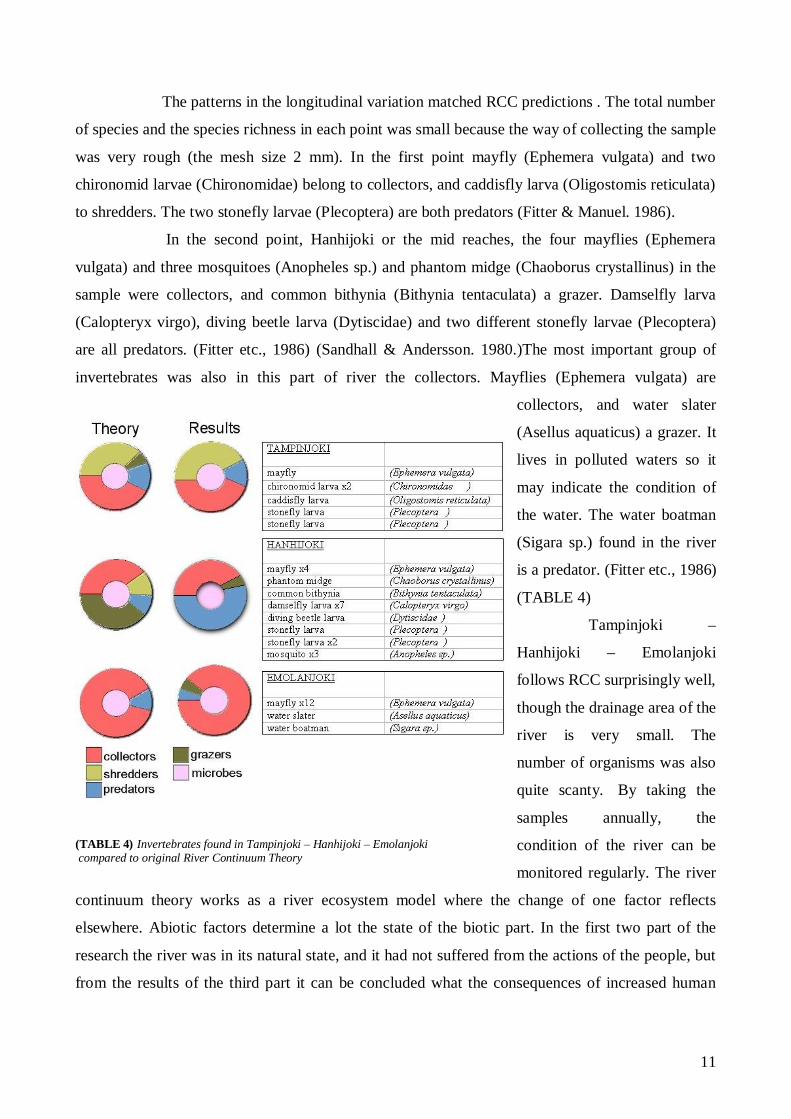
The patterns in the longitudinal variation matched RCC predictions . The total number
of species and the species richness in each point was small because the way of collecting the sample
was very rough (the mesh size 2 mm). In the first point mayfly (Ephemera vulgata) and two
chironomid larvae (Chironomidae) belong to collectors, and caddisfly larva (Oligostomis reticulata)
to shredders. The two stonefly larvae (Plecoptera) are both predators (Fitter & Manuel. 1986).
In the second point, Hanhijoki or the mid reaches, the four mayflies (Ephemera
vulgata) and three mosquitoes (Anopheles sp.) and phantom midge (Chaoborus crystallinus) in the
sample were collectors, and common bithynia (Bithynia tentaculata) a grazer. Damselfly larva
(Calopteryx virgo), diving beetle larva (Dytiscidae) and two different stonefly larvae (Plecoptera)
are all predators. (Fitter etc., 1986) (Sandhall & Andersson. 1980.)The most important group of
invertebrates was also in this part of river the collectors. Mayflies (Ephemera vulgata) are
collectors, and water slater
(Asellus aquaticus) a grazer. It
lives in polluted waters so it
may indicate the condition of
the water. The water boatman
(Sigara sp.) found in the river
is a predator. (Fitter etc., 1986)
(TABLE 4)
Tampinjoki –
Hanhijoki – Emolanjoki
follows RCC surprisingly well,
though the drainage area of the
river is very small. The
number of organisms was also
quite scanty. By taking the
samples annually, the
condition of the river can be
monitored regularly. The river
continuum theory works as a river ecosystem model where the change of one factor reflects
elsewhere. Abiotic factors determine a lot the state of the biotic part. In the first two part of the
research the river was in its natural state, and it had not suffered from the actions of the people, but
from the results of the third part it can be concluded what the consequences of increased human
(TABLE 4) Invertebrates found in Tampinjoki – Hanhijoki – Emolanjoki compared to original River Continuum Theory
12
actions are. Signals of eutrophication and pollution can be observed in the area between the second
and the third point.
The river flows through a settlement area so rain waters wash away possible phosphate
and nitrate run offs from the golf course and fields. The fallouts of traffic and other human actions
can cause strain to the river. The closest areas of the river should stay outside human actions, and be
restricted from construction so they will not have any influence on Saimaa.
Although the phosphorus and nitrogen contents were raised in one tributary of the
examined river, Pankajoki, the contents were good in other parts of the river, so possible fallouts in
Pankajoki don’t seem to affect the other rivers. Phosphorus is one of the greatest causes to
eutrophication because it enhances the growth of algae, which affects also the production of other
vegetation. Nitrogen has similar effects. The organic matter fallen to the bottom has to be
decomposed so the increased decomposer action consumes great amounts of oxygen. In
eutrophicated water systems the oxygen loss is a common problem. In the area on Tampinjoki –
Hanhijoki – Emolanjoki the oxygen contents were good.
The river ecosystem differs slightly from a lake ecosystem because the water changes
constantly and the oxygen loss does not appear in the river. In the case of Tampinjoki – Hanhijoki –
Emolanjoki the big amounts of nutrients affect probably the deltas and the lakes the river flows into.
The contents of nutrients and oxygen should be carefully followed particularly in the Saimaa area.
The area could be protected by planning constructions more far away from the river banks and by
reducing the use of phosphorus containing fertilizers as far as possible.
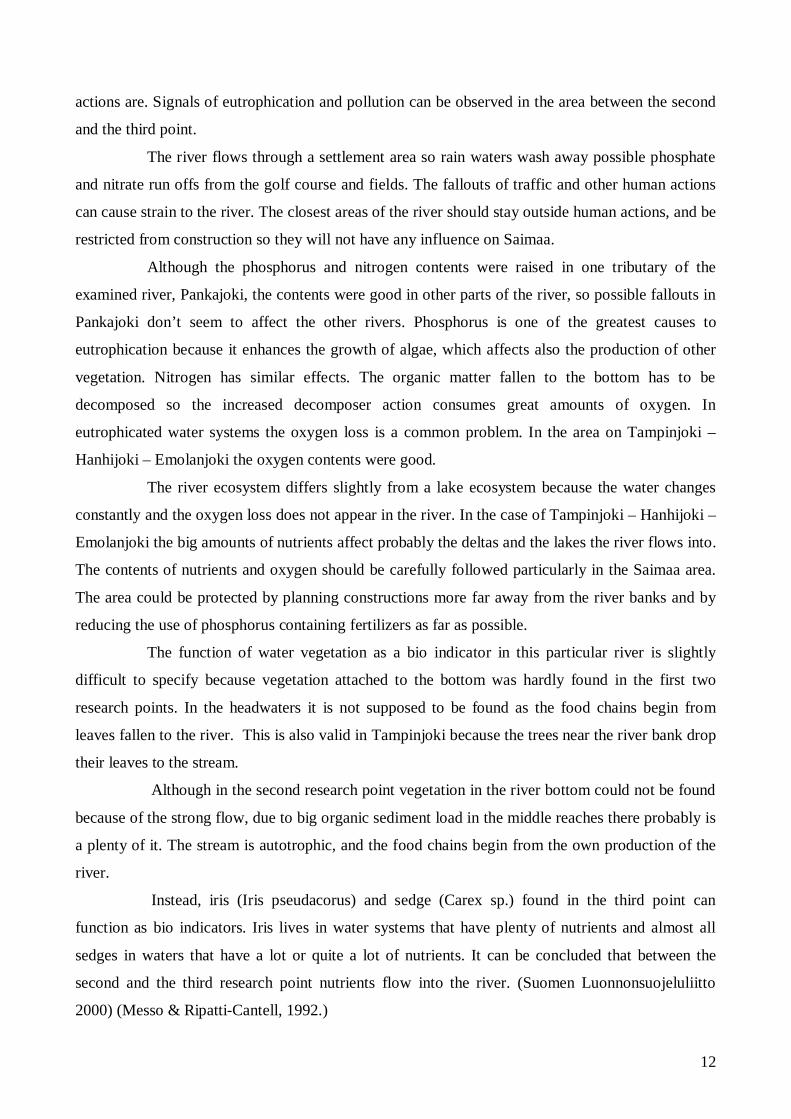
The function of water vegetation as a bio indicator in this particular river is slightly
difficult to specify because vegetation attached to the bottom was hardly found in the first two
research points. In the headwaters it is not supposed to be found as the food chains begin from
leaves fallen to the river. This is also valid in Tampinjoki because the trees near the river bank drop
their leaves to the stream.
Although in the second research point vegetation in the river bottom could not be found
because of the strong flow, due to big organic sediment load in the middle reaches there probably is
a plenty of it. The stream is autotrophic, and the food chains begin from the own production of the
river.
Instead, iris (Iris pseudacorus) and sedge (Carex sp.) found in the third point can
function as bio indicators. Iris lives in water systems that have plenty of nutrients and almost all
sedges in waters that have a lot or quite a lot of nutrients. It can be concluded that between the
second and the third research point nutrients flow into the river. (Suomen Luonnonsuojeluliitto
2000) (Messo & Ripatti-Cantell, 1992.)
13
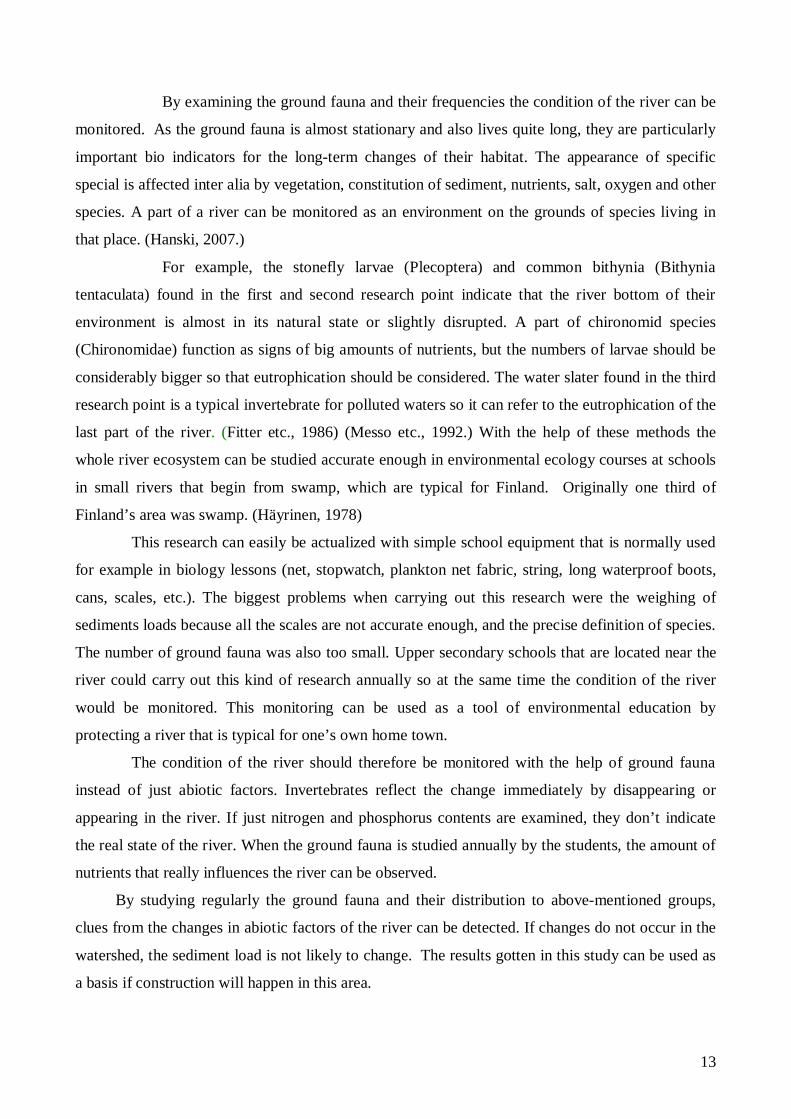
By examining the ground fauna and their frequencies the condition of the river can be
monitored. As the ground fauna is almost stationary and also lives quite long, they are particularly
important bio indicators for the long-term changes of their habitat. The appearance of specific
special is affected inter alia by vegetation, constitution of sediment, nutrients, salt, oxygen and other
species. A part of a river can be monitored as an environment on the grounds of species living in
that place. (Hanski, 2007.)
For example, the stonefly larvae (Plecoptera) and common bithynia (Bithynia
tentaculata) found in the first and second research point indicate that the river bottom of their
environment is almost in its natural state or slightly disrupted. A part of chironomid species
(Chironomidae) function as signs of big amounts of nutrients, but the numbers of larvae should be
considerably bigger so that eutrophication should be considered. The water slater found in the third
research point is a typical invertebrate for polluted waters so it can refer to the eutrophication of the
last part of the river. (Fitter etc., 1986) (Messo etc., 1992.) With the help of these methods the
whole river ecosystem can be studied accurate enough in environmental ecology courses at schools
in small rivers that begin from swamp, which are typical for Finland. Originally one third of
Finland’s area was swamp. (Häyrinen, 1978)
This research can easily be actualized with simple school equipment that is normally used
for example in biology lessons (net, stopwatch, plankton net fabric, string, long waterproof boots,
cans, scales, etc.). The biggest problems when carrying out this research were the weighing of
sediments loads because all the scales are not accurate enough, and the precise definition of species.
The number of ground fauna was also too small. Upper secondary schools that are located near the
river could carry out this kind of research annually so at the same time the condition of the river
would be monitored. This monitoring can be used as a tool of environmental education by
protecting a river that is typical for one’s own home town.
The condition of the river should therefore be monitored with the help of ground fauna
instead of just abiotic factors. Invertebrates reflect the change immediately by disappearing or
appearing in the river. If just nitrogen and phosphorus contents are examined, they don’t indicate
the real state of the river. When the ground fauna is studied annually by the students, the amount of
nutrients that really influences the river can be observed.
By studying regularly the ground fauna and their distribution to above-mentioned groups,
clues from the changes in abiotic factors of the river can be detected. If changes do not occur in the
watershed, the sediment load is not likely to change. The results gotten in this study can be used as
a basis if construction will happen in this area.
14
References:
European Commission (1999). Interpretation manual of European Union habitats. Eur 15/2, October
1999. European Commission, DG Environment.
Fitter & Manuel. 1986. Collins Photo Guide to Lakes, Rivers, Streams & Ponds of Britain & North-
West Europe. William Collins Sons and Co Ltd. London, Glasgow, Sydney, Auckland, Toronto,
Johannesburg, 1995.
Hanski. 2007. Kutistuva maailma. Elinympäristöjen häviämisen populaatioekologiset seuraukset.
Gaudeamus. Tammer-Paino Oyj, Tampere 2007.
Hirsijärvi, Remes & Sajavaara. 1997. Tutki ja kirjoita. Tammi Helsinki,2003.
Häyrinen, Urpo. 1978. Suo. Yhteiskirjapaino Oy, Helsinki, 1978.
Kanerva, Kara, & Karkela. 1992. Tutki ympäristöäsi. WSOY, Juva 1992.
Karjalainen & Heikkinen. 2005. The RiverLife project and Implementation of the Water
Framework Directive. Environ. Sci. Policy 8(3): 263–265.
Leopold, Wolman & Miller. 1964. Fluvial processes in geomorphology. W.H. Freeman, San
Fransisco, Cali., 522p.
Messo & Ripatti-Cantell. 1992. Veden laadun arviointi bioindikaation avulla.----. Kirjapaino Oy
Merkur, Helsinki 1992.
Sandhall & Andersson. 1980. Sääsket ja kärpäset. WSOY Porvoo-Helsinki-Juva 1980.
Vannote, Minshall, Cummins, Sedell & Cushing. 1980. River Continuum Concept. Can. J. Fish.
Aquatic. Sci. 37:130-137.
Vesi- ja ympäristöhallitus 1988. Vesistöjen laadullisen käyttökelpoisuuden luokittaminen. Vesi- ja
ympäristöhallitus, Helsinki. Vesi- ja ympäristöhallituksen julkaisuja 20.
Vesien eteen – vesien suojelun opetuspaketti. Suomen Luonnonsuojeluliiton julkaisuja 1/2000.
Finnish National Board of Education (2003). National Core Curriculum for Upper Secondary
Schools. Available in the Internet. <http://www.edu.fi/julkaisut/english/LOPS_2003_engl.pdf >.
Read 25.9.2007.
Groff, Margaret. 2006. Does the River Continuum Concept Work in Small Island Streams?
Functional Feeding Group Variation Along a Longitudial Gradient. Available in the Internet. <
http://repositories.cdlib.org/cgi/viewcontent.cgi?article=1073&context=wrca> Read 25.11.2007.
Stroud Water Research Center. A Portrait – 5. River Continuum. Available in the Internet
<www.stroudcenter.org/portrait/05.htm>. Read 25.9.2007.
Information system Hertta, 2008. Environmental Services of the region of Mikkeli, Waterworks and
Finland’s Environmental Government.
Ahola, J. Chemistry teacher of Mikkelin Yhteiskoulun lukio. 2007. Personal announcement.
15
(ATTACHMENT 1)
A: The research points in a map (Source: http://map3.centroid.fi/mikkelinseutu/map.php)
B: The beginning of Tampinjoki – Hanhijoki – Emolanjoki (Source: www. kansalaisen.karttapaikka.fi)
C: Finland and the city of Mikkeli