what is florida? - university of floridawec.ufl.edu/floridarivers/fieldecology/pine field ecology...
TRANSCRIPT

1
What is Florida?
FL peninsula is the exposed portion of the
Florida Platform – measured between the
200 meter contour, total 300 miles wide
Platform is composed of variably permeable
carbonate sediments, limestone and
dolostone, sitting on older igneous
sedimentary rocks
What is Florida?
In west-central, north-central, and panhandle
Florida, carbonate rocks are near the surface
–adjacent areas sand, silt, clay
Interaction between the two = fissures
3 Aquifers
Floridian (FAS)
Thick permeable
carbonate
Intermediate
Carbonate and clays, silt,
sand
Suficial Aquifer
Sand, shell carbonate
Springs result from
discharge from the FA

2
Aquifer recharge FAS recharged by
rainwater
Water + CO2 = carbonic
acid
Dissolves limestone
enlarging fractures
Dissolution enhances
permeability of
sediments forming
caves and cavities
Closer the water is to
the surface…
Two types of springs in Florida
Seeps (water table
springs)
Rainwater moves
through permeable layers
until moves laterally
Water eventually “seeps”
to the surface in a low
lying area (Apalachicola,
Chipola Rivers)
Karst [def: irregular
limestone region with
sinks and caves] or
artesian springs.
Groundwater discharges
to the surface through an
opening.
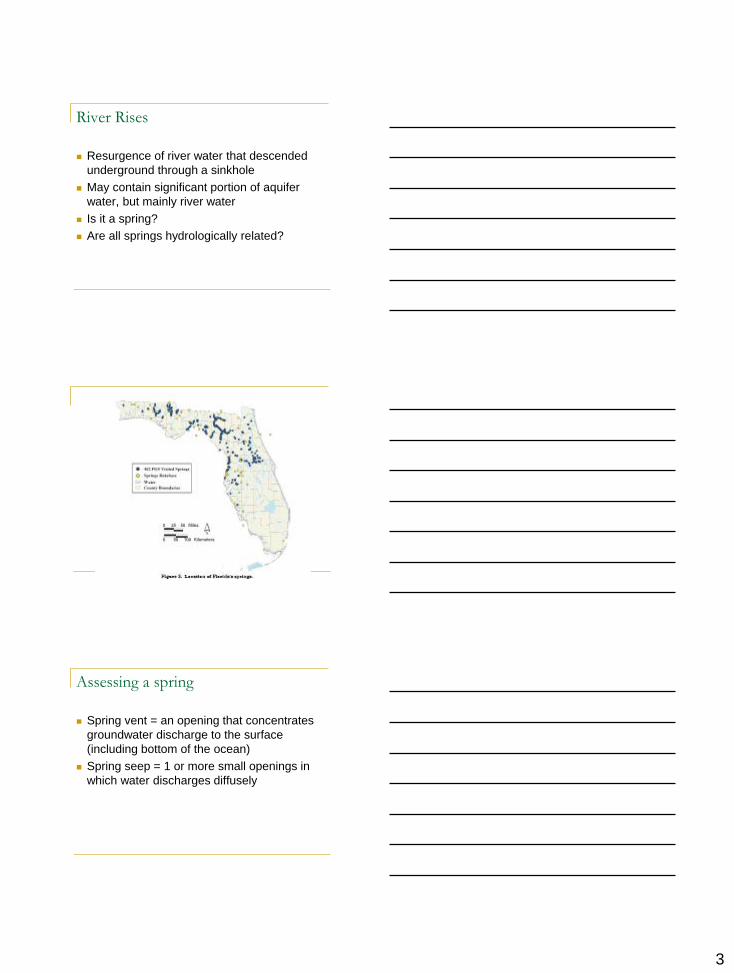
Most of FL 700 identified
springs are karst
Classification
Springs most often
classified based on
average discharge of
water
Discharge varies based
on rainfall, recharge and
groundwater withdrawals
within their recharge area
1st Magnitude = 100 cfs
or more (+ 64.6 mgd)
[N=33]
2nd Magnitude 10 to
100 cfs (6.46 to 64.6
mgd) [N=191]
3rd Magnitude 1 to 10
cfs (0.646 to 6.46 mgd)
[N=151]
3
River Rises
Resurgence of river water that descended
underground through a sinkhole
May contain significant portion of aquifer
water, but mainly river water
Is it a spring?
Are all springs hydrologically related?
Assessing a spring
Spring vent = an opening that concentrates
groundwater discharge to the surface
(including bottom of the ocean)
Spring seep = 1 or more small openings in
which water discharges diffusely

4
Spring uses
Springs have been used for >12,000 years
FAS recharge
Spring recharge basin
“areas within ground
and surface water
basins that contribute
to the discharge of the
spring
Karst systems
frequently include
sinking streams
Direct linkages to the
aquifer
Recharge basin may
include surface water
from outside ground-
water basin…
5
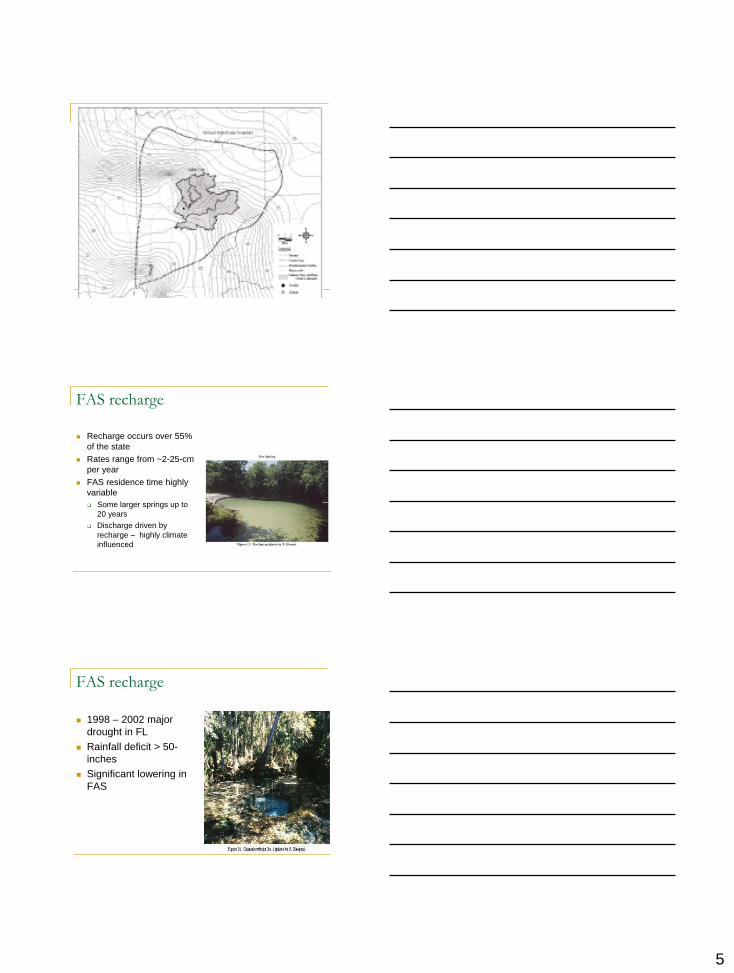
FAS recharge
Recharge occurs over 55%
of the state
Rates range from ~2-25-cm
per year
FAS residence time highly
variable
Some larger springs up to
20 years
Discharge driven by
recharge – highly climate
influenced
FAS recharge
1998 – 2002 major
drought in FL
Rainfall deficit > 50-
inches
Significant lowering in
FAS

6
Reverse flow
Higher river levels =
river flow into springs
River level drops,
springs first pump river
water out of aquifer
Influenced also by
reduction in recharge
area
Santa Fe River
Santa Fe River Basin
3,500 sq-km basin
Major tributary to the Suwannee River
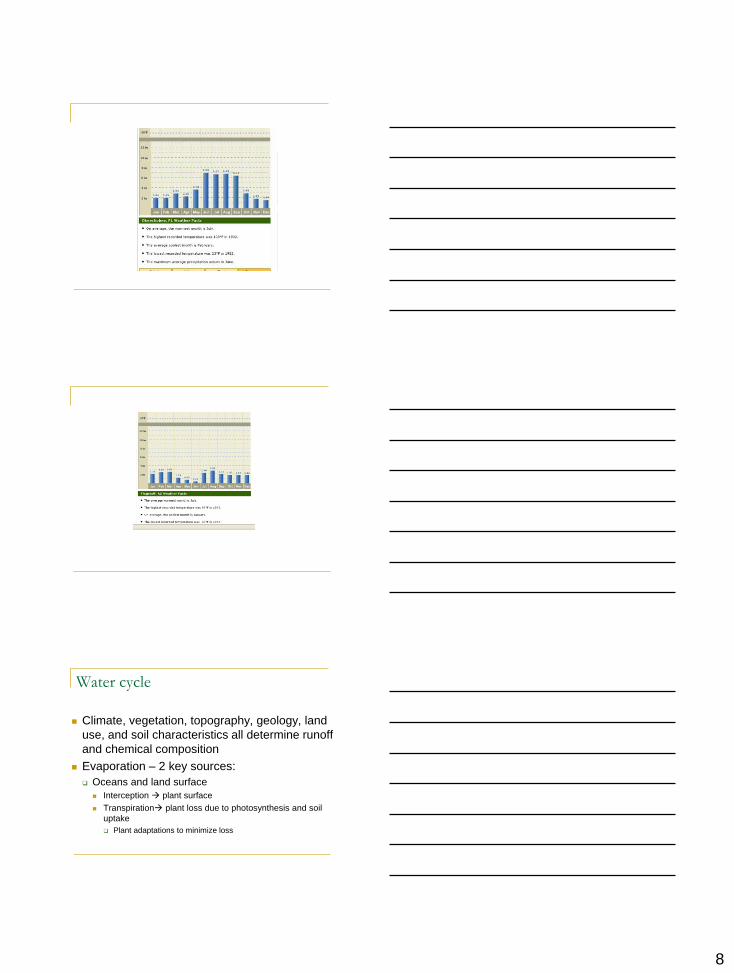
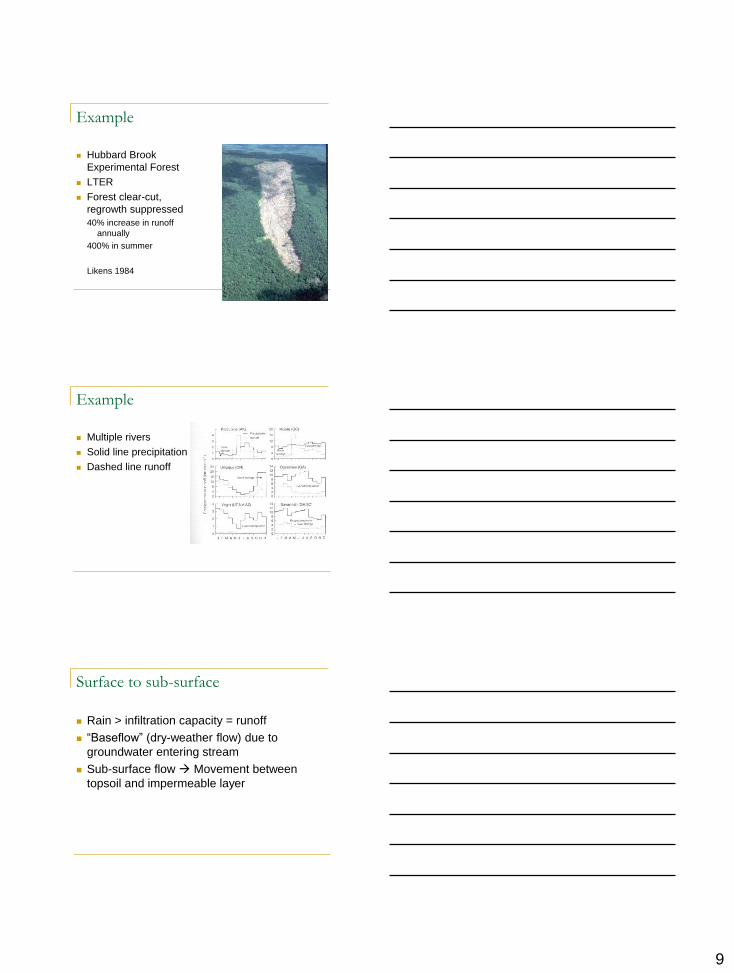
Semi-tropical mean annual precipitation135-
cm (54-in)
52% falls between June and September
7
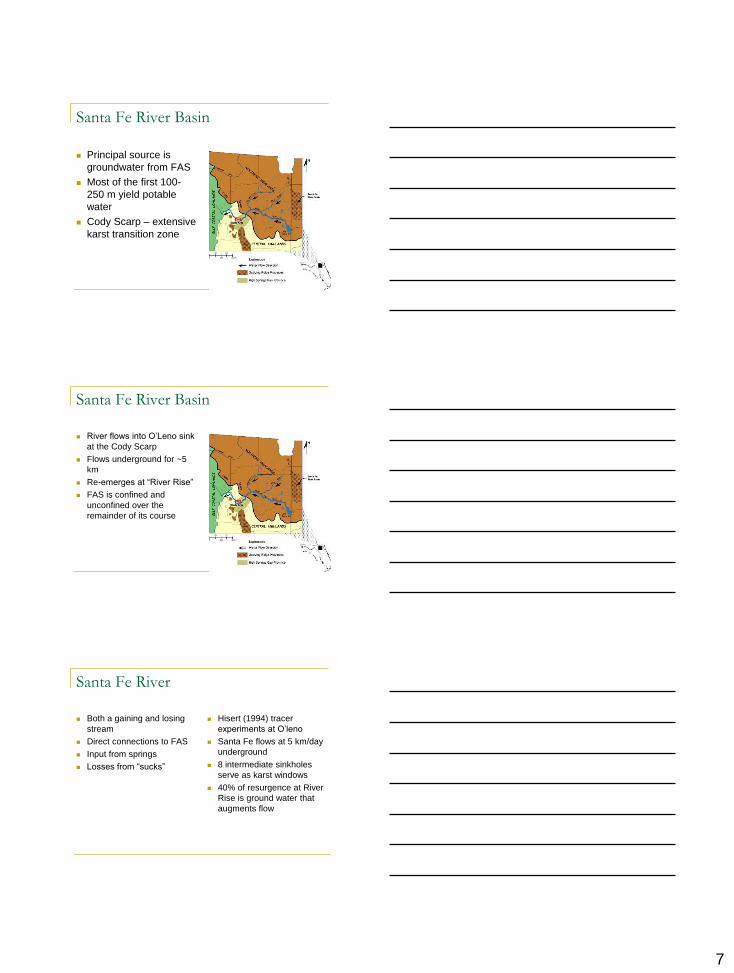
Santa Fe River Basin
Principal source is
groundwater from FAS
Most of the first 100-
250 m yield potable
water
Cody Scarp – extensive
karst transition zone
Santa Fe River Basin
River flows into O’Leno sink
at the Cody Scarp
Flows underground for ~5
km
Re-emerges at “River Rise”
FAS is confined and
unconfined over the
remainder of its course
Santa Fe River
Both a gaining and losing
stream
Direct connections to FAS
Input from springs
Losses from “sucks”
Hisert (1994) tracer
experiments at O’leno
Santa Fe flows at 5 km/day
underground
8 intermediate sinkholes
serve as karst windows
40% of resurgence at River
Rise is ground water that
augments flow

8

9

10
Watch movie
1
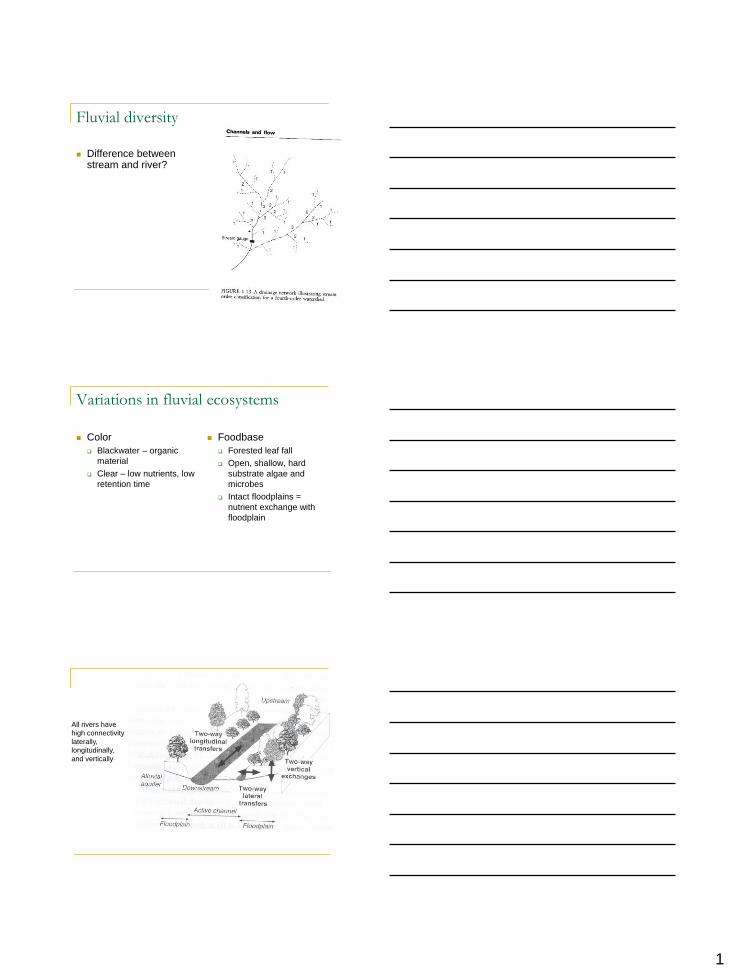
Fluvial diversity
Difference between stream and river?
Variations in fluvial ecosystems
Color
Blackwater – organic
material
Clear – low nutrients, low
retention time
Foodbase
Forested leaf fall
Open, shallow, hard
substrate algae and
microbes
Intact floodplains =
nutrient exchange with
floodplain
All rivers have
high connectivity
laterally,
longitudinally,
and vertically

2
Fluvial hierarchy
Nested hierarchies
1st order = smallest
permanently flowing
1st + 1st = 2nd
2nd + 2nd = ?
Order Number Avg.
length
(km)
Tot length
(km)
Avg.
drainage
area
1 1,570,000 1.6 2,510,000 2.6
3 80,000 8.8 670,000 67
7 200 235 48,000 30,300
9 8 1,240 9,900 684,000
10 1 2,880 2,880 3,240,000
Fluvial hierarchy
Each stream drains area proportional to its
size
“Drainage basin” water flowing into stream as
determined by geography
Drainages nested hierarchies
Defined for entire river (headwater to mouth) or
individual tributaries
Drainage basin or river basin = large units
Watershed and catchment = smaller units
3
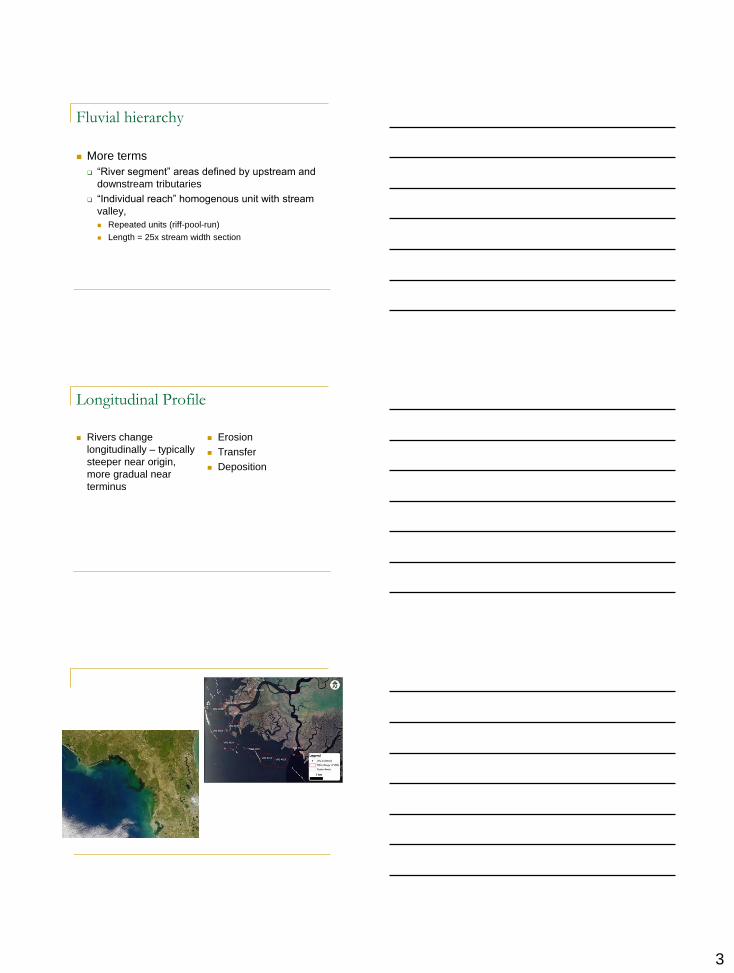
Fluvial hierarchy
More terms
“River segment” areas defined by upstream and
downstream tributaries
“Individual reach” homogenous unit with stream
valley,
Repeated units (riff-pool-run)
Length = 25x stream width section
Longitudinal Profile
Rivers change
longitudinally – typically
steeper near origin,
more gradual near
terminus
Erosion
Transfer
Deposition

4
Sediment sorting
Transporting sediment
function of gradient,
flow volume, particle
size
Streamflow
Key question: how
much water does a
river need and what is
the importance of
natural variation?
Streamflow
Key question: how
much water does a
river need and what is
the importance of
natural variation?
5
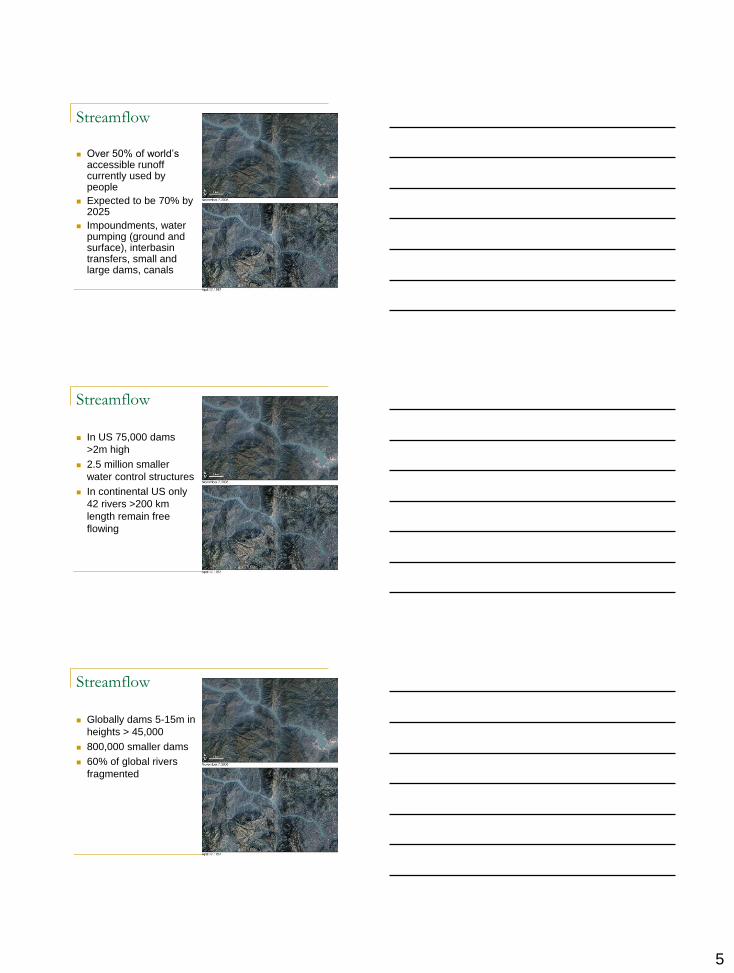
Streamflow
Over 50% of world’s accessible runoff currently used by people
Expected to be 70% by 2025
Impoundments, water pumping (ground and surface), interbasin transfers, small and large dams, canals
Streamflow
In US 75,000 dams
>2m high
2.5 million smaller
water control structures
In continental US only
42 rivers >200 km
length remain free
flowing
Streamflow
Globally dams 5-15m in
heights > 45,000
800,000 smaller dams
60% of global rivers
fragmented
6
Discharge
32-37 x 103 km/yr global discharge
Most discharge occurs in tropical and
subtropical areas
10 largest rivers account for 40%
Amazon 15% global discharge
US discharge, Mississippi 40%, Columbia, Mobile,
and Susquehanna additional 20%
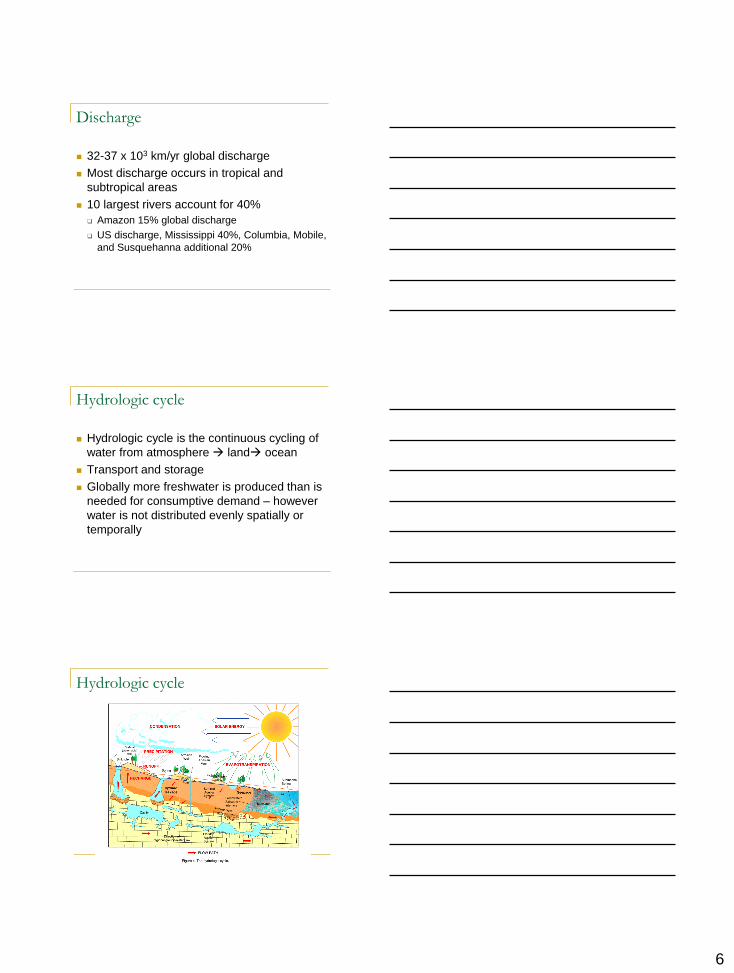
Hydrologic cycle
Hydrologic cycle is the continuous cycling of
water from atmosphere land ocean
Transport and storage
Globally more freshwater is produced than is
needed for consumptive demand – however
water is not distributed evenly spatially or
temporally
Hydrologic cycle
7
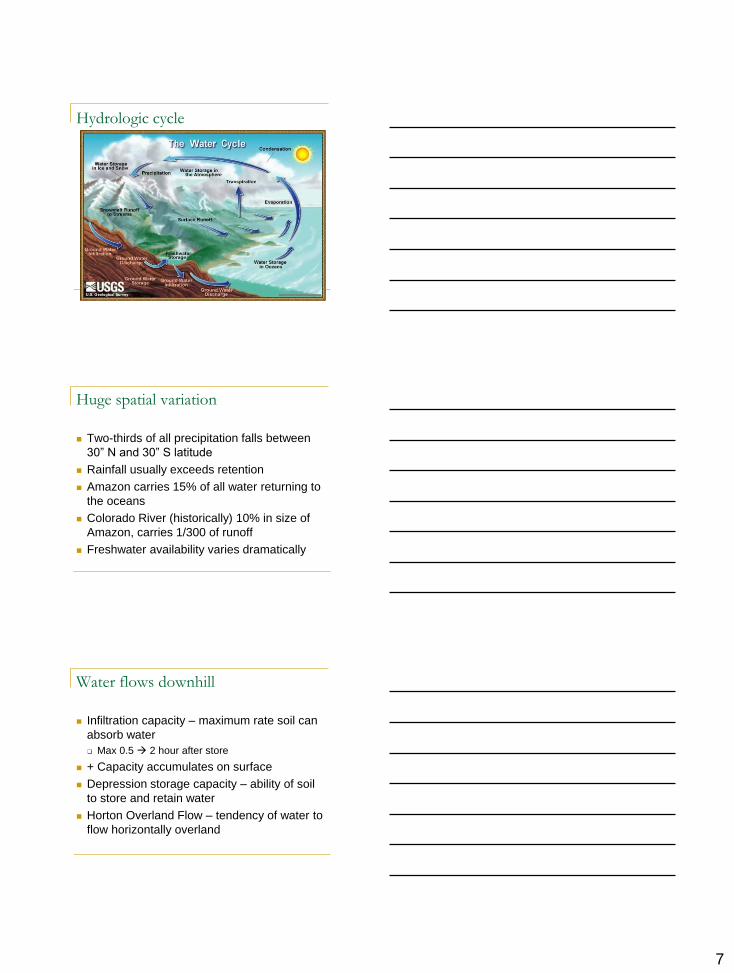
Hydrologic cycle
Huge spatial variation
Two-thirds of all precipitation falls between
30” N and 30” S latitude
Rainfall usually exceeds retention
Amazon carries 15% of all water returning to
the oceans
Colorado River (historically) 10% in size of
Amazon, carries 1/300 of runoff
Freshwater availability varies dramatically
Water flows downhill
Infiltration capacity – maximum rate soil can
absorb water
Max 0.5 2 hour after store
+ Capacity accumulates on surface
Depression storage capacity – ability of soil
to store and retain water
Horton Overland Flow – tendency of water to
flow horizontally overland
8
Water cycle
Climate, vegetation, topography, geology, land
use, and soil characteristics all determine runoff
and chemical composition
Evaporation – 2 key sources:
Oceans and land surface
Interception plant surface
Transpiration plant loss due to photosynthesis and soil
uptake
Plant adaptations to minimize loss
9
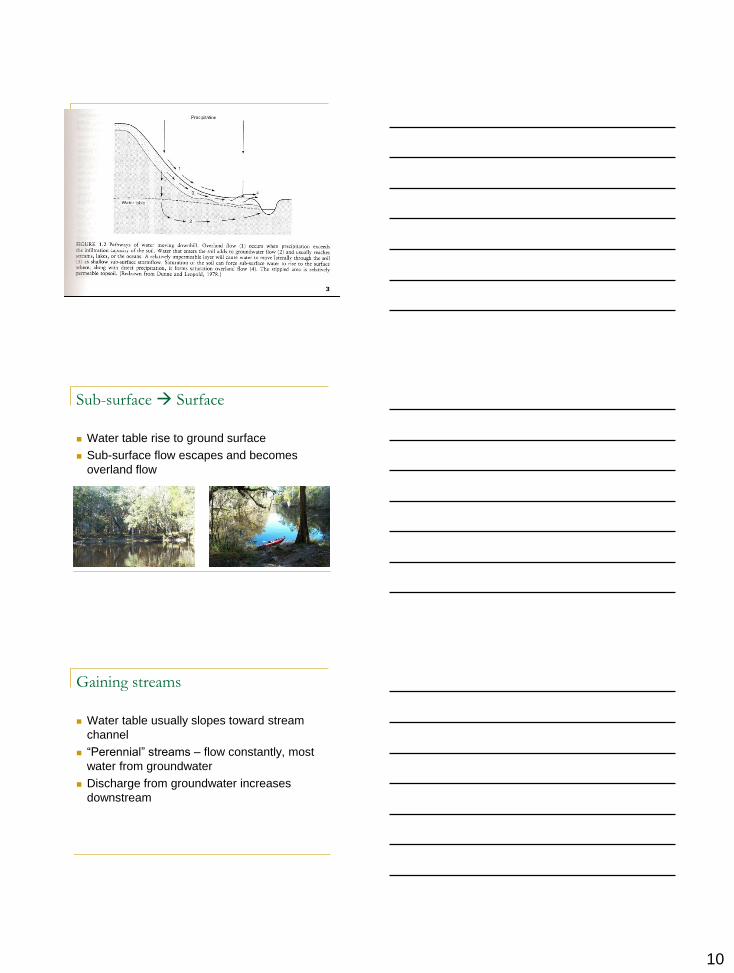
Example
Hubbard Brook
Experimental Forest
LTER
Forest clear-cut,
regrowth suppressed
40% increase in runoff
annually
400% in summer
Likens 1984
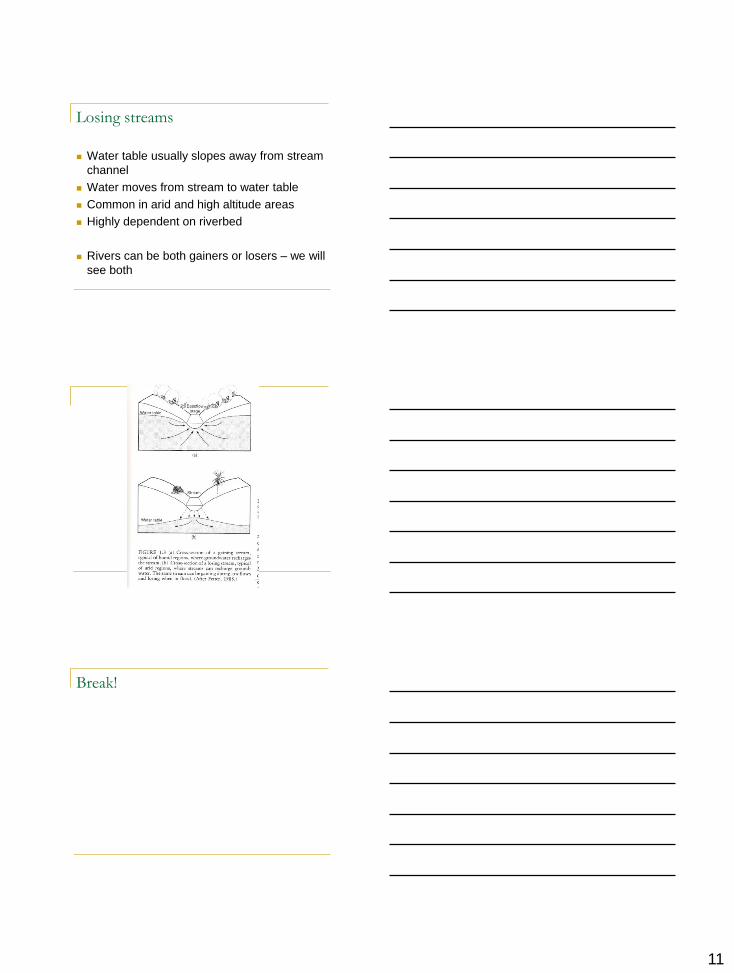
Example
Multiple rivers
Solid line precipitation
Dashed line runoff
Surface to sub-surface
Rain > infiltration capacity = runoff
“Baseflow” (dry-weather flow) due to
groundwater entering stream
Sub-surface flow Movement between
topsoil and impermeable layer
10
Sub-surface Surface
Water table rise to ground surface
Sub-surface flow escapes and becomes
overland flow
Gaining streams
Water table usually slopes toward stream
channel
“Perennial” streams – flow constantly, most
water from groundwater
Discharge from groundwater increases
downstream
11
Losing streams
Water table usually slopes away from stream
channel
Water moves from stream to water table
Common in arid and high altitude areas
Highly dependent on riverbed
Rivers can be both gainers or losers – we will
see both
Break!
12
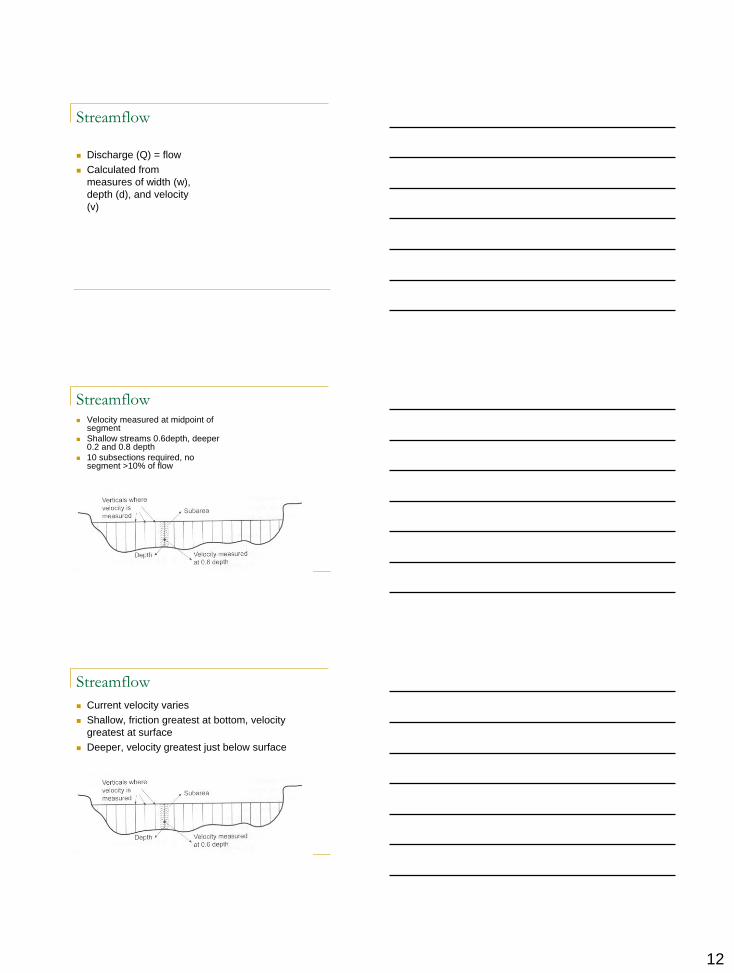
Streamflow
Discharge (Q) = flow
Calculated from
measures of width (w),
depth (d), and velocity
(v)
Streamflow Velocity measured at midpoint of
segment
Shallow streams 0.6depth, deeper 0.2 and 0.8 depth
10 subsections required, no segment >10% of flow
Streamflow
Current velocity varies
Shallow, friction greatest at bottom, velocity
greatest at surface
Deeper, velocity greatest just below surface

13
Streamflow
Current velocity varies
Shallow, friction greatest at bottom, velocity
greatest at surface
Deeper, velocity greatest just below surface
Streamflow
Methods integrate point
measures of velocity
and associated areas
of flow
Streamflow
Hydrograph =
discharge plotted vs.
time
http://www.srwmd.state.
fl.us/realtimeriverlevels/
realtimeriverlevels.asp

14
Streamflow
Informative for flood events
Observations on system
modifications
Mississippi River Floods
1993 Perfect storm
1 in 200 year rainfall event
oriented along river channel
and key tribs
Soil moisture above normal
ET below normal
Flow variations
Richter et al. 1996
Five elements of
stream flow that must
be maintained
(1) Magnitude of flow
(2) Frequency of
occurrence
(3) Duration of flow
events
(4) Timing of flow
events
(5) Rate of system rise
or fall
Effects of land use on streamflow

15
Characterizations of flow
Magnitude of flow=volume of water moving past a point per time
Frequency = measure of how often flow of given magnitude occurs
Duration, timing (predictability) and rate of change all temporal aspect of flow
Streamflow as the “master variable” Poff et al. 1997
Characterizations of flow
Magilligan and
Nislow 2005
Increases in low
flow and decreases
in high-flow stat
Reduced
seasonality
Decline in mean
rate of river rise and
fall
Motivated by
observations at dams
Characterizations of flow
106 stream fish from 34
groups in WI and MN
Streams w/ variable
flow support resource
generalist species
Streams w/ stable flows
support specialist
species
“Patterns in streamflow
have been shown to be
good indicators of
biological attributes of
streams”
Poff and Allan 1995

16
Characterizations of flow
Why are species
associated with flows?
Bunn and Arthington
2002
Loss or alteration of
habitat
Recruitment impacts
Loss of lateral and
longitudinal connectivity
Increased risk of
invasions
“Environmental Flows”
“The science of environmental flow
assessment has developed in response to
the recognition of the extent of flow alteration
worldwide, and the need to assess ecological
degradation and set acceptable levels.”
“Environmental Flows”
Tharme (2003) 207 different methodologies
for environmental flow assessment from 44
countries, 6 global regions
Most associated with some % of MAF
Most common is hydrologic approach using
flow records and event based responses
17
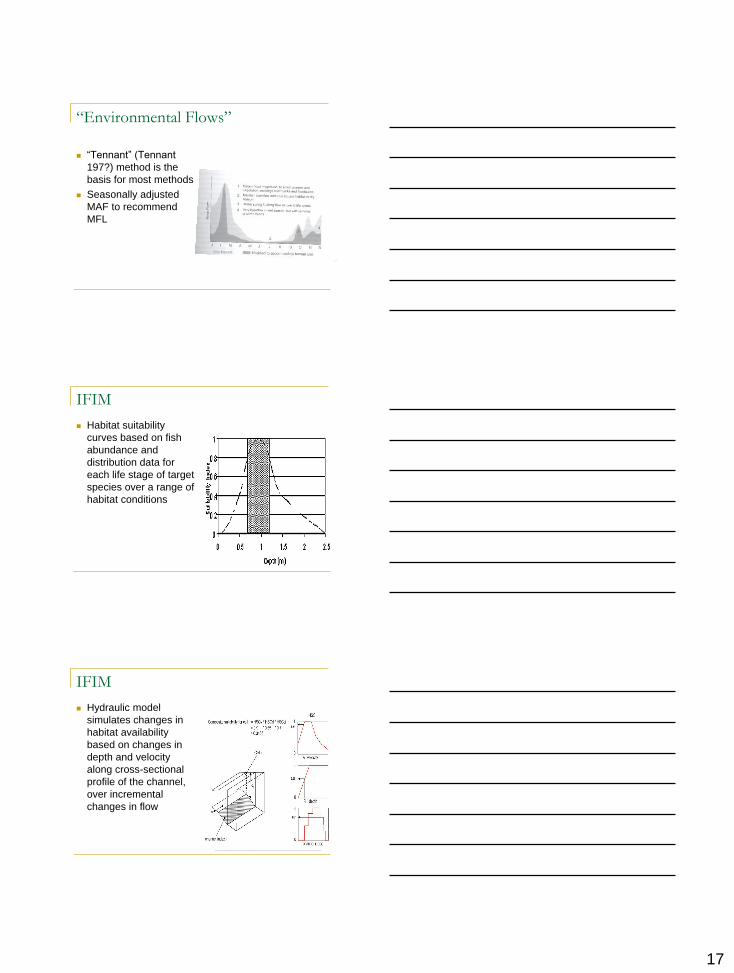
“Environmental Flows”
“Tennant” (Tennant
197?) method is the
basis for most methods
Seasonally adjusted
MAF to recommend
MFL
IFIM
Habitat suitability
curves based on fish
abundance and
distribution data for
each life stage of target
species over a range of
habitat conditions
IFIM
Hydraulic model
simulates changes in
habitat availability
based on changes in
depth and velocity
along cross-sectional
profile of the channel,
over incremental
changes in flow

18
Evaluated??
Very poor performance
Only model data is confronted with
More research needed to verify ecological
outcomes of flow management scenarios
1
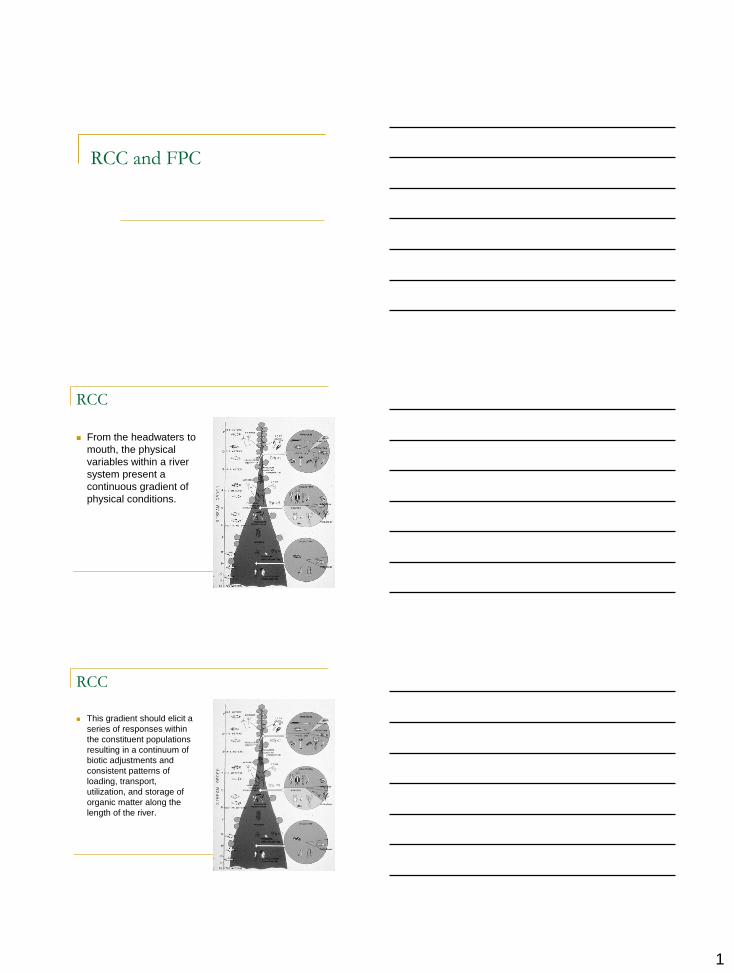
RCC and FPC
RCC
From the headwaters to
mouth, the physical
variables within a river
system present a
continuous gradient of
physical conditions.
RCC
This gradient should elicit a
series of responses within
the constituent populations
resulting in a continuum of
biotic adjustments and
consistent patterns of
loading, transport,
utilization, and storage of
organic matter along the
length of the river.
2
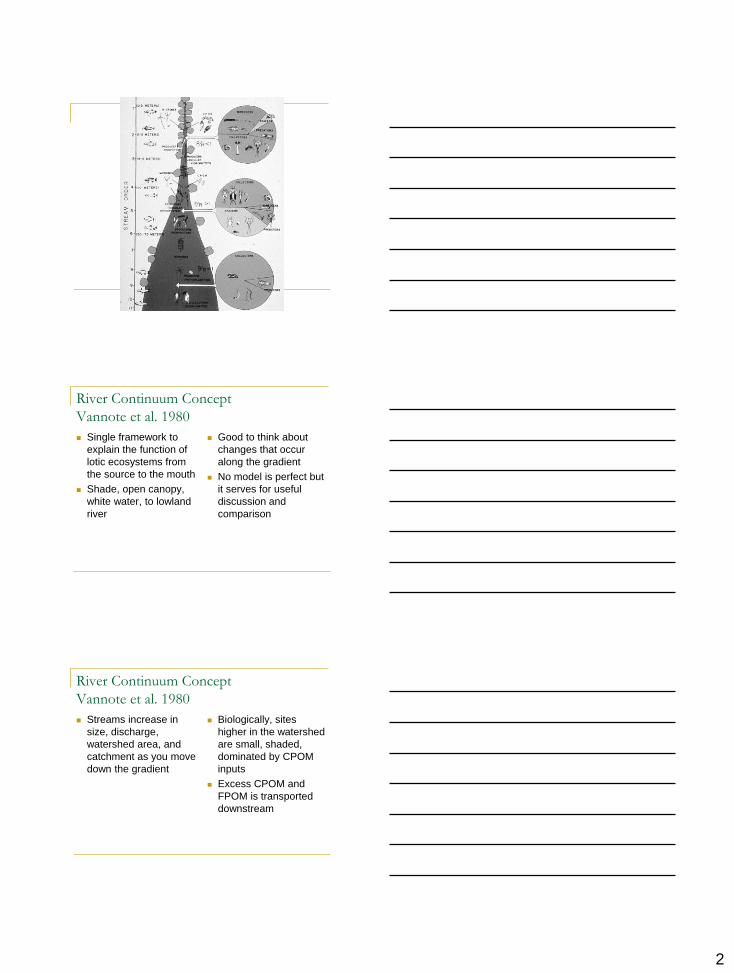
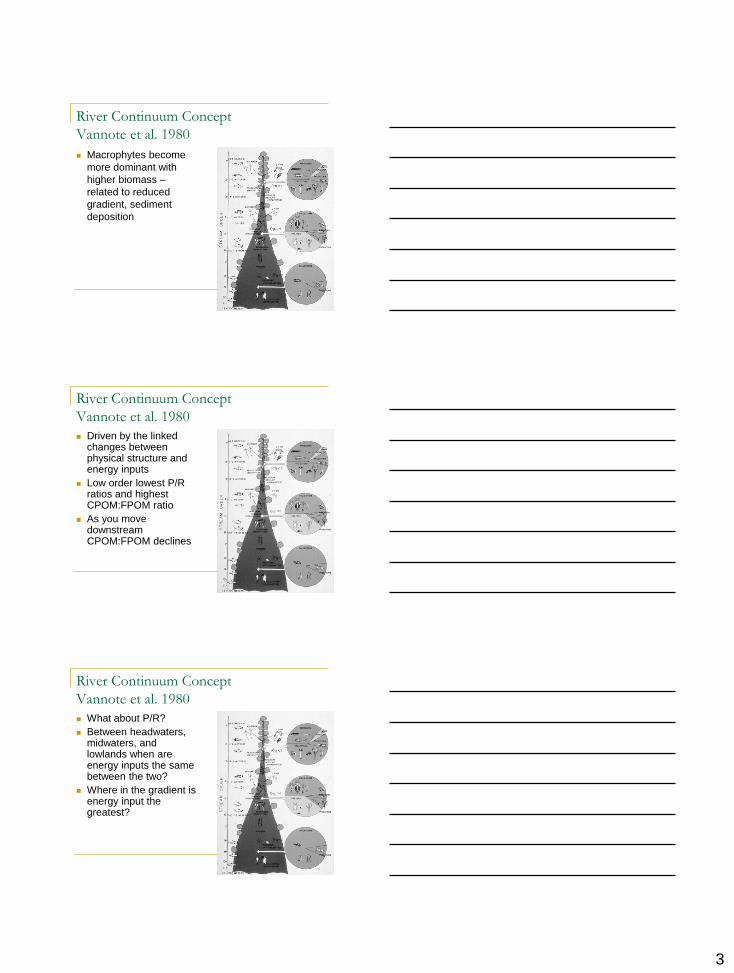
River Continuum Concept
Vannote et al. 1980
Single framework to
explain the function of
lotic ecosystems from
the source to the mouth
Shade, open canopy,
white water, to lowland
river
Good to think about
changes that occur
along the gradient
No model is perfect but
it serves for useful
discussion and
comparison
River Continuum Concept
Vannote et al. 1980
Streams increase in
size, discharge,
watershed area, and
catchment as you move
down the gradient
Biologically, sites
higher in the watershed
are small, shaded,
dominated by CPOM
inputs
Excess CPOM and
FPOM is transported
downstream
3
River Continuum Concept
Vannote et al. 1980
Macrophytes become
more dominant with
higher biomass –
related to reduced
gradient, sediment
deposition
River Continuum Concept
Vannote et al. 1980
Driven by the linked changes between physical structure and energy inputs
Low order lowest P/R ratios and highest CPOM:FPOM ratio
As you move downstream CPOM:FPOM declines
River Continuum Concept
Vannote et al. 1980
What about P/R?
Between headwaters, midwaters, and lowlands when are energy inputs the same between the two?
Where in the gradient is energy input the greatest?

4
Flood pulse concept
Junk W.J., Bayley P.B. & Sparks R.E. 1989. The flood pulse concept in river-floodplain systems. Can. Spec. Publ. Fish. Aquat. Sci., 106: 110-127.
Floodplain vs. RCC
RCC developed mostly
from northern,
temperate, low-order
streams with dense tree
canopy and steep
gradients
Many of these rivers
flowed to regulated
systems
Heavily influenced by
local hydrology (rainfall)
Floods are short in
duration
Minshall et al. 1985
expanded original RCC
Floodplains
Ecosystem at the
interface of aquatic and
terrestrial ecosystems
Link limnology,
estuarine ecology,
hydrology, and
terrestrial ecology
Floodplains are areas
that are periodically
inundated by the lateral
overflow of rivers or
lakes, groundwater or
rainfall
Elicits responses from
biota

5
Floodplains
Responses include
morphological,
anatomical,
physiological, related to
forming characteristic
community structures
Floodplains
Flood Pulse Concept
(Junk et al. 1989)
Focuses on the lateral
exchange of water,
nutrients, and
organisms between the
river channel (or lake)
and the connected
floodplain
Floodplains
Flood Pulse Concept
(Junk et al. 1989)
Includes hydrology and
hydrochemistry of the
parent river
Focuses on their impact
on organisms and the
floodplain

6
Floodplains
Flood Pulse Concept
(Junk et al. 1989)
“Flood pulse” is periodic
inundation and drought
Driving force behind
river-floodplain system
Floodplain is integral
part of the system
Periodically coupled
and decoupled from the
parent river
River and floodplain are
one unit
Flood Pulse Concept
FPC can be
monomodal, polymodal,
predictable, or
unpredictable, high or
low amplitude
Predictable pulsing
favors the adaptation of
organisms and increase
primary production and
efficiency of nutrient
use
Flood Pulse Concept
Nutrient status of the
floodplain depends on
the amount and quality
of suspended and
dissolved solids in river
Floodplain is driven by
nutrient transfer from
the river
Nutrient cycles, primary
and secondary
production,
decomposition
7
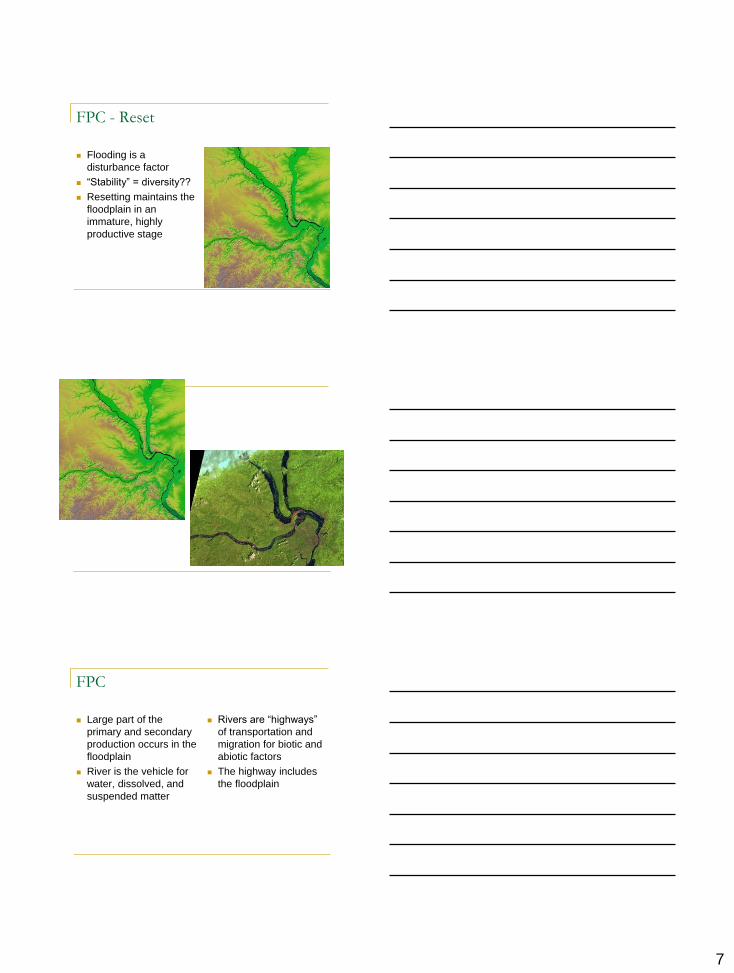
FPC - Reset
Flooding is a
disturbance factor
“Stability” = diversity??
Resetting maintains the
floodplain in an
immature, highly
productive stage
FPC
Large part of the
primary and secondary
production occurs in the
floodplain
River is the vehicle for
water, dissolved, and
suspended matter
Rivers are “highways”
of transportation and
migration for biotic and
abiotic factors
The highway includes
the floodplain

8
FPC- Allochthonous and Autochthonous
production
FPC focuses on the
productivity within the
flood plain
RCC focuses on?
Autochthonous
production is driving by
turbidity, timing of
inundation, season,
and river regulation
These cases in-channel
production higher than
flood plain
FPC- Allochthonous and Autochthonous
production
FPC states that rivers
should show a
predictable, sufficiently
long and timely
inundation
These generally only
occur in un-modified
systems
Wantzen et al. 2002
show through stable
isotopes many
floodplain fishes in
Pantanal show season
variation in carbon
sources
Increase N from wet
to dry = more
omnivorous feeding
when flooded and
higher carnivory
during dry
9
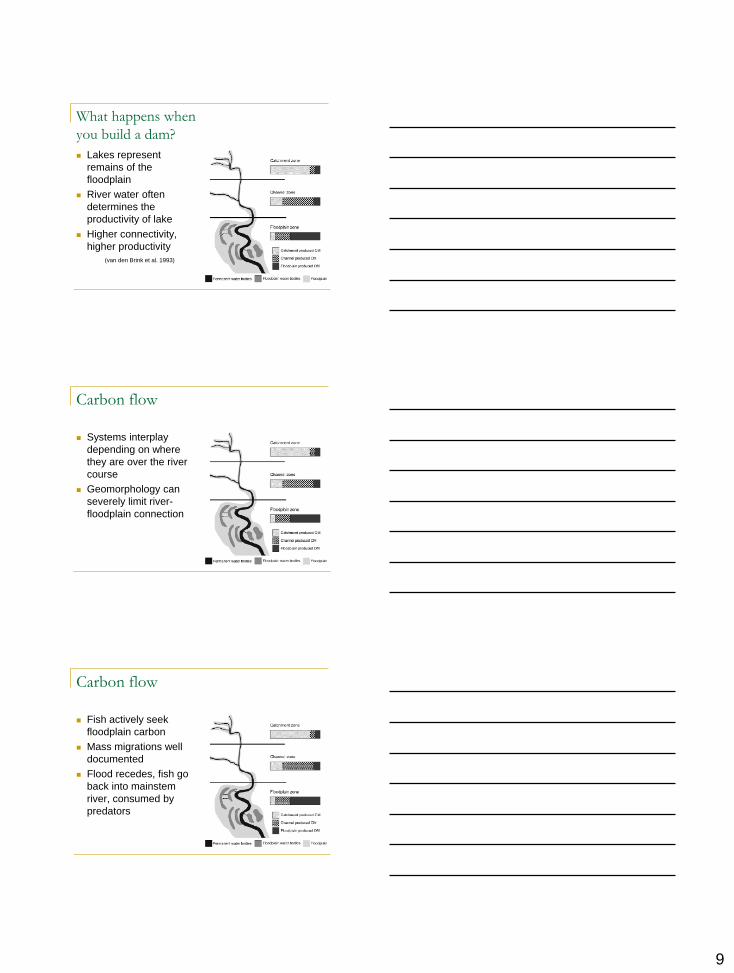
What happens when
you build a dam?
Lakes represent
remains of the
floodplain
River water often
determines the
productivity of lake
Higher connectivity,
higher productivity
(van den Brink et al. 1993)
Carbon flow
Systems interplay
depending on where
they are over the river
course
Geomorphology can
severely limit river-
floodplain connection
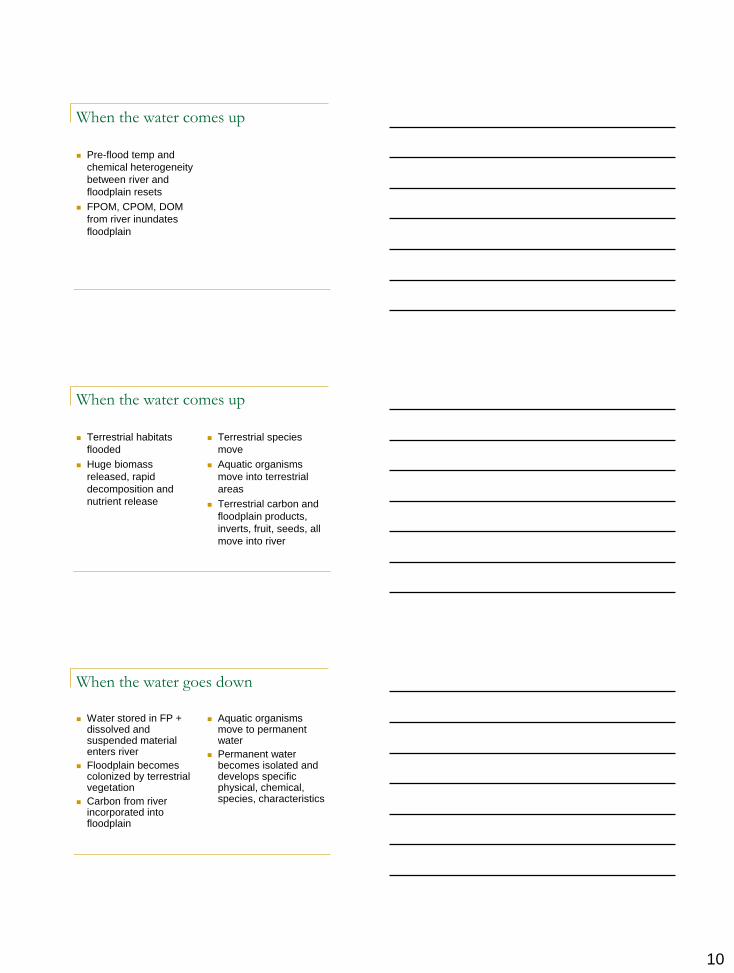
Carbon flow
Fish actively seek
floodplain carbon
Mass migrations well
documented
Flood recedes, fish go
back into mainstem
river, consumed by
predators
10
When the water comes up
Pre-flood temp and
chemical heterogeneity
between river and
floodplain resets
FPOM, CPOM, DOM
from river inundates
floodplain
When the water comes up
Terrestrial habitats
flooded
Huge biomass
released, rapid
decomposition and
nutrient release
Terrestrial species
move
Aquatic organisms
move into terrestrial
areas
Terrestrial carbon and
floodplain products,
inverts, fruit, seeds, all
move into river
When the water goes down
Water stored in FP + dissolved and suspended material enters river
Floodplain becomes colonized by terrestrial vegetation
Carbon from river incorporated into floodplain
Aquatic organisms move to permanent water
Permanent water becomes isolated and develops specific physical, chemical, species, characteristics

11
Timing and shape of
flood pulse
Flood timing and duration is
likely critical
Timing determines whether
organisms can benefit from
flood resources
Fish spawning often
severely impacted by flood
alterations
Spawning site access,
predation pressure, larval
rearing habitats, food
availability
Altered flood patterns,
altered food availability
Terrestrial (birds) and
aquatic predators
Big issue with all regulated
rivers
Mekong Video-Tonle Sap
Mekong Video-Tonle Sap

12
Mekong Video-Tonle Sap
http://video.google.com/videosearch?q=tonle
%20sap&oe=utf-8&rls=org.mozilla:en-
US:official&client=firefox-a&um=1&ie=UTF-
8&sa=N&hl=en&tab=wv#q=tonle+sap+(englis
h)&hl=en&emb=0&client=firefox-a

For more information please visit the following websites: Florida Rivers Research Lab at the University of Florida http://floridarivers.ifas.ufl.edu Florida Fish and Wildlife Conservation Commission Websites www.myFWC.com -Freshwater Fishes of Florida http://myfwc.com/fishing/Fishes -Fish and Wildlife Research Institute www.floridamarine.org Florida Museum of Natural History-Ichthyology www.flmnh.ufl.edu/Fish
A GUIDE TO SPRING-FED COASTAL RIVERS IN FLORIDA
University of Florida
Institute of Food and Agricultural Science
Department of Fisheries and Aquatic Sciences Florida Rivers Research Lab
http://floridarivers.ifas.ufl.edu

Background Florida’s Gulf of Mexico coast boasts a series of unique coastal rivers which originate from large, artesian springs created where the aquifer flows to the surface through limestone caverns. The headwater springs and downstream runs are characterized by high water clarity, low sedimentation and stable channels. Springs and spring-runs are highly productive systems with nearly constant temperature year-round. As these rivers flow from the headwaters to coastal estuaries, tidal influence becomes more prominent causing river levels to rise and fall, creating saltwater wedges in lower reaches. High and low tides shift flow upstream and downstream, enabling species to move with the tide. This distinct hydrological cycling creates freshwater and brackish habitats in spring-fed coastal rivers, and these systems support a diverse fish community comprised of freshwater and saltwater species.
Nutrient concentrations have increased significantly in several coastal rivers over the last couple of decades. Coincident with nutrient enrichment, shifts in the composition and abundance of aquatic vegetation have occurred, including decreased macrophytes (such as eelgrass) and increased periphyton (algae growing on aquatic plants or other substrate). Of particular concern is the decline and loss of native macrophyte
species, such as American eelgrass (Vallisneria americana) and strap-leaf sagittaria (Sagittaria kurziana). Additionally, filamentous algal biomass has reached nuisance levels in many headwater springs, and production of several species of these algae is limited by nitrogen and/or phosphorus. Loss of native macrophytes, increased periphyton loads, and increased macroalgae are signs of nutrient overenrichment in the aquatic ecosystem (this process is referred to as eutrophication). The broader impact of these vegetation changes to the riverine and coastal fish communities is currently not well understood. To address the broader ecological impacts to spring-fed coastal rivers the Department of Fisheries and Aquatic Sciences at the University of Florida and the Florida Fish and Wildlife Conservation Commission have initiated cooperative research studies aimed at describing the fish communities and food webs in coastal rivers.
Spring run habitat in the Weeki Wachee River
Eelgrass (Vallisneria americana) beds in the Wacissa River
Eelgrass (Vallisneria americana) beds in the Wacissa River
Filamentous algae bloom in the Chassahowitzka River
Fish Species Observed in the Santa Fe River SP CODE COMMON NAME SCIENTIFIC NAME TYPE FAMILY
AMEE American eel Anguilla rostrata Fresh Anguillidae (Freshwater eels)
ATNE Atlantic needlefish Strongylura marina Salt Belonidae (Needlefishes)
BLCR black crappie Pomoxis nigromaculatus Fresh Centrarchidae (Sunfishes)
BLDA blackbanded darter Percina nigrofasciata Fresh Percidae (Perches)
BLKI bluefin killifish Lucania goodei Fresh Cyprinodontidae (Killifishes)
BLUE bluegill Lepomis macrochirus Fresh Centrarchidae (Sunfishes)
BOW bowfin Amia calva Fresh Amiidae (Bowfins)
BRBU brown bullhead Ameiurus nebulosus Fresh Ictaluridae (Bullhead catfishes)
BRDA brown darter Etheostoma edwini Fresh Percidae (Perches)
BRSI brook silverside Labidesthes sicculus Fresh Atherinidae (Silversides)
CHCA channel catfish Ictalurus punctatus Fresh Ictaluridae (Bullhead catfishes)
COSH coastal shiner Notropis petersoni Fresh Cyprinidae (Carps and minnows)
CPIK chain pickerel Esox niger Fresh Esocidae (Pikes)
FGAR Florida gar Lepisosteus platyrhincus Fresh Lepisosteidae (Gars)
GOSH golden shiner Notemigonus crysoleucas Fresh Cyprinidae (Carps and minnows)
GUST Gulf sturgeon Acipenser oxyrhinchus desotoi
Salt Acipenseridae (Sturgeons)
GUPI Gulf pipefish Syngnathus scovelli Salt Syngnathidae (Pipefishes)
HOG hogchoker Trinectes maculatus Salt Soleidae (Soles)
LACH lake chubsucker Erimyzon sucetta Fresh Catostomidae (Suckers)
LGAR longnose gar Lepisosteus osseus Fresh Lepisosteidae (Gars)
LMB largemouth bass Micropterus salmoides Fresh Centrarchidae (Sunfishes)
MOSQ Eastern mosquitofish Gambusia holbrooki Fresh Poeciliidae (Livebearers)
PIPE pirate perch Aphredoderus sayanus Fresh Aphredoderidae (Pirate perches)
RBSU redbreast sunfish Lepomis auritus Fresh Centrarchidae (Sunfishes)
RESU redear sunfish Lepomis microlophus Fresh Centrarchidae (Sunfishes)
SAMO sailfin molly Poecilia latipinna Fresh Poeciliidae (Livebearers)
SEKI Seminole killifish Fundulus seminolis Fresh Cyprinodontidae (Killifishes)
SPBU spotted bullhead Ameiurus serracanthus Fresh Ictaluridae (Bullhead catfishes)
MADT madtom Notorus sps. Fresh Ictaluridae (Bullhead catfishes)
SPSK spotted sucker Minytrema melanops Fresh Catostomidae (Suckers)
SPSU spotted sunfish Lepomis punctatus Fresh Centrarchidae (Sunfishes)
STMU striped mullet Mugil cephalus Salt Mugilidae (Mullets)
SUBA Suwannee bass Micropterus notius Fresh Centrarchidae (Sunfishes)
SWDA swamp darter Etheostoma fusiforme Fresh Percidae (Perches)
WAR warmouth Lepomis gulosus Fresh Centrarchidae (Sunfishes)
YEBU yellow bullhead Ameiurus natalis Fresh Ictaluridae (Bullhead catfishes)
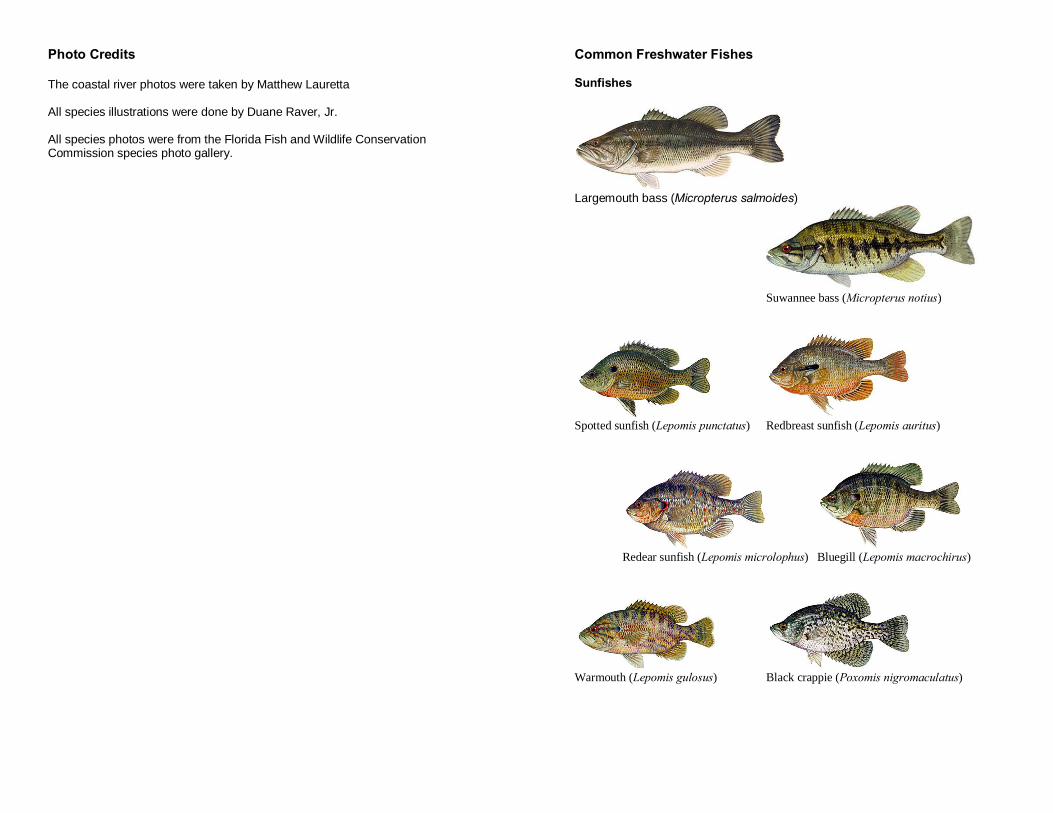
Photo Credits The coastal river photos were taken by Matthew Lauretta All species illustrations were done by Duane Raver, Jr. All species photos were from the Florida Fish and Wildlife Conservation Commission species photo gallery.
Common Freshwater Fishes Sunfishes
Largemouth bass (Micropterus salmoides)
Suwannee bass (Micropterus notius)
Spotted sunfish (Lepomis punctatus) Redbreast sunfish (Lepomis auritus)
Redear sunfish (Lepomis microlophus) Bluegill (Lepomis macrochirus)
Warmouth (Lepomis gulosus) Black crappie (Poxomis nigromaculatus)
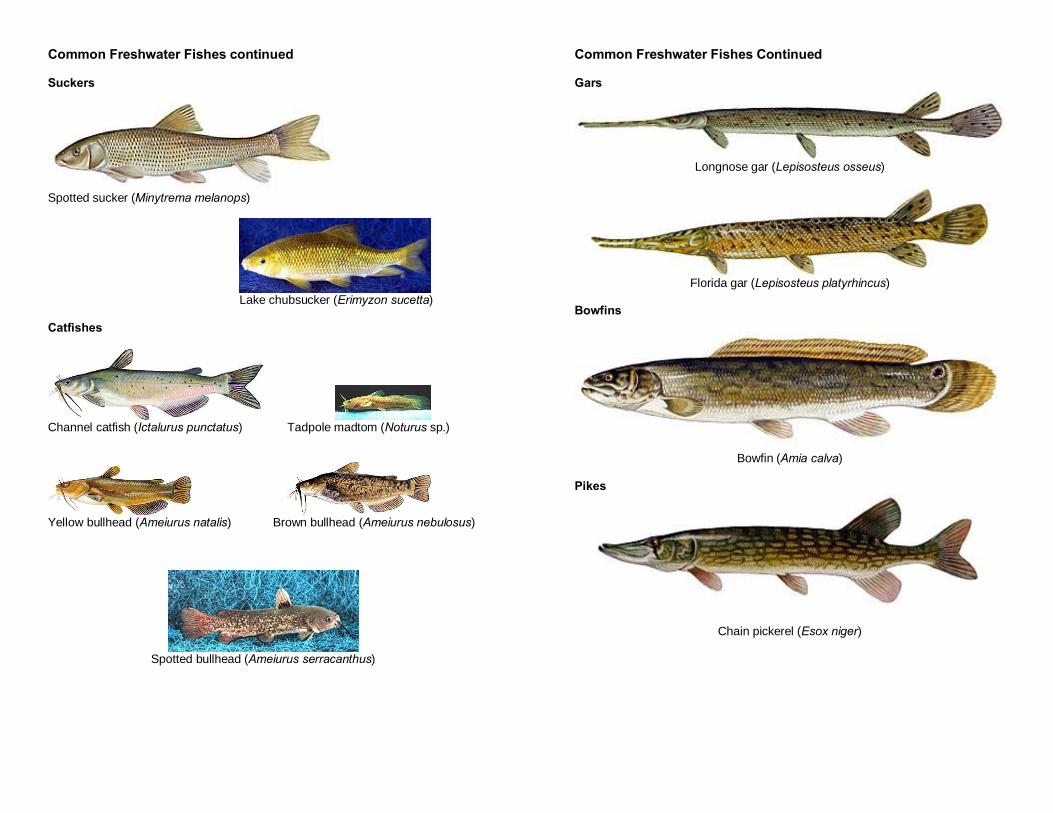
Common Freshwater Fishes continued Suckers
Spotted sucker (Minytrema melanops)
Lake chubsucker (Erimyzon sucetta) Catfishes
Channel catfish (Ictalurus punctatus) Tadpole madtom (Noturus sp.)
Yellow bullhead (Ameiurus natalis) Brown bullhead (Ameiurus nebulosus)
Spotted bullhead (Ameiurus serracanthus)
Common Freshwater Fishes Continued Gars
Longnose gar (Lepisosteus osseus)
Florida gar (Lepisosteus platyrhincus)
Bowfins
Bowfin (Amia calva)
Pikes
Chain pickerel (Esox niger)
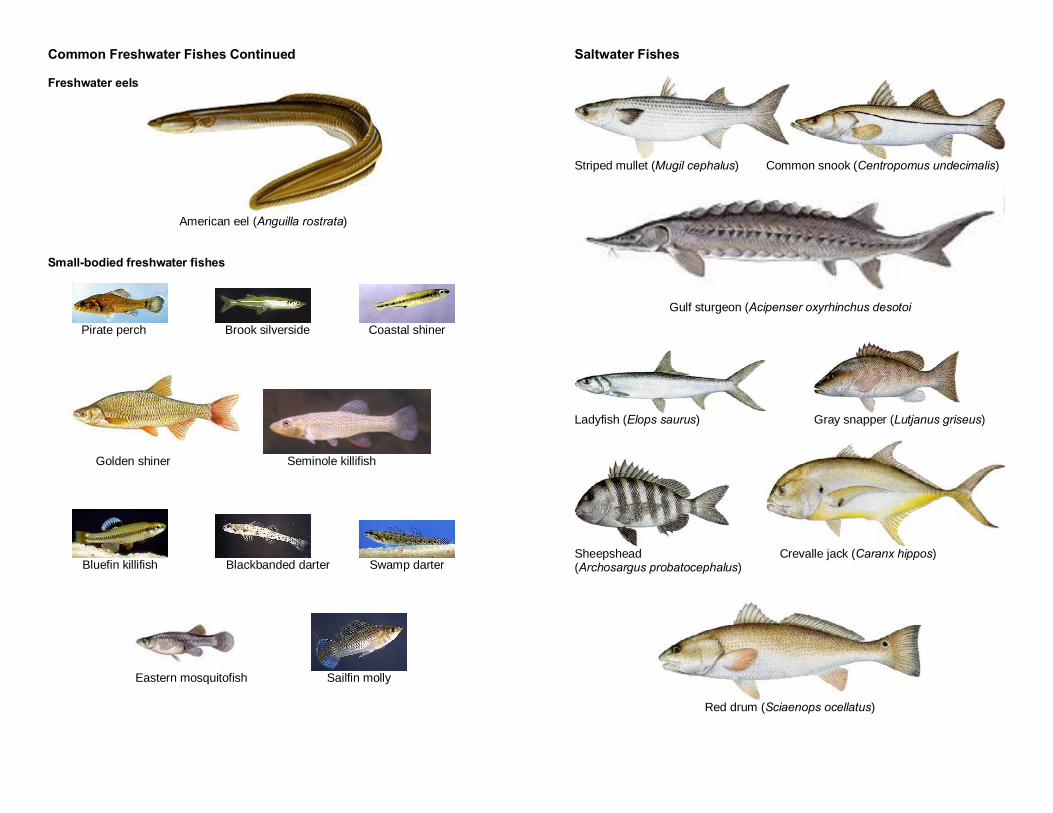
Common Freshwater Fishes Continued Freshwater eels
American eel (Anguilla rostrata)
Small-bodied freshwater fishes
Pirate perch Brook silverside Coastal shiner
Golden shiner Seminole killifish
Bluefin killifish Blackbanded darter Swamp darter
Eastern mosquitofish Sailfin molly
Saltwater Fishes
Striped mullet (Mugil cephalus) Common snook (Centropomus undecimalis)
Gulf sturgeon (Acipenser oxyrhinchus desotoi
Ladyfish (Elops saurus) Gray snapper (Lutjanus griseus)
Sheepshead Crevalle jack (Caranx hippos) (Archosargus probatocephalus)
Red drum (Sciaenops ocellatus)
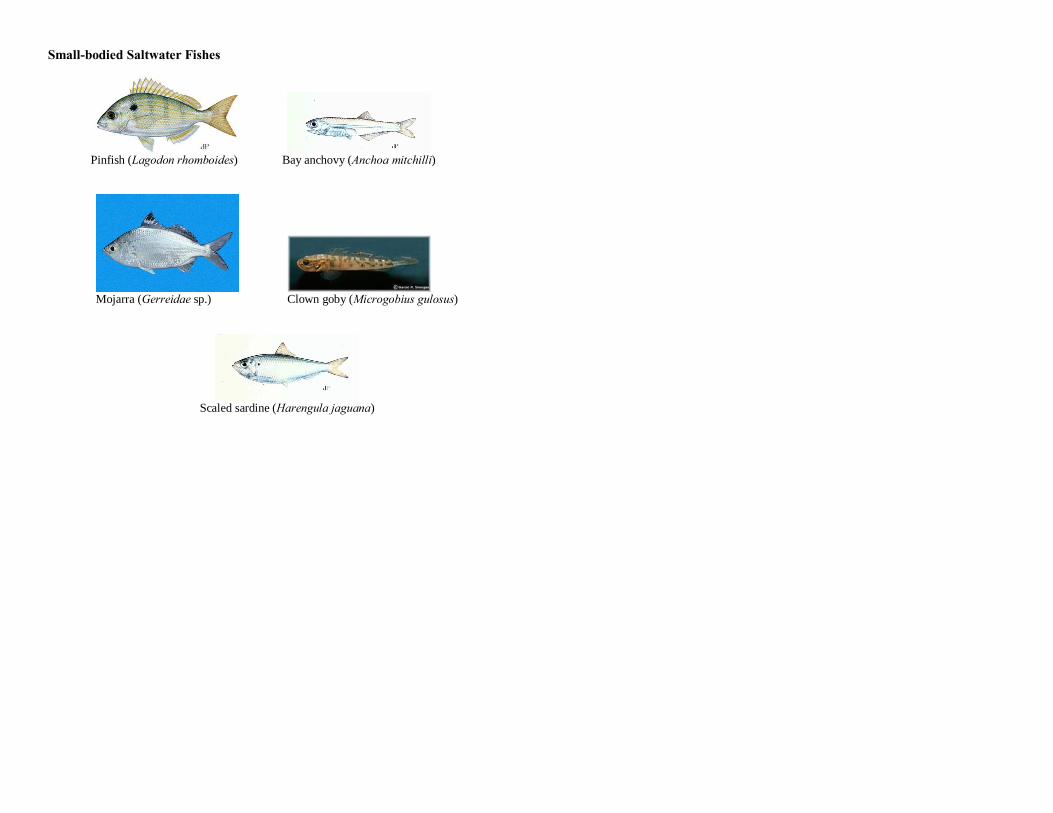
Small-bodied Saltwater Fishes
Pinfish (Lagodon rhomboides) Bay anchovy (Anchoa mitchilli)
Mojarra (Gerreidae sp.) Clown goby (Microgobius gulosus)
Scaled sardine (Harengula jaguana)