document resume ed 231 034, ea 015 694 · document resume. ed 231 034, author alexander,, karl l.;...
TRANSCRIPT
,
DOCUMENT RESUME
ED 231 034,
AUTHOR Alexander,, Karl L.; Pallas, Aaron M.TITLE Private Sbhools and Public Policy: New Evidence on
Cognitiye Achievement in Public and PrivateSchools.
NITSTITUTION Johns Hopkins Univ., Baltimore,Md.Center(for SocialOrganization of Schools.
SPONS AGENCY National Inst. of,Education (ED), Washingto , DC. -REPORT NO CSOS-R-333PUB DATE Jan'83GRANT 'NIE-G-80-0113NOTE 29p.PUB TYPE . Reports - Evaluative/Feasibility (142)
EA 015 694
EDRS PRICE MF01/PCO2 plup Postage.DESCRIPTORS *Achievement Rating; *Catholic Schools; El}1Ientary
Secondary Education; Longitudinal Studie ; *ParochialSchools; *Public Schools; *SchOol Effectiveness;*Statistical Analysis; Track System (Education)
IDENTIFIERS High School and Beyond (NCgS); National LongitudinalStudy High School Class 1972; *Public and PrivateSchools (Coleman et al)
ABSTRACT. -
Recent research by Coleman, Hoffer, and Kiagore onthe effectiveness of public and private schools'may be seriouslyflawed because of its neglect of input-level differences in studentperformance and its reaiance on cross=sectional testing data as thgcriteridn measetre. The sample used by Coleman and his,colleagues frothe Itigh 'School and Beyond (HSB) data set was limited to seniors andto fewer schools than the more complete data in the NationalLongitudinal Studi (NLS) of the High School Class of 1972. Whereas itis true that a comparison of mean scores for public and Catholicschools in both the NLS and HSB consistently favors Catholic schools,suchNa comparison may be inappropriate because,private sector schoolstend to attract students who are in an academiC tract, but publicschoqls must take anyone. The differences bet:/een public and Catholictest score results become markedly slimmer wh n academic and generaltrack students are Gompared separately. When adjusted for differences.in enrollment proportions in the two tracks, the fignres give onliitwo significant advantages to Catholic schoolsid the- verbal SATamong academic-track students and in the yerbal followup test amonggeneral-track students. The differences between public and Catholicschools in achievement scores become insignificant after thevariables of student selection and background characteristics are-statistically controlled. There is thus little reason to,believe thatCatholic schools are more effective thAn public schools in promotingcognitive development. (Author/JW)
***********************************************************************Reproductions supplied by.EDRS are the best that can be made
from the original document.***********************************************************************
,z)

U S DEPARTMENT OF EDUCATIONNATIONAL INSTITUTE OF EDUCATION
EDUCATIONAL RESOURCES INFORMAsTIONCENTER (ERIC)
Ot\This 'document has b'een reproduced asreceived from the pe,son or organizationoriginating itMinor changes have been made to improvereproduction quality
Points of view onopinions stated in this document do not neceisarily represent official NIEposition or policy
"PERMISSION TO REPRODUCE THISMATERIAL HAS BEEN GRANTED BY
TO THE EDUCATIONAV RESOURCESINFORMATION CENTER (ERIC)"
Report No. 333January 1983PRIVATE SCAOOLS AND PUBLIC POLICY: NEW EVIDENCE' ONCOGNITIVE ACHIEVEMENT IN PUBLIC AND PRIVATE SCHOOLSKarl L. Alexander and Aaron1. Pallag

STAFF
Edward L. McDill, Co-Director
James-M. McPartland, Co-Director
Karl L. Alexanderc,
Henry J. Becker
Jomills H- Braddock, IIo.
-
Shirley Brown
Ruth H. Carter
Michael Cook
Robert L. Crain
Doris R. Entwisle-
poyce L. Epstein
iJames Fennessey.
,Samuel A. Gordon
IDenise C. Gottfredson
, Gary D. Gottfredson
Linda S. Gottfredson
' Edward J. Harsch
John H. Hollifield1
Barbara J. Hucksoll
Lois G. Hybl
9
Richard Joffe
Debbie Kalmus
Helene M. KaPinos
Nancy-L. Karweit
Hazel/ G. Kennedyr-
Marshall B. Leavey
Nancy A. Madden
Kirk Nabors
Deborah K. Ogawa
Donald C. RickerC, Jr.
Laura Hersh Salganik
'T,Robert E. Slavin
Jane St. John
Valerie Sunderland
Gail E. Thomas
William T. Trent
James Ttone
t
X)*
a
PRIVATE SCHOOLS AND PUBLIC POLICY:NEW EVIDENCE OR COGNITIVE ACHIEVEMENT IN,PURLIC
AND PRIVATE SCHOOLS
Grant No. NIE-G-80-0113
Karl L. Alexanderand
Aaron M. Pallas
Report No. 333
January 1983
.
PubIiShed by the Center for Social Organization of Schools, supported in partas a research and development center by funds from the United States NationalInstitutAf Education, Department of Education. The 'opinions expressed inthis publication do not neceSsarily reflect the position or policy of theNational In-Ltitute of Education and,no official endorsement by the Instituteshould be inferred.
Center.for Social Organization of SchoolsThe Johns Hopkins University3505 North Charles Street
Baltimore, MD 21218
Printed and assembled by the Centers for the HandicappedS4ver Spring, MD

1111110 I 0,11! 3.)../11:),),) I LI IT . 1
I o 3 30013110000.m ' 3 r otutT A Ito 1331.1VI I 3 OM; or; 101 3 31 I ti 3 Tol 0.103 ) 0 30011.10 03 I 013 I o;)
imp ,) T3301 ,30 11101h)111 OHIO.) ) 110 ) 313.11: 11111: OA 3 ) I II I 0,4.)11.1.1 ) I 3 1
.11111111r4.) 01 1: 1.)1i 1171) JO 001, I a wIN 031 3101: 3lI1TA031 311IU I 01113:1 10 I II 011) 1110 I
1!)1:31 0.4"A 3 Utill *Illy.tio,id 1101 1 in., tivlit10 I ooti.)!; otik? A13 1)0,1 ° t; 3 ILL
uolip.) tlo 130 IT0000
00 Ill ATI0 I 313 put, 11011tom 30 001 I VII I .13 3.1nd ti:41110,111.1 IMP ) [IVO 3 3 3 Wei 3 0
Ilti I 111114I 11111: ) 011111100 ti 10110,1101i0.1 i{11110A 11.11110 I I:I- 10 3 003 ) ) 00313 Au hi
I. 101 it0T.I'd0.111 II .T.1 3:00033 003 I tt.3011:1 I 'sTTI '10mo) 30,4 o' .10dT100 00 3 3: ,101 00:3 033.3,
TT fl )1300
30 p I Ito Imo 11 3 000T.I'd0.111 1103 00A0.111 A 01100IW I I op ',ill I I oni I X0000101 I I opt
00 0 00 I 10 3003100 'Titt 333 uttoto 0 3 .3 liTol .103 AtnI011 3000110 1 3 op 10 A.I0011 30
TT T1030/%01) 11 p0011 010. 3-..-00.1 pint 003 30330 VI) 3 0.TitIo "A 00010111i Hp 113 XI! I d
1 VII ,) I 03 ."I 11" " 31)011.1" 131 A011.101411) into '3803 I ,11)111TA '0000 103 A 0811 .10 30
11103 Tio.id 01 I 0011.1 TIT000.1 wITAVT1.3,1 A`000111,11 I I 0(3 Ina tl 10)11,1S MU. *II )1404. A I 3 tfl 3 la
ITUTI,In 30 00840 diu0 puo '00.3) oti moll 001 OW ti 00p0 0;t0 3 00 ` I 00wA1T
, 0 poo I 04 3 04003 dadua Imo '00303 IT,T 30 0003000 013 3 ,001T 3,11,10m 11 I TT p0.1 I nho
00 odu100 .01 1 30 001 N 10 op0) 3 ou 3 U 3 001 0.111 300,3,303 0000000 3:003 3 3011p.0
01003 I od0000 0 I 3,1
.10 I o I a
0 3 11.4p0 ITT No 1iO3 3 001100 3300m3 011 133 Ipmo I I It I 0.1 011 40113 lulnio
)301,120.1d 1.101,1 Imo 003 3 U.11131.3 031,3, 60003 otr I 0001 3 3: .! I tto0 3011 30000
on 3 I lT.T.ITI140.1 'TT 3001100, 0183 1 30 000 0.10) nittuo.T0.1 .3 tit, 4 3110111.1A I oAll I 31: 3110 Tod
00 /MO1) 3 1t4 111,0.1311...) .1401110.)100 101110 1)110 Ii11111.11?0 I 111014111r U1 10 1 10 00 1
33 I ltu'itio 11100,10001,1 ptIli I 1)011.nt 1it)13 NO I V.,{ I )0.)All) 1111t,IR1)I3 3103 ) 1110.10 I 00130 S 0111
t"IA I 1 410 0 1 I "A.)1 1100 "mvIi".111 00,113 I 331d00,10: I 01.10P3 40,3000
' 1101 1 1`z I 110'd100 puo 3 .40.3(1 I 001300 .30 11013 1103 0A03) 0 I 040 mottTI 03 11 oTTIT .
ptto 0 31103111 10 1 3 .1II I ).1.) 3 I 11 0 10013 00 tA0II 11) I MO11)3 .43 3 3 3003 00 33 403 onop 03
: t4,)A 3 3 01 T30 11m13 om 03:33 U I 00330s 30 11013 1;.1 303111,3o I IT 3 00s .30 3 10 3000 013,3,
.1.1111.n.) 013.1,
ABSTRACT
Recent research by Coleman, Hoffer andKilgore on the effectiveness
,of public and private schools may be seriously flawed because of its
neglect of input-level differences in student performance and its reliance
on cross-sectional testing data as the criterion measure. Using data from
the High School and Beyond and the NLS Class of 1972:data sets, we examine
public-Catholic sector differences within high school tracks for a varietyfs
of congitive and achievement outcome measures. EveriLwithout any controls
for sector differences in student characteristics, the public-Catholic
differences are all very small. They account Eor less than one percent of
the variance in both test scotes and in years of school completed. When
stud.ent selection and background characteristics are controlled, these small
di jferences shrink even further. We thus cannot egret with Coleman, Hoffer
and Kilgores claim that Catholic schools produce better cognitive outcomes
than do public schools. This claim is the first of the "factual premises"
that they say would support policies to increase the role of private schools
in American education, In our view this premise is wrong, and hence should
not,be invoked in supp6rt of such policies,
6

Acknowledgments
We very much appreciate the helpf?l'advice o our colleagues Doris
Entwisle and James Fennasaey.
t._

AliAmovm)uu 1v0p 01 310q) pnv 17)1T 1111101100u.NNuao 110(Iti 0011111.1,1
A0)1011 dnr111.1100 0M0An) Nn oltintIA) )voM )Vq) Unloonoo q ti.tollIo All ootut Apito,11), tatttr103)1AO oW)N0A 0) 1,1013 poon on to oiou
'uluAinun nmo Ano ni nomuod.
JI0q) ..101 Iloddnv oil))) ow m pnv MOJI AV) 00110110
pull om 'Ammo/ )no1V11(11, oq IIIM '01ltalnUJOd Iniod itioN u)q) Ao
130ddnu ni oonopiAo q) Aluji inv)Aodult Ailvlaoduo u; I lo loll
*poloAo um) )1 n1)))ou0.1 oqi Aq po1fip1ti to! luvoi Iv 'Apnlu Aloqi io
ivAinoo oq) AlqvqoAd ul ahloou owind oq) III ouoq) nvqi oAlioollo olom
otv Ni(totiot; Amoou oivAlAd !nil) nolunionoo pup Aolion 'nvmolo:)
4poopnl olm)Aodull ivolionad opiwomuoo lo ao))1tM v I 1;1111 'AiNnolAtio
*ulooqou lJ I tIllil 1III I !:ouloolno oA))1n1ioo Aofloq onpoAd ulooqou oIvAlAd ivq)
ivAInoo I. 'nvmoloa io no laoadnu oi HI I I Anowo Ano
:iuom un mit odium oq) moti no t;ONIVIIV 3 m J )notwitl 0) o3 t1V
11 ON I It! M taityl I U11,1,1t;03 ,1 no 311 3H 00,1(1.) s plug N tun)) aotint,.) nq '110.11%p:0A
vioattliIIM IMP A0flon 'nv1t 010;) .10 IvO111A0 v) '9,0) 'Apn)u itiouoAd 114, stipqop
' a , )1111011llill ) dttt A3 411 thlo,CO 11,10ti u1ll 0,111011 AO 'all Allth) ot: I 1100,1,; jlIII
p0AION011in Uom0A NUAoJlloo q11'630M1111 '1Aom Aioq) po)osylp utuulomA,loqi
o) popnoduoA Apq rune3volioo pnv nvmoloa 'ivollIA.A Ai ij
oq Aiinnmmoo qoAuouol miCio Ilvd oq) no 1V11) )0 lionM q))m
4
.
.01P4\114 io 1Noio)n) 10 Itrop IvoIV P 110)0VAlIV foul ApnIu Ulu '12 Imago;
10API nl pnnoi pnv NAo)oot4' o)v.Alad pnV 0)1qUil 111 1.11 upoqou Ampup.uiu It'
rNiOn0A1)00110 011).NAvtilito0 (1,5161) 03W3IIM IMP JOHOn 'nutuoioa ApnIu
'At:raAtiA11111.1 14191 ulooqou no qoAvouoi o.ono
W10011aS AIVAINd UNV atitlad RI J.NANHAMIEW HA1090a NO HaNAMAA MAN
:AallOd O111111d (INV S10011:;
2
with the issue of selection biases arising from differences in the mix of
students attending schools in the various sectors. Probably the single
greatest burden of school effects research is to distinguish convincingly
between outcome differences that reflect simply differences.in the kinds of
students who attend various schools from differences that are attributable
to something about the schools themselves. This is no easy task under the
best of circumstances, and is especially difficult when students (and parents)4
select themselves into schools on the basis of criteria relevant to the
outcome being evaluated. Put simply, when good students go to sood schools,
how are we to know which iA responsible for the good performance that is
likely to be observed?
In the present instance, we know that schools in the public and private
sectors differ in their educational missions and academic priorities2
and in
the mix of students they enroll.3 The standard way to take account of such
complications.is to obtain measurements on those factors that are thought to
be most relevant and to enter them into the analysis as control variables.
Hence, differential sector effectiveness would show up as mean sector
differences on the performance criterion after adjustment for sector differ-
ences in relevant student input characteristics.
Although Coleman et al. adjust for student differences involving socio-
economic background and race/ethnicity, they neglect differences in competency
or achievement levels that predate high school. This is a serious omission,
one that severely compromises the basic findings of their study. ,Consider
the following points:
1. Forlarge populations the overtime stability in levels of
performante on standardized tests of the sort employed by
Coleman et al. consistently has been found to be quite substantial.
4
2. S tudent background charac teris tics are only par tial proxies
for such competency differences.
3. Es tima tes of school eff ec ts on s tandardi zed tes t performance
which neglect preexisting differences in performance levels
are likely to be substantially upwardly biased.4
In ligvt of these facts, the finding that students in the tirivate
sector score modestly better on standardized tests than students in the
public sec tor even af ter ad justing for' student socioeconomic' and demographic
characteristics is equivocal. If, as seems likelvy, private sector students
are somewhatcmore capable initially', then`Coleman et al.'s results almost,:,
*cer tainly reflec t a t leas t par tly, and perhaps wholly, these ini tial
advantages.
There is another data set Wellsuited to the issues considered by
Coleman et al. which would not have been so restrictive as the HSB survey
they employed. This is the National Lomitudinal Study of the High School
Class of 1972 (NLS). This project includes bo th private and public schools,
it contains information on a great variety of school outcomes, and, .perhaps
most importantly, it now spans a seven year period. With the NLS data,
a more proper evaluation of the publicprivate question is possible, and it
is to the NLS that we now turn for additional evidence on the purported
superiority of private schools over public. When possible, we also present
HSB results as a base of comparison. The following figures indicate the
coverage of both students and schools in the two data sets:
1 0

4
Pubi Iv: Schopin,(S Ind on t
thoi tv : Soltooln(Stud(lnt:I)
o they Pr Iva to: S01100 DI
(SW(1011111)
EISIO
I 232 Me)(2 I 12b)
314. 411
(1320)
- in(206)
;411:;14 lguron aro f or nontorn on! V Nif.M1)0i1; 1 01 :70 h00 1;1 ai',0 011 ia I ;It'd
t rum nollOO1 tia i.1 I 11 :; III bo tit ta .
Bo tit n Ind I rrov lilt. broad na t lona I. 0 0V0rago wl r I.t fin ropri.non tt
t iV011Onn wi th vogard to thoir ronper I ivo cohort N. 'the, groa tot rata, 1);t ni
01 the ILSII howovor,, ()Horn (0)'? toxin advantagon whon 1orttni II on nilbgroups
0 I I a l In t eron t aud It In ht. t tor ab 1 o to w Mtn tand tho var tom; ttottroon
o 1 nampio at tri t Ion tha t tako tho Ir t o 1 in ho.th proloc tn. Ono vet v
Pro!1:;114', 1 IIIII ta t 1011 01 tho N1 In I tn S111:11 I 111,11111)0r 01 p0 Iva to nee tor non-
Ca Choi 10 nchoo t: ilocattno thlth wo chola. to I t our a t tention to
thoI II; and th' hot) 1 fi , FM" which nampl o coverage in moro 41(144Itta to
CoIontan, Hot 1 or goro (I 98?a) howovor, VI'('OJi t y havo aoltnowl odgod
th.t I tho natup 1 lug of non-Ca t Ito 1 1c pr Iva to nohooln wan I nadequa to Iii (110
IlI nititly an wolt , and tSU, Ifl a prat' t tea! IILn t toe, boot owl!. n (11(1V a VII 0111n
1110111t1 1110r0 propor I y be prenonted an pub! to- thol lo empar I now:, ra thor0
than politic-pl. tva t I. For thin focus, bo th da ta tlet n ;IVO (lit :.0t V100.11)10 .
Tall o 1 pronentn moan neor on on Ow n tantlard 1 V,Pul I on 1!; I FoUt the
and 'on tho coon t orpar In In the N1,11, Ronnl tn are repot- od or VorKt 1 o
Ma th a mut Road I ng Sub t en to and for a compon I to which in 'n I nip L no of t ho
thor throe . 'Roma tn are pronontod onl y for nonlot n In Ilu' 11;11 t nay . '1110,
mon t totted abovo nampl od only Houton;
. AI 1 Ion 10 aro :teal od au n tandard ncot'on (ovora I 1 nampi I ftw.tit 01 ill ;

S.D. of 10). Both sets of tests were,developed by-The ETS and they do contain
some Identical items (for more detail.on the HSB tests, see Heyns and Hilton,
1982).. However, apart from our having adopted a common metric,.we have made
no particular effort to equate the tests acrosa studies. In light of this,
tne parallels between tine HSB and the NLS figures in Table I are especially
striking.
Table 1 About Here
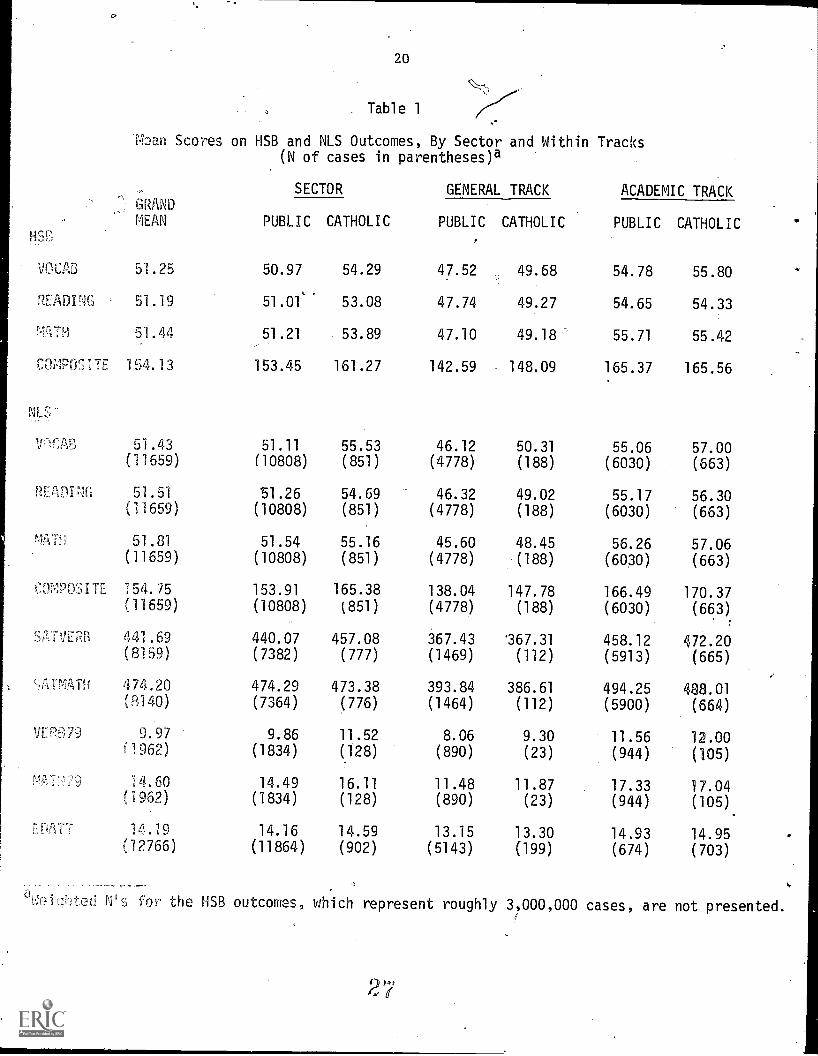
Comparing public and Catholic means, we find a consistent advantage
for the latter. Although the differences are not especially'large, they
all are somewhat greater in the NLS than in'the HSB. For instance, in the
NLS the mean differences on the subtests ate on the order of four-tenthsV
of a standard deviation,:while in the,HSB,'they are closer u* two-tenths
of a standard 'deviation." In.both data sets, the disparity is greatest on
Che vocabulary test.
These figures, however, may npt be the most appropriate comparisons.
Schools in the two sectors.differ somewhat in their educational goals.
Because of this, an argument can be made for focusing on differences between
students who are pursuing similar programs of study. Private sector school.s
tend to be more oriented toward preparation for college; hence, in that
sector cognitive skill development should be a more central priority. These
differences in scholastic orientation are reflected in the track enrollments
in the two sectors. Based on student self-reports, 34 percent of the HSB
public school students are enroll.ed in the academic track compared to 69
percent in the Catholic sector. The corresponding figures for the NLS
are 42 and 67, based on school records.6
Since academically oriented students are presumably more capable on
the average, the overall figures' in Table 1 to some extent likely reflect

6
merely these differences in curricular patterns across the two sectors. We
therefore also consider test scre results for academic and general track
students separately.7 '14hen comparisons between sectors are made within
curricula, the original differences, which themselves were rather modest,
become even slimmer. In fact, in the HSB data they become inconsequential.
Among non-academic youth, the subtest differences range from just over
two points on the Vocabulary test to about one and a half points on Reading.
Among academic students, all of the differences are very small, and two
actually favor public schools. Neither of these public school advantages
is at all large, but the reversal itself is striking. These, it should..,
be recalled, are the same data used by Coleman.8,,
/In the NIS data, the general track comparisons are not much different
from the overall figures; for academic students, however, the differences
are all smaller. Although these latter comparisons still all favor Catholic
schools, the differences themselves are trivial. For the subtests, the
largest is but two points and the smallest is under one point. The difference
between cthe composite means is only about .15 of a standard deviation.
Table 1 also presents similar. breakdowns for.the other outcomes whiCh
2 NLS maWs available. These include SAT scores for those youth in the
two sectors who took the test, scores on verbal and math tests which were
administered to a subsample as part of the 1979 follow-up, and data on years
of school completed as of 1979, seven years beyarid high school. Before
cons dering the averages themselves, we should point out that they are
l'ased on widelyvarying sample sizes. This is due to di ferences in their
urce. Students with SAT's are self-selected owing i6 their having
ylected to take the test, while the 1979'tests were achilinistered to only 11%
the original sample. The number of non-academic Catholic sch 1 students
13 ///
7
is especiall small for these variables. On the other hand, coverage for
the years of education measure is much more satisfactory.
These sparse figures are partially offset by the rarity of such data,
especially the re-admistration of standardized tests. Additionally, the
samples of students taking the SAT in the two sectors, being similarly
oriented toward college, may actually be more comparable than even the
groups defined by track membership. Hence, this sort of self-selection
may compensate partially for the initial dissimilarities between the two
sectors. As a practical matter, moreover, the results turn out to be
similarly patterned across all outcome measures, suggesting that the
varying case base is not a critical consideration.
Despite reservations because of the reduced N's, the NLS figures
in the lower portion of Table I are highly congruent with those for the
cross-sectional test results. The gross public-private comparisons
nearly all favor Catholic schools, but in absolute terms the differences
are quite small. The one exception involves quantitative SAT scores, where
the averages for the two sectors are very nearly identical. More interesting
than these gross comparisons, however, are those within nominally equivalent
tracks. Adjusting in this way for differences across the sectors in the
proportions enrolled in the two tracks has dramatic consequences. Now
there are, at most, only two differences of any consequence (the Catholic
sector aditantage on the verbal SAT among academic students and the Catholic
---sector advaniage on the verbal follow-up test among general trackiyouth),
and even these are quite small. The other disparities all are trivial,
and four actually favor public school students (three of these involve
quantitative tests).
8
If one accepts the procedures employed in Table 1, then even at this
simple descriptive level there is little basis for claiming that private
sector schools (i.e., Catfiolic) produce outcomes superior to public schools.
However, for both completeness and conclusiveness, we turn now to a more
analytic consideration of these data. These results are presented in Table
2. HSB analyses again are provided as a base of comparison.
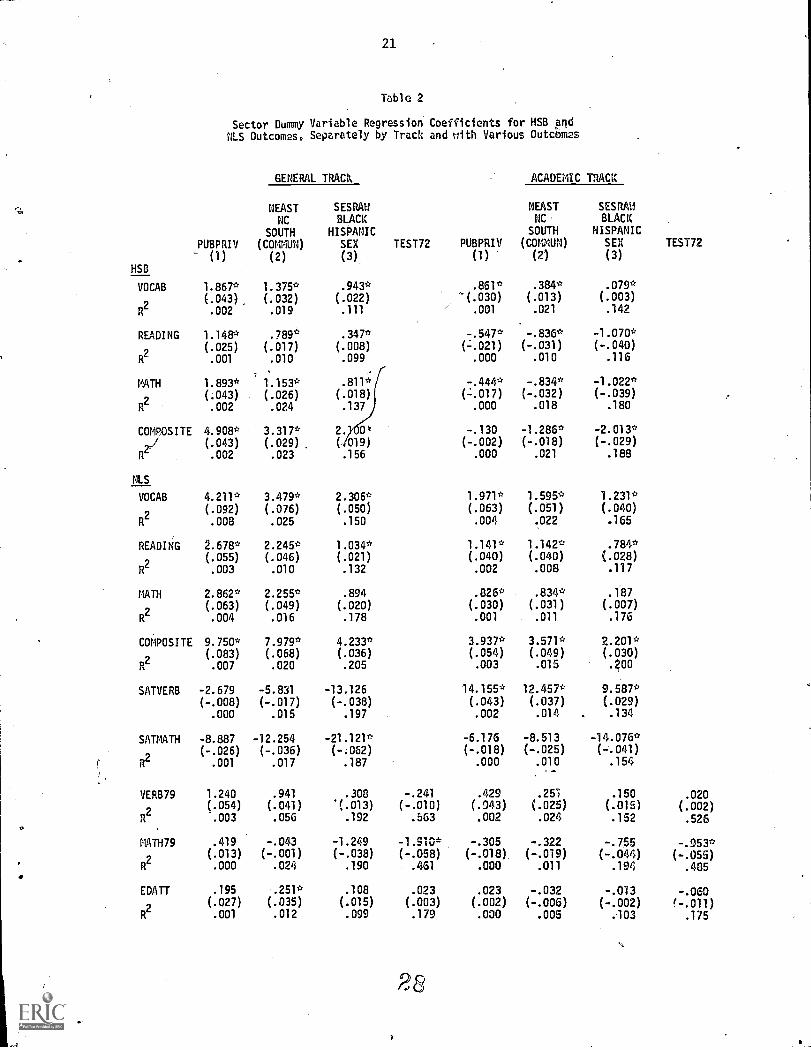
For each outcome we report the coefficients obtained for a sectora
dummy variable predictor across several regression estimations, with all
analyses performed separately for academic-and general track students.10
The estimations differ in the control variables they include. The first'
entry is that obtained.with no controls. In standard form, this is the
zero order correlation between the sector dummy and tl* test at issue.
r.This, then, expresses the observed difference between Catholic and public
schools.4the second entry is obtained from an equation which adjusts for
regional-and locational (i.e., urbanicity) differences between schools ip
the two sectors; and, the third takes into account differences in the
personal characteristics of students in the two sectors (i.e., SES back-
ground, race/ethnicity and gender). Hence, the sector coefficient for
the third estimation reflects public-Catholic differences among similar
kinds of students, who attend schools in the same area, who also are in
the same tracks. Finally, for the long-term outcomes in the NLS, we also
present the results obtained when scores on the 1972 test battery are
controlled. Since we think the 1972 test results more likely reflect
student selection differences than sector effectiveness, this last analysis
adjusts for relevant differences in competency levels between students in
the two sectors.11
R-squared statistics for these several equations also
are'presented. We'experimented with a great many variations on this
straightforward way of proceeding;12 the results presented in Table 2 are,
15

"
.1
9
we believe, faithful to the implications of these data in all important
respects.
Table 2 About Here
The zero-order correlations between our various outcomes and the
sector variable all are quite small. These appear'in the first column of
results for each curriculum. In not a single instance does the sector
distinction account for even as much as one percent of the criterionf
variance--and these figures pr bably are upper-bound estimates of sector
differences! The largest R2is .008, this being for the vocabulary subtest
among NLS general track students.
It appears, then, that even at this gross level sector differences
are not large enough to warrant attention. This conclusion certainly
applies to the H'SB data. For academic track students not a single R2
statistic exceeds .001, and three of the four coefficients are negative
(negative signs indicate public school advantages over Catholic). Among
general track students, the pattern is a little different because all the
comparisons favor Catholic schools and the coefficients are a bit larger
than in the academic track comparisons. However, they all still are
substantively trivial.
In Coleman, Hoffer and Kilgore's study too the public-private dis-
parities tended to be greater for the general track. The researchers
interpreted this as revealing where the private sector's advantage over /
the public was most pronounced. It strikes us as at least curious, though,
that private schools most outpace public schools in the curriculum where
cognitive skill development presumably is less salient.
16
10
It is possible, on the other Hand, that these results merely reflect
the superior initial competencies of Catholic school students. Recall
that differences in pre-existing tesfing levels are not taken account of
in these comparisons. Although the controls introduced in columns 2 and
3 no doubt adjust-partially for such -uifferences, we know from other research
that they do not do so fully. It is likely that such uncontrolled
variability in initial capabilities will result in upwardly biased estimates
of sector differences.
What the data may actually indicate, then, is that the academic track
in both sectors attracts students of roughly comparable abilities/achieve-
ments, while the Catholic sector tends to enroll somewhat more capable
students in its general track. The public school;, of course, must admit
virtually anyone who enrolls, whereas Catholic school admissions are
selective in at least two respects: first, on the part of the parents and
students who choose a non-public option; and, second, on the part of the
schools themselves, which retain the right of refusal. For these reasons,
it would be quite surprising if Catholic school students were not, in the
aggregate, somewhat more competent initially than those in the public
schools.
We thus strongly suspect that our analysis, as well as Coleman et
al.'s, could mistake selection differences for evidence of differential
sector effectiveness.13
But even if the figures in Table 2 are accepted
as evidence of effectiveness, the HSB results in column 1 offer little
reason to think Catholic schools superior to public. The effect of adding
locational and background controls in the second.and third esthnations is
to reduce the already trivial differences even further.14
11
The NLS results for cross-sectional test scores Are highly congruent
with those from the HSB: general track differences exceed those for the
academic track, but none is especially pronounced; and, the small zero-order
differences shrink even further when controls are introduced for locational
and student background differences between the two sectors. Also, as was
observed in Table'l, the sector disparities generally are somewhat greater
in the NLS than the HSB. All these differences, however, involve very
small coefficients.15
The major message of these data thus seems clear:
there is little reason to think Catholic schools any more effective than
public schools in fostering.high levels of cognitive development.6
In light of these results from our replieation of Coleman's analysis,
what we originally thought would be the unique contribution of the present
study seems somewhat anticlimactic. Nevertheless, the other NLS outcomes
are of interest in their own right, and our findings on them are presented
in the lower portion of Table 2.
Differences in SAT performance favor the public schools in three
out of four comparisons even before any controls are introduced, but nple
of these is statistically significant.17
General track students in Catholic
schools score somewhat higher on the verbal test, and this difference is
statistically significant (in fact, this is the only significant zero order
association in the NLS data), As locational and background controls are
entered into the analyis, however, the one Catholic sector advantage
shrinks somewhat, while all three public sector advantages tend to enlarge.
As has been the case throughout, in no instance are these differences at
all substantial.
Three of the four zero-order comparisons for the 1979 test scores
favor Catholic schools, but again none of these is statistically significant.18
18

12
the other hand, public school academic track students modestly outPerform
their Catholic school counterparts on the math test. When adjustments are
made for locational differences between schools in the WO sectors,.public
students surpass Catholic school stydents on the math test in both tracks
(see,the second column of results), and the pattern remains the same when
adjustments are made for student background differences.
For these latter outcomes the results for yet a fourth estimation,
which controls on students' scores on the 1972,test.battery, also are
presented. The 1972'test'data thus are used.as though they'reflected
.7student competencies.that existed prior to high school., -.This no doubt.
overstates the resistance of such traits to academic influence but it
probably is more appropriate to use them in this way than it is to use
them as school outcomes when one cannot also control for their corresponding
"input" values. The latter, of course, is what Coleman, Hoffer and Kilgore
have done.
We had.expected that adjusting for test score aifferences in this way
would attenuate the sector coefficients obtained when only student back-
ground and school location factors were controlled. And, in fact, these
test controls do drive down the Catholic school advantage, with three of
four differences at this point favoring the public sch ols. Although there
clearly is room for disagreement diler whether this is an appropriate use
of the Class of 72 testing data,19
Coleman et al.'s conclusion had been
found wanting yell before we got to this point. Hence, the general import
of our analysis does not hinge on this particular detail of our procedures.
The picture is very much the same for our last dependent variable,
years of school completed as of 1979, seven years beyond high school.
Among general track students, those attending Catholic schools tend to go

13
very slightly further through school than those from public schools, but
this difference is eliminated,when adjustments are made for student back-.
ground characteristics. Among students in the academic track, attainment
levelSare virtually identical to begin with. As controls are,added, a small
difference favoring public'schools emerges, but'this never reaches signifi-
0
cance. Once again, then, we see little indication that private sector schools
outperform those in the public sector. This has been consistently the case
-. across many outcome measures and in both data sets.
In light of this striking consistency, there is little reason to
ihink Catholic schools more effective than publis schools in promoting high
levels of school achievement. There no doubt are many considerations which
incline pome parents and youth'toward private sector schooling, and there
might well be good reasons to advocate policies which broaden educationalQ
options. At least insofat as die,choice of Catholic schools over public
is concerned, however, the evidence fails to support at least this rationale
for such a preference.
We think it would be a tragic mrsfortune if opinion and policy '
regarding the public schools were predicated upon mistaken beliefs. In
the present debate over 'Public subsidies for private schcoling, Coleman,
Hoffer and Kilgore's study is frequently invoked as establishing the
superiority of private sector schooling, They themselves, in fact, have
framed their work in the context of such policy considerations. Our
reanalysis'of their data and of other data bearing on the same isue does
not suppoil the conclusign that f)rivate sector schools are superior.
Since this conclusion apparently is wrong, it clearly should not be invoked
as a justification for policies to increase the role of private education
in American society,
22i)
14
FOOTNOTES
1. Indeed, we believe there is little basis fof this conclusion
eVen in their own study. Our reasons for thinking this will be developed
shortly.A
2. In response to early criticisms, Coleman and-colleagues recently
have attempted to take account of this by comparing outcomes across
sectors within the same durricula, e.g., the academic and general tracks
(1982a). This strategy vas not employed in either the original technical
(1981a) report or the commercially published version (1982b), however.
3. This is the reason for controlling on SES and demographic back-
ground characteristics before comparing performance levels'between sectors.
4: Evidence on these points is presented in Alexander, McPartland
and Cook, 1980, and in Alexander, Pallas and Cook, 1981.
5. Throughout these analyses, the 1113 results reflect design
weighting. The NLS results are unweighted.
6. School record reports are not available in the HSB.
7. Coleman, Hoffer and,Kilgore (1982a) also have performed such
within-track analyses. Controlling for track differences in this way
presumes that track placements reflect mainly student and family preferences,
rather, than schoolpolicy. Althpugh both factors likely are involvbd, we
believe that curricular placements in most instances are more a function of
student and family preferences than of school policy. Indeed, there can
be little doubt that many families choose schools on thd basis of,their
curriculum policies. For these reasons, we think it most appropriate that
sector effectkveness be evaluated within nominally equivalent tracks.
Coleman et al. have conceded that this at least is a proper concern, and
have reported results broken down in this way, They also caution, however,

15
that to the extent.,that track placements derive exclusively from school
--policy, this stta hy will underestimate sector differences. We readily
grant this point, tc.),Lit remain of the opinion that the neglect of track
differences altogeth would be the more serious failing. We will return
to this issue later.
The total figures reported in Table 1 pertain only to general and,
academic track students. Colethan, Hoffer and Kilgore excluded vocational
students because there were so few in the private sector. We have followed
their lead in removing vocational students from the analysis.
8. Their study, however, relied upon raw scores and used only the
items common to the sophomore and senior year tests. Hence, their results
and ours are not directly comparable.
9. Some of these SAT scores were inputed from the ACT subtests.
We regressed SAT verbal and mathematics performance on ACT subtests Tor
the nearlT1000 cases in the NLS with data on both sets of tests. These
regression equations then were used to predict SAT scores for those students
who had ACT scores but did not have SAT data. The prediction equations
seem quite adequate, with multiple correlations in the .80 range.
10. We also performed a pooled analysis neglecting curriculum
altogether. The results of this analysis were consistent in all important
respects with those we present in Table 2. Estimates of sector effects,
while still substantively trivial, were somewhat larger in magnitude,
however. The largest zero-order association of sector with an outcome
was .127 (for the NLS test composite), This might be compared with the
largest such zero-order correlation in Table 2, .092 for general track
students on the NLS vocabulary test. After regional and student background
controls are applied, the largest standardized sector coefficient in the
22

16
absence of curriculum controls was .069 (for the NLS vocabulary test). 'The
largest such sector coefficient in Table 2 is,050 (for general track
students on the NLS vocabulary test). As we noted earlier, we believe
the uglect of curriculum altogether would be a serious omission; Ience,
,we prefer the within-track analyses presented in Table 2. Nevertheless,
the results of the pooled analysis differ only slilghtly.
11. It is arguable whether cross-sectional 'test scores are more
properly used as input controls or as outcomes in research such as this.
Coleman, Hoffer and Kilgore have opted for the latter strategy; we believe
the case for the'former is stronger.
12. We considered these data in a great many ways to assure ourselves
that we were not missing something central to the issue of differential
sector effectiveness. We performed parallel analyses and regression
decompositions (similar to those employed by Coleman, Hoffer and Kilgore)
and have tested for various interactions in the regression framework pre-
sented in the text. Some of these results offered up minor details that
might be obscured in others, but all were consistent on the major question.
The analysis we present has the virtue of being uncompliZated and is
sufficiently faithful to detail.
13. We should note too that Coleman, et al.'s analysis showed low SES
and minority students to benefit most from attending private sector
schools. Although this is not revealed in the analysis we present, the
same pattern actually appears in both the NLS and the HS5 data. However,
alternative interpretations based on self-selection considerations could
be advanced here as well. This is reminiscent of the "differential
sensitivity" hypothesis advanced in Coleman's 1966 study (Coleman, et al.,
1966)--that the achievements of minority youth are especially affected by
p
17
school quality differences. In neither instance is the evidence in support
of such substantive interpretations compelling.
14. We should note that we are more interested in the size of
associations and of effect parameters than in levels of statistical
significance. In most instances, the sample sizes for these analyses aye-
so large that quite trivial relations4ps are significant at conventional
alpha levels.
15. Although we do not mean to make too much of it, we find it
interesting that the sector differences usually are lacger in the NLS
than in the HSB. If we take this pattern as reflective of selection pro-
cesses rather than school effectiveness, it might indicate that Catholic
schools.have become less selective over the intervening decade as they have
accommodated the flight from public schools.
16. It actually is hard to tell whether Coleman, et al.'s results
are similar in implication, but we-tend to think they line up. rather well
with ours. Since they employ raw-score test results, their descriptive
analysis (e.g., mean number right in the various sectors) doesn't provide
an anchor by which to judge whether a difference is large or small. Their
multivariate analysis employs a regression decomposition strategy, which
uses the results from parallel regressions across sectors. Nowhere, then,
do we see simple associations between the sector distinctions and the
outcomes. However, When We try to look at their data and ours in comparable
ways, they correspond quite closely. For example, based on Table,6-2 in
Coleman et al. (1982b), the mean differences.between the Catholic and
public sectors, expressed as fractions of the U.S. total standard deviations,
are .41, .26 and .35 for the vocabulary, reading and mathematics tests,
respectively. The corresponding number for our standard scores, .40, .26
24

18
and .33, respectively, are almost precisely the same.
17. Recall that some of.the sample sizes here are quite small.
18. HeTe too some of the samples are very small.
19. Most research in the status attainment tradition, for example,
uses concurrent test data as though they were predetermined relative to
other in-school, as well as longer term, outcomes. In fact, a good many
such studies employ these game NLS data in this way.
19
. REFERENCES
Alexander, Karl L., James M. Mcpartland, and Martha A. Cook
1980 "Using standardized test performance in.schdol effects research."
Pp. 1-33 in R. Corwin (ed.), Research in Sociology of Education
and Socialization, Volume 2. GreenWich, Conn.: JAI Press.
Alexander, Karl L., Aaron M. Pallas, and Martha A. Cook
1981 .leasure for measure: on the use of,endogenous ability data in.
school-process research." American SociolSgical Review 46: 619-31.
Coleman, James S., Ernest Q. CamPbell, Carol J. Hobson, James M. McPartland,
Alexander Mood, Frederic D. Weinfield, and Robert L. York
1966 Equality of Educational Opportunity. Washington, D.C.: U.S.
Government Printing Office.
Coleman, James S., Thomas Hoffer, and Sally Kilgore
198,1a, Public and Private Schools. A Report to the National Center
for alucation Statistics. Chicago: National Opinion Research
Center.
1981b "Questions and answers: our response.", Harvard Educational
Review 51: 526-45.
1982a "Achievement and segregation in secondary schools: a further
look at public and private school differences." Sociology of
Education 55: 162-82.
1982b High School Achievement: Public, Catholic and Private Schools
Compared. New York: Basic Books.
HS"
READMS
cc1rosriE
NLS-
vronr,
REAP.
WaN
COMPO_ TE
SAINATH
20
Table 1
Moan Scores on HSB and NLS Outcomes, By Sector and Within Tracks(N of cases in parentheses)a
GRANDMEAN
SECTOR GENERAL TRACK ACADEMIC TRACK
PUBLIC CATHOLIC PUBLIC CATHOLIC PUBLIC CATHOLIC
51.25 50.97 54.29 47.52 49.68 54.78 55.80
51.19 51.01' 53.08 47.74 49.27 54.65 54.33
51.44 51.21 53.89 47.10 49.18 55.71 55.42
154.13 153.45 161.27 142.59 148.09 165.37 165.56
51.43 51.11 55.53 46.12 50.31 55.06 57.00(11659) (10808) (851) (4778) (188) (6030) (663)
51.51 51.26 54.69 46.32 49.02 55.17 56.30(11659) (10808) (851) (4778) (188) (6030) (663)
51.81 51.54 55.16 45.60 48.45 56.26 57.06(11659) (10808) (851) (4778) (188) (6030) (663)
54.75 153.91 165.38 138.04 147.78 166.49 170.37(11659) (10808) (851) (4778) (188) (6030) (663)
441.69 440.07 457.08 367.43 '367.31 458.12 472.20(8159) (7382) (777) (1469) (112) (5913) (665)
474.20 474.29 473.38 393.84 386.61 494.25 488.01(8140) (7364) (776) (1464) (112) (5900) (664)
9.97 9.86 11.52 8.06 9.30 11.56 12.00(1962) (1834) (128) (890) (23) (944) (105)
14.60 14.49 16.11 11.48 11.87 17.33 17.04(1962) (1834) (128) (890) (23) (944) (105)
14.19 14.16 14.59 13.15 13.30 14.93 14.95(12766) (11864) (902) (5143) (199) (674) (703)
for the HSB outcomes, which represent roughly 3,000,000 cases, are not presented.
2 7
21
Table 2
Sector Dummy Variable Regression Coefficients for HSB agdNLS Outcomes, Separately by Track and with Various Outcbmes
GENERAL TRACK ACADEMIC TnAcx
HSB
VOCAB
R2
READING
R2
MATH
R2
COMP SITE
R
NLS
PUBPRIV(1)
1.867*(.043).002
1.148*(.025).001
1.893*(.043).002
4.908*(.043).002
4.211*(.092)
.008
2,678*(.055)
.003
2.862*(.063).004
9.750*(.083).007
-2.679(-.008)
.000
-8.887(-.026)
.001
1.240(.054)
.003
.419(.013).000
.195(.027).001
NEASTNC
SOUTH(COMMUN)
(2)
1.375*(.032).019
.789*(.017).010
- ^
1.153*(.026).024
3.317*(.029).023
3.479*(.076)
.025
2.245*(.046).010
2.255*(.049).016
7.979*(.068).020
-5.831(-.017)
.015
-12.254(-.036)
.017
.941(.041)
.056
-.043(-.001)
.024
'.251*
(.035).012
SESRAUBLACK
HISPANICSEX
(3)
943*(.022).111
347*(.008).099
.811*
(.018).137
2. P(1019).156
2.306*(.050)
.150
1.034*(.021)
.132
.894(.020)
.178
4.233*(.036)
.205
-13.126(-.038)
.197
-21.121*(-.062)
.187
.308(.013)
.192
-1.249(-.038)
.190
.108
(.015).099
TEST72
-.241(-.010)
.563
-1.910*(-.058)
.461
.023(.003).179
PUBPRIV(1)
.861*"(.030)
.001
-.547*R021).000
-.444*(,:..017)
.000
-.130(-.002)
.000
1.971*(.063).004
1.141*(.040).002
.826*(.030).001
3.937*(.054).003
14.155*(.043).002
-6.176(-.018)
.000
.429(.043).002
-.305(-.018)
.000
.023(.002).000
NEASTNC.
SOUTH(COMM)
(2)
.384*(.013).021
-.836*(-.031)
.010
-.834*(-.032)
.018
-1.286*(-.018)
.021
1.595*(.051).022
1.142*(.040).008
.834*(.031).011
3.571*(.049).015
12.457*(.037).014
-8.513(-.025)
.010-
.257(.025).024
-.322(-.019)
.011
-.032(-.006)
.005
SESRAUBLACK
HISPANICSEX
(3)
.079*(.003).142
-1.070*(-.040)
.116
-1.022*(-.039)
.180
-2.013*(-.029)
.188
1.231*(.040)
.165
.784*(.028)
.117
.187(.007).176
2.201*(.030).200
9.587*(.029)
-14.076*(-.041)
.154
.150(.015).152
-.755(-.044)
.194
-.013(-.002)
.103
TEST72
.020(.002)
.526
(-.055).485
-.060(-.011)
.175
VOCAB
R2
READING
R2
MATH
R2
COMPOSITE
R2
SATVERB
SATMATH
R2
VERB79
R2
MATH79
R2
EDATT
R2
28
22
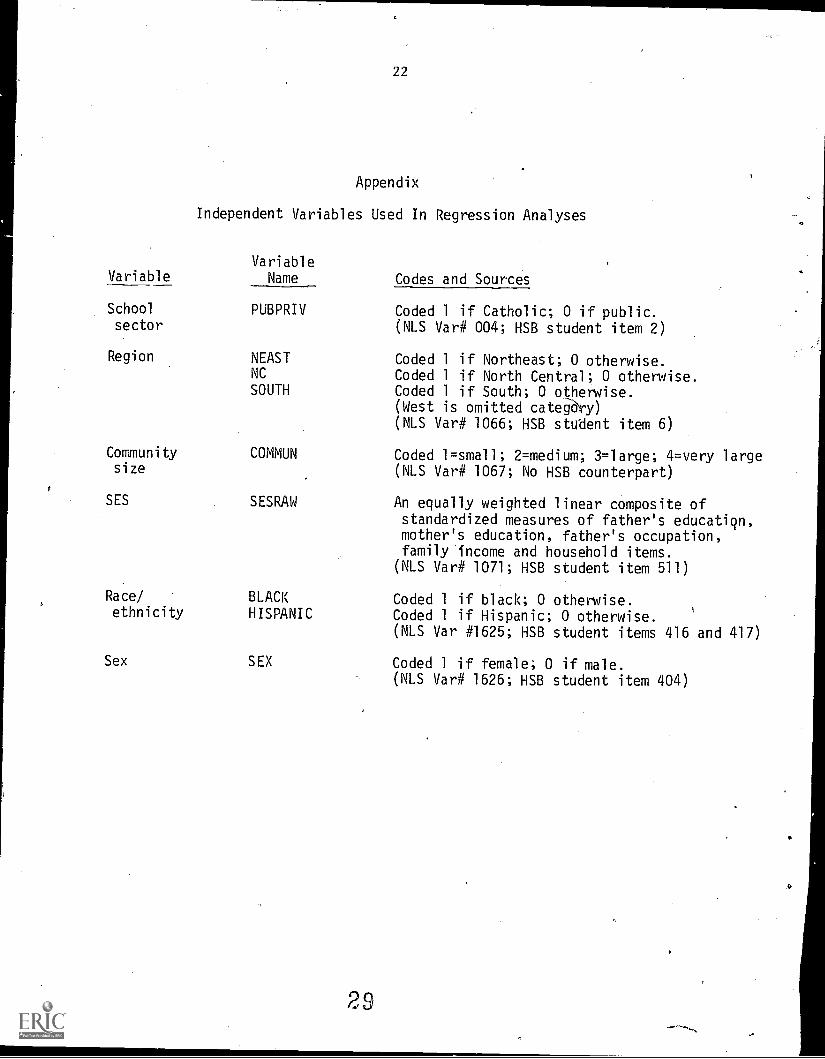
Appendix
Independent Variables Used In Regression Analyses
VariableVariable Name Codes and Sources
School PUBPRIV Coded 1 if Catholic; 0 if public.sector (NLS Var# 004; HSB student item 2)
Region NEAST Coded 1 if Northeast; 0 otherwise.NC Coded 1 if North Central; 0 otherwise.SOUTH Coded 1 if South; 0 otherwise.
(West is omitted categ-avy)
(NLS Var# 1066; HSB stuUent item 6)
Community COMMUN Coded 1=small; 2=medium; 3=large; 4=very largesize (NLS Var# 1067; No HSB counterpart)
SES SESRAW An equally weighted linear composite ofstandardized measures of father's educatign,mother's education, father's occupation,family fncome and household items.
(NLS Var# 1071; HSB student item 511)
Race/ BLACK Coded 1 if black; 0 otherwise.ethnicity HISPANIC Coded 1 if Hispanic; 0 otherwise.
(NLS Var #1625; HSB student items 416 and 417)
Sex SEX Coded 1 if female; 0 if male.(NLS Var# 1626; HSB student item 404)