do morningstar ratings provide value within...
TRANSCRIPT

Financial Decisions, Winter 2010, Article 4
1
Do Morningstar Ratings Provide Value Within Generic Government Mutual Bond Funds?
Amy F. Lipton* and Richard J. Kish**
*Saint Joseph’s University **Lehigh University
Abstract Investors often look for confirmation of a mutual fund’s performance. This paper analyzes whether Morningstar’s rating system adds value within the mutual fund sector for government bonds. The authors confirm that on average Morningstar ratings accurately represent high and low performing mutual funds when measured against Sharpe ratios, Treynor ratios, Jensen’s alphas, Sortino ratios, and M-squared values. Our performance evaluation also shows that some managers, although not all, can add value on a risk-adjusted basis even within the generic government bond mutual fund category.

Financial Decisions, Winter 2010, Article 4
2
Do Morningstar Ratings Provide Value Within Generic Government Mutual Bond Funds?
1. Introduction With $2.35 trillion in assets in 2008, government bond mutual funds continue to be an important part of many investors’ portfolios.1 Given that 44% of individuals hold bond mutual funds, there is a need for a simple metric for analyzing fund performance.2 Several widely used performance metrics based on risk-adjusted returns within the mutual fund industry include the Sharpe ratio, the Treynor ratio, Jensen’s alpha, the Sortino ratio, and M-squared.3 But can the potential investor gain as much from a simple and easy-to-use alternative metric like the Morningstar rating system without performing a set of complex calculations on historical returns? To answer this question, we compare the Morningstar rating system to five commonly used risk-adjusted performance measures: Sharpe ratio, Treynor ratio, Jensen’s alpha, Sortino ratio, and M-squared. In general, the comparisons show consistent results within our sample period for three maturity classes of government bond open-ended mutual funds (short-, intermediate-, and long-term) even though there were some outliers. Some of the differences uncovered may be due to the fact that these performance metrics were designed for portfolios of diversified assets which single asset government bond funds lack.4 In addition, there are some surprising differences between the Morningstar rankings and those produced by the Sharpe and Sortino ratios, whose computations are most similar to the Morningstar score.5 Our performance evaluation also showed that some managers, although not all, can add value on a risk-adjusted basis even within the generic government bond mutual fund category.
2. Performance Metrics We utilize five performance metrics (Sharpe ratio, Treynor ratio, Jensen’s alpha, Sortino ratio, and M-squared) for the mutual funds within our three different maturity government fund
1Investment Company Institute’s 2009 Investment Company Fact Book, 49th ed. (http://www.icifactbook.org).2For further documentation of the performance measures see Sharpe (1966, 1994), Treynor (1965), Jensen (1968), Sortino and Price (1994), and Modigliani and Modigliani (1997).3Sharpe criticizes the misuse of his ratio within the hedge fund field in a Wall Street Journal article (Wall Street Journal, “Sharpe Point: Risk Gauge is Misused,” August 31, 2005, p. C1 by Jeanne Dugan). Also because the components of the Sharpe ratio, the Treynor ratio, Jensen’s alpha, the Sortino ratio, and M-square are themselves statistical estimates, the potential exists for significant error in its calculation. Even through measurement errors can result in erroneous statistical inferences that does not seem to be the case within the government bond mutual funds based on persistence tests as outlined in Lo (2002).4See www.morningstar.com for more on the rating analysis. Morningstar rates mutual funds from one to five stars based on how well they've performed (after adjusting for risk and accounting for all sales charges) in comparison to similar funds. Within each Morningstar Category, the top 10% of funds receive five stars, the next 22.5% four stars, the middle 35% three stars, the next 22.5% two stars, and the bottom 10% receive one star. Funds are rated for up to three time periods--three-, five-, and 10 years--and these ratings are combined to produce an overall rating. Funds with less than three years of history are not rated. Ratings are objective, based entirely on a mathematical evaluation of past performance. They're a useful tool for identifying funds worthy of further research, but shouldn't be considered buy or sell recommendations.5We employ the denominator as originally defined in Sharpe (1966) as the standard deviation of the return series.

Financial Decisions, Winter 2010, Article 4
3
categories to help determine if these results are consistent with the Morningstar ratings and if the fund manager(s) investment decisions of the various mutual funds were value additive. The first performance metric, the Sharpe (1966) ratio, is a reward-to-volatility ratio defined as the excess return above a risk-free rate divided by the standard deviation of the returns.6 The Sharpe ratio, as it is generally applied, is estimated as equation (1).
(1)
where = sample mean of monthly returns for fund i, = risk-free return, and = sample standard deviation of monthly returns for fund i.
From a mean-variance framework, it is the slope of the line between the risk-free asset and the optimal risky portfolio on the efficient frontier (i.e., the capital market line) and represents the maximal attainable ratio of reward (measured by excess return) to risk (measure by standard deviation of returns). Alternatively, it has been defined as a zero investment strategy with a long position in the fund and a short position in the risk-free asset. For example, see Sharpe (1966, 1994). Our next two performance metrics, the Treynor ratio and Jensen’s alpha, both rely on the calculation of beta for the quantification of risk instead of the standard deviation utilized within the Sharpe ratio calculation. Risk in this context is defined as non-diversifiable risk, as opposed to total risk as determined by standard deviation. Non-diversifiable risk is measured by the fund’s beta, typically calculated by a regression of the fund’s excess return relative to the market’s excess return. The Treynor (1965) ratio is defined as the return premium earned over the risk free proxy by the fund for each unit of non-diversifiable risk taken. The Treynor ratio, shown in equation (2), is often referred to as the slope of the security market line, which measures the required return of an investment as a function of its non-diversifiable risk. Similar to the Sharpe ratio, it is also an estimated value based upon historical inputs.
(2)
where = sample mean of monthly returns for fund i, = risk-free return, and
= sample beta for fund i (i.e., the sensitivity of fund i’s excess returns to the market index’s excess returns).
6Although not included within this report, we tested for return persistence using Lo’s (2002) methodology. Within our government bond funds no persistence was found. Results of the quantitative analysis are available from the authors upon request.

Financial Decisions, Winter 2010, Article 4
4
Our third performance metric, Jensen’s (1968) alpha, is the constant term in a regression of the fund’s excess return against the excess return of a benchmark index. Thus, Jensen’s alpha is the difference between the fund’s realized return and its expected position on the security market line given its non-diversifiable risk. If the fund generates a positive alpha, it is positioned above the security market line and is outperforming what the Capital Asset Pricing Model (CAPM) would predict its performance to be given its perceived risk level. Equality signifies that the fund is generating just enough return to justify the risk undertaken. Otherwise, the fund is underperforming its required return given its level of risk. The regression equation used to generate Jensen’s alpha is shown as equation (3). Rit = αi + βiIt + εit (3) where
Rit = excess return of fund i in month t αi = Jensen’s alpha for fund i βi = sample beta for fund i (i.e., the sensitivity of fund i’s excess returns to the market index’s excess returns) and It = excess return of the index in month t is defined as the market’s monthly return less the one-month return on the risk-free asset, i.e., RMt – Rft. εit = unexplained excess return.
Our fourth performance statistic, the Sortino (1994) ratio, is a risk-adjusted return ratio similar to the Sharpe ratio except that it uses the excess return over a designated target return divided by the risk of not achieving this target return, as shown in equation (4). The risk of not realizing the target is captured by using a measure of downside risk only.
(4)
where = sample mean of monthly returns for fund i, = the target return, proxied by the sample mean return on the respective index
= the semi-standard deviation of the excess return of fund i versus the target over the sample period.
Our final performance metric, M-squared, was developed by Modigliani and Modigliani (1997). This performance metric measures the risk adjusted performance after adjusting the portfolio return for risk relative to the market index, as shown by equation (5).
(5) where µi = sample mean of monthly returns for fund i Rf = the risk-free return σm = the standard deviation of the market series σi = the standard deviation of fund i. Our comparison metric is the Morningstar rating for the funds which range from a high of 5 stars to a low of 1 star. Similar to our 5 comparison metrics, a Morningstar rating is a quantitative assessment of the fund’s past performance utilizing both risk and return. The Morningstar rating adjusts the fund’s return for fees and expenses, and its risk for downside

Financial Decisions, Winter 2010, Article 4
5
realizations.7 Winston (2005) shows that Morningstar’s rating formula can be reduced to equation (6).
(6)
where
= sample mean of monthly returns for fund i, adjusted for expenses and loads = sample standard deviation of monthly excess returns for fund i
3. Literature Review Although our metrics are commonly used within investment analysis, each has its critics. For example, after Lo (2002) fully describes the estimation of the Sharpe (1994) ratio and its component parts (sample mean and standard deviation of returns), he details the computation of the asymptotic distributions of the estimates of the returns from a sample of equity mutual funds and hedge funds and then uses these results to emphasize the potential for estimation error. Both Lo (2002) and Sharpe (1994) point out that the Sharpe ratio does not take into account the effects of autocorrelation of returns and that it should only be used within diversified portfolios.8 Furthermore, Bertrand and Protopopescu (2008) show that skewness and kurtosis may also affect this performance measure. Another shortcoming highlighted by Sortino (1994) is that the Sharpe ratio, based on standard deviation as a proxy for risk, negates the differences between large positive returns (which are desirable) and large negative returns (which are undesirable). The Sortino ratio, a modified form of the Sharpe ratio that only measures downside volatility, also places too much emphasis on historical returns and a single factor approach to project future fund performance. Pedersen and Satchell (2002), investigating the benefits of the Sortino ratio, analyze the asymmetric return distributions of funds and find merit in the Sortino ratio compared to alternative approaches. They do point out, however, that the Sortino ratio relies on historical analysis to make predictions of an uncertain future that may occur within a totally different market environment. This is a shortcoming of all six performance measures. An analysis by Detzler (1999) emphasizes the need for including fund expenses when using either Jenson’s alpha or the Treynor ratio. Nevertheless, using Jensen’s (1968) alpha and indirectly the Treynor (1965) ratio to measure performance of global bond funds versus a variety of indices, he concludes that managers are not adding value net of expenses and therefore indexing is a better strategy if the costs of indexing (which may be very difficult to measure) are not prohibitive. Conversely, our analysis shows that there are some managers within the government bond fund category that add value even when considering returns net of expenses. Complementing Detzler (1999), earlier studies by Blake, et al (1993) and Philpot, et al (1998) emphasize the need for a multi-factor model versus the standard single index analysis. Both
7See www.duke.edu/~charvey/performance_eval/lettab1.htm and Graham and Harvey (1997) for a more detailed discussion of their GH1 and GH2 performance metrics.8Morningstar, Inc., The Morningstar RatingTM for Funds, 2008.
Financial Decisions, Winter 2010, Article 4
6
studies also point out the need to test for persistence which may skew results. The authors find no persistence in bond fund performance, which our analysis also supports (see endnote 7 for confirmation of the lack of persistence in alphas within our sample data), based on the insignificance of the lagged return coefficient. The biggest criticism of both Jensen’s alpha and the Treynor ratio is a reliance on beta, which itself has been highly criticized in the literature (for example see Roll (1977)). M-squared has been criticized by Graham and Harvey (1997), in whose work Modigliani and Modigliani (1997) based their performance metric. Graham and Harvey, who created the performance metrics GH1 and GH2, the forerunners of M-squared, find M-squared does not allow for curvature in the efficient frontier. Furthermore, they state that by assuming zero correlation of the interest return and the asset being evaluated M-squared could generate misleading inferences about the performance of low volatility funds.9 Casarin et al (2005) find Morningstar ratings highly correlated to the traditional performance measures (Sharpe ratio, Sortino ratio, and Treynor ratio) within the Italian mutual equity fund market. We expand this analysis within the U.S. Treasury debt mutual fund market. Since the Morningstar rankings should be increasing with historical returns and decreasing with standard deviation, we would expect the rankings to closely follow rankings based on the Sharpe and Sortino ratios. However, Morningstar also makes adjustments to the rankings for the relative riskiness of the funds (Blake and Morey (2000)).
4. Data
Our data set consists of monthly returns over the 5-year period January 2004 – December 2008. We use a sample from the U.S. Government category of the Morningstar Mutual Fund Database of U.S. Open-Ended Mutual Funds. The first selection criterion is that a fund must be classified within one of the three maturity classes in the U.S. government category: short-term, intermediate-term, or long-term. There were 161, 381, and 32 funds within the short-, intermediate-, and long-term mutual funds respectively. The second criterion is that the fund must have five years (60 monthly observations) of data covering the test period. This reduces our sample by 19, 44, and 7 funds for their respective categories. From this reduced sample, we further limit our analysis to one class of each fund to avoid duplication, creating a data set totaling 56, 94, and 13 unique short-, intermediate-, and long-term U.S. Government Open-Ended bond funds.10 We utilized a U.S. Government index with similar maturities (Ibbotson Associates (IA) SBBI US 1-Year Constant Maturity Government Bond Index for the short-term funds, IA SBBI U.S. Intermediate Government Bond Index for the intermediate-term funds, and IA SBBI U.S. Long-term Government Bond Index for the long-term funds) as a market proxy to control for measuring market or target performance in all of our metrics and regressions. These
9 For instance, AIM U.S. Government family of funds consists of A, A Load Waived, B, C, Institutional, Investment, R, and Y. We chose the A fund whenever possible, as long as it contained the necessary number of data points.10Other indices, such as the Credit Suisse U.S. Treasury 3-5 years and Merrill Lynch U.S. Treasury 3-5 years indices within the intermediate-term bond funds, were utilized as market proxies. These all generated similar results.

Financial Decisions, Winter 2010, Article 4
7
three indices most closely resemble the maturity class of the government fund’s objectives as described by Morningstar. 11 There is a potential for survivorship bias in the sample because only funds in existence as of January 1, 2004 are included. Also funds that were terminated during the five-year period were not included in the original sample. Thus, if a fund closure is primarily the result of poor performance, this would bias our sample toward higher returns. Furthermore, if investors make their decisions based on risk-adjusted performance, our measurement estimates will, on average, also be biased upward. However, Blake, et al (1993) show that survivorship bias is not as severe in bond funds as it is in stock funds. Fortunately, all of the funds in our sample were in existence for our entire January 2004 through December 2008 sample period. Tables 1, 2, and 3 show the geometric mean (GM), arithmetic mean (AM), and standard deviation (σ) for the sample funds of each of the three maturity classes. The average fund underperformed the index on an absolute (i.e., not risk-adjusted) basis (short-term: 3.51% versus 3.55%; intermediate-term: 4.23% versus 5.88%; and long-term 9.60% versus 10.36% for the geometric means). Similar results are shown in the tables for the arithmetic means. With this lower average return, only the intermediate-term fund generated a lower level of risk (3.63% versus 4.85%) when measured by the standard deviation. The short- and long-term funds showed a significantly higher average standard deviation versus their respective indices (2.06% versus 1.04% and 13.08% versus 12.02% respectively). As shown in tables 1 through 3, generally, funds rated with a 5 star Morningstar rating show mean values that are higher than their respective index, except within the long-term sample. But total return is not a good indicator of performance unless risk is also taken into consideration. Thus, there exists a need for comparisons with our five performance measures. When the average expense ratio (0.79%, 0.82%, and 0.72% for the short-, intermediate-, and long-term funds respectively) is factored into the return, the expense-adjusted arithmetic mean returns show mixed results. With the addition of the average expense ratio, the intermediate-term fund still underperforms its index (5.11% versus 5.99%), while both the short-term (4.32% versus 3.56%) and long-term (11.10% versus 10.98%) funds outperform their respective index using arithmetic means. Therefore, the result of underperformance is close to the average expense ratio found in Detzler (1999) and Blake, et al (1993) only within our smallest sample (long-term funds).
11We used the total return of the IA SBBI U.S. 30 Day Treasury Bill in the Morningstar Database as our proxy for the risk-free rate. The mean monthly return for that index over the 5-year period was 3.04% and 2.90% for the geometric and arithmetic means, respectively. The standard deviation for this risk-free proxy over our test period was 0.47%.

Financial Decisions, Winter 2010, Article 4
8
Table 1. Summary Statistics Short-Term Government Bond Mutual Funds
This table shows the descriptive statistics and risk-adjusted return measures for each fund and the index for the 60 months of returns from January 2004-December 2008. For each fund, we report descriptive statistics (geometric average, arithmetic average, and standard deviation in percent) and performance statistics (Sharpe ratio, Treynor ratio, Jensen’s alpha, Sortino ratio, M-squared, and the Morningstar rating).
# Mutual Fund GM AM σ Sharpe Treynor Alpha Sortino M2 Mstar
Average 3.51 3.53 2.06 0.0679 0.0637 -0.02 -0.0048 3.29 2.75
Index IA SBBI US 1 Yr Trsy Const Maturity 3.55 3.56 1.04 0.1563 0.0421 0.00 -0.0003 3.56
1 Payden U.S. Government 4.19 4.22 2.37 0.1428 0.0459 0.01 0.1256 3.56 5 2 Sit U.S. Government Securities 4.33 4.35 2.09 0.1797 0.0740 0.05 0.1693 3.69 5 3 Vanguard Short-Term Federal 4.36 4.38 2.15 0.1785 0.0606 0.03 0.1862 3.69 5
4 Northern Institutional U.S. Gov Sec A 4.31 4.34 2.45 0.1506 0.0510 0.02 0.1448 3.59 4 5 Fidelity Instl Shrt-Interm Govt 4.27 4.29 2.29 0.1557 0.0511 0.02 0.1439 3.61 4 6 Northern U.S. Government 4.32 4.38 3.47 0.1099 0.0397 -0.01 0.1095 3.44 4 7 Eaton Vance Government Obligations C 3.78 3.82 2.87 0.0776 0.0322 -0.02 0.0433 3.32 4 8 State Farm Interim 4.37 4.40 2.41 0.1612 0.0517 0.02 0.1494 3.62 4 9 SEI Daily Income Short-Duration Govt A 3.62 3.63 1.54 0.1107 0.0393 0.00 0.0201 3.44 4 10 Vanguard Short-Term Treasury 4.19 4.21 2.10 0.1623 0.0506 0.02 0.1420 3.62 4 11 Goldman Sachs Short Dur Govt A 4.12 4.13 1.83 0.1692 0.0551 0.02 0.1637 3.66 4 12 Federated U.S. Govt 1-3 Yr Y 3.99 4.01 1.68 0.1662 0.0510 0.01 0.1296 3.64 4 13 Federated U.S. Govt 2-5 YR K 4.30 4.36 3.57 0.1061 0.0360 -0.02 0.1006 3.42 4 14 Pacific Capital Hi Grd Shrt/Interm A LW 3.40 3.43 2.35 0.0477 0.0199 -0.04 -0.0235 3.21 4
15 Commerce Shrt-Term Government Instl 3.55 3.57 1.95 0.0780 0.0285 -0.02 0.0019 3.32 3 16 Homestead Short-Term Government 3.44 3.45 1.26 0.0912 0.0322 -0.01 -0.0386 3.37 3 17 Dreyfus Short-Intermediate Government 3.52 3.53 1.53 0.0917 0.0292 -0.02 -0.0076 3.37 3 18 Eaton Vance Government Obligations A 4.59 4.62 2.89 0.1569 0.0647 0.04 0.1914 3.61 3 19 Franklin Limited Maturity U.S. Govt A 3.83 3.86 2.36 0.0985 0.0351 -0.01 0.0570 3.40 3 20 Madison Mosaic Government 3.93 3.97 2.64 0.1000 0.0336 -0.02 0.0712 3.40 3 21 Thornburg Limited-Term U.S. Govt A 3.80 3.84 2.78 0.0820 0.0319 -0.02 0.0422 3.34 3 22 RidgeWorth Limited-Term Federal A 3.72 3.75 2.53 0.0790 0.0408 0.00 0.0343 3.33 3 23 Trust for Credit Unions Short Duration 3.43 3.45 1.65 0.0716 0.0354 -0.01 -0.0282 3.29 3 24 American Century Short-Term Govt Inv 3.45 3.46 1.53 0.0815 0.0286 -0.02 -0.0284 3.33 3 25 Victory Fund For Income A 3.91 3.93 2.18 0.1165 0.0490 0.01 0.0703 3.46 3 26 JPMorgan Treasury & Agency A 3.70 3.72 1.95 0.0997 0.0342 -0.01 0.0341 3.40 3 26 Northern Short-Intermediate U.S. Govt 3.69 3.72 2.44 0.0788 0.0270 -0.03 0.0279 3.33 3 28 Wells Fargo Advantage Sh Dur Govt Bd A 3.19 3.20 1.51 0.0319 0.0122 -0.03 -0.0900 3.15 3 29 Calvert Short-Term Government I 3.31 3.32 1.24 0.0673 0.0234 -0.02 -0.0709 3.28 3 30 Sentinel Short Maturity Govt A 3.60 3.61 1.33 0.1212 0.0486 0.01 0.0164 3.48 3 31 BNY Mellon S-T U.S. Govt Secs Inv 3.63 3.65 1.66 0.1035 0.0314 -0.02 0.0224 3.42 3 32 First American Interm Govt Bd A 4.62 4.68 3.40 0.1377 0.0498 0.02 0.1578 3.54 3 33 Core I 3.60 3.60 0.97 0.1669 0.2714 0.04 0.0208 3.64 3
34 BB&T Short U.S. Government Bond A 3.20 3.21 1.62 0.0300 0.0104 -0.04 -0.0891 3.15 2 35 Morgan Stanley Limited Dur US Govt Tr 3.12 3.12 1.41 0.0180 0.0056 -0.05 -0.1306 3.10 2

Financial Decisions, Winter 2010, Article 4
9
36 RidgeWorth Short-Term US Treas Sec A 3.46 3.47 1.69 0.0742 0.0224 -0.03 -0.0231 3.30 2 37 Loomis Sayles Ltd Term Govt & Agency A 3.35 3.38 2.12 0.0452 0.0194 -0.03 -0.0332 3.20 2 38 Bernstein U.S. Government Short Dur 2.91 2.92 1.51 -0.0224 -0.0079 -0.06 -0.1608 2.96 2 39 Analytic Short-Term Inc Instl 2.50 2.54 2.99 -0.0490 1.5556 -0.04 -0.1109 2.87 2 40 AIM Limited Maturity Treasury A 3.27 3.28 1.52 0.0452 0.0135 -0.04 -0.0763 3.20 2 41 GE Short-Term Government A 3.23 3.24 1.56 0.0374 0.0144 -0.03 -0.0882 3.17 2 42 LWAS/DFA 2-Yr Government Portfolio 3.40 3.41 1.34 0.0779 0.0423 0.00 -0.0500 3.33 2 43 Pacific Capital US Govt Short F/I A 3.63 3.64 1.35 0.1299 0.0399 0.00 0.0269 3.50 2 44 SM&R Government Bond A 4.26 4.31 3.01 0.1207 0.0417 0.00 0.1089 3.48 2 45 CNI Charter Government Bond N 3.30 3.32 1.93 0.0419 0.0155 -0.04 -0.0489 3.19 2 46 Manor Bond 3.11 3.13 2.27 0.0120 0.0041 -0.07 -0.0721 3.08 2 47 Accessor Mortgage Securities C 2.40 2.44 2.92 -0.0586 -0.0274 -0.12 -0.1391 2.83 2 48 MTB Short Duration Govt Bd A 3.41 3.42 1.34 0.0818 0.0282 -0.02 -0.0417 3.33 2 49 California Investment S/T US Govt Bd K 2.89 2.90 1.55 -0.0263 -0.0077 -0.07 -0.1676 2.95 2
50 AMF Short U.S. Government 1.58 1.61 2.58 -0.1642 -0.1379 -0.15 -0.2404 2.47 1 51 GE Short-Term Government B 2.63 2.64 1.55 -0.0736 -0.0287 -0.08 -0.2344 2.77 1 52 Davis Government Bond A 2.92 2.94 1.74 -0.0166 -0.0071 -0.06 -0.1197 2.98 1 53 Oppenheimer Limited-Term Government A 1.20 1.26 3.39 -0.1556 0.5258 -0.13 -0.2088 2.50 1 54 RiverSource Sh Dur US Govt A 1.94 1.96 1.65 -0.2049 -0.1493 -0.11 -0.3084 2.37 1 55 Performance Short-Term Govt Inc A 3.24 3.25 1.40 0.0427 0.0139 -0.03 -0.0951 3.19 1 56 Cat:Short Government 3.29 3.31 1.84 0.0418 0.0153 -0.04 -0.0549 3.19 1
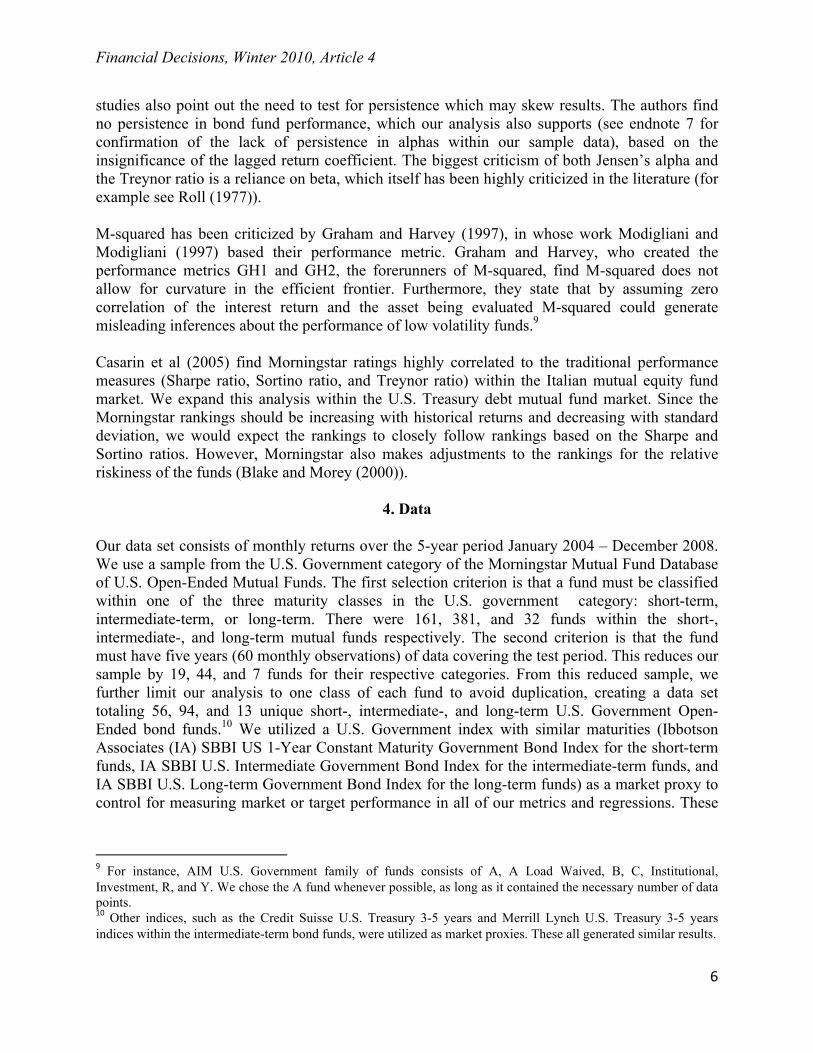
Table 2. Summary Statistics Intermediate-Term Government Bond Mutual Funds
This table shows the descriptive statistics and risk-adjusted return measures for each fund and the index for the 60 months of returns from January 2004-December 2008. For each fund, we report descriptive statistics (geometric average, arithmetic average, and standard deviation in percent) and performance statistics (Sharpe ratio, Treynor ratio, Jensen’s alpha, Sortino ratio, M-squared, and the Morningstar rating).
# Mutual Fund GM AM σ Sharpe Treynor Alpha Sortino M2 Mstar
Average 4.23 4.29 3.63 0.0991 0.1397 -0.03 0.105 4.75 2.8
Index IA SBBI US IT Govt TR USD 5.88 5.99 4.85 0.1761 0.2361 0.00 0.251 6.27
1 Northern Institutional U.S. Trs Idx A 6.19 6.30 4.85 0.1939 0.2784 0.04 0.278 6.31 5 2 DFA Intermediate Govt Fixed-Income I 6.30 6.44 5.47 0.1799 0.2704 0.03 0.261 6.06 5 3 Fidelity Government Income 5.64 5.72 4.12 0.1870 0.2788 0.03 0.257 6.20 5 4 T. Rowe Price U.S. Treasury Interm 5.71 5.84 5.25 0.1544 0.2216 -0.01 0.219 5.62 5 5 Vanguard GNMA 5.19 5.24 3.21 0.1960 0.3318 0.05 0.261 6.35 5 6 Vanguard Interm-Term Treasury 6.34 6.47 5.31 0.1873 0.2737 0.04 0.274 6.19 5 7 Federated Total Return Govt Inst 5.86 5.94 4.10 0.2028 0.2992 0.05 0.285 6.47 5
8 California Investment U.S. Govt Secs 4.74 4.79 3.27 0.1522 0.2340 0.00 0.183 5.62 4 9 American Century Government Bond Inv 5.20 5.26 3.70 0.1727 0.2616 0.02 0.230 5.94 4 10 ISI Total Return U.S. Treasury 6.38 6.54 6.00 0.1685 0.2736 0.04 0.274 5.88 4 11 Dreyfus U.S. Treasury Intermediate Term 5.04 5.10 3.55 0.1666 0.2410 0.00 0.211 5.84 4 12 Dupree Intermediate Govt Bond 5.39 5.45 3.77 0.1843 0.3016 0.04 0.262 6.05 4 13 Federated Income Instl 4.84 4.88 3.17 0.1667 0.2990 0.03 0.200 5.85 4 14 Fidelity Ginnie Mae 4.96 5.00 2.99 0.1879 0.3168 0.04 0.246 6.22 4 15 Fidelity Intermediate Government 5.04 5.09 3.26 0.1800 0.2576 0.01 0.225 6.09 4 16 T. Rowe Price Summit GNMA 4.63 4.67 2.91 0.1604 0.2764 0.02 0.183 5.74 4
Financial Decisions, Winter 2010, Article 4
10
17 SEI Daily Income GNMA A 5.08 5.13 3.30 0.1802 0.3124 0.04 0.253 6.09 4 18 SEI Daily Income Interm-Dur Govt A 5.18 5.26 3.90 0.1628 0.2439 0.01 0.231 5.78 4 19 Federated Mortgage Instl 4.25 4.29 2.93 0.1230 0.2445 0.00 0.106 5.08 4 20 Columbia U.S. Treasury Index A 5.85 5.96 4.79 0.1753 0.2515 0.01 -0.142 2.06 4 21 Schwab GNMA Sel 4.75 4.79 2.97 0.1693 0.2769 0.02 0.164 5.55 4 22 AIG Retirement I Government Securities 5.43 5.52 4.29 0.1652 0.2476 0.01 0.065 4.62 4
23 MainStay Government A 4.63 4.71 3.96 0.1202 0.1958 -0.03 0.136 5.07 3 24 American Funds US Government Sec A 4.48 4.54 3.68 0.1166 0.1876 -0.03 0.131 5.05 3 25 American Century Target Mat 2010 Inv 4.68 4.82 5.57 0.0931 0.1759 -0.05 0.090 4.58 3 26 BNY Mellon Intermediate U.S. Govt Inv 4.60 4.65 3.16 0.1452 0.2104 -0.02 0.150 5.48 3 27 AIM U.S. Government A 4.90 4.95 3.25 0.1653 0.2889 0.03 0.255 5.87 3 28 DFA Five-Year Government I 4.24 4.28 3.18 0.1107 0.1859 -0.03 0.089 4.91 3 29 Federated GNMA Instl 4.64 4.69 3.06 0.1538 0.2640 0.01 0.180 5.63 3 30 Federated Government Income Secs F 3.95 4.00 3.37 0.0820 0.1435 -0.05 0.055 4.40 3 31 SunAmerica GNMA A 5.05 5.11 3.68 0.1613 0.2556 0.01 0.200 5.76 3 32 Franklin U.S. Government Secs A 4.69 4.73 2.98 0.1615 0.2728 0.02 0.192 5.77 3 33 Federated Fund for U.S. Govt Secs A 3.94 3.98 2.91 0.0933 0.1765 -0.03 0.060 4.59 3 34 Pioneer Government Income A 4.16 4.21 3.28 0.1022 0.1660 -0.04 0.092 4.75 3 35 JPMorgan Government Bond A 5.36 5.46 4.49 0.1548 0.2431 0.01 0.201 5.64 3 36 ING GNMA Income A 4.48 4.53 3.18 0.1339 0.2200 -0.01 0.140 5.29 3 37 MFS Government Securities A 4.90 4.96 3.53 0.1556 0.2419 0.00 0.188 5.66 3 38 SunAmerica U.S. Govt Securities A 5.42 5.52 4.65 0.1532 0.2332 0.00 0.202 5.62 3 39 Goldman Sachs Government Income A 4.28 4.34 3.67 0.1016 0.1969 -0.02 0.095 4.74 3 40 Allegiant Government Mortgage A 4.78 4.83 3.22 0.1587 0.2775 0.02 0.190 5.70 3 41 T. Rowe Price GNMA 4.50 4.54 2.84 0.1513 0.2663 0.01 0.163 5.59 3 42 GE Government Securities A 5.02 5.10 4.21 0.1398 0.2033 -0.03 0.171 5.39 3 43 BlackRock Government Inc Inv A 3.75 3.89 5.35 0.0453 0.0752 -0.15 0.028 3.79 3 44 Sentinel Government Securities A 5.18 5.22 3.05 0.2045 0.3305 0.05 0.250 6.51 3 45 Waddell & Reed Adv Government Secs A 4.58 4.64 3.58 0.1274 0.2013 -0.02 0.138 5.16 3 46 USAA GNMA 4.76 4.80 2.87 0.1745 0.2924 0.03 0.215 5.99 3 47 Value Line U.S. Government Securities 4.56 4.62 3.54 0.1275 0.2017 -0.02 0.140 5.18 3 48 RidgeWorth U.S. Government Secs A 5.29 5.35 3.63 0.1807 0.2764 0.03 0.255 6.12 3 49 Wright Current Income Standard 4.18 4.22 2.75 0.1220 0.2196 -0.01 0.115 5.09 3 50 American Century Ginnie Mae Adv 4.42 4.46 3.04 0.1332 0.2364 0.00 0.147 5.29 3 51 DWS GNMA S 4.45 4.49 2.90 0.1435 0.2579 0.01 0.141 5.45 3 52 Nationwide Government Bond B 4.05 4.10 3.39 0.0897 0.1414 -0.06 0.086 4.67 3 53 Maxim U.S. Government Securities 4.57 4.61 3.10 0.1453 0.2353 0.00 0.149 5.48 3 54 BlackRock GNMA Inv A 4.86 4.91 3.14 0.1695 0.2970 0.03 0.223 5.91 3 55 WesMark Government Bond 4.04 4.07 2.82 0.1046 0.1750 -0.03 0.081 4.79 3 56 Wells Fargo Advantage Government Sec A 4.69 4.75 3.61 0.1354 0.2178 -0.01 0.145 5.31 3 57 PIMCO GNMA A 4.60 4.64 2.81 0.1645 0.3218 0.03 0.167 5.78 3 58 SM&R Government Bond A 4.26 4.31 3.01 0.1207 0.1733 -0.04 0.109 5.06 3 59 Schwab GNMA Inv 4.55 4.60 2.99 0.1497 0.2462 0.01 -0.084 2.62 3 60 Access Capital Strategies Cmnty Invst I 4.02 4.07 3.12 0.0950 0.1765 -0.03 0.040 4.27 3
61 Van Kampen Government Securities A 3.05 3.12 3.82 0.0061 0.0133 -0.11 -0.045 3.14 2 62 JHancock Government Income A 4.02 4.09 3.82 0.0786 0.1317 -0.07 0.058 4.34 2 63 BB&T Intermediate U.S. Govt Bond A 4.44 4.50 3.66 0.1143 0.1921 -0.03 0.121 4.95 2

Financial Decisions, Winter 2010, Article 4
11
64 Columbia Federal Securities A 4.70 4.78 3.97 0.1251 0.1969 -0.03 0.142 5.14 2 65 Principal Mortgage Securities A 3.86 3.90 2.74 0.0900 0.1568 -0.03 0.053 4.53 2 66 First Investors Government A 4.23 4.27 2.86 0.1222 0.2118 -0.01 0.119 5.10 2 67 Flex Funds The U.S. Government Bond 3.71 3.78 3.69 0.0580 0.0885 -0.10 0.024 3.99 2 68 Huntington Intermediate Govt Inc Inv A 4.11 4.16 3.50 0.0916 0.1440 -0.06 0.080 4.58 2 69 DWS Strategic Government Securities A 4.11 4.15 3.12 0.1022 0.1985 -0.02 0.079 4.75 2 70 Marshall Government Income Inv 3.42 3.46 3.10 0.0396 0.1340 -0.03 -0.011 3.69 2 71 Dryden Government Income A 3.32 3.37 3.39 0.0282 0.0512 -0.10 -0.020 3.53 2 72 Seligman U.S. Government Securities A 3.59 3.66 3.67 0.0480 0.0762 -0.11 0.013 3.86 2 73 Managers Intermediate Duration Govt 3.49 3.53 2.84 0.0498 0.0980 -0.06 -0.005 3.85 2 74 Target Mortgage Backed Securities 2.62 2.66 2.93 -0.0381 -0.0828 -0.12 -0.113 2.42 2 75 BlackRock Interm Govt Inv A 3.72 3.75 2.67 0.0766 0.1231 -0.05 0.030 4.31 2 76 Van Kampen U.S. Mortgage A 2.81 2.85 2.96 -0.0181 -0.0509 -0.08 -0.085 2.74 2 77 Morgan Stanley U.S. Govt Secs A 2.67 2.75 4.12 -0.0199 -0.0458 -0.14 -0.076 2.69 2 78 JPMorgan Mortgage-Backed Securities A 3.89 3.93 2.90 0.0886 0.1511 -0.04 0.052 4.50 2 79 UBS PACE Govt Secs Fix-Income A 3.93 3.97 2.98 0.0905 0.1903 -0.02 0.055 4.54 2 80 Hartford U.S. Government Securities A 3.27 3.32 3.23 0.0246 0.0380 -0.12 -0.030 3.45 2
81 First American U.S. Government Mtg A 1.91 1.95 2.82 -0.1142 -0.5193 -0.13 -0.187 1.28 1 82 AMF U.S. Government Mortgage 1.79 1.87 4.20 -0.0807 -0.1764 -0.22 -0.152 1.74 1 83 Pacific Advisors Government Secs A 1.53 1.55 2.18 -0.2056 -1.0834 -0.15 -0.288 -0.13 1 84 Legg Mason Partners Govt Securities A 3.04 3.08 3.06 0.0042 0.0088 -0.09 -0.059 3.11 1 85 Oppenheimer U.S. Government A 2.89 2.99 4.64 -0.0029 -0.0128 -0.07 -0.048 2.99 1 86 Putnam American Government Income A 2.75 2.87 4.89 -0.0101 -0.0318 -0.12 -0.058 2.87 1 87 Putnam U.S. Government Income A 2.25 2.36 4.99 -0.0392 -0.3304 -0.09 -0.091 2.40 1 88 Evergreen U.S. Government A 2.66 2.71 3.17 -0.0305 -0.0585 -0.14 -0.097 2.55 1 89 Morgan Stanley Mortgage Securities A 1.12 1.19 3.81 -0.1407 -0.6146 -0.21 -0.196 0.77 1 90 Principal Government & H/Q Bond J 1.79 1.84 3.21 -0.1079 -0.2866 -0.18 0.242 6.00 1 91 RiverSource U.S. Govt Mortgage A 2.45 2.48 2.62 -0.0628 -0.2179 -0.09 0.198 5.88 1 92 Goldman Sachs U.S. Mortgages A 2.65 2.71 3.57 -0.0265 -0.1005 -0.09 -0.158 1.74 1 93 JHT U.S. Government Sec Trust Series I 2.10 2.73 11.61 -0.0076 -0.0598 -0.12 0.200 5.74 1 94 Cat:Intermediate Government 3.81 3.86 3.17 0.0741 0.1241 -0.06 0.233 5.99 1

Financial Decisions, Winter 2010, Article 4
12
Table 3. Summary Statistics Long-Term Government Bond Mutual Funds This table shows the descriptive statistics and risk-adjusted return measures for each fund and the index for the 60 months of returns from January 2004-December 2008. For each fund, we report descriptive statistics (geometric average, arithmetic average, and standard deviation in percent) and performance statistics (Sharpe ratio, Treynor ratio, Jensen’s alpha, Sortino ratio, M-squared, and the Morningstar rating).
# Mutual Fund GM AM σ Sharpe Treynor Alpha Sortino M2 Mstar
Average 9.60 10.38 13.08 0.16 0.54 -0.07 0.00 9.65 2.69
Index IA SBBI US LT Govt TR USD 10.36 10.98 12.02 0.1959 0.6225 0.00 0.0384 10.98
1 American Century Target Mat 2015 Inv 7.73 8.07 8.70 0.1695 0.5873 -0.02 -0.0832 9.87 5
2 Vanguard Long-Term U.S. Treasury 9.23 9.70 10.31 0.1902 0.6090 -0.01 -0.0134 10.75 4
3 American Century Target Mat 2020 Inv 9.75 10.58 13.79 0.1626 0.5339 -0.10 0.0181 9.57 3 4 Dreyfus U.S. Treasury Long-Term 8.32 8.77 10.17 0.1657 0.5398 -0.07 -0.0555 9.72 3 5 Federated U.S. Government Bond 8.55 9.03 10.48 0.1678 0.5450 -0.07 -0.0421 9.81 3 6 T. Rowe Price U.S. Treasury Long-Term 8.85 9.30 10.14 0.1815 0.5829 -0.03 -0.0319 10.39 3 7 Wasatch-Hoisington U.S. Treasury 13.00 14.02 15.73 0.2100 0.6766 0.07 0.1318 11.57 3 8 PIMCO Long-Term U.S. Government A 6.71 7.16 9.97 0.1208 0.3998 -0.18 -0.1151 7.87 3
9 Rydex Govt Long Bond 1.2x Strategy Inv 13.73 15.21 19.27 0.1916 0.6218 0.00 0.1472 10.79 2
10 American Century Target Mat 2025 Inv 12.75 14.07 17.92 0.1860 0.6036 -0.03 0.1096 10.54 2 11 PIMCO Real Return Asset Instl 3.88 4.62 12.45 0.0369 0.1838 -0.30 -0.1510 4.48 2
12 ProFunds U.S. Government Plus Inv 13.25 14.75 19.31 0.1836 0.5992 -0.04 0.1305 10.45 1 13 Cat:Long Government 9.06 9.67 11.83 0.1652 0.5313 -0.09 -0.0134 9.70 1
5. Methodology and Results The first performance metric consider is the Sharpe ratio (SR). Our market proxy indices are the IA SBBI US 1-YR Constant Maturity, the IT Government, and the LT Government Indices for the short-, intermediate-, and long-term fund categories respectively. Note that SR in equation
(1) is technically , an estimated value. In order to compute the ratio, we must first estimate the population mean and standard deviation of the fund’s returns. We also compute the sample mean of the monthly risk-free returns, as this too is a random variable. We utilize the 30-day Treasury Bill returns as a proxy for a risk-free security within all of the security classes.12 The expected returns are based on the historical returns over our five-year test period. The expected return for each mutual fund minus the risk free rate is also called the portfolio’s risk premium since it is the mean expected return of the monthly differences between the fund’s returns and that of our risk free proxy. As pointed out in footnote 6, the standard deviation utilized in the denominator of the Sharpe ratio is typically defined as the standard deviation of the fund’s returns. Our second and third performance measures, Treynor ratio (TR) and Jensen’s alpha (α), utilize the same benchmark index proxies as the Sharpe ratio (i.e., the IA SBBI U.S. 1-Year Constant Maturity Index, the Intermediate Term Government Index, and the Long Term Government Index, respectively for the short-, intermediate-, and the long-term maturity funds). Jensen’s
12We used Kendall’s Tau because of the small sample size. The results from the Fisher exact test using Spearman rank correlations were similar.

Financial Decisions, Winter 2010, Article 4
13
alpha is utilized to test the null hypothesis that alpha is equal to 0 (i.e., H0: α 0), meaning that the manager is not contributing a risk-adjusted return over that of its corresponding index. By definition, the alpha for the index proxy is defined as zero. Generally, we would expect to reject the null hypothesis if an active manager has risk-adjusted performance that is statistically significantly different from the benchmark. Note that a negative alpha indicates underperformance, while a positive alpha indicates outperformance when compared to the index. Given that our generated Sharpe and Treynor ratios are generally greater than their market proxies within the Morningstar categories of 5- and 4-stars, as shown in Tables 1, 2, and 3, we would expect to reject this hypothesis for funds in these two categories as well. As noted in Blake and Morey (2000), the Sortino ratio is the only performance value that incorporates downside risk. Therefore, since Morningstar’s risk-adjusted score also incorporates a downside risk element, we would expect significant correlation between the two measures. In Tables 1, 2, and 3, we can reject the null hypothesis of α = 0 outlined under the section describing Jenson’s alpha for 51 of the 56 short-term funds; 87 of the 94 intermediate-term funds; and 12 of the 13 long-term funds. Of those where the null is rejected, alpha is generally small and negative (37, 55, and 11 funds respectively for the short, intermediate, and long-term fund categories respectively), generating results similar to our Treynor ratio analysis. The funds showing positive alphas (14, 32, and 1 funds respectively for the short, intermediate, and long-term fund categories respectively), indicate that their managers are adding value through bond picking skill. The results in Tables 1 through 3 show consistency between the Treynor ratio and Jensen’s alpha, which is to be expected since both performance measures rely on beta as a proxy for the fund’s systematic risk. The results are also similar to those of Blake, et al (1993), who found an average negative alpha and that significant alphas were largely negative within their sample. These results are not consistent with results from the Sharpe ratio, Sortino ratio, or M-square analyses, since these performance measures rely on a different set of performance criteria versus the systematic risk measure used in both the Treynor ratio and Jensen’s alpha. In general, the literature has found negative alphas problematic, as they should indicate that manager activity is actually detracting from performance. Some researchers (Philpot, et al (1998)) have related fund expenses with underperformance. Others (Ferson and Schadt (1996); Ferson, et al (2006)) have suggested that a model of performance should be conditional on publicly available information (macroeconomic variables, e.g.). Furthermore, they have shown that regressing excess fund return on the benchmark index and the conditioning variables solves the problem of negative alpha in measuring equity fund performance. Since many investors look at rank in selecting mutual funds, we present Kendall’s Tau correlations and test statistics in Table 4. The fund rank correlations for short- and intermediate-term funds are all statistically significantly different from zero, as measured by Kendall’s Tau. For the short-term funds, the ranks based on the Morningstar rating are consistent with the rankings based on the other measures in 52 to 68 percent of the pairs. For the intermediate funds, rankings were consistent for 56 to 75 percent. For the long-term funds, none of the rankings between the Morningstar rating and the other metrics are statistically significant.

Financial Decisions, Winter 2010, Article 4
14
Table 4. Rank correlations of risk-adjusted return measures
Kendall’s Tau correlations between measures. Significance is based on p-value of Kendall’s Tau. Short-term Government Bond Mutual Funds
Sharpe Treynor Alpha Sortino Msq Mstar
Sharpe 1.0000
Treynor 0.7442*** 1.0000
Alpha 0.8426*** 0.7975*** 1.0000
Sortino 0.7931*** 0.6732*** 0.7443*** 1.0000
Msq 0.9902*** 0.7558*** 0.8491*** 0.8012*** 1.0000
Mstar 0.6484*** 0.5151*** 0.6243*** 0.6824*** 0.6524*** 1.0000
Intermediate-term Government Bond Mutual Funds Sharpe Treynor Alpha Sortino Msq Mstar
Sharpe 1.0000
Treynor 0.8700*** 1.0000
Alpha 0.8537*** 0.9007*** 1.0000
Sortino 0.7290*** 0.6527*** 0.6530*** 1.0000
Msq 0.7874*** 0.6952*** 0.6856*** 0.9177*** 1.0000
Mstar 0.7539*** 0.6966*** 0.6981*** 0.5727*** 0.5587*** 1.0000
Long-term Government Bond Mutual Funds Sharpe Treynor Alpha Sortino Msq Mstar
Sharpe 1.0000
Treynor 0.9487*** 1.0000
Alpha 0.8832*** 0.8832*** 1.0000
Sortino 0.5807*** 0.5807*** 0.4575** 1.0000
Msq 1.0000*** 0.9487*** 0.8832*** 0.5807*** 1.0000
Mstar 0.0737 0.1327 0.2091 -0.2671 0.0737 1.0000
*** Significant at the 0.01 level; ** significant at the 0.05 level; * significant at the 0.10 level. As Tables 5, 6, and 7 confirm, the funds ranked highest by Morningstar are generally above the median when ranked by the Sharpe ratio, while the lowest-ranked generally fall below the median. This is largely true for the intermediate funds as well, but some funds with a Morningstar ranking of four may be ranked in the second, third, or even bottom quartile when ranked by Sharpe ratios. The Sharpe rankings are largely consistent with what we would expect based on Winston’s (2005) Morningstar formulation. However, given Morningstar’s adjustments for downside risk, the rating results are less consistent with the Sortino measure than expected. The Table 4 rank correlations between the Sortino and Morningstar measures for the short-term funds are consistent for the highest percentage (68%) of funds for any measure, but quite low (57%) for the intermediate funds. Of the short-term funds in Table 5 with the highest Sortino ranks, two (including the highest-ranked fund) have a Morningstar rating of three, and all but one of the lowest-ranked funds have a rating of one or two stars. The middle quartiles are a more

Financial Decisions, Winter 2010, Article 4
15
mixed result. The intermediate funds in Table 6 with the highest and lowest Morningstar ratings fall largely in the top and bottom quartile, respectively, but several funds with a rating of four fall in the middle and lowest quartiles. While the Morningstar ratings appear to provide a good general guide, they are far from a flawless benchmark for generic government funds.
Table 5. Rankings of Short-Term Government Mutual Funds by Return Metrics This table shows the rankings of the funds by descriptive statistics (geometric average, arithmetic average, and standard deviation in percents) and performance statistics (Sharpe ratio, Treynor ratio, Jensen’s alpha, Sortino ratio, M-squared, and the Morningstar rating).
# Mutual Fund GM AM σ Sharpe Treynor Alpha Sortino M-Sqr Mstar
1 Payden U.S. Government 11 11 40 11 16 14 11 11 5 2 Sit U.S. Government Securities 5 7 31 1 4 1 3 2 5 3 Vanguard Short-Term Federal 4 4 34 2 6 4 2 1 5
4 Northern Institutional U.S. Gov Sec A 7 8 43 10 10 8 7 10 4 5 Fidelity Instl Shrt-Interm Govt 9 10 37 9 9 7 8 9 4 6 Northern U.S. Government 6 5 55 18 21 20 12 17 4 7 Eaton Vance Government Obligations C 19 19 48 33 28 27 18 32 4 8 State Farm Interim 3 3 41 7 8 6 6 6 4 9 SEI Daily Income Short-Duration Govt A 25 25 15 17 22 19 26 18 4 10 Vanguard Short-Term Treasury 12 12 32 6 12 9 9 7 4 11 Goldman Sachs Short Dur Govt A 13 13 26 3 7 5 4 3 4 12 Federated U.S. Govt 1-3 Yr Y 14 14 23 5 11 11 10 4 4 13 Federated U.S. Govt 2-5 YR K 8 6 56 19 23 25 14 19 4 14 Pacific Capital Hi Grd Shrt/Interm A LW 36 34 38 37 39 42 31 37 4
15 Commerce Shrt-Term Government Instl 28 28 30 31 34 32 28 33 3 16 Homestead Short-Term Government 32 32 3 25 29 24 35 25 3 17 Dreyfus Short-Intermediate Government 29 29 13 24 32 30 29 24 3 18 Eaton Vance Government Obligations A 2 2 49 8 5 3 1 8 3 19 Franklin Limited Maturity U.S. Govt A 17 17 39 23 25 22 17 22 3 20 Madison Mosaic Government 15 15 46 21 27 26 15 21 3 21 Thornburg Limited-Term U.S. Govt A 18 18 47 26 30 28 19 26 3 22 RidgeWorth Limited-Term Federal A 20 20 44 29 19 17 20 27 3 23 Trust for Credit Unions Short Duration 33 33 20 35 24 21 32 35 3 24 American Century Short-Term Govt Inv 31 31 14 28 33 31 33 29 3 25 Victory Fund For Income A 16 16 35 16 14 12 16 16 3 26 JPMorgan Treasury & Agency A 21 21 29 22 26 23 21 23 3 27 Northern Short-Intermediate U.S. Govt 22 22 42 30 36 35 22 28 3 28 Wells Fargo Advantage Sh Dur Govt Bd A 45 45 10 44 46 40 45 45 3 29 Calvert Short-Term Government I 38 38 2 36 37 34 40 36 3 30 Sentinel Short Maturity Govt A 26 26 4 14 15 13 27 15 3 31 BNY Mellon S-T U.S. Govt Secs Inv 24 23 22 20 31 29 24 20 3 32 First American Interm Govt Bd A 1 1 54 12 13 10 5 12 3 33 Core I 27 27 1 4 3 2 25 5 3
34 BB&T Short U.S. Government Bond A 44 44 19 45 47 46 44 44 2 35 Morgan Stanley Limited Dur US Govt Tr 46 47 9 46 48 47 49 46 2

Financial Decisions, Winter 2010, Article 4
16
36 RidgeWorth Short-Term US Treas Sec A 30 30 24 34 38 36 30 34 2 37 Loomis Sayles Ltd Term Govt & Agency A 37 37 33 38 40 37 34 38 2 38 Bernstein U.S. Government Short Dur 49 49 11 49 52 49 51 49 2 38 Analytic Short-Term Inc Instl 52 52 51 51 1 41 47 51 2 40 AIM Limited Maturity Treasury A 41 41 12 39 45 45 42 39 2 41 GE Short-Term Government A 43 43 18 43 43 38 43 43 2 42 LWAS/DFA 2-Yr Government Portfolio 35 36 6 32 17 15 38 31 2 43 Pacific Capital US Govt Short F/I A 23 24 7 13 20 18 23 13 2 44 SM&R Government Bond A 10 9 52 15 18 16 13 14 2 45 CNI Charter Government Bond N 39 39 28 41 41 43 37 40 2 46 Manor Bond 47 46 36 47 49 50 41 47 2 47 Accessor Mortgage Securities C 53 53 50 52 53 54 50 52 2 48 MTB Short Duration Govt Bd A 34 35 5 27 35 33 36 30 2 49 California Investment S/T US Govt Bd K 50 50 16 50 51 51 52 50 2
50 AMF Short U.S. Government 55 55 45 55 55 56 55 55 1 51 GE Short-Term Government B 51 51 17 53 54 52 54 53 1 52 Davis Government Bond A 48 48 25 48 50 48 48 48 1 53 Oppenheimer Limited-Term Govt A 56 56 53 54 2 55 53 54 1 54 RiverSource Sh Dur US Govt A 54 54 21 56 56 53 56 56 1 55 Performance Short-Term Govt Inc A 42 42 8 40 44 39 46 42 1 56 Cat:Short Government 40 40 27 42 42 44 39 41 1
Table 6. Rankings for Intermediate-Term Government Mutual Funds by Return Metrics
This table shows the rankings of the funds by descriptive statistics (geometric average, arithmetic average, and standard deviation in percents) and performance statistics (Sharpe ratio, Treynor ratio, Jensen’s alpha, Sortino ratio, M-squared, and the Morningstar rating).
# Mutual Fund GM AM σ Sharpe Treynor Alpha Sortino M2 Mstar
1 Northern Institutional U.S. Trs Idx A 4 4 10 4 42 4 2 4 5 2 DFA Intermediate Govt Fixed-Income I 3 3 4 12 62 10 6 11 5 3 Fidelity Government Income 8 8 18 7 58 10 8 6 5 4 T. Rowe Price U.S. Treasury Interm 7 7 7 31 35 40 20 33 5 5 Vanguard GNMA 15 16 54 3 89 1 7 3 5 6 Vanguard Interm-Term Treasury 2 2 6 6 49 4 3 7 5 7 Federated Total Return Govt Inst 5 6 20 2 55 1 1 2 5
8 California Investment U.S. Govt Secs 31 32 48 34 45 33 33 35 4 9 American Century Government Bond Inv 14 14 28 15 59 18 17 16 4 10 ISI Total Return U.S. Treasury 1 1 2 18 54 4 4 18 4 11 Dreyfus U.S. Treasury Intermediate Term 20 20 39 20 31 33 22 22 4 12 Dupree Intermediate Govt Bond 11 12 27 8 70 4 5 12 4 13 Federated Income Instl 27 27 57 19 92 10 27 21 4 14 Fidelity Ginnie Mae 23 23 71 5 82 4 13 5 4 15 Fidelity Intermediate Government 21 22 49 11 39 23 18 10 4 16 T. Rowe Price Summit GNMA 38 38 80 27 90 18 32 28 4 17 SEI Daily Income GNMA A 18 18 46 10 91 4 11 9 4 18 SEI Daily Income Interm-Dur Govt A 17 15 23 24 44 23 16 23 4 19 Federated Mortgage Instl 53 53 77 47 7 33 54 50 4

Financial Decisions, Winter 2010, Article 4
17
20 Columbia U.S. Treasury Index A 6 5 11 13 37 23 89 89 4 21 Schwab GNMA Sel 30 31 75 17 88 18 37 37 4 22 AIG Retirement I Government Securities 9 9 15 22 47 23 63 61 4
23 MainStay Government A 37 36 22 51 68 51 48 51 3 24 American Funds US Government Sec A 46 46 30 52 57 51 49 53 3 25 American Century Target Mat 2010 Inv 35 29 3 61 33 65 57 63 3 26 BNY Mellon Intermediate U.S. Govt Inv 39 39 60 38 36 45 39 38 3 27 AIM U.S. Government A 24 25 50 21 56 10 9 20 3 28 DFA Five-Year Government I 54 54 56 54 28 51 58 55 3 29 Federated GNMA Instl 36 37 66 32 80 23 34 32 3 30 Federated Government Income Secs F 64 64 45 67 94 65 67 68 3 31 SunAmerica GNMA A 19 19 31 26 65 23 26 26 3 32 Franklin U.S. Government Secs A 33 35 74 25 85 18 29 25 3 33 Federated Fund for U.S. Govt Secs A 65 65 79 60 6 51 64 62 3 34 Pioneer Government Income A 57 57 47 57 53 62 56 57 3 35 JPMorgan Government Bond A 12 11 14 30 63 23 24 31 3 36 ING GNMA Income A 47 47 55 42 76 40 45 44 3 37 MFS Government Securities A 25 24 41 29 66 33 31 30 3 38 SunAmerica U.S. Govt Securities A 10 10 12 33 46 33 23 34 3 39 Goldman Sachs Government Income A 51 51 33 58 4 45 55 59 3 40 Allegiant Government Mortgage A 28 28 52 28 86 18 30 29 3 41 T. Rowe Price GNMA 45 45 85 35 93 23 38 36 3 42 GE Government Securities A 22 21 16 40 34 51 35 41 3 43 BlackRock Government Inc Inv A 70 69 5 74 29 90 72 75 3 44 Sentinel Government Securities A 16 17 68 1 73 1 12 1 3 45 Waddell & Reed Adv Government Secs A 41 41 37 45 51 45 47 46 3 46 USAA GNMA 29 30 83 14 77 10 21 15 3 47 Value Line U.S. Government Securities 43 42 40 44 64 45 46 45 3 48 RidgeWorth U.S. Government Secs A 13 13 35 9 38 10 10 8 3 49 Wright Current Income Standard 56 56 90 49 83 40 52 49 3 50 American Century Ginnie Mae Adv 50 50 69 43 78 33 41 43 3 51 DWS GNMA S 48 49 82 39 1 23 44 40 3 52 Nationwide Government Bond B 60 60 44 65 40 68 59 60 3 53 Maxim U.S. Government Securities 42 43 65 37 74 33 40 39 3 54 BlackRock GNMA Inv A 26 26 61 16 79 10 19 17 3 55 WesMark Government Bond 61 62 87 55 61 51 60 56 3
56 Wells Fargo Advantage Government Sec A 34 34 36 41 72 40 42 42 3
57 PIMCO GNMA A 40 40 89 23 5 10 36 24 3 58 SM&R Government Bond A 52 52 70 50 30 62 53 52 3 59 Schwab GNMA Inv 44 44 72 36 87 23 84 85 3 60 Access Capital Strategies Cmnty Invst I 63 63 62 59 3 51 70 71 3
61 Van Kampen Government Securities A 78 78 24 78 14 81 79 79 2 62 JHancock Government Income A 62 61 25 68 75 72 65 69 2 63 BB&T Intermediate U.S. Govt Bond A 49 48 34 53 52 51 50 54 2 64 Columbia Federal Securities A 32 33 21 46 48 51 43 47 2 65 Principal Mortgage Securities A 68 68 91 64 67 51 68 66 2

Financial Decisions, Winter 2010, Article 4
18
66 First Investors Government A 55 55 84 48 84 40 51 48 2 67 Flex Funds The U.S. Government Bond 72 71 29 71 26 79 73 72 2 68 Huntington Intermediate Govt Inc Inv A 58 58 42 62 43 68 61 64 2 69 DWS Strategic Government Securities A 59 59 63 56 8 45 62 58 2 70 Marshall Government Income Inv 75 75 64 75 12 51 76 76 2 71 Dryden Government Income A 76 76 43 76 11 79 77 77 2 72 Seligman U.S. Government Securities A 73 73 32 73 23 81 74 73 2 73 Managers Intermediate Duration Govt 74 74 86 72 9 68 75 74 2 74 Target Mortgage Backed Securities 86 87 78 87 69 83 88 87 2 75 BlackRock Interm Govt Inv A 71 72 92 69 50 65 71 70 2 76 Van Kampen U.S. Mortgage A 81 82 76 83 22 74 85 83 2 77 Morgan Stanley U.S. Govt Secs A 83 83 19 84 25 88 83 84 2 78 JPMorgan Mortgage-Backed Securities A 67 67 81 66 60 62 69 67 2 79 UBS PACE Govt Secs Fix-Income A 66 66 73 63 10 45 66 65 2 80 Hartford U.S. Government Securities A 77 77 51 77 20 83 78 78 2
81 First American U.S. Government Mtg A 90 90 88 92 27 87 92 92 1 82 AMF U.S. Government Mortgage 91 91 17 90 2 94 90 90 1 83 Pacific Advisors Government Secs A 93 93 94 94 32 90 94 94 1 84 Legg Mason Partners Govt Securities A 79 79 67 79 13 75 82 80 1 85 Oppenheimer U.S. Government A 80 80 13 80 15 72 80 81 1 86 Putnam American Government Income A 82 81 9 82 16 83 81 82 1 87 Putnam U.S. Government Income A 88 89 8 88 19 75 86 88 1 88 Evergreen U.S. Government A 84 85 59 86 24 88 87 86 1 89 Morgan Stanley Mortgage Securities A 94 94 26 93 71 93 93 93 1 90 Principal Government & H/Q Bond J 92 92 53 91 41 92 14 13 1 91 RiverSource U.S. Govt Mortgage A 87 88 93 89 21 75 28 19 1 92 Goldman Sachs U.S. Mortgages A 85 86 38 85 17 75 91 91 1 93 JHT U.S. Government Sec Trust Series I 89 84 1 81 18 83 25 27 1 94 Cat:Intermediate Government 69 70 58 70 81 68 15 14 0
Financial Decisions, Winter 2010, Article 4
19
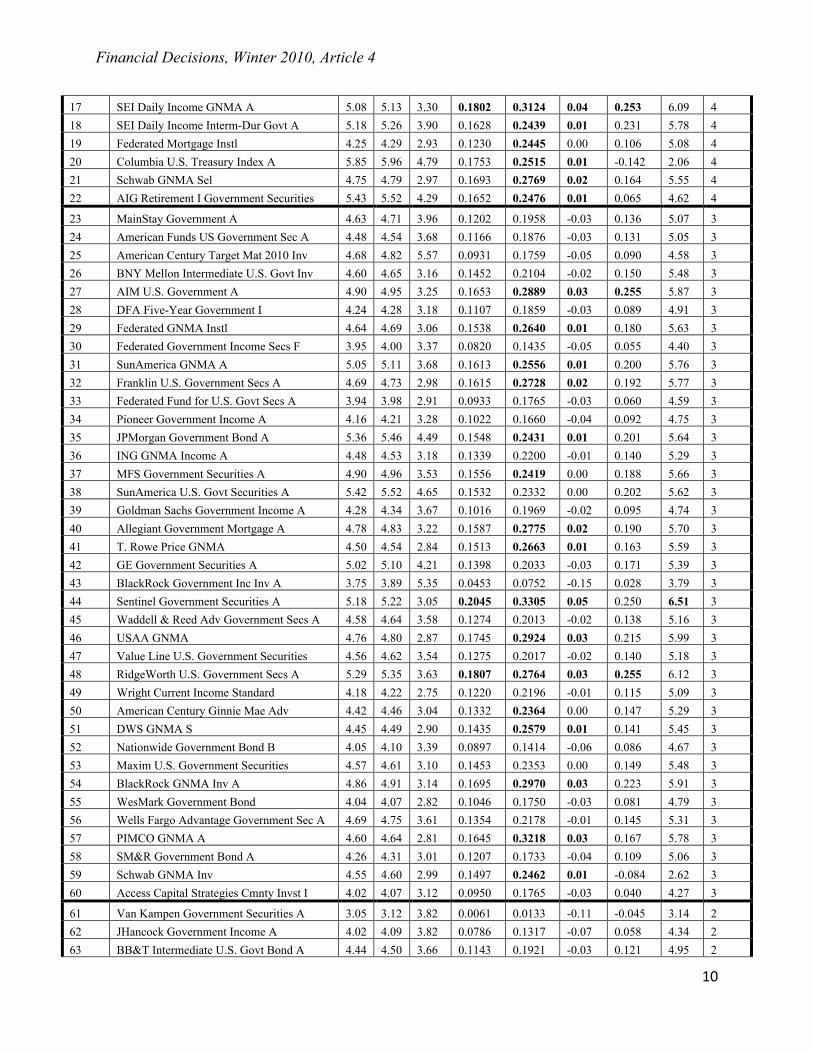
Table 7. Rankings for Long-Term Government Mutual Funds by Return Metrics
This table shows the rankings of the funds by descriptive statistics (geometric average, arithmetic average, and standard deviation in percents) and performance statistics (Sharpe ratio, Treynor ratio, Jensen’s alpha, Sortino ratio, M-squared, and the Morningstar rating).
# Mutual Fund GM AM σ Sharpe Treynor Alpha Sortino M2 Mstar
1 American Century Target Mat 2015 Inv 11 11 1 7 6 4 11 7 5
2 Vanguard Long-Term U.S. Treasury 6 6 5 3 3 3 6 3 4
3 American Century Target Mat 2020 Inv 5 5 9 11 10 11 5 11 3 4 Dreyfus U.S. Treasury Long-Term 10 10 4 9 9 8 10 9 3 5 Federated U.S. Government Bond 9 9 6 8 8 9 9 8 3 6 T. Rowe Price U.S. Treasury Long-Term 8 8 3 6 7 5 8 6 3 7 Wasatch-Hoisington U.S. Treasury 3 3 10 1 1 1 2 1 3 8 PIMCO Long-Term U.S. Government A 12 12 2 12 12 12 12 12 3
9 Rydex Govt Long Bond 1.2x Strategy Inv 1 1 12 2 2 2 1 2 2 10 American Century Target Mat 2025 Inv 4 4 11 4 4 6 4 4 2 11 PIMCO Real Return Asset Instl 13 13 8 13 13 13 13 13 2
12 ProFunds U.S. Government Plus Inv 2 2 13 5 5 7 3 5 1 13 Cat:Long Government 7 7 7 10 11 10 7 10 1
A cross-sectional regression of the Morningstar ratings on the different return measures, similar to Blake and Morey (2000), shows a high level of explanatory power within both the short- and intermediate-term samples. The regression equation is
(7) where
= Return metric i = dummy variable for a 1-star rating = dummy variable for a 2-star rating = dummy variable for a 3-star rating = dummy variable for a 4-star rating.
The 5-star rating is the base case. Within the short-term regressions, the adjusted R-squared ranges from 53% for Jensen’s alpha to 64% for the Sharpe ratio, but the Treynor ratio seems to be an outlier since the ratings show no explanatory power. The intermediate-term sample shows similar results with the adjusted R-squared ranging from 41% for the M-squared factor up to 76% for the Sharpe ratio. The p-values of the return regressions confirm the observations in the ranked funds: the coefficient for the four-star rating (D4) is not significantly different from zero for all but the short-term funds’ Sortino ratio. The long-term sample shows poor results, but this is primarily due to the small sample size of 13 observations. See Table 8 for the complete summary of the regression analysis.
6. Conclusions This paper compares the risk-adjusted performance metrics to the Morningstar ratings within a sample of generic government bond mutual funds. Our findings confirm that for investors who do not wish to perform a set of complete performance evaluations, the highest levels of the Morningstar ratings (i.e., 5 and 4 stars) give a consistent metric for picking quality funds within

Financial Decisions, Winter 2010, Article 4
20
the U.S. Government Bond mutual fund category. Our results also provide confirmation that investors can reasonably avoid the lowest-rated funds. We also find that the majority of managers in our sample do not in general add value on a risk-adjusted basis using any of our five performance metrics. For instance, under the Sharpe ratio criteria, only 8 of 56 short-term funds outperformed their index. The Treynor ratio and Jensen’s alpha produced similar results, showing only 17 and 14 funds outperforming the index, respectively. The Sortino ratio and M-squared measures also yield comparable conclusions within the three maturity groups. The performance measures are generally highly correlated with the Morningstar ratings, which is further supported by our regression analysis indicating that within the government bond class of mutual funds the highest and lowest Morningstar ratings could be used in place of the performance metrics for investors trying to identify the best and worst performing funds.

Financial Decisions, Winter 2010, Article 4
1
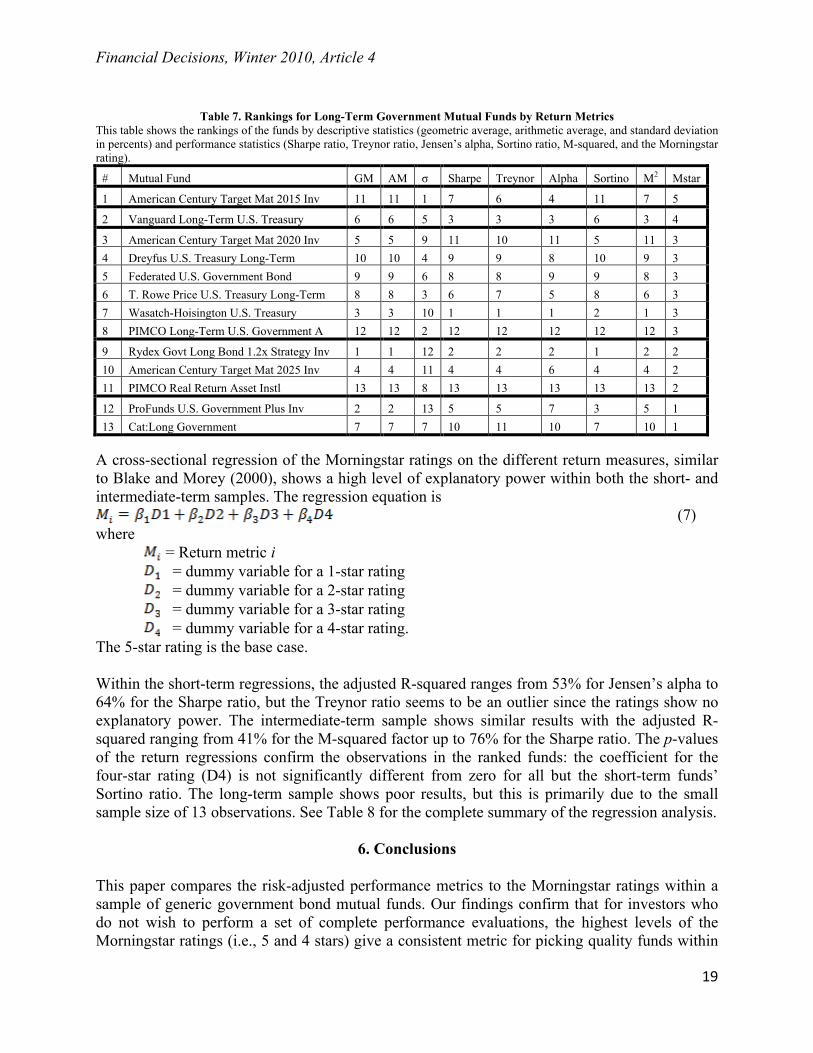
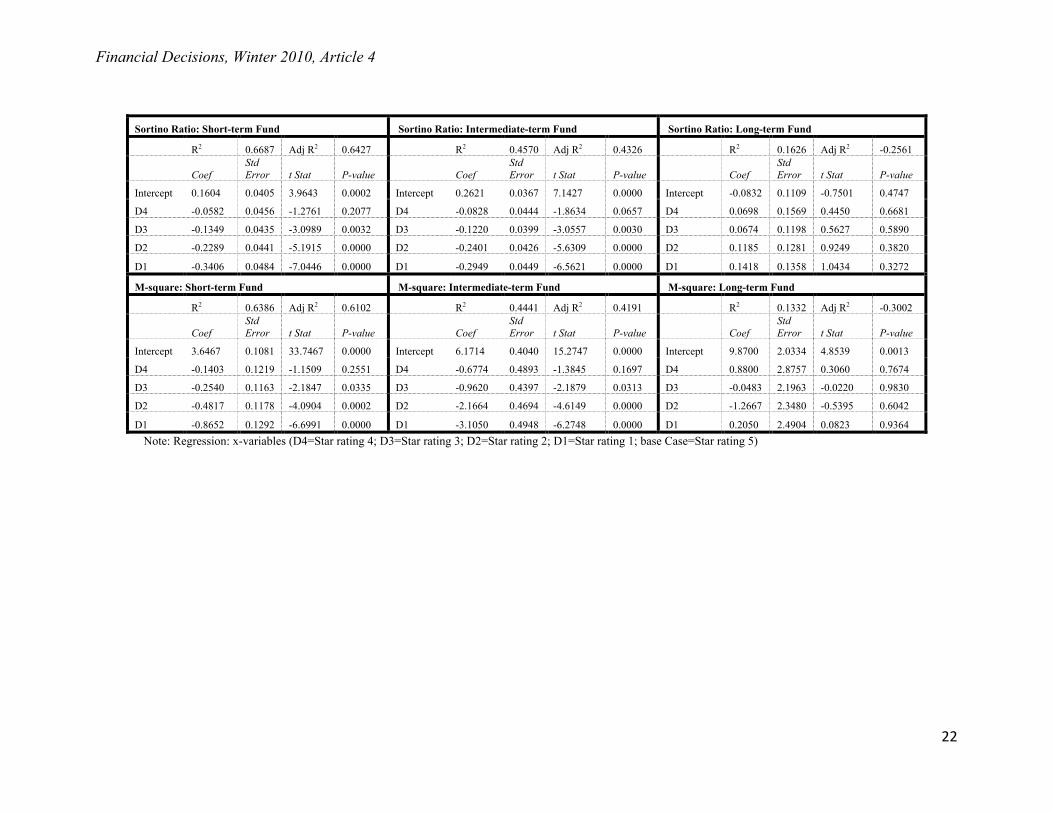
Table 8. Regression Analysis: Performance Measures versus MorningStar Ratings
Sharpe Ratio: Short-term Fund Sharpe Ratio: Intermediate-term Fund Sharpe Ratio: Long-term Fund
R2 0.6332 Adj R2 0.6044 R2 0.7746 Adj R2 0.7645 R2 0.1330 Adj R2 -0.3005
Coef Std Error t Stat P-value Coef
Std Error t Stat P-value Coef
Std Error t Stat P-value
Intercept 0.1670 0.0307 5.4386 0.0000 Intercept 0.1859 0.0157 11.8206 0.0000 Intercept 0.1695 0.0497 3.4092 0.0092
D4 -0.0382 0.0346 -1.1017 0.2758 D4 -0.0182 0.0190 -0.9570 0.3412 D4 0.0207 0.0703 0.2944 0.7759
D3 -0.0694 0.0330 -2.1012 0.0406 D3 -0.0520 0.0171 -3.0401 0.0031 D3 -0.0014 0.0537 -0.0267 0.9794
D2 -0.1321 0.0335 -3.9487 0.0002 D2 -0.1280 0.0183 -7.0052 0.0000 D2 -0.0313 0.0574 -0.5458 0.6001
D1 -0.2428 0.0367 -6.6148 0.0000 D1 -0.2395 0.0193 -12.4342 0.0000 D1 0.0049 0.0609 0.0805 0.9378
Treyner Ratio: Short-term Fund Treyner Ratio: Intermediate-term Fund Treyner Ratio: Long-term Fund
R2 0.0193 Adj R2 -0.0576 R2 0.6289 Adj R2 0.6123 R2 0.1238 Adj R2 -0.3143
Coef Std Error t Stat P-value Coef
Std Error t Stat P-value Coef
Std Error t Stat P-value
Intercept 0.0602 0.1304 0.4615 0.6464 Intercept 0.2791 0.0506 5.5196 0.0000 Intercept 0.5873 0.1437 4.0884 0.0035
D4 -0.0167 0.1471 -0.1139 0.9098 D4 -0.0099 0.0612 -0.1617 0.8719 D4 0.0217 0.2032 0.1068 0.9176
D3 -0.0124 0.1403 -0.0886 0.9297 D3 -0.0559 0.0550 -1.0167 0.3121 D3 -0.0410 0.1552 -0.2640 0.7984
D2 0.0505 0.1421 0.3552 0.7239 D2 -0.1783 0.0588 -3.0350 0.0032 D2 -0.1176 0.1659 -0.7088 0.4986
D1 -0.0270 0.1558 -0.1734 0.8630 D1 -0.5191 0.0619 -8.3806 0.0000 D1 -0.0221 0.1759 -0.1253 0.9034
Jensen’s Alpha: Short-term Fund Jensen’s Alpha: Intermediate-term Fund Jensen’s Alpha: Long-term Fund
R2 0.5670 Adj R2 0.5331 R2 0.6676 Adj R2 0.6527 R2 0.1100 Adj R2 -0.3350
Coef Std Error t Stat P-value Coef
Std Error t Stat P-value Coef
Std Error t Stat P-value
Intercept 0.0300 0.0162 1.8513 0.0699 Intercept 0.0329 0.0136 2.4089 0.0181 Intercept -0.0200 0.1059 -0.1888 0.8550
D4 -0.0282 0.0183 -1.5415 0.1294 D4 -0.0135 0.0165 -0.8187 0.4152 D4 0.0100 0.1498 0.0667 0.9484
D3 -0.0363 0.0174 -2.0827 0.0423 D3 -0.0436 0.0148 -2.9405 0.0042 D3 -0.0433 0.1144 -0.3787 0.7148
D2 -0.0700 0.0177 -3.9640 0.0002 D2 -0.0994 0.0158 -6.2692 0.0000 D2 -0.0900 0.1223 -0.7357 0.4829
D1 -0.1157 0.0194 -5.9744 0.0000 D1 -0.1586 0.0167 -9.4921 0.0000 D1 -0.0450 0.1297 -0.3468 0.7377
Financial Decisions, Winter 2010, Article 4
22
Sortino Ratio: Short-term Fund Sortino Ratio: Intermediate-term Fund Sortino Ratio: Long-term Fund
R2 0.6687 Adj R2 0.6427 R2 0.4570 Adj R2 0.4326 R2 0.1626 Adj R2 -0.2561
Coef Std Error t Stat P-value Coef
Std Error t Stat P-value Coef
Std Error t Stat P-value
Intercept 0.1604 0.0405 3.9643 0.0002 Intercept 0.2621 0.0367 7.1427 0.0000 Intercept -0.0832 0.1109 -0.7501 0.4747
D4 -0.0582 0.0456 -1.2761 0.2077 D4 -0.0828 0.0444 -1.8634 0.0657 D4 0.0698 0.1569 0.4450 0.6681
D3 -0.1349 0.0435 -3.0989 0.0032 D3 -0.1220 0.0399 -3.0557 0.0030 D3 0.0674 0.1198 0.5627 0.5890
D2 -0.2289 0.0441 -5.1915 0.0000 D2 -0.2401 0.0426 -5.6309 0.0000 D2 0.1185 0.1281 0.9249 0.3820
D1 -0.3406 0.0484 -7.0446 0.0000 D1 -0.2949 0.0449 -6.5621 0.0000 D1 0.1418 0.1358 1.0434 0.3272
M-square: Short-term Fund M-square: Intermediate-term Fund M-square: Long-term Fund
R2 0.6386 Adj R2 0.6102 R2 0.4441 Adj R2 0.4191 R2 0.1332 Adj R2 -0.3002
Coef Std Error t Stat P-value Coef
Std Error t Stat P-value Coef
Std Error t Stat P-value
Intercept 3.6467 0.1081 33.7467 0.0000 Intercept 6.1714 0.4040 15.2747 0.0000 Intercept 9.8700 2.0334 4.8539 0.0013
D4 -0.1403 0.1219 -1.1509 0.2551 D4 -0.6774 0.4893 -1.3845 0.1697 D4 0.8800 2.8757 0.3060 0.7674
D3 -0.2540 0.1163 -2.1847 0.0335 D3 -0.9620 0.4397 -2.1879 0.0313 D3 -0.0483 2.1963 -0.0220 0.9830
D2 -0.4817 0.1178 -4.0904 0.0002 D2 -2.1664 0.4694 -4.6149 0.0000 D2 -1.2667 2.3480 -0.5395 0.6042
D1 -0.8652 0.1292 -6.6991 0.0000 D1 -3.1050 0.4948 -6.2748 0.0000 D1 0.2050 2.4904 0.0823 0.9364 Note: Regression: x-variables (D4=Star rating 4; D3=Star rating 3; D2=Star rating 2; D1=Star rating 1; base Case=Star rating 5)

Financial Decisions, Winter 2010, Article 4
1
References Bertrand, Phillipe and Costin Protopopescu. (2008) “The Sensitivity of the Asymptotic Variance
of Performance Measures with Respect to Skewness and Kurtosis.” International Journal of Business 13, 349-360.
Blake, Christopher R., Edwin J. Elton, and Martin J. Gruber. (1993) "The Performance of Bond
Mutual Funds." Journal of Business 66, 371-403. Blake, Christopher R. and Matthew R. Morey. (2000) “Morningstar Ratings and Mutual Fund
Performance.” Journal of Financial and Quantitative Analysis 35(3), 451-483. Casarin, Roberto, Marco Lazzarin, Loriana Pelizzon, and Domenico Sartore. (2005) “Relative
Benchmark Rating and Persistence Analysis: Evidence from the Italian Equity Funds.” European Journal of Finance 11(4), 297-308.
Detzler, Miranda Lam. (1999) "The Performance of Global Bond Mutual Funds." Journal of
Banking and Finance 23, 1195-1217. Ferson, Wayne E., and Rudi W. Schadt. (1996) "Measuring Fund Strategy and Performance in
Changing Economic Conditions." Journal of Finance 51, 425-461. Ferson, Wayne E., Tyler R. Henry and Darren J. Kisgen. (2006) "Evaluating Government Bond
Funds with Stochastic Discount Factors." The Review of Financial Studies 19, 423-455. Graham, John R. and Campbell R. Harvey. (1997) “Grading the Performance of Market Timing
Newsletters.” Financial Analysts Journal 53(Nov/Dec), 54-66. Jensen, Michael C. (1968) "The Performance of Mutual Funds in the Period from 1945-1964."
Journal o f Finance 23, 389-416. Lo, Andrew. (2002) "The Statistics of Sharpe Ratios." Financial Analysts’ Journal 58. 36-52. Modigliani, Franco and Leah Modigliani. (1997) “Risk-Adjusted Performance.” Journal of
Portfolio Management, Winter, 45-54. Pedersen, Christian S. and Stephen E. Satchell. (2002) “On the Foundation of Performance
Measures under Asymmetric Returns.” Quantitative Finance 2(3), 217-223. Philpot, James, Douglas Hearth, James N. Rimbey, and Craig T. Shulman. (1998) "Active
Management, Fund Size, and Bond Mutual Fund Returns." Financial Review 33, 115-125.
Roll, Richard (1977) “A Critique of the Asset Pricing Theory’s Tests Part I: On Past and
Potential Testability of the Theory.” Journal of Financial Economics 4(2), 129-176. Sharpe, William F. (1994) "The Sharpe Ratio." Journal of Portfolio Management 21, 49-58.
Financial Decisions, Winter 2010, Article 4
24
Sharpe, William F. (1966) “Mutual Fund Performance.” Journal of Business 39, 119-138. Sortino, Frank A. and Lee N. Price (1994) “Performance Measurement in a Downside Risk
Framework.” Journal of Investing 3, 59-64. Treynor, Jack, L. (1965) “How to Rate Management Investment Funds.” Harvard Business
Review 43, 63-75. Winston, Kenneth (2005) "Performance Measurement Manipulation." Journal of Portfolio Management 31, 101-108.