morningstar ratings and mutual fund manager turnover
TRANSCRIPT

Morningstar Ratings and Mutual Fund Manager Turnover
John M. Barron Krannert Graduate School of Management
Purdue University West Lafayette, IN 47907 email: [email protected]
Jinlan Ni
College of Business Administration University of Nebraska at Omaha, Omaha, NE 68182
Tel: (402)554-2549 Email: [email protected]
Abstract
This paper investigates the effect of Morningstar ratings on mutual fund manager replacement.
We find that not only do Morningstar ratings affect the likelihood fund managers are replaced,
but that Morningstar ratings are better predictors of manager replacement than alternative
measures of fund performance. This finding is consistent with the finding that mutual fund
investors respond to the Morningstar measure of performance. We also examine the changes in
the management structure of funds that are made in conjunction with manager replacement in
response to poor performance.
JEL Classification: G23, L14
Keywords: Mutual Fund; Morningstar Ratings; Manager Turnover
We thank Jason Abrevaya, John Carlson, Christian Dahl, David Hummels, and William Novshek for their helpful
suggestions. We also thank workshop participants at Purdue University, University of Nebraska at Omaha, and the
West Economic Association International 78th Annual Conference for their suggestions and comments. Finally, we
especially thank a referee for numerous helpful comments and suggestions. Jinlan Ni is the corresponding author.

1
1. Introduction
Morningstar Inc. offers mutual fund ratings to help investors identify the best funds in terms
of past performance. Investors use these ratings, and this creates a direct link between
Morningstar ratings and the net flow of funds into a mutual fund portfolio. As mutual fund fee
revenues typically increase with the size of assets under management, it follows that a key
measure of a fund manager's performance should be the fund's Morningstar ratings. Yet the role
of Morningstar ratings on the decision of whether or not to replace a fund manager has not yet
been investigated.
The purpose of this paper is to contrast the role of Morningstar ratings in determining
manager replacement with four alternative fund performance measures that have been proposed.
Starting with the entire set of equity mutual funds in Morningstar Inc.'s internal dataset for the
period 1994 to 2010, our analysis extends existing findings in several ways.1 First, we establish
that the Morningstar performance rankings are a key determinant of fund manager turnover. To
the best of our knowledge, ours is the first empirical evidence linking the Morningstar rating
1Note that our analysis relies on a more extensive dataset than other studies. For instance, Khorana (1996) examines
339 funds over the period 1979 to 1992, for a total of 2,528 funds drawn from several data sources including Lipper
Analytical Services and Morningstar. Chevalier and Ellison (1999) consider 1,320 funds over the period 1992 to
1994 drawn from Morningstar data. Lynch and Musto (2003) consider 6,243 funds over the period 1985 to 1995
using data from Micropal and CRSP. Unlike Lynch and Musto (2003), our analysis relies on Morningstar mutual
fund data instead of CRSP mutual fund data. As Elton, Gruber, and Blake (2001) have shown, Morningstar data and
CRSP data on mutual funds do differ, with each having its own biases and errors. We later compare these two dataset
in terms of usefulness in examining manager replacement.

2
system to manager replacement decisions.2 Second, we show that Morningstar ratings are better
predictors of manager replacement than other commonly used performance metrics. Third, we
consider determinants not only of the replacement of a fund manager, but also of changes in the
managerial structure. For cases where the manager is not replaced, we distinguish cases when the
existing manager is joined by others to become a team-managed portfolio. For cases where the
manager is replaced, we distinguish cases when the new management is a management team
rather than a new single manager. Our results regarding management structure changes indicate
no clear evidence that Morningstar ratings influence management structure changes if one adopts
a simple linear specification. Thus converting a single manager structure to a team management
structure appears largely due to considerations other than performance ratings.
The paper is arranged as follows. Section 2 introduces various fund performance measures,
including the Morningstar rating measure. Section 3 provides a detailed account of our dataset,
including the creation of a set of mutual fund portfolios using the Morningstar mutual fund
database. Section 4 investigates the relationships between the performance measures and
management succession, including fund manager replacement. Section 5 establishes the
empirical link between Morningstar ratings and the net flow of funds into a mutual fund portfolio,
confirming for our dataset that investors do use Morningstar ratings. Section 6 considers the
2 Khorana and Nelling (1998) provide evidence that the tenure of a manager at a point in time (June 1995) is lengthier
at funds with higher Morningstar ratings for some types of funds. While this finding is consistent with past manager
turnover being inversely related to past performance and current performance being directly related to past
performance, it could also simply reflect a positive correlation between current Morningstar ratings and the fund's
age given that a manager's tenure is limited by the length of time a fund has existed.

3
effect of Morningstar ratings on fund management type (single manager versus team).
Concluding remarks are contained in section 7.
2. Mutual Fund Performance Measures
Our analysis relies on data obtained from Morningstar for the years 1994 to 2010.3 The
dataset contains data for all equity funds that appeared during the 1994 to 2010 period, including
equity funds that were started or ceased to exist during that period. Below we describe the
procedure for calculating Morningstar ratings for these equity funds, and then consider four
alternative performance measures for these funds that have been proposed.
2.1. Morningstar Category Ratings
A key performance measure for our analysis is the Morningstar category rating. To create
this rating, Morningstar begins by calculating a risk-adjusted return for each fund that equals the
fund's return after accounting for all loads, sales charges, and redemption fees minus a risk
penalty that accounts for variation in the fund's monthly performance.4 Each fund's risk-adjusted
return is then compared to other risk-adjusted returns for funds in the same category. If the fund
scores in the top 10 percent of its category, it receives 5 stars (highest). If it falls in the next 22.5
percent, it receives 4 stars (above average), a place in the middle 35 percent earns 3 stars
(neutral), those in the next 22.5 percent, receive 2 stars (below average); and a fund in the bottom
10 percent receives only 1 star (lowest). Morningstar claims such ratings by category are
3 Morningstar has a procedure for data storage that allows us to extract the underlying raw data directly from the
Morningstar Principia program datasets starting in 1994. 4 A full statement of how the Morningstar ratings are calculated is provided by Morningstar. See
http://help.yahoo.com/l/us/yahoo/finance/definitions/fitams.html. See Sharpe (1998) for a detailed discussion about
the underlying basic utility of the Morningstar rating system.

4
important to avoid ranking a fund highly based solely on the fund being in a booming category
(e.g., a large-growth fund when this type of fund is out-performing other categories).5
2.2 Alternative Performance Measures
In addition to Morningstar's category rankings, our analysis considers four alternative
performance measures that have been suggested by others in examinations of fund manager
turnover. Chevalier and Ellison (1999) focus on a single factor 1-year Alpha based on the Capital
Asset Pricing Model (CAPM). To estimate a similar 1-year Alpha for each fund i, we run the
following regression using the 12 prior monthly return observations in year t:
( )it ft i i mt ft itR R Alpha Beta R R (1)
where itR is the monthly return on fund i , ftR is the return on a three-month T-bill, and mtR is
the monthly return on the CRSP value-weighted AMEX/NYSE/NASDAQ index for our equity
funds. A second measure of fund performance that we consider, one reported by Morningstar, is
a single factor 3-year Alpha calculated based on the CAPM using the past 36 months of return
data.
Our third and fourth alternative performance measures are drawn from Khorana's (1996)
analysis. These two measures are the Objective-Adjusted-Return (OAR) and the
Risk-Adjusted-Return (RAR). The OAR measures the difference between the fund’s total return
( itR ) and the average total return within the fund category ( ctR ) over the past year.
5 Morningstar, in explaining a change in focus to category ratings in 2002, stated that: "By using a more precise,
portfolio-driven ratings group the new rating can more effectively measure whether a manager is adding value. Many
of our customers already use the category rating to do this type of analysis, but the star rating will take it to a new
level." Morningstar's New Star Rating by Russel Kinnel, 4/22/2002,
http://news.morningstar.com/article/article.asp?id=14071&_QSBPA=Y.
5
it it ctOAR R R (2)
Note that, unlike the Morningstar category rating that is a risk-adjusted rating, the OAR measure
is not risk-adjusted. The RAR is obtained using the CAPM as the underlying model. We first
estimate the fund coefficients ˆi and i using the standard of CAPM equation:
( )it ft i i mt ft itR R R R (3)
and monthly data for the past year. We then calculate the RAR as the excess return generated by
the following equation under the assumption that ˆi is equal to zero:6
ˆ( ( ))it it ft i mt ftRAR R R R R (4)
3. Manager Replacement in the Morningstar Data
In this section we discuss our measure of manager turnover using the Morningstar mutual
fund database. In section 3.1, we provide a simple measure of manager turnover constructed at
the level of the unique set of individual Morningstar mutual funds as defined by Morningstar. In
section 3.2, we aggregate this measure of manager turnover up to the level of unique mutual fund
portfolios. This aggregation takes into account the fact that mutual fund managers typically
oversee a mutual fund portfolio composed of several unique mutual funds that differ in
shareholder services and/or distribution arrangements, with different fees and expenses (i.e.,
different classes of mutual funds).
6See Khorana (1996). The basic rationale for assuming Alpha equals zero is to not penalize the outperforming manager
who has a positive Alpha.
6
3.1 Manager Replacement at the Morningstar Mutual Fund Level
We begin our analysis of the fund manager replacement by focusing on single-manager
mutual funds, as it is often not possible to identify individual managers when a fund has adopted
a team-management approach. For single-manager funds, we limit the analysis to cases when the
fund's reported manager has been listed as the manager of the fund for at least two years as of the
end of year t. For such cases, we determine if the manager separated from the fund between year
t and t+1. If the manager is listed as the sole manager of the fund or as one of several managers of
the fund in the following year, then we identify the fund as one with no manager separation. On
the other hand, if the fund switches to a different manager or if the fund switches to multiple
managers and the original manager is not reported as part of the new management team, then we
say that manager separation has occurred. This means that we are implicitly assuming separation
in cases when the management of the fund reverts to a management described as a "management
team" or "multiple managers".
There are 275,540 fund-year observations in the complete Morningstar mutual fund dataset
over the 17-year period from 1994 to 2010. Dropping funds that are coded by Morningstar as
either bond funds or Index funds at some point during this period reduces the dataset to 188,189
observations reflecting 31,593 unique equity funds. Eliminating fund-year observations that do
not report a positive level of assets reduces the sample to 166,570 observations reflecting 26,759
unique equity funds.
For this set of observations, we then restrict our attention to funds that do not have breaks in
the data over time and provide observations for a minimum of four contiguous years. Four
7
contiguous years is the minimum required length to be able to combine identification of
management changes at a particular fund with the calculation of current and lagged performance
variables that require three years of data. This reduces the sample to 142,673 observations
reflecting 16,769 unique funds. For each of these funds, manager separation from the particular
fund cannot be determined for the last annual observation of any fund.7 Excluding the last year of
each fund, there are then 125,904 fund-year observations for which we can examine changes in
the fund manager; for this sample, we find that 78,223 involve funds advised by a management
team and 47,681 involve funds advised by a single manager.
Among these 47,681 observations of funds that were advised by a single manager and for
which we can determine a change in management, 20,606 are fund-year observations when the
same single manager had been at the fund for at least two years, reflecting 6,313 distinct funds.
From this sample we then exclude from our analysis observations with missing values for key
performance variables including the Morningstar category rating used in the analysis. This
reduces the sample to 19,386 observations of potential fund-manager turnover over the years
1996 to 2009 reflecting 5,955 distinct funds.8 Of these 19,386 observations, 16,467 reflect
fund-year observations when no manager separation occurred. This no separation group
consisted of 14,733 cases when there was also no management team structure change and 1,734
7 This reflects either that the observation is for the last year of our sample data (2010) or for the last year the fund
existed in the Morningstar data. 8 Variables with missing values include various annual performance measures lagged up to two years, the tenure of
the manager, and the size of the fund. The original dataset period of 1994 to 2010 is reduced to the 1996 to 2009
period in order to calculate lagged performance variables for the current and preceding two periods and changes in
management between the current and following period.

8
cases when a single manager become an identified part of a team of managers. The remaining
2,919 cases of 19,386 observations involved manager replacement. This separation group
consisted of 1,612 cases when the manager was replaced by another single manager and 1,307
cases when manager was replace by either an anonymous management team or a management
team that did not include the prior manager as a listed member.
Among the separations are managers who reappear in our data base of equity funds in
subsequent periods as managers of funds that collectively are larger in terms of total assets than
the assets of the funds they managed when a separation occurred. For such managers with
enhanced responsibility, we consider the move to be a potential "promotion" rather than a
separation if the total assets held across all the funds the manager oversees increases. We exclude
from the analysis the 273 cases of manager turnover so identified in our dataset. Panel A of Table
1 indicates how the remaining 19,113 observations, representing 5,893 distinct equity mutual
funds, are divided into the various groups.
3.2 Manager Replacement Aggregated to the Mutual Fund Portfolio Level
The unique set of mutual funds reported in the Morningstar data often include funds that
reflect a common investment portfolio, but have different shareholder services and/or distribution
arrangements with different fees and expenses. For example, class A shares might have a fee paid
when an investor purchases fund shares ("front-end sales load"), while class B shares many have
no front-end sales load, but have a fee that investors pay when they redeem fund shares, with the
size of the fee depending on the length of time the shares are held ("contingent deferred sales
load"). Class I shares may be sold only to institutional investors and have their own set of fees

9
and expenses. Performance ratings, including the Morningstar ratings, can differ across funds
that involve the same investment portfolio, as the different arrangements, fees and expenses
result in performance differences.
In examining the Morningstar mutual fund data, it is clear that there typically is a common
manager or manager team for portfolios that support several different fund classes.
Unfortunately, unlike the CRSP mutual fund dataset, the Morningstar mutual fund database does
not contain a variable that clearly identifies unique portfolios.9 Morningstar only provides a code
that identifies each specific fund over time. However, as discussed below, using fund names and
other information, we can accurately aggregate manager turnover from the fund level to the
portfolio level, and consider the effect on manager turnover of the appropriately weighted
aggregate performance of the set of funds that make up the managed portfolio.
To aggregate individual funds to the portfolio level, we rely on several variables, including
Morningstar's unique fund code variable, cleaned versions of the reported names of the individual
funds, information in the Morningstar database on the fund's portfolio composition when
available, and information from the CRSP mutual fund database that aggregates different funds
defined by their NASDAQ ticker values into distinct portfolios. We start the aggregation process
with the fund name as reported in the Morningstar dataset.
In the dataset, the name of a specific mutual fund can change across time, often simply due to
changes in the abbreviations used for particular parts of the fund name. For instance, as just one
9 There is a variable in the Morningstar dataset that purports to measure the total assets across all funds in a particular
portfolio, but values for this variable are often missing.

10
example, the same "growth" mutual fund can use the term "gr", "grwth", and "gro" in its name in
different years to represent the term "growth". Thus, we begin our identification of funds with a
common portfolio by adjusting the reported names of the individual funds to obtain a consistent
name for a particular fund over time. This extensive process results in updates for approximately
51% of the original fund names in our full sample of 142,673 fund-year observations (reflecting
16,769 unique funds). Recall that this sample of the Morningstar data meets the following three
conditions: a) the mutual fund is classified by Morningstar as a stock fund; b) the mutual fund has
a positive recorded level of assets; and c) the observation is part of series of four or more
contiguous years of observations for the specific fund.
Our next step is to identify a specific fund name for each Morningstar's fund code. More
recent fund names are typically less abbreviated than earlier names, so we choose the common
name across time for each fund code to be either the name of that fund at the end of 2009 if
available, or the name of the fund in its last year in the dataset otherwise.
A fund's name typically includes as part of its name an identification of the fund class, almost
always at the end of the fund name. Thus, our next step in generating a name that is associated
with funds that have a common portfolio and management is to strip from the fund names the
fund class information, and then group funds by the resulting common (portfolio) name. In most
cases, this procedure provided an appropriate grouping of funds into ones with a common
portfolio and a common management each period. However, we performed an extensive
examination of variables that indicate the asset composition of the portfolio (to the extent such
variables were not missing) as well as the reported management across funds to identify cases

11
where the grouping could be improved upon for the purposes of examining management turnover
at the portfolio level of funds.
Two other checks were also performed to assure the accuracy of our grouping of funds based
on having a common portfolio name and identical management over time. First, we checked
whether aggregation of our individual fund management turnover measure to the level of the fund
portfolio resulted in a comparable measure of management turnover for the portfolio for the
underlying mutual funds that relied on this common portfolio of assets. Across the
approximately three thousand cases of identified manager replacement at the fund level, this
check revealed five cases where aggregation to the portfolio level resulted in apparent different
outcomes across funds that made up the same portfolio. In two of these cases, turnover involved
a single manager being replaced by several managers, with the list of new managers in the
subsequent period in one of the funds in the portfolio not including the original manager.
However, in both instances the manager reappeared as one of several managers for all funds in
their respective portfolio in the subsequent year, so we eliminated the identification of
fund-manager replacement for the one fund in each of the two portfolios affected. In the other
three portfolio cases, a manager was replaced, but the report of replacement was delayed by one
of the funds (in two cases, one of three funds, in the third case one of five funds). For these two
cases, we updated the timing of the manager replacement to match the most frequently recorded
date for funds in the specific portfolio. With these changes, our measure of manager replacement

12
identified for individual funds is accurately aggregated to our measure at the portfolio level of
funds.10
Our second check to assure the accuracy of our grouping of funds was to use individual
funds' ticker and date variables from the Morningstar data to merge the Morningstar mutual fund
data with the CRSP mutual fund dataset. Note that this merge was successful for 85% of the
mutual funds in the Morningstar dataset, and 65% of the fund-year observations. The lack of a
complete match reflects the more expansive coverage of the Morningstar data, both in terms of
fund coverage and in terms of time period, as the CRSP dataset essentially begins in 1999, while
the Morningstar dataset starts in 1994.
For those funds in the Morningstar dataset that could be matched, we identified cases where
the CRSP data indicated multiple portfolio names for the same CRSP portfolio identifier and
cases where the CRSP data indicated multiple CRSP portfolio identifiers for the same portfolio
name. For such cases, we checked and made adjustments in the assignment of portfolio names
where it made sense based on the underlying patterns of reported management and portfolio
composition. The final result is the aggregation of our original mutual-fund-level dataset of
16,769 distinct mutual funds with 142,673 observations into a dataset of 6,666 distinct mutual
fund portfolios over the 1994 to 2010 period, with 61,894 observations.
The sample is then further reduced, as we consider only portfolios with a single manager who
had been at the fund for at least two years and are not missing key performance variables. Panel
B of Table 1 provides a breakdown of the resulting cases of potential and actual single-manager
10 Note that the information provided in Panel A of Table 1 incorporates these adjustments.

13
replacement similar to Panel A of Table 1, but for this aggregated dataset of mutual fund
portfolios. Panel B indicates 1,234 cases when the manager of a mutual fund portfolio was
replaced, excluding potential promotions, and 8,501 cases when the manager was not replaced
over the 2006 to 2009 period, for a total sample size of 9,735 cases. Note that of the 8,501 cases
when the manager was not replaced, 828 cases involved the manager being joined by other
managers to form a management team. Of the 1,234 cases when the manager was replaced, 550
cases involved the management structure also changing from a single manager to a management
team.
Panel C of Table 1 provides summary statistics on key variables for both the mutual fund
dataset and the aggregated, portfolio-level dataset, broken down by whether or not management
replacement occurred. Note that the portfolio variables reflect weighted averages of underlying
values of the variable for the individual funds that make up the portfolio, with the weights
reflecting the proportion of total portfolio assets held by the fund.11
It is of interest to note two side outcomes of our aggregating the data to the portfolio level.
First, the associated comparison of the Morningstar mutual fund data to the CRSP mutual fund
data indicates that the Morningstar mutual fund data likely is the preferred mutual fund data base
for management turnover analysis. This follows not only due to the more extensive coverage of
the Morningstar mutual fund dataset, but also because the management information provided in
the Morningstar dataset is generally more complete. For instance, the Morningstar data are more
11 It is important to note that the findings reported in this paper for the constructed set of mutual fund portfolios do
not differ from results if one were to use the non-aggregated sample that reflects individual mutual funds.

14
likely to include individual manager names when there is more than one manager for a fund
rather than simply listing the fund as "Team Managed". In particular, the CRSP mutual fund
dataset identified management without individual names for close to one-third of all the funds
(i.e., management being identified as "Team Managed"). Less than six percent of these funds
were similarly reported in the Morningstar dataset (i.e., management being identified as "Team
Management").
A second outcome of the aggregation process is that it proved advantageous in identifying
the manager for a relatively small number of cases in the Morningstar dataset when a manager's
name was missing. In particular, we first used the CRSP mutual fund data to replace missing
manager names in the Morningstar dataset with the manager's name as recorded by CRSP, but
only if an examination of the management at the funds with a common portfolio over time
indicated that such updates were appropriate. We then replaced missing manager names for a
particular fund in a portfolio by the manager identified for the other funds in that portfolio in the
same year, but again only if an examination of the management of the funds with a common
portfolio over time suggested such an updating was appropriate.
15
4 The Relationship between the Morningstar Rating and Manager Replacement
This section reports how various performance measures, and in particular the Morningstar
rating, can be used to predict changes in management. Then we compare the Morningstar rating
to other performance measurements in terms of the ability to predict manager turnover.
4.1 Morningstar Ratings Effect on Manager Turnover
Our study of the relationship between manager replacement and past Morningstar
performance ratings begins with a simple logit model. For now we focus on the role of the
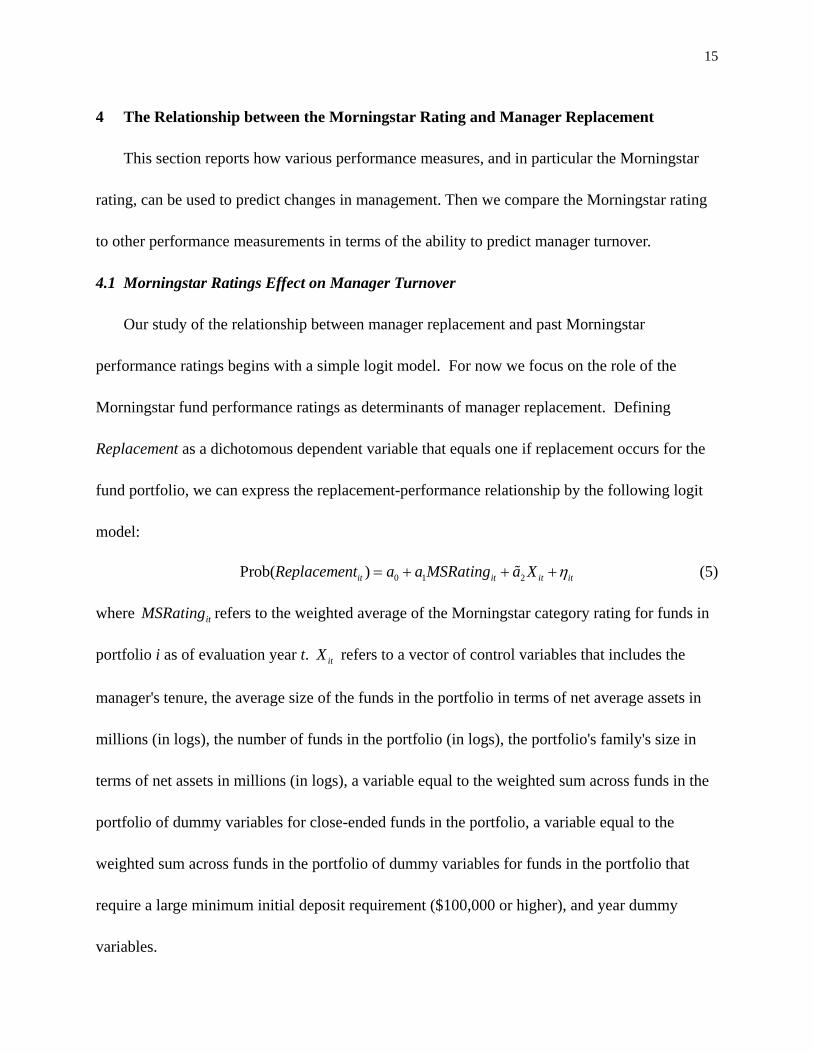
Morningstar fund performance ratings as determinants of manager replacement. Defining
Replacement as a dichotomous dependent variable that equals one if replacement occurs for the
fund portfolio, we can express the replacement-performance relationship by the following logit
model:
0 1 2Prob( )it it it itReplacement a a MSRating a X (5)
where itMSRating refers to the weighted average of the Morningstar category rating for funds in
portfolio i as of evaluation year t. itX refers to a vector of control variables that includes the
manager's tenure, the average size of the funds in the portfolio in terms of net average assets in
millions (in logs), the number of funds in the portfolio (in logs), the portfolio's family's size in
terms of net assets in millions (in logs), a variable equal to the weighted sum across funds in the
portfolio of dummy variables for close-ended funds in the portfolio, a variable equal to the
weighted sum across funds in the portfolio of dummy variables for funds in the portfolio that
require a large minimum initial deposit requirement ($100,000 or higher), and year dummy
variables.
16
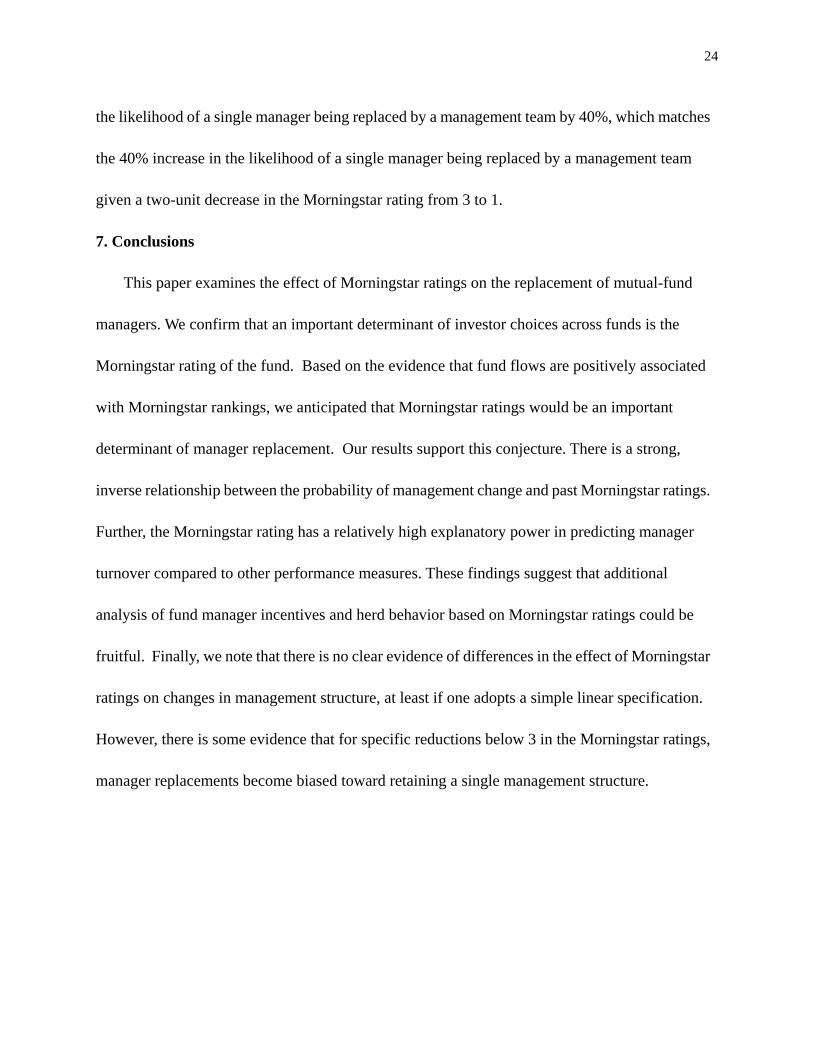
The logit results are presented in the first column of Table 2. The coefficients reported are
marginal coefficients, indicating the effect on the probability of management replacement of a
one unit increase in the various independent variables. As expected, the coefficient for the
standard Morningstar category rating is negative and statistically different from zero at the 1
percent confidence level. The results reported in Column (1) indicate that an increase in the
average Morningstar rating for funds in the portfolio by one level reduces the probability of
manager replacement by .0316. Given that the average probability of manager replacement
is .127, this translates into 25% increase in the likelihood of the manager being replaced. Implied
is that a decrease in Morningstar rating from the highest to the lowest rank (5 to 1) essentially
doubles the likelihood a manager is replaced in any given year.
Columns (2) and (3) illustrate, however, that the effect of a reduction in the Morningstar
ratings on manager replacement likelihood is not linear in the ratings. In particular, the largest
increase in the likelihood of replacement is a one unit reduction in the ratings from 3 to 2, as this
implies a 34% increase the likelihood of manager replacement from its mean level. At the other
extreme, a one unit reduction in the ratings from 5 to 4 only results in a 9% increase in the
likelihood of a manager replacement from its mean level.
We have included a number of variables as control variables in Table 2. As one might expect,
a manager with longer tenure, and presumably a more established reputation, is less likely to be
replaced. This result is consistent with the findings of Chevalier and Ellison (1999)12 and other
12 Note that an interaction term for the Morningstar Rating and manager tenure, if included in the analysis, is not
statistically significant.
17
literature. For instance, Maxam et al. (2006) finds hedging fund managers with previous trading
experience significantly and consistently outperform others. Gottesman and Morey (2010) finds
Chief Executive Officers’ (CEO) working experience is a significant factor in terms of firm
financial performance. It is likely the case that managers of portfolios with higher assets have
better reputations, and we do find that such managers are also less likely to be replaced.
Interestingly, holding constant the total assets in a portfolio, an increase in the number of funds in
the portfolio (and thus a decrease in the average fund size) increases the likelihood of manager
replacement. Finally, portfolios with a greater prevalence of closed-end funds and funds with a
greater prevalence of funds without large minimum initial deposit requirements tend to have
lower manager replacement likelihoods. The former result may reflect less concern with
attracting and retaining mutual fund investors at funds that are closed.13 The latter result, that
funds that cater to large investors have higher manager turnover rates, could indicate that
institutional investors are more sophisticated as well as perhaps better monitors, resulting in any
given manager finding it more difficult to satisfy large investors.14
4.2 Comparisons to Other Performance Measures
The findings that mutual fund managers are more likely to be replaced if they perform poorly
was first documented by Khorana (1996). The fund performance measures used by Khorana are
the Objective-Adjusted Return (OAR) and Risk-Adjusted-Return (RAR) variables defined in
Section 2. Later, Chevalier and Ellison (1999) use the one-year Jensen’s Alpha to measure
13 Note that the results reported in Table 2 are similar to estimates obtained using a survival model (available upon
request). 14 We thank the referee for this suggestion.

18
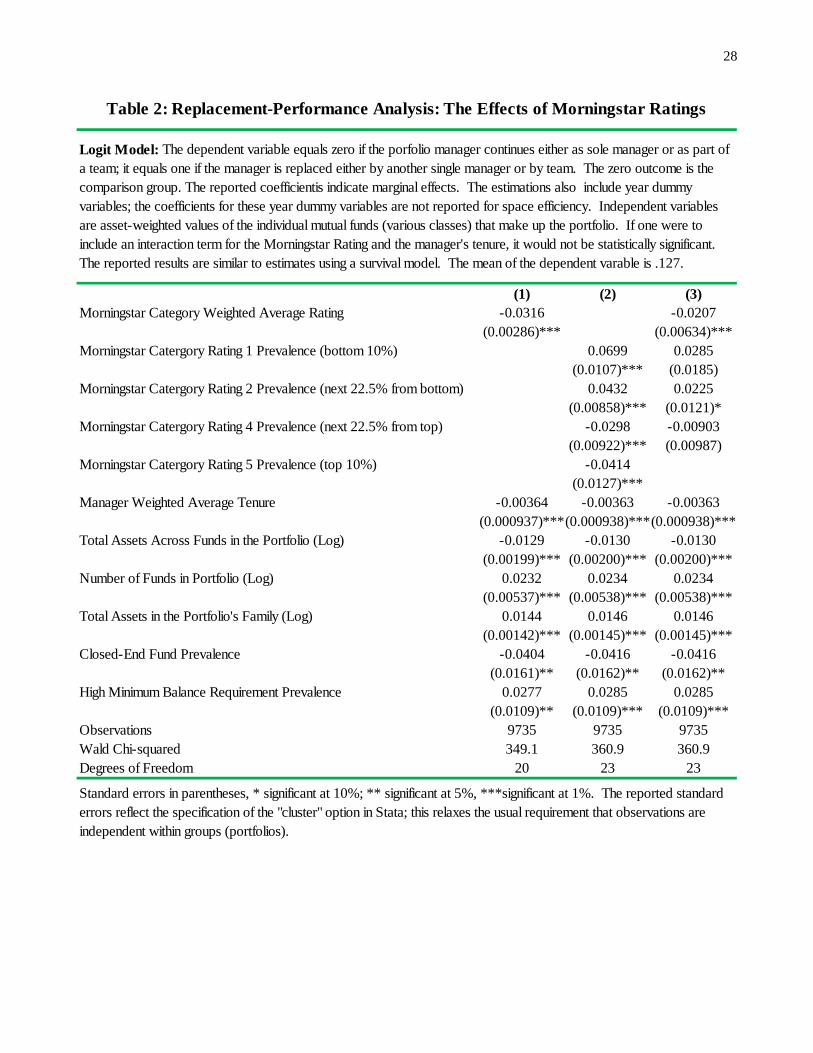
manager performance. In addition, Morningstar reports a three-year Alpha performance
measure. Table 3 illustrates the correlation that exists among these various performance
measurements and the Morningstar ratings. Note that the correlations between traditional
performance measurements and Morningstar category rating, while high, are less than .5.
Therefore, it is of interest to determine if the Morningstar rating performance measure is better
than the alternatives in predicting the manager replacement.
Table 4 compares estimates of manager replacement model that uses the Morningstar rating
with models that adopt alternative measures of performance. Namely, we estimate the logit
model:
0 1 2Prob( )it it it itReplacement a a Alternative a X (6)
where itAlternative stands for the alternative measures indicated in the above literature. The prior
results for the Morningstar category rating listed in Column (1) can be compared to the estimation
results using the alternatives to the Morningstar ratings that are listed in Columns (2)-(5) of Table
4. We start by noting that the results in columns (2) through (5) provide confirmation of the
results reported by others, but for a more extensive dataset. Namely, that manager replacement is
negatively associated with past performance as measured by variables other than the Morningstar
ratings.15
We use Akaike’s Information Criterion (AIC) and Bayesian Information Criterion (BIC),
together with log-likelihood values to compare models that adopt alternative performance
15 Note that our analysis, unlike Lynch and Musto (2003), relies on Morningstar data instead of CRSP data. As
Elton, Gruber, and Blake (2001) have shown, Morningstar data and CRSP data on mutual funds do differ, with each
having its own biases and errors.

19
measures.16 The lower part of Table 4 lists the results of the pair-wise comparisons of the
goodness of fit of the alternative performance measures to the Morningstar rating using these
three measures of goodness of fit. To make the comparison straightforward, we report the
difference of the statistics between the Morningstar model and each of the alternatives in the
lower part of the table. The number of observations is the same for the models so that the
comparison is valid.
A better fit model should have a higher Log-likelihood value (Log-like Full Model) and a
smaller AIC and BIC. For all alternatives, such comparisons support the claim that the
Morningstar rating performance model offers a better fit for the data than alternative performance
measures. That is, the Morningstar ratings appear superior to other standard performance
measures in explaining the likelihood of managerial replacement. In the next section, we check
to see if investors respond as expected to the Morningstar ratings as measured by changes in net
fund flows.
5. Fund Performance and Investment Flows
The previous section demonstrates the importance of performance as measured by the
Morningstar rating in determining the replacement of fund managers. The presumption is that the
Morningstar rating is a key determinant of fund size, and thus fund profitability. The purpose of
16 The AIC criterion, first published in Akaike (1974), identifies that a model has a "better fit" if it has a lower AIC.
The BIC Criterion was introduced by Schwarz (1978) and is similar to the AIC. Each of these two criterions
penalizes models with additional parameters.

20
this section is to check to see if, for our data, individual investor choices of funds, and thus
changes in fund size, do depend on Morningstar ratings.17
We use the annual fund flow growth rate to measure individual investor choices across funds.
Following Chevalier and Ellison (1999) and Khorana (1996), the growth rate variable Flow is
defined as the fund asset growth net of the internal growth of return:
11 1
it itit it
it
Asset AssetFlow Return
Asset
(7)
where itAsset is fund i ’s total net asset under management at time t and 1itReturn is the fund’s
total return over the year in consideration. This measure reflects new investment flow into the
fund excluding the growth due to the reinvestment of all dividends.
To obtain a measure of the growth rate for a particular portfolio of funds, we simply take the
weighted sum of the above flow measure, with the weights equal to the proportion of the total
portfolio assets in each fund. We then consider the link between the performance as measured by
Morningstar ratings for each portfolio and the flow using a linear regression framework applied
to portfolio-level data. We include the standard set of control variables. We control for size since
smaller funds are more sensitive to equal value flows. Following the same argument, we expect
that the funds with large minimum initial investments and the closed-end funds have smaller
growth rates. The model is estimated on the entire panel dataset using a cross-sectional
17 The results reported below augment findings reported by Guercio and Tkac (2008), in that we consider an expanded
time period (1994-2010) and a larger sample of mutual fund portfolios. Guercio and Tkac use event-study methods on
a sample of 3,388 domestic equity mutual funds from November 1996 to October 1999 to isolate the “Morningstar
effect” from other influences (such as traditional performance measures) on fund flow.

21
time-series model assuming that the error term follows an AR (1) process. This regression
method accommodates unbalanced panels whose observations are unequally spaced over time.
Table 5 reports the results using the Morningstar category ratings. In Column (1), the
significant positive coefficient estimates for the Morningstar ratings indicate that the higher
performance ranking funds are associated with larger investment flow into those funds. In
Column (2), we consider four dummies for the five levels of Morningstar ratings. The estimation
results indicate that one- and two- star funds experience significant fund outflow. On the contrary,
the four-star and five-star funds are associated with economically and statistically significant
fund inflows.
The coefficients reported in Column (2) suggest a non-linear relationship, in that the increase
in the inflow arising from an increase from a four-star to a five-star fund is substantially greater
than a one unit increase in ratings at lower rating levels. With respect to the control variables,
portfolios with higher average assets across their funds or a larger number of funds in the
portfolio tend to have lower growth rates. This may reflect that larger portfolios are less likely to
have substantial remaining growth opportunities in terms of new customers. On the other hand,
portfolios that belonged to larger fund families tend to have higher growth rates, which may
reflect access to a larger base of potential customers. Not surprisingly, portfolios with a higher
prevalence of assets in closed-end funds tend to have lower growth rates. To summarize, the
results reported in Table 5 indicate that consumers do react to the mutual fund performance as
represented by Morningstar ratings.
22
Existing literature has documented the positive relationship between the traditional
performances and the following mutual fund flow. See, for instance, Ippolito (1992), Berkowitz
and Kotowitz (1993), Gruber (1996), Sirri and Tufano (1998), Zheng (1999), Edelen and Warner
(2001). Columns (3) through (6) in Table 5 examine the effects of traditional alternative
performance measures, and confirm the positive effect of these performance measures on net
portfolio flows for our dataset. However, the Wald statistics for the results reported in Table 5
suggest that the performance measures other than the Morningstar ratings provide less power in
explaining differences in mutual fund flows.
6. Effect of Morningstar Rating on Fund Management Type and Existence
We have focused on the increased likelihood of managerial replacement at single-manager
equity funds in response to low Morningstar ratings, but there are clearly other potential reactions
when a portfolio is not performing well. The most dramatic would be to eliminate the portfolio
from review by the Morningstar rating service, often by merging the fund with other funds. In
fact, approximately one-fourth of the portfolios in our sample do exit our sample each year.
Examining the likelihood a portfolio drops out of our sample other than in the last year of our
dataset, we find that a one unit decrease in the Morningstar fund rating increases the likelihood of
a portfolio not being listed in the subsequent year’s Morningstar database by .033, an
approximate 12% increase in the likelihood that the portfolio exits the sample.
A less dramatic adjustment to low performance can be to change the type of fund
management. To examine the sensitivity of this change to performance, we consider a more
detailed multinomial logit analysis of managerial outcomes. That is, we expand the outcomes to
23
factor in whether the management structure shifts from a single manager to a management team.
The case of no manager replacement is split into the case when a single manager remains a single
manager (case 0) and the case when a single manager remains a manager, but now is one of
several managers as the fund adopts a management team structure (case 1). Similarly, the case of
manager replacement is split into the case when a single manager is replaced by a new single
manager (case 2) and the case when a single manager is replaced by a management team (case 3).
Table 6 reports the multinomial logit regression results when performance is measured by the
Morningstar ratings. Column (1) indicates no statistically significant effect of Morningstar
ratings on the likelihood of a single manager being merged into a team. Consistent with our
previous findings, the results of Columns (2) and (3) indicate that a manager with poor
performance as measured by this Morningstar rating is more likely to be replaced by either an
individual manager (case 2) or a management team (case 3). However, given 7% of the cases
involve case 2 and 5.6% of the cases involve case 3, the coefficients indicate similar percentage
increases in the likelihood of a manager being replaced whether the replacement involves a new
single manager or a management team.
The last two columns of Table 6, however, do indicate potential effects of Morningstar
ratings on management structure is one adopts a nonlinear specification. For instance, a two-unit
decrease in the Morningstar rating from 5 to 3 increases the likelihood of a single manager being
replaced by another single manager by 26%, while a similar two-unit decrease in the Morningstar
rating from 3 to 1 increases the likelihood of a single manager being replaced by another single
manger by 65%. In contrast, a two-unit decrease in the Morningstar rating from 5 to 3 increases
24
the likelihood of a single manager being replaced by a management team by 40%, which matches
the 40% increase in the likelihood of a single manager being replaced by a management team
given a two-unit decrease in the Morningstar rating from 3 to 1.
7. Conclusions
This paper examines the effect of Morningstar ratings on the replacement of mutual-fund
managers. We confirm that an important determinant of investor choices across funds is the
Morningstar rating of the fund. Based on the evidence that fund flows are positively associated
with Morningstar rankings, we anticipated that Morningstar ratings would be an important
determinant of manager replacement. Our results support this conjecture. There is a strong,
inverse relationship between the probability of management change and past Morningstar ratings.
Further, the Morningstar rating has a relatively high explanatory power in predicting manager
turnover compared to other performance measures. These findings suggest that additional
analysis of fund manager incentives and herd behavior based on Morningstar ratings could be
fruitful. Finally, we note that there is no clear evidence of differences in the effect of Morningstar
ratings on changes in management structure, at least if one adopts a simple linear specification.
However, there is some evidence that for specific reductions below 3 in the Morningstar ratings,
manager replacements become biased toward retaining a single management structure.

25
References
Akaike, H., 1974, "A New Look at the Statistical Model Identification," IEEE Transactions on
Automatic Control, 19 (No. 6), 716–723.
Berkowitz , M. K. and Y. Kotowitz, 1993, "Incentives and Efficiency in the Market for
Management Services: A Study of Canadian Mutual Funds," Canadian Journal of
Economics, Canadian Economics Association, 26 (No. 4), 850-66 (November).
Chevalier, J. and G. Ellison, 1999, “Career Concerns of Mutual Fund Managers,” Quarterly
Journal of Economics, 114 (No. 2), 389-432.
Edelen R. M. and J. B. Warner, 2001, “Aggregate Price Effects of Institutional Trading: A Study
of Mutual Fund Flow and Market Returns,” Journal of Financial Economics, 59, 195-220.
Elton, E. J., M. J. Gruber, and C. R. Blake, 2001, "A First Look at the Accuracy of the CRSP
Mutual Fund Database and a Comparison of the CRSP and Morningstar Mutual Fund
Databases," Journal of Finance, 56 (No. 6), 2415-30.
Gottesman, A. A. and M. R. Morey, 2010, “CEO Educational Background and Firm Financial
Performance,” Journal of Applied Finance, 20 (No. 2), 70-82.
Guercio, D. and P. A. Tkac, 2008, “Star Power: The Effect of Morningstar Ratings on Mutual
Fund Flow,” Journal of Financial and Quantitative Analysis, 43 (December), 907-936.
Gruber, M., 1996, “Another Puzzle: The Growth in Actively Managed Mutual Funds,” Journal of
Finance, 51, 783-810.
Ippolito, R. A., 1992, “Consumer Reaction to Measures of Poor Quality: Evidence from the
Mutual Fund Industry,” Journal of Law and Economics, 35, 45-70.

26
Khorana, A., 1996, “Top Management Turnover: An Empirical Investment of Mutual Fund
Managers,” Journal of Financial Economics, 40, 403-427.
Khorana, A. and E. Nelling, 1998, “The Determinants and Predictive Ability of Mutual Fund
Ratings,” The Journal of Investing, Fall, 61-66.
Lynch, A. W. and D. K. Musto, 2003, “How Investors Interpret Past Fund Returns,” Journal of
Finance, 58 (No. 5), 2033-2058.
Schwarz G., 1978, “Estimating the Dimension of a Model,” Annals of Statistics, 6, 461-464.
Maxam, C. L., E. Nikbakht, M. Petrova, M., and A. C. Spieler, 2006, “Manager Characteristics
and Hedge Fund Performance,” Journal of Applied Finance, 16 (No. 2), 57-70.
Sharpe, W. F., 1998. “Morningstar’s Risk-Adjusted Ratings,” Financial Analysts Journal, 54,
21-32.
Sirri, E. R. and P. Tufano, 1998, “Costly Search and Mutual Fund Flows,” Journal of Finance, Vol
53 Issue 5, p1589-1622, 34p.
Zheng, L., 1999, “Is Money Smart? A Study of Mutual Fund Investors’ Fund Selection Ability,”
Journal of Finance, LIV (No. 3), 901-933.

27
Type of Observation
Continue Single
Manager Structure
Change to Team Mgmt
Structure Total
Number of cases manager leaves fund 1,612 1,307 2,919 - Number of cases leaving manager improves position (promotions) 189 84 273 = Number of cases manager is replaced 1,423 1,223 2,646 + Number of cases manager stays at fund 14,733 1,734 16,467 = Total Number: manager stays plus replacements 16,156 2,957 19,113
Type of Observation
Continue Single
Manager Structure
Change to Team Mgmt
Structure Total
Number of cases manager leaves portfolio 790 599 1,389 - Number of cases leaving manager improves position (promotions) 106 49 155 = Number of cases manager is replaced 684 550 1,234 + Number of cases manager stays at portfolio 7,673 828 8,501 = Total Number: manager stays plus replacements 8,357 1,378 9,735
Variables*
Means: No
Turnover Sample
Means: Turnover Sample
(Manager replaced)
Means: Full
Sample
Means: No
Turnover Sample
Means: Turnover Sample
(Manager replaced)
Means: Full
Sample
Turnover rate 0 1 0.138 0 1 0.127Morningstar Category Rating 3.14 2.73 3.08 3.18 2.79 3.13Three-year Alpha 1.34 -0.91 1.03 1.30 -1.35 0.95One-year Alpha 0.06 -0.18 0.03 0.05 -0.21 0.02Risk Adjusted Return (RAR) 6.22 4.38 5.97 7.07 5.02 6.81Objective Adjusted Return (OAR) 0.57 -1.69 0.26 0.75 -1.72 0.44Manager Tenure (in years) 6.80 6.05 6.70 7.19 6.22 7.06Total Assets in Individual Fund (millions) 799.49 523.69 761.31Total Assets Across Funds in the Portfolio (millions) 1564.20 1126.82 1508.76Number of Funds in Portfolio (before log) 2.07 2.29 2.24Total Assets in Family (Log) 9.24 9.50 9.27 8.53 9.08 8.60Closed-End Fund Prevalence 0.06 0.04 0.06 0.06 0.04 0.06High Minimum Balance Requirement Prevalence 0.10 0.11 0.10 0.09 0.11 0.09Number of Observations 16,467 2,646 19,113 8,501 1,234 9,735
* For the portfolio sample, the value of these variables are the weighted average of the underlying values of the fund-level variables, with the weights being the proportion of total porfolio assets in each of the funds that makes up the portfolio.
Individual Mutual Funds Mutual Fund Portfolios
Table 1: Data and Statistics Summary for Mutual Fund Samples
A. Sample of Individual Mutual Funds (Single Manager)
B. Sample Aggregated to the Level of Mutual Fund Portfolios
C. Descriptive Statistics for Mutual Fund and Portfolio Samples
28
(1) (2) (3)Morningstar Category Weighted Average Rating -0.0316 -0.0207
(0.00286)*** (0.00634)***Morningstar Catergory Rating 1 Prevalence (bottom 10%) 0.0699 0.0285
(0.0107)*** (0.0185)Morningstar Catergory Rating 2 Prevalence (next 22.5% from bottom) 0.0432 0.0225
(0.00858)*** (0.0121)*Morningstar Catergory Rating 4 Prevalence (next 22.5% from top) -0.0298 -0.00903
(0.00922)*** (0.00987)Morningstar Catergory Rating 5 Prevalence (top 10%) -0.0414
(0.0127)***Manager Weighted Average Tenure -0.00364 -0.00363 -0.00363
(0.000937)***(0.000938)***(0.000938)***Total Assets Across Funds in the Portfolio (Log) -0.0129 -0.0130 -0.0130
(0.00199)*** (0.00200)*** (0.00200)***Number of Funds in Portfolio (Log) 0.0232 0.0234 0.0234
(0.00537)*** (0.00538)*** (0.00538)***Total Assets in the Portfolio's Family (Log) 0.0144 0.0146 0.0146
(0.00142)*** (0.00145)*** (0.00145)***Closed-End Fund Prevalence -0.0404 -0.0416 -0.0416
(0.0161)** (0.0162)** (0.0162)**High Minimum Balance Requirement Prevalence 0.0277 0.0285 0.0285
(0.0109)** (0.0109)*** (0.0109)***Observations 9735 9735 9735Wald Chi-squared 349.1 360.9 360.9Degrees of Freedom 20 23 23
Table 2: Replacement-Performance Analysis: The Effects of Morningstar Ratings
Standard errors in parentheses, * significant at 10%; ** significant at 5%, ***significant at 1%. The reported standard errors reflect the specification of the "cluster" option in Stata; this relaxes the usual requirement that observations are independent within groups (portfolios).
Logit Model: The dependent variable equals zero if the porfolio manager continues either as sole manager or as part of a team; it equals one if the manager is replaced either by another single manager or by team. The zero outcome is the comparison group. The reported coefficientis indicate marginal effects. The estimations also include year dummy variables; the coefficients for these year dummy variables are not reported for space efficiency. Independent variables are asset-weighted values of the individual mutual funds (various classes) that make up the portfolio. If one were to include an interaction term for the Morningstar Rating and the manager's tenure, it would not be statistically significant. The reported results are similar to estimates using a survival model. The mean of the dependent varable is .127.
29
(1) (2) (3) (4) (5) (6) (7) (8) (9) (10) (11)
Three-year Weighted Average Alpha (1) 1.00
One-year Weighted Average Alpha (2)\ 0.53 1.00
One-year Weighted Average Alpha lagged one year (3) 0.59 0.10 1.00
One-year Weighted Average Alpha lagged two years (4) 0.45 -0.05 0.09 1.00
Risk Adjusted Weighted Average Return (RAR) (5) 0.22 0.50 -0.02 -0.03 1.00
RAR Weighted Average lagged one year (6) 0.20 -0.02 0.47 -0.06 -0.16 1.00
RAR Weighted Average lagged two years (7) 0.25 0.01 0.04 0.61 -0.12 0.03 1.00
Objective Adjusted Weighted Average Return (OAR) (8) 0.37 0.61 0.07 -0.01 0.49 -0.01 -0.03 1.00
OAR Weighted Average lagged one year (9) 0.38 0.06 0.59 0.06 0.00 0.47 0.05 0.04 1.00
OAR Weighted Average lagged two years (10) 0.32 -0.02 0.05 0.61 0.00 0.01 0.55 -0.05 0.07 1.00
Morningstar Category Weighted Average Rating (11) 0.42 0.26 0.24 0.18 0.17 0.16 0.14 0.34 0.34 0.25 1.00
Table 3: Correlation Table of Fund Performance Measures
Note that positive correlations involving the three-year Alpha are all positive and statistically significant at the .05 level. Similarly, the Morningstar category ranking that spans three years has statistically significant positive correlations with all other performance measures. The correlations of alternative one-year performance measures within the same year (indicated by bold) are also positive and statistically significant.

30
(1) (2) (3) (4) (5)Morningstar Category Weighted Average Rating -0.0316
(0.00286)***Three-year Weighted Average Alpha -0.00383
(0.000451)***One-year Weighted Average Alpha -0.0192
(0.00290)***One-year Weighted Average Alpha (lagged one year) -0.0111
(0.00328)***One-year Weighted Average Alpha (lagged two years) -0.00778
(0.00347)**Risk Adjusted Weighted Average Return (RAR) -0.00129
(0.000228)***RAR Weighted Average (lagged one year) -0.000832
(0.000228)***RAR Weighted Average (lagged two years) -0.000210
(0.000208)Objective Adjusted Weighted Average Return (OAR) -0.00163
(0.000305)***OAR Weighted Average (lagged one year) -0.00199
(0.000359)***OAR Weighted Average (lagged two years) -0.000971
(0.000310)***Observations 9735 9735 9735 9735 9735Wald Chi-squared 349.1 322.7 305.4 305.8 325.2Degrees of Freedom 20 20 22 22 22
Morningstar Rating model
(1)
(1)-(2) (1)-(3) (1)-(4) (1)-(5)
Log-Likelihood, Full Model: -3505.69 18.81 27.33 33.43 15.27AIC: 7053.376 -37.62 -58.65 -70.85 -34.54BIC: 7204.23 -37.62 -73.02 -85.22 -48.91
Difference in BIC provides strong support for model (1).
Logit Model: The dependent variable equals zero if the portfolio manager continues either as sole manager or as part of a team; the variable equals one if the portfolio manager is replaced either by another sole manager or by a management team (Outcome zero is the comparison group). The mean of the dependent variable is .127. The reported coefficients indicate marginal effects. In the estimations reported below, the standard set of control variables is included, namely manager tenure, portfolio size, number of funds in the portfolio, family size, a variable indicating the prevalence of close-end funds in the portfolio, a variable indicating the prevalence of high minimum balances, and year dummy variables.
Table 4: Comparison of Goodness of Fit of Morningstar Rating Replacement Models with Manager Replacement Models That Use Alternative Performance Measures
Comparisons of model (1) with models (2) through (5) for model selection: Differences in Statistics
Standard errors in parentheses, * significant at 10%; ** significant at 5%, ***significant at 1% . The reported standard errors reflect the specification of the "cluster" option in Stata; this relaxes the usual requirement that observations are independent within groups (portfolios).

31
(1) (2) (3) (4) (5) (6)Morningstar Category Weighted Average Rating 0.199
(0.0240)***Morningstar Category Rating 1 Prevalence -0.306
(0.102)***Morningstar Category Rating 2 Prevalence -0.209
(0.0773)***Morningstar Category Rating 4 Prevalence 0.146
(0.0707)**Morningstar Category Rating 5 Prevalence 0.514
(0.0886)***Three-year Weighted Average Alpha 0.0204
(0.00342)***One-year Weighted Average Alpha 0.146
(0.0237)***One-year Weighted Average Alpha (lagged one year) 0.0774
(0.0254)***One-year Weighted Average Alpha (lagged two years) 0.00765
(0.0276)Risk Adjusted Weighted Average Return (RAR) 0.0106
(0.00168)***RAR Weighted Average (lagged one year) 0.00596
(0.00171)***RAR Weighted Average (lagged two years) 0.000962
(0.00180)Objective Adjusted Weighted Average Return (OAR) 0.0136
(0.00211)***OAR Weighted Average (lagged one year) 0.00820
(0.00230)***OAR Weighted Average (lagged two years) 0.00316
(0.00249)Manager Weighted Average Tenure 0.00221 0.00208 0.00218 0.00167 0.000897 0.00236
(0.00695) (0.00695) (0.00697) (0.00697) (0.00696) (0.00696)Total Assets Across Funds in the Portfolio (Log) -0.196 -0.196 -0.190 -0.187 -0.185 -0.187
(0.0191)*** (0.0191)*** (0.0192)*** (0.0191)*** (0.0191)*** (0.0191)***Number of Funds in Portfolio (Log) -0.0392 -0.0361 -0.0645 -0.0689 -0.0663 -0.0631
(0.0475) (0.0476) (0.0474) (0.0474) (0.0474) (0.0474)Total Assets in the Portfolio's Family (Log) 0.0696 0.0721 0.0741 0.0719 0.0705 0.0713
(0.0133)*** (0.0134)*** (0.0134)*** (0.0134)*** (0.0134)*** (0.0134)***Closed-End Fund Prevalence -0.215 -0.227 -0.230 -0.198 -0.200 -0.210
(0.121)* (0.121)* (0.121)* (0.121) (0.121)* (0.121)*High Minimum Balance Requirement Prevalence -0.181 -0.178 -0.140 -0.139 -0.142 -0.141
(0.105)* (0.105)* (0.105) (0.105) (0.105) (0.105)Observations 9735 9735 9735 9735 9735 9735Number of group(portfolio) 2601 2601 2601 2601 2601 2601Wald Chi-squared 189.2 193.6 155.2 167.7 171.4 174.4Degrees of Freedom 21 24 21 23 23 23
Table 5: Net-Flow Analysis: The Effects of Morningstar Ratings
Random Effects Model with AR(1) disturbance: The dependent variable, a measure of the flow of new funds into the portfolio over the folowing year, equals the rate of change in the asset holdings in the mutual fund portfolio over the year minus the one-year portfolio's return rate. The reported coefficients indicate marginal effects. The estimations also include year dummy variables. These results are not reported for space efficiency. The mean of the dependent variable, the net rate of change in the portfolio's value, is .155 for the entire sample.
Standard errors in parentheses, * significant at 10%; ** significant at 5%, ***significant at 1%. The estimation procedure (xtregar in Stata) implements the methods derived in Baltagi and Wu (1999).

32
(1) (2) (3) (1) (2) (3)Morningstar Category Weighted Average Rating 0.00142 -0.0179 -0.0130
(0.00243) (0.00213)*** (0.00192)***Morningstar Category Rating 1 Prevalence (bottom 10%) -0.0262 0.0454 0.0226
(0.0116)** (0.00778)*** (0.00701)***Morningstar Category Rating 2 Prevalence (next 22.5% from bottom) 0.00102 0.0318 0.0107
(0.00796) (0.00625)*** (0.00586)*Morningstar Category Rating 4 Prevalence (next 22.5% from top) -0.00565 -0.00770 -0.0219
(0.00758) (0.00676) (0.00640)***Morningstar Category Rating 5 Prevalence (top 10%) -0.00586 -0.0184 -0.0222
(0.00944) (0.00931)** (0.00871)**Manager Weighted Average Tenure 8.01e-05 -0.00110 -0.00248 0.000123 -0.00109 -0.00247
(0.000719) (0.000704) (0.000606)*** (0.000715) (0.000704) (0.000604)***Total Assets Across Funds in the Portfolio (Log) 0.000354 -0.00839 -0.00422 0.000410 -0.00841 -0.00425
(0.00206) (0.00143)*** (0.00141)*** (0.00205) (0.00143)*** (0.00141)***Number of Funds in Portfolio (Log) 0.0102 0.00338 0.0218 0.00991 0.00344 0.0219
(0.00475)** (0.00381) (0.00369)*** (0.00475)** (0.00381) (0.00370)***Total Assets in the Portfolio's Family (Log) 0.000514 0.0125 0.00132 0.000252 0.0126 0.00135
(0.00138) (0.00105)*** (0.000932) (0.00138) (0.00107)*** (0.000943)Closed-End Fund Prevalence 0.00176 -0.0271 -0.0117 0.00264 -0.0281 -0.0120
(0.0126) (0.0117)** (0.0118) (0.0126) (0.0118)** (0.0119)High Minimum Balance Requirement Prevalence 0.00819 -0.00426 0.0292 0.00749 -0.00330 0.0290
(0.0104) (0.00888) (0.00670)*** (0.0104) (0.00890) (0.00671)***Observations 9735 9735Wald Chi-squared 644.1 669.7Degrees of Freedom 60 69
Table 6: Fund Management Type Changes: The Effects of Morningstar Ratings
Multinomial Logit Model: The dependent variable equals 0 if the manager continues as sole manager; equals 1 if the manager continues as part of a team; equals 2 if the manager is replaced by another sole manager; and equals 3 if the manager is replaced by a management team. Outcome zero is the comparison group. The proportion of the sample in categories 0 through 3 are, respectively, .788, .085, .07, and .056. The reported coefficients indicate marginal effects. The estimations also include year dummy variables; these results are not reported for space efficiency.
Linear Model: Category Rating Non-linear Model: Category Rating
Standard errors in parentheses, * significant at 10%; ** significant at 5%, ***significant at 1%. The reported standard errors reflect the specification of the "cluster" option in Stata; this relaxes the usual requirement that observations are independent within groups (portfolios).