do financial incentives affect fertility? · do financial incentives affect fertility? alma cohen...
TRANSCRIPT

NBER WORKING PAPER SERIES
DO FINANCIAL INCENTIVES AFFECT FERTILITY?
Alma CohenRajeev Dehejia
Dmitri Romanov
Working Paper 13700http://www.nber.org/papers/w13700
NATIONAL BUREAU OF ECONOMIC RESEARCH1050 Massachusetts Avenue
Cambridge, MA 02138December 2007
An earlier version of this paper was circulated as “Do Financial Incentives Affect Fertility?” We thankJoshua Angrist, Lucian Bebchuk, Gary Becker, Avraham Ebenstein, Zvika Eckstein, Yona Rubenstein,Analia Schlosser, Manuel Trajtenberg, Yoram Weiss, anonymous referees, and seminar and conferenceparticipants at the Bank of Israel, Bar-Ilan, Ben-Gurion, Chicago, Columbia, Cyprus, Haifa, Maryland,Miami, St. Gallan, Sussex, Tel-Aviv, Yale SOM, IIES Stockholm, the Van Leer Institute in Jerusalem,and the annual meetings of European Association for Labor Economics and the Israeli Economic Associationfor helpful comments and suggestions. We thank Michal Goltzman for excellent research assistance,Yuri Homenko of the Central Bureau of Statistics for assistance in preparing the data, and Anat Katzand David Gordon of the Central Bureau of Statistics for facilitating our work on the project at theCentral Bureau of Statistics. Alma Cohen gratefully acknowledges the financial support of the FoerderInstitute for Economic Research and the Pinhas Sapir Center for Development at Tel Aviv University. The views expressed herein are those of the author(s) and do not necessarily reflect the views of theNational Bureau of Economic Research.
© 2007 by Alma Cohen, Rajeev Dehejia, and Dmitri Romanov. All rights reserved. Short sectionsof text, not to exceed two paragraphs, may be quoted without explicit permission provided that fullcredit, including © notice, is given to the source.

Do Financial Incentives Affect Fertility?Alma Cohen, Rajeev Dehejia, and Dmitri RomanovNBER Working Paper No. 13700December 2007, Revised May 2009JEL No. D1,H31,I38,J13,K36
ABSTRACT
This paper investigates how fertility responds to changes in the price of a marginal child and in householdincome. We construct a large, individual-level panel data set of married Israeli women during the period1999–2005 that contains fertility histories and detailed controls. We exploit variation in Israel’s childsubsidy program to identify changes in the price of a marginal child (using changes in the subsidyfor a marginal child) and to instrument for household income (using changes in the subsidy for infra-marginalchildren). We find a significant and positive price effect on fertility: the mean level of marginal childsubsidy produces a 7.8 percent increase in fertility. There is a positive effect within all religious andethnic subgroups, including the ultra-Orthodox Jewish population, whose social and religious normsdiscourage family planning. There is also a significant price effect on fertility among women whoare close to the end of their lifetime fertility, suggesting that at least part of the price effect is due toa reduction in total fertility. As expected, the child subsidy has no effect in the upper range of the incomedistribution. Finally, consistent with the predictions of Becker (1960) and Becker and Tomes (1976),we find that the income effect is small in magnitude and is negative at low income levels and positiveat high levels.
Alma CohenThe Eitan Berglas School of EconomicsTel Aviv UniversityRamat-Aviv, Tel-AvivISRAELand [email protected]
Rajeev DehejiaDept of Economics and The Fletcher SchoolTufts University114A Braker Hall8 Upper Campus RoadMedford, MA 02155-6722and [email protected]
Dmitri RomanovCentral Bureau of Statistics66 Kanfei Nesharim,Corner Bachi str.Jerusalem 95464 [email protected]
1
1. Introduction
This paper investigates empirically the effect of financial incentives on individuals' fertility
decisions. We construct a large, individual-level, panel data set, using non-public data from
Israel’s Central Bureau of Statistics (CBS), that matches fertility histories to detailed
controls including education, income, and religious affiliation during the seven-year period
1999 to 2005. We exploit the substantial changes in benefits during this period to study
how child subsidies affect fertility both in the population as a whole and in demographic
subgroups.
The literature on fertility goes back at least to Thomas Malthus and the nineteenth
century debate on the Poor Law (see Boyer 1989). Malthus argued that, by supporting the
poor, the Poor Law subsidized marriage and fertility by removing natural checks on
population growth, namely delayed marriage and abstention from sexual activity. The key
modern reference on fertility as an economic decision is Becker (1960), who argues that
children should be analyzed as durable consumption and production goods.1 Within the
Becker framework, demand for children responds to changes in the price of a marginal
child. We test this key hypothesis, as well as Becker's conjecture about the limited effects
of income changes on fertility.
The question of whether and to what extent fertility responds to financial incentives
is not only of theoretical interest but also has significant policy implications. Facing sharp
declines in birthrates in the recent decades, many developed economies have adopted either
explicitly pro-natalist policies (France, Germany, Sweden, and the Canadian province of
Quebec) or implicit subsidies to children through childcare (most Western European
countries, the United States, and Canada). At the same time, some developing countries
(most notably China) have used financial incentives to discourage fertility.2
By merging several non-public data sets maintained by the CBS, we create an
individual-level panel data set that contains 1.2 million person-year observations on
fertility for married women and that includes not only complete fertility histories but also
education, religion, immigrant status, and income for the woman and her husband. During 1 This canonical model has been extended in various directions by, for example, introducing family transfers (Cigno 1986) and social dynamics (Manski and Mayshar 2003, who discuss how fertility rates in Israel could decline in the overall population while at the same time increase in the ultra-Orthodox Jewish population). 2 Recent studies of China's policy to discourage fertility include Oster (2005), Ebenstein (2008), and Qian (2008).
2
the periods we study, there were a number of significant and unanticipated changes in the
level of the child subsidy, both increases and decreases, but no changes in eligibility.
Our identification strategy is based on exploiting variation in the child subsidy over
the seven-year period we study. Back-timing births to their date of conception – which we
assume to be nine months before birth – we estimate the impact of the subsidy that a
mother will receive for her next child (“the marginal child subsidy”) on the probability of
her becoming pregnant. We consider both the contemporaneous child subsidy (which is
relevant if a woman is making a myopic fertility decision) and the present value of the
child subsidy over the eighteen-year period in which she will receive it (which is more
appropriate if a woman is making a forward-looking decision). We use the child subsidy
for infra-marginal children and income two years before the incremental childbirth as
instruments for household income. We use a range of strategies to deal with potentially
confounding time effects in the data (including age, ethnic group, and education-specific
reference fertility and year fixed effects).
We find that a 150 NIS (about US$34)3 reduction in the monthly subsidy for a
marginal child reduces the probability of an incremental child by 0.78 percentage points (or
7.8 per cent relative to baseline fertility). We estimate a benefit elasticity of 0.15 and a
price elasticity of -0.422 for the population as a whole, and provide estimates for these
elasticities for different income and religious groups. The effect on fertility of the subsidy
for a marginal child is weakest among households in the upper part of the income
distribution – the households for whom the subsidies are least economically meaningful.
The effect of the subsidy is present across all religious groups but is strongest
among the ultra-Orthodox, whose norms discourage family planning, and Arab Muslims.
We also find an effect among women who are nearing the end of their lifetime fertility and
are unlikely to postpone fertility (those in the 35-to-40 and 40-to-45 age cohorts),
suggesting that the effect we identify is not wholly due to changes in the timing of births
and at least partly from changes in total fertility. Consistent with the conjecture in Becker
(1960) and the prediction in Becker and Tomes (1976), we find that the effect of income on
fertility is small and that this effect is negative at low levels of income and positive at
higher income levels.
3 During the period of our study, the average exchange rate of NIS to US dollars was 4.4.
3
While cross-country studies have found mixed, weak, or insignificant effects of
child subsidies on fertility,4 two recent studies using individual data have identified
positive and significant effects. Milligan (2005), using Canadian data, finds that the
introduction of a child subsidy in the 1990s had a significant positive effect on fertility.
Laroque and Salanié (2008), using French data and variation in the French tax code,
conclude that tax incentives affect fertility decisions in France.5 There is also a literature
that examines the effect on fertility of U.S. tax provisions and social policies benefiting
families with children ( Blau and Robbins 1989, Whittington 1992, Acs 1996, Fairlee and
London 1997, Moffitt 1998, Moffitt 2000, Groger, Karoly, and Klerman 2002, Dyer and
Fairlee 2003, Rosenzweig 1999, Joyce, Kaestner, and Korenman 2003, and Kearny 2004).
Overall, this literature finds no effects or modest effects.6
Our study differs from previous work, and contributes to the empirical literature on
financial incentives and fertility, in three ways. First, we have access both to a rich micro-
level panel data set on fertility histories and to significant variation in the financial
incentives for fertility. The combination of a large and comprehensive data set and
significant changes in policy allows for improved identification and estimation of the effect
of the child subsidy on fertility. For example, unlike previous work, we use controls timed
to the date of conception (when fertility decisions are made), rather than at the time of
birth. Similarly, we use detailed information on the ages of a woman's children to calculate
the precise change in the net present value of the subsidy for a marginal child and for the
woman's existing children.
Second, we are able to investigate how the effect of incentives on fertility varies
across ethnic, religious, and income groups. It has been suggested that the effect of
financial incentives on fertility is likely to vary both with economic development (see
Schultz 1973 and Jones and Tertilt 2008 for a useful survey) and with cultural norms
(Fernandez 2009). Israel provides a good setting for studying such variation. The secular
4 See, e.g., Demeny (1986), who reviews the mixed evidence on pro-fertility policies in France, Romania, Germany, and Hungary; Gauthier and Hatzius (1997), who provide cross-country evidence from 22 OECD countries; and Dunn (2003). 5 In addition, Schellekens (2006) examines data from the period 1983-1995 in Israel and seeks to estimate the effect of the child subsidy on the hazard rate of childbirth. The length of the period examined makes it difficult for this study to disentangle the effect of child subsidies from that of long-run fertility trends. 6 More recently Lalive and Zweimuller (2008) find significant effects of parental leave policies in Austria.
4
Jewish population resembles the population in OECD countries in many respects (with
high education and female labor force participation and a social norm of two or three
children), while the Arab Muslims population is similar to that of developing countries
(with low education and female labor force participation and a social norm of high fertility)
and the ultra-Orthodox population combines features of both (high education, higher
female labor force participation, and high fertility).
Third, although we focus on the price effect of the child subsidy on fertility, we also
contribute by using instrumental variables to identify exogenous variation in household
income and, in turn the effect of changes in household income on fertility.7 Hotz, Klerman,
and Willis (1997) and Jones, Schoonbroodt, and Tertilt (2008) stress the need for such
analysis. Although the negative association between income and fertility has been widely
documented (see Becker 1960, Borg 1989, Docquier 2004, and Jones, Schoonbroodt, and
Tertilt 2008), it has been recognized (since Becker 1960) that these results are plagued by
omitted variable bias. One approach used in the literature is to use the husband’s income or
occupation (e.g., Milligan 2005 and Jones and Tertilt 2008), but this could also be jointly
determined with a woman’s fertility. Although Hotz and Miller (1988) and Milligan (2005)
are able to identify both income and price effects, they also rely on the assumption that
husband’s income is exogenous. Black, Kolesnikova, Sanders, and Taylor (2008) use
shocks to coal prices to instrument for county-level income in coal-producing regions, but
do not identify the price effect. We use panel data and policy-driven variation in the
subsidies received for infra-marginal children to identify and take advantage of exogenous
variation in household income.
The paper is organized as follows. Section 2 describes our data set and the child
subsidy program in Israel. Section 3 discusses our identification strategy and specifications.
Section 4 presents our results. Section 5 discusses the magnitude of the effect, and Section
6 concludes.
7 An extensive literature examines the causal relationship in the other direction, i.e. from fertility to mother’s labor supply; see, for example, Angrist and Evans (1998).
5
2. The Data and Institutional Background
2.1 The Data
We use non-public individual-level panel data sets maintained by Israel’s Central Bureau
of Statistics (CBS), to which the CBS allows restricted access. Our data contain
information on a 40 percent random sample of women in Israel who were married, under
45, and had 2 children during the period 1999-2005. (Since women enter the sample when
they have two or more children and exit when they turn 45, it is not a balanced panel).8
Restricting the data to married women excludes very few births, since births to unmarried
women are uncommon in Israel.9 We look at mothers with two or more children because,
as we discuss in Section 2.2, the significant variation in subsidies occurred for third and
higher parity children, with only insignificant variation in the subsidies for the first two
children. Thus, although the effects of incentives on fertility decisions for first and second
births are of potential interest, they cannot be identified using our strategy. It is also worth
noting that a substantial majority of women in Israel have completed fertility of two or
more children.
We merge several data sets, each separately maintained by the CBS, to create a
comprehensive data set that includes fertility histories, education, religious affiliation,
ethnicity, and income. Below we describe briefly the process we follow and the
information available for individuals in our data set. A detailed list of variables appears in
Appendix A.
Fertility history and basic demographic characteristics: From the Population
Register’s data set maintained by the CBS, we obtain information on the following: the
woman’s date of birth, country of origin and year of immigration for individuals not born
in Israel, the country of origin and year of immigration for parents of Israel-born women,
the number of children and their dates of birth, and information about the husband – date of
birth, country of origin and year of immigration for men not born in Israel, and the country
of origin and year of immigration for parents of Israel-born men. We back-time from the
8 The sample excludes Arab Christians and others small minorities which account for less than five percent of the sample. 9 For example, in 2005 there were 2.3 per cent of all births were to unmarried mothers (3,349 births out of a total of 145,207).

6
date of birth to estimate the date of conception, which we use as the relevant date in our
data set.10
Education: We compile data on education of mothers and theirs husbands from
various data sets maintained by the CBS. The administrative records of Israel's higher-
education institutions provide information on the mother's and husband's most recent
academic degrees and the institutions that awarded them. For individuals who do not
appear in the higher education records, we obtain the information on education from the
school registry (created when parents register their children in public schools and public
kindergartens).11 For new immigrants who do not appear in one of the aforementioned
sources, we obtain data on years of schooling from the immigration registry (data that they
are required to provide when they immigrate to Israel).
In order to render the data on higher education degrees and years of schooling
comparable across different countries and databases, we code the mother's and husband's
education as a categorical variable on a 1 to 4 scale (for primary school, high school
graduate, college, and post-graduate education). Because education data are missing for
some women but available for their husbands, we code education as the maximum of a
woman and her husband’s education.12
Religion: Identifying the degree of religiosity for the Jewish population is
challenging, but essential for understanding their fertility decisions. In Israel, there are
three main degrees of religiosity for the Jewish population: secular, Orthodox and ultra-
Orthodox. The boundaries among these three groups are sometimes unclear. We infer the
degree of religiosity for Jewish women by using information on the kind of kindergarten
10 An issue with using live births to determine the date of conception is that we miss aborted or miscarried births. Abortions, although legal, are less important in Israel than, for example, the United States with one abortion to every 7 live births in Israel compared to a 1:4 ratio in the United States. 11 In Israel, virtually all primary schools and pre-school kindergartens are supported with public funds. Information on parents' school years was obtained for parents who had children already enrolled in primary school or public kindergartens and recorded information regarding their own years of schooling when registering their children. 12 Ultra-Orthodox Jewish men missing administrative records on education and reporting more than 12 years of education in the school or immigration registry are coded as having only 12 years of schooling; since most Ultra-Orthodox men spend many years engaged in religious study, any additional years of schooling that are not recorded are unlikely to reflect in their earnings potential.

7
and school that their children attend. Portnoi (2007) has shown that this method is more
reliable than alternatives. 13
Income: Finally, income data are obtained from a matched employer-employee
database, which is based on income tax files. We have the following information for both
mothers and their husbands: employment status (self-employed or wage earner), the
number of jobs held, the number of months worked, gross income, industry of
employment, income tax, mandatory health insurance contributions, and social security
contributions. We use these data to create socioeconomic controls.14
2.2 Institutional Background: Child Subsidies in Israel
The child subsidy is a non-taxable payment made to all mothers of children under the age
of 18, with the amount of the payment a function of the number of children (see Table 1
and Figures 1a and 1b). The child subsidy is one of Israel’s most important welfare
expenditures. In 2004, 947,000 mothers received child subsidies, paid to support
approximately 2.2 million children. Child subsidy outlays in 2004 were 4.6 billion NIS.
During the period we study, total child-subsidy expenditure ranged from 0.8 per cent to 1.5
per cent of Israel’s GDP, peaking in 2000 and declining significantly after the 2003 reform
that we describe below.15
Israel first introduced the child subsidies in 1959, and has revised its coverage (age,
family size, veteran status) and level many times since then. The program originally
covered children under age 14, which was extended to age 18 in 1965. Coverage was
initially limited to families with four or more children, but was extended in 1972 to
families with three or more children and in 1975 (in the so-called Ben-Shahar Reform) to
all children under age 18. In the 1990s, child subsidies for the first (and eventually second)
child of families with three or fewer children were revoked, but eventually reinstated.
Another feature of the program that has varied is eligibility based on military veteran
13 For example, Dahan (1998) suggests using husbands attending yeshiva as their last school to identify the Ultra-Orthodox. But this method of identifying religiosity has been criticized for its inability to distinguish between the secular and the Orthodox, and has been shown to bias downward estimates of the Ultra-Orthodox population. 14 It is widely believed that income is systematically underreported for Ultra-Orthodox men, since they are less likely to participate in the formal labor market. This implies that we are more likely to mis-categorize Ultra-Orthodox women when we split the sample by household income. 15 For a review of the child subsidy system and a wealth of descriptive statistics about it, see Frish (2004).
8
status, which was required until the mid-1990s but not afterwards. The period we study
(1999-2005) includes significant variation in the level of child subsidies but not in
eligibility and coverage. In general, the child subsidy has tended to increase over time,
although in the period we study there were a number of unanticipated policy changes –
induced by shifts in Israel’s complex coalition politics – that magnified or negated this
trend. The Halpert Law, which passed in November 2000 and was implemented from
January 2001 onward, increased the benefit for fifth and higher-parity births by 33 to 47
percent. The so-called Netanyahu reform in June 2003 significantly reduced benefits so
that children born after June 2003 receive a subsidy equivalent to that of the first two
children in the family regardless of their birth parity. For example, in 2002 a family with
six children would receive 790 NIS per month for their next child, whereas after June 2003
such a family would receive only 150 NIS per month for an extra child (a five-fold
reduction). Children born before 2003 continue to receive higher benefits after 2003 during
a transition period. Although child subsidies were reduced across the board, given the pre-
2003 non-linearity in the subsidy, the biggest reduction in benefits post-2003 was for large
families.
Table 1 and Figure 1a summarize the child subsidy for a marginal child. Figure 1b
plots the total child subsidy to families based on the current number of children. The
schedule of subsidies has several notable features. Before 2003, the marginal benefit
increased non-linearly: a third child received approximately double the subsidy of each of
the first two children and a fifth or higher marginal child received between 3.75 and 5
times as much. The benefits also varied from year to year (Figure 1a). Before 2003 changes
tended to accentuate the non-linear increase in marginal child benefit with parity, whereas
from after 2003 the benefit schedule has become linear for the marginal child. Furthermore,
comparing Figures 1a and 1b, we can see that the child subsidy has changed more
dramatically for the marginal child than for infra-marginal children; this allows us to
exploit both sources of variation to identifying separately price and income effects.
A natural concern in exploiting changes in child subsidy levels is that other
government programs may have changed concurrently. However, changes in the child
subsidy were unanticipated and largely driven by changes in the power that religious
parties, which strongly support child subsidies, wielded in the complex coalition politics of

9
Israel. In 2001, the aforementioned Halpert Law focused on the child subsidy, and was not
accompanied by any other changes in government programs. The 2003 revision of child
subsidies was accompanied by other fiscal reforms, but these reforms did not have a
significant impact on married families with children.16
3. Theoretical and Empirical Framework
3.1 Theoretical Framework
We examine the fertility decision within the Becker (1960) framework. Children are
viewed as durable consumer goods, and there is demand for children along with other
commodities. Variation in the child subsidy will have four types of effects. (See Hotz,
Klerman, and Willis 1997 for a more detailed discussion.)
First, reductions in the child subsidy decrease the subsidy for the marginal child
and, in turn, increase the net-of-subsidy price of the marginal child. We would expect the
price effect to reduce the demand for children, since any income effect from the marginal
child subsidy is likely to be small.
Second, reductions in the child subsidy reduce payments for infra-marginal
children, leading to a reduction in income. For example, a family that had four children
received a subsidy of 1259 NIS in 2002, 937 NIS in 2003, and only 756 NIS in 2005. Thus,
reductions in the infra-marginal child subsidy also have an income effect. Becker (1960)
hypothesizes that income effects on fertility are likely to be small, in part because of his
conjecture that households respond to fertility along both quantity and quality dimensions.
The standard presumption in the literature is that children are normal goods, although
Becker (1960) notes that this not an implication of the model and subsequent authors have
conjectured that the income elasticity of fertility may vary with the income (Becker and
Tomes 1976) and the level of development (e.g., Galor and Weil 1999).
Third, there is also scope, potentially, for dynamic fertility effects. A reduction in
the child subsidy may lead to a temporary postponement of fertility, an increase in the age
at first birth, an increase in the time between births, and effects on completed family size
16 The “Netanyahu reforms” also included cuts in unemployment benefits and income-maintenance benefits, but very few families in our research sample could have been affected by these changes.

10
(see Heckman, Hotz, and Walker 1985, Heckman and Walker 1990, and Pettersson-
Lidbom and Skogman Thoursie 2009).
Fourth, there may be quality effects in addition to quantity effects (see Angrist,
Lavy, and Schlosser 2006 and Black, Devereux and Salvanes 2007). For example, a
reduction in the child subsidy may not only reduce the probability of a marginal child, but
may increase the investment in infra-marginal children.
In this paper, we address primarily the first three of these effects. To examine the
first effect our key right-hand-side variable is the marginal child subsidy, which is
inversely related to the price of a marginal child. We examine the second effect by
controlling (and instrumenting, as we explain below) for net household income. The third
effect is more difficult to capture since postponement and completed fertility are difficult to
infer in a six-year data window. We will, however, split our results by age, and in particular
present results for women aged 35 and older, a group for whom it is difficult to postpone
fertility and for whom any observed reduction in fertility is very likely to correspond to a
reduction in completed fertility. Finally, we cannot address quantity-quality issues given
the variables we observe in, and the time horizon of, our current data set.
3.2. Empirical Strategy
Our empirical strategy is based on examining the fertility decision for a marginal child.
Thus, we time births to the month of conception (estimated as nine months prior to the
birth of a child) and use an indicator for having become pregnant in that year as the
outcome.
Our key right-hand-side variable is the child subsidy for the marginal child, i.e., the
subsidy a woman would expect to receive for her next child given the number of children
under age 18 that she has at that point. Thus, the incremental child subsidy varies by the
number of prior children younger than age 18 and by year. Furthermore, the age of
previous children under age 18 determines how long a mother will expect to receive a
given level of child subsidy. For example, a fourth child preceded by three children aged
one, two, and three would receive the fourth-child subsidy (e.g., 640 NIS per month in
2005) for the next 15 years, but a fourth child preceded by three children aged 16, 17, and

11
18 would receive the fourth-child subsidy for one year only and within three years would
transition to receiving the first-child subsidy (e.g., 150 NIS) for the next 15 years.
Our analysis considers two polar cases. First we consider the marginal child
subsidy, ignoring the age of infra-marginal children. This assumes that women respond
myopically to the marginal child subsidy, i.e., ignore the fact that the subsidy will decline
as their previous children turn age 18. Second, we construct the present discounted value of
the stream of future subsidies for the marginal child. The present-value calculation is
forward looking in the sense that it correctly accounts for previous children ageing out of
the subsidy (i.e., turning 18) and future changes in the child-subsidy schedule that are
anticipated under the current rules. 17
In terms of both interpretation and identification we prefer the second definition,
although we will present both polar cases for our base specification. The marginal child-
subsidy variable is likely to underestimate the true effect of the child subsidy, because it
codes mothers with older children as receiving a high subsidy even though their children
will soon age out of the high subsidy.
A related issue is that the marginal child subsidy is identified only by year and by
child parity. Thus since we control for the previous number of children, our identification is
driven only by between-year variation. Instead, the present value of the marginal child
subsidy is appropriately forward looking with respect to the age distribution of previous
children and, furthermore, varies not only by parity and by year, but also within parity-year
cells because of variation in the age distribution of previous children. The difference
between the two definitions of child subsidy is likely to be greatest for the secular and
Orthodox Jewish populations and smaller for the ultra-Orthodox and Arab Muslims,
because the latter two groups have larger families and a more regular spacing of children.
We believe that it is reasonable to think of these two measures of the marginal child
subsidy as exogenous with respect to fertility choices. As discussed in Section 3.1,
variation in child subsidy was policy driven and largely unanticipated. Furthermore, at the
17 The child-subsidy reform in 2003 announced a benefit schedule for current and future children until 2009,
which we assume remains in place thereafter. Our calculation of the present value of the marginal child subsidy uses a discount rate of 5 per cent, and assumes that all live births survive to age 18. By ignoring infant mortality, we somewhat overstate the present value of the child subsidy. However, infant mortality rates in Israel, including those for the Arab Muslim population, are fairly low, even by OECD country standards.
12
individual level, the incremental child subsidy is not directly tied to the household’s work
and income decisions, and thus is independent of labor decisions. A possible concern is that
by choosing their level of fertility households implicitly choose their level of child subsidy;
due to the non-linear increase in child subsidy with the number of children, especially
before 2003, households that opt for high fertility also select into a high child subsidy. We
address this concern by controlling for the number of previous children.
Another key right-hand-side variable is log net household income (which includes
earnings net of taxes and the child subsidy for infra-marginal children). By controlling for
income, we ensure that we are identifying the price effect of a change in the marginal child
subsidy, and of course obtain a direct estimate of the effect of income on fertility.
Controlling for income, however, creates several challenges. Even though we control for
household income at the time of conception – assumed to be nine months prior to birth – it
is possible that households anticipate future births by more than nine months in making
their work decisions. Furthermore, since our data are annualized, for children born after
September our income measure includes up to three months of post-birth income. This is a
concern only if mothers stop working; if they continue to work, we will pick up maternity-
leave payments in our data.
Our strategy is to instrument for household income by using variation in the child
subsidy for infra-marginal children and lagged household income. The infra-marginal child
subsidy is plausibly exogenous for the reasons outlined above for the marginal child
subsidy. Lagged household income is plausibly exogenous, we believe, since it is difficult
for households to anticipate pregnancies with precision and to adjust their work a year
before the conception (and two years before the birth) of the marginal child.
It is also important to control for the age distribution of previous children, for
example not to compare a woman who selects into a pattern of high and frequent fertility
with a woman who has achieved her target fertility at a younger age. Thus, we include the
mother’s age at first birth and linear and quadratic terms in the months since last birth.
This, coupled with the number of previous children (including also those above age 18),
allows us to identify high fertility women with early and regular fertility.
Given that part of our identification comes from between-year variation in child
subsidies, we are concerned with confounding changes in the child subsidy with time-
13
varying factors omitted from our model, such as macro events or simply underlying time
trends in fertility. We address this concern in several ways. First, we explicitly control for
two key macro variables: GDP growth and the unemployment rate (although with five time
series observations, this approach has limited power). Second, we control for reference
fertility, where for a given woman we look at the total number of children for a woman of
the same age five years ago within a reference group defined by religion, education, and
year. Finally, we control for year fixed effects in some specifications.
We include additional controls for education and religion (as described above:
secular Jewish, Orthodox Jewish, ultra-Orthodox Jewish, and Arab Muslim), and husband’s
age.18 When splitting the results by religious group, we include controls for immigrant
status among the Jewish population.
Thus, our specification takes the following form:
Pregnancyit =α + Child allowanceitδ + logHousehold incomeitγ +X itβ + Reference Fertilityitϕ + εit ,
where we instrument for household income using lagged household income and the infra-
marginal child subsidy. We use a linear probability model for our main specification, but
also present probit results for comparison. We cluster standard errors by year × the age
distribution of children, which is the level of variation of the child subsidy.19
4. Results
4.1 Summary Statistics
Table 2 presents summary statistics for our sample. The main sample consists of
approximately 1.3 million person-year observations. Of these observations, 50 per cent are
secular Jewish, 10 per cent are Orthodox, another 10 per cent are ultra-Orthodox, and 20
per cent are Arab Muslim. The average age of the sample is 35. Average annual household
income is approximately 120,000 NIS (2006). Notably household income is 30 percent
higher for the secular Jewish and Orthodox Jewish populations and much lower for both
the ultra-Orthodox and Arab Muslims. This is partly due to low participation rates of ultra-
18 We do not include the woman’s age as it is highly collinear with age at first birth. 19 In particular, this gives 1686 clusters. Our results are similar for other plausible clustering schemes.

14
Orthodox men and Arab women in the labor force (50 per cent and 21 per cent
respectively).
Table 2 indicates that the average number of children per woman is 3.4.20 This
mean varies by income group and by religious group: fertility declines from 3.93 children
among below-poverty-line mothers to 2.97 in the top decile of income and ranges from
2.68 in the secular Jewish population to 4.76 and 4.23 in the ultra-Orthodox Jewish and
Arab Muslim populations. Family size is highly skewed in the ultra-Orthodox and Arab
Muslim populations, with the mode being children or more.
Figures 2 and 3 provide a snapshot of the underlying time trends in fertility. In
Figure 2, there are no dramatic fluctuations in the probability of pregnancy from 1999 to
2005. There is a small but detectable downturn among the ultra-Orthodox and Arab
Muslims and for the below-poverty-line income group from 2003 onward. Figure 3, which
splits the data by income groups and by parity, shows a similar pattern in the low-income
group: a small decrease in the probability of pregnancy from 2003 onward. The middle-
income group shows some effect for higher parity births, and the high-income group shows
no discernable pattern.
In Table 3, we regress the probability of pregnancy on year dummies, including a
wide range of controls (excluding the child-subsidy variables), and find no significant year
effects for the full population and for the Jewish subpopulation. For Arab Muslims, we find
no significant effect before 2003 and a negative and statistically significant effect from
2003 on. Most other covariates enter the regression in the expected direction. Husband’s
age is a negative predictor of the wife’s pregnancy, as is own and husband’s work status.
Age at first birth is positively associated with pregnancy because it identifies women who
begin their fertility at a later age. The quadratic in months from last birth indicates an
increasing probability of pregnancy up to 28 months, consistent with plausible patterns of
spacing between births. For the secular and Orthodox populations, income is positively
associated with the probability of fertility, which is consistent with the perception in Israel
that larger families are associated with wealth. There is no significant pattern among the
20 This is higher than the average level of fertility among Israeli women (2.9 children) because our sample consists of women with two or more children.

15
ultra-Orthodox, which is consistent with the low income and labor force participation and
high fertility rates associated with this group.
Finally, it is notable that we find a consistently negative and statistically significant
effect of reference fertility: if a woman’s reference group had a higher number of children
five years ago, then she is less likely to become pregnant. There are several possible
interpretations of this. It could reflect a reversion to the mean among high-fertility groups.
It is also consistent with women increasing the spacing between births relative to their
fertility reference group, even if they have the same target fertility.
4.2 Baseline Specification
Table 4 presents several versions of our baseline specification: controlling for reference
fertility or also for year fixed effects; using marginal child subsidy or the present value of
marginal child subsidy; using income dummies or log income; and probit, linear
probability model, and instrumental variables specifications.
In column (1), we use the marginal child subsidy as the treatment variable and find
a positive and statistically significant (at the one percent level) effect of the child subsidy,
with a coefficient of 0.000016. To provide a more transparent interpretation of the child
subsidy variable, we rescale this coefficient as follows: for a monthly child subsidy of 150
NIS, the probability of pregnancy increases by 0.000016 × 150 = 0.0023, which is
presented as a probability (0.0023 × 100 = 0.23 per cent) in the second last row of Table 4.
Subsequent tables directly report the child subsidy coefficients scaled in the same manner.
It is convenient to scale the coefficient by 150 NIS per month because in addition to being
the child subsidy for all parities in 2003 it is also a realistic between-year change in child
subsidy for a given parity. We can compare the 0.23 percentage point increase in the
probability of pregnancy with the underlying probability of pregnancy in a given year of
10.3 per cent.
In column (2), the estimated effect of the net present value of the child subsidy is
larger: a 0.78 percentage point increase in the probability of pregnancy for a 150 NIS
increase in subsidy. As discussed in Section 3.2, there are both substantive and econometric
reasons to expect a larger coefficient. Substantively, mothers are more likely to respond to
changes in the net present value of the subsidy over a child’s first 18 years than to a one-

16
year change in the subsidy. Econometrically, when we use the marginal child subsidy we
incorrectly code some mothers as receiving a high marginal subsidy (e.g., for a fifth child)
even though she will receive a high subsidy only while her existing children remain
younger than age 18. For both reasons, we prefer the specification that uses the net present
value of the marginal child subsidy, and will present it in subsequent tables.
Whereas the specifications in columns (1) and (2) control for household income
using dummy variables, columns (3) and (4) use linear probability models to control (and
instrument) directly for log household income. The first stage is presented in Appendix B.
Our two instruments enter with a high degree of significance that exceeds standard
thresholds for weak instruments. The coefficient for the present value of the child subsidy
is somewhat larger in column (3) than column (2), but when we instrument for household
income in column (4) we find an effect very similar to that in column (2) (a 0.86
percentage point increase in the probability of pregnancy with a 150 NIS child subsidy).
The coefficient for log household income is negative (and statistically significant)
in column (3), but becomes much smaller and ceases to be significant when we instrument
for income in column (4). This suggests that in column (3) we are, in part, picking up the
simultaneous decision to reduce work and increase fertility, which is cleansed by our
instrumental variables strategy in column (4). The magnitude of the coefficient in column
(4) suggests that on average the demand for children is essentially unresponsive to income
changes. However, when we split the sample by religion and income groups, we will see
that the average masks interesting heterogeneity in the effect.
Columns (5) to (8) present the same specifications with year fixed effects. We
continue to find positive and statistically significant effects for both the marginal child
subsidy and the present value of the marginal child subsidy, although the coefficients are
approximately twice as large (a 0.5 percentage point effect for the marginal child subsidy
and a 1.9 percentage point effect for the present value of the marginal child subsidy). By
taking out between-year variation, we are identified by comparing the within-year effects
across parities for the marginal child subsidy or within-year effects across parities and age
distributions for children for the net present value of the child subsidy.
Looking at the year effects, we see that there are positive (and significant in column
(4)) year dummies for 2003 to 2005, the years in which the child subsidy was reduced
17
dramatically. Nonetheless, due to the particularly unexpected nature of the policy-driven
variation in the child subsidy (especially in 2003), we believe it is useful to exploit
between-year variation in our identification. Furthermore, our results in Table 3 (and
Figure 1) suggest that the year effects in the raw data are modest in magnitude. Since the
results in Table 4 suggest that this is a conservative choice with respect to our child subsidy
coefficient, we focus on the specification in column (4) in our subsequent tables.
The other coefficients in Table 4 are in the same direction and have similar
magnitudes as our results in Table 3. Thus, in subsequent tables we will suppress these
coefficients and present the child subsidy and income effects (with the child subsidy effects
scaled as described above).
4.3 The Effect by Income Category and by Religious Group
In this section, we consider the effect of child subsidy in subgroups defined by income and
by religion. These results are of interest for several reasons. First, splitting the sample by
income category provides an important plausibility check of our results. Since the marginal
child subsidy constitutes a smaller percentage of household income at the upper end of the
income distribution, we would expect the child subsidy effect to be smaller in this group as
compared to the middle and lower ranges of the income distribution. Second, splitting the
sample by religious and ethnic group provides an interesting window on the effect of child
subsidies and income on fertility within groups which have very different social norms,
fertility patterns, and labor force participation rates. As noted in the Introduction, the
secular Jewish population (highly educated, with high labor force participation among
women) broadly resembles the population in OECD countries. In contrast, the Arab
Muslim and ultra-Orthodox Jewish populations have strong social norms that favor lower
female labor force participation and high fertility, a pattern more characteristic of
developing countries, and child subsidies are economically more relevant for these
populations because of their lower household income. The results are presented in Tables 5
to 7.
We split the results by income category in Table 5, and find that the effect of the
marginal child subsidy is positive, statistically significant, and large in magnitude for the
below-poverty and middle income categories. A 150 NIS monthly increase in the present

18
value of the marginal child subsidy leads to a 1.01 and 0.88 percentage point increase in the
probability of pregnancy compared to 13.9 and 8.7 per cent baseline probabilities of
pregnancy. In contrast, and as expected, the effect is insignificant and one-fourth as large in
the high-income group.
The income effect differs across income categories. For below-poverty-line
households, it is negative, albeit small in magnitude: a 10 per cent increase in income leads
to a 0.6 percentage point decrease in the probability of pregnancy relative to a baseline
probability of 13.9 per cent. In contrast, for middle- and high-income households, the
income effect is significantly positive, although still small in magnitude: a 10 percent
increase in income leads to 0.1 and 0.09 percentage point increases in the probability of
pregnancy relative to respective baselines of 8.7 per cent and 6.4 per cent. We discuss
possible interpretations of these results in Section 5.2.
The child-subsidy effect is statistically significant within each religious and ethnic
group (Table 6). It is smallest for the secular Jewish and Orthodox populations, and
progressively larger for the ultra-Orthodox and the Arab Muslims. For the last two groups,
a 150 NIS increase in the child subsidy increases the probability of pregnancy by
approximately one percentage point. Although these two groups also have high underlying
fertility rates and family sizes, it is nonetheless noteworthy that we find the greatest
responsiveness to financial incentives in the two groups that have strong religious and/or
social norms of high fertility. The income effect is positive and statistically significant in
the secular Jewish population, and negative and statistically significant among the ultra-
Orthodox and Arab Muslims, with relatively small magnitudes. Given our results in Table
5, this pattern is not surprising since the secular Jewish population is more likely to be
middle or upper income and the ultra-Orthodox and Arab Muslims tend to be poorer.
Finally, Table 7 splits the sample by income category and by religious and ethnic
group. Among both the secular and Orthodox, we find a decrease in responsiveness to the
child subsidy as income increases, with the effect at one-half to one-third the magnitude of
the lowest income category. Among the ultra-Orthodox and Arab Muslims, the effect is
strongest in the middle-income category. This is plausible since the low-income categories
in both groups are among the poorest segments of Israeli society, for whom children are an
expensive investment, even including the child subsidy. Although we do find a significant
19
response to the child subsidy in the top income decline among the ultra-Orthodox and Arab
Muslims, it is again worth noting that many of these individuals would be in the middle
income category in the overall income distribution. We continue to find positive income
effects in the (middle- and upper-income) secular population, and significantly negative
effects in the ultra-Orthodox population. The one result inconsistent with Tables 5 and 6 is
a positive income effect among Arab Muslims below the poverty line.
4.4 The Effect by Age
A qualification to the results we have presented thus far is that they pertain to the short-run
impact of financial incentives on fertility. Over a longer horizon, additional effects can
come into play. The policy change can gain or lose credibility over time. In the case of the
child subsidy, anecdotal evidence suggests that, although there was initial uncertainty about
the 2003 reform, it quickly gained credibility during the first few months of its
implementation. As noted in Section 3.1, our results identify only the immediate impact of
financial incentives on fertility, rather than their impact on total fertility. Women could
postpone pregnancies if they perceive the policy not to be credible, or the policy could also
affect age at first birth or the optimal spacing and timing of children.
Unfortunately, since the change in child subsidy that we are studying is recent and
the horizon of our data is only six years, our data set does not enable us to identify the
impact on the total fertility rate for the overall population. However, for women nearing the
end of their lifetime fertility, a temporary reduction in fertility is likely to translate into a
permanent reduction in fertility.
Table 8 breaks down our results by age. We find a significant and positive effect of
the child subsidy for each age category, with the coefficient decreasing with age. The
coefficient for 20-to-25-year-olds is more than double the coefficient for 35-to-40-year-
olds and more than five times the coefficient for 40-to-45-year-olds. Since the probability
of pregnancy decreases significantly with age, the magnitude of the effect relative to
underlying fertility is greatest among women aged 35 to 40. Although not as stark as for
40-to-45-year-olds, it is also likely that a postponement of fertility for this group will
reduce total fertility. We find a negative and statistically significant income effect among
20
younger mothers, although as in previous tables the magnitudes are small, and no
significant income effect among mothers older than 30.
Overall, these results suggest that our average child subsidy effect is not due only to
postponed fertility; it is at least partly due to a reduction in total fertility.
5. The Magnitude of Price and Income Effects
5.1 Price and Benefit Elasticities
Calculating the price elasticity of fertility is complicated by the lack of detailed data on the
marginal cost of children. However, a back-of-the-envelope calculation is possible using
tabulations on the marginal cost of children from Israel’s National Insurance Institute. The
estimated marginal financial cost of a child ranges from 980 NIS per month for the first
child to 770 NIS per month for fifth and subsequent children.21 To this we add estimated
foregone earnings as a result of childbearing. Since Israel provides three months of paid
maternity leave, the primary foregone earnings from childbearing are for those mothers
who transition out of the labor force. Thus, our back-of-the-envelope estimate of foregone
earnings due to childbearing is the product of average annual earnings among working
mothers and the proportion of mothers who leave work as result of having an additional
child.22
In keeping with our previous calculations, we examine the impact of a 150 NIS
change in the child subsidy, which roughly corresponds to the reduction in the marginal
child subsidy for a third child between 2002 and 2003. For a third child, a 150 NIS
reduction in the child subsidy raises the cost of a child by 18 per cent.23 Based on Table 4,
21 The National Insurance Institute estimates for 2003, in NIS per month, are as follows: first child 980; second child 900; third child 850; fourth child 800; and fifth and further children 770. See Sabag-Andelblad (2005). 22 There are many reasons to be cautious about this imputation. Working and non-working mothers differ along an array of observable (and most likely unobservable) dimensions. This calculation does not account for either of these. 23 We compute the price elasticity as follows. We consider an incremental child to a mother who already has two children and a change in child allowance from 300 to 150 NIS per month. The National Insurance Institute estimates the financial cost of a third child at 850 NIS per month. We estimate foregone earnings as the product of a working mother’s annual earnings (approximately 60,600 NIS) and the incremental proportion of mothers who leave work because of a third child (0.058). Thus, the total cost changed from 850+(60,600x0.058/12)-300=843 NIS to 850+(60,600x0.058/12)-150=993, or an 18 per cent increase in cost.
21
this is associated with a 7.5 per cent reduction in fertility or an elasticity of 0.42 (with a
standard error of 0.06).24
The finding that fertility is inelastic with respect to changes in the price of children
accords both with the prior literature and Becker’s (1960) theory of fertility, which
suggests that the demand for children is akin to the demand for capital goods (whose price
elasticity of demand is known to be low; see for example Chirinko 1993). Laroque and
Salanié (2008) find a lower elasticity, 0.2. Their estimate, however, is derived from a
structural model in which a woman assumes that each child is her last. In contrast, our
estimates are for a marginal child conditional on the existing number of children.
Splitting the results by income group (Table 9), we find the largest price elasticity
in the middle-income group and the lowest elasticity in the below-poverty-line income
group. Although the high-income group is the least responsive to the child subsidy in
absolute terms, it also has the highest foregone earnings from an additional child; this in
turn means that the percentage change in the cost of an incremental child due to the change
in child subsidy is lower than for the below-poverty-line income group. When we split the
results by religious and ethnic group, we find the largest elasticity (0.54) among Arab
Muslims and the second highest elasticity (0.46) in the secular Jewish population. Again,
the latter is due to the fact that the secular Jewish population has higher income and
foregone earnings from an additional child than other religious and ethnic groups.
Alternatively, we can scale our results as a benefit elasticity. A 150 NIS reduction
in the monthly child subsidy corresponds to a 50 percent decrease in the benefit for the
marginal child, which from Table 4, column (2), leads to a 7.5 per cent reduction in fertility
and to a benefit elasticity of 0.15. Milligan (2005) finds a benefit elasticity of 0.107 for
Quebec and notes that this falls into the range of previous estimates (a long-run cross-
country elasticity of 0.16 in Gauthier and Hatzius 1997; an elasticity of 0.05 to 0.11 for
Canada in Zhang, Quan, and Meerbergn 1994; and elasticities ranging from 0.127 to 0.248
in Whittington, Alm, and Peters 1990; see Milligan 2005).
24 For a 150 NIS change in child allowance, we calculate from Table 4, column (2), that the change in fertility is 0.0000517 × 150 = 0 .0078. Thus, for a baseline probability of pregnancy of 0.103 (from Table 2, column (1)), we obtain a 0.075 percent change in fertility and an elasticity of 0.075/ 0.178 = 0.42. Standard errors are computed using the delta method, assuming that fertility is the only source of uncertainty and that cost data are not stochastic.
22
When we split the results by income categories, we find elasticities ranging from
0.085 for the high-income group to 0.19 for the below-poverty-income group. When we
split by religious and ethnic group, we find the largest elasticity among Arab Muslims, and
perhaps surprisingly the lowest elasticity in the ultra-Orthodox Jewish population. The
reason for the latter is that although the ultra-Orthodox are highly responsive to changes in
the child subsidy they also have a very high baseline level of fertility.
5.2 The Impact of the 2003 Reform
To get a sense of the magnitude of the price effect on fertility, we estimate the number of
children who would have been born in 2004 absent the 2003 reform – the largest policy
change during the period we examine – and compare the result to the number of children in
fact born in 2004. To this end, we first estimate for each woman the present value of the
subsidy for a marginal child that she would have received in 2004 in the counterfactual
scenario that the 2003 reform did not occur, and then estimate her expected fertility in this
scenario. We then compare the results obtained for births in the counterfactual scenario
with the number of children actually born in 2004.
Table 10 presents the results for the population as a whole and for subgroups. We
estimate that married women with at least two children would have given birth to
approximately 5400 additional children in 2004 – an increase of 11.8 per cent – if the 2003
reform had not reduced child subsidies.25 The estimated effect of the 2003 reform is largest
among Arab Muslims, for whom we estimate a reduction in births of 19.7 per cent. The
reduction is also large – 12.3 per cent – among mothers below the poverty line.
5.3 The Sign and Magnitude of the Income Effect
In contrast to the robustly positive price effect of child subsidies on fertility, we find
substantial heterogeneity in the income effect. In the overall population, there is no
significant effect, but this is because a negative income effect in below-poverty-line
households offsets a positive effect in middle- and high-income households. This is
initially surprising, since the literature on growth and fertility associates a negative income
25 The estimates were first made for our 40% random sample of the population of women who were married and have at least 2 children, and then multiplied by 2.5 to obtain estimates for the population as a whole.
23
effect with wealthier populations and a positive income effect with poorer and less
developed populations. However, Becker and Tomes (1976) argue that precisely such a
pattern could be observed in micro data. In particular, in a model where child quality is
partly inherited the income elasticity of the parents’ own contribution to quality will tend to
be high at low income levels and decline with income. This leads to an increase in the
observed income elasticity of quantity with income and in turn to the pattern that we
observe. Sacerdote and Feyrer (2008) offer a complementary explanation in which initial
increases in income and female labor force participation reduce fertility, but eventually
fertility increases with income as women bear less responsibility for childcare. Another
possible explanation is social norms: large families are still commonly associated with
wealth in the Israeli context.
Notwithstanding the varying sign of the income effect, our most consistent finding
is that the magnitude of the income effect – whether positive or negative – is small: a 10
percent increase in income leads to a less than a one percentage point change in fertility.
This is underlined in Table 9 in which the estimated income elasticity ranges from -0.066
for the ultra-Orthodox to 0.043 for the secular population. This is consistent with Becker’s
(1960) conjecture that the (quantity) elasticity of income is small and with the income
elasticity estimated by Hotz and Miller (1988). Black et al. (2008) find a much larger
income elasticity, although their estimate is an average effect from a significant structural
shock to household income (coal prices in coal-producing regions), whereas our estimate is
a local average effect among those induced to change fertility as a result of changes in the
infra-marginal child subsidy and variation in lagged household income.
6. Conclusion
This paper has used a large individual-level panel data set with detailed controls and
variation in Israel’s child subsidy to examine the effect of financial incentives on fertility.
We have studied not only the effects of incentives on fertility in the population as a whole,
but also how these effects vary across income, ethnic, religious, and age subgroups. We
have also been able to separate the price and income effects of changes in the child
subsidy.
24
We find a consistently positive effect of the child subsidy for a marginal child on
fertility. The effect is present within all religious, ethnic, economic, and age subgroups,
except those in the top decile of the income distribution. The fact that we find an effect
even among women in the 35-to-40 and 40-to-45 age groups suggests that the effect we
identify is at least in part an effect on total fertility and not only on the timing of births.
Corroborating Becker’s (1960) conjecture, we find that the magnitude of the
income effect on fertility is uniformly small. Although cross-country and within-country
time-series evidence suggests large income effects, our results indicate that over a short
time horizon, and when identified by plausibly exogenous variation, income effects on
fertility are small in magnitude compared with price effects. Our results with respect to
income effects also match the pattern conjectured by Becker and Tomes (1976), namely a
negative income effect in the low-income group and a positive income effect in the higher-
income group.
Overall, our results suggest that policies that change the price of a marginal child
can be an effective instrument for governments that seek to influence the fertility rate over
a short time horizon. For example, we estimate that Israel would have had 12 per cent more
births in 2004 if the child subsidy had not been reduced in 2003. In contrast, government
policies that affect income should not be expected to have a meaningful impact on fertility
over a short time horizon. For developing countries, this implies that increases in income
resulting from economic growth are unlikely to succeed in substantially reducing birthrates
over a short horizon and that attaining such a reduction, if it were deemed to be desirable,
would require policies that raise the price of a marginal child.

25
Appendix A: Description of the Variables
Variable Description Pregnant Equal to 1 if the woman was pregnant in the calendar year and 0 otherwise. It is calculated by
back-timing 39 weeks from the child’s date of birth. Marginal child subsidy The value in 2007 NIS of child subsidy that will be given to the next child, if born. PV of marginal child subsidy The present value in 2007 NIS of the marginal child subsidy that a child will receive until age
18, using the announced benefit schedules and a discount rate of 5 per cent. Infra-marginal child subsidy Child subsidy for existing children in 2007 NIS. Husband's age The age of the husband in years. Mother working Equal to 1 if the mother had a positive annual salary and 0 otherwise. Husband working Equal to 1 if the husband had a positive annual salary and 0 otherwise Max education Maximum of husband’s and mother’s level of education. Equal to 1 for primary school, 2 for
high school graduate, 3 for college, and 4 for post-graduate education. Age at first birth Mother’s age in years at first birth. Reference fertility The average number of children born five years ago within a reference group defined by a
woman’s religion, age, and education, and year. Months from last birth The number of months since the last birth. Mother/husband of Sephardic origin*
Equal to 1 if the mother/husband is Jewish and was born in one of the following places: Middle East, Asia, North Africa, Morocco, Ethiopia, or Africa. If the mother/husband is Israeli native then we look at her/his father’s place of birth. Defined only for the Jewish population.
New immigrant* Equal to 1 if either the mother or the husband is Jewish and immigrated to Israel after 1990. Below-poverty-line income Equal to 1 if net income is below the poverty income. This dummy is computed separately
each year conditional on the year specific poverty threshold. Above-poverty-line income and below the 90 percentile
Equal to 1 if net income is above poverty income and below 90 per cent. This dummy is computed separately each year.
Top 90 per cent Equal to 1 if net income is at or above the 90th percentile. This is computed separately by year and by religious group if the specification splits by religion.
Net household income The mother’s and husband’s total income minus tax, plus annual child subsidy for existing children.
Log net household income Log of net household income. Secular Jewish Equal to 1 if the mother is Jewish and secular and 0 otherwise. In the regression specification,
Secular is the base religion category. Orthodox Jewish Equal to 1 if the mother if Jewish and Orthodox and 0 otherwise. Ultra-Orthodox Jewish Equal to 1 if the mother is ultra-Orthodox Jewish and 0 otherwise. Arab Muslim Equal to 1 if the mother is Arab Muslim and 0 otherwise. Year dummy YYYY Equal to 1 if the current year if equal to YYYY and 0 otherwise. Unemployment rate Unemployment rate by year.
GDP change GDP growth by year. Notes: * Included as controls for specifications restricted to the Jewish population. Coefficients are suppressed.

26
Appendix B: First-Stage RegressionLog
household income
Log household
income(1) (2)
Infra-marginal child subsidy 0.0001508*** 0.0000833***(0.00000246) (0.00000297)
Lagged log income 0.6299078*** 0.8284253***(0.000614) (0.0006101)
PV of marginal child subsidy 0.0000275*** -0.0000266***(0.00000447) (0.00000812)
Husband's age 1.16E-06 -0.002031***(0.0001322) (0.0001547)
Age at first birth 0.0058861 0.0007495***(0.0001944) (0.0002286)
Months from last birth 0.0004971*** -0.000296***(0.0000457) (0.0000535)
Months from last birth^2 -0.00000174 3.72E-07(0.000000252) (0.000000295)
Number of children 0.0169197*** -0.0131191***(0.0006704) (0.000784)
Max education 0.0799902*** 0.0620823***(0.000735) (0.0008603)
Orthodox Jewish 0.91131*** -0.0124132***(0.0014884) (0.0022043)
Ultra-Orthodox Jewish -0.0452198*** -0.0918103***(0.0018717) (0.0037647)
Muslim Arabs 0.0009025 -0.1506098***(0.0032027) (0.0030515)
Reference fertility -0.216702*** 0.0143427***(0.0025822) (0.0013502)
Unemployment rate 0.006147***(0.0011481)
GDP growth -3.72183***(0.0798384)
Year dummy 2000 0.1235878***(0.0173028)
Year dummy 2001 0.0772687***(0.0173066)
Year dummy 2002 -0.00544(0.0173027)
Year dummy 2003 -0.028933*(0.0173909)
Year dummy 2004 -0.0051583(0.0174038)
Year dummy 2005 -0.030247*(0.0174068)
Observations 1,005,118 1,005,118Adjusted R2 0.704 0.705Notes: Stars denote the level of statistical signifance: *** for 0.01, ** for 0.05, * for 0.10.
27
References
Acs, Gregory (1996) “The Impact of Welfare on Young Mothers’ Subsequent Childbearing
Decisions,” Journal of Human Resources, Volume 31, pp. 898–915.
Angirst, Joshha, and William Evans (1998), “Children and their Parents’ Labor Supply:
Evidence from Exogenous Variation in Family Size,” American Economic Review,
Volume 88, Number 3, pp. 450-477.
Angrist, Josha, Victor Lavy, and Analia Schlosser (2006), “Multiple Experiments for the
Causal Link between the Quantity and Quality of Children,” Massachusetts Institute of
Technology, manuscript.
Becker, Gary S. (1960), “An Economic Analysis of Fertility,” in Demographic and
Economic Change in Developed Countries, National Bureau of Economic Research
Series, Number 11, Princeton, NJ: Princeton University Press, pp. 209–231.
Becker, Gary S., and Nigel Tomes (1976), “Child Endowments and the Quantity and
Quality of Children,” Journal of Political Economy, Volume 84, Number 4 (Part 2), pp.
S143–S162.
Black, Dan, Natalia Kolesnikova, Seth Sanders, and Lowell Taylor (2008), “Are Children
‘Normal’?” Federal Reserve Board of St. Louis, Working Paper No. 2008-040C.
Black, Sandra, Paul Devereux, and Kjell Salvanes (2007), “Small Family, Smart Family?
Family Size and the IQ Scores of Young Men,” National Bureau of Economic
Research, Working Paper Number 13336.
Blau, F.D. (1992), “The Fertility of Immigrant Women: Evidence from High Fertility
Source Countries,” in George Borjas and Richard Freeman (eds.), Immigration and the
Workforce: Economic Consequences for the United States and Source Areas, Chicago,
IL: University of Chicago Press.
Björklund, Anders (2006), “Does Family Policy Affect Fertility? Lessons from Sweden”,
Journal of Population Economics, Volume 19, pp. 3-24.
Borg, M. (1989), “The Income–Fertility Relationship: Effect of the Net Price of a Child,”
Demography, Volume 26, Number 2, pp. 301-310.
28
Boyer, George (1989), “Malthus Was Right after All: Poor Relief and Birth Rates in
Southeastern England,” Journal of Political Economy, Volume 96, Number 1, pp. 93–
114.
Chirinko, Robert (1993), “Business Fixed Investment Spending: A Critical Survey of
Modeling Strategies, Empirical Results, and Policy Implications,” Journal of Economic
Literature, Volume 32, pp. 1875-1911.
Cigno, A. (1986), “Fertility and the Tax-Benefit System: A Reconsideration of the Theory
of Family Taxation,” Economic Journal, 96, 1035–1051.
Dahan, Momi (1998), “The Ultra-Orthodox Population and the Municipal Council,”
Jerusalem Institute for Israel Studies.
Demeny, Paul (1986), “Pronatalist Policies in Low-Fertility Countries: Patterns,
Performance, and Prospects,” Population and Development Review, Volume 12,
Supplement, pp. 225-–58.
Docquier, F. (2004), “Income Distribution, Non-Convexities, and the Fertility-Income
Relationship,” Economica, Volume 71, Number 282, pp. 261–273.
Dunn, Robert (2003), “Subsidies for Childbearing and Fertility Rates,” Challenge, Volume
46, Number 5, pp. 90–99.
Dyer, Wendy, and Robert Fairlie (2003), “Do Family Caps Reduce Out-of-Wedlock
Births? Evidence from Arkansas, Georgia, Indiana, New Jersey, and Virginia,” Yale
University, Economic Growth Center Discussion Paper No. 877.
Ebenstein, Avraham (2008), “The ‘Missing Girls’ of China and the Unintended
Consequences of the One Child Policy,” Journal of Human Resources, forthcoming.
Fairlie, Robert W., and Rebecca A. London (1997), “The Effect of Incremental Benefit
Levels on Births to AFDC Recipients,” Journal of Human Resources, Volume 16,
Number 4, pp. 575–597.
Frish, Roni (2004), “Child Allowance and Its Effect on Fertility Rate in Israel,” Research
Department, Bank of Israel, working paper.
29
Galor, Oded, and David Weil (1999), “From Malthusian Stagnation to Modern Growth,”
American Economic Review, Volume 89, Number 2, Papers and Proceedings, pp. 150–
154
Gauthier, Anne Helene (1996), The State and the Family. Oxford University Press.
Gautheir, Anne Helene, and Jan Hatzius (1997), “Family Benefits and Fertility: An
Econometric Analysis,” Population Studies, Volume 51, Number 3, pp. 295–306.
Grogger, Jeffrey, Lynn Karoly, and Alex Klerman (2002), Consequences of Welfare
Reform: A Research Synthesis. Los Angeles, CA: The RAND Corporation.
Heckman J.J., Joseph Hotz, and J. Walker (1985), “New Evidence on the Timing and
Spacing of Births,” American Economic Review, Volume 75, pp. 179–184.
Heckman, J.J., and J. Walker (1990), “The Relationship between Wages and the Timing
and Spacing of Births: Evidence from Swedish Longitudinal Data,” Econometrica,
Volume 58, pp. 1411–1441.
Hotz, Joseph, Jacob Klerman, and Robert Willis (1993), “The Economics of Fertility in
Developed Countries,” in Handbook of Population and Family Economics, M.
Rosenzweig and O. Stark (eds.), Volume 1, Chapter 7. New York: Elsevier, pp. 275–
347.
Hotz, Joseph, and Robert Miller (1988), “An Empirical Analysis of Life Cycle Fertility and
Female Labor Supply,” Econometrica, Volume 56, Number 1, pp. 91–118.
Jones, Larry, Alice Schoonbroodt, and Michele Tertilt (2008), “Fertility Theories: Can
They Explain the Negative Fertility-Income Relationship?” National Bureau of
Economic Research, Working Paper Number 14266.
Jones, Larry, and M. Tertilt (2008), “An Economic History of Fertility in the U.S.: 1826-
1960,” in Frontiers of Family Economics, P. Rupert (ed.), Volume 1. London: Emerald
Press, forthcoming.
Joyce, Theodore, Robert Kaestner, and Sanders Korenman (2003), “Welfare Reform and
Non-Marital Fertility in the 1990s: Evidence from Birth Records,” Advances in
Economic Analysis and Policy, Volume 3, Issue 1, Article 6.
30
Kearny, Melissa (2004), “Is There an Effect of Incremental Welfare Benefits on Fertility
Behavior? A Look at the Family Cap,” Journal of Human Resources, Volume 39, pp.
295–325.
Lalive, Rafael, and Josef Zweimuller (2008), “Does Parental Leave Affect Fertility and
Return-to-Work? Evidence from Two Natural Experiments,” Quarterly Journal of
Economics, forthcoming.
Laroque, Guy, and Bernard Salanié (2008), “Does Fertility Respond to Financial
Incentives?” Columbia University, Department of Economics, Discussion Paper
Number 0708-15.
Mayshar, Joram, and Charles F. Manski (2000), “Child Allowances and Fertilities in Israel:
Preliminary Findings,” The Economic Quarterly, Volume 47, pp. 535–565.
Mayshar, Joram, and Charles F. Manski (2003), “Private Incentives and Social
Interactions: Fertility Puzzles in Israel,” Journal of the European Economic
Association, Volume 1, Number 1, pp. 181–211.
Milligan, Kevin (2005), “Subsidizing the Stork: New Evidence on Tax Incentives and
Fertility,” Review of Economics and Statistics, Volume 87, Number 3, pp. 539–555.
Moffitt, Robert (1998), “The Effect of Welfare on Marriage and Fertility,” in Welfare, the
Family, and Reproductive Behavior, Robert Moffitt (ed.). Washington, DC: National
Academy Press, pp. 50-97.
Moffitt, Robert (2000), “Welfare Benefits and Female Headship in U.S. Time Series,”
American Economic Review, Volume 90, No. 2, Papers and Proceedings, pp. 373-377.
Oster, Emily (2005), “Hepatitis B and the Case of the Missing Women,” Journal of
Political Economy, Volume 113, Number 6, pp. 1163–1216.
Pettersson-Lidbom, Per, and Peter Skogman Thoursie (2009), “Does Child Spacing Affect
Children’s Outcomes?” Institute for Labour Market Policy Evaluation, Uppsala,
Working Paper Number 2009:7.
Population Division of the Department of Economic and Social Affairs of the United
Nation Secretariat (2005). World Population Prospect: The 2004 Revision, Highlights.
31
New-York: United Nations. http://www.un.org/esa/population/publications/WPP2004/
2004Highlights_finalrevised.pdf.
Portnoi Chaim (2007), “Characterization of the Jewish Population by Degree of Religiosity
Based on Linkage to Educational Institutions,” Central Bureau of Statistics, Israel,
working paper.
Qian, Nancy (2008), “Quantity and Quality and the One Child Policy: The Only-Child
Disadvantage on School Enrollment in China,” Department of Economics, Brown
University, manuscript.
Rosenzweig, Mark R. (1999), “Welfare, Marital Prospects, and Nonmarital Childbearing,”
Journal of Political Economy, Volume 107, Number 6, pp. S3–S32.
Sabag-Andelblad, Miri (2005), "Estimating Poverty Using Expenditure Data, 2002-2003,"
Report of the Research and Planning Department, National Insurance Institute, Israel.
Sacerdote, Bruce, and James Feyrer (2008), “Will the Stork Return to Europe and Japan?
Understanding Fertility with Developed Nations,” National Bureau of Economic
Research, Working Paper No. 14114.
Schellekens, Jona (2006), “Family Allowances and Fertility: Socio-Economic and
Religious Differentials,” Hebrew University of Jerusalem, manuscript.
Whittington, Leslie A. (1992), “Taxes and the Family: The Impact of the Tax Exemption
for Dependents on Marital Fertility,” Demography, Volume 29, Number 2, pp. 215–
226.
Whittington, Leslie A., James Alm, and H. Elizabeth Peters (1990), “Fertility and the
Personal Exemption: Implicit Pronatalist Policy in the United States,” American
Economic Review, Volume 30, Number 3, pp. 545–556.
Zhang, Junsen, Jason Quan, and Peter van Meerbergen (1994), “The Effect of Tax-Transfer
Policies on Fertility in Canada 1921–1988,” Journal of Human Resources, Volume 29,
Number 1, pp. 181–201.
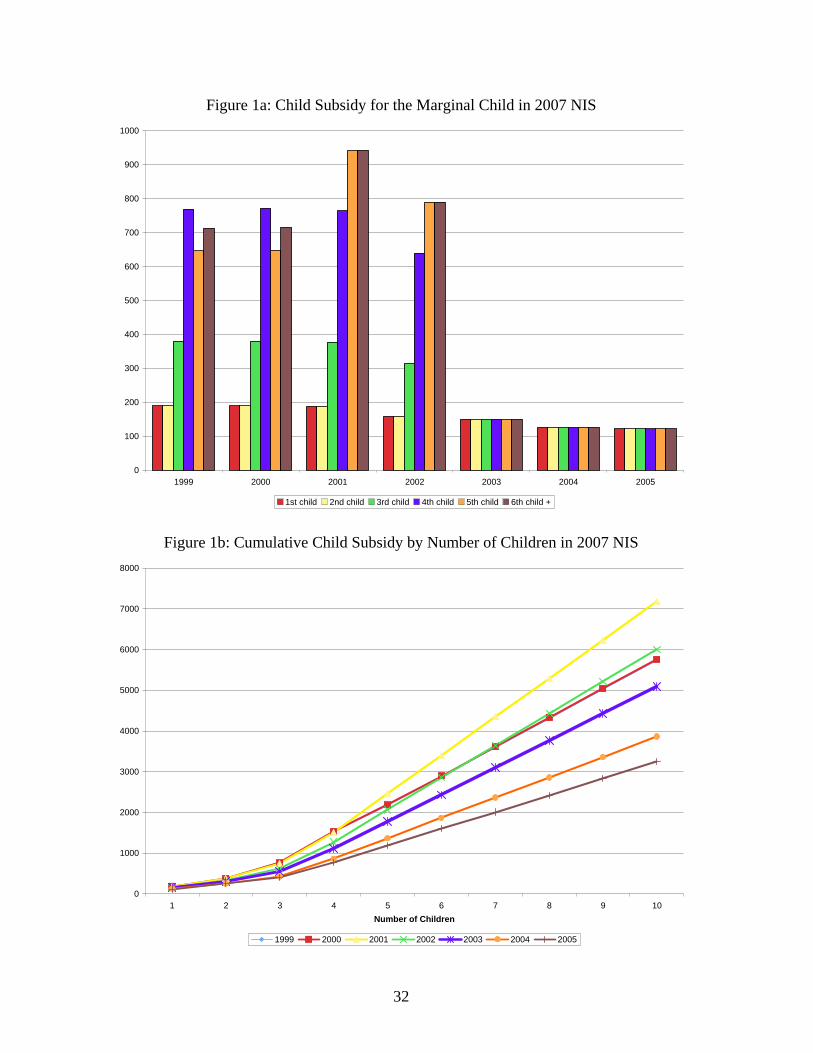
32
Figure 1a: Child Subsidy for the Marginal Child in 2007 NIS
0
100
200
300
400
500
600
700
800
900
1000
1999 2000 2001 2002 2003 2004 2005
1st child 2nd child 3rd child 4th child 5th child 6th child +
Figure 1b: Cumulative Child Subsidy by Number of Children in 2007 NIS
0
1000
2000
3000
4000
5000
6000
7000
8000
1 2 3 4 5 6 7 8 9 10Number of Children
1999 2000 2001 2002 2003 2004 2005
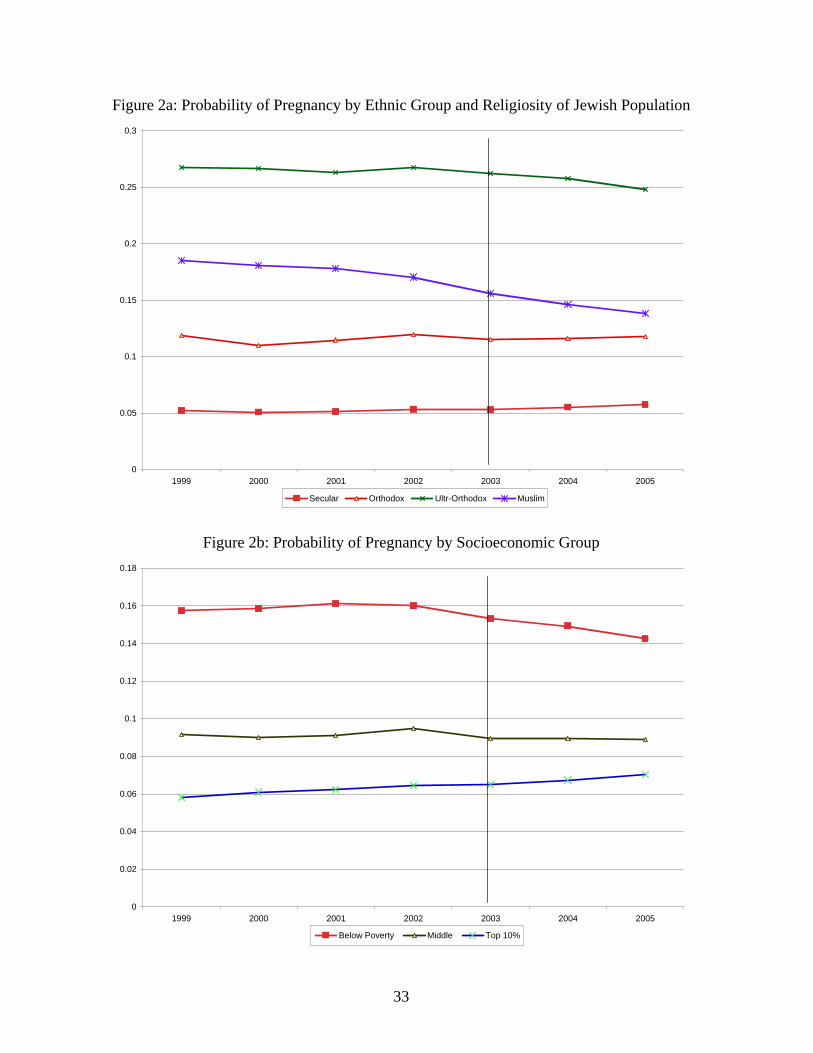
33
Figure 2a: Probability of Pregnancy by Ethnic Group and Religiosity of Jewish Population
0
0.05
0.1
0.15
0.2
0.25
0.3
1999 2000 2001 2002 2003 2004 2005
Secular Orthodox Ultr-Orthodox Muslim
Figure 2b: Probability of Pregnancy by Socioeconomic Group
0
0.02
0.04
0.06
0.08
0.1
0.12
0.14
0.16
0.18
1999 2000 2001 2002 2003 2004 2005
Below Poverty Middle Top 10%
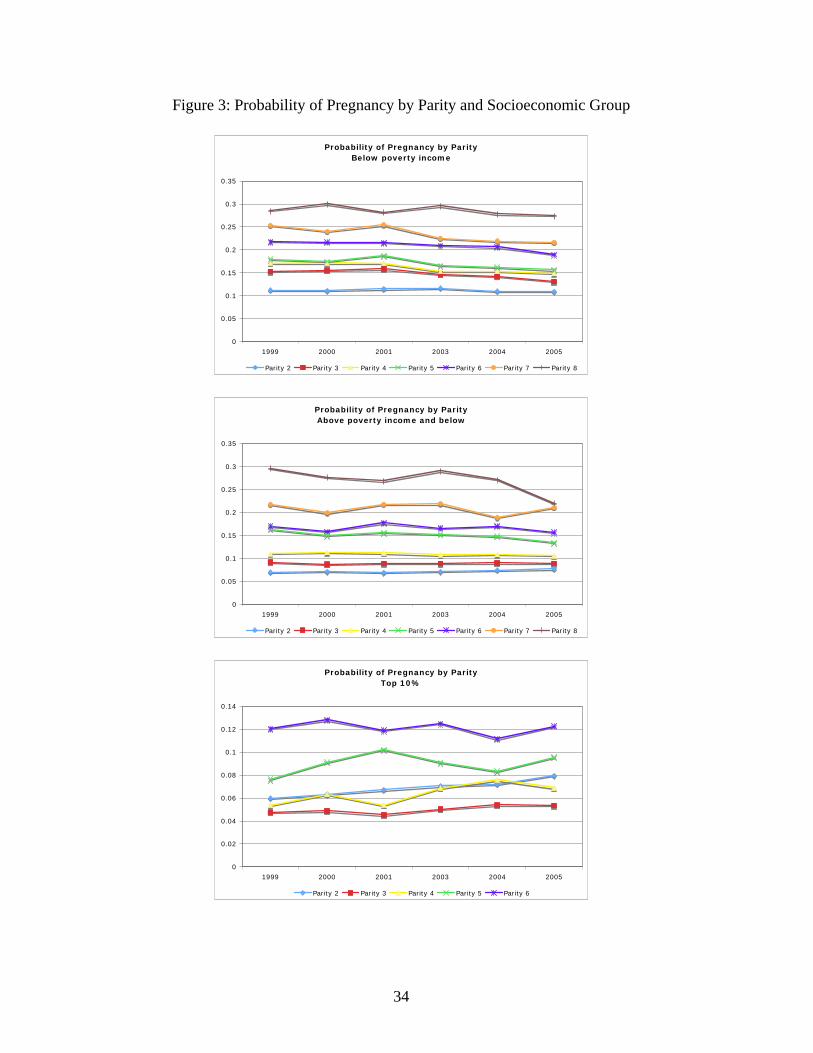
34
Figure 3: Probability of Pregnancy by Parity and Socioeconomic Group
Probability of Pregnancy by ParityBelow poverty income
0
0.05
0.1
0.15
0.2
0.25
0.3
0.35
1999 2000 2001 2003 2004 2005
Parity 2 Parity 3 Parity 4 Parity 5 Parity 6 Parity 7 Parity 8
Probability of Pregnancy by ParityAbove poverty income and below
0
0.05
0.1
0.15
0.2
0.25
0.3
0.35
1999 2000 2001 2003 2004 2005
Parity 2 Parity 3 Parity 4 Parity 5 Parity 6 Parity 7 Parity 8
Probability of Pregnancy by ParityTop 10%
0
0.02
0.04
0.06
0.08
0.1
0.12
0.14
1999 2000 2001 2003 2004 2005
Parity 2 Parity 3 Parity 4 Parity 5 Parity 6
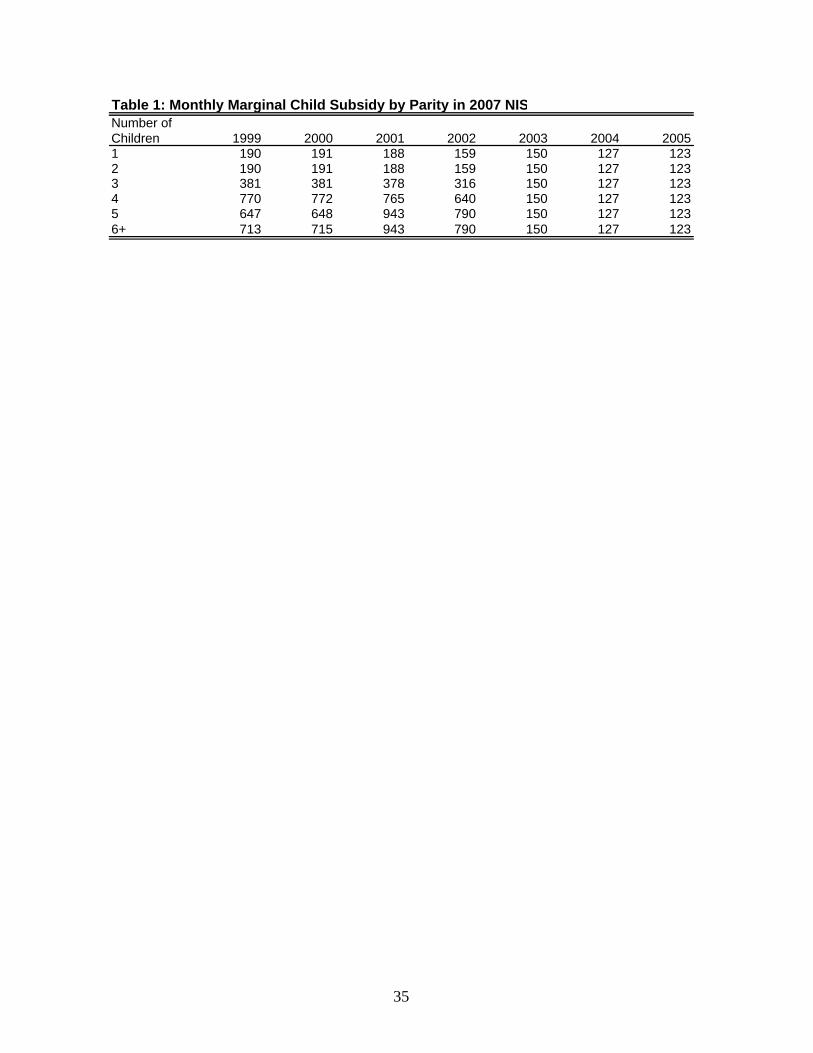
35
Number of Children 1999 2000 2001 2002 2003 2004 20051 190 191 188 159 150 127 1232 190 191 188 159 150 127 1233 381 381 378 316 150 127 1234 770 772 765 640 150 127 1235 647 648 943 790 150 127 1236+ 713 715 943 790 150 127 123
Table 1: Monthly Marginal Child Subsidy by Parity in 2007 NIS
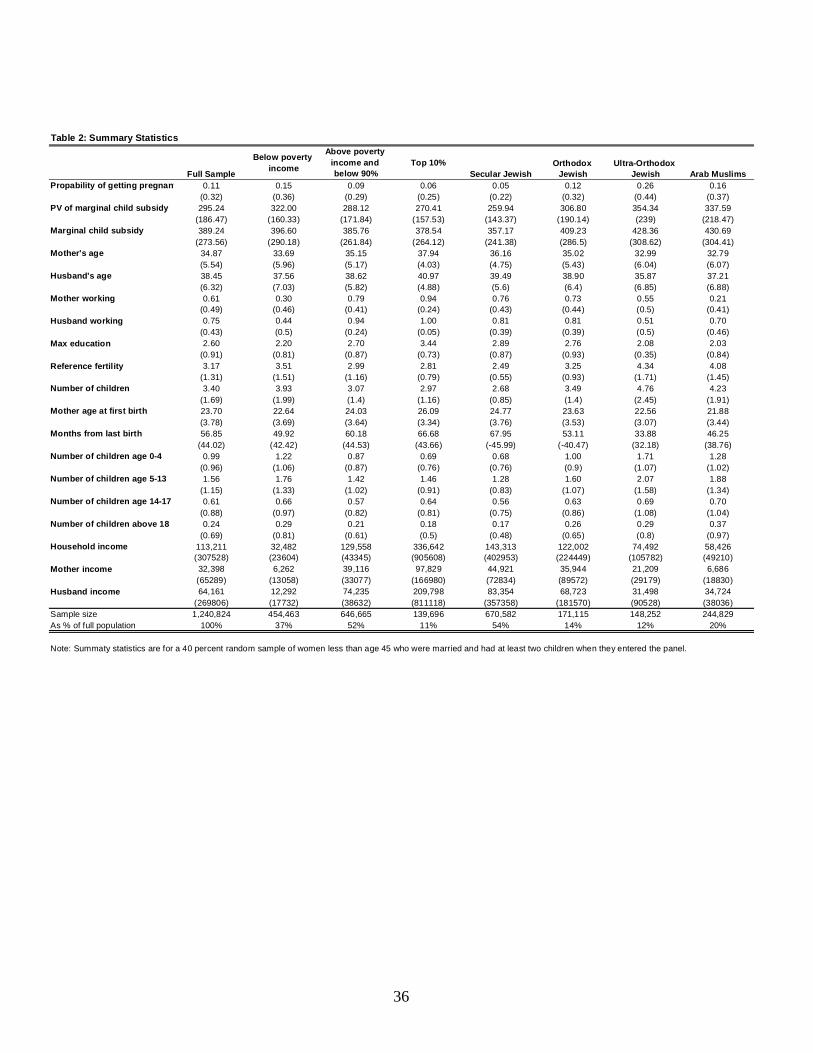
36
Table 2: Summary Statistics
Full Sample
Below poverty income
Above poverty income and below 90%
Top 10%Secular Jewish
Orthodox Jewish
Ultra-Orthodox Jewish Arab Muslims
Propability of getting pregnant 0.11 0.15 0.09 0.06 0.05 0.12 0.26 0.16(0.32) (0.36) (0.29) (0.25) (0.22) (0.32) (0.44) (0.37)
PV of marginal child subsidy 295.24 322.00 288.12 270.41 259.94 306.80 354.34 337.59(186.47) (160.33) (171.84) (157.53) (143.37) (190.14) (239) (218.47)
Marginal child subsidy 389.24 396.60 385.76 378.54 357.17 409.23 428.36 430.69(273.56) (290.18) (261.84) (264.12) (241.38) (286.5) (308.62) (304.41)
Mother's age 34.87 33.69 35.15 37.94 36.16 35.02 32.99 32.79(5.54) (5.96) (5.17) (4.03) (4.75) (5.43) (6.04) (6.07)
Husband's age 38.45 37.56 38.62 40.97 39.49 38.90 35.87 37.21(6.32) (7.03) (5.82) (4.88) (5.6) (6.4) (6.85) (6.88)
Mother working 0.61 0.30 0.79 0.94 0.76 0.73 0.55 0.21(0.49) (0.46) (0.41) (0.24) (0.43) (0.44) (0.5) (0.41)
Husband working 0.75 0.44 0.94 1.00 0.81 0.81 0.51 0.70(0.43) (0.5) (0.24) (0.05) (0.39) (0.39) (0.5) (0.46)
Max education 2.60 2.20 2.70 3.44 2.89 2.76 2.08 2.03(0.91) (0.81) (0.87) (0.73) (0.87) (0.93) (0.35) (0.84)
Reference fertility 3.17 3.51 2.99 2.81 2.49 3.25 4.34 4.08(1.31) (1.51) (1.16) (0.79) (0.55) (0.93) (1.71) (1.45)
Number of children 3.40 3.93 3.07 2.97 2.68 3.49 4.76 4.23(1.69) (1.99) (1.4) (1.16) (0.85) (1.4) (2.45) (1.91)
Mother age at first birth 23.70 22.64 24.03 26.09 24.77 23.63 22.56 21.88(3.78) (3.69) (3.64) (3.34) (3.76) (3.53) (3.07) (3.44)
Months from last birth 56.85 49.92 60.18 66.68 67.95 53.11 33.88 46.25(44.02) (42.42) (44.53) (43.66) (-45.99) (-40.47) (32.18) (38.76)
Number of children age 0-4 0.99 1.22 0.87 0.69 0.68 1.00 1.71 1.28(0.96) (1.06) (0.87) (0.76) (0.76) (0.9) (1.07) (1.02)
Number of children age 5-13 1.56 1.76 1.42 1.46 1.28 1.60 2.07 1.88(1.15) (1.33) (1.02) (0.91) (0.83) (1.07) (1.58) (1.34)
Number of children age 14-17 0.61 0.66 0.57 0.64 0.56 0.63 0.69 0.70(0.88) (0.97) (0.82) (0.81) (0.75) (0.86) (1.08) (1.04)
Number of children above 18 0.24 0.29 0.21 0.18 0.17 0.26 0.29 0.37(0.69) (0.81) (0.61) (0.5) (0.48) (0.65) (0.8) (0.97)
Household income 113,211 32,482 129,558 336,642 143,313 122,002 74,492 58,426(307528) (23604) (43345) (905608) (402953) (224449) (105782) (49210)
Mother income 32,398 6,262 39,116 97,829 44,921 35,944 21,209 6,686(65289) (13058) (33077) (166980) (72834) (89572) (29179) (18830)
Husband income 64,161 12,292 74,235 209,798 83,354 68,723 31,498 34,724(269806) (17732) (38632) (811118) (357358) (181570) (90528) (38036)
Sample size 1,240,824 454,463 646,665 139,696 670,582 171,115 148,252 244,829As % of full population 100% 37% 52% 11% 54% 14% 12% 20%
Note: Summaty statistics are for a 40 percent random sample of women less than age 45 who were married and had at least two children when they entered the panel.

37
Table 3: Year Effects in the Full Population and by Religious and Ethnic GroupFull
population Secular Jewish Orthodox Jewish Ultra-Orthodox Jewish Muslim Jewish
(1) (2) (3) (4) (5)Husband's age -0.005406*** -0.003581*** -0.006116*** -0.010526*** -0.005072***
(0.000217) (0.000182) (0.000265) (0.000430) (0.000207)Age at first birth 0.007345*** 0.003906*** 0.007474*** 0.019196*** 0.015923***
(0.000511) (0.000607) (0.000686) (0.001077) (0.000831)Months from last birth 0.002134*** 0.001474*** 0.002543*** 0.006408*** 0.003692***
(0.000196) (0.000194) (0.000270) (0.000650) (0.000269)Months from last birth^2 -0.000014*** -0.000008*** -0.000018*** -0.000056*** -0.000026***
(0.000001) (0.000001) (0.000002) (0.000006) (0.000002)Number of children 0.022261*** 0.012267*** 0.025668*** 0.045617*** 0.033667***
(0.001153) (0.002645) (0.001732) (0.001726) (0.001541)Max education -0.015568*** -0.010137*** 0.003786*** -0.034043*** -0.034510***
(0.000817) (0.001643) (0.001350) (0.003813) (0.001747)Own work status -0.006128*** -0.004042*** -0.007254*** -0.014222*** -0.012059***
(0.000880) (0.000868) (0.001821) (0.002261) (0.001948)Husband working -0.007834*** -0.001471 -0.008177*** -0.036550*** -0.006294***
(0.000894) (0.000900) (0.002459) (0.003411) (0.001657)Above poverty income and below 90% 0.344444*** 0.003233*** 0.005029** 0.003705 0.003900**
(0.013426) (0.001050) (0.002330) (0.003515) (0.001914)Top 10% 0.196265*** 0.012513*** 0.008464** -0.003761 -0.001473
(0.008002) (0.002256) (0.004118) (0.004697) (0.002877)Reference fertility -0.048886*** -0.040899*** -0.060930*** -0.089888*** -0.089447***
(0.002807) (0.006096) (0.004746) (0.004584) (0.005059)Year dummy 2000 -0.003373 -0.002243 -0.008595 -0.002249 -0.005174
(0.006046) (0.005987) (0.007524) (0.010490) (0.008401)Year dummy 2001 -0.002957 -0.002268 -0.003526 -0.004092 -0.004732
(0.005865) (0.005792) (0.007402) (0.010279) (0.007618)Year dummy 2002 -0.001172 -0.000066 0.001316 0.004659 -0.007750
(0.005602) (0.006004) (0.007454) (0.009796) (0.006665)Year dummy 2003 -0.004125 -0.000050 0.000467 0.003064 -0.019578***
(0.005488) (0.005923) (0.007686) (0.010423) (0.006044)Year dummy 2004 -0.004690 0.002048 0.001900 0.000757 -0.027553***
(0.005575) (0.006206) (0.007950) (0.009881) (0.005985)Year dummy 2005 -0.005913 0.002857 0.002523 -0.005044 -0.032882***
(0.005701) (0.006559) (0.007807) (0.009847) (0.005977)Observations 1,234,778 670,582 171,115 148,252 244,829Adjusted R2 0.102 0.063 0.075 0.098 0.102
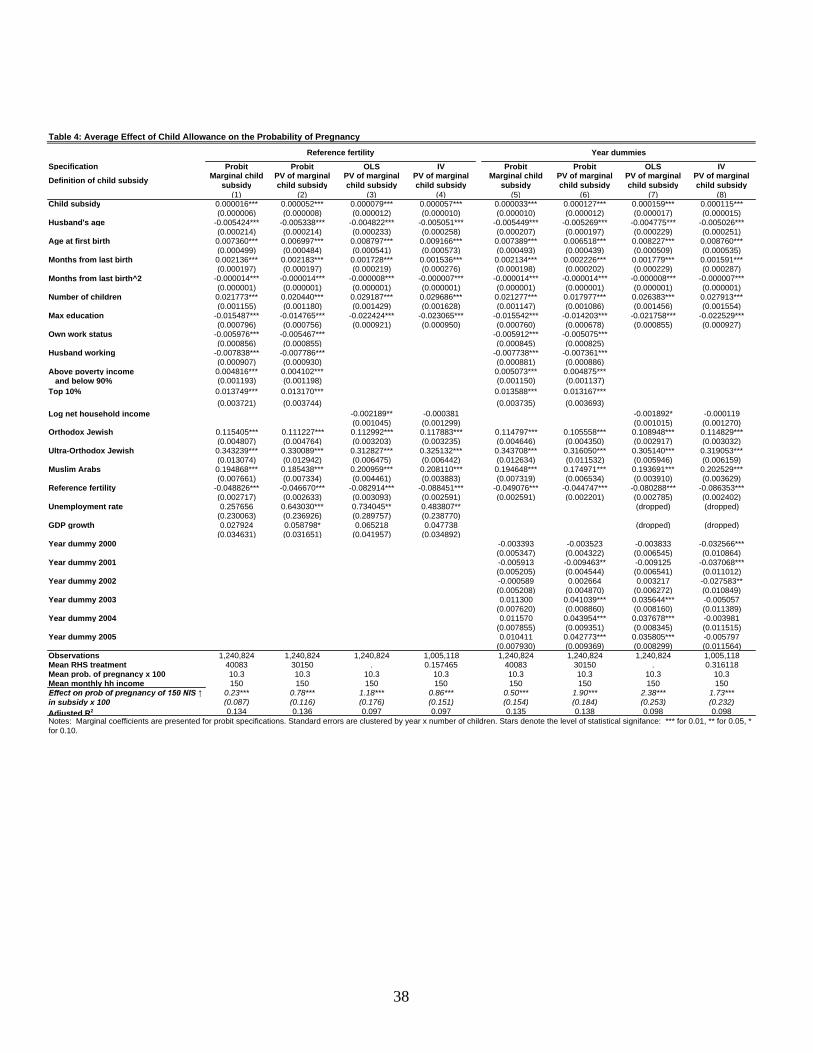
38
Table 4: Average Effect of Child Allowance on the Probability of Pregnancy
Specification Probit Probit OLS IV Probit Probit OLS IV
Definition of child subsidy Marginal child subsidy
PV of marginal child subsidy
PV of marginal child subsidy
PV of marginal child subsidy
Marginal child subsidy
PV of marginal child subsidy
PV of marginal child subsidy
PV of marginal child subsidy
(1) (2) (3) (4) (5) (6) (7) (8)Child subsidy 0.000016*** 0.000052*** 0.000079*** 0.000057*** 0.000033*** 0.000127*** 0.000159*** 0.000115***
(0.000006) (0.000008) (0.000012) (0.000010) (0.000010) (0.000012) (0.000017) (0.000015)Husband's age -0.005424*** -0.005338*** -0.004822*** -0.005051*** -0.005449*** -0.005269*** -0.004775*** -0.005026***
(0.000214) (0.000214) (0.000233) (0.000258) (0.000207) (0.000197) (0.000229) (0.000251)Age at first birth 0.007360*** 0.006997*** 0.008797*** 0.009166*** 0.007389*** 0.006518*** 0.008227*** 0.008760***
(0.000499) (0.000484) (0.000541) (0.000573) (0.000493) (0.000439) (0.000509) (0.000535)Months from last birth 0.002136*** 0.002183*** 0.001728*** 0.001536*** 0.002134*** 0.002226*** 0.001779*** 0.001591***
(0.000197) (0.000197) (0.000219) (0.000276) (0.000198) (0.000202) (0.000229) (0.000287)Months from last birth^2 -0.000014*** -0.000014*** -0.000008*** -0.000007*** -0.000014*** -0.000014*** -0.000008*** -0.000007***
(0.000001) (0.000001) (0.000001) (0.000001) (0.000001) (0.000001) (0.000001) (0.000001)Number of children 0.021773*** 0.020440*** 0.029187*** 0.029686*** 0.021277*** 0.017977*** 0.026383*** 0.027913***
(0.001155) (0.001180) (0.001429) (0.001628) (0.001147) (0.001086) (0.001456) (0.001554)Max education -0.015487*** -0.014765*** -0.022424*** -0.023065*** -0.015542*** -0.014203*** -0.021758*** -0.022529***
(0.000796) (0.000756) (0.000921) (0.000950) (0.000760) (0.000678) (0.000855) (0.000927)Own work status -0.005976*** -0.005467*** -0.005912*** -0.005075***
(0.000856) (0.000855) (0.000845) (0.000825)Husband working -0.007838*** -0.007786*** -0.007738*** -0.007361***
(0.000907) (0.000930) (0.000881) (0.000886)Above poverty income 0.004816*** 0.004102*** 0.005073*** 0.004875*** and below 90% (0.001193) (0.001198) (0.001150) (0.001137)Top 10% 0.013749*** 0.013170*** 0.013588*** 0.013167***
(0.003721) (0.003744) (0.003735) (0.003693)Log net household income -0.002189** -0.000381 -0.001892* -0.000119
(0.001045) (0.001299) (0.001015) (0.001270)Orthodox Jewish 0.115405*** 0.111227*** 0.112992*** 0.117883*** 0.114797*** 0.105558*** 0.108948*** 0.114829***
(0.004807) (0.004764) (0.003203) (0.003235) (0.004646) (0.004350) (0.002917) (0.003032)Ultra-Orthodox Jewish 0.343239*** 0.330089*** 0.312827*** 0.325132*** 0.343708*** 0.316050*** 0.305140*** 0.319053***
(0.013074) (0.012942) (0.006475) (0.006442) (0.012634) (0.011532) (0.005946) (0.006159)Muslim Arabs 0.194868*** 0.185438*** 0.200959*** 0.208110*** 0.194648*** 0.174971*** 0.193691*** 0.202529***
(0.007661) (0.007334) (0.004461) (0.003883) (0.007319) (0.006534) (0.003910) (0.003629)Reference fertility -0.048826*** -0.046670*** -0.082914*** -0.088451*** -0.049076*** -0.044747*** -0.080288*** -0.086353***
(0.002717) (0.002633) (0.003093) (0.002591) (0.002591) (0.002201) (0.002785) (0.002402)Unemployment rate 0.257656 0.643030*** 0.734045** 0.483807** (dropped) (dropped)
(0.230063) (0.236926) (0.289757) (0.238770)GDP growth 0.027924 0.058798* 0.065218 0.047738 (dropped) (dropped)
(0.034631) (0.031651) (0.041957) (0.034892)Year dummy 2000 -0.003393 -0.003523 -0.003833 -0.032566***
(0.005347) (0.004322) (0.006545) (0.010864)Year dummy 2001 -0.005913 -0.009463** -0.009125 -0.037068***
(0.005205) (0.004544) (0.006541) (0.011012)Year dummy 2002 -0.000589 0.002664 0.003217 -0.027583**
(0.005208) (0.004870) (0.006272) (0.010849)Year dummy 2003 0.011300 0.041039*** 0.035644*** -0.005057
(0.007620) (0.008860) (0.008160) (0.011389)Year dummy 2004 0.011570 0.043954*** 0.037678*** -0.003981
(0.007855) (0.009351) (0.008345) (0.011515)Year dummy 2005 0.010411 0.042773*** 0.035805*** -0.005797
(0.007930) (0.009369) (0.008299) (0.011564)Observations 1,240,824 1,240,824 1,240,824 1,005,118 1,240,824 1,240,824 1,240,824 1,005,118Mean RHS treatment 40083 30150 . 0.157465 40083 30150 . 0.316118Mean prob. of pregnancy x 100 10.3 10.3 10.3 10.3 10.3 10.3 10.3 10.3Mean monthly hh income 150 150 150 150 150 150 150 150
0.23*** 0.78*** 1.18*** 0.86*** 0.50*** 1.90*** 2.38*** 1.73***(0.087) (0.116) (0.176) (0.151) (0.154) (0.184) (0.253) (0.232)
Adjusted R2 0.134 0.136 0.097 0.097 0.135 0.138 0.098 0.098in subsidy x 100
Year dummiesReference fertility
Notes: Marginal coefficients are presented for probit specifications. Standard errors are clustered by year x number of children. Stars denote the level of statistical signifance: *** for 0.01, ** for 0.05, * for 0.10.
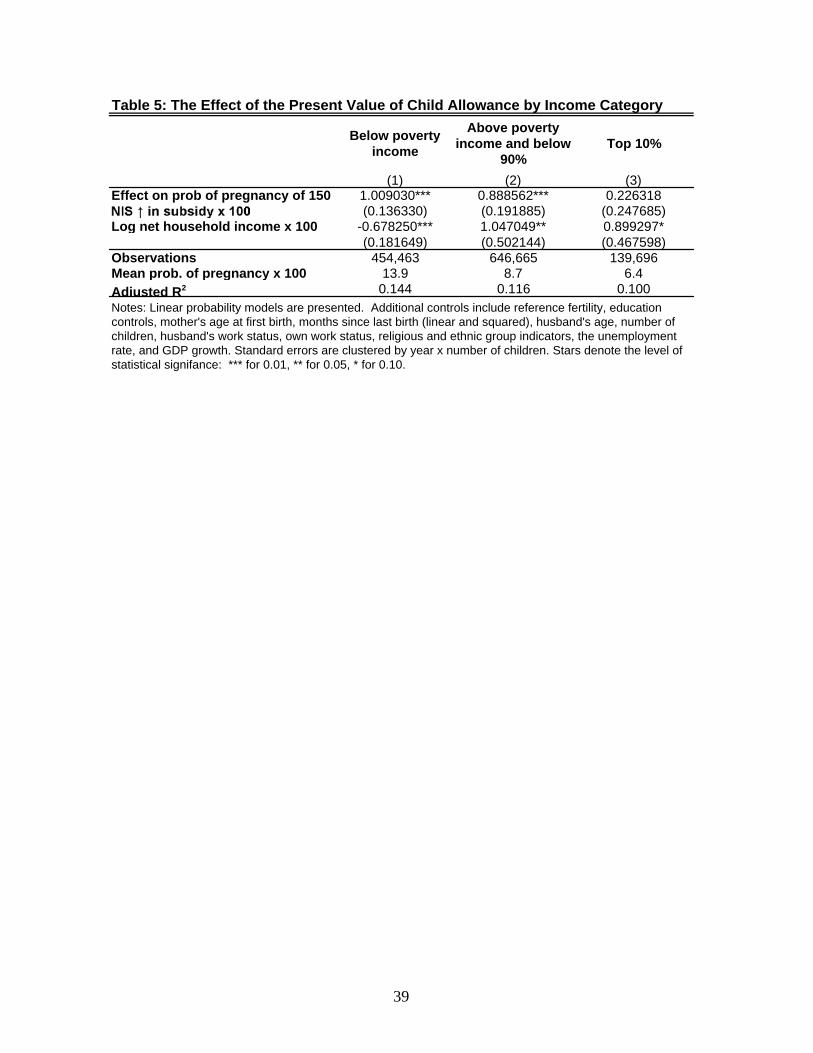
39
Table 5: The Effect of the Present Value of Child Allowance by Income Category
Below poverty income
Above poverty income and below
90%Top 10%
(1) (2) (3)1.009030*** 0.888562*** 0.226318(0.136330) (0.191885) (0.247685)
Log net household income x 100 -0.678250*** 1.047049** 0.899297*(0.181649) (0.502144) (0.467598)
Observations 454,463 646,665 139,696Mean prob. of pregnancy x 100 13.9 8.7 6.4Adjusted R2 0.144 0.116 0.100
Effect on prob of pregnancy of 150
Notes: Linear probability models are presented. Additional controls include reference fertility, education controls, mother's age at first birth, months since last birth (linear and squared), husband's age, number of children, husband's work status, own work status, religious and ethnic group indicators, the unemployment rate, and GDP growth. Standard errors are clustered by year x number of children. Stars denote the level of statistical signifance: *** for 0.01, ** for 0.05, * for 0.10.
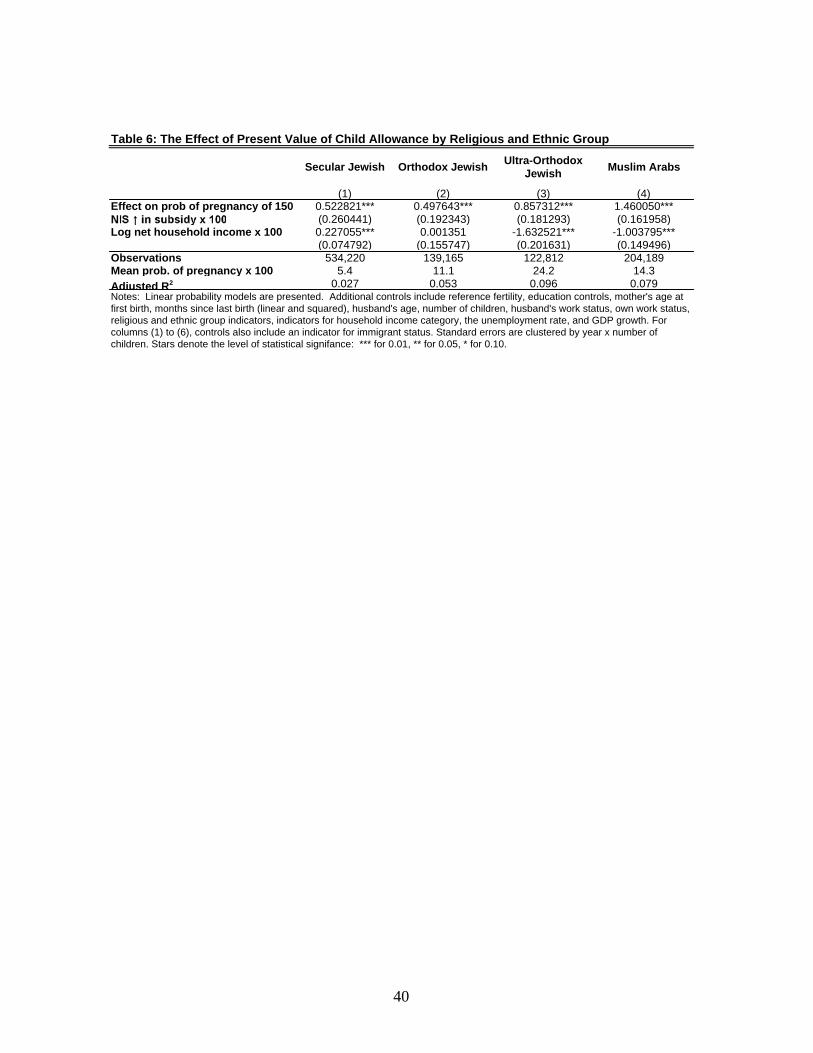
40
Table 6: The Effect of Present Value of Child Allowance by Religious and Ethnic Group
Secular Jewish Orthodox Jewish Ultra-Orthodox Jewish Muslim Arabs
(1) (2) (3) (4)0.522821*** 0.497643*** 0.857312*** 1.460050***(0.260441) (0.192343) (0.181293) (0.161958)
Log net household income x 100 0.227055*** 0.001351 -1.632521*** -1.003795***(0.074792) (0.155747) (0.201631) (0.149496)
Observations 534,220 139,165 122,812 204,189Mean prob. of pregnancy x 100 5.4 11.1 24.2 14.3Adjusted R2 0.027 0.053 0.096 0.079
Effect on prob of pregnancy of 150
Notes: Linear probability models are presented. Additional controls include reference fertility, education controls, mother's age at first birth, months since last birth (linear and squared), husband's age, number of children, husband's work status, own work status, religious and ethnic group indicators, indicators for household income category, the unemployment rate, and GDP growth. For columns (1) to (6), controls also include an indicator for immigrant status. Standard errors are clustered by year x number of children. Stars denote the level of statistical signifance: *** for 0.01, ** for 0.05, * for 0.10.
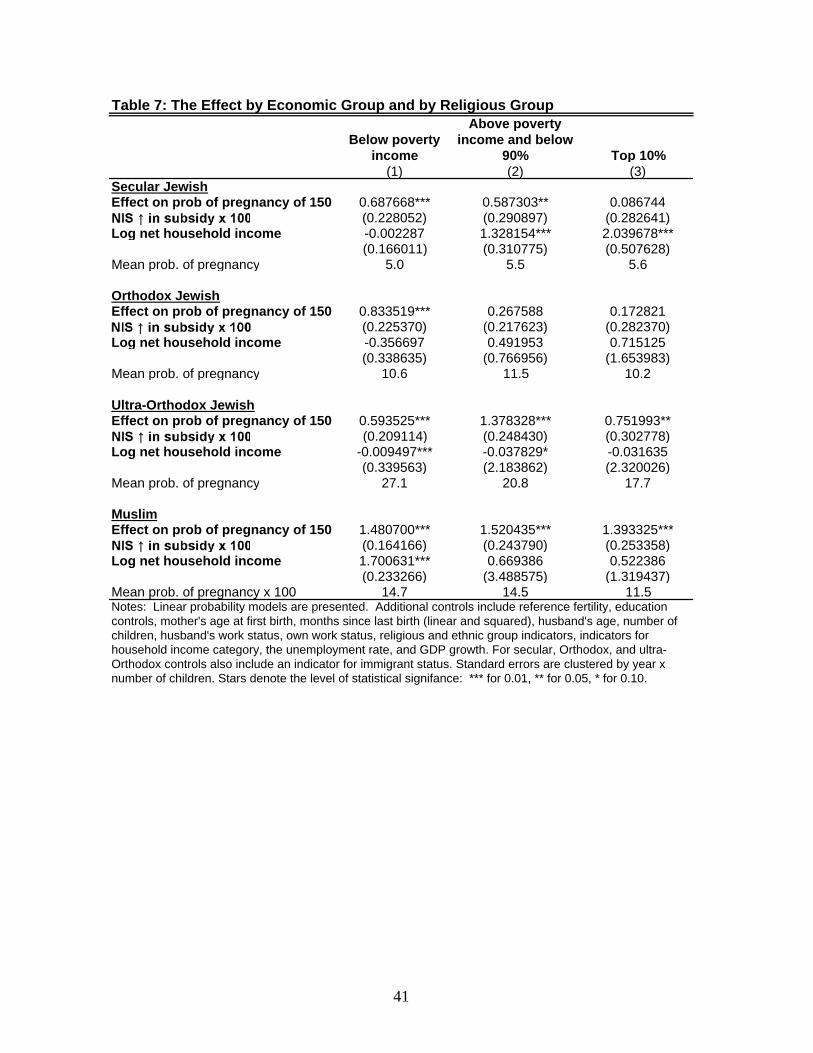
41
Table 7: The Effect by Economic Group and by Religious Group
Below poverty income
Above poverty income and below
90% Top 10%(1) (2) (3)
Secular Jewish0.687668*** 0.587303** 0.086744(0.228052) (0.290897) (0.282641)
Log net household income -0.002287 1.328154*** 2.039678***(0.166011) (0.310775) (0.507628)
Mean prob. of pregnancy 5.0 5.5 5.6
Orthodox Jewish0.833519*** 0.267588 0.172821(0.225370) (0.217623) (0.282370)
Log net household income -0.356697 0.491953 0.715125(0.338635) (0.766956) (1.653983)
Mean prob. of pregnancy 10.6 11.5 10.2
Ultra-Orthodox Jewish0.593525*** 1.378328*** 0.751993**(0.209114) (0.248430) (0.302778)
Log net household income -0.009497*** -0.037829* -0.031635(0.339563) (2.183862) (2.320026)
Mean prob. of pregnancy 27.1 20.8 17.7
Muslim1.480700*** 1.520435*** 1.393325***(0.164166) (0.243790) (0.253358)
Log net household income 1.700631*** 0.669386 0.522386(0.233266) (3.488575) (1.319437)
Mean prob. of pregnancy x 100 14.7 14.5 11.5Notes: Linear probability models are presented. Additional controls include reference fertility, education controls, mother's age at first birth, months since last birth (linear and squared), husband's age, number of children, husband's work status, own work status, religious and ethnic group indicators, indicators for household income category, the unemployment rate, and GDP growth. For secular, Orthodox, and ultra-Orthodox controls also include an indicator for immigrant status. Standard errors are clustered by year x number of children. Stars denote the level of statistical signifance: *** for 0.01, ** for 0.05, * for 0.10.
Effect on prob of pregnancy of 150
Effect on prob of pregnancy of 150
Effect on prob of pregnancy of 150
Effect on prob of pregnancy of 150

42
Table 8: The Effect of Present Value of Child Allowance by Mother's Age
Younger than 25 Between 25 and 30 Between 30 and 35 Between 35 and 40 Older than 40(1) (2) (3) (4) (5)
1.477716*** 0.976817*** 0.722742*** 0.570993*** 0.303014***(0.413687) (0.268498) (0.186349) (0.161214) (0.000007)
Log net household income -2.970676*** -1.328688*** 0.131279 0.060196 -0.024878(0.546176) (0.302515) (0.204769) (0.093151) (0.027037)
Mean prob. of pregnancy x 100 27.4 20.3 13.6 6.8 1.8Notes: Linear probability models are presented. Additional controls include reference fertility, education controls, mother's age at first birth, months since last birth (linear and squared), husband's age, number of children, husband's work status, own work status, religious and ethnic group indicators, indicators for household income category, the unemployment rate, and GDP growth. Stars denote the level of statistical signifance: *** for 0.01, ** for 0.05, * for 0.10.
Effect on prob of pregnancy of
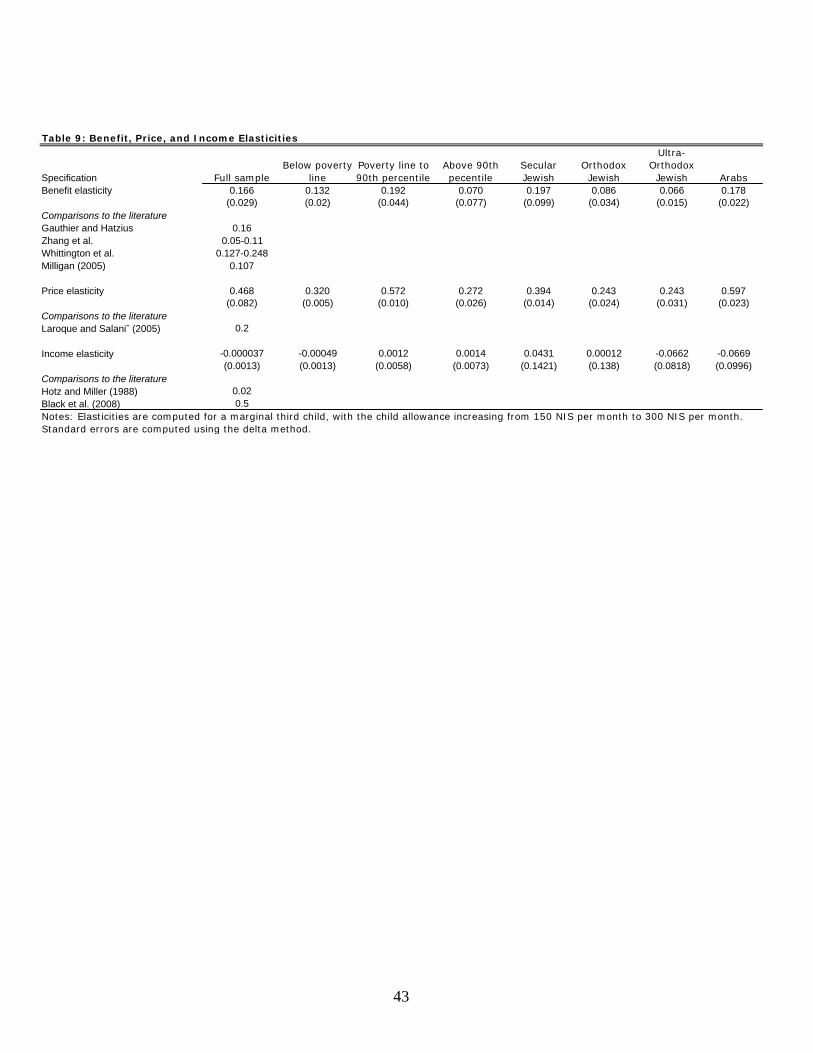
43
Table 9: Benefit, Price, and Income Elasticities
Specification Full sampleBelow poverty
linePoverty line to 90th percentile
Above 90th pecentile
Secular Jewish
Orthodox Jewish
Ultra-Orthodox Jewish Arabs
Benefit elasticity 0.166 0.132 0.192 0.070 0.197 0.086 0.066 0.178(0.029) (0.02) (0.044) (0.077) (0.099) (0.034) (0.015) (0.022)
Comparisons to the literatureGauthier and Hatzius 0.16Zhang et al. 0.05-0.11Whittington et al. 0.127-0.248Milligan (2005) 0.107
Price elasticity 0.468 0.320 0.572 0.272 0.394 0.243 0.243 0.597(0.082) (0.005) (0.010) (0.026) (0.014) (0.024) (0.031) (0.023)
Comparisons to the literatureLaroque and Salaniˇ (2005) 0.2
Income elasticity -0.000037 -0.00049 0.0012 0.0014 0.0431 0.00012 -0.0662 -0.0669(0.0013) (0.0013) (0.0058) (0.0073) (0.1421) (0.138) (0.0818) (0.0996)
Comparisons to the literatureHotz and Miller (1988) 0.02Black et al. (2008) 0.5Notes: Elasticities are computed for a marginal third child, with the child allowance increasing from 150 NIS per month to 300 NIS per month. Standard errors are computed using the delta method.

44
Table 10: The Effect of the 2003 Reform(1) (2) (3) (4) (5) (6) (7)
Number of Observations in
2004 Percentage
Number of Children born
in 2004
Number of children born
without reduction in subsidy to
marginal child
(4)-(3) Number of birth that would have occurred if
there was no reduction in
marginal subsidy
Percetage of total number of households in
2004
Percetage of total number of children born in
2004Secular 229,808 53.8% 12,430 13,727 1,297 0.6% 9.4%Orthodox 60,253 14.1% 6,642 7,296 654 1.1% 9.0%Ultra Orthodox 52,538 12.3% 12,003 13,098 1,095 2.1% 8.4%Arab Muslim 84,775 19.8% 9,978 12,423 2,446 2.9% 19.7%
Below Poverty Income 162,660 38.1% 20,065 22,841 2,776 1.7% 12.2%Above Poverty Income and Below 90% 201,538 47.2% 16,720 18,636 1,916 1.0% 10.3%Top 10% 48,375 11.3% 3,300 3,419 119 0.2% 3.5%
Total 427,373 100.0% 41,053 46,544 5,492 1.3% 11.8%