do financial incentives affect fertility? alma cohen rajeev dehejia dmitri romanov israeli national...
TRANSCRIPT

DO FINANCIAL INCENTIVES AFFECT FERTILITY?DO FINANCIAL INCENTIVES AFFECT FERTILITY?
Alma Cohen
Rajeev Dehejia
Dmitri Romanov
Israeli National Council for Economy and SocietyIsraeli National Council for Economy and Society
Feb. 12, 2008Feb. 12, 2008

SubjectSubject
• Paper investigates empirically whether financial incentives, and in particular governmental child subsidies, affect fertility.
• Takes advantage of a comprehensive individual-level panel dataset of fertility histories and detailed individual controls for married Israeli women.Data covers 1999-2005 – a period with
substantial variation in level of child subsidies but no changes in eligibility.

Main Findings Main Findings
• Child allowances have a significant positive effect on fertility.
• This effect:Is concentrated in the bottom half of the income
distribution. Is present across all religious groups, and is
especially strong for ultra-Orthodox Jews and Arab Muslims.
Is stronger for new immigrants.

Motivations for Study (1)Motivations for Study (1)
• Ever since the now-canonical fertility model of Becker (1960), there has been significant interest among researchers in whether and to what extent fertility responds to financial incentives.
• Some believe that fertility decisions are largely shaped by social, religious, and cultural forces (Gauthier 1996), and that financial incentives – at least incentives of the magnitude used by governments – have little effect.

Motivations for Study (2) Motivations for Study (2) • Whether fertility is responsive to financial incentives
has significant policy implications.
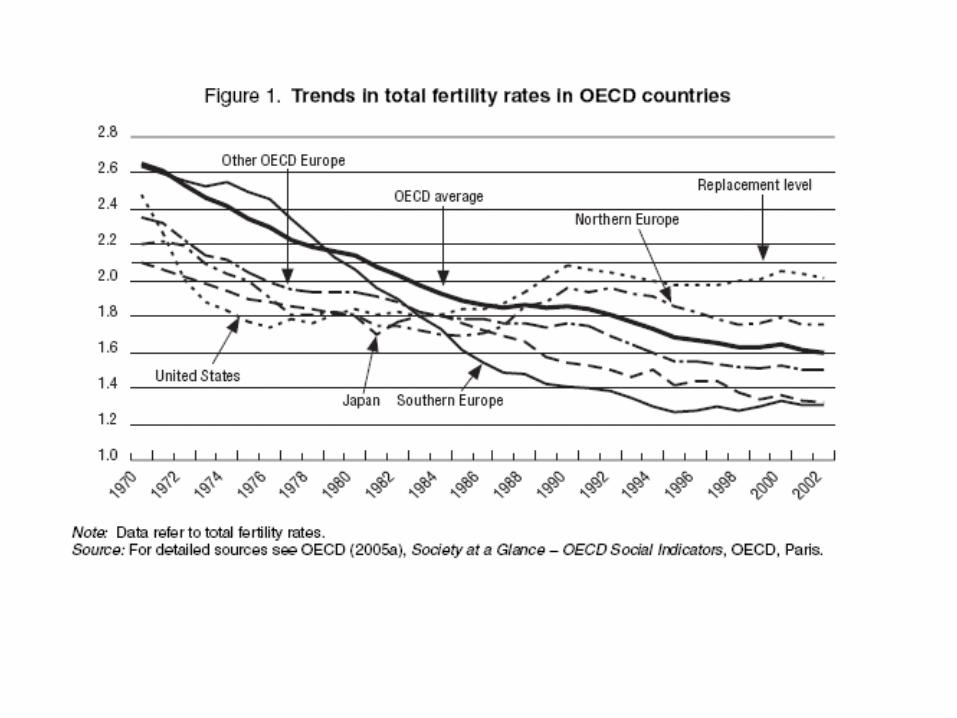
• Facing a low birthrate below the replacement level, many developed economies have adopted policies that “encourage procreation:”
• Many countries have adopted different kids of policies. The main policies:
– Child subsidies– Tax Benefits– Child care subsidies. – Maternity leaves
• Despite the prevalence of these polices, the evidence of their impact on fertility has been thus far inconclusive.

Fertility Rate around the WorldFertility Rate around the WorldCountry^ 1985 1990 1995 2000 2005
Israel 3.1 3 2.9 2.9 2.9Jew^ 2.79 2.62 2.62 2.67 2.69Arab Muslim^ 4.7 4.67 4.67 4.57 4.03
OECD CountriesAustralia 1.9 1.9 1.9 1.8 1.8Canada 1.6 1.6 1.7 1.6 1.5Denmark 1.4 1.5 1.8 1.8 1.8France 1.9 1.8 1.7 1.8 1.9Germany 1.5 1.4 1.3 1.3 1.4Italy 1.5 1.4 1.3 1.2 1.3Sweden 1.6 1.9 2 1.6 1.7Switzerland 1.5 1.5 1.5 1.5 1.4United States 1.8 1.9 2 2 2
Muslim countries Egypt 5.3 4.8 3.9 3.5 3.2Indonesia 4.1 3.4 2.9 2.5 2.4Iran 6.6 5.6 4.3 2.5 2.1Iraq 6.3 6.2 5.7 5.4 4.9Jordan 6.8 5.9 5.1 4.3 3.5Lebanon 3.9 3.3 3 2.7 2.3Saudi Arabia 7 6.2 5.5 4.6 3.8Syrian Arab Republic 7.2 6.2 4.9 4 3.5West Bank 6.4† 5.9† 5.6* 5** 5**Gaza 7.4† 7.8† 7.4* 6.9* --
^ Source: Israel CBS^^ Source: the UN† Souece: West Bank and Gaza Strip Dempgraphic Survey, 1995* Source: The Palestinian Population, Housing and Establishment Census** Source: The World bank

Prior Literature – TheoryPrior Literature – Theory
• Becker (1960): fertility decisions can be analyzed as an economic decision – the demand for children is a demand for a special type of capital good and is sensitive to their costs.
• Model extended in various directions (e.g., Cigno 1986, Manski and Mayshar 2003).

Prior Empirical Work (1) Prior Empirical Work (1)
Cross-Country Studies:
[e.g., Demeny 1986, Gauthier and Hatzius 1997, Whittington, Alm, and Peters 1990]
Problems with Cross-Countries Studies:• Hard to measure the incentive effects of transfer in a
very heterogeneous population.• Policies across countries are not uniform
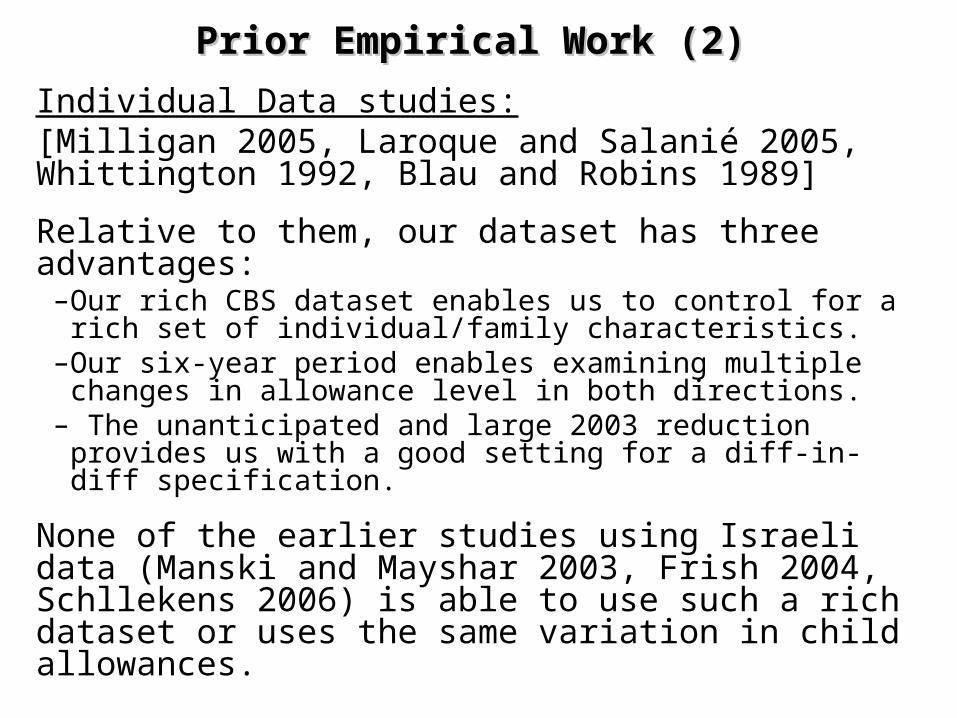
Prior Empirical Work (2) Prior Empirical Work (2)
Individual Data studies: [Milligan 2005, Laroque and Salanié 2005, Whittington 1992, Blau and Robins 1989]
Relative to them, our dataset has three advantages:–Our rich CBS dataset enables us to control for a rich set of
individual/family characteristics. –Our six-year period enables examining multiple changes in
allowance level in both directions.– The unanticipated and large 2003 reduction provides us with a
good setting for a diff-in-diff specification.
None of the earlier studies using Israeli data (Manski and Mayshar 2003, Frish 2004, Schllekens 2006) is able to use such a rich dataset or uses the same variation in child allowances.
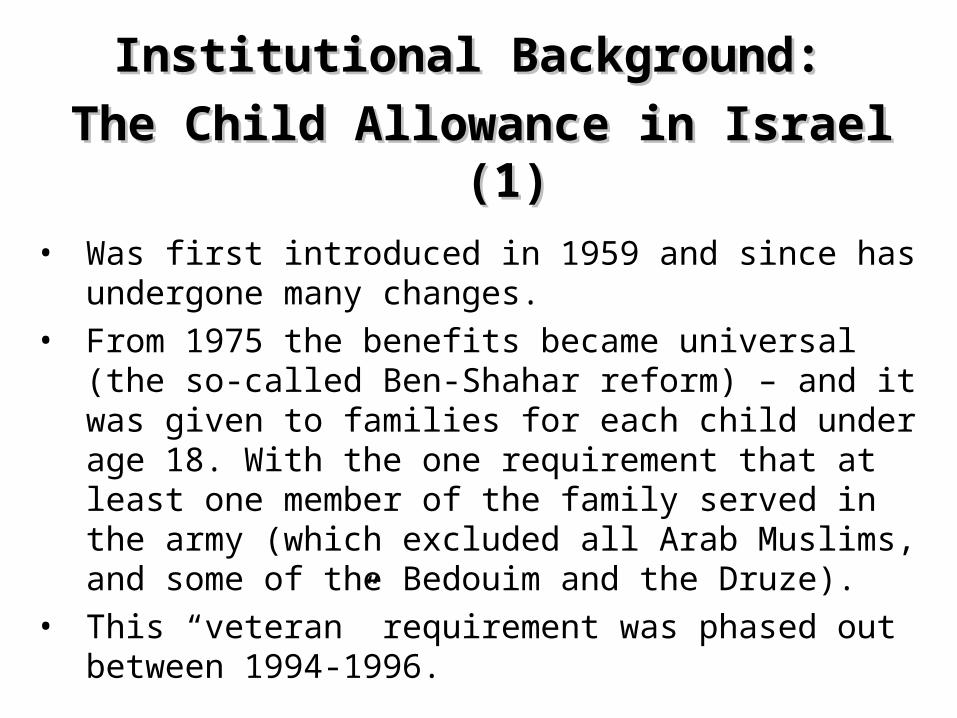
Institutional Background: Institutional Background:
The Child Allowance in Israel (1)The Child Allowance in Israel (1)
• Was first introduced in 1959 and since has undergone many changes.
• From 1975 the benefits became universal (the so-called Ben-Shahar reform) – and it was given to families for each child under age 18. With the one requirement that at least one member of the family served in the army (which excluded all Arab Muslims, and some of the Bedouim and the Druze).
• This “veteran” requirement was phased out between 1994-1996.
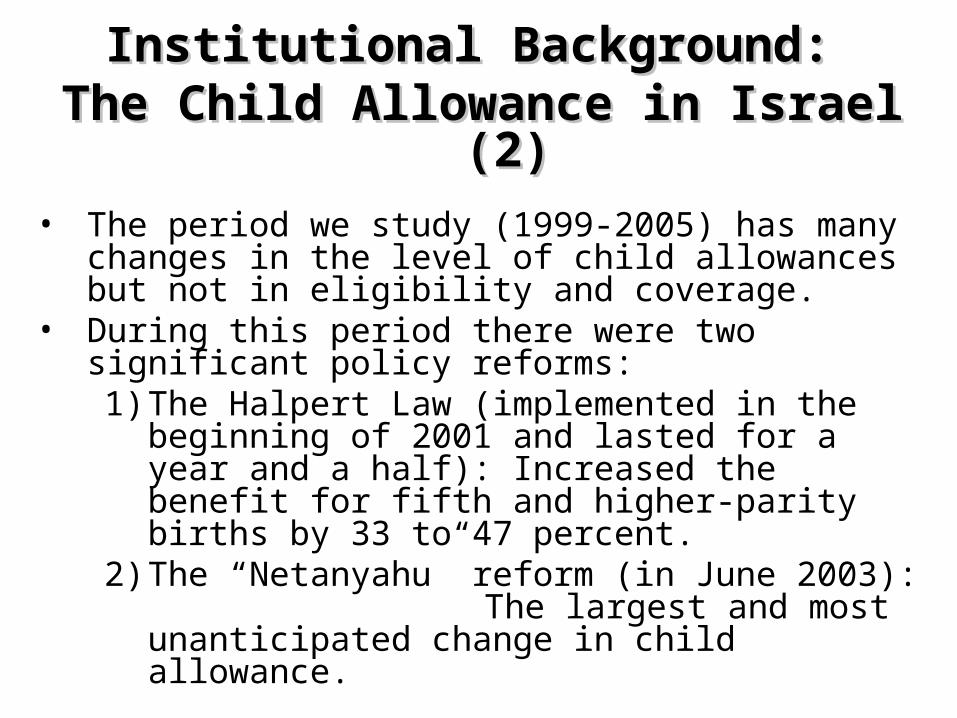
Institutional Background: Institutional Background: The Child Allowance in Israel (2)The Child Allowance in Israel (2)
• The period we study (1999-2005) has many changes in the level of child allowances but not in eligibility and coverage.
• During this period there were two significant policy reforms:
1) The Halpert Law (implemented in the beginning of 2001 and lasted for a year and a half): Increased the benefit for fifth and higher-parity births by 33 to 47 percent.
2) The “Netanyahu” reform (in June 2003): The largest and most unanticipated change in child allowance.

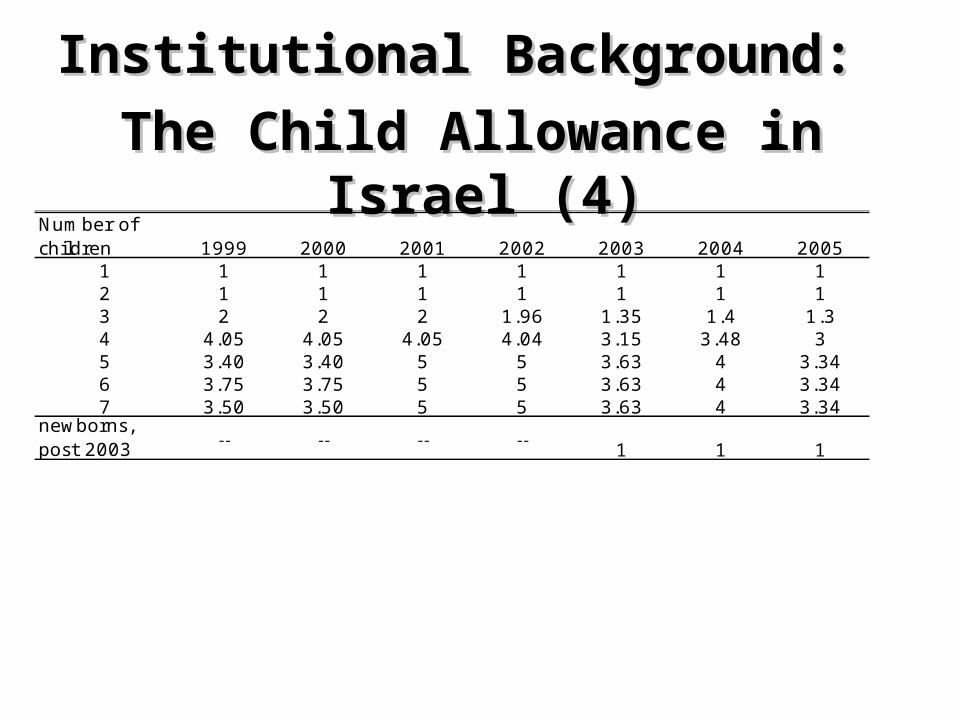
Institutional Background: Institutional Background: The Child Allowance in Israel (3)The Child Allowance in Israel (3)
The 2003 Reform:• Under the 2003 reform bill, mothers of children born
after June 2003 receive an allowance equivalent to that of the first two children in the family regardless of their birth parity.
• Established a transition regime for children born prior to the reform – a gradual decrease over the subsequent seven years so that by 2009 every child will receive a uniform allowance irrespective of birth parity.
• Although child allowances were reduced across the board, the biggest reduction in benefits was for families with many children.
Institutional Background: Institutional Background:
The Child Allowance in Israel (4)The Child Allowance in Israel (4)
Number of children 1999 2000 2001 2002 2003 2004 2005
1 1 1 1 1 1 1 12 1 1 1 1 1 1 13 2 2 2 1.96 1.35 1.4 1.34 4.05 4.05 4.05 4.04 3.15 3.48 35 3.40 3.40 5 5 3.63 4 3.346 3.75 3.75 5 5 3.63 4 3.347 3.50 3.50 5 5 3.63 4 3.34
newborns, post 2003 -- -- -- --
1 1 1
Institutional Background: Institutional Background: The Child Allowance in Israel (5)The Child Allowance in Israel (5)
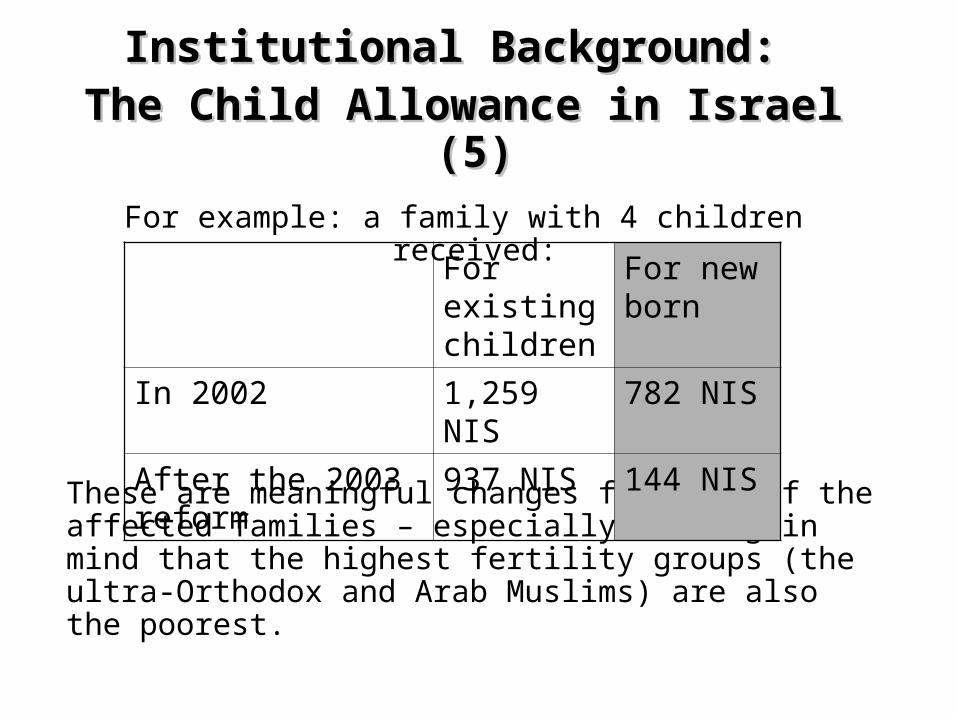
For example: a family with 4 children received:
These are meaningful changes for many of the affected families – especially bearing in mind that the highest fertility groups (the ultra-Orthodox and Arab Muslims) are also the poorest.
For existing children
For new born
In 2002 1,259 NIS 782 NIS
After the 2003 reform 937 NIS 144 NIS
Institutional Background: Institutional Background: The Child Allowance in Israel (4)The Child Allowance in Israel (4)
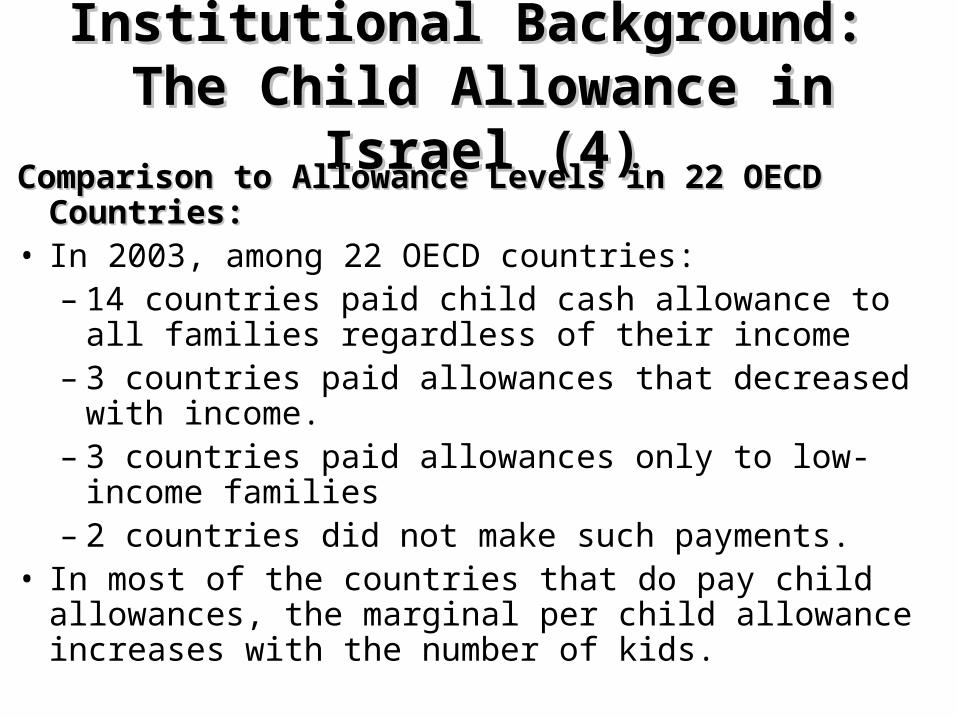
Comparison to Allowance Levels in 22 OECD Countries: Comparison to Allowance Levels in 22 OECD Countries: • In 2003, among 22 OECD countries:
– 14 countries paid child cash allowance to all families regardless of their income
– 3 countries paid allowances that decreased with income. – 3 countries paid allowances only to low-income
families– 2 countries did not make such payments.
• In most of the countries that do pay child allowances, the marginal per child allowance increases with the number of kids.

The Data:The Data:Includes all married women under 45 with at least 2 kids.
We merged number of datasets, each maintained by the Israeli CBS
• Fertility History and Basic Demographic Characteristics • Education• Religion• Income

Descriptive Statistics (1)Descriptive Statistics (1)Summary StatisticsSummary Statistics
Full sample Secular J ewsReligious
J ewsOrthodox
J ewsArabs Muslim
Arab Christians
Druze and others
Number of children 3.28 2.63 3.41 4.61 4.14 3.02 3.63(1.44) (0.82) (1.38) (2.44) (1.91) (1.07) (1.58)
Age 35.27 36.77 35.19 32.95 32.84 35.19 33.79(5.74) (4.95) (5.58) (6.16) (6.22) (5.58) (5.82)
Husband's age 38.98 40.16 39.07 35.84 37.30 40.47 38.44(6.56) (5.88) (6.58) (6.99) (7.06) (6.39) (6.58)
Education 2.39 2.71 2.57 2.05 1.67 2.32 1.94(1.02) (1.07) (1.12) (0.33) (1.08) (1.16) (0.95)
Household income 104021 136679 113400 56924 44445 80754 67654(264,625) (341,147) (215,263) (96,900) (50,569) (87,386) (60,831)
Mother Working 0.61 0.76 0.73 0.55 0.22 0.49 0.33(0.46) (0.43) (0.44) (0.5) (0.41) (0.50) (0.47)
Husband working 0.743 0.80 0.80 0.51 0.69 0.76 0.78(0.43) (0.4) (0.4) (0.5) (0.46) (0.43) (0.41)
Sample size 1,575,117 824,842 193,080 183,748 302,693 39,100 31,654

Descriptive Statistics (2)Descriptive Statistics (2)Distribution of number of kids for married women age Distribution of number of kids for married women age
40-45 by Religious Group for year 200540-45 by Religious Group for year 2005
Number of kids
Secular Religious Ultra Orthodox
Arab Muslims
Arab Christian
Druze
2 39.67% 14.02% 7.52% 4.93% 26.27% 6.05% 3 41.81% 25.49% 9.76% 11.19% 33.96% 15.19% 4 14.45% 29.33% 12.52% 21.65% 26.04% 28.02% 5 2.91% 16.48% 14.01% 22.38% 8.78% 24.07% 6+ 1.16% 14.68% 56.19% 39.86% 4.94% 26.67% Total 31774 6191 4346 7206 1275 810
Religious Group
Average Number of Kids
Secular 2.84 Religious 4.06 Ultra Orthodox 6.41 Arab Muslims 5.34 Arab Christian 3.34 Druze 4.70 Total 4.45
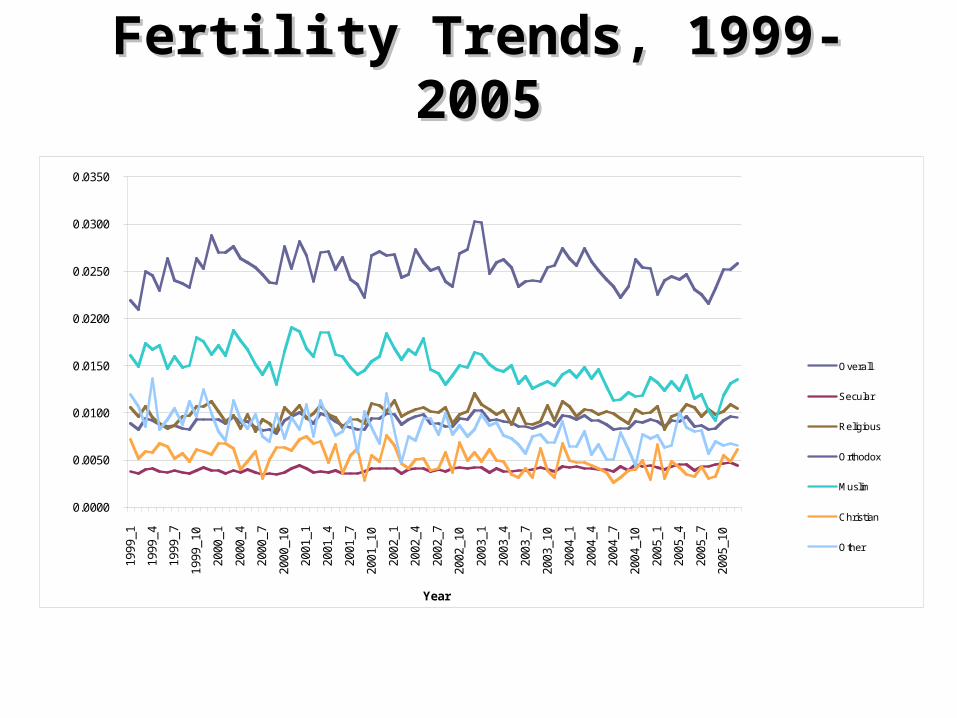
Fertility Trends, 1999-2005Fertility Trends, 1999-2005
0.0000
0.0050
0.0100
0.0150
0.0200
0.0250
0.0300
0.0350
1999
_1
1999
_4
1999
_7
1999
_10
2000
_1
2000
_4
2000
_7
2000
_10
2001
_1
2001
_4
2001
_7
2001
_10
2002
_1
2002
_4
2002
_7
2002
_10
2003
_1
2003
_4
2003
_7
2003
_10
2004
_1
2004
_4
2004
_7
2004
_10
2005
_1
2005
_4
2005
_7
2005
_10
Year
Fer
tility
rat
e
Overall
Secular
Religious
Orthodox
Muslim
Christian
Other
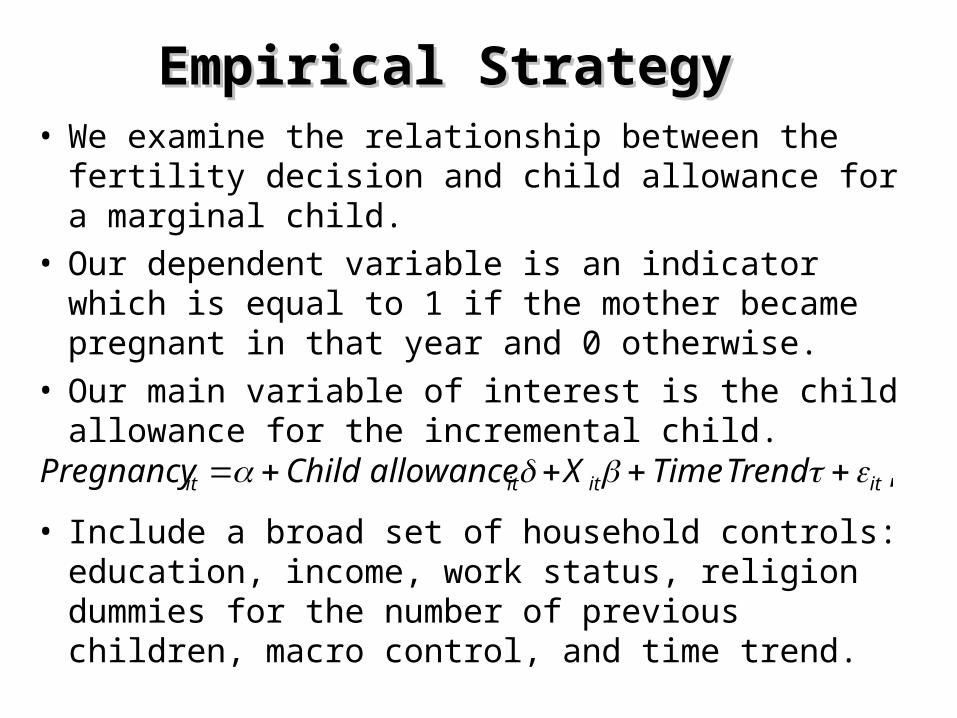
Empirical Strategy Empirical Strategy • We examine the relationship between the fertility
decision and child allowance for a marginal child. • Our dependent variable is an indicator which is equal to
1 if the mother became pregnant in that year and 0 otherwise.
• Our main variable of interest is the child allowance for the incremental child.
• Include a broad set of household controls: education, income, work status, religion dummies for the number of previous children, macro control, and time trend.
Pregnancy it Child allowanceit X it Time Trend it ,

Results (1)Results (1) Average effect of Child
Allowance on the Probability of Pregnancy
Probit regressionDependent variable: becoming
pregnant dummy
Variables: Year Trend Year Dummiescoef/se coef/se
Child allowance 0.000022*** 0.000020***0.000001*** (0.000002)
Mother's age -0.007220*** -0.007230***0.000066*** (0.000066)
Father's age -0.003227*** -0.003233***0.000056*** (0.000056)
Mother working -0.013045*** -0.013130***0.000525*** (0.000525)
Father working -0.016632*** -0.017000***0.000648*** (0.000651)
Max household education 0.001071*** 0.001005***0.000216*** (0.000216)
Pregnant previous year -0.068227*** -0.068537***0.000293*** (0.000293)0.000322*** 0.0003390.000260*** (0.000260)
Religious J ew 0.063331*** 0.063305***0.001025*** (0.001024)
Ultra-Orthodox J ew 0.146318*** 0.145983***0.001932*** (0.001931)
Arab Muslim 0.061217*** 0.060917***0.001188*** (0.001186)
Arab Christian -0.000310*** -0.0004080.001486*** (0.001484)
Druze or other 0.018564*** 0.018431***0.001795*** (0.001793)
% effect at mean CA 7.9% 7.2%Year trend Yes NoYear dummies No YesNumber of kids dummies Yes YesSocio Group dummies Yes YesNumber of observations 1,573,634 1,573,634Adjusted R-squared 0.161 0.161note: .01 - ***; .05 - **; .1 - *;Marginal probit coefficients are presented.
Gap with avg kids in locality
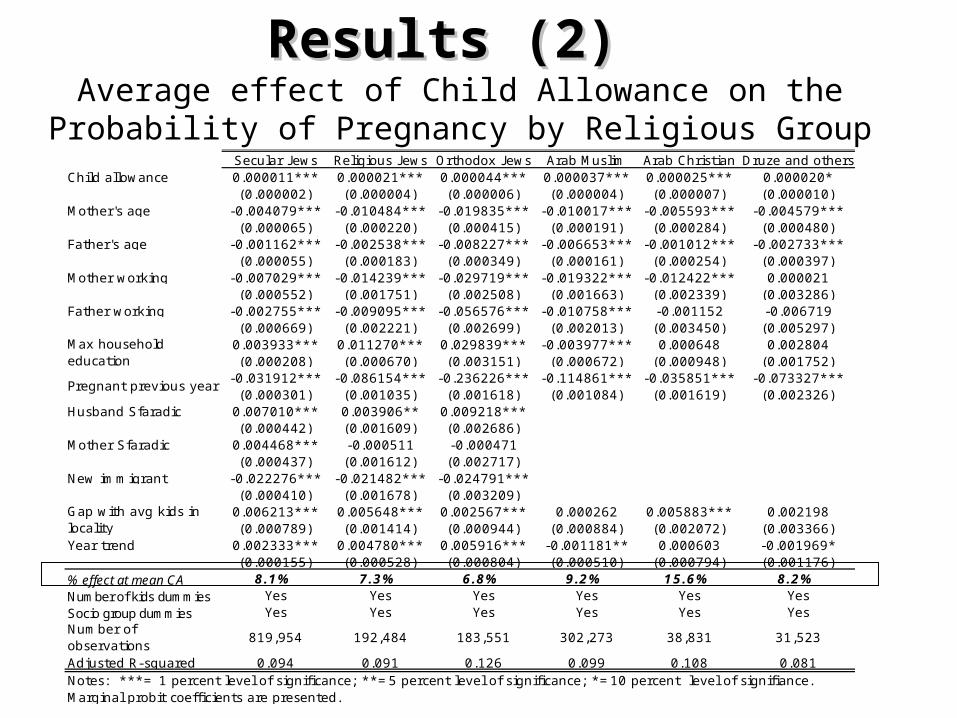
Results (2)Results (2) Average effect of Child Allowance on the Probability of
Pregnancy by Religious GroupSecular J ews Religious J ews Orthodox J ews Arab Muslim Arab Christian Druze and others
Child allowance 0.000011*** 0.000021*** 0.000044*** 0.000037*** 0.000025*** 0.000020*(0.000002) (0.000004) (0.000006) (0.000004) (0.000007) (0.000010)
Mother's age -0.004079*** -0.010484*** -0.019835*** -0.010017*** -0.005593*** -0.004579***(0.000065) (0.000220) (0.000415) (0.000191) (0.000284) (0.000480)
Father's age -0.001162*** -0.002538*** -0.008227*** -0.006653*** -0.001012*** -0.002733***(0.000055) (0.000183) (0.000349) (0.000161) (0.000254) (0.000397)
Mother working -0.007029*** -0.014239*** -0.029719*** -0.019322*** -0.012422*** 0.000021(0.000552) (0.001751) (0.002508) (0.001663) (0.002339) (0.003286)
Father working -0.002755*** -0.009095*** -0.056576*** -0.010758*** -0.001152 -0.006719(0.000669) (0.002221) (0.002699) (0.002013) (0.003450) (0.005297)
0.003933*** 0.011270*** 0.029839*** -0.003977*** 0.000648 0.002804(0.000208) (0.000670) (0.003151) (0.000672) (0.000948) (0.001752)
-0.031912*** -0.086154*** -0.236226*** -0.114861*** -0.035851*** -0.073327***(0.000301) (0.001035) (0.001618) (0.001084) (0.001619) (0.002326)
Husband Sfaradic 0.007010*** 0.003906** 0.009218***(0.000442) (0.001609) (0.002686)
Mother Sfaradic 0.004468*** -0.000511 -0.000471(0.000437) (0.001612) (0.002717)
New immigrant -0.022276*** -0.021482*** -0.024791***(0.000410) (0.001678) (0.003209)
0.006213*** 0.005648*** 0.002567*** 0.000262 0.005883*** 0.002198(0.000789) (0.001414) (0.000944) (0.000884) (0.002072) (0.003366)
Year trend 0.002333*** 0.004780*** 0.005916*** -0.001181** 0.000603 -0.001969*(0.000155) (0.000528) (0.000804) (0.000510) (0.000794) (0.001176)
% effect at mean CA 8.1% 7.3% 6.8% 9.2% 15.6% 8.2%Number of kids dummies Yes Yes Yes Yes Yes YesSocio group dummies Yes Yes Yes Yes Yes YesNumber of observations
819,954 192,484 183,551 302,273 38,831 31,523
Adjusted R-squared 0.094 0.091 0.126 0.099 0.108 0.081Notes: ***= 1 percent level of significance; **=5 percent level of significance; *=10 percent level of signifiance.Marginal probit coefficients are presented.
Max household education
Pregnant previous year
Gap with avg kids in locality
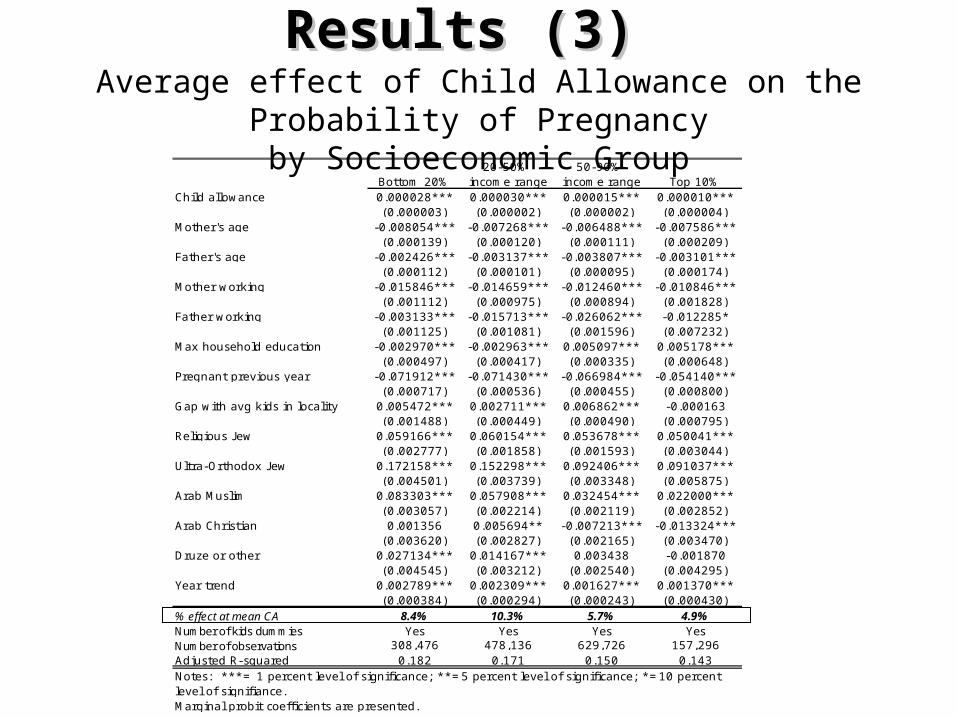
Results (3)Results (3) Average effect of Child Allowance on the Probability of Pregnancy
by Socioeconomic GroupBottom 20%
20-50% income range
50-90% income range Top 10%
Child allowance 0.000028*** 0.000030*** 0.000015*** 0.000010***(0.000003) (0.000002) (0.000002) (0.000004)
Mother's age -0.008054*** -0.007268*** -0.006488*** -0.007586***(0.000139) (0.000120) (0.000111) (0.000209)
Father's age -0.002426*** -0.003137*** -0.003807*** -0.003101***(0.000112) (0.000101) (0.000095) (0.000174)
Mother working -0.015846*** -0.014659*** -0.012460*** -0.010846***(0.001112) (0.000975) (0.000894) (0.001828)
Father working -0.003133*** -0.015713*** -0.026062*** -0.012285*(0.001125) (0.001081) (0.001596) (0.007232)
Max household education -0.002970*** -0.002963*** 0.005097*** 0.005178***(0.000497) (0.000417) (0.000335) (0.000648)
Pregnant previous year -0.071912*** -0.071430*** -0.066984*** -0.054140***(0.000717) (0.000536) (0.000455) (0.000800)
0.005472*** 0.002711*** 0.006862*** -0.000163(0.001488) (0.000449) (0.000490) (0.000795)
Religious J ew 0.059166*** 0.060154*** 0.053678*** 0.050041***(0.002777) (0.001858) (0.001593) (0.003044)
Ultra-Orthodox J ew 0.172158*** 0.152298*** 0.092406*** 0.091037***(0.004501) (0.003739) (0.003348) (0.005875)
Arab Muslim 0.083303*** 0.057908*** 0.032454*** 0.022000***(0.003057) (0.002214) (0.002119) (0.002852)
Arab Christian 0.001356 0.005694** -0.007213*** -0.013324***(0.003620) (0.002827) (0.002165) (0.003470)
Druze or other 0.027134*** 0.014167*** 0.003438 -0.001870(0.004545) (0.003212) (0.002540) (0.004295)
Year trend 0.002789*** 0.002309*** 0.001627*** 0.001370***(0.000384) (0.000294) (0.000243) (0.000430)
% effect at mean CA 8.4% 10.3% 5.7% 4.9%Number of kids dummies Yes Yes Yes YesNumber of observations 308,476 478,136 629,726 157,296Adjusted R-squared 0.182 0.171 0.150 0.143
Marginal probit coefficients are presented.
Gap with avg kids in locality
Notes: ***= 1 percent level of significance; **=5 percent level of significance; *=10 percent level of signifiance.
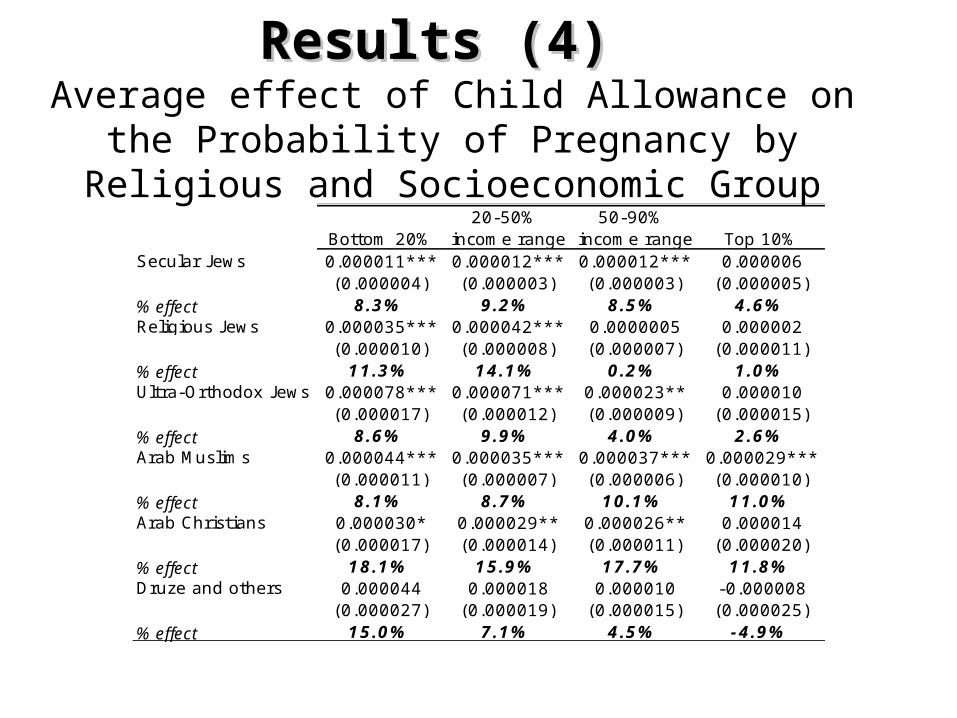
Results (4)Results (4) Average effect of Child Allowance on the Probability of
Pregnancy by Religious and Socioeconomic Group
Bottom 20%20-50%
income range50-90%
income range Top 10%Secular J ews 0.000011*** 0.000012*** 0.000012*** 0.000006
(0.000004) (0.000003) (0.000003) (0.000005)% effect 8.3% 9.2% 8.5% 4.6%Religious J ews 0.000035*** 0.000042*** 0.0000005 0.000002
(0.000010) (0.000008) (0.000007) (0.000011)% effect 11.3% 14.1% 0.2% 1.0%Ultra-Orthodox J ews 0.000078*** 0.000071*** 0.000023** 0.000010
(0.000017) (0.000012) (0.000009) (0.000015)% effect 8.6% 9.9% 4.0% 2.6%Arab Muslims 0.000044*** 0.000035*** 0.000037*** 0.000029***
(0.000011) (0.000007) (0.000006) (0.000010)% effect 8.1% 8.7% 10.1% 11.0%Arab Christians 0.000030* 0.000029** 0.000026** 0.000014
(0.000017) (0.000014) (0.000011) (0.000020)% effect 18.1% 15.9% 17.7% 11.8%Druze and others 0.000044 0.000018 0.000010 -0.000008
(0.000027) (0.000019) (0.000015) (0.000025)% effect 15.0% 7.1% 4.5% -4.9%

Results (5)Results (5)The Differential Effect of Child Allowance on New The Differential Effect of Child Allowance on New
ImmigrantsImmigrants
Baseline specification
with interactions
New immigrant -0.040822***(0.000677)
Child allowance 0.000011***(0.000001)
Child Alowance x new immigrant 0.000064***(0.000003)
Year trend 0.003103***(0.000163)
Number of observations 1,195,989Adjusted R-squared 0.181Notes: ***= 1 percent level of significance; * *=5 percent level of significance; *=10 percent level of signifiance.Marginal probit coefficients are presented.

Diff-in-Diff: The 2003 ChangesDiff-in-Diff: The 2003 Changes • Look at changes in fertility around the policy
change in 2003. We compare the fertility of low-income women in a three- or four-month window before and after the policy change using top income quartile women as a comparison group:
Pregnancyi,t Low Income it Afterit Low Incomeit Afterit it .

Results (diffs-in-diffs)Results (diffs-in-diffs)
Pre-period Starts
J anuary 2003
Post-period Starts J une
2003
Treatment-Comparison
difference
Pre-period Starts
J anuary 2003
Post-period Starts J une
2003
Treatment-Comparison
difference
Comparison: 4th Income Group 0.0188 0.0226 0.0038
Comparison: 4th Income Group 0.0239 0.0274 0.0035
Treatment: 1st Income Group 0.0537 0.0470 -0.0067
Treatment: 1st Income Group 0.0654 0.0587 -0.0067
Difference in differences -0.014*** Difference in differences -0.0102***(0.0023) (0.0026)
Pre-period Starts
J anuary 2003
Post-period Starts
December 2003
Treatment-Comparison
difference
Pre-period Starts
J anuary 2003
Post-period Starts
December 2003
Treatment-Comparison
difference
Comparison: 4th Income Group 0.0188 0.0211 0.0022
Comparison: 4th Income Group 0.0239 0.0211 -0.0028
Treatment: 1st Income Group 0.0537 0.0481 -0.0056
Treatment: 1st Income Group 0.0654 0.0481 -0.0173
Difference in differences -0.0078*** Difference in differences -0.0145***(0.0023) (0.0024)
Fourth-month window
Fourth-month window
Three-month window
Three-month window
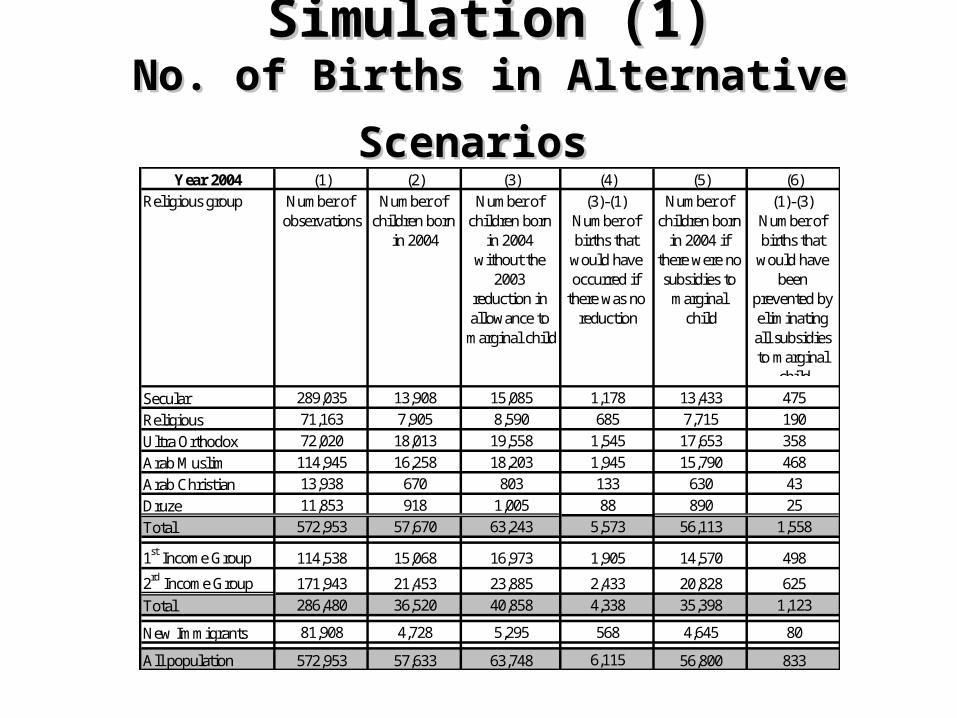
Simulation (1)Simulation (1)No. of Births in Alternative ScenariosNo. of Births in Alternative Scenarios
Year 2004 (1) (2) (3) (4) (5) (6)
Number of observations
Number of children born
in 2004 without the
2003 reduction in allowance to marginal child
(3)-(1) Number of births that
would have occurred if
there was no reduction
Number of children born
in 2004 if there were no subsidies to
marginal child
(1)-(3) Number of births that
would have been
prevented by eliminating all subsidies to marginal
child
Secular 289,035 13,908 15,085 1,178 13,433 475
Religious 71,163 7,905 8,590 685 7,715 190
Ultra Orthodox 72,020 18,013 19,558 1,545 17,653 358
Arab Muslim 114,945 16,258 18,203 1,945 15,790 468
Arab Christian 13,938 670 803 133 630 43
Druze 11,853 918 1,005 88 890 25
Total 572,953 57,670 63,243 5,573 56,113 1,558
1st Income Group 114,538 15,068 16,973 1,905 14,570 498
2rd Income Group 171,943 21,453 23,885 2,433 20,828 625
Total 286,480 36,520 40,858 4,338 35,398 1,123
New Immigrants 81,908 4,728 5,295 568 4,645 80
All population 572,953 57,633 63,748 6,115 56,800 833
Religious group Number of children born
in 2004
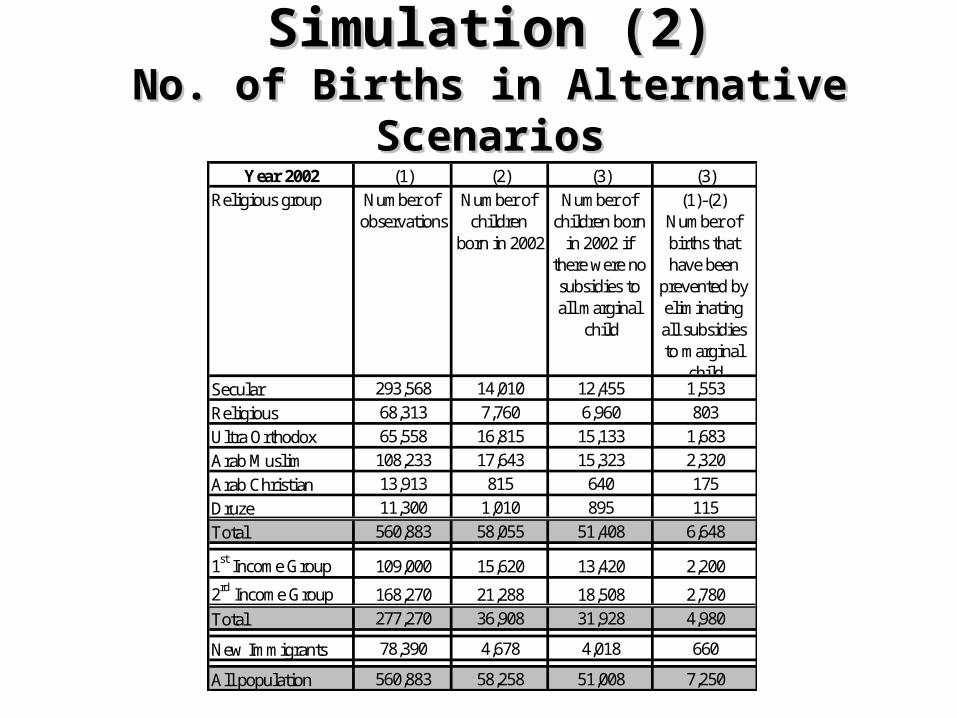
Simulation (2)Simulation (2)No. of Births in Alternative ScenariosNo. of Births in Alternative Scenarios
Year 2002 (1) (2) (3) (3)
Secular 293,568 14,010 12,455 1,553
Religious 68,313 7,760 6,960 803
Ultra Orthodox 65,558 16,815 15,133 1,683
Arab Muslim 108,233 17,643 15,323 2,320
Arab Christian 13,913 815 640 175
Druze 11,300 1,010 895 115
Total 560,883 58,055 51,408 6,648
1st Income Group 109,000 15,620 13,420 2,200
2rd Income Group 168,270 21,288 18,508 2,780
Total 277,270 36,908 31,928 4,980
New Immigrants 78,390 4,678 4,018 660
All population 560,883 58,258 51,008 7,250
(1)-(2) Number of births that have been
prevented by eliminating all subsidies to marginal
child
Number of observations
Religious group Number of children
born in 2002
Number of children born
in 2002 if there were no subsidies to all marginal
child
ConclusionsConclusions
• Child allowances have a significant positive effect on fertility,
• This effect: Is concentrated in the bottom half of the income distribution. Is present across all religious groups, and is especially strong
for ultra-Orthodox Jews and Arab Muslims. Is stronger for new immigrants (who may have less resources
to rely on).
• Future work: In several years, it would be worthwhile to do a follow-up study to investigate the long-term effects of the 2003 reform.

Description of Variables
Variable Description Pregnant Equal to 1 if the woman was pregnant in the calendar year and 0 otherwise. Number of children The number of children the women had at the beginning of the calendar year. Mother age Mother age in years. Father age Father age in years. Religion 1 for secular Jewish, 2 for religious Jewish, 3 for ultra-Orthodox Jewish, 4 for Arab
Muslim, 5 for Arab Christian, and 6 for Druze and other Mother Place of Origin Defined only for the Jewish population and equal to 1 if Mother (or parents) from:
Middle East, Asia, North Africa, Morocco, Ethiopia, or Africa. Husband Place of Origin Defined only for the Jewish population and equal to 1 if Husband (or parents) from:
Middle East, Asia, North Africa, Morocco, Ethiopia, or Africa. New immigrant Equal to 1 if either the mother or the Husband is Jewish and immigrated to Israel
after 1990. Max household education Maximum of mother's and husband’s years of education. 1 for primary school, 2 for
high school graduate, 3 for college, and 4 for post-graduate education. Mother working Equal to 1 if the mother had a positive annual salary and 0 otherwise. Father working Equal to 1 if the father had a positive annual salary and 0 otherwise Pregnant previous year Mother was pregnant in the previous year. Child allowance The value of child allowance that will be given to the next child if born. Net income Mother and Husband total income minus tax, plus annual child allowance for
existing children Income quartiles Are computed separately in each year, and are computed by religious group when the
specification is split by religion. Gap with average kids in locality
The gap between the number of children in the family and the average number of children women belonging to the same religious group, same income quartile, and living in the same locality.
Year Calendar year time trend. Unemployment rate The unemployment rate for each calendar year.
GDP change The GDP growth for each calendar year.
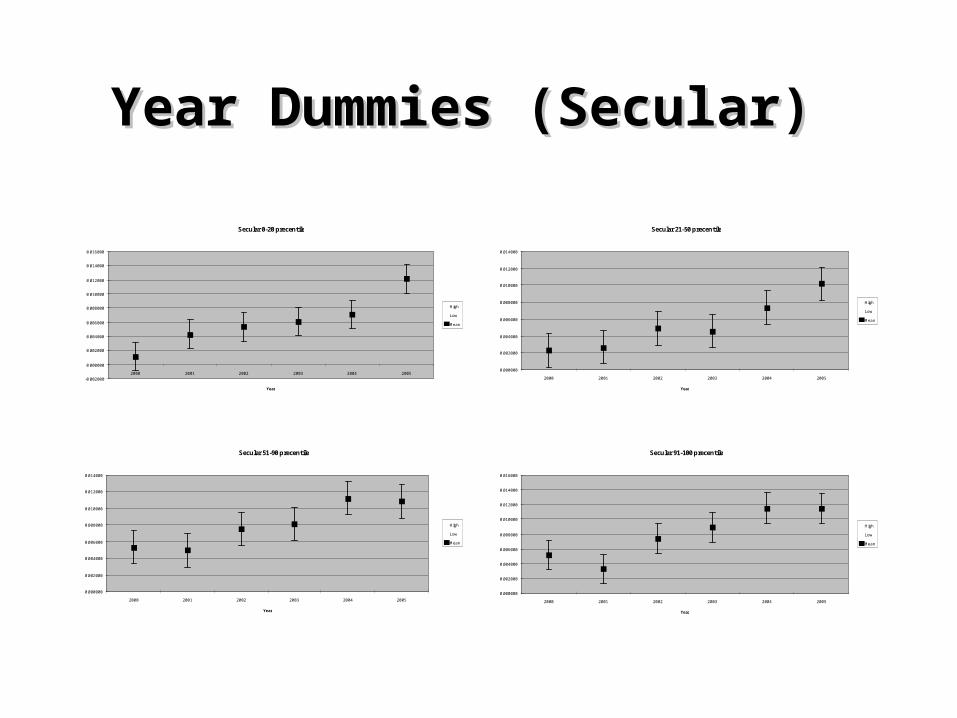
Year Dummies (Secular)Year Dummies (Secular)
Secular 0-20 precentile
-0.002000
0.000000
0.002000
0.004000
0.006000
0.008000
0.010000
0.012000
0.014000
0.016000
2000 2001 2002 2003 2004 2005
Year
High
Low
Mean
Secular 21-50 precentile
0.000000
0.002000
0.004000
0.006000
0.008000
0.010000
0.012000
0.014000
2000 2001 2002 2003 2004 2005
Year
High
Low
Mean
Secular 51-90 precentile
0.000000
0.002000
0.004000
0.006000
0.008000
0.010000
0.012000
0.014000
2000 2001 2002 2003 2004 2005
Year
High
Low
Mean
Secular 91-100 precentile
0.000000
0.002000
0.004000
0.006000
0.008000
0.010000
0.012000
0.014000
0.016000
2000 2001 2002 2003 2004 2005
Year
High
Low
Mean

Year Dummies (Religious)Year Dummies (Religious)
Religious 0-20 precentile
0.000000
0.002000
0.004000
0.006000
0.008000
0.010000
0.012000
0.014000
0.016000
2000 2001 2002 2003 2004 2005
Year
High
Low
Mean
Religious 21-50 precentile
0.000000
0.005000
0.010000
0.015000
0.020000
0.025000
0.030000
0.035000
0.040000
2000 2001 2002 2003 2004 2005
Year
High
Low
Mean
Religious 51-90 precentile
0.000000
0.005000
0.010000
0.015000
0.020000
0.025000
0.030000
0.035000
0.040000
2000 2001 2002 2003 2004 2005
Year
High
Low
Mean
Religious 91-100 precentile
0.000000
0.005000
0.010000
0.015000
0.020000
0.025000
0.030000
2000 2001 2002 2003 2004 2005
Year
High
Low
Mean

Year Dummies (Ultra-Orthodox)Year Dummies (Ultra-Orthodox)
Ultra 0-20 precentile
0.000000
0.020000
0.040000
0.060000
0.080000
0.100000
0.120000
0.140000
0.160000
2000 2001 2002 2003 2004 2005
Year
High
Low
Mean
Ultra 21-50 precentile
0.000000
0.020000
0.040000
0.060000
0.080000
0.100000
0.120000
0.140000
2000 2001 2002 2003 2004 2005
Year
High
Low
Mean
Ultra 51-90 precentile
0.000000
0.010000
0.020000
0.030000
0.040000
0.050000
0.060000
0.070000
2000 2001 2002 2003 2004 2005
Year
High
Low
Mean
Ultra 91-100 precentile
0.000000
0.005000
0.010000
0.015000
0.020000
0.025000
0.030000
0.035000
0.040000
2000 2001 2002 2003 2004 2005
Year
High
Low
Mean
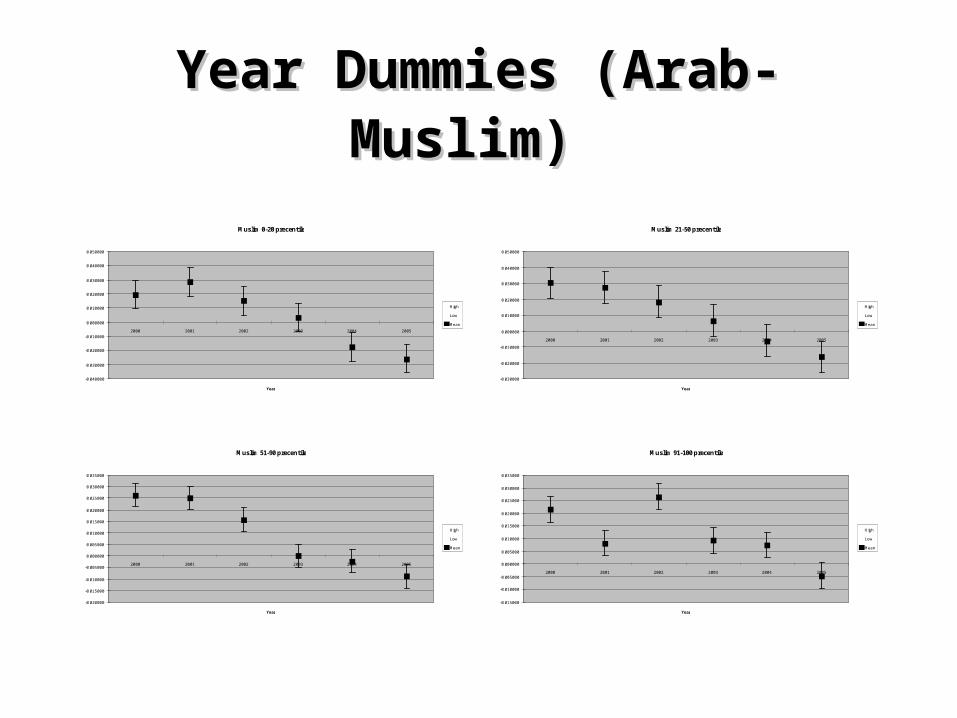
Year Dummies (Arab-Muslim)Year Dummies (Arab-Muslim)
Muslim 0-20 precentile
-0.040000
-0.030000
-0.020000
-0.010000
0.000000
0.010000
0.020000
0.030000
0.040000
0.050000
2000 2001 2002 2003 2004 2005
Year
High
Low
Mean
Muslim 21-50 precentile
-0.030000
-0.020000
-0.010000
0.000000
0.010000
0.020000
0.030000
0.040000
0.050000
2000 2001 2002 2003 2004 2005
Year
High
Low
Mean
Muslim 51-90 precentile
-0.020000
-0.015000
-0.010000
-0.005000
0.000000
0.005000
0.010000
0.015000
0.020000
0.025000
0.030000
0.035000
2000 2001 2002 2003 2004 2005
Year
High
Low
Mean
Muslim 91-100 precentile
-0.015000
-0.010000
-0.005000
0.000000
0.005000
0.010000
0.015000
0.020000
0.025000
0.030000
0.035000
2000 2001 2002 2003 2004 2005
Year
High
Low
Mean