diversity and equal opportunities in television
TRANSCRIPT
PROMOTING CHOICE • SECURING STANDARDS • PREVENTING HARM
Diversity and equal opportunities in televisionUK television industry charts and tablesProduced by: Ofcom
Fieldwork: May-July 2019
This year, to accompany the 2019 Monitoring report on the UK-based television industry, Ofcom has decided to provide a new Freelancer report, as well as an expanded In-focus report, which now covers ten major broadcasters.
Together with the charts and tables that follow, these provide industry data for television broadcasters' UK-based employees, for the period April 2018 to March 2019.
A detailed Methodology report is also available.
Diversity and equal opportunities in television
IndexFigure 1: Broadcasters solely based outside of the UK
Figure 2: Broadcasters with 500+ UK based employees
Figure 3: Summary table - 2018/19 profiles for the mandatory characteristics
Figure 4: Summary table for the six characteristics – UK based TV industry
Figure 5: Makeup of UK-based employees by job level and job role
Figure 6: Overview of key characteristics for UK-based TV industry
Figure 7: Gender - by job level and role
Figure 8: Gender – by joiners, leavers, trained and promoted (2018/19 vs. 2017/18)
Figure 9: Racial group - by job level and role
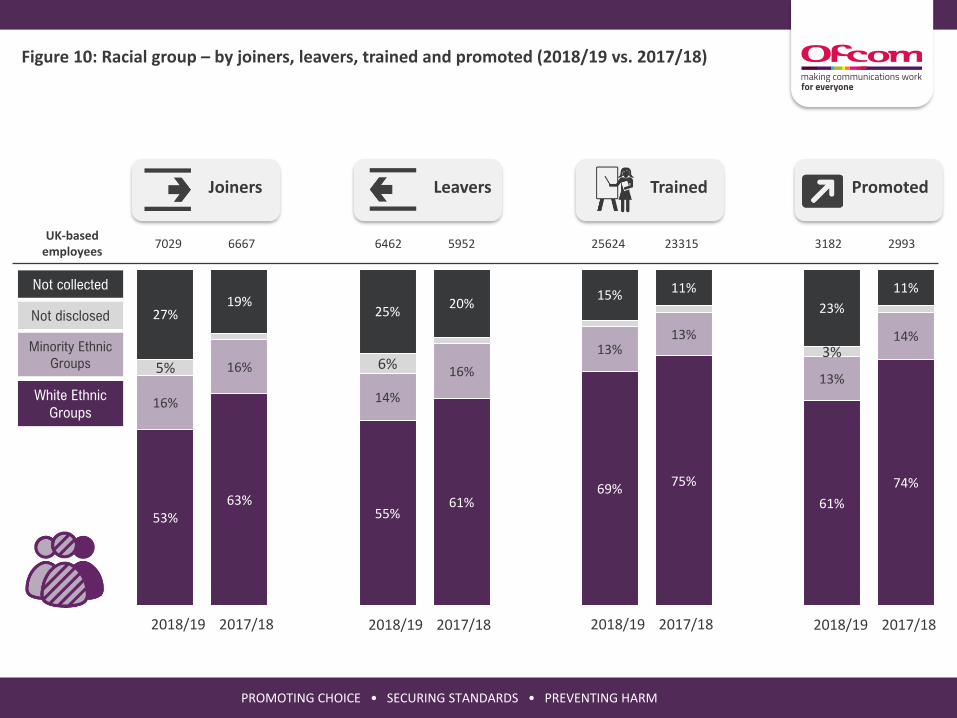
Figure 10: Racial group – by joiners, leavers, trained and promoted (2018/19 vs. 2017/18)
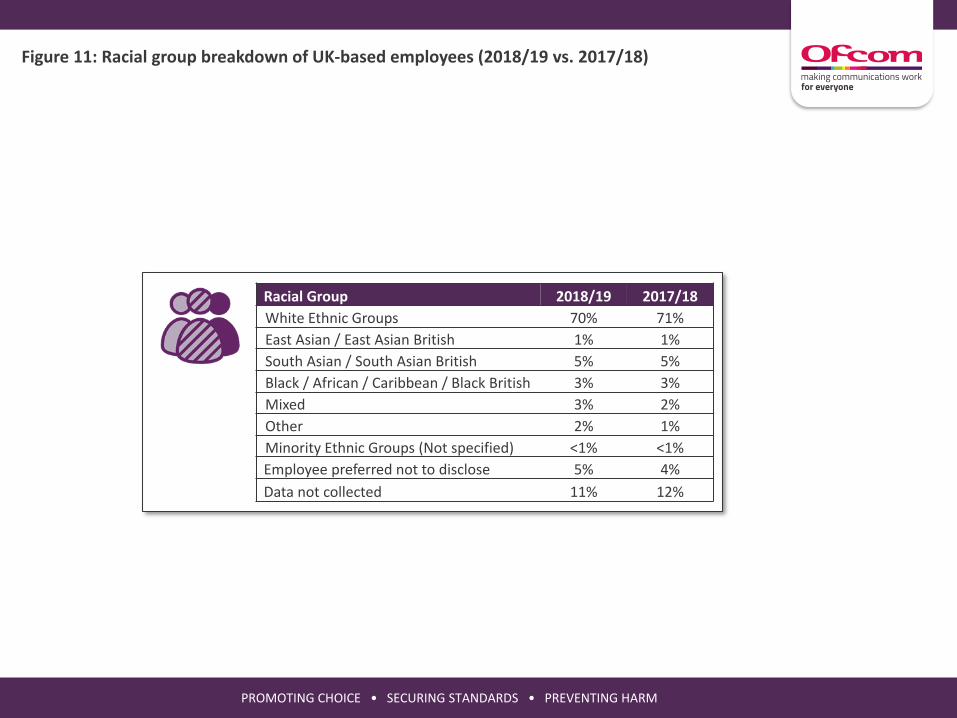
Figure 11: Racial group breakdown of UK-based employees (2018/19 vs. 2017/18)
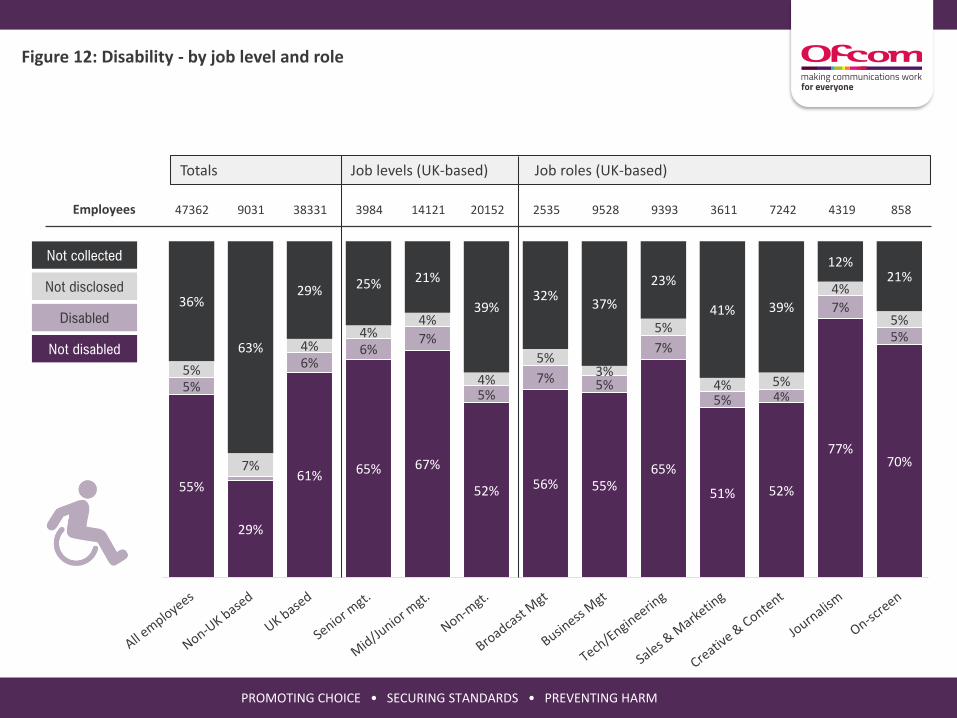
Figure 12: Disability - by job level and role
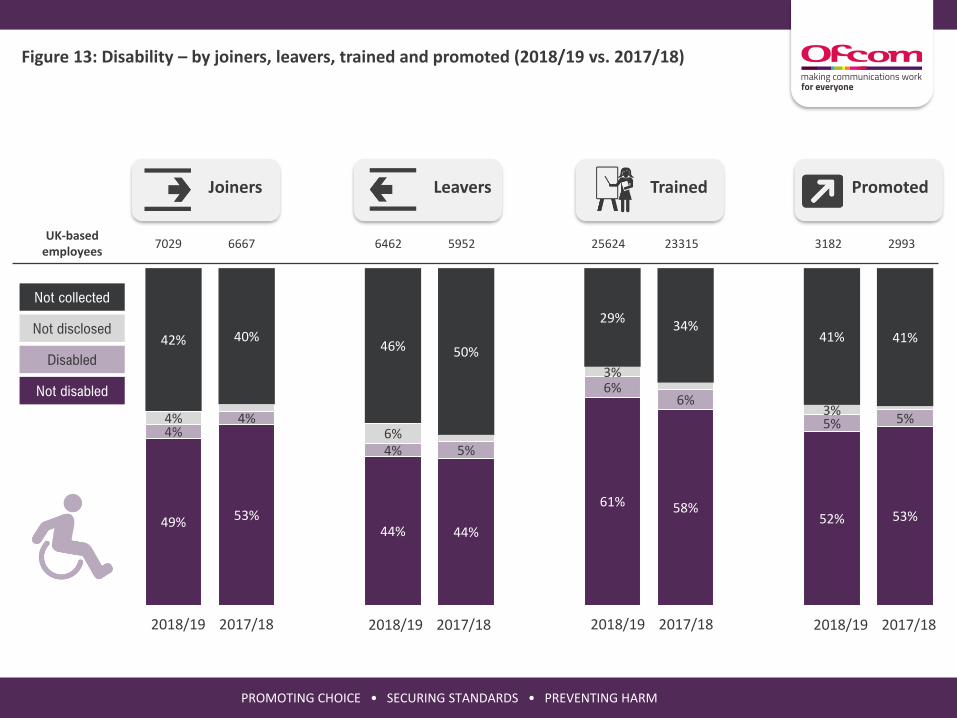
Figure 13: Disability – by joiners, leavers, trained and promoted (2018/19 vs. 2017/18)
Figure 14: Disability breakdown of UK-based employees (2018/19 vs. 2017/18)
Figure 15: Age - by job level and role
Figure 16: Age – by joiners, leavers, trained and promoted (2018/19 vs. 2017/18)
Figure 17: Age breakdown of UK-based employees (2018/19 vs. 2017/18)Figure 18: Age – by gender
Figure 19: Sexual orientation - by job level and role
Figure 20: Sexual orientation – by joiners, leavers, trained and promoted (2018/19 vs. 2017/18)
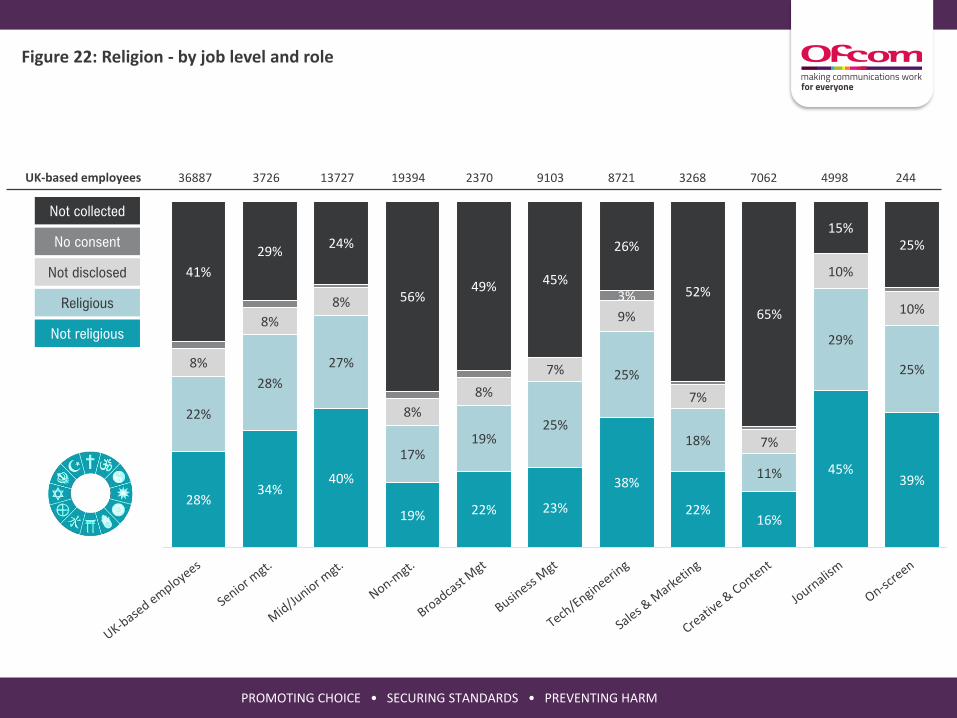
Figure 21: Sexual orientation breakdown of UK-based employees (2018/19 vs. 2017/18) Figure 22: Religion - by job level and role
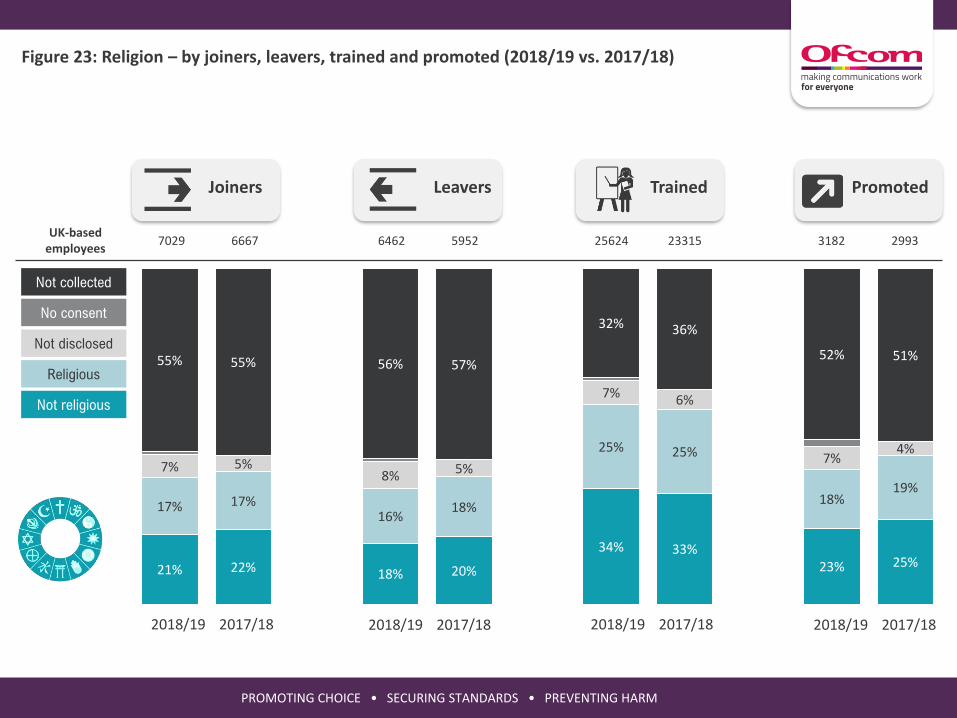
Figure 23: Religion – by joiners, leavers, trained and promoted (2018/19 vs. 2017/18)
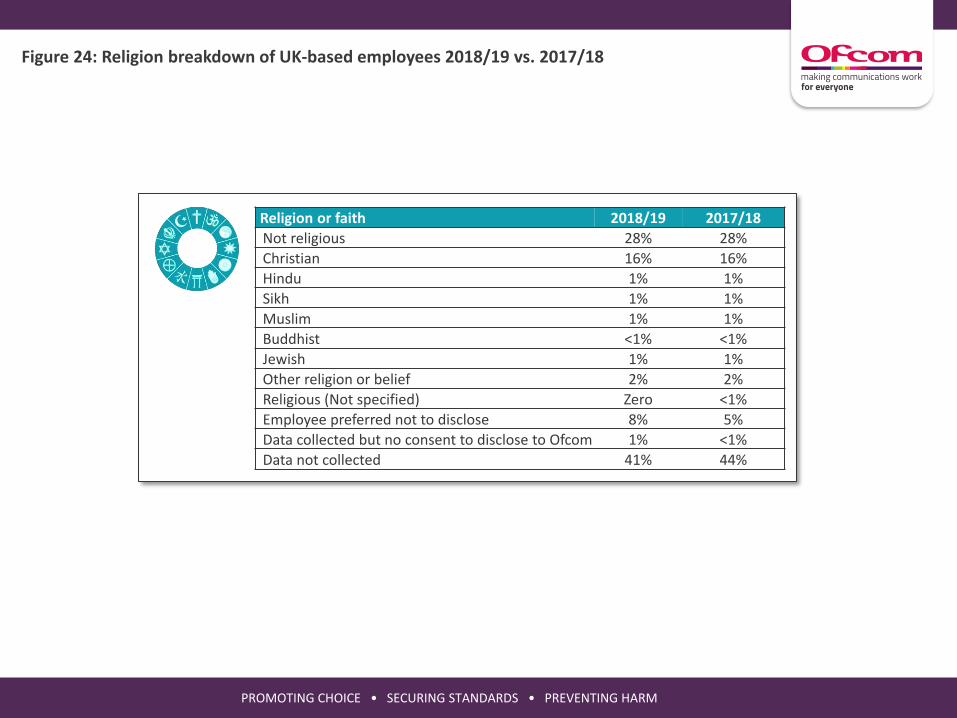
Figure 24: Religion breakdown of UK-based employees 2018/19 vs. 2017/18
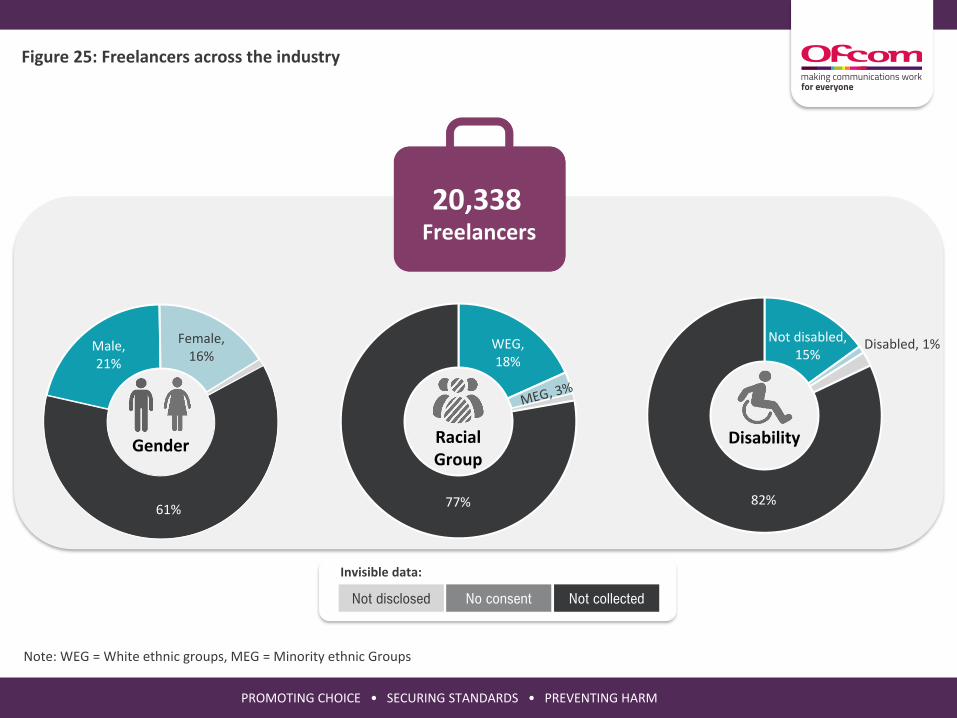
Figure 25: Freelancers across the industry
Table 1: UK-based employee profiles for the three mandatory characteristics - 2018/19 vs. 2017/18
Table 2: UK-based employee data collection statistics for the three voluntary characteristics - 2018/19
PROMOTING CHOICE • SECURING STANDARDS • PREVENTING HARM
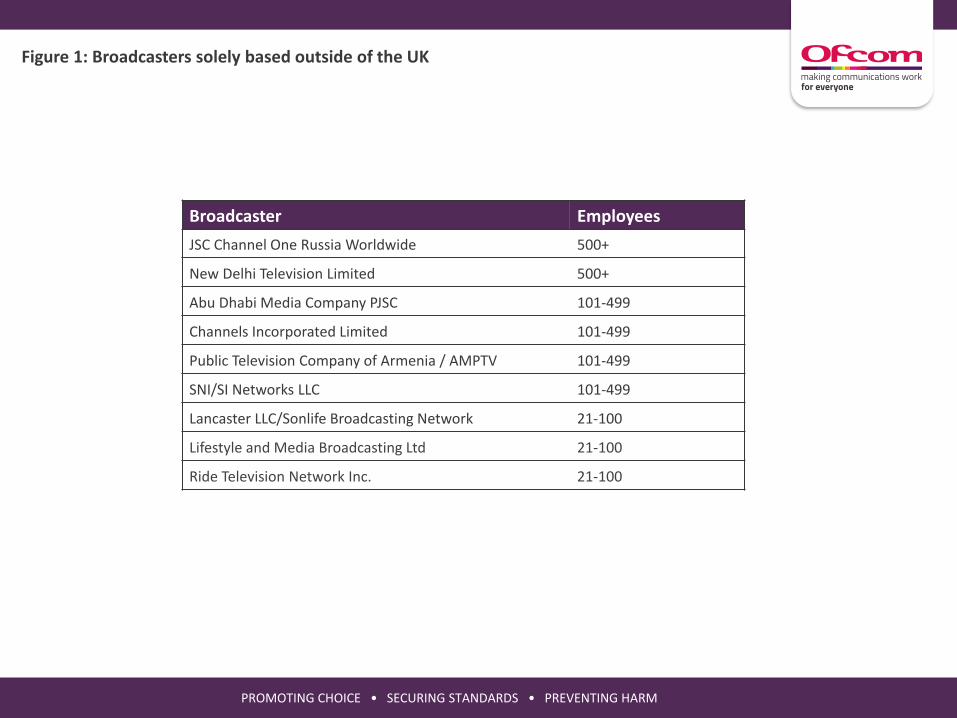
Figure 1: Broadcasters solely based outside of the UK
Broadcaster Employees
JSC Channel One Russia Worldwide 500+
New Delhi Television Limited 500+
Abu Dhabi Media Company PJSC 101-499
Channels Incorporated Limited 101-499
Public Television Company of Armenia / AMPTV 101-499
SNI/SI Networks LLC 101-499
Lancaster LLC/Sonlife Broadcasting Network 21-100
Lifestyle and Media Broadcasting Ltd 21-100
Ride Television Network Inc. 21-100
PROMOTING CHOICE • SECURING STANDARDS • PREVENTING HARM
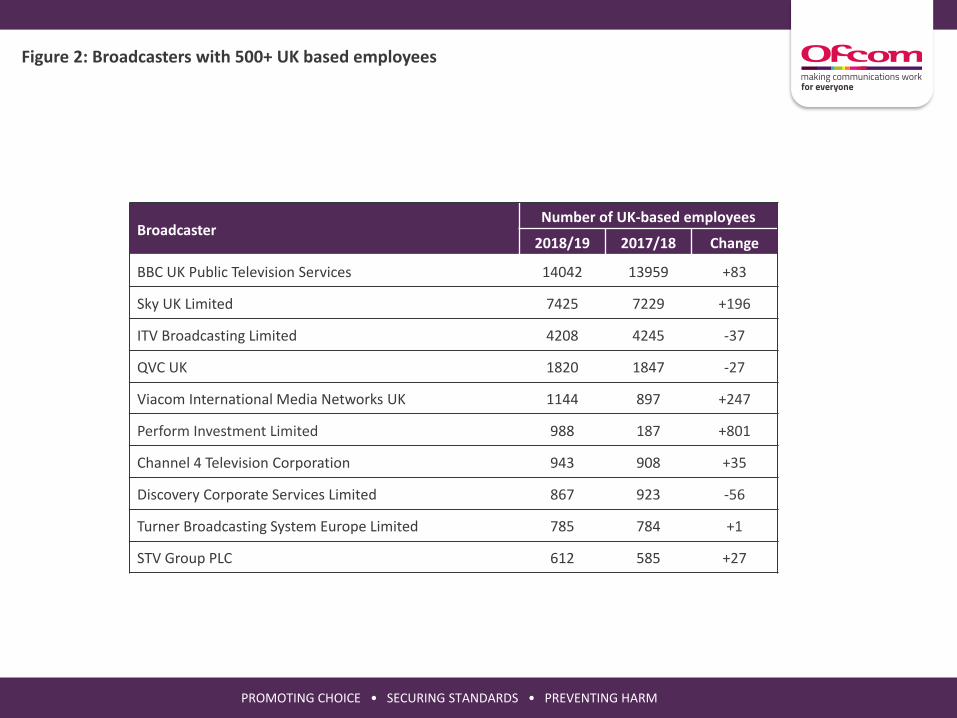
Figure 2: Broadcasters with 500+ UK based employees
BroadcasterNumber of UK-based employees
2018/19 2017/18 Change
BBC UK Public Television Services 14042 13959 +83
Sky UK Limited 7425 7229 +196
ITV Broadcasting Limited 4208 4245 -37
QVC UK 1820 1847 -27
Viacom International Media Networks UK 1144 897 +247
Perform Investment Limited 988 187 +801
Channel 4 Television Corporation 943 908 +35
Discovery Corporate Services Limited 867 923 -56
Turner Broadcasting System Europe Limited 785 784 +1
STV Group PLC 612 585 +27
PROMOTING CHOICE • SECURING STANDARDS • PREVENTING HARM
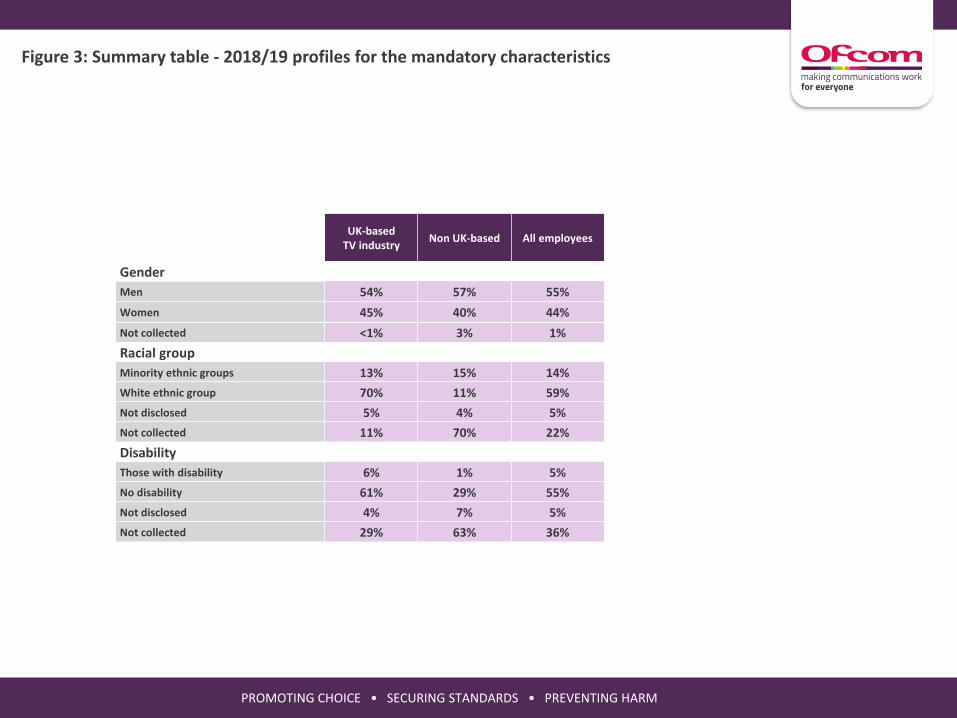
Figure 3: Summary table - 2018/19 profiles for the mandatory characteristics
UK-basedTV industry
Non UK-based All employees
Gender
Men 54% 57% 55%
Women 45% 40% 44%
Not collected <1% 3% 1%
Racial group
Minority ethnic groups 13% 15% 14%
White ethnic group 70% 11% 59%
Not disclosed 5% 4% 5%
Not collected 11% 70% 22%
Disability
Those with disability 6% 1% 5%
No disability 61% 29% 55%
Not disclosed 4% 7% 5%
Not collected 29% 63% 36%
PROMOTING CHOICE • SECURING STANDARDS • PREVENTING HARM
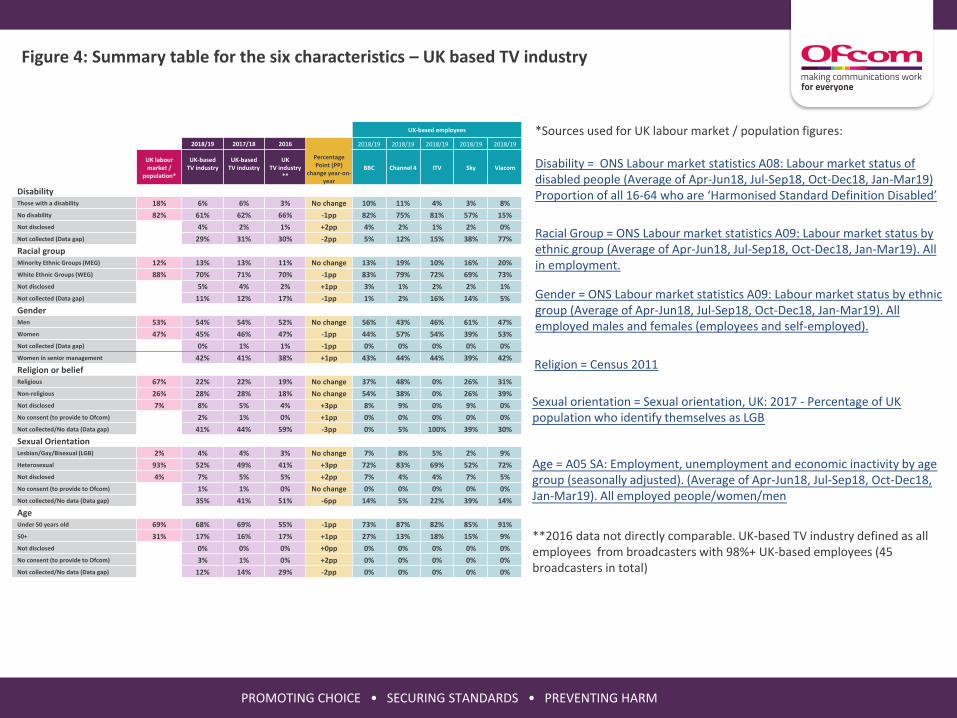
Figure 4: Summary table for the six characteristics – UK based TV industry
UK-based employees
2018/19 2017/18 2016
Percentage Point (PP)
change year-on-year
2018/19 2018/19 2018/19 2018/19 2018/19
UK labour market /
population*
UK-basedTV industry
UK-basedTV industry
UKTV industry
**BBC Channel 4 ITV Sky Viacom
DisabilityThose with a disability 18% 6% 6% 3% No change 10% 11% 4% 3% 8%
No disability 82% 61% 62% 66% -1pp 82% 75% 81% 57% 15%
Not disclosed 4% 2% 1% +2pp 4% 2% 1% 2% 0%
Not collected (Data gap) 29% 31% 30% -2pp 5% 12% 15% 38% 77%
Racial groupMinority Ethnic Groups (MEG) 12% 13% 13% 11% No change 13% 19% 10% 16% 20%
White Ethnic Groups (WEG) 88% 70% 71% 70% -1pp 83% 79% 72% 69% 73%
Not disclosed 5% 4% 2% +1pp 3% 1% 2% 2% 1%
Not collected (Data gap) 11% 12% 17% -1pp 1% 2% 16% 14% 5%
GenderMen 53% 54% 54% 52% No change 56% 43% 46% 61% 47%
Women 47% 45% 46% 47% -1pp 44% 57% 54% 39% 53%
Not collected (Data gap) 0% 1% 1% -1pp 0% 0% 0% 0% 0%
Women in senior management 42% 41% 38% +1pp 43% 44% 44% 39% 42%
Religion or beliefReligious 67% 22% 22% 19% No change 37% 48% 0% 26% 31%
Non-religious 26% 28% 28% 18% No change 54% 38% 0% 26% 39%
Not disclosed 7% 8% 5% 4% +3pp 8% 9% 0% 9% 0%
No consent (to provide to Ofcom) 2% 1% 0% +1pp 0% 0% 0% 0% 0%
Not collected/No data (Data gap) 41% 44% 59% -3pp 0% 5% 100% 39% 30%
Sexual OrientationLesbian/Gay/Bisexual (LGB) 2% 4% 4% 3% No change 7% 8% 5% 2% 9%
Heterosexual 93% 52% 49% 41% +3pp 72% 83% 69% 52% 72%
Not disclosed 4% 7% 5% 5% +2pp 7% 4% 4% 7% 5%
No consent (to provide to Ofcom) 1% 1% 0% No change 0% 0% 0% 0% 0%
Not collected/No data (Data gap) 35% 41% 51% -6pp 14% 5% 22% 39% 14%
AgeUnder 50 years old 69% 68% 69% 55% -1pp 73% 87% 82% 85% 91%
50+ 31% 17% 16% 17% +1pp 27% 13% 18% 15% 9%
Not disclosed 0% 0% 0% +0pp 0% 0% 0% 0% 0%
No consent (to provide to Ofcom) 3% 1% 0% +2pp 0% 0% 0% 0% 0%
Not collected/No data (Data gap) 12% 14% 29% -2pp 0% 0% 0% 0% 0%
*Sources used for UK labour market / population figures:
Disability = ONS Labour market statistics A08: Labour market status of disabled people (Average of Apr-Jun18, Jul-Sep18, Oct-Dec18, Jan-Mar19)Proportion of all 16-64 who are ‘Harmonised Standard Definition Disabled’
Racial Group = ONS Labour market statistics A09: Labour market status by ethnic group (Average of Apr-Jun18, Jul-Sep18, Oct-Dec18, Jan-Mar19). All in employment.
Gender = ONS Labour market statistics A09: Labour market status by ethnic group (Average of Apr-Jun18, Jul-Sep18, Oct-Dec18, Jan-Mar19). All employed males and females (employees and self-employed).
Religion = Census 2011
Sexual orientation = Sexual orientation, UK: 2017 - Percentage of UK population who identify themselves as LGB
Age = A05 SA: Employment, unemployment and economic inactivity by age group (seasonally adjusted). (Average of Apr-Jun18, Jul-Sep18, Oct-Dec18, Jan-Mar19). All employed people/women/men
**2016 data not directly comparable. UK-based TV industry defined as all employees from broadcasters with 98%+ UK-based employees (45 broadcasters in total)
PROMOTING CHOICE • SECURING STANDARDS • PREVENTING HARM
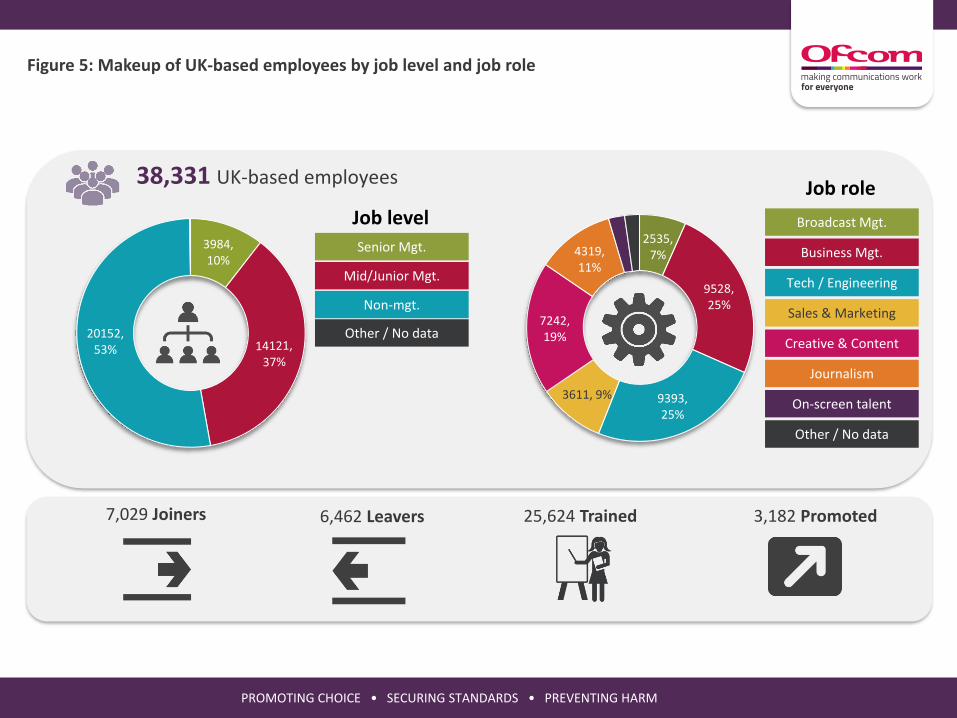
Figure 5: Makeup of UK-based employees by job level and job role
2535, 7%
9393, 25%
3611, 9%
7242, 19%
4319, 11%
3984, 10%
20152, 53%
38,331 UK-based employeesJob role
Creative & Content
Tech / Engineering
Business Mgt.
Broadcast Mgt.
Sales & Marketing
Journalism
On-screen talent
Other / No data
7,029 Joiners 6,462 Leavers 25,624 Trained 3,182 Promoted
Job level
Non-mgt.
Mid/Junior Mgt.
Senior Mgt.
Other / No data
PROMOTING CHOICE • SECURING STANDARDS • PREVENTING HARM
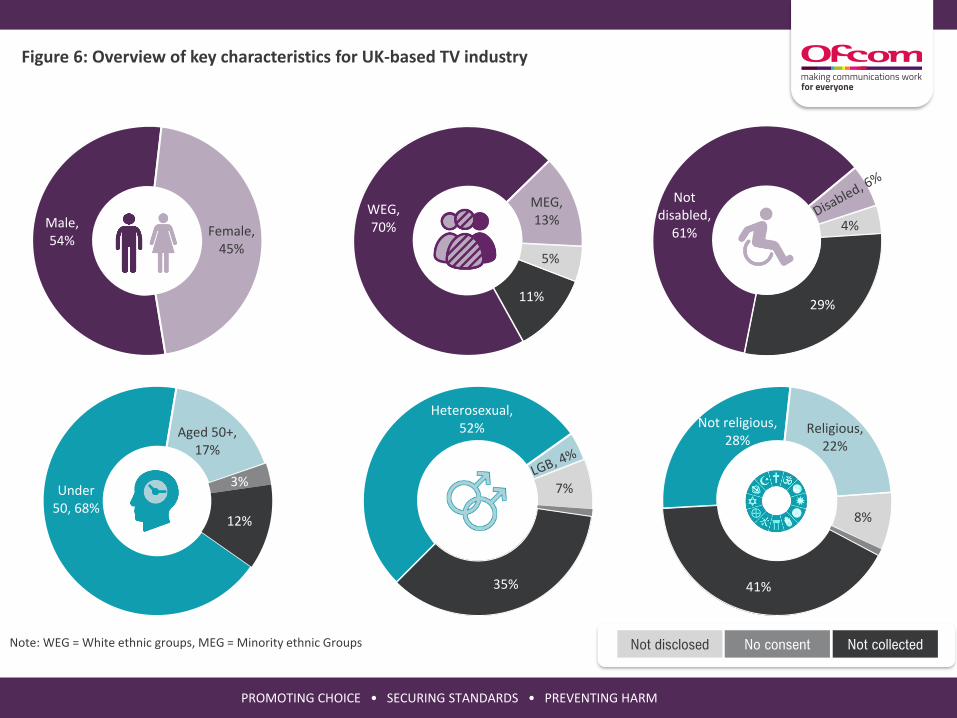
WEG, 70%
MEG, 13%
5%
11%
Male, 54%
Female, 45%
Not collectedNot disclosed
Not disabled,
61%4%
29%
Heterosexual, 52%
7%
35%
Under 50, 68%
Aged 50+, 17%
3%
12%
Not religious, 28%
Religious, 22%
8%
41%
No consentNote: WEG = White ethnic groups, MEG = Minority ethnic Groups
Figure 6: Overview of key characteristics for UK-based TV industry
PROMOTING CHOICE • SECURING STANDARDS • PREVENTING HARM
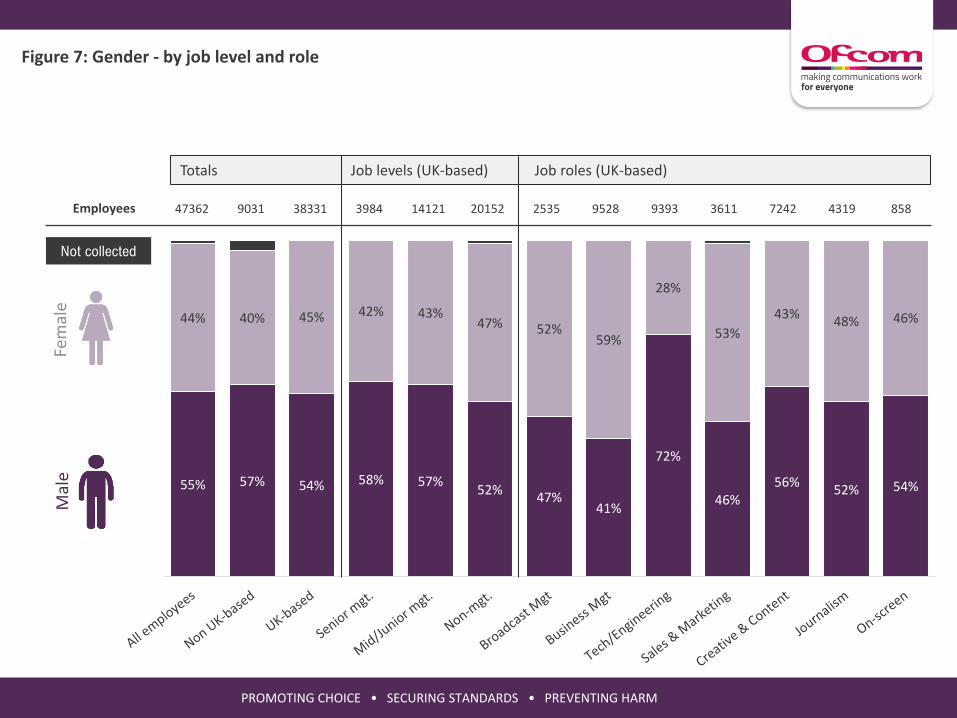
Figure 7: Gender - by job level and role
55% 57% 54% 58% 57%52%
47%41%
72%
46%56%
52% 54%
44% 40% 45% 42% 43%47% 52%
59%
28%
53%
43%48% 46%
Mal
eFe
mal
e
Employees 47362 9031 38331 3984 14121 20152 2535 9528 9393 3611 7242 4319 858
Job levels (UK-based) Job roles (UK-based)Totals
Not collected
PROMOTING CHOICE • SECURING STANDARDS • PREVENTING HARM
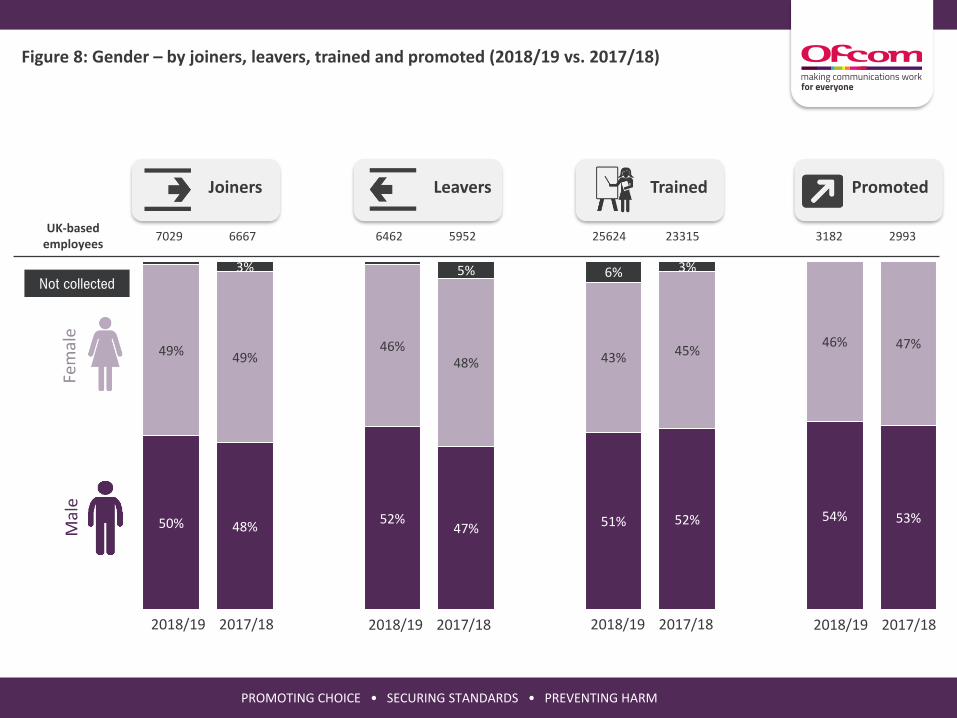
Figure 8: Gender – by joiners, leavers, trained and promoted (2018/19 vs. 2017/18)
50% 48%52%
47% 51% 52% 54% 53%
49% 49%46%
48% 43% 45%46% 47%
3% 5% 6% 3%
Mal
eFe
mal
e
UK-based employees
7029 6667 6462 5952 25624 23315 3182 2993
Not collected
2018/19 2017/18 2018/19 2017/18 2018/19 2017/18 2018/19 2017/18
Joiners Leavers Trained Promoted
PROMOTING CHOICE • SECURING STANDARDS • PREVENTING HARM
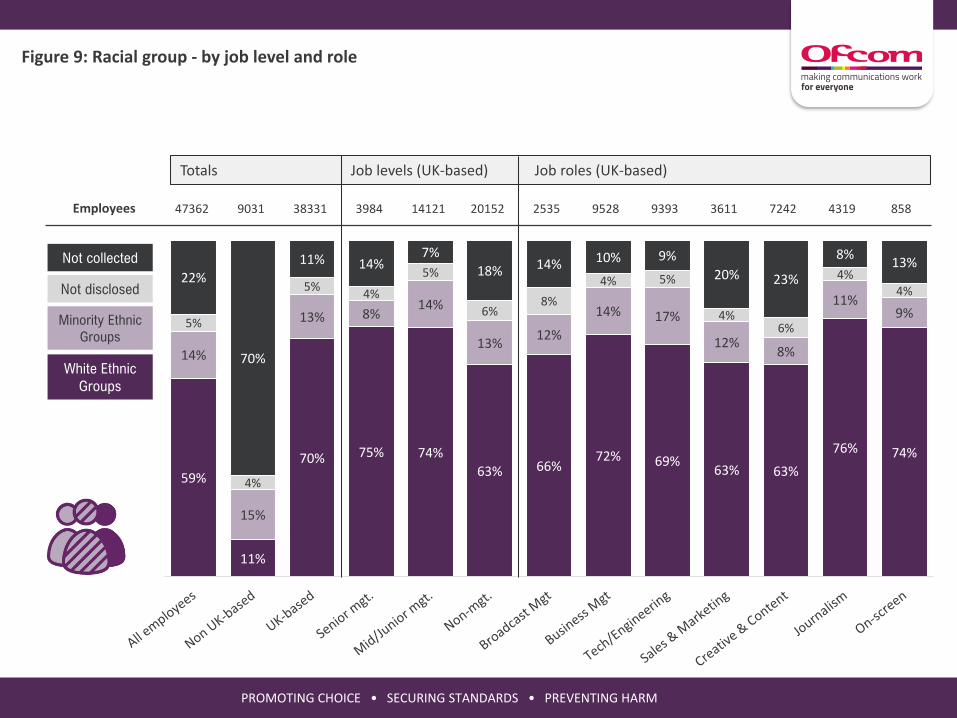
Figure 9: Racial group - by job level and role
59%
11%
70% 75% 74%
63% 66%72% 69%
63% 63%
76% 74%
14%
15%
13% 8%14%
13%12%
14% 17%
12%8%
11%9%
5%
4%
5%4%
5%
6%8%
4% 5%
4%6%
4%4%
22%
70%
11% 14%7%
18% 14% 10% 9%
20% 23%
8%13%
Employees 47362 9031 38331 3984 14121 20152 2535 9528 9393 3611 7242 4319 858
Job levels (UK-based) Job roles (UK-based)Totals
Not collected
Not disclosed
Minority Ethnic
Groups
White Ethnic
Groups
PROMOTING CHOICE • SECURING STANDARDS • PREVENTING HARM
Figure 10: Racial group – by joiners, leavers, trained and promoted (2018/19 vs. 2017/18)
53%63%
55%61%
69%75%
61%
74%
16%
16%
14%
16%
13%13%
13%
14%
5% 6%3%
27%19%
25%20%
15% 11%
23%
11%Not collected
Not disclosed
Minority Ethnic
Groups
White Ethnic
Groups
2018/19 2017/18 2018/19 2017/18 2018/19 2017/18 2018/19 2017/18
Joiners Leavers Trained Promoted
UK-based employees
7029 6667 6462 5952 25624 23315 3182 2993
PROMOTING CHOICE • SECURING STANDARDS • PREVENTING HARM
Figure 11: Racial group breakdown of UK-based employees (2018/19 vs. 2017/18)
Racial Group 2018/19 2017/18
White Ethnic Groups 70% 71%
East Asian / East Asian British 1% 1%
South Asian / South Asian British 5% 5%
Black / African / Caribbean / Black British 3% 3%
Mixed 3% 2%
Other 2% 1%
Minority Ethnic Groups (Not specified) <1% <1%
Employee preferred not to disclose 5% 4%
Data not collected 11% 12%
PROMOTING CHOICE • SECURING STANDARDS • PREVENTING HARM
Figure 12: Disability - by job level and role
55%
29%
61% 65% 67%
52% 56% 55%65%
51% 52%
77%70%
5%
6%6%
7%
5%7% 5%
7%
5% 4%
7%
5%
5%
7%
4%4%
4%
4%
5%3%
5%
4% 5%
4%
5%
36%
63%
29% 25% 21%
39%32%
37%
23%
41% 39%
12%21%
Not collected
Not disclosed
Disabled
Not disabled
Employees 47362 9031 38331 3984 14121 20152 2535 9528 9393 3611 7242 4319 858
Job levels (UK-based) Job roles (UK-based)Totals
PROMOTING CHOICE • SECURING STANDARDS • PREVENTING HARM
Figure 13: Disability – by joiners, leavers, trained and promoted (2018/19 vs. 2017/18)
49% 53%44% 44%
61% 58%52% 53%
4%4%
4% 5%
6%6%
5% 5%4%6%
3%
3%
42% 40%46% 50%
29%34%
41% 41%
Not collected
Not disclosed
Disabled
Not disabled
2018/19 2017/18 2018/19 2017/18 2018/19 2017/18 2018/19 2017/18
UK-based employees
7029 6667 6462 5952 25624 23315 3182 2993
Joiners Leavers Trained Promoted
PROMOTING CHOICE • SECURING STANDARDS • PREVENTING HARM
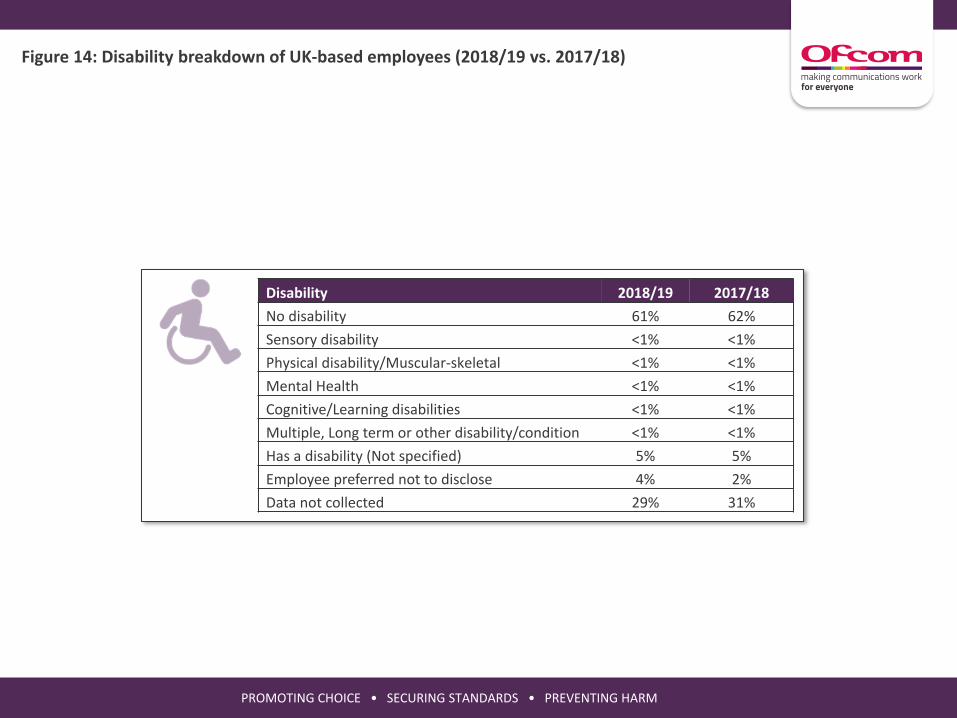
Figure 14: Disability breakdown of UK-based employees (2018/19 vs. 2017/18)
Disability 2018/19 2017/18
No disability 61% 62%
Sensory disability <1% <1%
Physical disability/Muscular-skeletal <1% <1%
Mental Health <1% <1%
Cognitive/Learning disabilities <1% <1%
Multiple, Long term or other disability/condition <1% <1%
Has a disability (Not specified) 5% 5%
Employee preferred not to disclose 4% 2%
Data not collected 29% 31%
PROMOTING CHOICE • SECURING STANDARDS • PREVENTING HARM
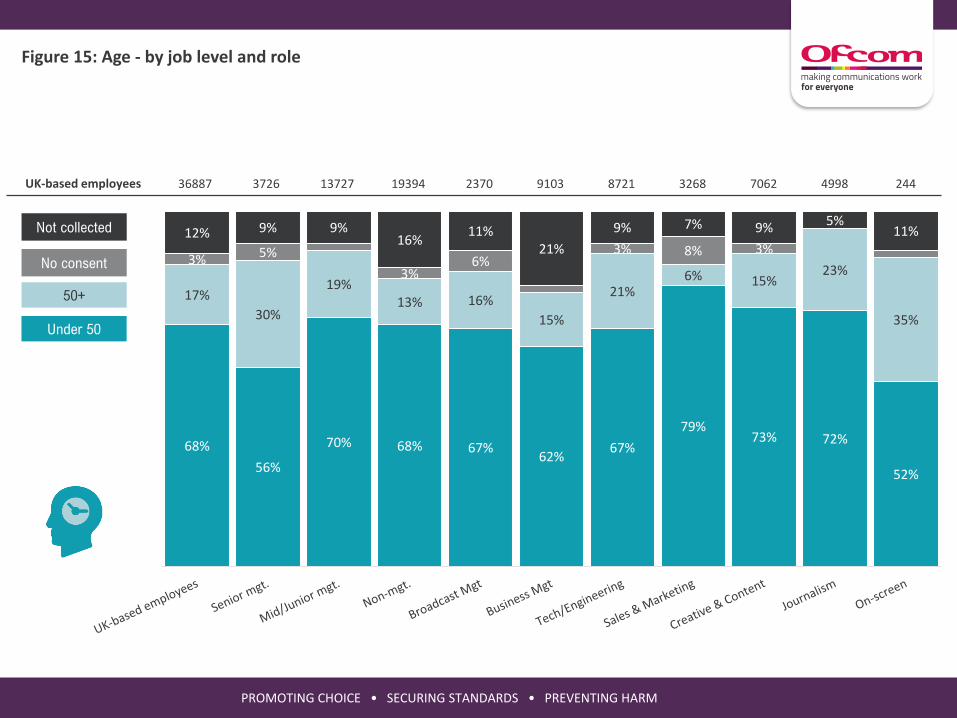
Figure 15: Age - by job level and role
68%
56%
70% 68% 67%62%
67%
79%73% 72%
52%
17%
30%
19%13% 16%
15%
21%6% 15%
23%
35%
3% 5%
3%6%
3% 8% 3%12% 9% 9%
16%11%
21%
9% 7% 9% 5%11%
UK-based employees 36887 3726 13727 19394 2370 9103 8721 3268 7062 4998 244
Not collected
No consent
50+
Under 50
PROMOTING CHOICE • SECURING STANDARDS • PREVENTING HARM
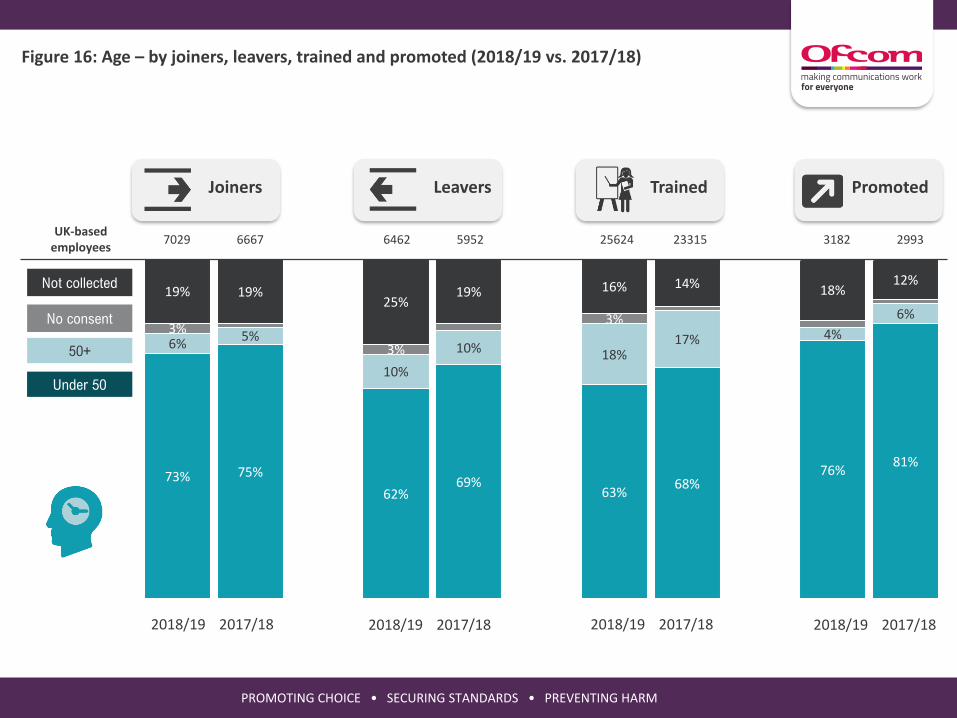
Figure 16: Age – by joiners, leavers, trained and promoted (2018/19 vs. 2017/18)
73% 75%
62%69%
63%68%
76%81%
6%5%
10%
10% 18%17% 4%
6%3%
3%
3%
19% 19%25%
19% 16% 14% 18%12%
UK-based employees
7029 6667 6462 5952 25624 23315 3182 2993
Not collected
No consent
50+
Under 50
2018/19 2017/18 2018/19 2017/18 2018/19 2017/18 2018/19 2017/18
Joiners Leavers Trained Promoted
PROMOTING CHOICE • SECURING STANDARDS • PREVENTING HARM
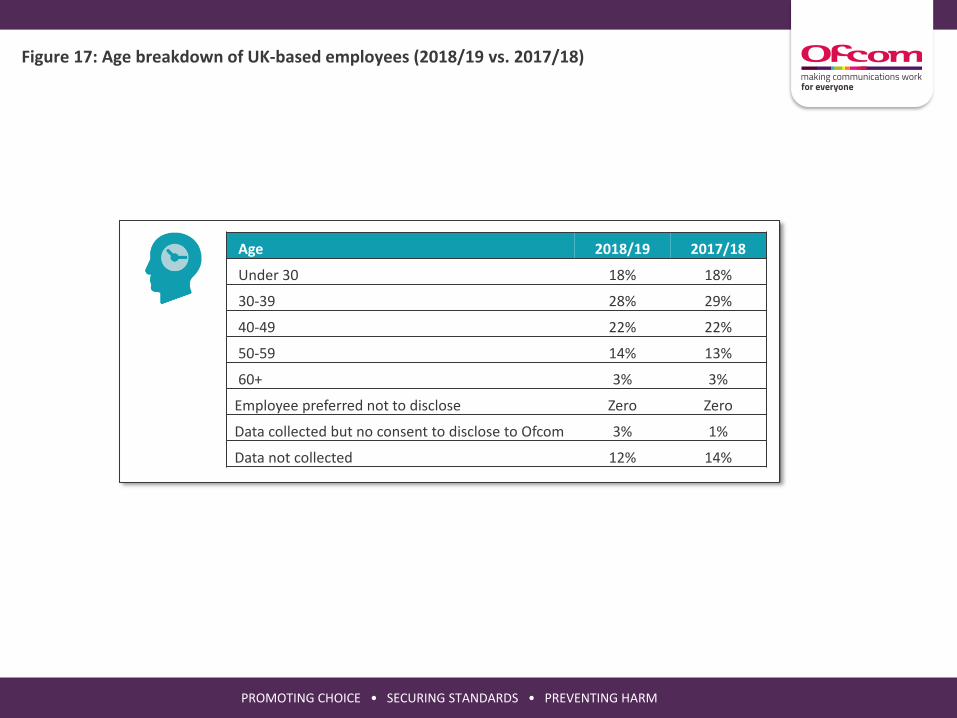
Figure 17: Age breakdown of UK-based employees (2018/19 vs. 2017/18)
Age 2018/19 2017/18
Under 30 18% 18%
30-39 28% 29%
40-49 22% 22%
50-59 14% 13%
60+ 3% 3%
Employee preferred not to disclose Zero Zero
Data collected but no consent to disclose to Ofcom 3% 1%
Data not collected 12% 14%
PROMOTING CHOICE • SECURING STANDARDS • PREVENTING HARM
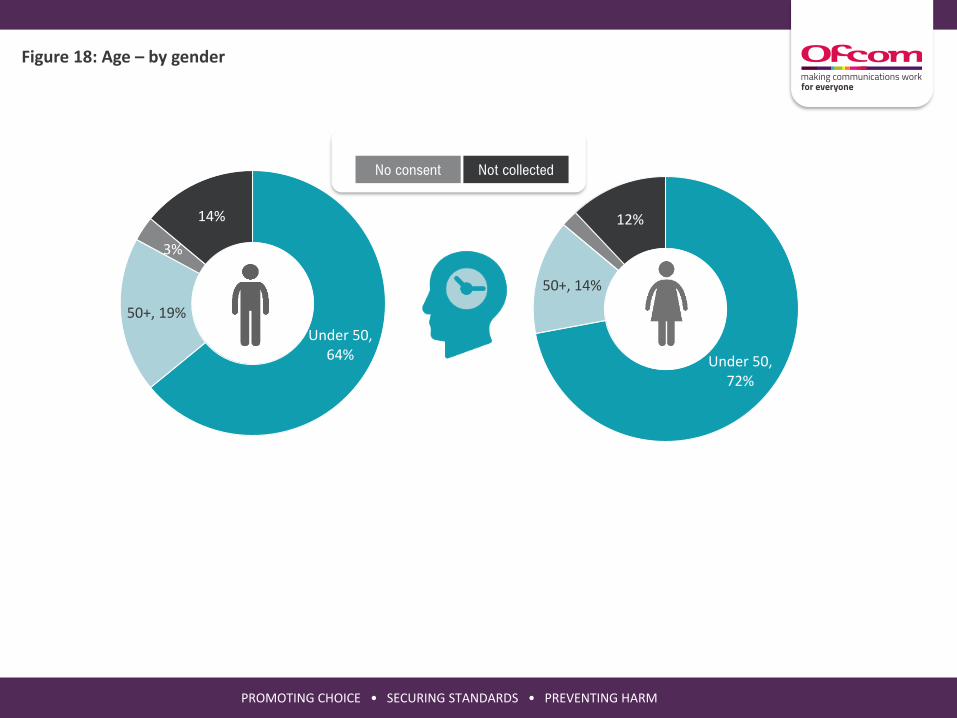
Figure 18: Age – by gender
Under 50, 64%
50+, 19%
3%
14%
Under 50, 72%
50+, 14%
12%
Not collectedNo consent
PROMOTING CHOICE • SECURING STANDARDS • PREVENTING HARM
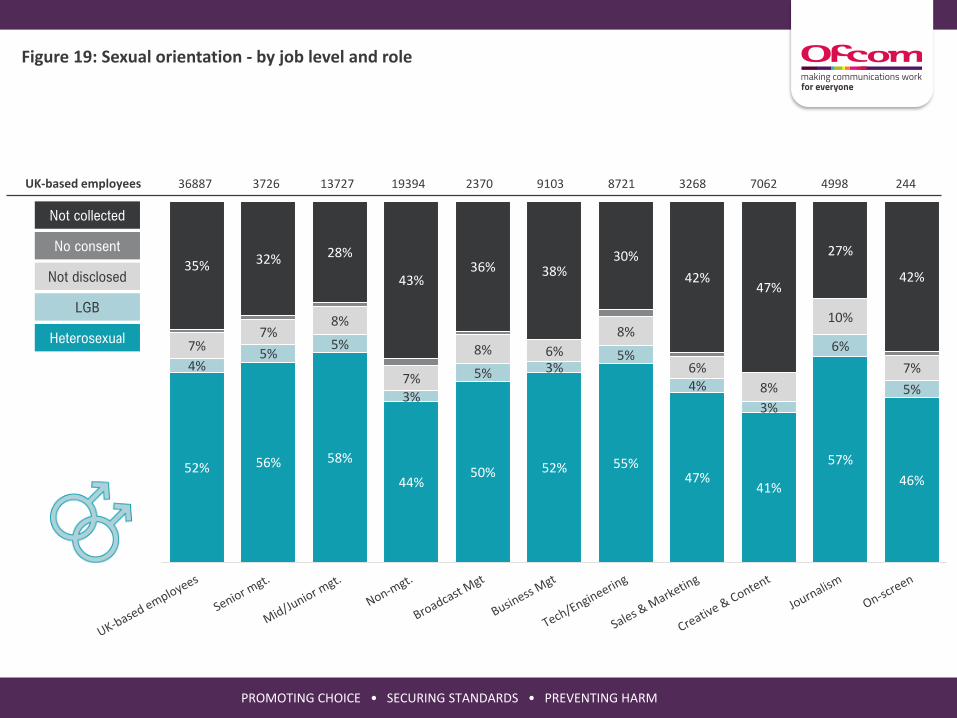
Figure 19: Sexual orientation - by job level and role
52% 56% 58%
44%50% 52% 55%
47%41%
57%
46%
4%5%
5%
3%
5% 3%5%
4%
3%
6%
5%
7%7%
8%
7%
8% 6%
8%
6%
8%
10%
7%
35% 32% 28%
43%36% 38%
30%
42%47%
27%
42%Not disclosed
LGB
Heterosexual
No consent
Not collected
UK-based employees 36887 3726 13727 19394 2370 9103 8721 3268 7062 4998 244
PROMOTING CHOICE • SECURING STANDARDS • PREVENTING HARM
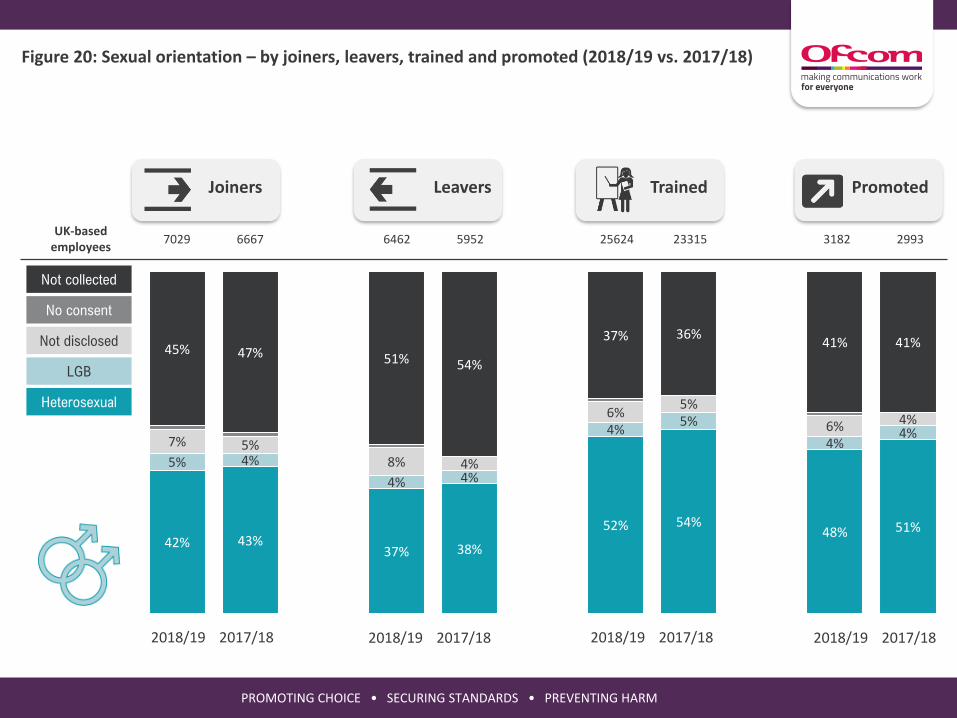
Figure 20: Sexual orientation – by joiners, leavers, trained and promoted (2018/19 vs. 2017/18)
42% 43%37% 38%
52% 54%48% 51%
5% 4%
4% 4%
4%5%
4%4%
7% 5%8% 4%
6%5%
6% 4%
45% 47% 51% 54%
37% 36%41% 41%Not disclosed
LGB
Heterosexual
No consent
Not collected
UK-based employees
7029 6667 6462 5952 25624 23315 3182 2993
2018/19 2017/18 2018/19 2017/18 2018/19 2017/18 2018/19 2017/18
Joiners Leavers Trained Promoted
PROMOTING CHOICE • SECURING STANDARDS • PREVENTING HARM
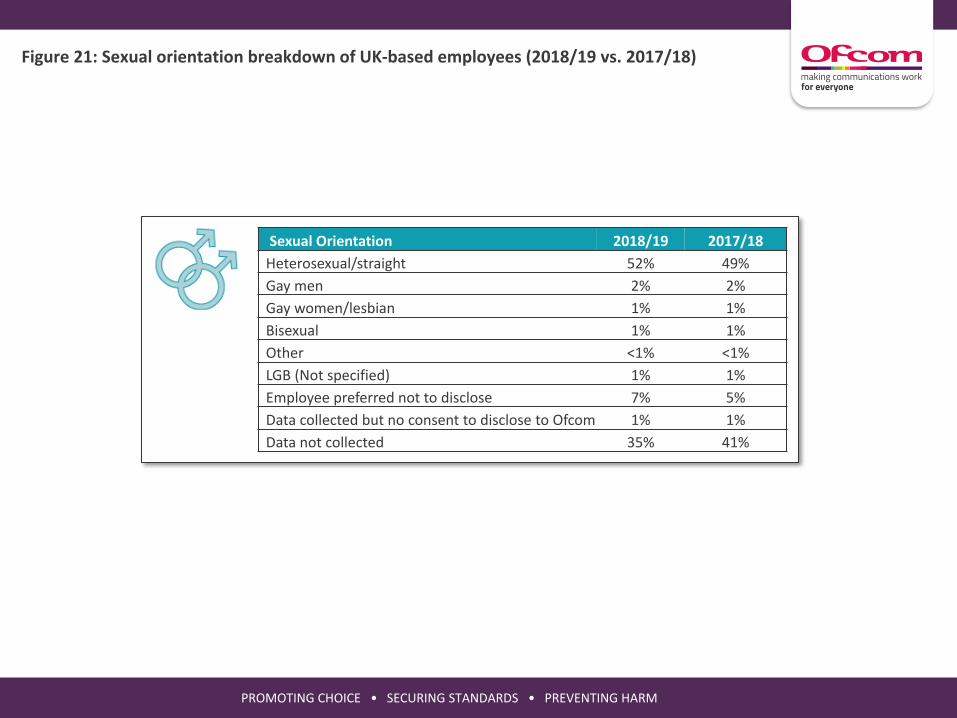
Figure 21: Sexual orientation breakdown of UK-based employees (2018/19 vs. 2017/18)
Sexual Orientation 2018/19 2017/18
Heterosexual/straight 52% 49%
Gay men 2% 2%
Gay women/lesbian 1% 1%
Bisexual 1% 1%
Other <1% <1%
LGB (Not specified) 1% 1%
Employee preferred not to disclose 7% 5%
Data collected but no consent to disclose to Ofcom 1% 1%
Data not collected 35% 41%
PROMOTING CHOICE • SECURING STANDARDS • PREVENTING HARM
Figure 22: Religion - by job level and role
28%34%
40%
19% 22% 23%
38%
22%16%
45%39%
22%
28%
27%
17%19%
25%
25%
18%
11%
29%
25%8%
8%
8%
8%
8%
7%
9%
7%
7%
10%
10%3%
41%
29%24%
56%49% 45%
26%
52%
65%
15%25%
Not collected
Not disclosed
Religious
Not religious
No consent
UK-based employees 36887 3726 13727 19394 2370 9103 8721 3268 7062 4998 244
PROMOTING CHOICE • SECURING STANDARDS • PREVENTING HARM
Figure 23: Religion – by joiners, leavers, trained and promoted (2018/19 vs. 2017/18)
21% 22% 18% 20%
34% 33%23% 25%
17% 17%16%
18%
25% 25%
18%19%
7% 5%8% 5%
7% 6%
7%4%
55% 55% 56% 57%
32% 36%
52% 51%
Not collected
Not disclosed
Religious
Not religious
No consent
UK-based employees
7029 6667 6462 5952 25624 23315 3182 2993
2018/19 2017/18 2018/19 2017/18 2018/19 2017/18 2018/19 2017/18
Joiners Leavers Trained Promoted
PROMOTING CHOICE • SECURING STANDARDS • PREVENTING HARM
Figure 24: Religion breakdown of UK-based employees 2018/19 vs. 2017/18
Religion or faith 2018/19 2017/18
Not religious 28% 28%
Christian 16% 16%
Hindu 1% 1%
Sikh 1% 1%
Muslim 1% 1%
Buddhist <1% <1%
Jewish 1% 1%
Other religion or belief 2% 2%
Religious (Not specified) Zero <1%
Employee preferred not to disclose 8% 5%
Data collected but no consent to disclose to Ofcom 1% <1%
Data not collected 41% 44%
PROMOTING CHOICE • SECURING STANDARDS • PREVENTING HARM
Figure 25: Freelancers across the industry
Male, 21%
Female, 16%
61%
Gender
WEG, 18%
77%
Racial Group
Disability
Not disabled, 15%
Disabled, 1%
82%
Freelancers
20,338
Not collectedNot disclosed No consent
Invisible data:
Note: WEG = White ethnic groups, MEG = Minority ethnic Groups
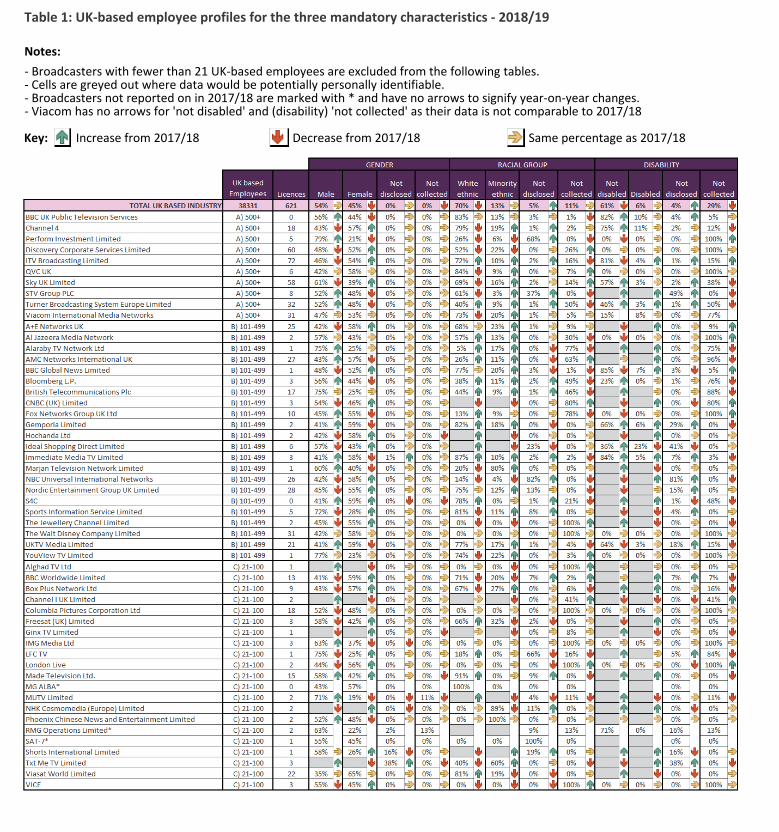
Table 1: UK-based employee profiles for the three mandatory characteristics - 2018/19
Notes: - Broadcasters with fewer than 21 UK-based employees are excluded from the following tables.- Cells are greyed out where data would be potentially personally identifiable.- Broadcasters not reported on in 2017/18 are marked with * and have no arrows to signify year-on-year changes.- Viacom has no arrows for 'not disabled' and (disability) 'not collected' as their data is not comparable to 2017/18
Key: Increase from 2017/18 Decrease from 2017/18 Same percentage as 2017/18
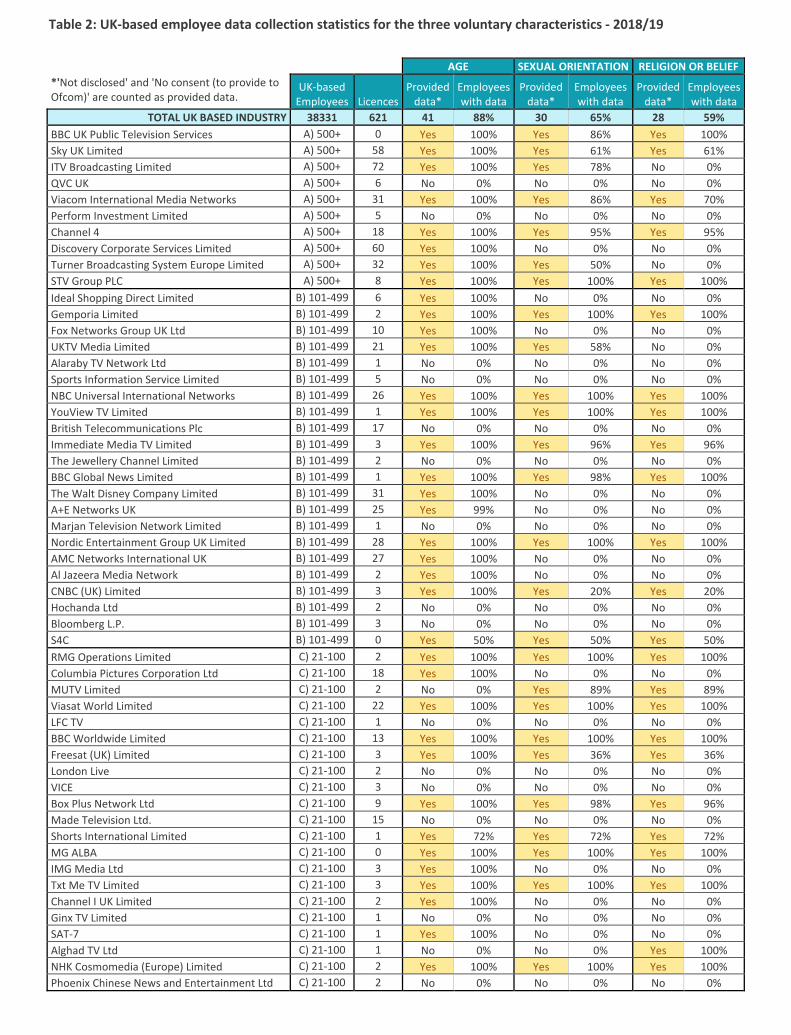
Table 2: UK-based employee data collection statistics for the three voluntary characteristics - 2018/19
AGE SEXUAL ORIENTATION RELIGION OR BELIEF *'Not disclosed' and 'No consent (to provide to Ofcom)' are counted as provided data.
UK-based Employees Licences
Provided data*
Employees with data
Provided data*
Employees with data
Provided data*
Employees with data
TOTAL UK BASED INDUSTRY 38331 621 41 88% 30 65% 28 59% BBC UK Public Television Services A) 500+ 0 Yes 100% Yes 86% Yes 100% Sky UK Limited A) 500+ 58 Yes 100% Yes 61% Yes 61% ITV Broadcasting Limited A) 500+ 72 Yes 100% Yes 78% No 0% QVC UK A) 500+ 6 No 0% No 0% No 0% Viacom International Media Networks A) 500+ 31 Yes 100% Yes 86% Yes 70% Perform Investment Limited A) 500+ 5 No 0% No 0% No 0% Channel 4 A) 500+ 18 Yes 100% Yes 95% Yes 95% Discovery Corporate Services Limited A) 500+ 60 Yes 100% No 0% No 0% Turner Broadcasting System Europe Limited A) 500+ 32 Yes 100% Yes 50% No 0% STV Group PLC A) 500+ 8 Yes 100% Yes 100% Yes 100% Ideal Shopping Direct Limited B) 101-499 6 Yes 100% No 0% No 0% Gemporia Limited B) 101-499 2 Yes 100% Yes 100% Yes 100% Fox Networks Group UK Ltd B) 101-499 10 Yes 100% No 0% No 0% UKTV Media Limited B) 101-499 21 Yes 100% Yes 58% No 0% Alaraby TV Network Ltd B) 101-499 1 No 0% No 0% No 0% Sports Information Service Limited B) 101-499 5 No 0% No 0% No 0% NBC Universal International Networks B) 101-499 26 Yes 100% Yes 100% Yes 100% YouView TV Limited B) 101-499 1 Yes 100% Yes 100% Yes 100% British Telecommunications Plc B) 101-499 17 No 0% No 0% No 0% Immediate Media TV Limited B) 101-499 3 Yes 100% Yes 96% Yes 96% The Jewellery Channel Limited B) 101-499 2 No 0% No 0% No 0% BBC Global News Limited B) 101-499 1 Yes 100% Yes 98% Yes 100% The Walt Disney Company Limited B) 101-499 31 Yes 100% No 0% No 0% A+E Networks UK B) 101-499 25 Yes 99% No 0% No 0% Marjan Television Network Limited B) 101-499 1 No 0% No 0% No 0% Nordic Entertainment Group UK Limited B) 101-499 28 Yes 100% Yes 100% Yes 100% AMC Networks International UK B) 101-499 27 Yes 100% No 0% No 0% Al Jazeera Media Network B) 101-499 2 Yes 100% No 0% No 0% CNBC (UK) Limited B) 101-499 3 Yes 100% Yes 20% Yes 20% Hochanda Ltd B) 101-499 2 No 0% No 0% No 0% Bloomberg L.P. B) 101-499 3 No 0% No 0% No 0% S4C B) 101-499 0 Yes 50% Yes 50% Yes 50% RMG Operations Limited C) 21-100 2 Yes 100% Yes 100% Yes 100% Columbia Pictures Corporation Ltd C) 21-100 18 Yes 100% No 0% No 0% MUTV Limited C) 21-100 2 No 0% Yes 89% Yes 89% Viasat World Limited C) 21-100 22 Yes 100% Yes 100% Yes 100% LFC TV C) 21-100 1 No 0% No 0% No 0% BBC Worldwide Limited C) 21-100 13 Yes 100% Yes 100% Yes 100% Freesat (UK) Limited C) 21-100 3 Yes 100% Yes 36% Yes 36% London Live C) 21-100 2 No 0% No 0% No 0% VICE C) 21-100 3 No 0% No 0% No 0% Box Plus Network Ltd C) 21-100 9 Yes 100% Yes 98% Yes 96% Made Television Ltd. C) 21-100 15 No 0% No 0% No 0% Shorts International Limited C) 21-100 1 Yes 72% Yes 72% Yes 72% MG ALBA C) 21-100 0 Yes 100% Yes 100% Yes 100% IMG Media Ltd C) 21-100 3 Yes 100% No 0% No 0% Txt Me TV Limited C) 21-100 3 Yes 100% Yes 100% Yes 100% Channel I UK Limited C) 21-100 2 Yes 100% No 0% No 0% Ginx TV Limited C) 21-100 1 No 0% No 0% No 0% SAT-7 C) 21-100 1 Yes 100% No 0% No 0% Alghad TV Ltd C) 21-100 1 No 0% No 0% Yes 100% NHK Cosmomedia (Europe) Limited C) 21-100 2 Yes 100% Yes 100% Yes 100% Phoenix Chinese News and Entertainment Ltd C) 21-100 2 No 0% No 0% No 0%