distribution and evaluation of soil fertility based on
TRANSCRIPT

Distribution and Evaluation of Soil Fertility Based on Geostatistical Approach in Bafra Deltaic Plain
Mustafa SAĞLAM*, Orhan DENGİZ Ondokuz Mayıs University, Faculty of Agriculture, Department of Soil Science and Plant Nutrition, 55139, Samsun, TURKEY
Received: 04.09.2014 Accepted: 24.09.2014
*Correspondence: [email protected] Abstract: This study was conducted to examine spatial variability of soil fertility depending on the level of selected soil fertility parameters in Fener Village located on Bafra Alluvial Deltaic Plain by means of Soil Fertility Index (SFI) model using geostatistics and Geographic Information System (GIS) technique. Fifteen soil properties [available macronutrient elements (nitrogen, phosphorous, potassium, calcium, magnesium, sodium), available micronutrient elements (iron, copper, zinc, manganese), and other soil properties (texture class, organic matter, pH, electrical conductivity, CaCO3)] at the depths of 0-30 cm and 30-60 cm were evaluated using SFI model for each georeferenced point. A total of 140 grid points were obtained and soil samples collected from surface (0-30 cm) and subsurface (30-60 cm) depths of each grid centre are 131 and 124, respectively. Geostatistical method was used to generate SFI distribution maps for surface and subsurface soils of the study area. According to the results of SFI distributions for both depths, 80.18% of the study area has good (S1) and moderate fertility (S2), 19.06% has marginal fertility (S3), 0.75% has poor fertility in surface depth, while 38.83% of the study area has good (S1) and moderate fertility (S2), 41.30% marginal fertility (S3) and 19.87% has poor fertility in subsurface depth. Consequently, findings of this study showed that geostatistical modelling was useful in the determination of the spatial variability structure and spatial dependency of investigated soil properties and nutrients. Keywords: Soil fertility index, physical and chemical properties, nutrients, spatial variability, geographic information system 1. Introduction Soils are essential natural resources with a wide range of environmental functions, and their properties are greatly investigated by soil sampling in different depths. The spatial dependence structure of soil properties can be similar or largely differing, since they are affected by interactions of different processes at various scales. As a consequence, the spatial variability of soil properties may vary along with different scales and resolutions which can be varied from millimetres to kilometres. Generally, detailed soil sampling is neither feasible nor economic in a studied area. It is important, however, in terms of higher and qualified yield and sustainable use of natural resources, to understand spatial and temporal variability of soil fertility parameters in agricultural areas.
Soil quality can be monitored by a set of measurable attributes termed indicators. These indicators can be broadly grouped as physical, chemical, and biological indicators, and one can assess overall soil quality by measuring changes in these indicators (Larson and Pierce, 1991; Doran and Parkin, 1994; Dalal and Moloney, 2000; Ditzler and Tugel, 2002) and transform them into a single value known as the soil quality/fertility index (SQI/SFI). It is essential to compare the changes in soil properties due to changes in land cover -or land use to understand the influence of changes in soil and water quality, biodiversity, and global climatic systems on natural resources and ecological processes (Chen et al., 2001; Chaudhury et al., 2005; Abbasi et al., 2010).
Alluvial soils which have a high productivity capacity and show big variety in their properties at short distances are characterized by sediment transport and deposition during different periods,
Türkiye Tarımsal Araştırmalar Dergisihttp://dergi.siirt.edu.tr/index.php/ziraat
Research Article
Turk J Agric Res(2014) 1: 186-195TÜTADISSN: 2148-2306
187Türkiye Tarımsal Araştırmalar Dergisi - Turkish Journal of Agricultural Research 1(2): 186-195
SAĞLAM and DENGİZ
as well as by soil formation. Moreover, they are characterized by complex ecological systems and dynamic spatial mosaics, more or less connected with the active channel of the river (Weber and Gobat, 2006). Thus, combination of geomorphic and pedologic processes is the main property of alluvial soils providing high variability in terms of soil fertility. Bafra Deltaic Plain has also alluvial soils located on alluvial deposit completely formed by Kızılırmak River. Therefore, study of the variations in soil properties is not only important for soil mapping but also for soil managements (irrigation, fertilization, etc.) that require detailed information on spatial distribution of soil properties.
In order to use land resources sustainably and improve their productivity, it is necessary to determine the current status and monitor whether degradation can be explained by use of land in local conditions. For this reasons, in the last few decades advanced computer programs such as geographic information systems, geostatistical programs and simulation models contribute to the speed and efficiency of the overall planning process and allow access to large amounts of information quickly. The purpose of this study is to investigate and map the evaluation of soil fertility change on Bafra Deltaic Plain by means of
SFI model using geostatistic program and geographic information system techniques. 2. Materials and Methods 2.1. Field description of the study area
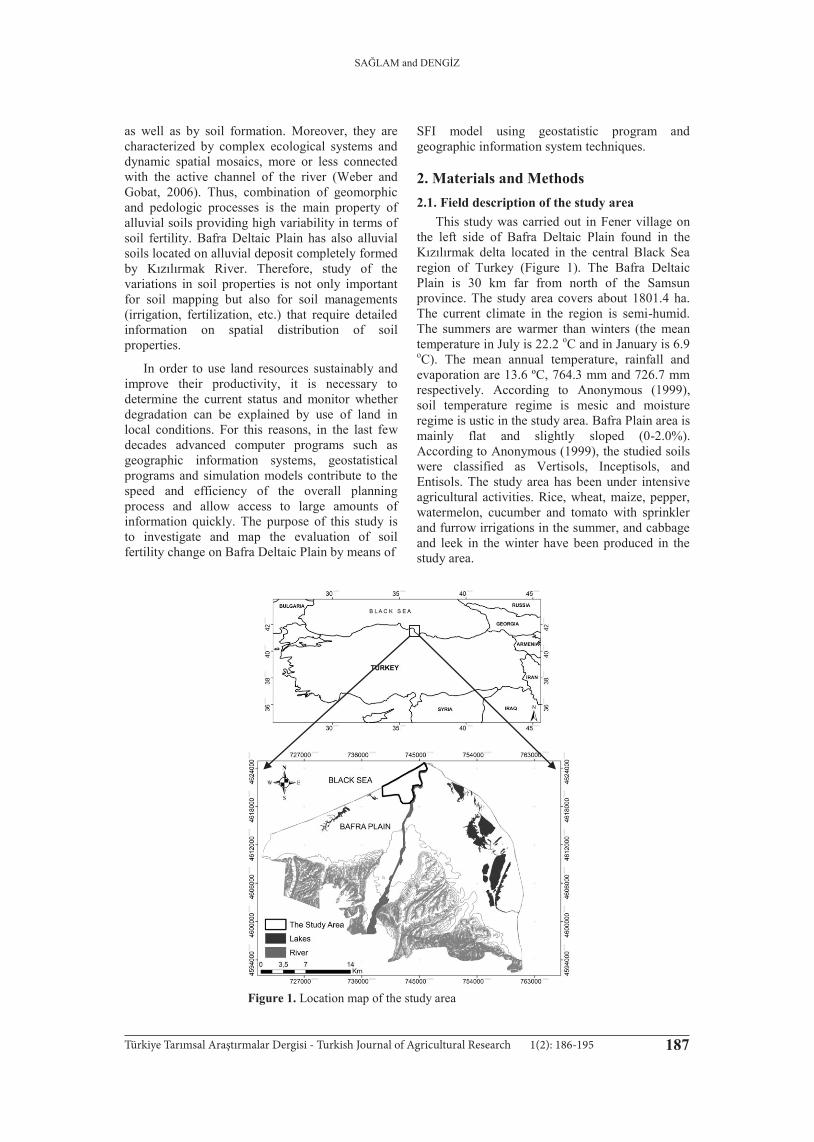
This study was carried out in Fener village on the left side of Bafra Deltaic Plain found in the Kızılırmak delta located in the central Black Sea region of Turkey (Figure 1). The Bafra Deltaic Plain is 30 km far from north of the Samsun province. The study area covers about 1801.4 ha. The current climate in the region is semi-humid. The summers are warmer than winters (the mean temperature in July is 22.2 oC and in January is 6.9 oC). The mean annual temperature, rainfall and evaporation are 13.6 ºC, 764.3 mm and 726.7 mm respectively. According to Anonymous (1999), soil temperature regime is mesic and moisture regime is ustic in the study area. Bafra Plain area is mainly flat and slightly sloped (0-2.0%). According to Anonymous (1999), the studied soils were classified as Vertisols, Inceptisols, and Entisols. The study area has been under intensive agricultural activities. Rice, wheat, maize, pepper, watermelon, cucumber and tomato with sprinkler and furrow irrigations in the summer, and cabbage and leek in the winter have been produced in the study area.
Figure 1. Location map of the study area
188 Türkiye Tarımsal Araştırmalar Dergisi - Turkish Journal of Agricultural Research 1(2): 186-195
SAĞLAM and DENGİZ
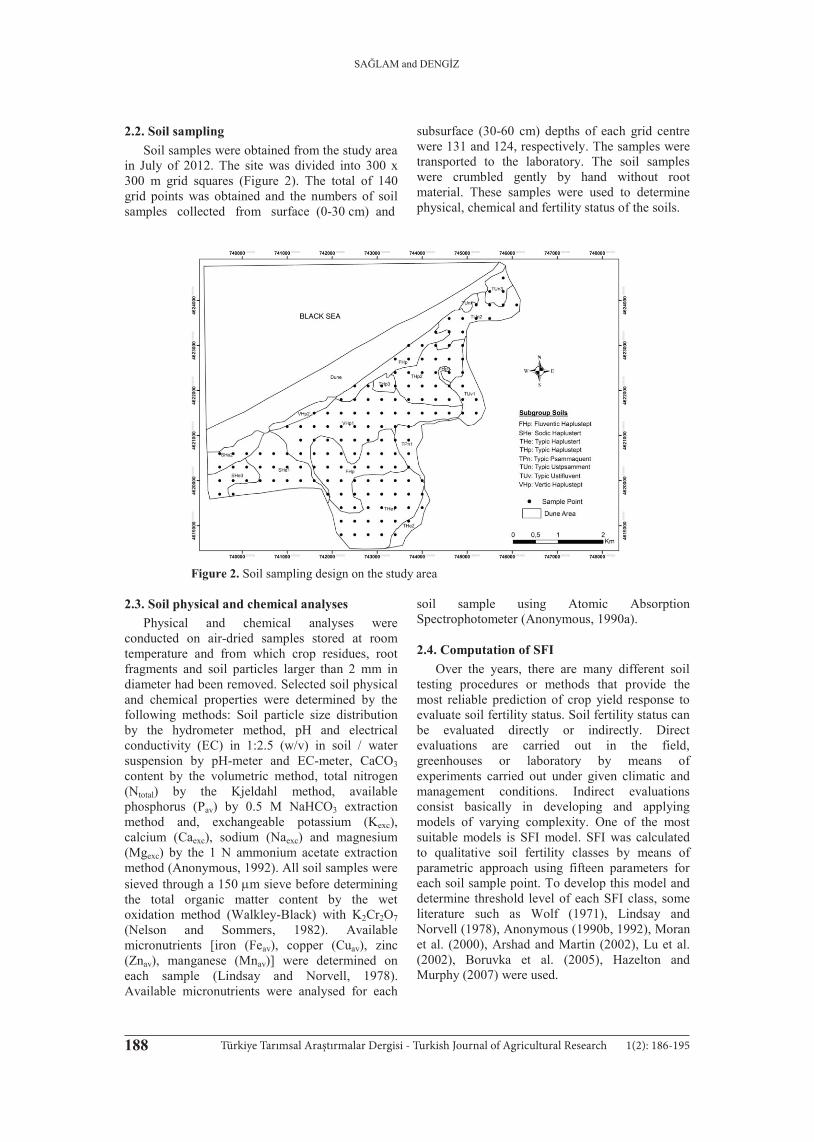
2.2. Soil sampling Soil samples were obtained from the study area
in July of 2012. The site was divided into 300 x 300 m grid squares (Figure 2). The total of 140 grid points was obtained and the numbers of soil samples collected from surface (0-30 cm) and
subsurface (30-60 cm) depths of each grid centre were 131 and 124, respectively. The samples were transported to the laboratory. The soil samples were crumbled gently by hand without root material. These samples were used to determine physical, chemical and fertility status of the soils.
Figure 2. Soil sampling design on the study area 2.3. Soil physical and chemical analyses
Physical and chemical analyses were conducted on air-dried samples stored at room temperature and from which crop residues, root fragments and soil particles larger than 2 mm in diameter had been removed. Selected soil physical and chemical properties were determined by the following methods: Soil particle size distribution by the hydrometer method, pH and electrical conductivity (EC) in 1:2.5 (w/v) in soil / water suspension by pH-meter and EC-meter, CaCO3 content by the volumetric method, total nitrogen (Ntotal) by the Kjeldahl method, available phosphorus (Pav) by 0.5 M NaHCO3 extraction method and, exchangeable potassium (Kexc), calcium (Caexc), sodium (Naexc) and magnesium (Mgexc) by the 1 N ammonium acetate extraction method (Anonymous, 1992). All soil samples were sieved through a 150 m sieve before determining the total organic matter content by the wet oxidation method (Walkley-Black) with K2Cr2O7
(Nelson and Sommers, 1982). Available micronutrients [iron (Feav), copper (Cuav), zinc (Znav), manganese (Mnav)] were determined on each sample (Lindsay and Norvell, 1978). Available micronutrients were analysed for each
soil sample using Atomic Absorption Spectrophotometer (Anonymous, 1990a). 2.4. Computation of SFI
Over the years, there are many different soil testing procedures or methods that provide the most reliable prediction of crop yield response to evaluate soil fertility status. Soil fertility status can be evaluated directly or indirectly. Direct evaluations are carried out in the field, greenhouses or laboratory by means of experiments carried out under given climatic and management conditions. Indirect evaluations consist basically in developing and applying models of varying complexity. One of the most suitable models is SFI model. SFI was calculated to qualitative soil fertility classes by means of parametric approach using fifteen parameters for each soil sample point. To develop this model and determine threshold level of each SFI class, some literature such as Wolf (1971), Lindsay and Norvell (1978), Anonymous (1990b, 1992), Moran et al. (2000), Arshad and Martin (2002), Lu et al. (2002), Boruvka et al. (2005), Hazelton and Murphy (2007) were used.
189Türkiye Tarımsal Araştırmalar Dergisi - Turkish Journal of Agricultural Research 1(2): 186-195
SAĞLAM and DENGİZ
The fifteen parameters (diagnostic factors) are commonly implemented in physical and chemical characteristics of soil and designated with letters from A to P (Table 1). Each parameter or factor is evaluated ranging between 10 and 100. The least
favour value of factor rating is 10 and the most beneficial value of factor rating is 100 for plant growth. In other words, the limiting nature of each SFI classes is taken into account by its effect in reducing productivity.
Table 1. Factor rating of each soil parameters Diagnostic factors Units Factor rating
100 80 50 20 10 Available macronutrient elements
A- Ntotal g kg-1 > 3.2 3.2-1.7 0.9-1.7 0.9-0.45 <0.45 B- Pav mg kg-1 > 80 25-80 8.0-25 2.5-8.0 <2.5 C- Kexc cmol (+) kg-1 0.28-0.74 0.74-2.56 0.13-0.28 >2.56 <0.13 D- Caexc cmol (+) kg-1 17.5-50 5.75-17.5 1.19-5.75 >50 <1.19 E- Naexc cmol (+) kg-1 0.0-0.20 0.21-0.30 0.31-0.70 0.71-2.0 > 2.0 F- Mgexc cmol (+) kg-1 1.33-4.0 4.0-12.5 0.42-1.33 >12.5 <0.42
Available micronutrient elements G- Mnav mg kg-1 14-50 4-14 50-170 >170 <4 H- Znav mg kg-1 0.7-2.4 2.4-8.0 0.2-0.7 >8.0 <0.2 I- Feav mg kg-1 2.0-4.5 1.0-2.0 1.0-0.2 >4.5 <0.2 K- Cuav mg kg-1 > 0.2 - - - <0.2
Some soil physical and chemical characteristics L- CaCO3 g kg-1 50-150 10-50 150-250 >250 0-10 M- Salt or EC
g kg-1 / dS m-1
0-1.5 / 0-2
1.5-3.0 / 2-4
3.0-5.0 / 4-6
5.0-6.5 / 6-8
>6.5 / >8
N- pH 1:2.5 (soil/water-w/v)
6.5-7.5 7.5-8.5 5.5-6.5 4.5-5.5 <4.5->8.5
O- SOM g kg-1 >30 20-30 10-20 5-10 0-5 P- Texture % CL, SCL, SiCL vfSL, L, SiL,
Si, <%50 C > %50 C, SC, SiC
SL, fSL S, LS
Ntotal: Total nitrogen, Pav: Available phosphorus, Kexc: Exchangeable potassium, Caexc: Exchangeable calcium, Naexc: Exchangeable sodium, Mgexc: Exchangeable magnesium, Mnav: Available manganese, Znav: Available zinc, Feav: Available iron, Cuav: Available cupper, EC: Electrical conductivity, SOM: Soil Organic Matter, CL: Clay Loam, SCL: Sandy Clay Loam, vfSL: Very Fine Sandy Loam, L: Loam, C: Clay, SL: Sandy Loam, fSL: Fine Sandy Loam, S: Sand, LS: Loamy Sand, SiCL: Silty Clay Loam, SiL: Silty Loam, Si: Silty, SC: Sandy Clay, SiC: Silty Clay
SFI is calculated and using the value of factor rating for each factor as follows (Equation 1);
max ....... 100
100 100A BSFI R x x x x
(1)
max
SFI= Soil Fertility Index,A B .......... P
R = Maximum ratio,15
A, B... Rating value for each diagnostic factors
SFI of each soil sample point can be classified
according to classes indicated in Table 2.
Table 2. Classes and values of soil fertility index Class Description Soil Fertility Index S1 Good Fertility > 80 S2 Moderate Fertility 80-50 S3 Marginal Fertility 50-20 N Poor Fertility < 20
2.5. Geostatistical and statistical analyses Geostatistical method was used to generate SFI
distribution map of the study area for surface and subsurface soils. Data analyses for each grid coded SFI classes were done in two steps (for both depth): i) values of SFI were described with descriptive statistics (arithmetic mean, standard deviation, maximum and minimum, coefficient of variation, skewness and kurtosis), ii) range, nugget and sill variance values were determined using semivariograms. The degree of spatial dependence of a random variable Z(xi) over a certain distance can be described by the following semivariogram function (Equation 2):
2
( ) ( )1
1( ) ( )2 ( ) i i
n
x x hi
h Z ZN h
(2)
Where (h) is the semivariance for the interval
distance class h, N(h) is the number of pairs of the lag interval, Z(xi) is the measured sample value at point i, and Z(xi+h) is the measured sample value at position (i+h). To determine spatial variability

190 Türkiye Tarımsal Araştırmalar Dergisi - Turkish Journal of Agricultural Research 1(2): 186-195
SAĞLAM and DENGİZ
of SFI variables, the isotropic semivariogram models as Exponential and Gaussian were used.
The isotropic exponential model (Equation 3):
0( ) 1 exp hh C Ca
(3)
The isotropic gaussian model (Equation 4):
2
0( ) 1 exp hh C Ca
(4)
Where; C0 is the nugget variance 0, C is the
structural variance C0, (C0+C) is the sill variance, and a is the range of spatial correlation.
Geostatistical software (GS+ 7.0vs) was used to construct semivariograms and spatial structure analysis for variables (Robertson, 2008). In addition, maps of SFI variables for both depth surface and subsurface soils) were produced by kriging technique (Isaaks and Srivastava, 1989) using ArcGIS 9.3v geographic information system program. 3. Results and Discussion 3.1. Soil physical and chemical properties
Alluvial lands and floodplains formed under ephemeral flow regimes, especially in arid and semiarid regions, lack many of the same relationships between hydrology, sedimentology, and morphology that obtained in perennial rivers (Graf, 1982; Alexander et al., 1999). According to these last authors, the concept of pedogenic maturity is used to infer sediment accumulation rates at different locations in ancient floodplain environments: weak soil development is assumed where sedimentation rates are rapid and strong development is presumed where sediment accumulation is slow.
This study was carried out on alluvial land including three soil orders such as Entisol, Inceptisol and Vertisol according to Anonymous (1999). In addition, eight sub groups were identified: Sodic Haplustert, Typic Haplustert, Fluventic Haplustept, Vertic Haplustept, Typic Haplustept, Typic Ustipsamment, Typic Psammaquent and, Typic Ustifluvent. The descriptive statistics as minimum, maximum, mean, and coefficients of variation of physical and chemical properties and SFI values of both surface and subsurface soil samples were presented in Table 3.
In surface soil samples, the values of pH in soil samples ranged between 7.74 and 8.94, whereas
electrical conductivity had a minimum value of 0.16 dS m-1 and a maximum value of 1.56 dS m-1 (Table 3). Soil texture widely varies from sand to clay and Typic Haplustert and Sodic Haplustert have the highest clay content, while Typic Psammaquent and Typic Ustipsamment have the highest sand content. The mean values of clay content was 36.82% and ranges between 7.0% and 67.0%, while sand content varies between 2.43% and 91.39%. The mean values of organic matter and CaCO3 content were 21.2 g kg-1 and 84.5 g kg-1. As for macronutrient content of samples, Pav and Kexc showed high variation between minimum and maximum values. Ntotal varied between 0.2 g kg-1 and 3.5 g kg-1 and the mean value of Ntotal was 1.3 g kg-1. The mean values of Caexc, Mgexc, and Naexc concentration were found 43.56, 15.90 and 1.82 cmol(+) kg-1, respectively. In addition, Table 3 shows statistical distribution of micronutrient concentration (Feav, Cuav, Znav, and Mnav). According to limit values reported by Lindsay and Norvell (1978) and Anonymous (1990b), Feav and Cuav were found in sufficient amounts in all soil samples and their mean values are 40.87 and 4.02 mg kg-1 respectively, whereas all samples in terms of mean value were insufficient in respect to Znav content; its mean value is 0.45 mg kg-1. Besides, 32% of samples were insufficient in respect to Mnav and it has high variation between minimum and maximum values (1.31-77.02 mg kg-1). Finally, minimum and maximum values of SFI varied from 0.88 to 805.55.
In subsurface soil samples, the values of pH ranged between 7.92 and 9.01, whereas EC had a minimum value of 0.12 dS m-1 and a maximum value of 1.89 dS m-1. Most of subsurface soil samples had lower OM content compared to the surface soil samples and changed between 0.2-35.2 g kg-1, whereas CaCO3 content was found higher in subsurface soil samples than in surface soil samples due to carbonate accumulation and ranged from 4.7 to 216.1 g kg-1. In addition, when evaluating the Table 3 in terms of minimum, maximum and mean values of the macronutrients content in subsurface soils, it can be seen that Pav and Naexc showed high variation between minimum and maximum values. Ntotal varied between 0.2 g kg-1 and 2.8 g kg-1 and the mean value of Ntotal was 1.1 g kg-1. The mean values of Caexc, Mgexc, and Kexc concentration were found 43.09, 15.47 and 0.50 cmol(+) kg-1, respectively. Moreover, the amounts of micronutrient elements were found to be sufficient except of Znav which has mean value 0.26 mg kg-1 in subsurface soil samples. Finally, SFI varied from 0.35 to 435.05 (Table 3).

191Türkiye Tarımsal Araştırmalar Dergisi - Turkish Journal of Agricultural Research 1(2): 186-195
SAĞLAM and DENGİZ
Table 3. Descriptive statistics of the soil physical and chemical properties studied (0-30 cm and 30-60 cm soil depths)
Mean Minimum Maximum SD CV, % Skewness Kurtosis n
0-30 cm depth Sand 27.70 2.43 91.39 16.58 59.85 2.17 5.05 131 Clay 36.82 7.00 67.00 13.67 37.13 -0.01 -0.58 131 Silt 35.46 0.71 64.62 11.84 33.39 -0.84 0.97 131 SOM 21.20 1.20 90.60 1.21 57.08 2.42 11.20 131 pH 8.34 7.74 8.94 0.26 3.11 0.17 -0.76 131 EC 0.43 0.16 1.56 0.22 52.35 2.05 6.82 131 CaCO3 84.50 14.70 126.40 2.73 32.33 -0.99 -0.03 131 Caexc 43.56 19.00 57.46 6.81 15.64 -0.93 1.53 131 Naexc 1.82 0.12 19.43 2.10 115.03 5.69 40.72 131 Mgexc 15.90 2.57 30.91 5.19 32.64 0.20 0.56 131 Kexc 0.59 0.10 2.12 0.32 54.30 1.77 5.38 131 Feav 40.87 1.36 131.22 26.53 64.91 0.67 -0.05 131 Cuav 4.02 0.33 7.08 1.60 39.81 -0.17 -0.91 131 Znav 0.45 0.06 1.44 0.26 57.27 1.17 1.15 131 Mnav 7.79 1.31 77.02 9.32 52.41 2.58 13.78 131 Ntotal 1.30 0.20 3.50 0.08 61.72 0.37 -0.83 131 Pav 12.40 0.87 63.83 9.24 74.54 2.63 10.08 131 SFI 89.65 0.88 805.55 114.41 127.62 3.24 13.96 131
30-60 cm depth Sand 27.68 8.94 92.48 19.16 69.22 2.08 4.12 124 Clay 36.24 4.00 68.00 15.24 42.05 -0.12 -0.62 124 Silt 36.09 0.49 62.65 12.39 34.33 -0.98 1.48 124 SOM 15.30 0.2 35.2 0.82 53.66 0.01 -0.76 124 pH 8.37 7.92 9.01 0.26 3.07 0.38 -0.79 124 EC 0.40 0.12 1.89 0.20 48.64 3.75 25.01 124 CaCO3 95.70 4.7 216.1 3.30 34.51 -0.57 1.33 124 Caexc 43.09 17.42 54.63 7.44 17.26 -1.22 1.78 124 Naexc 2.12 0.13 18.01 2.26 106.65 4.51 25.80 124 Mgexc 15.47 1.45 43.00 6.38 41.21 0.99 2.24 124 Kexc 0.50 0.06 1.82 0.27 54.33 1.25 3.77 124 Feav 32.17 3.16 121.82 25.34 78.77 1.24 1.00 124 Cuav 3.54 0.09 6.91 1.65 46.67 -0.04 -0.68 124 Znav 0.26 0.09 1.21 0.16 61.69 2.64 10.27 124 Mnav 13.81 1.31 41.75 8.25 59.70 0.77 0.34 124 Ntotal 1.10 0.2 2.8 0.07 60.61 0.35 -1.02 124 Pav 9.69 0.62 31.79 6.76 69.69 1.19 1.34 124 SFI 54.00 0.35 435.05 81.63 151.18 2.91 9.08 124 SD: Standard deviation, CV: Coefficient of variation, SFI: Soil fertility index 3.2. Distribution of SFI with spatial variability
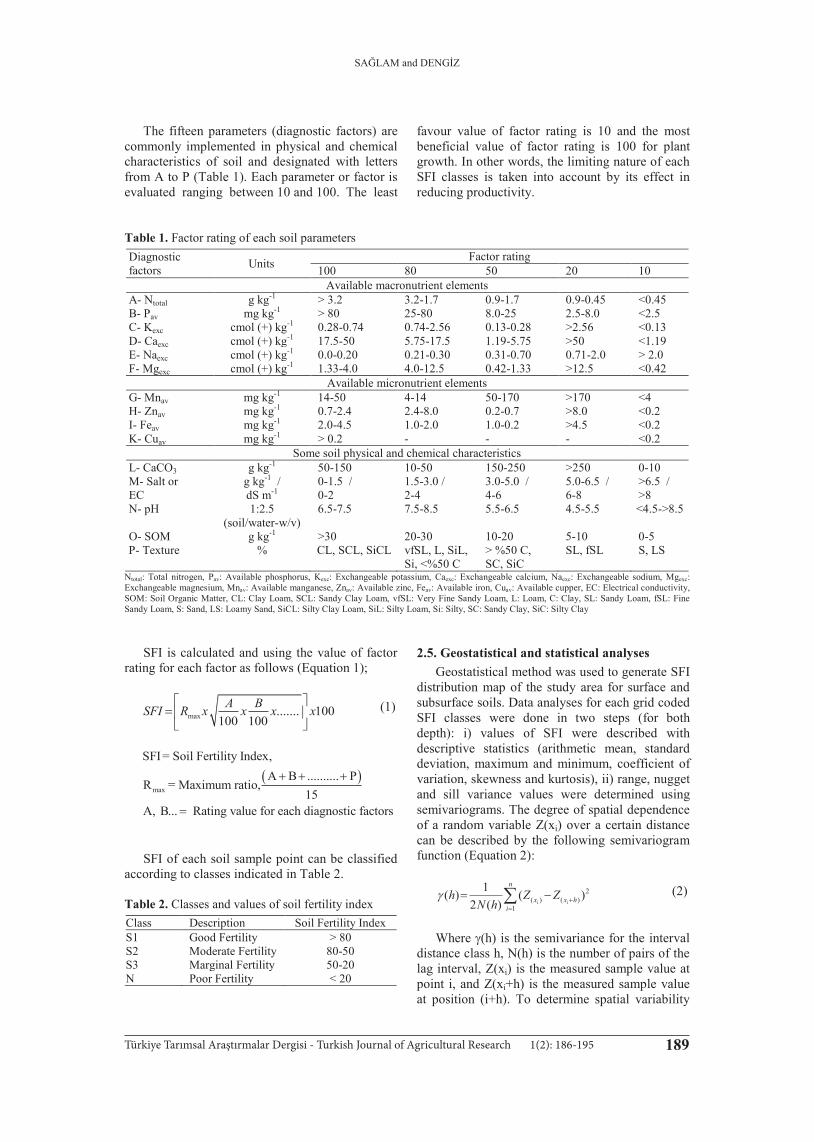
Geostatistics provides a set of statistical tools for incorporating spatial coordinates of observations in data processing (Loganathan et al., 2001). Geostatistics provides a tool for the optimum sampling design and interpolation on unsampled locations, taking into account the spatial correlation of adjacent pixels based on the semivariance. This procedure is optimal in the sense that estimates are unbiased and the estimation variance is a minimum (Di et al., 1989). This technique has been widely applied by soil scientists. Two models were tested to fit the semivariogram models for SFI (both surface and subsurface soils) in this study. The isotropic
spherical model showed the best fitting value for the computed semivariance points for surface and sub surface SFI (Figure 3 and Table 4).
The experiment semivariogram depicts the variance of the sample values at various separation distances (Hani et al., 2010). The ratio of nugget to sill (nugget/sill) can be used to express the extent of spatial autocorrelations of environmental factors. If the ratio is low (< 25%), the variable has strong spatial autocorrelations at a regional scale. A high ratio of nugget effect (> 75%) plays an important role in spatial heterogeneity of soil properties. In this study, the nugget value is 0.355 and the low ratio of nugget to sill (less than 25%) for surface SFI indicated the existence of a strong
192 Türkiye Tarımsal Araştırmalar Dergisi - Turkish Journal of Agricultural Research 1(2): 186-195
SAĞLAM and DENGİZ
spatial auto-correlation, whereas the nugget value of subsurface is 0.541 and ratio of nugget to sill was determined as moderate (Table 4).
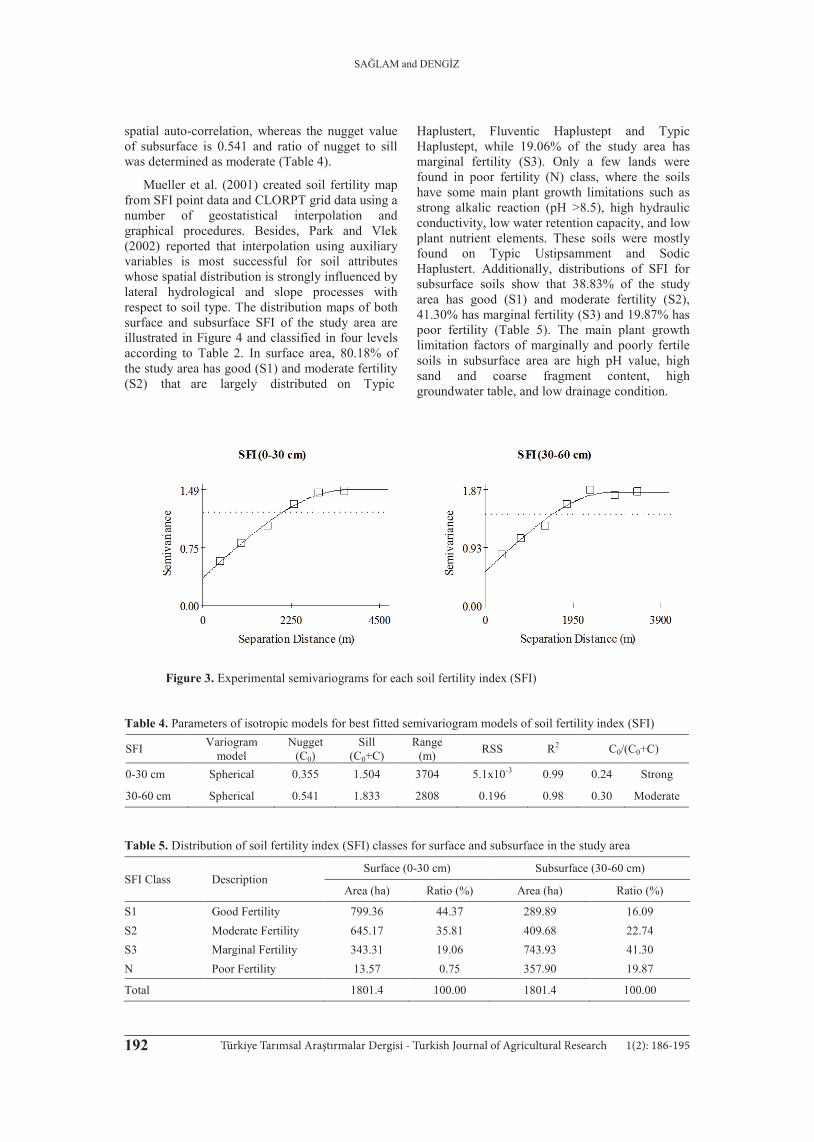
Mueller et al. (2001) created soil fertility map from SFI point data and CLORPT grid data using a number of geostatistical interpolation and graphical procedures. Besides, Park and Vlek (2002) reported that interpolation using auxiliary variables is most successful for soil attributes whose spatial distribution is strongly influenced by lateral hydrological and slope processes with respect to soil type. The distribution maps of both surface and subsurface SFI of the study area are illustrated in Figure 4 and classified in four levels according to Table 2. In surface area, 80.18% of the study area has good (S1) and moderate fertility (S2) that are largely distributed on Typic
Haplustert, Fluventic Haplustept and Typic Haplustept, while 19.06% of the study area has marginal fertility (S3). Only a few lands were found in poor fertility (N) class, where the soils have some main plant growth limitations such as strong alkalic reaction (pH >8.5), high hydraulic conductivity, low water retention capacity, and low plant nutrient elements. These soils were mostly found on Typic Ustipsamment and Sodic Haplustert. Additionally, distributions of SFI for subsurface soils show that 38.83% of the study area has good (S1) and moderate fertility (S2), 41.30% has marginal fertility (S3) and 19.87% has poor fertility (Table 5). The main plant growth limitation factors of marginally and poorly fertile soils in subsurface area are high pH value, high sand and coarse fragment content, high groundwater table, and low drainage condition.
Figure 3. Experimental semivariograms for each soil fertility index (SFI) Table 4. Parameters of isotropic models for best fitted semivariogram models of soil fertility index (SFI)
SFI Variogram model
Nugget (C0)
Sill (C0+C)
Range (m) RSS R2 C0/(C0+C)
0-30 cm Spherical 0.355 1.504 3704 5.1x10⁻³ 0.99 0.24 Strong
30-60 cm Spherical 0.541 1.833 2808 0.196 0.98 0.30 Moderate Table 5. Distribution of soil fertility index (SFI) classes for surface and subsurface in the study area
SFI Class Description Surface (0-30 cm) Subsurface (30-60 cm)
Area (ha) Ratio (%) Area (ha) Ratio (%)
S1 Good Fertility 799.36 44.37 289.89 16.09 S2 Moderate Fertility 645.17 35.81 409.68 22.74 S3 Marginal Fertility 343.31 19.06 743.93 41.30 N Poor Fertility 13.57 0.75 357.90 19.87
Total 1801.4 100.00 1801.4 100.00

193Türkiye Tarımsal Araştırmalar Dergisi - Turkish Journal of Agricultural Research 1(2): 186-195
SAĞLAM and DENGİZ
Figure 4. Interpolation mapping of surface and subsurface soil fertility index (SFI)
4. Conclusions Vertisol, Inceptisol and Entisol soils formed on fluvial land shapes are important agricultural soils in left side of Bafra Deltaic Plain. This study was
considered as a preliminary qualitative assessment and mapping of soil fertility changes using SFI model on a sustainable alluvial land use basis. The successful application of site specific management depends on the competence of differentially
194 Türkiye Tarımsal Araştırmalar Dergisi - Turkish Journal of Agricultural Research 1(2): 186-195
SAĞLAM and DENGİZ
managing plant growing to achieve both maximizing yield and simultaneously minimizing environmental impact. The most important difficulty with respect to this is the lack of, and uncertainty in, site specific information (Whelan et al., 1996). The information, related to the variation in crop yield, are spatially determined by soil properties such as soil type/texture, soil moisture content, nutrients, soil chemical properties etc. which can altogether help to designate the required site specific agricultural inputs such as fertilizers, irrigation and pesticides, and the interaction between crop genetics and environmental factors (Boyer, 1982). Site specific management of nutrients that uses spatial variability of soil fertility parameters provides to a grower the potential to apply the exact requirement of nutrients. It is necessary to use the modern methods of surveying and analysis tools. That’s why, geographic information system and geostatistical methods with its capability of data collection and analysis are now viewed as efficient and effective tools for mapping and modelling of SFI distribution. The capability of geographic information system and geostatistical techniques to analyze the information across space and time would help in managing such dynamic systems as irrigation systems. The study shows the efficiency of these tools to analyze the information on SFI in various domains in an integrated manner to understand the system. It is also very easy to update data involved in these techniques with more accuracy and reliability. Consequently, findings of this study showed that the most of the soil properties had strong spatial dependency and geostatistical modeling is very useful tool to determine the spatial variability structure and spatial dependency of soil properties.
It is highly recommended that the probable spatio-temporal changes in spatial variability of soil properties originating from the implementing of variable rate fertilizer and other agricultural input should be investigated in cultivated areas. Next to this study, more research should be devoted to these important topics, in particular validation of usefulness of SFI in decision making and implantation. The similar research should be also conducted for different soil types and environments. References Abbasi, M.K., Zafar, M., Sultan, T., 2010. Changes in
soil properties and microbial indices across various management sites in the mountain environments of Azad Jammu and Kashmir. Communications in Soil Science and Plant Analysis, 41: 768-782.
Alexander, J., Fielding, C.R., Pocock, G.D., 1999. Floodplain Behaviour of the Burdekin River,
Tropical North Queensland, Australia. In Anderson, M. G., Walling, D. E. and Bates, P. D. (eds.) Floodplain Processes. Wiley, Chichester. pp. 27-40.
Anonymous, 1990a. Analytical for Atomic Absorption Spectro Photometry. Connecticut, Perkin Elmer, Norwalk.
Anonymous, 1990b. Micronutrient, Assessment at the Country Level: An International Study. FAO Soil Bulletin by Sillanpaa, Rome.
Anonymous, 1992. Procedures for Collecting Soil Samples and Methods of Analysis for Soil Survey. Soil Surv Invest Rep I US Gov Print Office, Washington DC.
Anonymous, 1999. Soil Survey Staff, Soil Taxonomy. A Basic of Soil Classification for Making and Interpreting Soil Survey. USDA Handbook No 436, Washington DC.
Arshad, M.A., Martin, S., 2002. Identifying critical limits for soil quality indicators in agro-ecosystems. Agriculture Ecosystem and Environment, 88: 153-160.
Boruvka, L., Vacek, O., Jehlicka, J., 2005. Principal component analysis as a tool to indicate the origin of potentially toxic elements in soils. Geoderma, 128: 289-300.
Boyer, J.S., 1982. Plant productivity and environment. Science, 218: 443-448.
Chaudhury, J., Mandal, U.K., Sharma, K.L., Ghosh, H., Mandal, B., 2005. Assessing soil quality under long-term rice-based cropping system. Communications in Soil Science and Plant Analysis, 36: 1141-1161.
Chen, L.D., Wang, J., Fu, B.J., Qiu, Y., 2001. Land-use change in a small catchment of northern Loess Plateau, China. Agriculture Ecosystem and Environment, 86: 163-172.
Dalal, R.C., Moloney, D., 2000. Sustainability indicators of soil health and biodiversity. In Hale, P., Petrie, A., Moloney, D. and Sattler, P. (eds.) Management for sustainable ecosystems. Centre for Conservation Biology, University of Queensland, Brisbane, pp. 101-108.
Di, H.J., Trangmar, B.B., Kemp, R.A., 1989. Use of Geostatistics in Designing Sampling Strategies for Soil Survey. Soil Science Society of America Journal, 53: 1163-1167.
Ditzler, C.A., Tugel, A.J., 2002. Soil quality field tools: Experiences of USDA-NRCS Soil Quality Institute. Agronomy Journal, 94: 33-38.
Doran, J.W., Parkin, T.B., 1994. Defining and assessing soil quality. In Doran, J. W., Coleman, D. C., Bezdicek, D. F. and Stewart, B. A. (eds.) Defining soil quality for a sustainable environment. SSSA and ASA, Madison, Wisconsin, pp. 3-21.
Graf, W.L., 1982. Spatial variations of fluvial processes in semi-arid lands. In Thorn, C. E. (ed.) Space and time in Geomorphology. Allen and Unwin, Boston.
Hani, A., Pazira, E., Manshouri, M., Kafaky, S.B., Tali, M.G., 2010. Spatial distribution and mapping of risk elements pollution in agricultural soils of southern
195Türkiye Tarımsal Araştırmalar Dergisi - Turkish Journal of Agricultural Research 1(2): 186-195
SAĞLAM and DENGİZ
Tehran, Iran. Plant Soil Environment, 56(6): 288-296.
Hazelton, P., Murphy, B., 2007. Interpreting Soil Test Results. What do the Numbers Mean? CSIRO Publishing, Melbourne.
Isaaks, H.E., Srivastava, R.M., 1989. An Introduction to Applied Geostatistics. Oxford University Press, Oxford.
Larson, W.E., Pierce, F.J., 1991. Conservation and enhancement of soil quality. In Proceedings of the International Workshop on Evaluation for Sustainable Land Management in the Developing World, International Board for Soil Research and Management, Bangkok, pp. 175-203.
Lindsay, W.L., Norvell, W.A., 1978. Development of a DTPA soil test for zinc, iron, manganese and copper. Soil Science Society of America Journal, 42: 421-428.
Loganathan, P., Hedley, M.J., Wallace, G.C., Roberts, A.H.C., 2001. Effect of soil cultivation and winter pugging on fluorine distribution in soil profiles under pasture following long-term applications of phosphate fertilizers. Environmental Pollution, 115: 275-282.
Lu, D., Moran, E., Mausel, P., 2002. Linking Amazonian secondary succession forest growth to soil properties. Land Degradation and Development, 13: 331-343.
Moran, E.F., Brondizion, E.S., Tucker, J.M., Da Silva-Forsberg, M.C., McCracken, S., Falesi, I., 2000. Effects of soil fertility and land use on forest
succession in Amazonia. Forest Ecology and Management, 139: 93-108.
Mueller, T.G., Pierce, F.J., Schabenberger, O., Warncke, D.D., 2001. Map Quality for Site-Specific Fertility Management. Soil Science Society of America Journal, 65(5): 1547-1558.
Nelson, D.W., Sommers, L.E., 1982. Total Carbon, Organic Carbon and Organic matter. In Page, L. A., Miller, R. H. and Keeney, D. R. (eds.) Methods of Soil Analysis, Part II, Chemical and Microbiological Methods, 2nd edn. ASA, Madison, Wisconsin, pp. 539-579.
Park, S.J., Vlek, P.L.G., 2002. Environmental correlation of three-dimensional soil spatial variability: A comparison of three adaptive techniques. Geoderma, 109(1-2): 117-140.
Robertson, G.P., 2008. GS+: Geostatistics for the environmental sciences. USA: Gamma design software, Plainwell, Michigan.
Weber, G.B., Gobat, J.M., 2006. Identification of facies models in alluvial soil formation: The case of a Swiss Alpine Floodplain. Geomorphology, 74: 181-195.
Whelan, B.M., McBratney, A.B., Rossel, R.A., 1996. Spatial prediction for precision agriculture. Precision Agriculture Proceedings of the 3rd International Conference, Madison, pp. 331-342.
Wolf, B., 1971. The Determination of Boron in Soil Extracts, Plant Materials, Composts, Manures, Water and Nutrient Solutions. Soil Science and Plant Analysis, 2: 363-374.