discount rates issues and capitalization rates for … aptc presentation.pdf · discount rates...
TRANSCRIPT

Discount Rates Issues and
Capitalization Rates for Special
Use Properties
Hal Heaton, PhD

Relationship between discount rates
and capitalization rates
The discount rate is the rate of return
required to attract an investor to invest in
the property
The capitalization rate is the ratio of
profitability to price paid for a property
◦ Several metrics: net rents, gross rents, etc.

Constant Growth Equation
Value =
If growth is constant this simplifies to
◦ Value = Profit (cash flow) / (k-g)
Hence the capitalization rate =
Profit/Value = k - g
CONFIDENTIAL / DATE /
DEPARTMENT
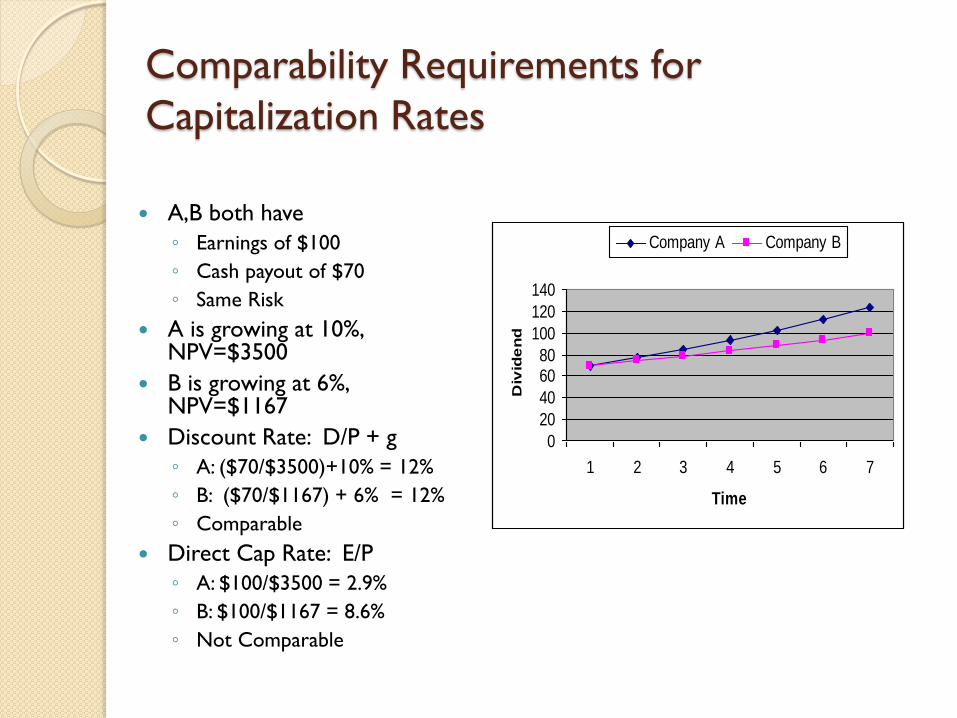
Comparability Requirements for
Capitalization Rates
A,B both have
◦ Earnings of $100
◦ Cash payout of $70
◦ Same Risk
A is growing at 10%, NPV=$3500
B is growing at 6%, NPV=$1167
Discount Rate: D/P + g
◦ A: ($70/$3500)+10% = 12%
◦ B: ($70/$1167) + 6% = 12%
◦ Comparable
Direct Cap Rate: E/P
◦ A: $100/$3500 = 2.9%
◦ B: $100/$1167 = 8.6%
◦ Not Comparable
0
20
40
6080
100
120
140
1 2 3 4 5 6 7
TimeD
ivid
en
d
Company A Company B

Estimating unique property discount
rates Few sales
◦ Refineries, pipelines, electric utilities,
telecommunications networks, etc.
◦ Capitalization rates from sales of actual
properties not available
Appraisers turn to securities of
corporations that own similar properties
Some assessors use corporate finance
techniques to extract discount rates from
securities

Discount rate estimation
A business will generally be financed with both debt and equity. The
Cost of Capital reflects the weighted average of all sources of
capital:
Weighted Average Cost of Capital (WACC) = Wd Kd (1-T) + We Ke
where:
Wd = the percent of financing raised in the form of debt
Kd = the long-term cost of debt
T = tax rate
We = the percent of financing raised in the form of equity
Ke = the cost of equity

Issues in 2012
◦ Debt for risky projects less available
◦ CAPM estimates biased low
◦ Dividend Growth Model better but has
greater variation
Liquidity is a critical issue
◦ Adjustments to final value or discount rates
essential

The stock market is lower than 12
years ago…
0
200
400
600
800
1000
1200
1400
1600
1800
S&P 500

But earnings have risen dramatically
… discount rates must be higher!
$0
$20
$40
$60
$80
$100
$120
1994 1995 1996 1997 1998 1999 2000 2001 2002 2003 2004 2005 2006 2007 2008 2009 2010 2011
S&P 500 Earnings

Headlines are clear that obtaining credit is difficult …
Wall Street Journal: February 24, 2010
“Lending Falls at Epic Pace
U.S. banks posted last year their sharpest decline in lending since 1942, suggesting that the industry's continued slide is making it harder for the economy to recover. … According to the FDIC, the number of U.S. banks at risk of failing hit a 16-year high at 702. More than 5% of all loans were at least three months past due, the highest level recorded in the 26 years the data have been collected. And the problems are expected to last through 2010. … …The struggling U.S. banking industry remains a problem for policy makers eager for banks to lend again.”

‘Smaller,’ undiversified properties
have greater difficulty obtaining debt “Company size and diversification often plays role.
While we have no minimum size criterion for any given
rating level, company size tends to be significantly
correlated to rating levels. This is because larger
companies often benefit from economies of scale
and/or diversification, translating into a stronger
competitive position. Small companies are, almost by
definition, more concentrated in terms of product,
number of customers, and geography. To the extent that
markets and regional economies change, a broader
scope of business affords protection.”
[Standard and Poor’s, “Corporate Ratings Criteria” page
22.]

Risk spreads for debt elevated …
0%
2%
4%
6%
8%
10%
12%
14%
16%
18%
20%N
ov-
98
May
-99
Nov-
99
May
-00
Nov-
00
May
-01
Nov-
01
May
-02
Nov-
02
May
-03
Nov-
03
May
-04
Nov-
04
May
-05
Nov-
05
May
-06
Nov-
06
May
-07
Nov-
07
May
-08
Nov-
08
May
-09
Nov-
09
May
-10
Nov-
10
May
-11
Nov-
11
Debt Premiums over Treasuries
Aa
Baa
Ba
B

CAPM: Required Return = Rf + β(Rm - Rf)
Example: Telecommunication Network
Share Price
12/31/2011
Shares
Outstanding
(millions)
Market
Value of
Equity
($millions)
Debt
($millions)
Percent
Debt
Bloomberg
Beta
Unlevered
Beta*
Alaska Communications $3.01 45.3 $136 $570 80.7% 0.74 0.21
Cincinnati Bell $3.03 195.2 $591 $2,534 81.1% 1.13 0.31
Consolidated Communications $19.05 29.9 $570 $885 60.8% 1.00 0.51
CenturyLink $37.20 618.5 $23,009 $21,836 48.7% 0.78 0.49
Frontier Communications $5.15 995.1 $5,125 $8,300 61.8% 0.98 0.49
Metro PCS $8.68 362.5 $3,146 $4,744 60.1% 1.08 0.56
Sprint Nextel $2.34 2996.0 $7,011 $20,274 74.3% 1.24 0.45
AT&T $30.24 5926.5 $179,218 $64,753 26.5% 0.82 0.67
Verizon Communications $40.12 2835.5 $113,761 $55,152 32.7% 0.79 0.61
Windstream $11.74 586.3 $6,883 $9,150 57.1% 0.90 0.50
Average 58.4% 0.94 0.48

CAPM Estimate Required Return = Rf + β(Rm - Rf)
Morningstar/Ibbotson
◦ Using 20% debt and relevering .5 unlevered beta
◦ 2.48% + .58 x 6.62% = 6.3%
Treasury Rates absurdly low
◦ Lower than inflation
◦ Due to demand from foreign banks
◦ …and foreigners terrified of European meltdown
◦ …Foreign governments keeping currencies low for
employment reasons
6.3% equity rate is lower than the rate on long
term telecom debt—impossible!

Ibbotson risk premium still biased
by 2008 return Return on large stocks in 2008: -37.0%
Return on long term Treasury bonds in
2008: +25.9%
One year risk premium
= Rm – Rf = -37.0% - 25.9% = -62.9%
Historical average risk premium fell
almost a full 1% as a result of one year’s
number

Treasury Rates

Dividend Growth Model:
Ke = Yield + Growth = D/P + g
Share Price
12/31/2011
Bloomberg
2012 Cash
Distribution
Forecast Yield
Value Line
Projected
Growth
Bloomberg
Projected
Growth Estimated
Return
Alaska Communications $3.01 $0.20 6.6% NMF 9.0% 15.6%
Cincinnati Bell $3.03 $0.00 0.0% 18.4% 3.0% 10.7%
Consolidated
Communications $19.05 $1.55 8.1% 10.8% 1.5% 14.3%
CenturyLink $37.20 $2.90 7.8% 16.1% -1.3% 15.2%
Frontier Communications $5.15 $0.75 14.6% 21.4% -5.9% 22.3%
Metro PCS $8.68 $0.00 0.0% 15.3% 19.5% 17.4%
Sprint Nextel $2.34 $0.00 0.0% NMF 4.0% 4.0%
AT&T $30.24 $1.77 5.9% 9.9% 4.9% 13.2%
Verizon Communications $40.12 $2.05 5.1% 11.5% 8.8% 15.3%
Windstream $11.74 $1.00 8.5% 17.8% 0.2% 17.5%
Average 14.6%

Liquidity
Liquidity refers to the ability to sell an
investment easily, quickly, and at low cost ◦ A liquidity discount refers to the lower value of an
illiquid asset compared to a liquid asset of similar
risk
◦ A liquidity premium refers to the higher return
that investors will require for an illiquid asset
Liquidity became critical in January 2009 ◦ Ability to generate cash to meet obligations critical
◦ Treasury bills were offering virtually zero interest
◦ 30-day Treasury bills briefly offered negative
interest

Liquidity: Illustration Build a pipeline/refinery/network … ◦ Cost $800 million
Hire managers, train a work force, market to
obtain contracts and customer base ◦ Cost $200 million
If property generates $100 million per year
and 10% is required rate ◦ Value = $1000 = $100 / 10%
May need intangibles such as patents,
licenses, copyrights, intellectual property ◦ Higher revenue/cash flow/value to compensate
Problem: what is value for property taxes?

Liquidity Illustration (continued)
Issue and sell stock (debt) claims on the
property
◦ Incur substantial costs to issue
◦ Incur ongoing costs to stay listed
Exchange listing fees
Disclosure costs
Regulatory costs
Additional auditing costs
Compare owning the property versus buying
shares ….

Liquidity Illustration (continued)
If you own the property you must ◦ Have substantial knowledge of how to operate
facility, market products or services
◦ Worry about hiring, firing, training
◦ Take care of all regulatory, licensing, disclosure, and
other issues
If you own the property you do not
have limited liability ◦ Environmental, accident, other litigation may lead
to losing other assets
Selling property takes time, expense, …

Liquidity Illustration (continued)
If you buy the shares
◦ You do not have to know anything about
managing, operating, marketing, regulations
….
◦ You can buy a few shares or a lot
Easy to diversify
Shareholders have absolute limited liability
You can turn your ownership into cash in
seconds with the click of an icon
Which you would rather own?

Liquidity Illustration (continued)
If the shares sell for, say, $1.5 billion due to all the
conveniences and advantages
◦ The property is still only generating $100
million a year
◦ Hence the discount rates extracted from stock
and bond data must be lower than 10%
In addition, shares can trade at higher values due
to property which does not even exist on the
assessment date!
◦ Wynn Resorts example

Liquidity
We are dealing with a property tax …
Not what highly liquid claims on property will sell
for
If the data obtained and used comes from stocks
and bonds …
Which are so liquid they can be sold in seconds
with the click of an icon …
The estimated discount rates must be adjusted to
make them useful to value illiquid property which is
expensive to sell, takes months to sell, and carries
substantial risk that securities don’t

Using Securities Data
Securities are very liquid
Securities can be sold in small or large amounts
Operating property requires dealing with management
hassles
Securities have absolute limited liability
Securities represent ownership in companies than can
expand, enter new businesses
Securities capture value from assets that do not even
exist on the lien date
Securities capture all intangible values
Not only do these facts affect extracted rates, it means
measures of “market/book” do not mean there is no
‘economic obsolescence’

Assessors recognize need for
liquidity adjustments California State Board of Equalization, Assessors’ Handbook,
Section 502, Advanced Appraisal, p. 63.
“Most financial assets are liquid. Real estate and most business assets, however, are relatively illiquid, and real estate investors must be compensated for this reduced liquidity.”
California State Board of Equalization, Assessors’ Handbook, Section 502, Advanced Appraisal, pp. 183-184. “The argument based on lack of liquidity is a much stronger one.
There is no question that financial assets are significantly more liquid than real estate assets. ... An adjustment for lack of liquidity can be made in two ways: (1) consider lack of liquidity as an added risk factor and add a premium for it to the cost of equity estimated by the CAPM; or (2) value the real estate asset using the CAPM/WACC without any liquidity adjustment, and then apply a liquidity discount to the estimated value.”

Appraisal texts require adjustment:
13th Edition Appraisal of Real Estate
◦ “If there are differences between a
comparable property and the subject
property that could affect the overall
capitalization rate concluded, the appraiser
must account for these differences.”
The word “must” is a very strong word

Adjusting for Illiquidity
Apply a liquidity discount to final value
Restricted stock sale studies: Silber, William L., “Discounts on Restricted Stock: The Impact of Illiquidity on Stock Prices,” Financial Analysts
Journal, (July/August 1991), pp. 60-64.
◦ Letter 144 shares sold for 33.75% lower price than identical publicly traded shares
Private equity placements on publicly traded companies: Hertzel, Michael and Smith, Richard L. “Market Discounts and Gains for Placing Equity Privately,” The Journal of
Finance, Vol. 48 (June 1993), pp.459-485.
◦ Untraded private stocks sell at lower prices than traded stocks Average discount= 20.14%
Median discount = 13.25%
Put Options (LEAPS)/Stock Price for similar companies
Seamon, Ron, “A Study of Discounts for Lack of Marketability Based on LEAPS Put Options in November 2008”
◦ Right to sell worth Average = 30.9%
Median = 28.4%

Size premium represents a minimum
liquidity premium adjustment …
Datasource: Morningstar/Ibbotson Annual Yearbook 2012

Why is liquidity becoming such a
critical issue now?
$0
$2,000
$4,000
$6,000
$8,000
$10,000
$12,000
$14,000
$B
illio
ns
U.S. Pension Fund Assets
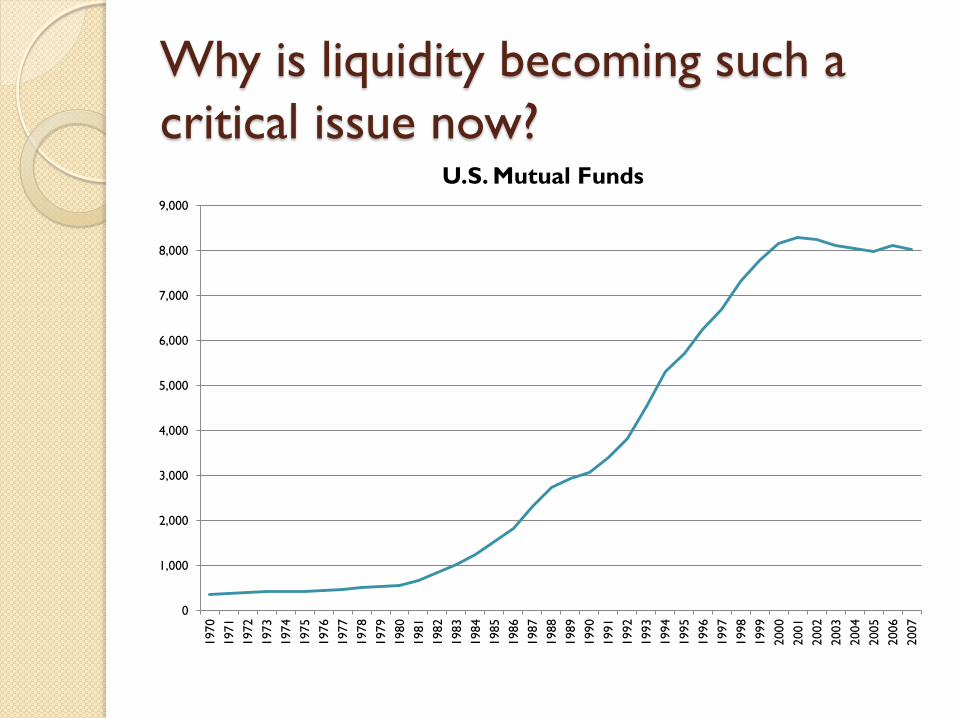
Why is liquidity becoming such a
critical issue now?
0
1,000
2,000
3,000
4,000
5,000
6,000
7,000
8,000
9,0001970
1971
1972
1973
1974
1975
1976
1977
1978
1979
1980
1981
1982
1983
1984
1985
1986
1987
1988
1989
1990
1991
1992
1993
1994
1995
1996
1997
1998
1999
2000
2001
2002
2003
2004
2005
2006
2007
U.S. Mutual Funds

Damadoran Liquidity Adjustment
Capital Asset Pricing Model (CAPM)
◦ Required return
= Risk Free Rate + Beta x Market Risk Premium
Beta = βi = ρi,m x (σi / σm)
◦ ρi,m = correlation coefficient , given by R2
Adjusted Beta = βi / ρi,m
Adjustment =
◦ (Adjusted Beta – Beta) x Market Risk Premium
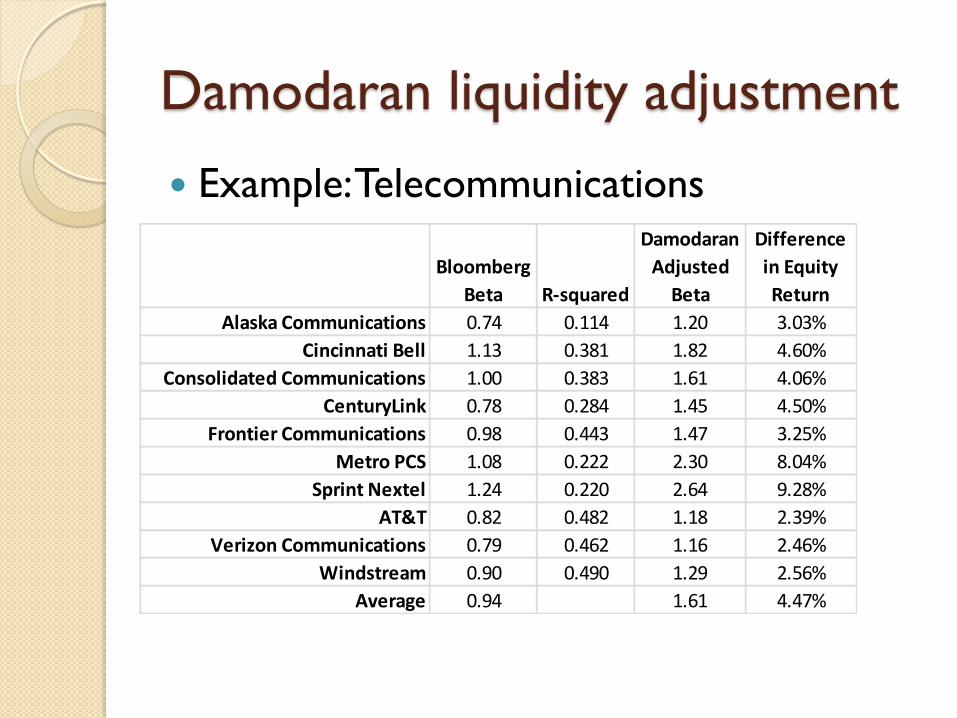
Damodaran liquidity adjustment
Example: Telecommunications
Bloomberg
Beta R-squared
Damodaran
Adjusted
Beta
Difference
in Equity
Return
Alaska Communications 0.74 0.114 1.20 3.03%
Cincinnati Bell 1.13 0.381 1.82 4.60%
Consolidated Communications 1.00 0.383 1.61 4.06%
CenturyLink 0.78 0.284 1.45 4.50%
Frontier Communications 0.98 0.443 1.47 3.25%
Metro PCS 1.08 0.222 2.30 8.04%
Sprint Nextel 1.24 0.220 2.64 9.28%
AT&T 0.82 0.482 1.18 2.39%
Verizon Communications 0.79 0.462 1.16 2.46%
Windstream 0.90 0.490 1.29 2.56%
Average 0.94 1.61 4.47%
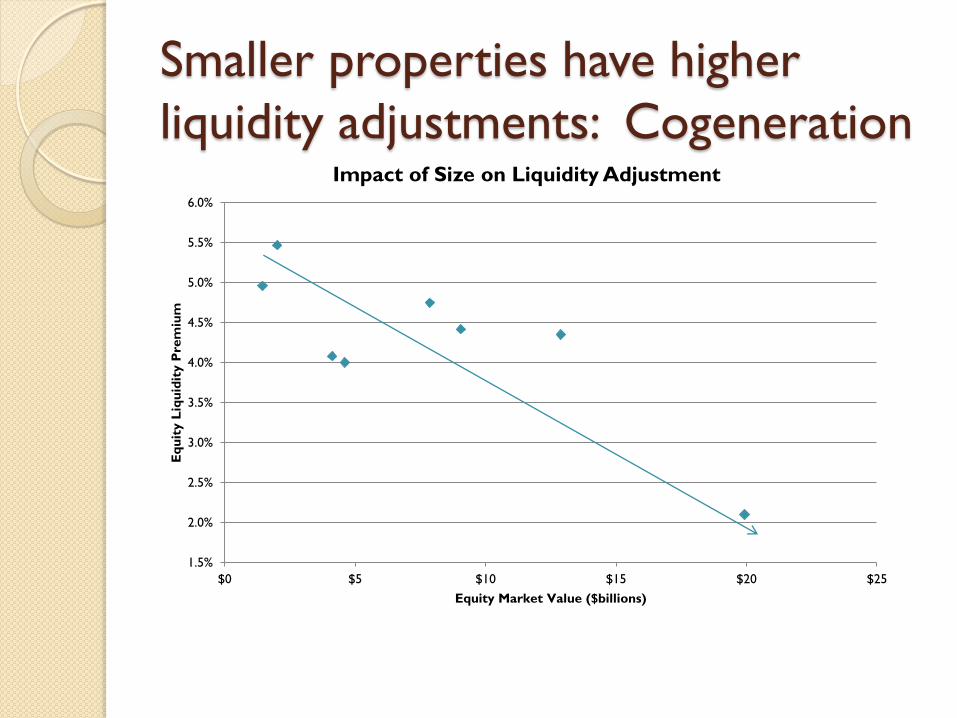
Smaller properties have higher
liquidity adjustments: Cogeneration
1.5%
2.0%
2.5%
3.0%
3.5%
4.0%
4.5%
5.0%
5.5%
6.0%
$0 $5 $10 $15 $20 $25
Eq
uit
y L
iqu
idit
y P
rem
ium
Equity Market Value ($billions)
Impact of Size on Liquidity Adjustment

Summary
Look carefully at properties used as comparable to estimate capitalization rates ◦ Must be similar risk (Discount rate)
◦ Must have similar growth expectations
If special use property and discount rates are ‘built up’ from security data ◦ CAPM estimates likely biased low
Must adjust for differences between securities and illiquid property ◦ Illiquidity discount/premium
◦ Size adjustment
◦ Damodaran approach