pdf discount rates – nyuadamodar/pdfiles/eqnotes/dcfrates.pdf · ... discount rates ¨ while...
TRANSCRIPT
DISCOUNTRATES
TheDintheDCF..
Aswath Damodaran 20
21
EstimatingInputs:DiscountRates
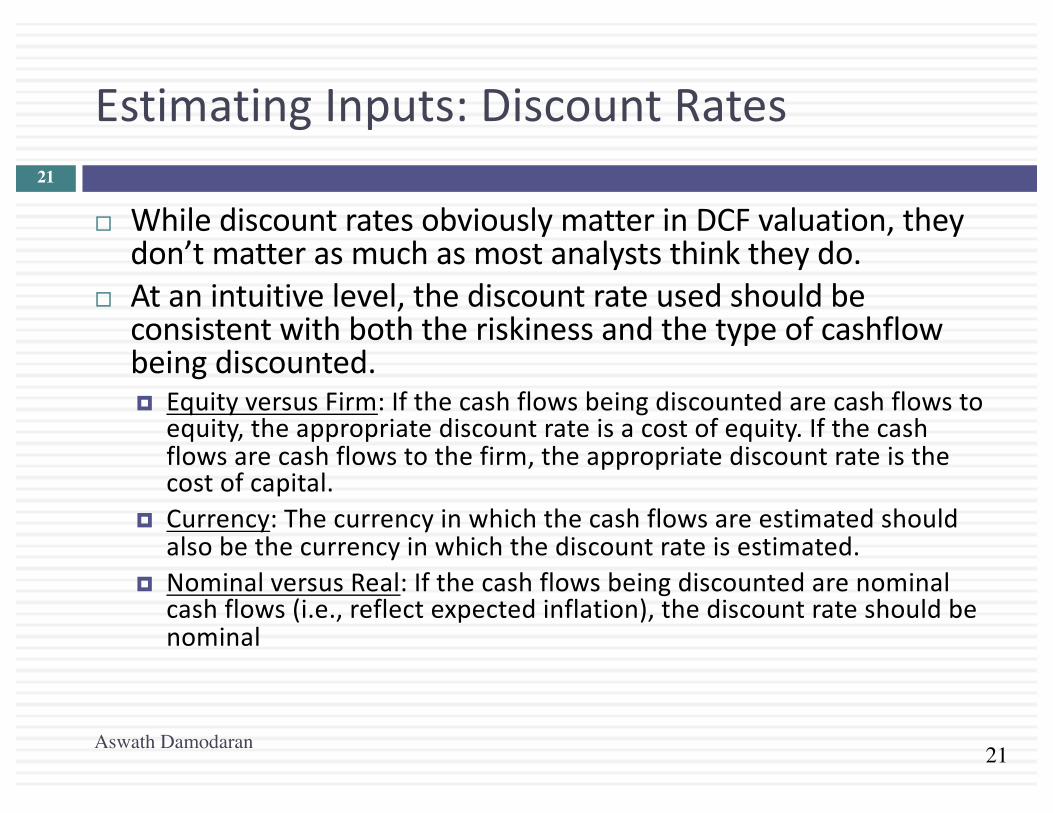
¨ WhilediscountratesobviouslymatterinDCFvaluation,theydon’tmatterasmuchasmostanalyststhinktheydo.
¨ Atanintuitivelevel,thediscountrateusedshouldbeconsistentwithboththeriskinessandthetypeofcashflowbeingdiscounted.¤ EquityversusFirm:Ifthecashflowsbeingdiscountedarecashflowsto
equity,theappropriatediscountrateisacostofequity.Ifthecashflowsarecashflowstothefirm,theappropriatediscountrateisthecostofcapital.
¤ Currency:Thecurrencyinwhichthecashflowsareestimatedshouldalsobethecurrencyinwhichthediscountrateisestimated.
¤ NominalversusReal:Ifthecashflowsbeingdiscountedarenominalcashflows(i.e.,reflectexpectedinflation),thediscountrateshouldbenominal
Aswath Damodaran
21

22
RiskintheDCFModel
Risk Adjusted Cost of equity
Risk free rate in the currency of analysis
Relative risk of company/equity in
questiion
Equity Risk Premium required for average risk
equity+ X=
Aswath Damodaran
22
23
Notallriskiscreatedequal…
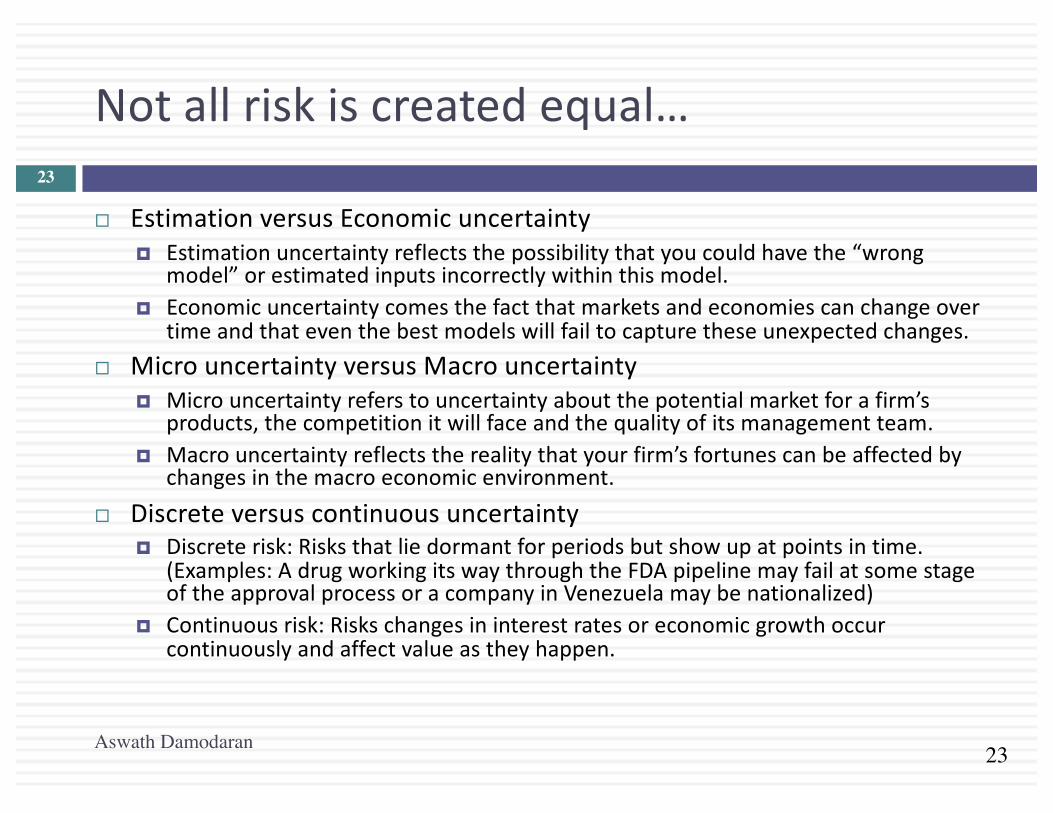
¨ EstimationversusEconomicuncertainty¤ Estimationuncertaintyreflectsthepossibilitythatyoucouldhavethe“wrong
model”orestimatedinputsincorrectlywithinthismodel.¤ Economicuncertaintycomesthefactthatmarketsandeconomiescanchangeover
timeandthateventhebestmodelswillfailtocapturetheseunexpectedchanges.¨ MicrouncertaintyversusMacrouncertainty
¤ Microuncertaintyreferstouncertaintyaboutthepotentialmarketforafirm’sproducts,thecompetitionitwillfaceandthequalityofitsmanagementteam.
¤ Macrouncertaintyreflectstherealitythatyourfirm’sfortunescanbeaffectedbychangesinthemacroeconomicenvironment.
¨ Discreteversuscontinuousuncertainty¤ Discreterisk:Risksthatliedormantforperiodsbutshowupatpointsintime.
(Examples:AdrugworkingitswaythroughtheFDApipelinemayfailatsomestageoftheapprovalprocessoracompanyinVenezuelamaybenationalized)
¤ Continuousrisk:Riskschangesininterestratesoreconomicgrowthoccurcontinuouslyandaffectvalueastheyhappen.
Aswath Damodaran
23

24
RiskandCostofEquity:Theroleofthemarginalinvestor
¨ Notallriskcounts:Whilethenotionthatthecostofequityshouldbehigherforriskierinvestmentsandlowerforsaferinvestmentsisintuitive,whatriskshouldbebuiltintothecostofequityisthequestion.
¨ Riskthroughwhoseeyes? Whileriskisusuallydefinedintermsofthevarianceofactualreturnsaroundanexpectedreturn,riskandreturnmodelsinfinanceassumethattheriskthatshouldberewarded(andthusbuiltintothediscountrate)invaluationshouldbetheriskperceivedbythemarginalinvestorintheinvestment
¨ Thediversificationeffect:Mostriskandreturnmodelsinfinancealsoassumethatthemarginalinvestoriswelldiversified,andthattheonlyriskthatheorsheperceivesinaninvestmentisriskthatcannotbediversifiedaway(i.e,marketornon-diversifiablerisk).Ineffect,itisprimarilyeconomic,macro,continuousriskthatshouldbeincorporatedintothecostofequity.
Aswath Damodaran
24
25
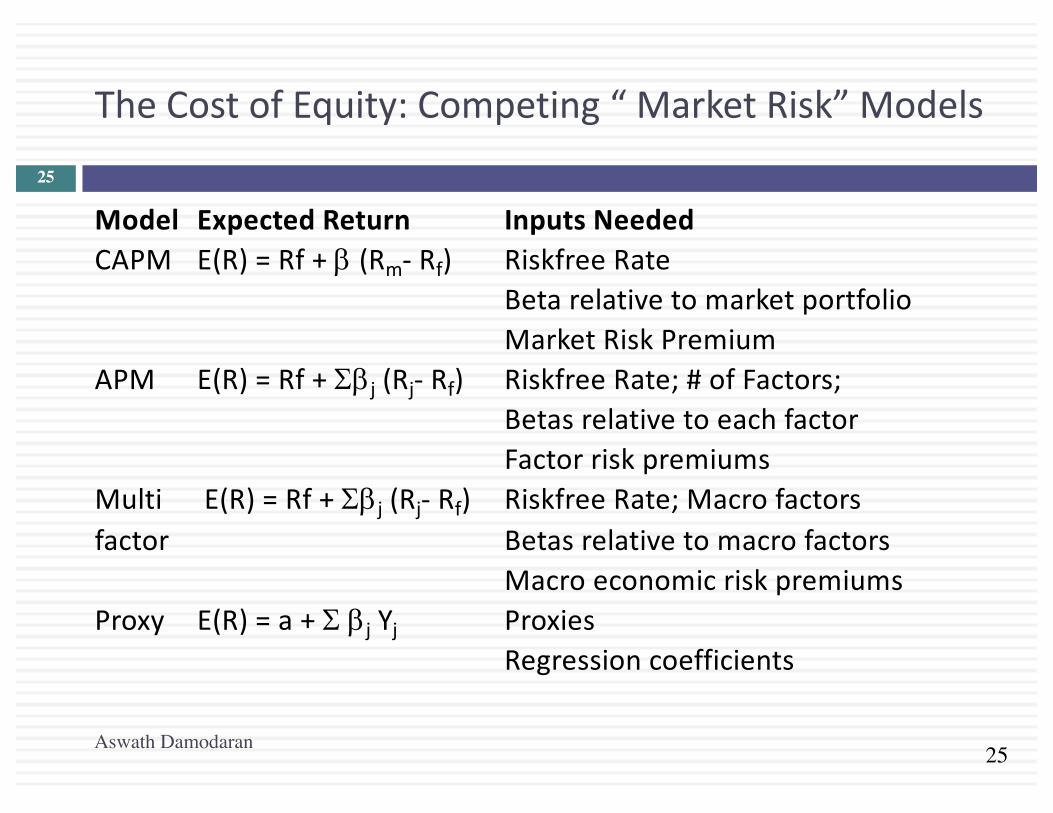
TheCostofEquity:Competing“MarketRisk”Models
Model ExpectedReturn InputsNeededCAPM E(R)=Rf +b (Rm- Rf) Riskfree Rate
BetarelativetomarketportfolioMarketRiskPremium
APM E(R)=Rf +Sbj (Rj- Rf) Riskfree Rate;#ofFactors;BetasrelativetoeachfactorFactorriskpremiums
Multi E(R)=Rf +Sbj (Rj- Rf) Riskfree Rate;Macrofactorsfactor Betasrelativetomacrofactors
MacroeconomicriskpremiumsProxy E(R)=a+S bj Yj Proxies
Regressioncoefficients
Aswath Damodaran
25

26
ClassicRisk&Return:CostofEquity
¨ IntheCAPM,thecostofequity:CostofEquity=Riskfree Rate+EquityBeta*(EquityRiskPremium)
¨ InAPMorMulti-factormodels,youstillneedariskfreerate,aswellasbetasandriskpremiumstogowitheachfactor.
¨ Touseanyriskandreturnmodel,youneed¨ Ariskfreerateasabase¨ Asingleequityriskpremium(intheCAPM)orfactorrisk
premiums,inthethemulti-factormodels¨ Abeta(intheCAPM)orbetas(inmulti-factormodels)
Aswath Damodaran
26

TheRiskFreeRate
DiscountRates:I27
Aswath Damodaran

28
TheRiskFreeRate:LayingtheFoundations
¨ Onariskfree investment,theactualreturnisequaltotheexpectedreturn.Therefore,thereisnovariancearoundtheexpectedreturn.
¨ Foraninvestmenttoberiskfree,then,ithastohave¤ Nodefaultrisk¤ Noreinvestmentrisk
¤ Itfollowsthenthatifaskedtoestimateariskfreerate:1. Timehorizonmatters:Thus,theriskfree ratesinvaluationwill
dependuponwhenthecashflowisexpectedtooccurandwillvaryacrosstime.
2. Currenciesmatter:Ariskfreerateiscurrency-specificandcanbeverydifferentfordifferentcurrencies.
3. Notallgovernmentsecuritiesareriskfree:Somegovernmentsfacedefaultriskandtheratesonbondsissuedbythemwillnotberiskfree.
Aswath Damodaran
28

29
Test1:AriskfreerateinUSdollars!
¨ Invaluation,weestimatecashflowsforever(oratleastforverylongtimeperiods).TherightriskfreeratetouseinvaluingacompanyinUSdollarswouldbea. Athree-monthTreasurybillrate(0.2%)b. Aten-yearTreasurybondrate(2%)c. Athirty-yearTreasurybondrate(3%)d. ATIPs(inflation-indexedtreasury)rate(1%)e. Noneoftheabove
¨ WhatareweimplicitlyassumingabouttheUStreasurywhenweuseanyofthetreasurynumbers?
Aswath Damodaran
29

30
Test2:ARiskfreeRateinEuros
Aswath Damodaran
30
0.00%
1.00%
2.00%
3.00%
4.00%
5.00%
6.00%
7.00%
8.00%
9.00%
10.00%
EuroGovernmentBondRates- January1,2016

31
Test3:ARiskfreeRateinIndianRupees
¨ TheIndiangovernmenthad10-yearRupeebondsoutstanding,withayieldtomaturityofabout7.73%onJanuary1,2016.
¨ InJanuary2016,theIndiangovernmenthadalocalcurrencysovereignratingofBaa3.Thetypicaldefaultspread(overadefaultfreerate)forBaa3ratedcountrybondsinearly2016was2.44%.TheriskfreerateinIndianRupeesisa. Theyieldtomaturityonthe10-yearbond(7.73%)b. Theyieldtomaturityonthe10-yearbond+Defaultspread(10.17%)c. Theyieldtomaturityonthe10-yearbond– Defaultspread(5.29%)d. Noneoftheabove
Aswath Damodaran
31
32
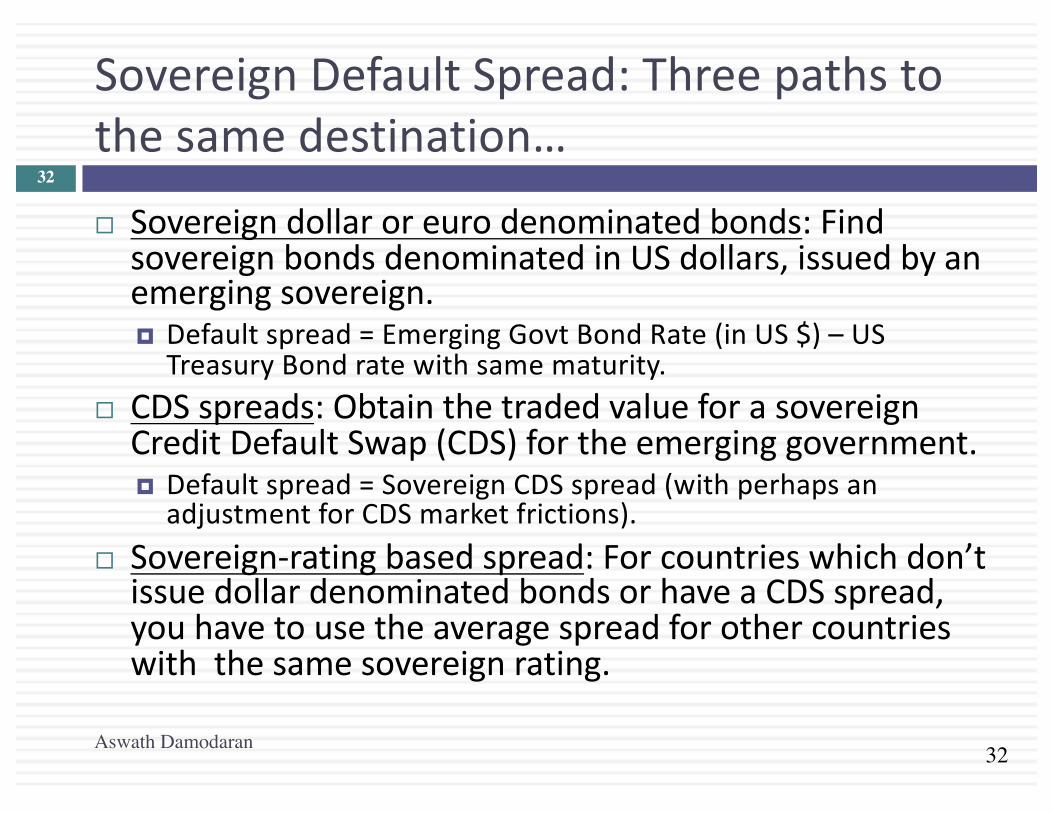
SovereignDefaultSpread:Threepathstothesamedestination…
¨ Sovereigndollaroreurodenominatedbonds:FindsovereignbondsdenominatedinUSdollars,issuedbyanemergingsovereign.¤ Defaultspread=EmergingGovt BondRate(inUS$)– USTreasuryBondratewithsamematurity.
¨ CDSspreads:ObtainthetradedvalueforasovereignCreditDefaultSwap(CDS)fortheemerginggovernment.¤ Defaultspread=SovereignCDSspread(withperhapsanadjustmentforCDSmarketfrictions).
¨ Sovereign-ratingbasedspread:Forcountrieswhichdon’tissuedollardenominatedbondsorhaveaCDSspread,youhavetousetheaveragespreadforothercountrieswiththesamesovereign rating.
Aswath Damodaran
32

33
LocalCurrencyGovernmentBondRates–January2016
Aswath Damodaran
33
34
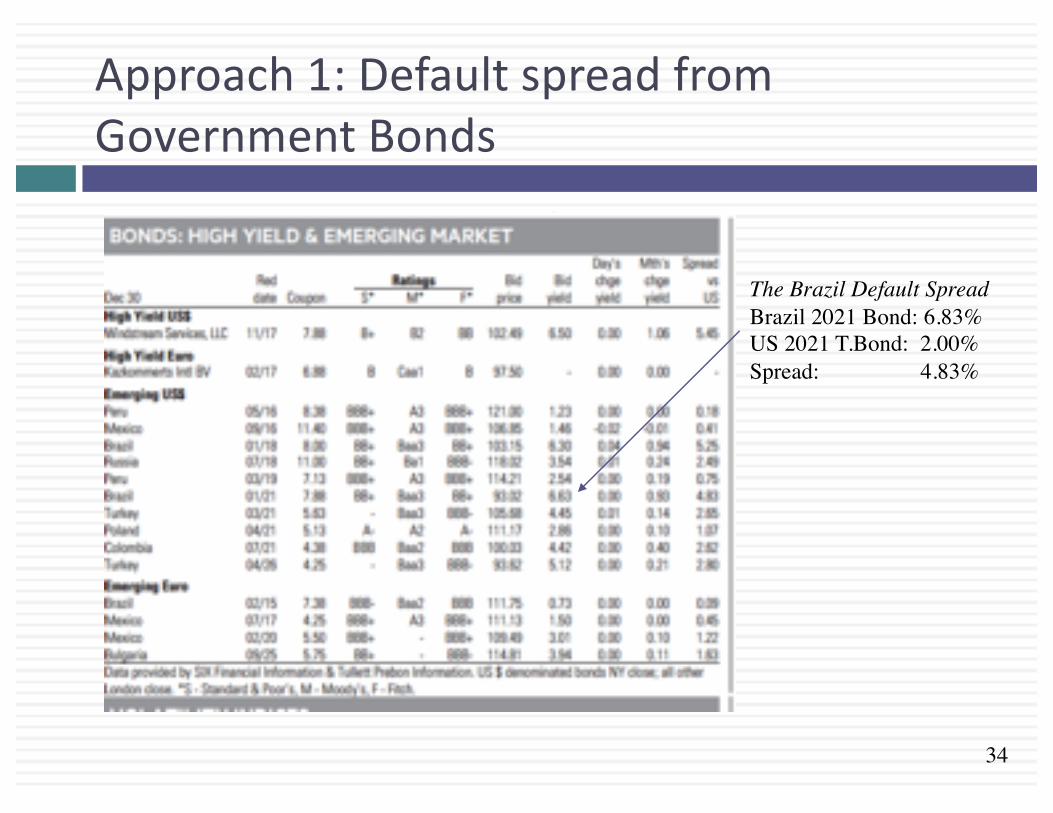
Approach1:DefaultspreadfromGovernmentBonds
The Brazil Default SpreadBrazil 2021 Bond: 6.83%US 2021 T.Bond: 2.00%Spread: 4.83%

35
Approach2:CDSSpreads– January2016
Aswath Damodaran
35

36
Approach3:TypicalDefaultSpreads:January2016
Aswath Damodaran
36

37
Gettingtoariskfreerateinacurrency:Example
¨ TheBraziliangovernmentbondrateinnominalreaisonJanuary1,2016was16.51%.Togettoariskfreerateinnominalreais,wecanuseoneofthreeapproaches.¨ Approach1:GovernmentBondspread
¤ The2021Brazilbond,denominatedinUSdollars,hasaspreadof4.83%overtheUStreasurybondrate.
¤ Riskfreeratein$R=16.51%- 4.83%=11.68%¨ Approach2:TheCDSSpread
¤ TheCDSspreadforBrazil,adjustedfortheUSCDSspreadwas5.19%.
¤ Riskfreeratein$R=16.51%- 5.19%=11.32%¨ Approach3:TheRatingbasedspread
¤ BrazilhasaBaa3localcurrencyratingfromMoody’s.Thedefaultspreadforthatratingis2.44%
¤ Riskfreeratein$R=16.51%- 2.44%=14.07%
Aswath Damodaran
37

38
Test4:ARealRiskfreeRate
¨ Insomecases,youmaywantariskfree rateinrealterms(inrealterms)ratherthannominalterms.
¨ Togetarealriskfree rate,youwouldlikeasecuritywithnodefaultriskandaguaranteedrealreturn.Treasuryindexedsecuritiesofferthiscombination.
¨ InJanuary2016,theyieldona10-yearindexedtreasurybondwas0.75%.Whichofthefollowingstatementswouldyousubscribeto?a. This(0.75%)istherealriskfree ratetouse,ifyouarevaluing
UScompaniesinrealterms.b. This(0.75%)istherealriskfree ratetouse,anywhereinthe
worldExplain.
Aswath Damodaran
38
39
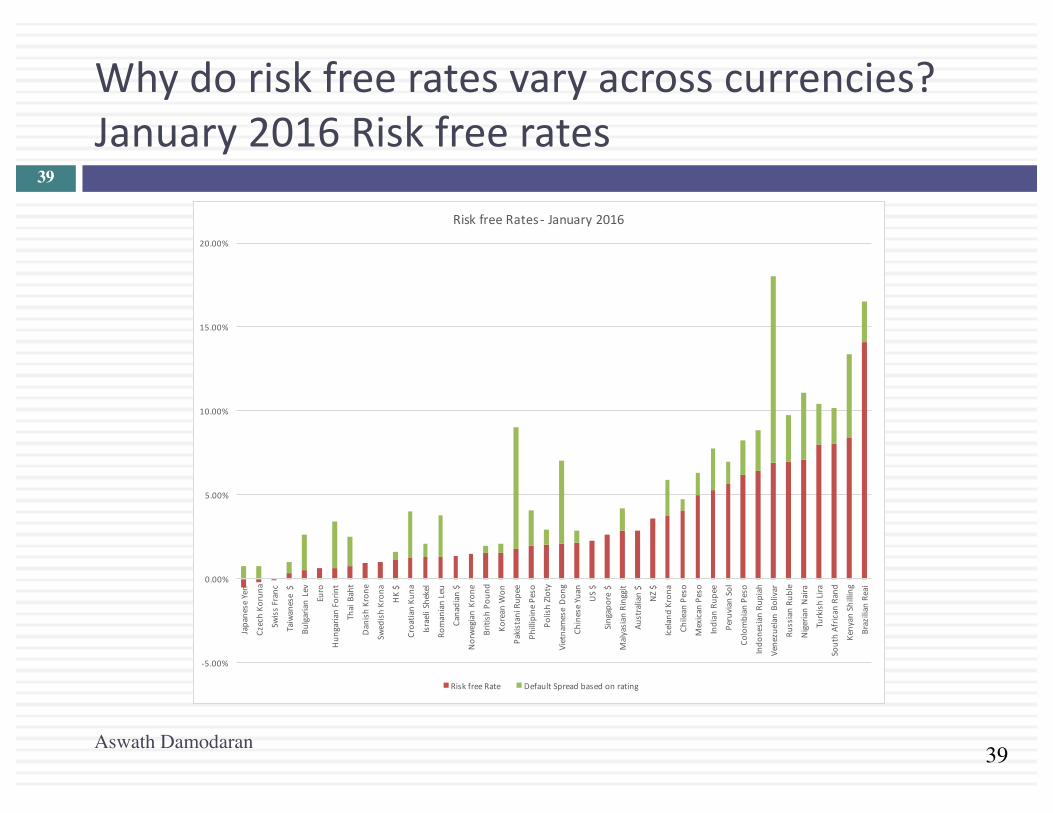
Whydoriskfreeratesvaryacrosscurrencies?January2016Riskfreerates
Aswath Damodaran
39
-5.00%
0.00%
5.00%
10.00%
15.00%
20.00%JapaneseYen
CzechKo
runa
SwissFranc
Taiwanese$
BulgarianLev
Euro
Hun
garianForin
t
ThaiBaht
DanishKron
e
SwedishKron
a
HK$
CroatianKu
na
IsraeliShekel
RomanianLeu
Canadian$
NorwegianKron
e
BritishPou
nd
KoreanW
on
PakistaniRup
ee
PhillipinePeso
PolishZloty
VietnameseDon
g
ChineseYuan
US$
Singapore$
MalyasianRinggit
Australian$
NZ$
IcelandKron
a
ChileanPeso
MexicanPeso
IndianRup
ee
PeruvianSol
ColombianPeso
Indo
nesianRup
iah
VenezuelanBolivar
RussianRu
ble
NigerianNaira
TurkishLira
SouthAfricanRand
KenyanShilling
BrazilianReai
RiskfreeRates- January2016
RiskfreeRate DefaultSpreadbasedonrating

40
RiskfreeRate:Don’thaveortrustthegovernmentbondrate?1. Buildupapproach:Theriskfreerateinanycurrencycanbe
writtenasthesumoftwovariables:Riskfreerate=ExpectedInflationincurrency+Expectedrealinterestrate
Theexpectedrealinterestratecanbecomputedinoneoftwoways:fromtheUSTIPsrateorsetequaltorealgrowthintheeconomy.Thus,iftheexpectedinflationrateinacountryisexpectedtobe15%andtheTIPsrateis1%,theriskfreerateis16%.
2. US$Rate&DifferentialInflation:Alternatively,youcanscaleuptheUS$riskfreeratebythedifferentialinflationbetweentheUS$andthecurrencyinquestion:
RiskfreerateCurrency=
Thus,iftheUS$riskfreerateis2.00%,theinflationrateintheforeigncurrencyis15%andtheinflationrateinUS$is1.5%,theforeigncurrencyriskfreerateisasfollows:Riskfreerate= 1.02 !.!"
!.!"# − 1=15.57%

41
Onemoretestonriskfreerates…
¨ OnJanuary1,2016,the10-yeartreasurybondrateintheUnitedStateswas2.27%,ahistoriclow.AssumethatyouwerevaluingacompanyinUSdollarsthen,butwerewaryabouttheriskfreeratebeingtoolow.Whichofthefollowingshouldyoudo?a. Replacethecurrent10-yearbondratewithamorereasonable
normalizedriskfreerate(theaverage10-yearbondrateoverthelast30yearshasbeenabout5-6%)
b. Usethecurrent10-yearbondrateasyourriskfreeratebutmakesurethatyourotherassumptions(aboutgrowthandinflation)areconsistentwiththeriskfreerate
c. Somethingelse…
Aswath Damodaran
41

42
Someperspectiveonriskfreerates
Aswath Damodaran
42
-5.00%
0.00%
5.00%
10.00%
15.00%
20.00%1954
1955
1956
1957
1958
1959
1960
1961
1962
1963
1964
1965
1966
1967
1968
1969
1970
1971
1972
1973
1974
1975
1976
1977
1978
1979
1980
1981
1982
1983
1984
1985
1986
1987
1988
1989
1990
1991
1992
1993
1994
1995
1996
1997
1998
1999
2000
2001
2002
2003
2004
2005
2006
2007
2008
2009
2010
2011
2012
2013
2014
2015
Interestratefundamentals:T.Bondrates,Realgrowthandinflation
Inflationrate RealGDPgrowth Ten-yearT.Bondrate

43
NegativeInterestRates?
¨ In2016,therewereatleastthreecurrencies(SwissFranc,JapaneseYen,Euro)withnegativeinterestrates.Usingthefundamentals(inflationandrealgrowth)approach,howwouldyouexplainnegativeinterestrates?
¨ Hownegativecanratesget?(Isthereabound?)¨ Wouldyouusethesenegativeinterestratesasriskfreerates?¤ Ifno,whynotandwhatwouldyoudoinstead?¤ Ifyes,whatelsewouldyouhavetodoinyourvaluationtobeinternallyconsistent?
Aswath Damodaran
43

TheEquityRiskPremium
DiscountRates:II44
Aswath Damodaran
45
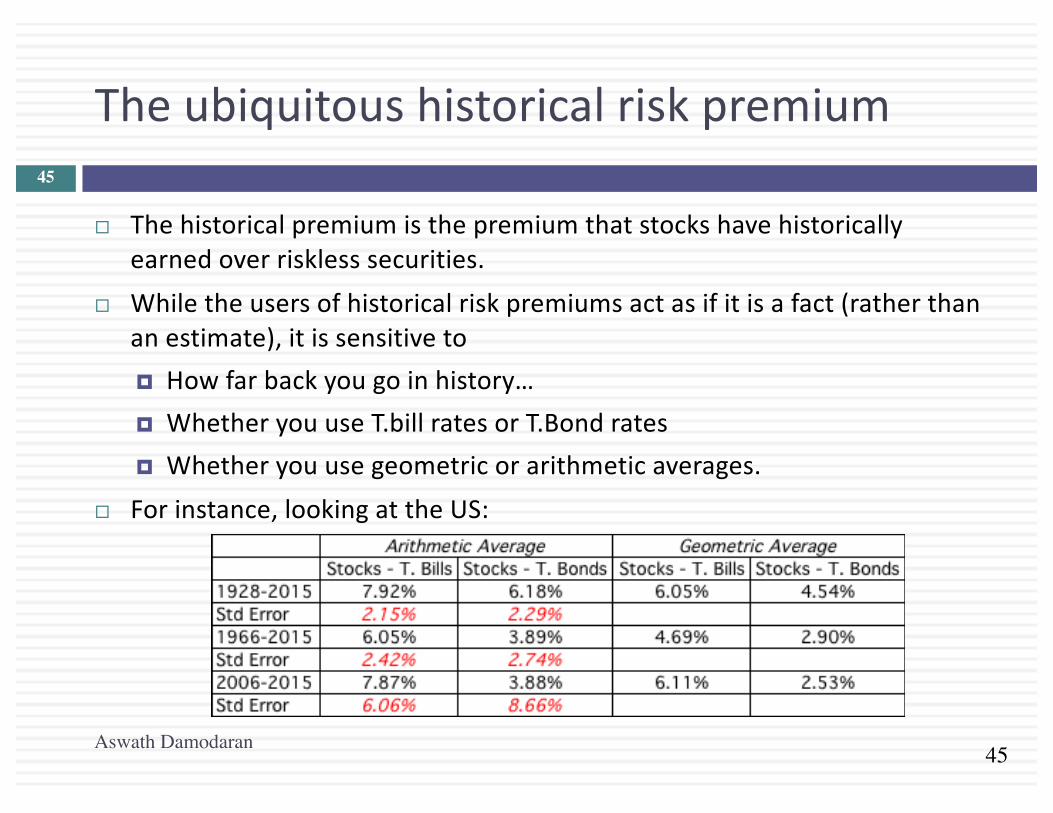
Theubiquitoushistoricalriskpremium
¨ Thehistoricalpremiumisthepremiumthatstockshavehistoricallyearnedoverrisklesssecurities.
¨ Whiletheusersofhistoricalriskpremiumsactasifitisafact(ratherthananestimate),itissensitiveto¤ Howfarbackyougoinhistory…¤ WhetheryouuseT.billratesorT.Bondrates¤ Whetheryouusegeometricorarithmeticaverages.
¨ Forinstance,lookingattheUS:
Aswath Damodaran
45

46
Theperilsoftrustingthepast…….
¨ Noisyestimates:Evenwithlongtimeperiodsofhistory,theriskpremiumthatyouderivewillhavesubstantialstandarderror.Forinstance,ifyougobackto1928(about80yearsofhistory)andyouassumeastandarddeviationof20%inannualstockreturns,youarriveatastandarderrorofgreaterthan2%:
StandardErrorinPremium=20%/√80=2.26%¨ SurvivorshipBias:UsinghistoricaldatafromtheU.S.equitymarketsoverthetwentiethcenturydoescreateasamplingbias.Afterall,theUSeconomyandequitymarketswereamongthemostsuccessfuloftheglobaleconomiesthatyoucouldhaveinvestedinearlyinthecentury.
Aswath Damodaran
46
47
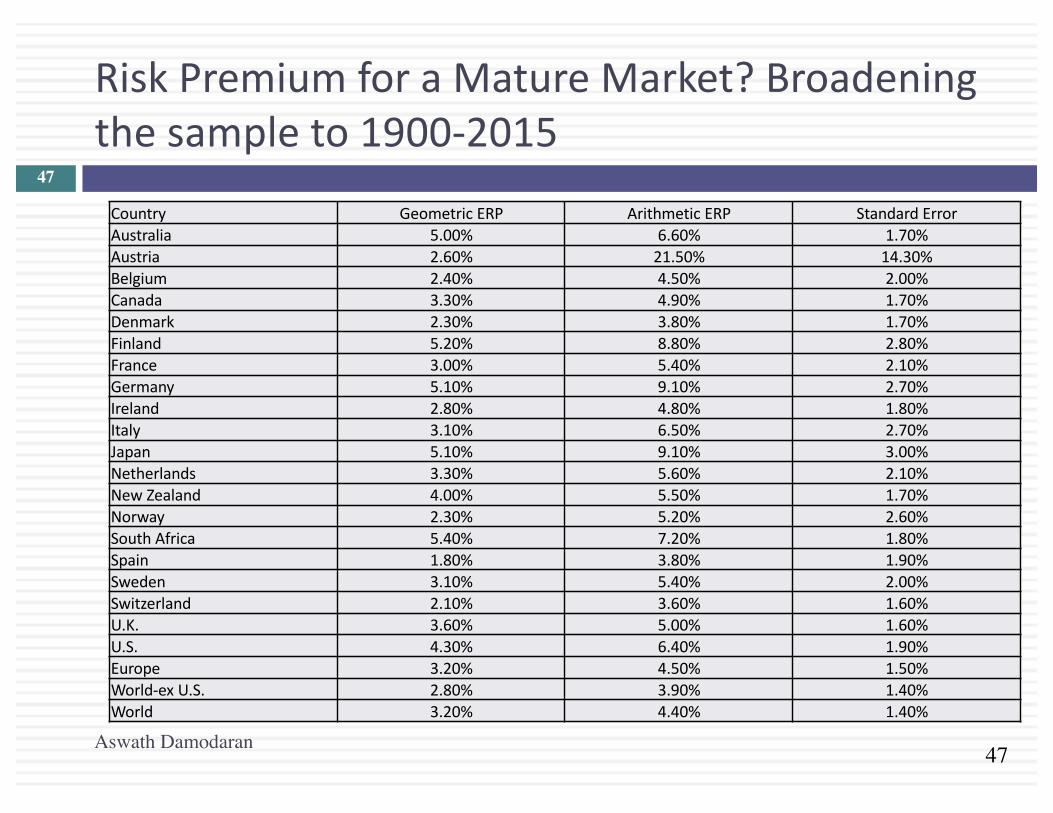
RiskPremiumforaMatureMarket?Broadeningthesampleto1900-2015
Aswath Damodaran
47
Country GeometricERP ArithmeticERP StandardErrorAustralia 5.00% 6.60% 1.70%Austria 2.60% 21.50% 14.30%Belgium 2.40% 4.50% 2.00%Canada 3.30% 4.90% 1.70%Denmark 2.30% 3.80% 1.70%Finland 5.20% 8.80% 2.80%France 3.00% 5.40% 2.10%Germany 5.10% 9.10% 2.70%Ireland 2.80% 4.80% 1.80%Italy 3.10% 6.50% 2.70%Japan 5.10% 9.10% 3.00%Netherlands 3.30% 5.60% 2.10%New Zealand 4.00% 5.50% 1.70%Norway 2.30% 5.20% 2.60%South Africa 5.40% 7.20% 1.80%Spain 1.80% 3.80% 1.90%Sweden 3.10% 5.40% 2.00%Switzerland 2.10% 3.60% 1.60%U.K. 3.60% 5.00% 1.60%U.S. 4.30% 6.40% 1.90%Europe 3.20% 4.50% 1.50%World-ex U.S. 2.80% 3.90% 1.40%World 3.20% 4.40% 1.40%

48
Thesimplestwayofestimatinganadditionalcountryriskpremium:Thecountrydefaultspread
¨ Defaultspreadforcountry:Inthisapproach,thecountryequityriskpremiumissetequaltothedefaultspreadforthecountry,estimatedinoneofthreeways:¤ Thedefaultspreadonadollardenominatedbondissuedbythecountry.
(InJanuary2016,thatspreadwas4.83%fortheBrazilian$bond)¤ ThesovereignCDSspreadforthecountry.InJanuary2016,thetenyear
CDSspreadforBrazil,adjustedfortheUSCDS,was5.19%.¤ Thedefaultspreadbasedonthelocalcurrencyratingforthecountry.
Brazil’ssovereignlocalcurrencyratingisBaa3andthedefaultspreadforaBaa3ratedsovereignwasabout2.44%inJanuary2016.
¨ Addthedefaultspreadtoa“mature”marketpremium:ThisdefaultspreadisaddedontothematuremarketpremiumtoarriveatthetotalequityriskpremiumforBrazil,assumingamaturemarketpremiumof6.00%.¤ CountryRiskPremiumforBrazil=2.44%¤ TotalERPforBrazil=6.00%+2.44%=8.44%
Aswath Damodaran
48
Aswath Damodaran

49
AnequityvolatilitybasedapproachtoestimatingthecountrytotalERP
¨ Thisapproachdrawsonthestandarddeviationoftwoequitymarkets,theemergingmarketinquestionandabasemarket(usuallytheUS).Thetotalequityriskpremiumfortheemergingmarketisthenwrittenas:¤ Totalequityriskpremium=RiskPremiumUS*sCountry Equity/sUS Equity
¨ ThecountryequityriskpremiumisbaseduponthevolatilityofthemarketinquestionrelativetoU.Smarket.¤ AssumethattheequityriskpremiumfortheUSis6.00%.¤ AssumethatthestandarddeviationintheBovespa (Brazilianequity)is
30%andthatthestandarddeviationfortheS&P500(USequity)is18%.
¤ TotalEquityRiskPremiumforBrazil=6.00%(30%/18%)=10.0%¤ CountryequityriskpremiumforBrazil=10.00%- 6.00%=4.00%
Aswath Damodaran
49

50
Ameldedapproachtoestimatingtheadditionalcountryriskpremium
¨ Countryratingsmeasuredefaultrisk.Whiledefaultriskpremiumsandequityriskpremiumsarehighlycorrelated,onewouldexpectequityspreadstobehigherthandebtspreads.
¨ Anotheristomultiplythebonddefaultspreadbytherelativevolatilityofstockandbondpricesinthatmarket.UsingthisapproachforBrazilinJanuary2016,youwouldget:¤ CountryEquityriskpremium=Defaultspreadoncountrybond*sCountry
Equity /sCountry Bondn StandardDeviationinBovespa (Equity)=30%n StandardDeviationinBrazilgovernmentbond=20%n DefaultspreadforBrazil=2.44%
¤ BrazilCountryRiskPremium=2.44%(30%/20%)=3.66%¤ BrazilTotalERP=MatureMarketPremium+CRP=6.00%+3.66%=9.66%
Aswath Damodaran
50
51
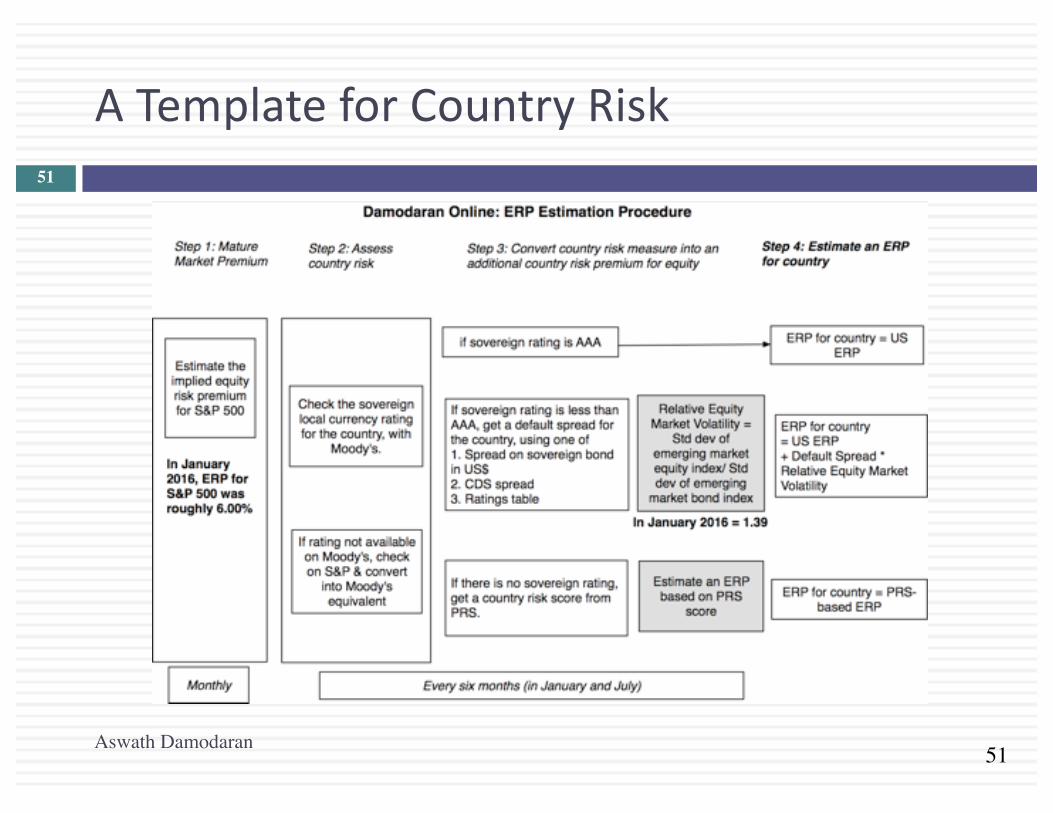
ATemplateforCountryRisk
Aswath Damodaran
51
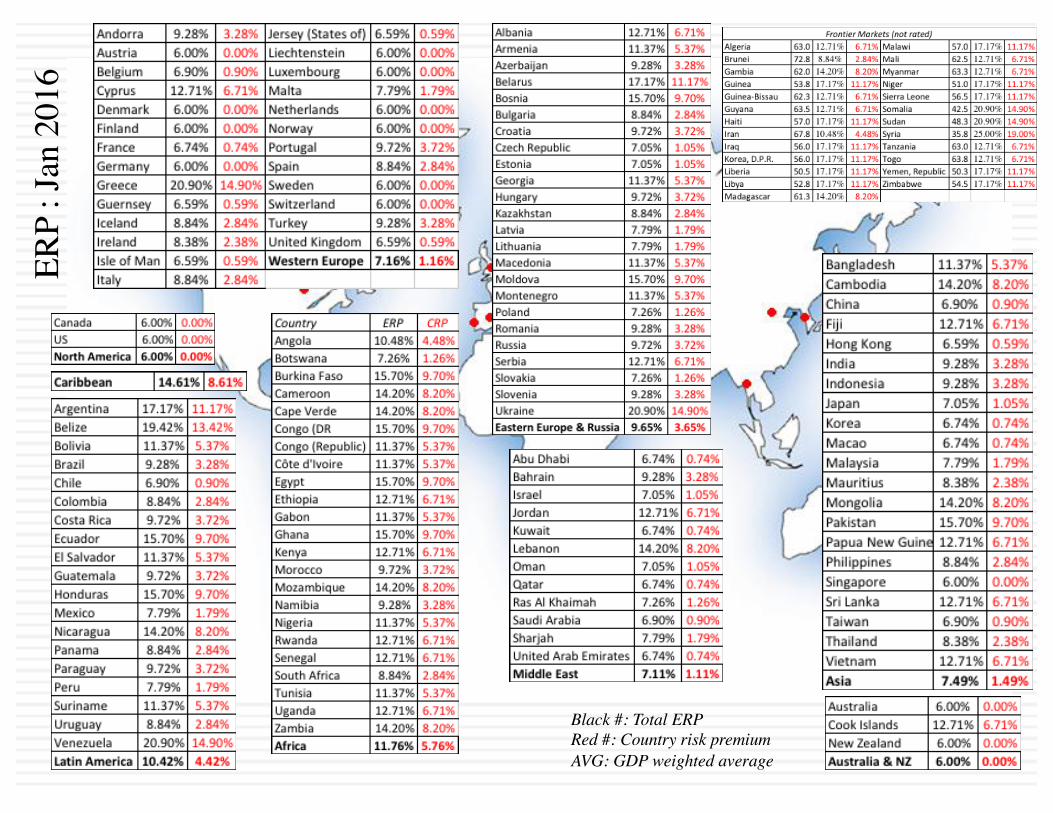
Black #: Total ERPRed #: Country risk premiumAVG: GDP weighted average
ERP
: Jan
201
6

53
FromCountryEquityRiskPremiumstoCorporateEquityRiskpremiums
¨ Approach1:Assumethateverycompanyinthecountryisequallyexposedtocountryrisk.Inthiscase,¤ E(Return)=RiskfreeRate+CRP+Beta(MatureERP)¤ Implicitly,thisiswhatyouareassumingwhenyouusethelocalGovernment’s
dollarborrowingrateasyourriskfreerate.¨ Approach2:Assumethatacompany’sexposuretocountryriskissimilar
toitsexposuretoothermarketrisk.¤ E(Return)=RiskfreeRate+Beta(MatureERP+CRP)
¨ Approach3:Treatcountryriskasaseparateriskfactorandallowfirmstohavedifferentexposurestocountryrisk(perhapsbasedupontheproportionoftheirrevenuescomefromnon-domesticsales)¤ E(Return)=RiskfreeRate+b (MatureERP)+l (CRP)
MatureERP=MaturemarketEquityRiskPremiumCRP=Additionalcountryriskpremium
Aswath Damodaran
53

54
Approaches1&2:Estimatingcountryriskpremiumexposure
¨ LocationbasedCRP:Thestandardapproachinvaluationistoattachacountryriskpremiumtoacompanybaseduponitscountryofincorporation.Thus,ifyouareanIndiancompany,youareassumedtobeexposedtotheIndiancountryriskpremium.Adevelopedmarketcompanyisassumedtobeunexposedtoemergingmarketrisk.
¨ Operation-basedCRP:Thereisamorereasonablemodifiedversion.Thecountryriskpremiumforacompanycanbecomputedasaweightedaverageofthecountryriskpremiumsofthecountriesthatitdoesbusinessin,withtheweightsbaseduponrevenuesoroperatingincome.Ifacompanyisexposedtoriskindozensofcountries,youcantakeaweightedaverageoftheriskpremiumsbyregion.
Aswath Damodaran
54

55
OperationbasedCRP:SingleversusMultipleEmergingMarkets
¨ Singleemergingmarket:Embraer,in2004,reportedthatitderived3%ofitsrevenuesinBrazilandthebalancefrommaturemarkets.ThematuremarketERPin2004was5%andBrazil’sCRPwas7.89%.
¨ Multipleemergingmarkets:Ambev,theBrazilian-basedbeveragecompany,reportedrevenuesfromthefollowingcountriesduring2011.
Aswath Damodaran
55

56
Extendingtoamultinational:RegionalbreakdownCocaCola’srevenuebreakdownandERPin2012
Things to watch out for1. Aggregation across regions. For instance, the Pacific region often includes Australia & NZ with Asia2. Obscure aggregations including Eurasia and Oceania
56

57
Twoproblemswiththeseapproaches..
¨ Focusjustonrevenues:Totheextentthatrevenuesaretheonlyvariablethatyouconsider,whenweightingriskexposureacrossmarkets,youmaybemissingotherexposurestocountryrisk.Forinstance,anemergingmarketcompanythatgetsthebulkofitsrevenuesoutsidethecountry(inadevelopedmarket)maystillhaveallofitsproductionfacilitiesintheemergingmarket.
¨ Exposurenotadjustedorbaseduponbeta:Totheextentthatthecountryriskpremiumismultipliedbyabeta,weareassumingthatbetainadditiontomeasuringexposuretoallothermacroeconomicriskalsomeasuresexposuretocountryrisk.
Aswath Damodaran
57

58
AProduction-basedERP:RoyalDutchShellin2015
Aswath Damodaran
58
Country Oil&GasProduction %ofTotal ERPDenmark 17396 3.83% 6.20%Italy 11179 2.46% 9.14%Norway 14337 3.16% 6.20%UK 20762 4.57% 6.81%RestofEurope 874 0.19% 7.40%Brunei 823 0.18% 9.04%Iraq 20009 4.40% 11.37%Malaysia 22980 5.06% 8.05%Oman 78404 17.26% 7.29%Russia 22016 4.85% 10.06%RestofAsia&ME 24480 5.39% 7.74%Oceania 7858 1.73% 6.20%Gabon 12472 2.75% 11.76%Nigeria 67832 14.93% 11.76%RestofAfrica 6159 1.36% 12.17%USA 104263 22.95% 6.20%Canada 8599 1.89% 6.20%Brazil 13307 2.93% 9.60%RestofLatinAmerica 576 0.13% 10.78%RoyalDutchShell 454326 100.00% 8.26%

59
Approach3:Estimatealambdaforcountryrisk
¨ Countryriskexposureisaffectedbywhereyougetyourrevenuesandwhereyourproductionhappens,butthereareahostofothervariablesthatalsoaffectthisexposure,including:¤ Useofriskmanagementproducts:Companiescanusebothoptions/futures
marketsandinsurancetohedgesomeorasignificantportionofcountryrisk.¤ Government“national”interests:Therearesectorsthatareviewedasvitalto
thenationalinterests,andgovernmentsoftenplayakeyroleinthesecompanies,eitherofficiallyorunofficially.Thesesectorsaremoreexposedtocountryrisk.
¨ Itisconceivablethatthereisarichermeasureofcountryriskthatincorporatesallofthevariablesthatdrivecountryriskinonemeasure.ThatwaymyrationalewhenIdevised“lambda”asmymeasureofcountryriskexposure.
Aswath Damodaran
59

60
ARevenue-basedLambda
¨ Thefactor“l” measurestherelativeexposureofafirmtocountryrisk.Onesimplisticsolutionwouldbetodothefollowing:l =%ofrevenuesdomesticallyfirm/%ofrevenuesdomesticallyaverage firm
¨ Considertwofirms– TataMotorsandTataConsultingServices,bothIndiancompanies.In2008-09,TataMotorsgotabout91.37%ofitsrevenuesinIndiaandTCSgot7.62%.TheaverageIndianfirmgetsabout80%ofitsrevenuesinIndia:l TataMotors=91%/80%=1.14l TCS=7.62%/80%=0.09
¨ Therearetwoimplications¤ Acompany’sriskexposureisdeterminedbywhereitdoesbusinessand
notbywhereitisincorporated.¤ Firmsmightbeabletoactivelymanagetheircountryriskexposures

61
APrice/ReturnbasedLambda
Embraer versus C Bond: 2000-2003
Return on C-Bond
20100-10-20-30
Ret
urn
on E
mbr
aer
40
20
0
-20
-40
-60
Embratel versus C Bond: 2000-2003
Return on C-Bond
20100-10-20-30
Ret
urn
on E
mb r
a tel
100
80
60
40
20
0
-20
-40
-60
-80
ReturnEmbraer = 0.0195 + 0.2681 ReturnC BondReturnEmbratel = -0.0308 + 2.0030 ReturnC Bond
Aswath Damodaran
61

62
EstimatingaUSDollarCostofEquityforEmbraer- September2004
¨ AssumethatthebetaforEmbraeris1.07,andthattheUS$riskfreerateusedis4%.AlsoassumethattheriskpremiumfortheUSis5%andthecountryriskpremiumforBrazilis7.89%.Finally,assumethatEmbraergets3%ofitsrevenuesinBrazil&therestintheUS.
¨ Therearefiveestimatesof$costofequityforEmbraer:¤ Approach1:ConstantexposuretoCRP,LocationCRP
n E(Return)=4%+1.07(5%)+7.89%=17.24%¤ Approach2:ConstantexposuretoCRP,OperationCRP
n E(Return)=4%+1.07(5%)+(0.03*7.89%+0.97*0%)=9.59%¤ Approach3:BetaexposuretoCRP,LocationCRP
n E(Return)=4%+1.07(5%+7.89%)=17.79%¤ Approach4:BetaexposuretoCRP,OperationCRP
n E(Return)=4%+1.07(5%+(0.03*7.89%+0.97*0%))=9.60%¤ Approach5:LambdaexposuretoCRP
n E(Return)=4%+1.07(5%)+0.27(7.89%)=11.48%
Aswath Damodaran
62

63
ValuingEmergingMarketCompanieswithsignificantexposureindevelopedmarkets
¨ Theconventionalpracticeininvestmentbankingistoaddthecountryequityriskpremiumontothecostofequityforeveryemergingmarketcompany,notwithstandingitsexposuretoemergingmarketrisk.Thus,in2004,Embraerwouldhavebeenvaluedwithacostofequityof17-18%eventhoughitgetsonly3%ofitsrevenuesinBrazil.Asaninvestor,whichofthefollowingconsequencesdoyouseefromthisapproach?
a. Emergingmarketcompanieswithsubstantialexposureindevelopedmarketswillbesignificantlyovervaluedbyequityresearchanalysts.
b. Emergingmarketcompanieswithsubstantialexposureindevelopedmarketswillbesignificantlyundervaluedbyequityresearchanalysts.Canyouconstructaninvestmentstrategytotakeadvantageofthemisvaluation?Whatwouldneedtohappenforyoutomakemoneyofthisstrategy?
Aswath Damodaran
63

64
ImpliedEquityPremiums
¨ Let’sstartwithageneralproposition.Ifyouknowthepricepaidforanassetandhaveestimatesoftheexpectedcashflowsontheasset,youcanestimatetheIRRofthesecashflows.Ifyoupaidtheprice,thisiswhatyouhavepricedtheassettoearn(asanexpectedreturn).
¨ Ifyouassumethatstocksarecorrectlypricedintheaggregateandyoucanestimatetheexpectedcashflowsfrombuyingstocks,youcanestimatetheexpectedrateofreturnonstocksbyfindingthatdiscountratethatmakesthepresentvalueequaltothepricepaid.Subtractingouttheriskfreerateshouldyieldanimpliedequityriskpremium.
¨ Thisimpliedequitypremiumisaforwardlookingnumberandcanbeupdatedasoftenasyouwant(everyminuteofeveryday,ifyouaresoinclined).
Aswath Damodaran
64

65
ImpliedEquityPremiums:January2008
¨ Wecanusetheinformationinstockpricestobackouthowriskaversethemarketisandhowmuchofariskpremiumitisdemanding.
¨ Ifyoupaythecurrentleveloftheindex,youcanexpecttomakeareturnof8.39%onstocks(whichisobtainedbysolvingforrinthefollowingequation)
¨ ImpliedEquityriskpremium=Expectedreturnonstocks- Treasurybondrate=8.39%- 4.02%=4.37%
€
1468.36 =61.98(1+ r)
+65.08(1+ r)2
+68.33(1+ r)3
+71.75(1+ r)4
+75.34(1+ r)5
+75.35(1.0402)
(r − .0402)(1+ r)5
January 1, 2008S&P 500 is at 1468.364.02% of 1468.36 = 59.03
Between 2001 and 2007 dividends and stock buybacks averaged 4.02% of the index each year.
Analysts expect earnings to grow 5% a year for the next 5 years. We will assume that dividends & buybacks will keep pace..Last year’s cashflow (59.03) growing at 5% a year
After year 5, we will assume that earnings on the index will grow at 4.02%, the same rate as the entire economy (= riskfree rate).
61.98 65.08 68.33 71.75 75.34
Aswath Damodaran
65

66
Ayearthatmadeadifference..TheimpliedpremiuminJanuary2009
Year Market value of index Dividends Buybacks Cash to equity Dividend yield Buyback yield Total yield2001 1148.09 15.74 14.34 30.08 1.37% 1.25% 2.62%2002 879.82 15.96 13.87 29.83 1.81% 1.58% 3.39%2003 1111.91 17.88 13.70 31.58 1.61% 1.23% 2.84%2004 1211.92 19.01 21.59 40.60 1.57% 1.78% 3.35%2005 1248.29 22.34 38.82 61.17 1.79% 3.11% 4.90%2006 1418.30 25.04 48.12 73.16 1.77% 3.39% 5.16%2007 1468.36 28.14 67.22 95.36 1.92% 4.58% 6.49%2008 903.25 28.47 40.25 68.72 3.15% 4.61% 7.77%
Normalized 903.25 28.47 24.11 52.584 3.15% 2.67% 5.82%
January 1, 2009S&P 500 is at 903.25Adjusted Dividends & Buybacks for 2008 = 52.58
In 2008, the actual cash returned to stockholders was 68.72. However, there was a 41% dropoff in buybacks in Q4. We reduced the total buybacks for the year by that amount.
Analysts expect earnings to grow 4% a year for the next 5 years. We will assume that dividends & buybacks will keep pace..Last year’s cashflow (52.58) growing at 4% a year
After year 5, we will assume that earnings on the index will grow at 2.21%, the same rate as the entire economy (= riskfree rate).
54.69 56.87 59.15 61.52 63.98
Expected Return on Stocks (1/1/09) = 8.64%Riskfree rate = 2.21%Equity Risk Premium = 6.43%
903.25 = 54.69(1+ r)
+56.87(1+ r)2 +
59.15(1+ r)3 +
61.52(1+ r)4 +
63.98(1+ r)5 +
63.98(1.0221)(r −.0221)(1+ r)5
Aswath Damodaran
66

67
TheAnatomyofaCrisis:ImpliedERPfromSeptember12,2008toJanuary1,2009
Aswath Damodaran
67

68
AnUpdatedEquityRiskPremium:January2016
Aswath Damodaran
68
Base year cash flow (last 12 mths)Dividends (TTM): 42.66+ Buybacks (TTM): 63.43
= Cash to investors (TTM): 106.09
Expected growth in next 5 yearsTop down analyst estimate of earnings
growth for S&P 500: 5.55%
Risk free rate = T.Bond rate on 1/1/16= 2.27%
r = Implied Expected Return on Stocks = 8.39%
S&P 500 on 1/1/16= 2043.94
Minus
Implied Equity Risk Premium (1/1/16) = 8.39% - 2.27% = 6.12%
Equals
Earnings and Cash flows grow @2.27% (set equal to risk free rate) a year forever.
Payout ratio assumed to stay stable. 106.09 growing @ 5.55% a year
Last12mths 1 2 3 4 5 TerminalYearDividends+Buybacks 106.09 111.99$ 118.21$ 124.77$ 131.70$ 139.02$ 142.17
2043.94 = 111.99(1 + ,) +118.21(1 + ,)/ +
124.77(1 + ,)1 +
131.70(1 + ,)2 +
139.02(1 + ,)3 +
142.17(, − .0227)(1 + ,)3
You have to solve for the discount rate (r). I
used the solver or Goal seek function in Excel

69
ImpliedPremiumsintheUS:1960-2015
Aswath Damodaran
0.00%
1.00%
2.00%
3.00%
4.00%
5.00%
6.00%
7.00%
19601961196219631964196519661967196819691970197119721973197419751976197719781979198019811982198319841985198619871988198919901991199219931994199519961997199819992000200120022003200420052006200720082009201020112012201320142015
Impl
ied
Prem
ium
Year
Implied Premium for US Equity Market: 1960-2015

70
ABuybackAdjustedVersionoftheUSERP
Aswath Damodaran
70

71
ImpliedPremiumversusRiskFreeRate
Aswath Damodaran
71
0.00%
5.00%
10.00%
15.00%
20.00%
25.00%19
6119
6219
6319
6419
6519
6619
6719
6819
6919
7019
7119
7219
7319
7419
7519
7619
7719
7819
7919
8019
8119
8219
8319
8419
8519
8619
8719
8819
8919
9019
9119
9219
9319
9419
9519
9619
9719
9819
9920
0020
0120
0220
0320
0420
0520
0620
0720
0820
0920
1020
1120
1220
1320
1420
15
Implied ERP and Risk free Rates
Implied Premium (FCFE)
T. Bond Rate
Expected Return on Stocks = T.Bond Rate + Equity Risk Premium
Since 2008, the expected return on stocks has stagnated at about 8%, but the risk free rate has dropped dramatically.
72
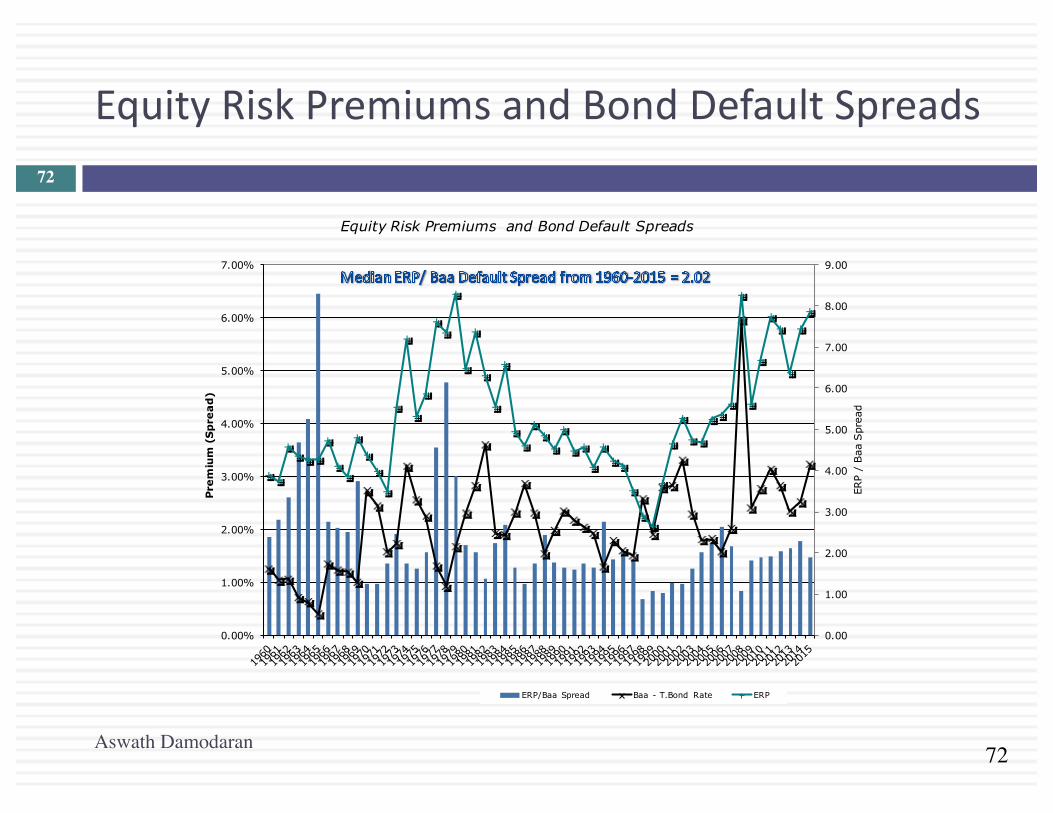
EquityRiskPremiumsandBondDefaultSpreads
Aswath Damodaran
72
0.00
1.00
2.00
3.00
4.00
5.00
6.00
7.00
8.00
9.00
0.00%
1.00%
2.00%
3.00%
4.00%
5.00%
6.00%
7.00%
ERP
/ Baa
Spr
ead
Pre
miu
m (
Sp
rea
d)
Equity Risk Premiums and Bond Default Spreads
ERP/Baa Spread Baa - T.Bond Rate ERP
73
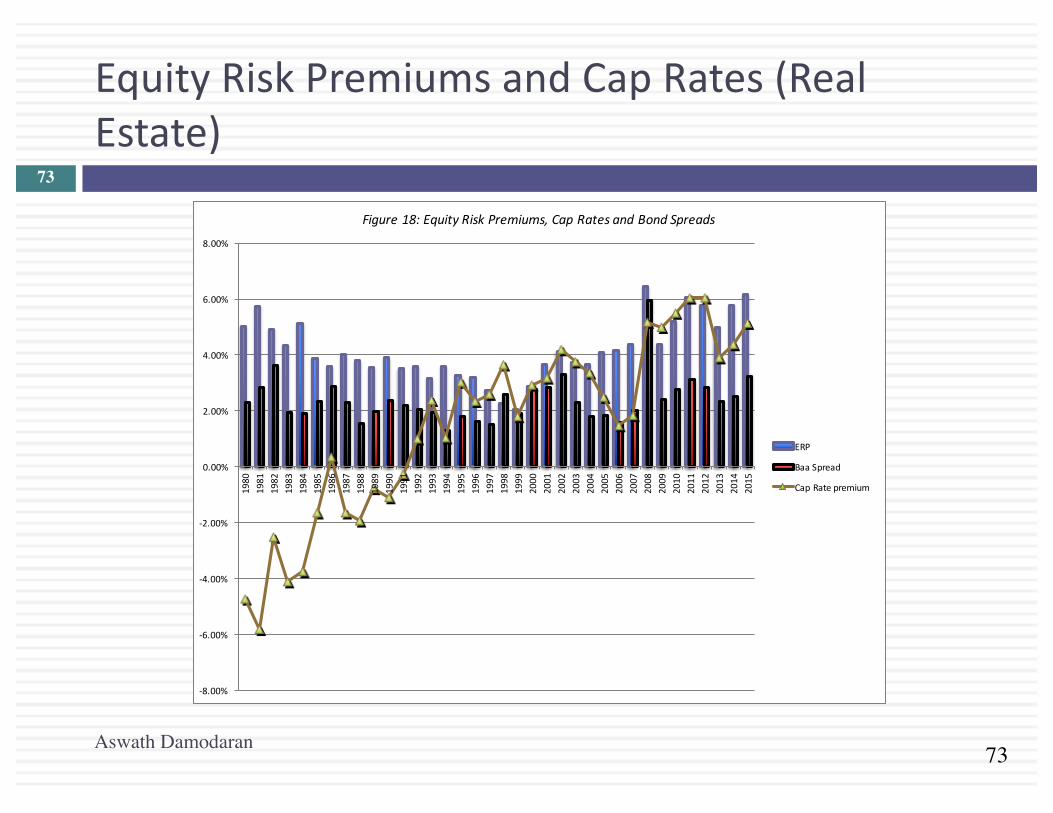
EquityRiskPremiumsandCapRates(RealEstate)
Aswath Damodaran
73
-8.00%
-6.00%
-4.00%
-2.00%
0.00%
2.00%
4.00%
6.00%
8.00%1980
1981
1982
1983
1984
1985
1986
1987
1988
1989
1990
1991
1992
1993
1994
1995
1996
1997
1998
1999
2000
2001
2002
2003
2004
2005
2006
2007
2008
2009
2010
2011
2012
2013
2014
2015
Figure18:EquityRiskPremiums,CapRatesandBondSpreads
ERP
BaaSpread
CapRatepremium

74
Whyimpliedpremiumsmatter?
¨ Inmanyinvestmentbanks,itiscommonpractice(especiallyincorporatefinancedepartments)tousehistoricalriskpremiums(andarithmeticaveragesatthat)asriskpremiumstocomputecostofequity.Ifallanalystsinthedepartmentusedthearithmeticaveragepremium(forstocksoverT.Bills)for1928-2015of7.92%tovaluestocksinJanuary2014,giventheimpliedpremiumof6.12%,whataretheylikelytofind?
a. Thevaluestheyobtainwillbetoolow(moststockswilllookovervalued)
b. Thevaluestheyobtainwillbetoohigh(moststockswilllookundervalued)
c. Thereshouldbenosystematicbiasaslongastheyusethesamepremiumtovalueallstocks.
Aswath Damodaran
74

75
Whichequityriskpremiumshouldyouuse?
Ifyouassume this Premium touse
Premiumsrevertbacktohistoricalnormsandyourtimeperiodyieldsthesenorms
Historical riskpremium
Marketiscorrect intheaggregateorthatyourvaluationshouldbemarketneutral
Current impliedequityriskpremium
Marker makesmistakesevenintheaggregatebutiscorrectovertime
Averageimpliedequity riskpremiumovertime.
Aswath Damodaran
75
Predictor Correlation with implied
premium next year
Correlation with actual
return- next 5 years
Correlation with actual return
– next 10 years
Current implied premium 0.750 0.475 0.541
Average implied premium: Last 5
years
0.703 0.541 0.747
Historical Premium -0.476 -0.442 -0.469
Default Spread based premium 0.035 0.234 0.225

76
AnERPfortheSensex
¨ Inputsforthecomputation¤ Sensexon9/5/07=15446¤ Dividendyieldonindex=3.05%¤ Expectedgrowthrate- next5years=14%¤ Growthratebeyondyear5=6.76%(setequaltoriskfree rate)
¨ Solvingfortheexpectedreturn:
¨ Expectedreturnonstocks=11.18%¨ ImpliedequityriskpremiumforIndia=11.18%- 6.76%=
4.42%€
15446 =537.06(1+ r)
+612.25(1+ r)2
+697.86(1+ r)3
+795.67(1+ r)4
+907.07(1+ r)5
+907.07(1.0676)(r − .0676)(1+ r)5
Aswath Damodaran
76
77
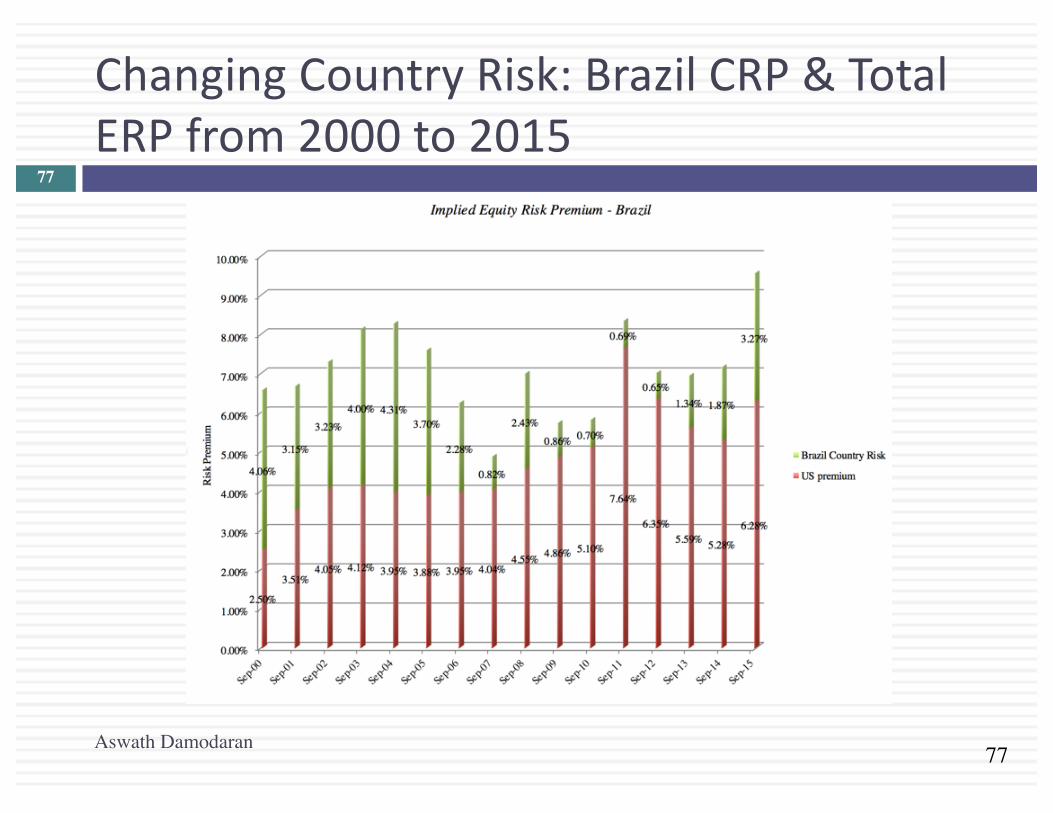
ChangingCountryRisk:BrazilCRP&TotalERPfrom2000to2015
Aswath Damodaran
77
78
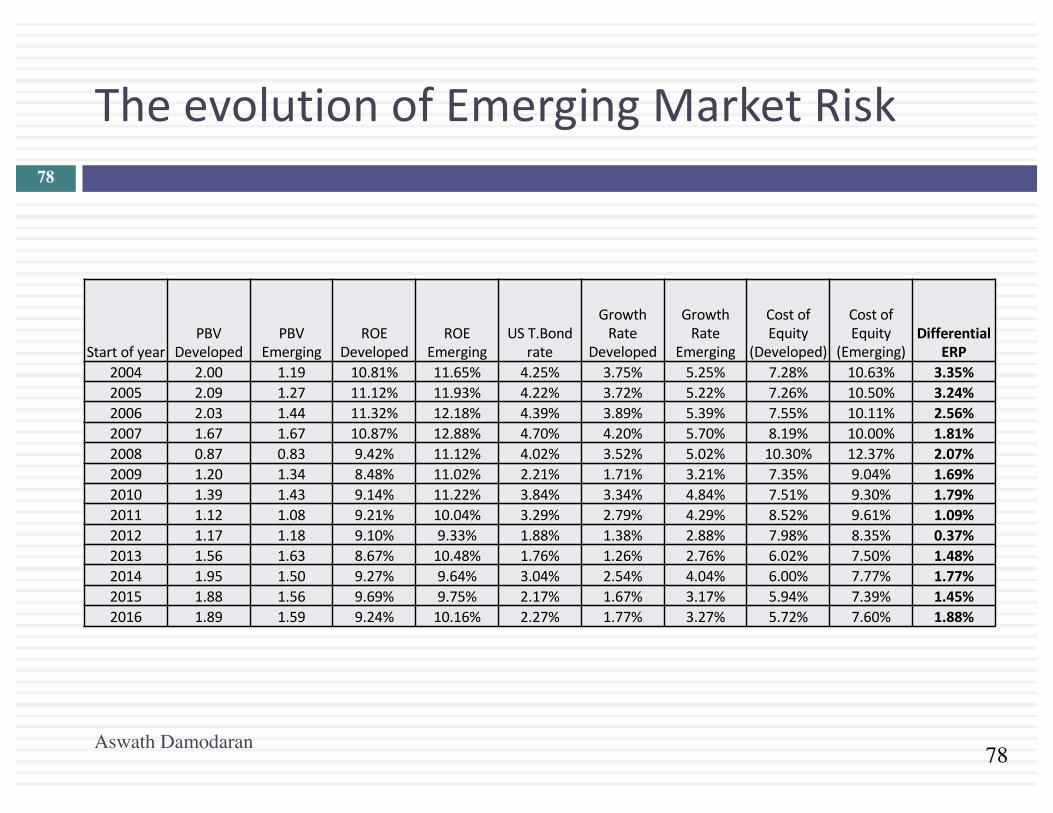
TheevolutionofEmergingMarketRisk
Aswath Damodaran
78
StartofyearPBV
DevelopedPBV
EmergingROE
DevelopedROE
EmergingUST.Bond
rate
GrowthRate
Developed
GrowthRate
Emerging
CostofEquity
(Developed)
CostofEquity
(Emerging)Differential
ERP2004 2.00 1.19 10.81% 11.65% 4.25% 3.75% 5.25% 7.28% 10.63% 3.35%2005 2.09 1.27 11.12% 11.93% 4.22% 3.72% 5.22% 7.26% 10.50% 3.24%2006 2.03 1.44 11.32% 12.18% 4.39% 3.89% 5.39% 7.55% 10.11% 2.56%2007 1.67 1.67 10.87% 12.88% 4.70% 4.20% 5.70% 8.19% 10.00% 1.81%2008 0.87 0.83 9.42% 11.12% 4.02% 3.52% 5.02% 10.30% 12.37% 2.07%2009 1.20 1.34 8.48% 11.02% 2.21% 1.71% 3.21% 7.35% 9.04% 1.69%2010 1.39 1.43 9.14% 11.22% 3.84% 3.34% 4.84% 7.51% 9.30% 1.79%2011 1.12 1.08 9.21% 10.04% 3.29% 2.79% 4.29% 8.52% 9.61% 1.09%2012 1.17 1.18 9.10% 9.33% 1.88% 1.38% 2.88% 7.98% 8.35% 0.37%2013 1.56 1.63 8.67% 10.48% 1.76% 1.26% 2.76% 6.02% 7.50% 1.48%2014 1.95 1.50 9.27% 9.64% 3.04% 2.54% 4.04% 6.00% 7.77% 1.77%2015 1.88 1.56 9.69% 9.75% 2.17% 1.67% 3.17% 5.94% 7.39% 1.45%2016 1.89 1.59 9.24% 10.16% 2.27% 1.77% 3.27% 5.72% 7.60% 1.88%
RelativeRiskMeasures
DiscountRates:III79
Aswath Damodaran
80
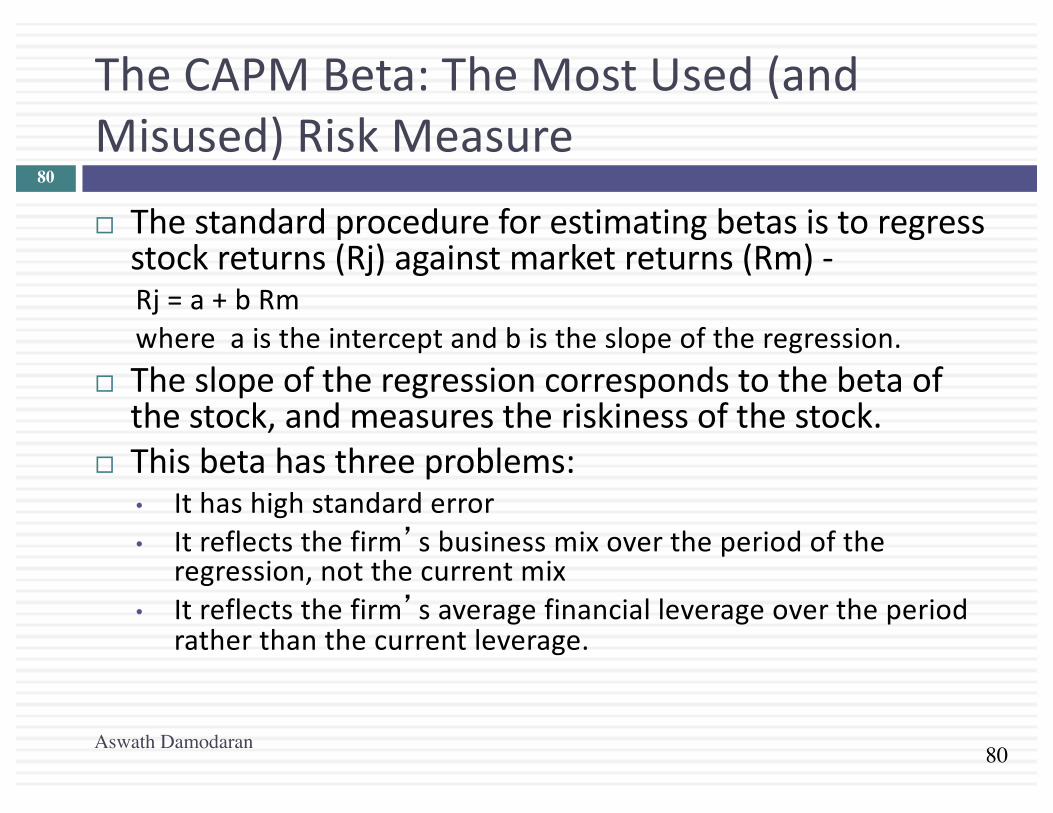
TheCAPMBeta:TheMostUsed(andMisused)RiskMeasure
¨ Thestandardprocedureforestimatingbetasistoregressstockreturns(Rj)againstmarketreturns(Rm)-Rj =a+bRmwhereaistheinterceptandbistheslopeoftheregression.
¨ Theslopeoftheregressioncorrespondstothebetaofthestock,andmeasurestheriskinessofthestock.
¨ Thisbetahasthreeproblems:• Ithashighstandarderror• Itreflectsthefirm’sbusinessmixovertheperiodofthe
regression,notthecurrentmix• Itreflectsthefirm’saveragefinancialleverageovertheperiod
ratherthanthecurrentleverage.
Aswath Damodaran
80

81
Unreliable,whenitlooksbad..
Aswath Damodaran
81
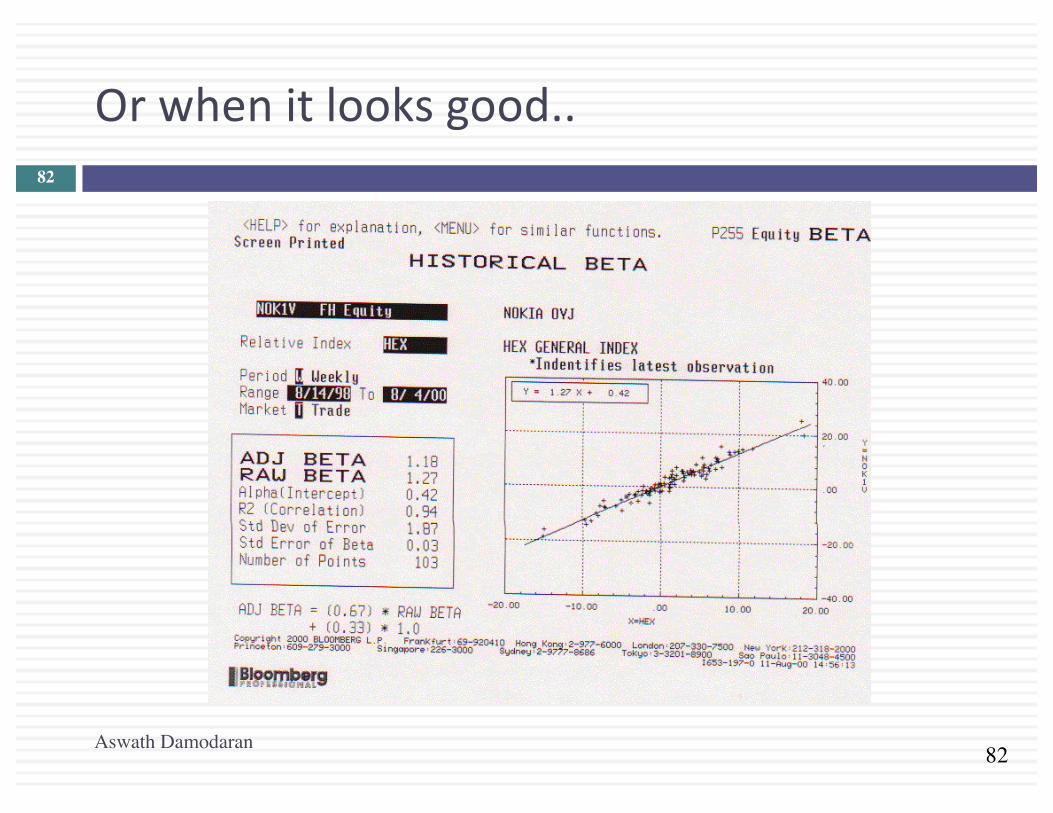
82
Orwhenitlooksgood..
Aswath Damodaran
82

Onesliceofhistory..83
Aswath Damodaran
During this time period, Valeant was a stock under siege, without a CEO, under legal pressure & lacking financials.
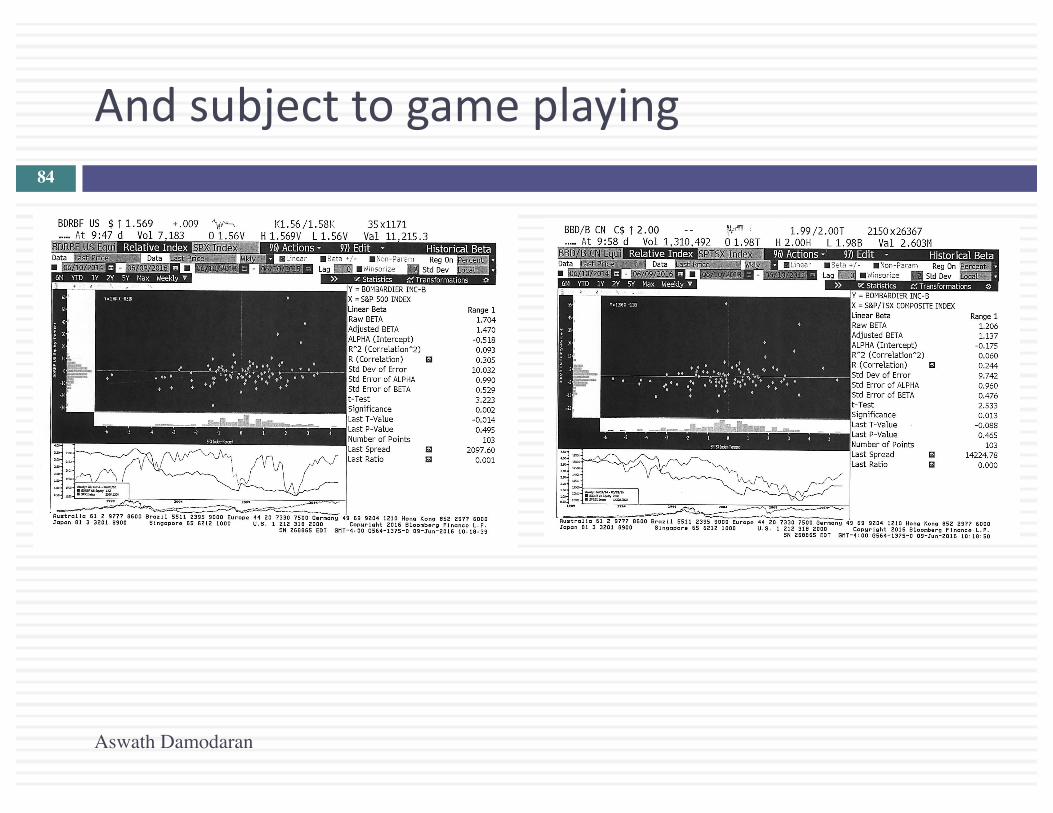
Andsubjecttogameplaying84
Aswath Damodaran

85
MeasuringRelativeRisk:Youdon’tlikebetasormodernportfoliotheory?Noproblem.
Aswath Damodaran
85
86
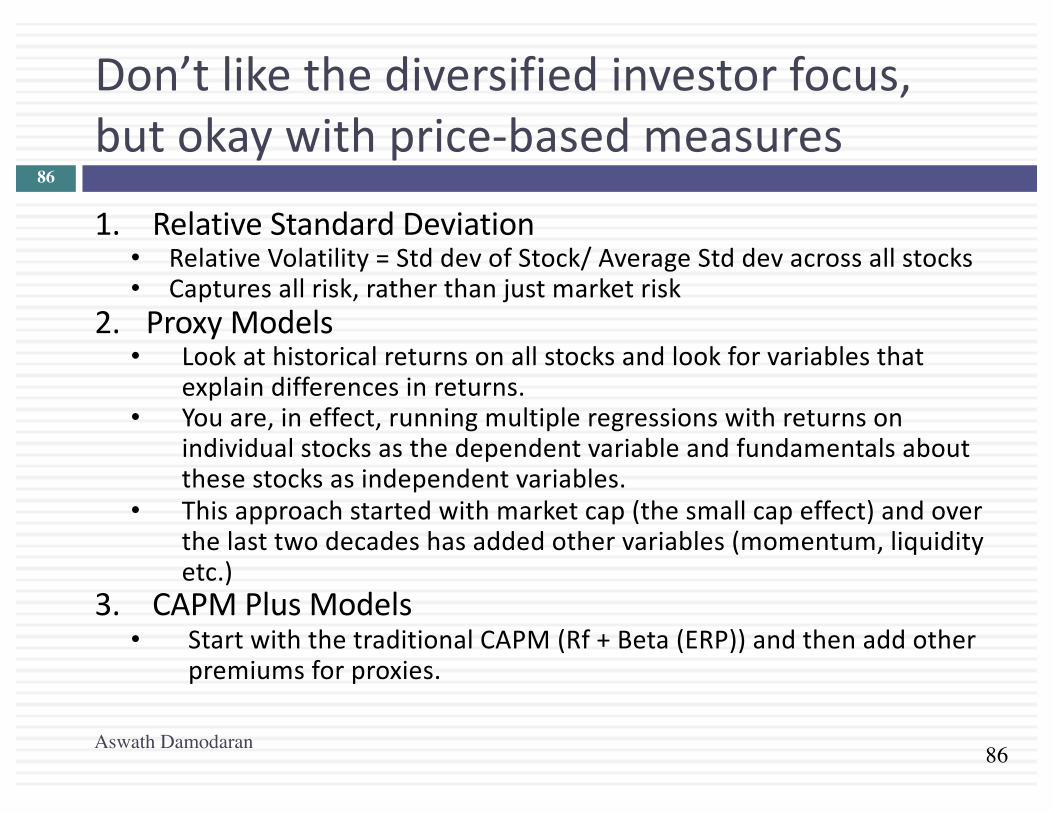
Don’tlikethediversifiedinvestorfocus,butokaywithprice-basedmeasures
1. RelativeStandardDeviation• RelativeVolatility=Std devofStock/AverageStd devacrossallstocks• Capturesallrisk,ratherthanjustmarketrisk
2. ProxyModels• Lookathistoricalreturnsonallstocksandlookforvariablesthat
explaindifferencesinreturns.• Youare,ineffect,runningmultipleregressionswithreturnson
individualstocksasthedependentvariableandfundamentalsaboutthesestocksasindependentvariables.
• Thisapproachstartedwithmarketcap(thesmallcapeffect)andoverthelasttwodecadeshasaddedothervariables(momentum,liquidityetc.)
3. CAPMPlusModels• StartwiththetraditionalCAPM(Rf +Beta(ERP))andthenaddother
premiumsforproxies.
Aswath Damodaran
86

87
Don’tliketheprice-basedapproach..
1. Accountingriskmeasures:Totheextentthatyoudon’ttrustmarket-pricedbasedmeasuresofrisk,youcouldcomputerelativeriskmeasuresbasedon• Accountingearningsvolatility:Computeanaccountingbetaorrelative
volatility• Balancesheetratios:Youcouldcomputeariskscorebaseduponaccounting
ratioslikedebtratiosorcashholdings(akintodefaultriskscoresliketheZscore)
2. QualitativeRiskModels:Inthesemodels,riskassessmentsarebasedatleastpartiallyonqualitativefactors(qualityofmanagement).
3. Debtbasedmeasures:Youcanestimateacostofequity,baseduponanobservablecostsofdebtforthecompany.• Costofequity=Costofdebt*Scalingfactor• Thescalingfactorcanbecomputedfromimpliedvolatilities.
Aswath Damodaran
87

88
DeterminantsofBetas&RelativeRisk
Beta of Firm (Unlevered Beta)
Beta of Equity (Levered Beta)
Nature of product or service offered by company:Other things remaining equal, the more discretionary the product or service, the higher the beta.
Operating Leverage (Fixed Costs as percent of total costs):Other things remaining equal the greater the proportion of the costs that are fixed, the higher the beta of the company.
Financial Leverage:Other things remaining equal, the greater the proportion of capital that a firm raises from debt,the higher its equity beta will be
Implications1. Cyclical companies should have higher betas than non-cyclical companies.2. Luxury goods firms should have higher betas than basic goods.3. High priced goods/service firms should have higher betas than low prices goods/services firms.4. Growth firms should have higher betas.
Implications1. Firms with high infrastructure needs and rigid cost structures should have higher betas than firms with flexible cost structures.2. Smaller firms should have higher betas than larger firms.3. Young firms should have higher betas than more mature firms.
ImplciationsHighly levered firms should have highe betas than firms with less debt.Equity Beta (Levered beta) = Unlev Beta (1 + (1- t) (Debt/Equity Ratio))
Aswath Damodaran
88

89
Inaperfectworld…wewouldestimatethebetaofafirmbydoingthefollowing
Start with the beta of the business that the firm is in
Adjust the business beta for the operating leverage of the firm to arrive at the unlevered beta for the firm.
Use the financial leverage of the firm to estimate the equity beta for the firmLevered Beta = Unlevered Beta ( 1 + (1- tax rate) (Debt/Equity))
Aswath Damodaran
89
90
Adjustingforoperatingleverage…
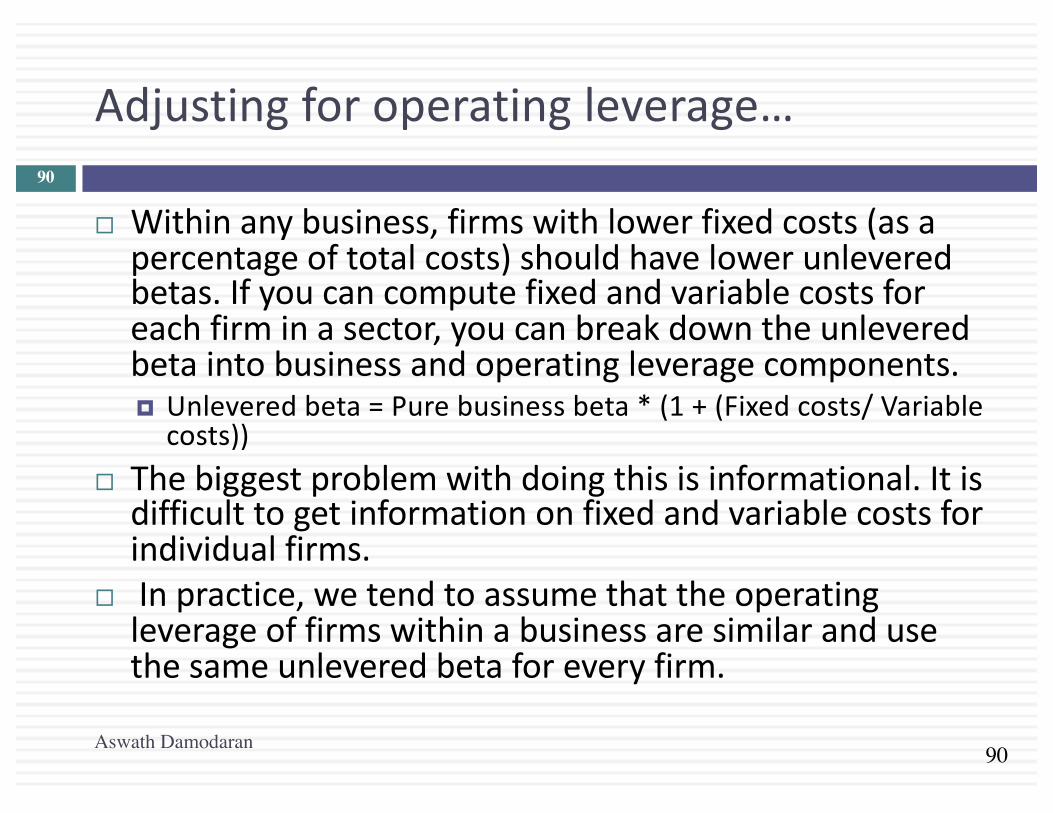
¨ Withinanybusiness,firmswithlowerfixedcosts(asapercentageoftotalcosts)shouldhavelowerunleveredbetas.Ifyoucancomputefixedandvariablecostsforeachfirminasector,youcanbreakdowntheunleveredbetaintobusinessandoperatingleveragecomponents.¤ Unleveredbeta=Purebusinessbeta*(1+(Fixedcosts/Variablecosts))
¨ Thebiggestproblemwithdoingthisisinformational.Itisdifficulttogetinformationonfixedandvariablecostsforindividualfirms.
¨ Inpractice,wetendtoassumethattheoperatingleverageoffirmswithinabusinessaresimilarandusethesameunleveredbetaforeveryfirm.
Aswath Damodaran
90

91
Adjustingforfinancialleverage…
¨ Conventionalapproach:Ifweassumethatdebtcarriesnomarketrisk(hasabetaofzero),thebetaofequityalonecanbewrittenasafunctionoftheunleveredbetaandthedebt-equityratiobL =bu (1+((1-t)D/E))Insomeversions,thetaxeffectisignoredandthereisno(1-t)intheequation.
¨ DebtAdjustedApproach:Ifbetacarriesmarketriskandyoucanestimatethebetaofdebt,youcanestimatetheleveredbetaasfollows:bL =bu (1+((1-t)D/E))-bdebt (1-t)(D/E)Whilethelatterismorerealistic,estimatingbetasfordebtcanbedifficulttodo.
Aswath Damodaran
91
92
Bottom-upBetas
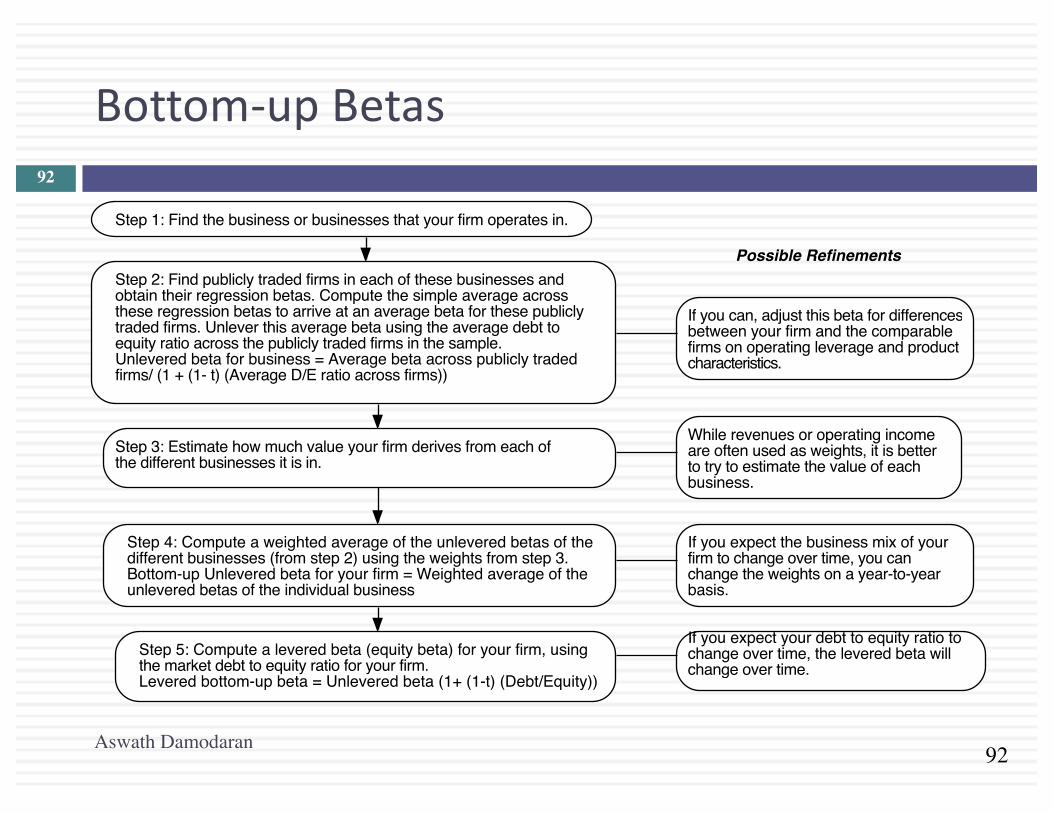
Step 1: Find the business or businesses that your firm operates in.
Step 2: Find publicly traded firms in each of these businesses and obtain their regression betas. Compute the simple average across these regression betas to arrive at an average beta for these publicly traded firms. Unlever this average beta using the average debt to equity ratio across the publicly traded firms in the sample.Unlevered beta for business = Average beta across publicly traded firms/ (1 + (1- t) (Average D/E ratio across firms))
If you can, adjust this beta for differencesbetween your firm and the comparablefirms on operating leverage and product characteristics.
Step 3: Estimate how much value your firm derives from each of the different businesses it is in.
While revenues or operating income are often used as weights, it is better to try to estimate the value of each business.
Step 4: Compute a weighted average of the unlevered betas of the different businesses (from step 2) using the weights from step 3.Bottom-up Unlevered beta for your firm = Weighted average of the unlevered betas of the individual business
Step 5: Compute a levered beta (equity beta) for your firm, using the market debt to equity ratio for your firm. Levered bottom-up beta = Unlevered beta (1+ (1-t) (Debt/Equity))
If you expect the business mix of your firm to change over time, you can change the weights on a year-to-year basis.
If you expect your debt to equity ratio to change over time, the levered beta will change over time.
Possible Refinements
Aswath Damodaran
92
93
Whybottom-upbetas?
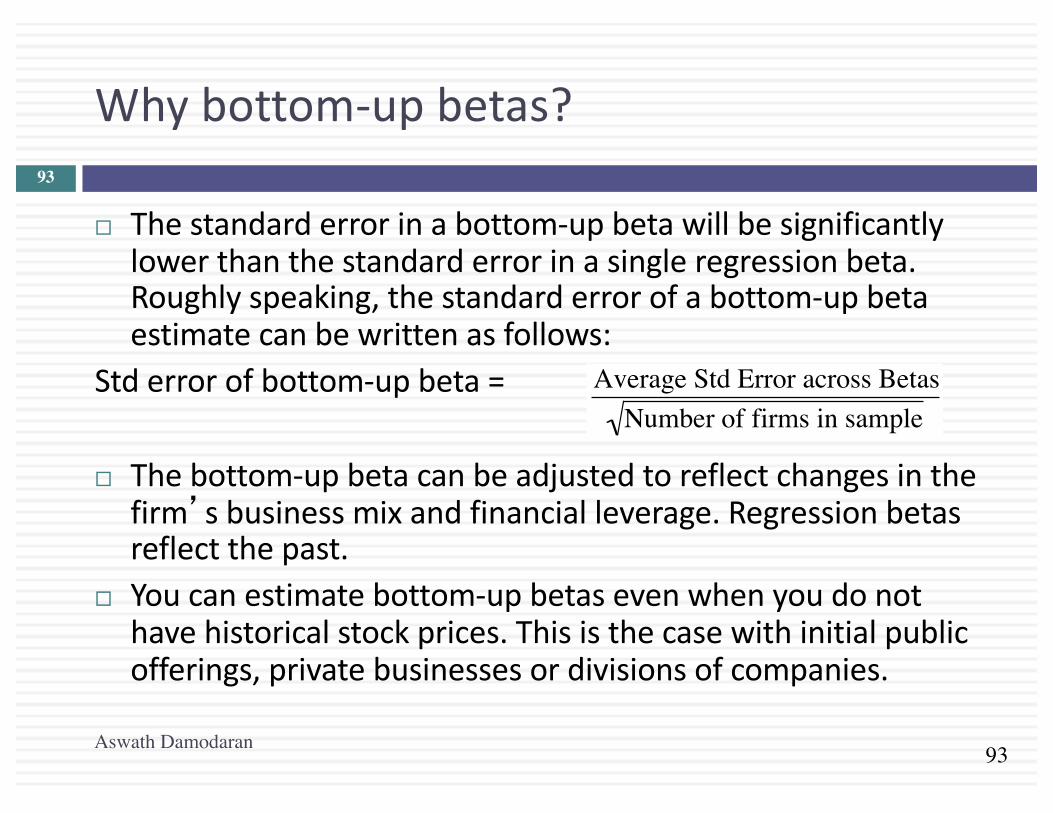
¨ Thestandarderrorinabottom-upbetawillbesignificantlylowerthanthestandarderrorinasingleregressionbeta.Roughlyspeaking,thestandarderrorofabottom-upbetaestimatecanbewrittenasfollows:
Stderrorofbottom-upbeta=
¨ Thebottom-upbetacanbeadjustedtoreflectchangesinthefirm’sbusinessmixandfinancialleverage.Regressionbetasreflectthepast.
¨ Youcanestimatebottom-upbetasevenwhenyoudonothavehistoricalstockprices.Thisisthecasewithinitialpublicofferings,privatebusinessesordivisionsofcompanies.
€
Average Std Error across BetasNumber of firms in sample
Aswath Damodaran
93

94
EstimatingBottomUpBetas&CostsofEquity:Vale
Aswath Damodaran
Business' Sample'Sample'size'
Unlevered'beta'of'business' Revenues'
Peer'Group'EV/Sales'
Value'of'Business'
Proportion'of'Vale'
Metals'&'Mining'
Global'firms'in'metals'&'mining,'Market'cap>$1'billion' 48' 0.86' $9,013' 1.97' $17,739' 16.65%'
Iron'Ore' Global'firms'in'iron'ore' 78' 0.83' $32,717' 2.48' $81,188' 76.20%'
Fertilizers'Global'specialty'chemical'firms' 693' 0.99' $3,777' 1.52' $5,741' 5.39%'
Logistics'Global'transportation'firms' 223' 0.75' $1,644' 1.14' $1,874' 1.76%'
Vale'Operations' '' '' 0.8440' $47,151' '' $106,543' 100.00%'

95
Embraer’sBottom-upBeta
Business UnleveredBeta D/ERatio LeveredbetaAerospace 0.95 18.95% 1.07
¨ LeveredBeta=UnleveredBeta(1+(1- taxrate)(D/ERatio)=0.95(1+(1-.34)(.1895))=1.07
¨ CananunleveredbetaestimatedusingU.S.andEuropeanaerospacecompaniesbeusedtoestimatethebetaforaBrazilianaerospacecompany?
a. Yesb. No
Whatconcernswouldyouhaveinmakingthisassumption?
Aswath Damodaran
95

96
GrossDebtversusNetDebtApproaches
¨ AnalystsinEuropeandLatinAmericaoftentakethedifferencebetweendebtandcash(netdebt)whencomputingdebtratiosandarriveatverydifferentvalues.
¨ ForEmbraer,usingthegrossdebtratio¤ GrossD/ERatioforEmbraer=1953/11,042=18.95%¤ LeveredBetausingGrossDebtratio=1.07
¨ Usingthenetdebtratio,weget¤ NetDebtRatioforEmbraer=(Debt- Cash)/MarketvalueofEquity
=(1953-2320)/11,042=-3.32%¤ LeveredBetausingNetDebtRatio=0.95(1+(1-.34)(-.0332))=0.93
¨ ThecostofEquityusingnetdebtleveredbetaforEmbraerwillbemuchlowerthanwiththegrossdebtapproach.ThecostofcapitalforEmbraerwillevenoutsincethedebtratiousedinthecostofcapitalequationwillnowbeanetdebtratioratherthanagrossdebtratio.
Aswath Damodaran
96
97
TheCostofEquity:ARecap
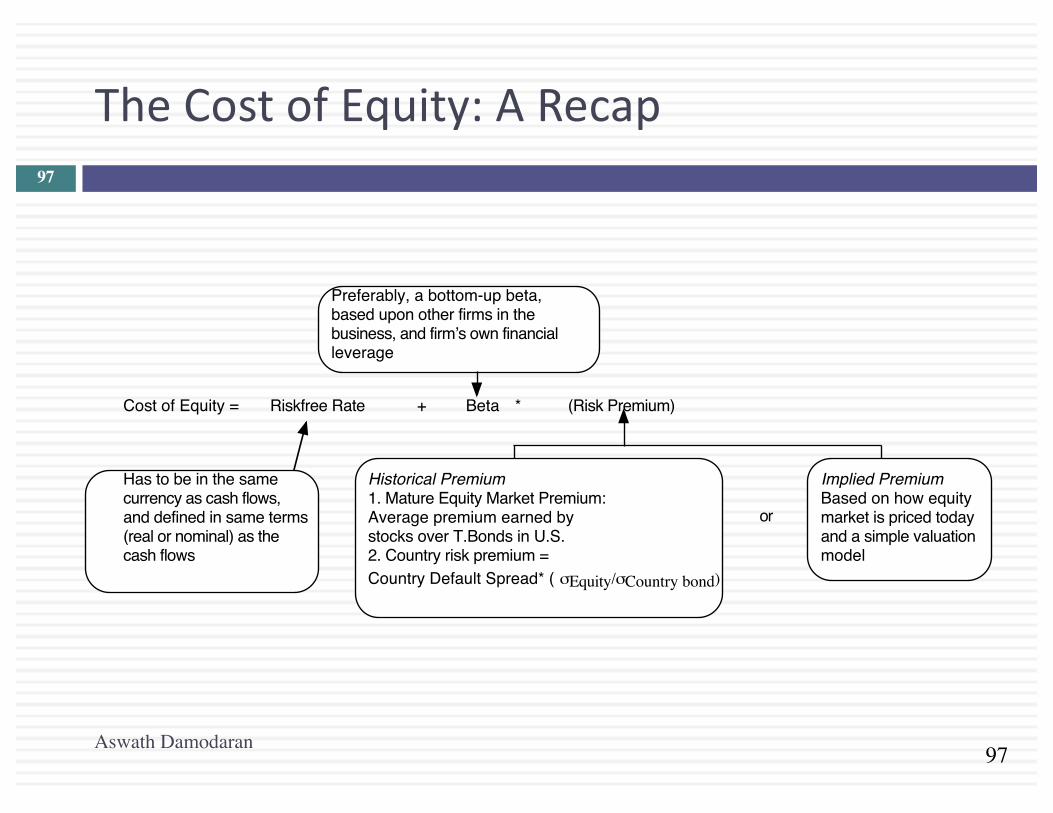
Cost of Equity = Riskfree Rate + Beta * (Risk Premium)
Has to be in the samecurrency as cash flows, and defined in same terms(real or nominal) as thecash flows
Preferably, a bottom-up beta,based upon other firms in thebusiness, and firmʼs own financialleverage
Historical Premium1. Mature Equity Market Premium:Average premium earned bystocks over T.Bonds in U.S.2. Country risk premium =Country Default Spread* ( σEquity/σCountry bond)
Implied PremiumBased on how equitymarket is priced todayand a simple valuationmodel
or
Aswath Damodaran
97

Moppingup
DiscountRates:IV98
Aswath Damodaran

99
EstimatingtheCostofDebt
¨ Thecostofdebtistherateatwhichyoucanborrowatcurrently,Itwillreflectnotonlyyourdefaultriskbutalsothelevelofinterestratesinthemarket.
¨ Thetwomostwidelyusedapproachestoestimatingcostofdebtare:¤ Lookinguptheyieldtomaturityonastraightbondoutstandingfrom
thefirm.Thelimitationofthisapproachisthatveryfewfirmshavelongtermstraightbondsthatareliquidandwidelytraded
¤ Lookinguptheratingforthefirmandestimatingadefaultspreadbasedupontherating.Whilethisapproachismorerobust,differentbondsfromthesamefirmcanhavedifferentratings.Youhavetouseamedianratingforthefirm
¨ Whenintrouble(eitherbecauseyouhavenoratingsormultipleratingsforafirm),estimateasyntheticratingforyourfirmandthecostofdebtbaseduponthatrating.
Aswath Damodaran
99
100
EstimatingSyntheticRatings
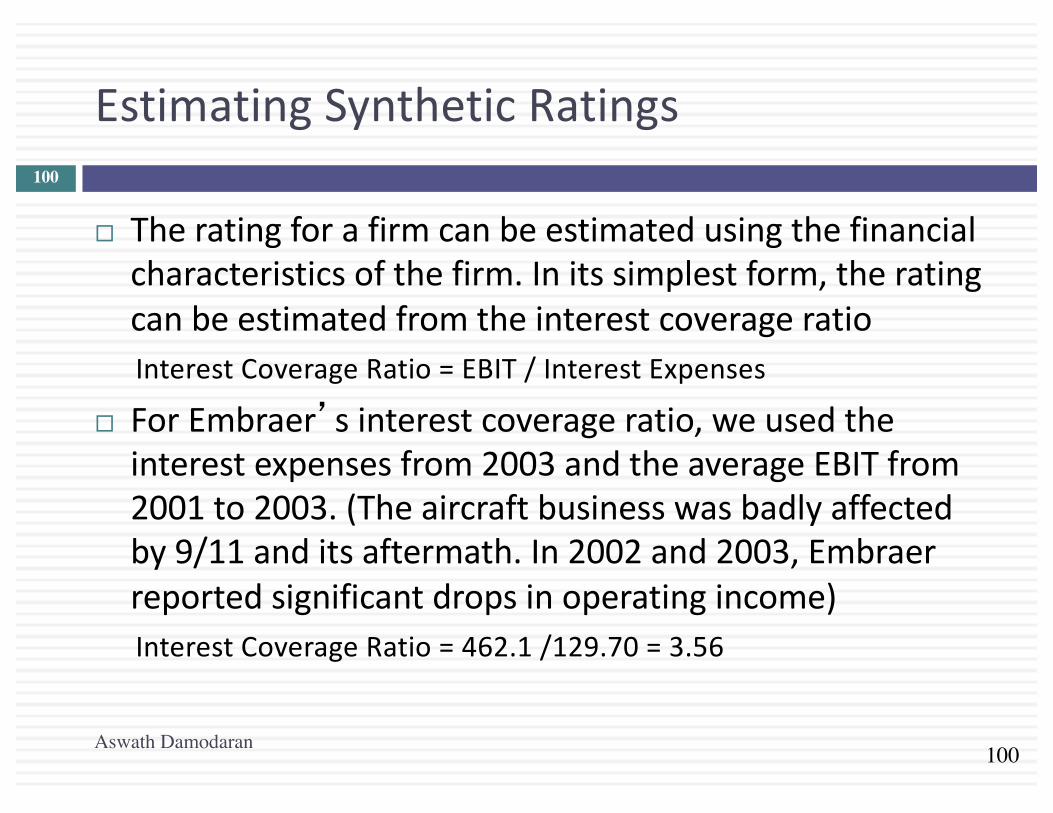
¨ Theratingforafirmcanbeestimatedusingthefinancialcharacteristicsofthefirm.Initssimplestform,theratingcanbeestimatedfromtheinterestcoverageratioInterestCoverageRatio=EBIT/InterestExpenses
¨ ForEmbraer’sinterestcoverageratio,weusedtheinterestexpensesfrom2003andtheaverageEBITfrom2001to2003.(Theaircraftbusinesswasbadlyaffectedby9/11anditsaftermath.In2002and2003,Embraerreportedsignificantdropsinoperatingincome)InterestCoverageRatio=462.1/129.70=3.56
Aswath Damodaran
100

101
InterestCoverageRatios,RatingsandDefaultSpreads:2003&2004
IfInterestCoverageRatiois EstimatedBondRating DefaultSpread(2003) DefaultSpread(2004)>8.50 (>12.50) AAA 0.75% 0.35%6.50- 8.50 (9.5-12.5) AA 1.00% 0.50%5.50- 6.50 (7.5-9.5) A+ 1.50% 0.70%4.25- 5.50 (6-7.5) A 1.80% 0.85%3.00- 4.25 (4.5-6) A– 2.00% 1.00%2.50- 3.00 (4-4.5) BBB 2.25% 1.50%2.25- 2.50 (3.5-4) BB+ 2.75% 2.00%2.00- 2.25 ((3-3.5) BB 3.50% 2.50%1.75- 2.00 (2.5-3) B+ 4.75% 3.25%1.50- 1.75 (2-2.5) B 6.50% 4.00%1.25- 1.50 (1.5-2) B– 8.00% 6.00%0.80- 1.25 (1.25-1.5) CCC 10.00% 8.00%0.65- 0.80 (0.8-1.25) CC 11.50% 10.00%0.20- 0.65 (0.5-0.8) C 12.70% 12.00%<0.20 (<0.5) D 15.00% 20.00%
¨ Thefirstnumberunderinterestcoverageratiosisforlargermarketcapcompaniesandthesecondinbracketsisforsmallermarketcapcompanies.ForEmbraer,Iusedtheinterestcoverageratiotableforsmaller/riskierfirms(thenumbersinbrackets)whichyieldsalowerratingforthesameinterestcoverageratio.
Aswath Damodaran
101

102
CostofDebtcomputations
¨ Companiesincountrieswithlowbondratingsandhighdefaultriskmightbeartheburdenofcountrydefaultrisk,especiallyiftheyaresmallerorhavealloftheirrevenueswithinthecountry.
¨ Largercompaniesthatderiveasignificantportionoftheirrevenuesinglobalmarketsmaybelessexposedtocountrydefaultrisk.Inotherwords,theymaybeabletoborrowataratelowerthanthegovernment.
¨ ThesyntheticratingforEmbraerisA-.Usingthe2004defaultspreadof1.00%,weestimateacostofdebtof9.29%(usingariskfree rateof4.29%andaddingintwothirdsofthecountrydefaultspreadof6.01%):
Costofdebt=Riskfree rate+2/3(Brazilcountrydefaultspread)+Companydefaultspread=4.29%+4.00%+1.00%=9.29%
Aswath Damodaran
102

103
SyntheticRatings:SomeCaveats
¨ Therelationshipbetweeninterestcoverageratiosandratings,developedusingUScompanies,tendstotravelwell,aslongasweareanalyzinglargemanufacturingfirmsinmarketswithinterestratesclosetotheUSinterestrate
¨ TheyaremoreproblematicwhenlookingatsmallercompaniesinmarketswithhigherinterestratesthantheUS.Onewaytoadjustforthisdifferenceismodifytheinterestcoverageratiotabletoreflectinterestratedifferences(Forinstances,ifinterestratesinanemergingmarketaretwiceashighasratesintheUS,halvetheinterestcoverageratio.
Aswath Damodaran
103

104
DefaultSpreads:Theeffectofthecrisisof2008..Andtheaftermath
Default spread over treasury
Rating 1-Jan-08 12-Sep-08 12-Nov-08 1-Jan-09 1-Jan-10 1-Jan-11Aaa/AAA 0.99% 1.40% 2.15% 2.00% 0.50% 0.55%Aa1/AA+ 1.15% 1.45% 2.30% 2.25% 0.55% 0.60%Aa2/AA 1.25% 1.50% 2.55% 2.50% 0.65% 0.65%Aa3/AA- 1.30% 1.65% 2.80% 2.75% 0.70% 0.75%A1/A+ 1.35% 1.85% 3.25% 3.25% 0.85% 0.85%A2/A 1.42% 1.95% 3.50% 3.50% 0.90% 0.90%A3/A- 1.48% 2.15% 3.75% 3.75% 1.05% 1.00%
Baa1/BBB+ 1.73% 2.65% 4.50% 5.25% 1.65% 1.40%Baa2/BBB 2.02% 2.90% 5.00% 5.75% 1.80% 1.60%
Baa3/BBB- 2.60% 3.20% 5.75% 7.25% 2.25% 2.05%Ba1/BB+ 3.20% 4.45% 7.00% 9.50% 3.50% 2.90%Ba2/BB 3.65% 5.15% 8.00% 10.50% 3.85% 3.25%Ba3/BB- 4.00% 5.30% 9.00% 11.00% 4.00% 3.50%B1/B+ 4.55% 5.85% 9.50% 11.50% 4.25% 3.75%B2/B 5.65% 6.10% 10.50% 12.50% 5.25% 5.00%B3/B- 6.45% 9.40% 13.50% 15.50% 5.50% 6.00%
Caa/CCC+ 7.15% 9.80% 14.00% 16.50% 7.75% 7.75%ERP 4.37% 4.52% 6.30% 6.43% 4.36% 5.20%
104
105
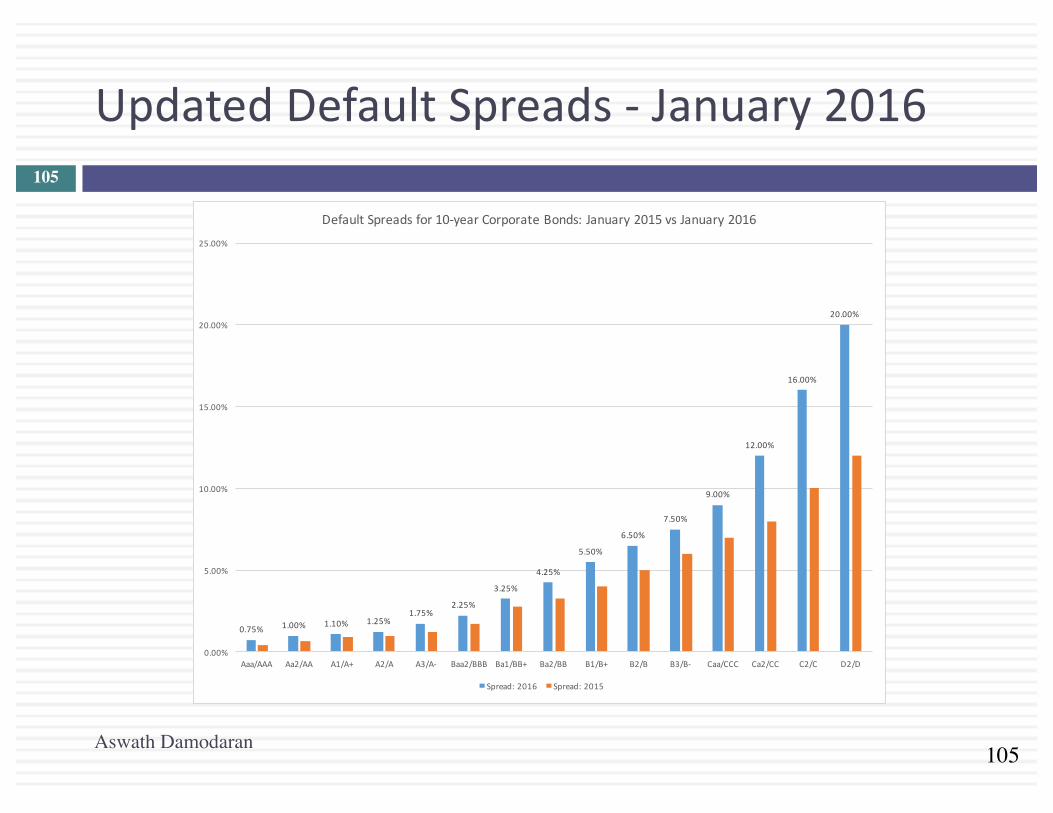
UpdatedDefaultSpreads- January2016
Aswath Damodaran
105
0.75% 1.00% 1.10% 1.25%1.75%
2.25%
3.25%
4.25%
5.50%
6.50%
7.50%
9.00%
12.00%
16.00%
20.00%
0.00%
5.00%
10.00%
15.00%
20.00%
25.00%
Aaa/AAA Aa2/AA A1/A+ A2/A A3/A- Baa2/BBB Ba1/BB+ Ba2/BB B1/B+ B2/B B3/B- Caa/CCC Ca2/CC C2/C D2/D
DefaultSpreadsfor10-yearCorporateBonds:January2015vsJanuary2016
Spread:2016 Spread:2015
106
SubsidizedDebt:Whatshouldwedo?
¨ AssumethattheBraziliangovernmentlendsmoneytoEmbraeratasubsidizedinterestrate(say6%indollarterms).IncomputingthecostofcapitaltovalueEmbraer,shouldbeweusethecostofdebtbasedupondefaultriskorthesubsidizedcostofdebt?
a. Thesubsidizedcostofdebt(6%).Thatiswhatthecompanyispaying.
b. Thefaircostofdebt(9.25%).Thatiswhatthecompanyshouldrequireitsprojectstocover.
c. Anumberinthemiddle.
Aswath Damodaran
106
107
WeightsfortheCostofCapitalComputation
¨ Incomputingthecostofcapitalforapubliclytradedfirm,thegeneralruleforcomputingweightsfordebtandequityisthatyouusemarketvalueweights(andnotbookvalueweights).Why?a. Becausethemarketisusuallyrightb. Becausemarketvaluesareeasytoobtainc. Becausebookvaluesofdebtandequityaremeaninglessd. Noneoftheabove
Aswath Damodaran
107

108
EstimatingCostofCapital:Embraerin2004
¨ Equity¤ CostofEquity=4.29%+1.07(4%)+0.27(7.89%)=10.70%¤ MarketValueofEquity=11,042millionBR($3,781million)
¨ Debt¤ Costofdebt=4.29%+4.00%+1.00%=9.29%¤ MarketValueofDebt=2,083millionBR($713million)
¨ CostofCapitalCostofCapital=10.70%(.84)+9.29%(1- .34)(0.16))=9.97%
¤ ThebookvalueofequityatEmbraeris3,350millionBR.¤ ThebookvalueofdebtatEmbraeris1,953millionBR;Interest
expenseis222milBR;Averagematurityofdebt=4years¤ Estimatedmarketvalueofdebt=222million(PVofannuity,4years,
9.29%)+$1,953million/1.09294 =2,083millionBR
Aswath Damodaran
108
109
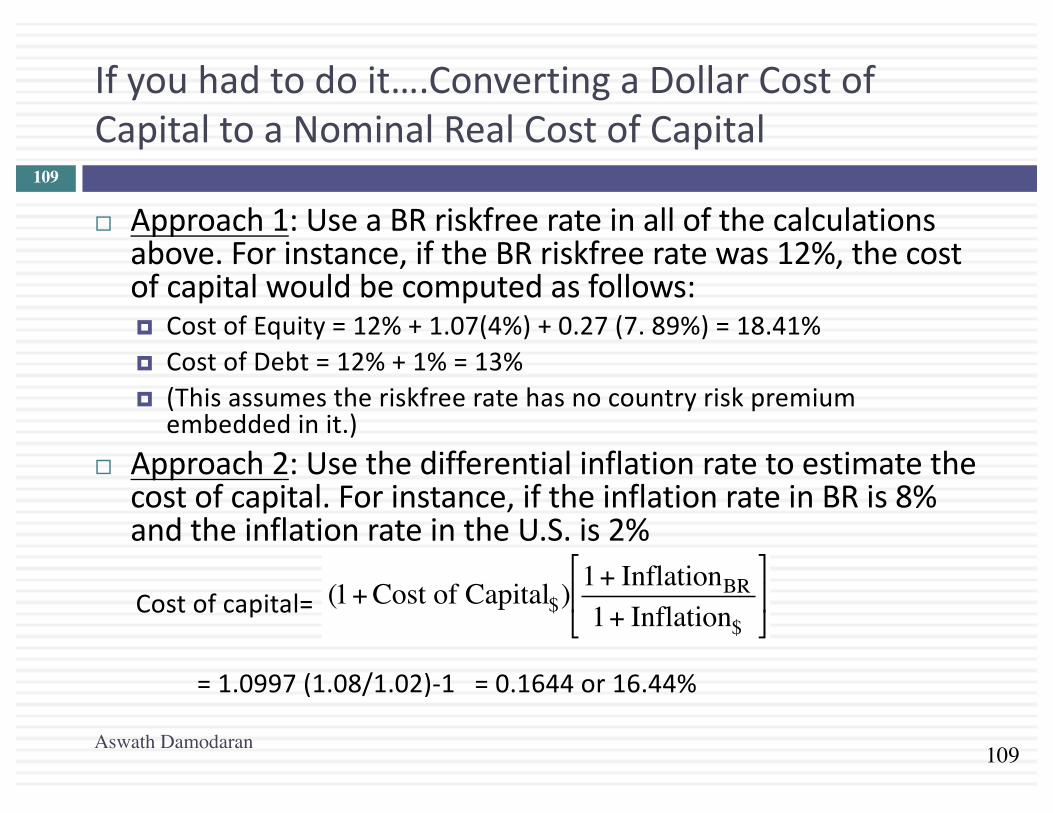
Ifyouhadtodoit….ConvertingaDollarCostofCapitaltoaNominalRealCostofCapital
¨ Approach1:UseaBRriskfree rateinallofthecalculationsabove.Forinstance,iftheBRriskfree ratewas12%,thecostofcapitalwouldbecomputedasfollows:¤ CostofEquity=12%+1.07(4%)+0.27(7.89%)=18.41%¤ CostofDebt=12%+1%=13%¤ (Thisassumestheriskfree ratehasnocountryriskpremium
embeddedinit.)¨ Approach2:Usethedifferentialinflationratetoestimatethe
costofcapital.Forinstance,iftheinflationrateinBRis8%andtheinflationrateintheU.S.is2%
Costofcapital=
=1.0997(1.08/1.02)-1=0.1644or16.44%
€
(1+ Cost of Capital$) 1+ InflationBR1+ Inflation$
"
# $
%
& '
Aswath Damodaran
109

110
DealingwithHybridsandPreferredStock
¨ Whendealingwithhybrids(convertiblebonds,forinstance),breakthesecuritydownintodebtandequityandallocatetheamountsaccordingly.Thus,ifafirmhas$125millioninconvertibledebtoutstanding,breakthe$125millionintostraightdebtandconversionoptioncomponents.Theconversionoptionisequity.
¨ Whendealingwithpreferredstock,itisbettertokeepitasaseparatecomponent.Thecostofpreferredstockisthepreferreddividendyield.(Asaruleofthumb,ifthepreferredstockislessthan5%oftheoutstandingmarketvalueofthefirm,lumpingitinwithdebtwillmakenosignificantimpactonyourvaluation).
Aswath Damodaran
110

111
Decomposingaconvertiblebond…
¨ Assumethatthefirmthatyouareanalyzinghas$125millioninfacevalueofconvertibledebtwithastatedinterestrateof4%,a10yearmaturityandamarketvalueof$140million.IfthefirmhasabondratingofAandtheinterestrateonA-ratedstraightbondis8%,youcanbreakdownthevalueoftheconvertiblebondintostraightdebtandequityportions.¤ Straightdebt=(4%of$125million)(PVofannuity,10years,8%)+125
million/1.0810=$91.45million¤ Equityportion=$140million- $91.45million=$48.55million
¨ Thedebtportion($91.45million)getsaddedtodebtandtheoptionportion($48.55million)getsaddedtothemarketcapitalizationtogettothedebtandequityweightsinthecostofcapital.
Aswath Damodaran
111
112
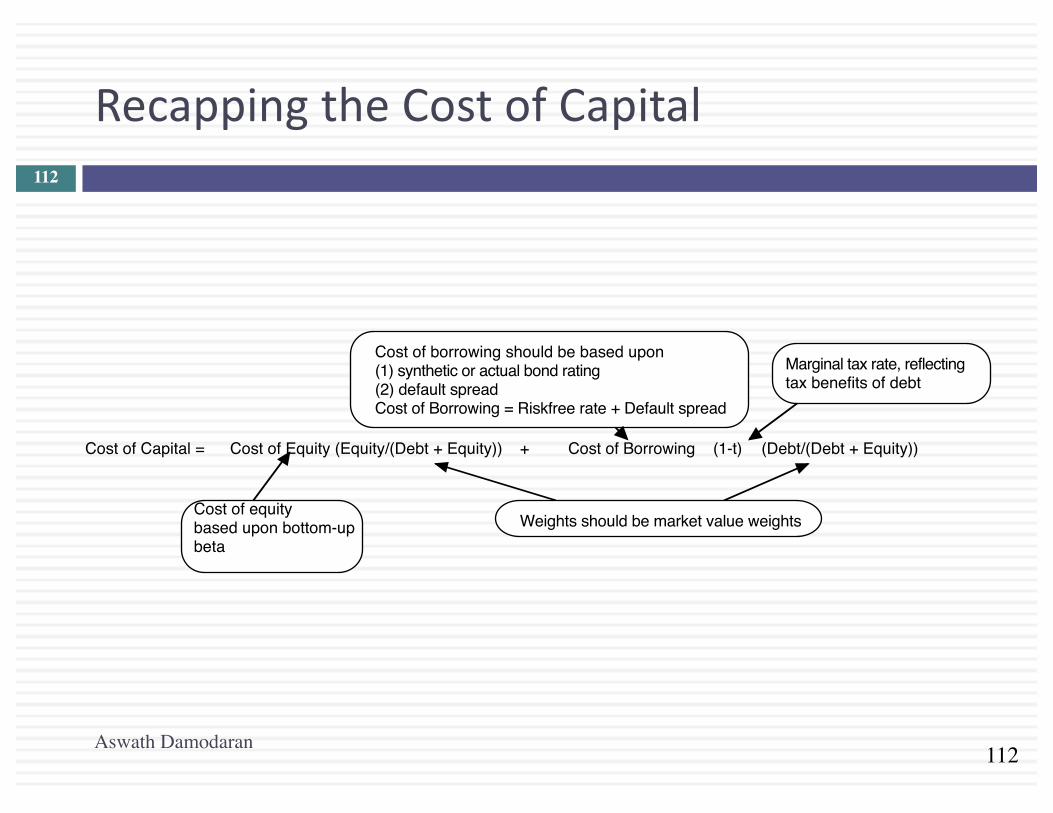
RecappingtheCostofCapital
Cost of Capital = Cost of Equity (Equity/(Debt + Equity)) + Cost of Borrowing (1-t) (Debt/(Debt + Equity))
Cost of borrowing should be based upon(1) synthetic or actual bond rating(2) default spreadCost of Borrowing = Riskfree rate + Default spread
Marginal tax rate, reflectingtax benefits of debt
Weights should be market value weightsCost of equitybased upon bottom-upbeta
Aswath Damodaran
112