diesel power plants based on biomass gasification. final
TRANSCRIPT
TeK£ S' B16ENEA&V- - 301
BIOENERGIA
Final report
Esa Kurkela, Pekka Stahlberg, Yrjo Solantausta & Carl Wilen
DIESEL POWER PLANTS BASED ON BIOMASS GASIFICATION
DISTRIBUTION OF THIS DOCUMENT IS UNLIMITED FOREIGN SALES PROHIBITED k T
Espoo, 5.9.1996
BIOENERGIAN TUTKIMUSOHJELMA BIOENERGY RESEARCH PROGRAMME

DISCLAIMER
Portions of this document may be illegible electronic image products. Images are produced from the best available original document.
TECHNICAL RESEARCH CENTRE OF FINLAND Energy/Energy Production Technologies P.O. Box 1601, FIN - 02044 VTT tel. +358-0-4561, telefax+358-0-460493
Final report
Esa Kurkela, Pekka Stahlberg, Yrjo Solantausta & Carl Wilen
DIESEL POWER PLANTS BASED ON BIOMASS GASIFICATIONBioenergia research programme - Project 309 Liekki 2 research programme - Project 412
Espoo, 5.9.1996
Jakelu: T utkimusohj elma Kirjastojakelu
25 kpl 15 kpl
RESEARCH PROGRAMME
Publisher (name and address) Project code/project number Place and date
VTT ENERGY 309 ESPOO, 5.9.1996
Energy Production Technologies
P.O.Box 1601 Commissioned by
FIN - 02044 VTT TEKES / BIOENERGIA research programme
Author(s) Name of project
Esa Kurkela, Pekka Stahlberg, Yijd Solantausta &Carl Wilen
Diesel power plants based on biomass gasification - 309
Title
Diesel power plants based on biomass gasification
Abstract
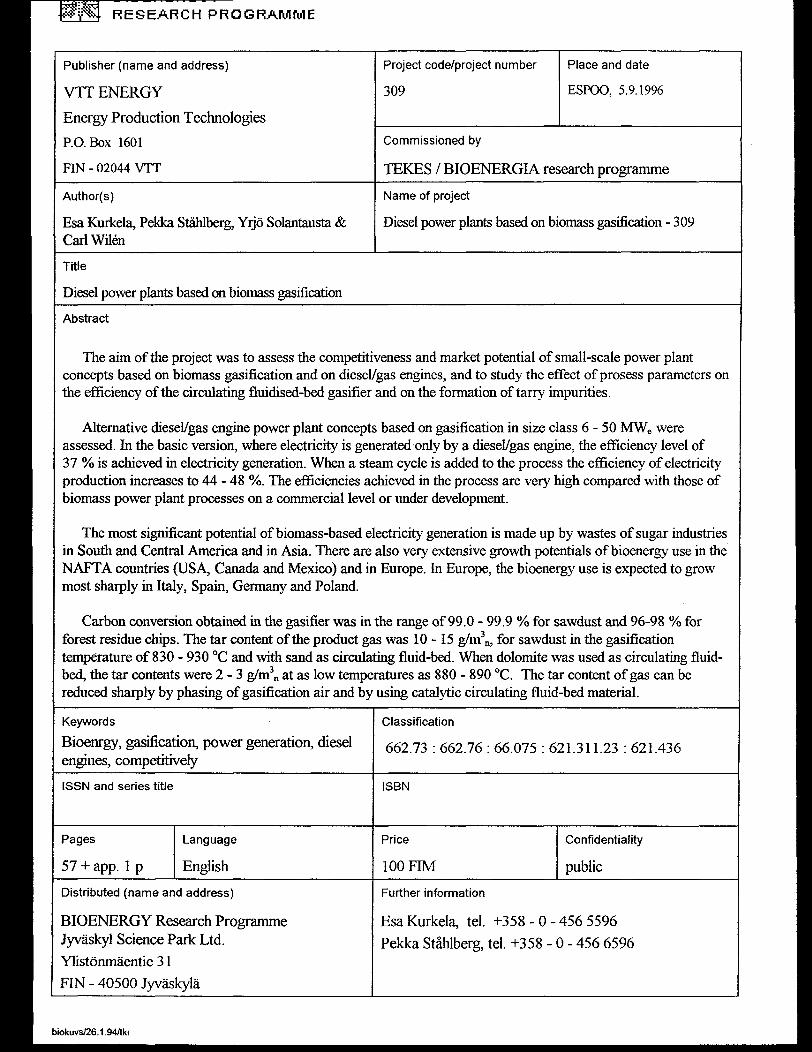
The aim of the project was to assess the competitiveness and market potential of small-scale power plant concepts based on biomass gasification and on diesel/gas engines, and to study the effect of prosess parameters on the efficiency of the circulating fluidised-bed gasifier and on the formation of tarry impurities.
Alternative diesel/gas engine power plant concepts based on gasification in size class 6-50 MWe were assessed. In the basic version, where electricity is generated only by a diesel/gas engine, the efficiency level of 37 % is achieved in electricity generation. When a steam cycle is added to the process the efficiency of electricity production increases to 44 - 48 %. The efficiencies achieved in the process are very high compared with those of biomass power plant processes on a commercial level or under development.
The most significant potential of biomass-based electricity generation is made up by wastes of sugar industries in South and Central America and in Asia. There are also very extensive growth potentials of bioenergy use in the NAFTA countries (USA Canada and Mexico) and in Europe. In Europe, the bioenergy use is expected to grow most sharply in Italy, Spain, Germany and Poland.
Carbon conversion obtained in the gasifier was in the range of 99.0 - 99.9 % for sawdust and 96-98 % for forest residue chips. The tar content of the product gas was 10 - 15 g/m3„, for sawdust in the gasification temperature of 830 - 930 °C and with sand as circulating fluid-bed. When dolomite was used as circulating fluid- bed, the tar contents were 2-3 g/m3„ at as low temperatures as 880 - 890 °C. The tar content of gas can be reduced sharply by phasing of gasification air and by using catalytic circulating fluid-bed material.
Keywords
Bioenrgy, gasification, power generation, diesel engines, competitively
Classification
662.73 : 662.76 : 66.075 : 621.311.23 : 621.436
ISSN and series title ISBN
Pages
57 + app. 1 p
Language
English
Price
100 FIM
Confidentiality
public
Distributed (name and address)
BIOENERGY Research ProgrammeJyvaskyl Science Park Ltd.Ylistdnmaentie 31FIN - 40500 Jyvaskyla
Further information
Esa Kurkela, tel. +358 - 0 - Pekka Stahlberg, tel. +358 -
456 55960 - 456 6596
biokuvs/26.1,94/lkr
[> IU M I , kz,
TUTK IMUSOHJELMA
Julkaisija (nimi ja osoite) Projektintunnus/projektinumero
Paikka ja paivays
VTT ENERGIA 309 ESPOO, 5.9.1996
Energian tuotantoteknologiatPL 1601 Toimeksiantaja(t)
02044 VTT TEKES / BIOENERGIA tutkimusohjelma
Tekija(t) Hankkeen nimi
Esa Kurkela, Pekka Stahlberg, Yijo Solantausta & Carl Wilen
Biomassan ja turpeen kaasutukseen perustuvien dieselvoimalaitosten toteutettavuustutkimus - 309
Raportin nimi :
Biomassan kaasutukseen perustuva dieselvoimalaitos
Tiivistelma
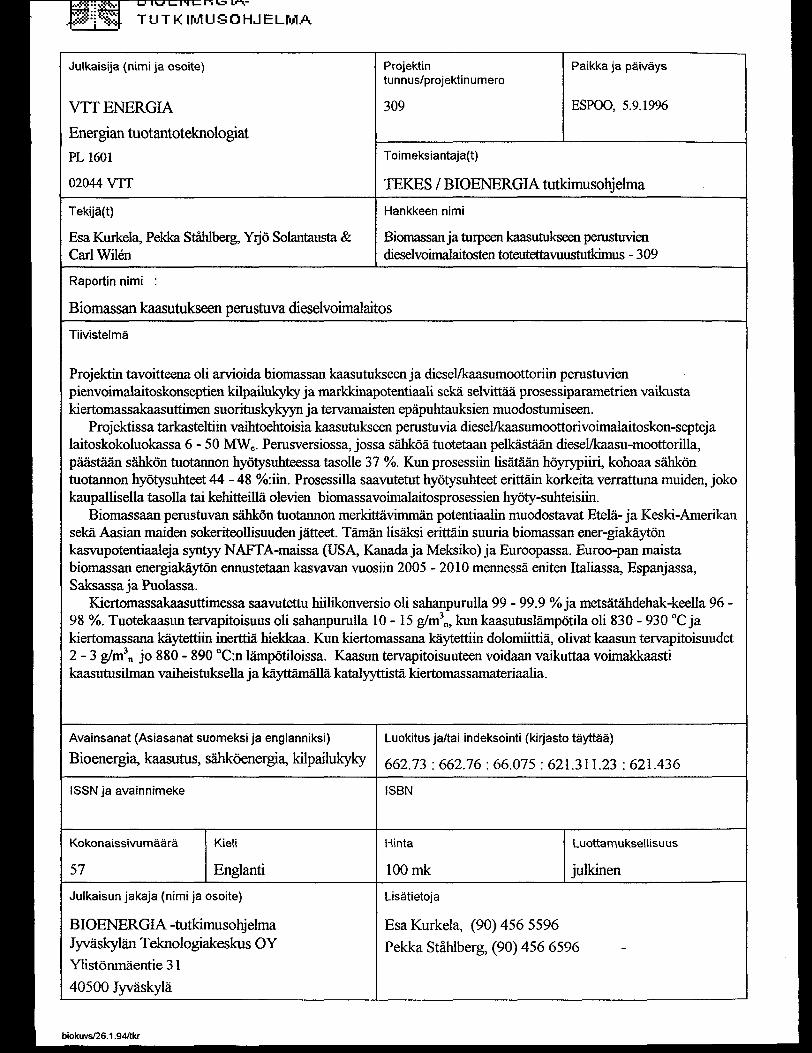
Projektin tavoitteena oli arvioida biomassan kaasutukseen ja diesel/kaasumoottoriin perustuvien pienvoimalaitoskonseptien kilpailukykyja markkinapotentiaali seka selvittaa prosessiparametrien vaikusta kiertomassakaasuttimen suorituskykyyn ja tervamaisten epapuhtauksien muodostumiseen.
Projektissa tarkasteltiin vaihtoehtoisia kaasutukseen perustuvia diesel/kaasumoottorivoimalaitoskon-septeja laitoskokoluokassa 6-50 MWe. Perusversiossa, jossa sahkoa tuotetaan pelkastaan diesel/kaasu-moottorilla, paastaan sahkon tuotannon hyotysuhteessa tasolle 37 %. Kun prosessiin lisataan hoyrypiiri, kohoaa sahkon tuotannon hyotysuhteet 44 - 48 %:iin. Prosessilla saavutetut hyotysuhteet erittain korkeita verrattuna muiden, joko kaupallisella tasolla tai kehitteilla olevien biomassavoimalaitosprosessien hyoty-suhteisiin.
Biomassaan perustuvan sahkon tuotannon merldttavimman potentiaalin muodostavat Etela- ja Keski-Amerikan seka Aasian maiden sokeriteollisuuden jatteet. Taman lisaksi erittain suuria biomassan ener-giakayton kasvupotentiaaleja syntyy NAFTA-maissa (USA, Kanada ja Meksiko) ja Euroopassa. Euroo-pan maista biomassan energiakayton ennustetaan kasvavan vuosiin 2005 - 2010 mennessa eniten Italiassa, Espanjassa, Saksassa ja Puolassa.
Kiertomassakaasuttimessa saavutettu hiilikonversio oli sahanpurulla 99 - 99.9 % ja metsatahdehak-keella 96 - 98 %. Tuotekaasun tervapitoisuus oli sahanpurulla 10 - 15 g/m3n, kun kaasutuslampotila oli 830 - 930 °C ja kiertomassana kaytettiin inerttia hiekkaa. Kun kiertomassana kaytettiin dolomiittia, olivat kaasun tervapitoisuudet 2-3 g/m3n jo 880 - 890 °C:n lampotiloissa. Kaasun tervapitoisuuteen voidaan vaikuttaa voimakkaasti kaasutusilman vaiheistuksella ja kayttamalla katalyyttista kiertomassamateriaalia.
Avainsanat (Asiasanat suomeksi ja englanniksi)
Bioenergia, kaasutus, sahkoenergia, kilpailukykyLuokitus ja/tai indeksointi (kirjasto tayttaa)
662.73 : 662.76 : 66.075 : 621.311.23 : 621.436
ISSN ja avainnimeke ISBN
Kokonaissivumaara
57
Kiel!
England
Hinta
100 mk
Luottamuksellisuus
julkinen
Julkaisun jakaja (nimi ja osoite)
BIOENERGIA -tutkimusohjelma Jyvaskylan Teknologiakeskus OY Ylistonmaentie 31 40500 Jyvaskyla
Lisatietoja
Esa Kurkela, (90) 456 5596 Pekka Stahlberg, (90) 456 6596
biokuvs/26.1.94/tkr
PREFACE
The research was carried out as a teamwork of the research groups on Gasification and advanced combustion and Process technologies of VTT Energy in 1995. The responsible project manager was Mr. Esa Kurkela, Senior Research Scientist, and the project leader was Mr. Pekka Stahlberg, Senior Research Scientist.
The work was financed mainly by Technology Development Centre Finland (TEKES) through its research programmes BIOENERGY and LIEKKI2, and was also supported financially by Imatran Voima Oy, Wartsila Diesel Oy and Technical Research Centre of Finland (VTT).
We express our warm thanks to the financers of the research work and to the technical and and analytical groups and the office team of VTT Energy for their contribution to the success of the work. Special thanks are due to Mr. Harri Luomala, Technician, for an especially skillful work on planning and constructing the new gasification test equipment.
Espoo, September 1996
Authors
CONTENTS
1 BACKGROUND 8
2 OBJECTIVES 10
3 IMPLEMENTATION 11
4 TASKS 11
5 COMPETITIVENESS OF THE CFB GASIFIER ENGINEPOWER PLANT CONCEPT 115.1 Introduction 115.2 Bases for assessment 12
5.2.1 Fuel 125.2.2 Combustion engine 135.2.3 Process concepts 145.2.4 Modelling tool employed 155.2.5 Investment and operating costs 15
5.3 Description of process concepts 175.3.1 Gasification combustion engine, power only 175.3.2 Gasification combustion engine with a combined-cycle,
power only 185.3.3 Gasification combustion engine, co-generation 195.3.4 Gasification combustion engine combined-cycle,
co-generation 205.4 Performance of assessed concepts 20
5.4.1 Overall efficiencies 205.4.2 Co-generation 225.4.3 Technical sensitivities 22
5.5 Economic assessment 245.5.1 Investment cost 245.5.2 Operating and power production cost 245.5.3 Comparison to conventional and other alternatives 29
5.6 Conclusions 33
6 MARKET POTENTIAL OF BIOMASS-FUELED POWER PLANTS 346.1 Global biomass use 346.2 Supply of biomass for energy 356.3 Electricity demand and biomass supply scenarios 376.4 Biomass based electricity production scenario 416.5 European projections 456.6 European electricity prices 476.7 Conclusions 48
6
7 BIOMASS GASIFICATION TESTS WITH CIRCULATINGFLUIDIZED-BED GASIFIER 497.1 Tests 497.2 Test equipment 497.3 Results 497.4 Conclusions 53
SUMMARY 53
REFERENCES 56
7
1 BACKGROUND
Intensive development work on the gasification technology of solid fuels was initiated in the mid 1970s in Finland, the aim being to replace imported fuels (and raw materials) by gas produced from peat and wood biomass. The most significant industrial-scale projects in the 1980s were:
. Development of the Bioneer heating station based on an updraft gasifier (size class 1-15 MWth. Nine stations were commissioned in the years 1982 - 1987.
• Development of the Pyroflow circulating-bed gasifier for lime kiln applications (four plants were commissioned).
• Peat ammonia project of Kemira Oy (pilot tests abroad, demonstration plant at Oulu, Finland)
• Gasification-diesel tests by A Ahlstrom Corporation and Wartsila Diesel.
Since the late 1980s, development of the so-called simplified IGCC has been the main object of interest. However, the economic feasibility of the IGCC technology requires as large a size class (>30 - 50 MWe), that this technology cannot be applied to all potential biomass and peat applications. For example, the efficiency requirements and waste wood amounts in the mechanical wood industry are usually too small for the IGCC technology.
New power plant technologies suitable for different size classes are shown in Figure 1. In small-scale, pyrolysis oil fuelled diesel power plants, direct combustion of sawdust in a gas turbine, and the gasification diesel studied in this project are technologies competing with the conventional steam process. Of these alternatives, the gasification diesel is most close to the commercial level. Advantages of this process compared to fluidised-bed combustion and steam turbines are a higher efficiency (in the production of condensing power) and a clearly higher power-to-heat ratio in combined electricity and heat production.
Gasification-diesel technology has been demonstrated in Finland by A. Ahlstrom Corporation and Wartsila Diesel in the mid-1980s. It has also been developed in Sweden, where an extensive test series was carried out by Studsvik AB (today TPS) in the late 1980s to test the operability of a concept based on circulating-bed gasification and diesel engine (Hedemora Diesel). The only significant technical problems in both these projects proved to be cleaning of gas from tarry impurities and high CO and PAH emissions caused in part by these impurities.
Technology on catalytic gas cleaning was developed by VTT Gasification Group as part of gas cleaning research related to applications of IGCC technology. Catalytic gas cleaning offers a good chance of achieving a sufficiently efficient decomposition of tar with regard to the use of gas in engines.
8
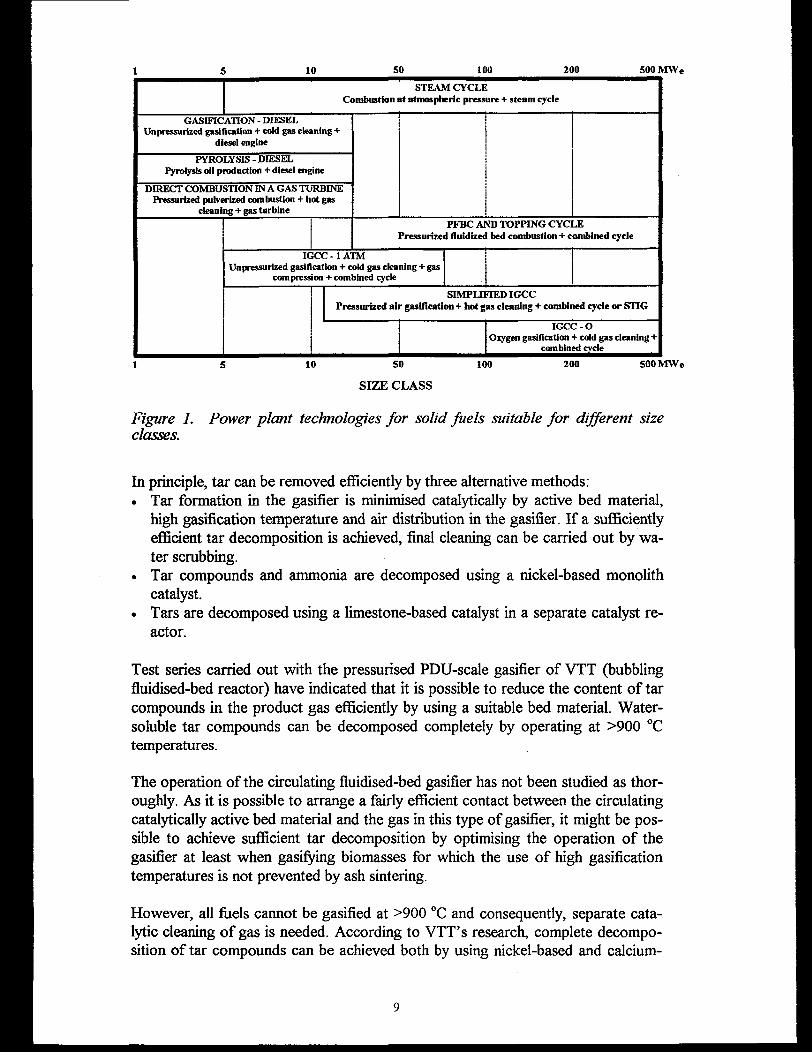
1________________ 5________________10_______________ 50______________ 100______________ 200____________SOOMWe
STEAM CYCLECombustion at atmospheric pressure + steam cycle
GASIFICATION - DIESEL Unpressurized gasification + cold gas cleaning +
diesel engine
PYROLYSIS - DIESEL Pyrolysis oil production + diesel engine
DIRECT COMBUSTION IN A GAS TURBINE Pressurized pulverized combustion + hot gas
cleaning + gas turbinePFBC AND TOPPING CYCLE
Pressurized fluidized bed combustion + combined cycle
IGCC-1ATMUnpressurized gasification + cold gas cleaning + gas
compression + combined cycle
SIMPLIFIED IGCCPressurized air gasification + hot gas cleaning + combined cycle or STIG
IGCC -OOxygen gasification + cold gas cleaning +
combined cycle
1 5 10 SO 100 200 SOOMWe
SIZE CLASS
Figure 1. Power plant technologies for solid fuels suitable for different size classes.
In principle, tar can be removed efficiently by three alternative methods:• Tar formation in the gasifier is minimised catalytically by active bed material,
high gasification temperature and air distribution in the gasifier. If a sufficiently efficient tar decomposition is achieved, final cleaning can be carried out by water scrubbing.
• Tar compounds and ammonia are decomposed using a nickel-based monolith catalyst.
• Tars are decomposed using a limestone-based catalyst in a separate catalyst reactor.
Test series carried out with the pressurised PDU-scale gasifier of VTT (bubbling fluidised-bed reactor) have indicated that it is possible to reduce the content of tar compounds in the product gas efficiently by using a suitable bed material. Water- soluble tar compounds can be decomposed completely by operating at >900 °C temperatures.
The operation of the circulating fluidised-bed gasifier has not been studied as thoroughly. As it is possible to arrange a fairly efficient contact between the circulating catalytically active bed material and the gas in this type of gasifier, it might be possible to achieve sufficient tar decomposition by optimising the operation of the gasifier at least when gasifying biomasses for which the use of high gasification temperatures is not prevented by ash sintering.
However, all fuels cannot be gasified at >900 °C and consequently, separate catalytic cleaning of gas is needed. According to VTT’s research, complete decomposition of tar compounds can be achieved both by using nickel-based and calcium-
9
based catalysts. The development of the nickel-based monolith catalyst is farthest advanced so far. Advantages of this alternative are: a) simple flow-through method, which is also suitable for dust-containing gases, b) complete decomposition of tars, and c) about 80 % conversion of ammonia.
The use of limestone and dolomite requires calcination of calcium carbonate, which requires operation temperatures of >970 - 1 000 °C in IGCC applications (pressure >20 bar). However, at the gasification pressure required for engine applications (1 - 5 bar) calcination can be easily achieved (temperature requirement >780 - 850 °C). The tests at VTT have so far been carried out in a small fixed-bed catalyst reactor, in which the contact of gas and catalyst is especially efficient and hence, the residence time required for tar decomposition is fairly short (less than 0.5 s). It is crucial for the implementation of this alternative to develop a reactor type filling the following requirements: a) the gas-catalyst contact is efficient, b) the method is not susceptible to dust blocking, and c) the method can be implemented in industrial scale and at sufficiently low cost.
Conditions for small-scale electricity generation are clearly more favourable in a number of EU countries than in Finland. In Italy, for example, the price of electricity is much higher and biomass-based generation is supported considerably. The emission charges (inch CO2 tax) set for fossil fuels will also improve the competitiveness of biomass-based energy production in a number of European countries. As a consequence of increasing dumping charges and closing of dumps, new alternatives of utilising different industrial waste flows will emerge (package materials, waste flows from the chipboard industry, etc.).
Experimental research aiming at applications of the gasification diesel and other atmospheric gasification technology was initiated in this project. The one-year project focused on the operation of the gasifier, while gas cleaning, a problem of crucial significance to the implementation of the technology, will be studied in another project in the years of 1996 - 1997. Another task of the project was to assess the potential and economical feasibility of gasification diesel power plants.
2 OBJECTIVES
The aim of the project was to assess the competitiveness and market potential of small-scale power plant concepts based on biomass gasification and on diesel/gas engines, and to study the effect of process parameters on the efficiency of the circulating fluidised-bed gasifier and on the formation of tarry impurities.
10
3 IMPLEMENTATION
The project was carried out by the Gasification Group of VTT Energy. The power plant concepts were modelled by ASPEN PLUS™ Program by calculating the material and energy balances of different process alternatives. Electricity generation costs of the concepts were compared to those of a plant based on direct combustion and a steam process. The market potential of small-scale power plants fuelled with biomass was surveyed on the basis of the existing literature. Experimental research was carried out with an atmospheric circulating fluidised-bed gasifier in the test premises of VTT Energy in Otaniemi, Espoo.
4 TASKSThe tasks of the one-year project performed in 1995 were
1. to assess the competitiveness of power plant concepts based on atmospheric gasification and a diesel/gas engine compared to a steam process,
2. to survey the market potential of biomass-fuelled small power plants,3. to study the effect of the operation parameters of the circulating fluidised-bed
gasifier on achievable carbon conversion, gas quality, and tar formation.
5 COMPETITIVENESS OF THE CFB- GASIFIER ENGINE POWER PLANT CONCEPT
5.1 INTRODUCTION
The objective of this sub-task was to estimate the competitiveness of a new power plant concept proposed. The concept is based on gasification of biomass in a circulating fluidized bed (CFB) and on the use of the product gas as a fuel in an internal combustion engine.
Both co-generation and power production cases are included. Capacities range between 6 to 50 MWe. It has been proposed that markets for renewable energy systems will be growing in the foreseeable future [1], It would be important to assess different alternatives, to select most promising configurations for further development. It is estimated that markets for these systems may be largest in South- East Asia and Europe in the next 5 to 6 years.
Only some experimental work with gasification-engine concepts aimed at scales larger than about one MW have been reported [2, 3], The overriding problem in the earlier work (see, e g., [4]) has the been the fuel gas quality: deposits have been
li
detected in turbo-charger blades, and especially NOx emissions have been unacceptably high. Water scrubbing to clean the fuel gas has been employed, which leads to a waste water stream. This in part will result in higher investment and operating costs.
New gas cleaning options have been developed recently, among others, at VTT Energy. The aim of this report is to assess new concepts employing these alternatives. Several plant configurations have been designed. The alternative configurations are compared with each other on techno-economic bases, and the most promising ones are compared with conventional steam-cycle power plants. Alternative engine configurations have been designed at a nominal capacity of 5 MWe. In comparing to commercial alternatives, larger capacities up to 50 MWe are also studied. Since at this point the engine configuration and operation is not determined in detail, both power plants based on a diesel engine and a gas engine are studied.
This study was planned to be the first stage of a techno-economic assessment of power plant concepts based on gasification and engine technologies. At a later stage, more detailed design and optimisation of the process will be required and is planned to be carried out in co-operation with Wartsila Diesel and with a gasifier manufacturer Foster Wheeler Energia.
5.2 BASES FOR ASSESSMENT
5.2.1 Fuel
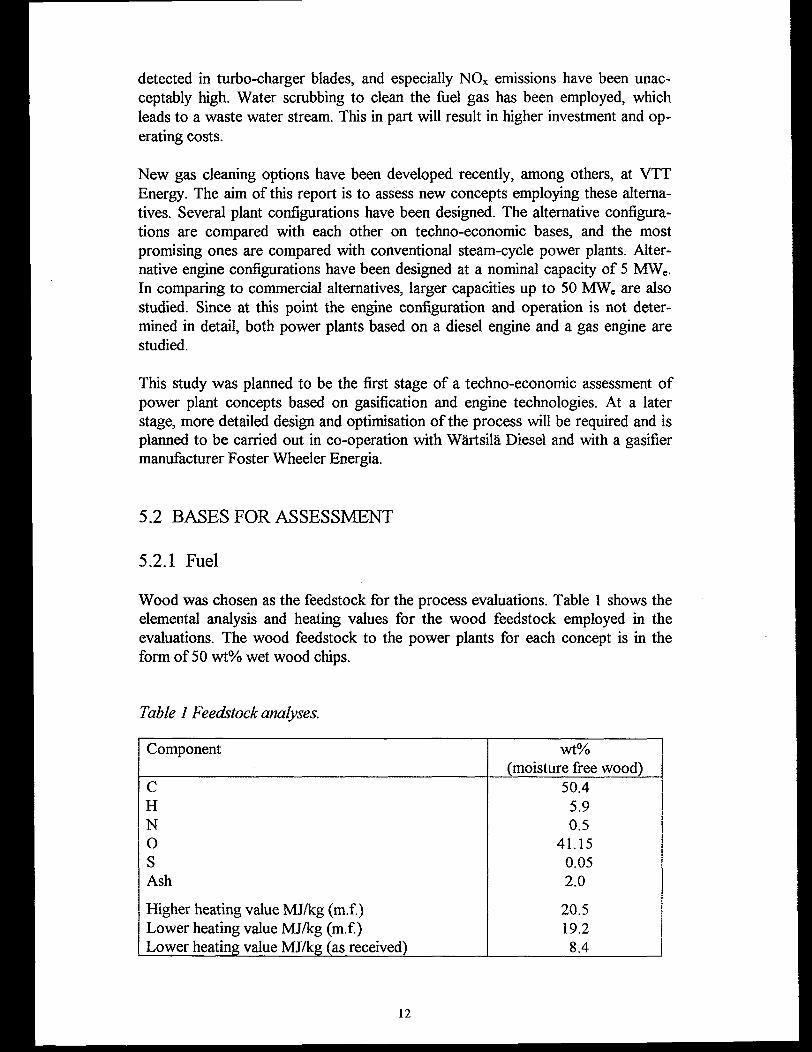
Wood was chosen as the feedstock for the process evaluations. Table 1 shows the elemental analysis and heating values for the wood feedstock employed in the evaluations. The wood feedstock to the power plants for each concept is in the form of 50 wt% wet wood chips.
Table 1 Feedstock analyses.
Component wt%(moisture free wood)
C 50.4H 5.9N 0.50 41.15s 0.05Ash 2.0
Higher heating value MJ/kg (m.f.) 20.5Lower heating value MJ/kg (m.f.) 19.2Lower heating value MJ/kg (as received) 8.4
12
5.2.2 Combustion engine
An attempt is made to assess both gas and diesel engines integrated to gasification. In the past, pilot injected diesel engines have been employed for low heating value (lhv) fuel gas. Notably both AAhlstrdm (now Foster Wheeler Energia) and Wart- sila Diesel [3] and Studsvik Energiteknik (now TPS) and Hedemora Diesel [2] have experience of operation. However, experiences with lhv gas in gas engines have not been reported in open literature.
A following approach has been taken in modeling the combustion engines:
• Power production efficiencies for both engines were estimated. 38 % is employed for the gas engine (generator power/fuel chemical energy), and 41 % for the diesel engine. Both values are lower than state-of-the-art engines in commercial operation employing natural gas as fuel. A sensitivity case is carried out, where the effect of engine efficiency to the plant overall performance is studied.
• Potential derating is taken into account in economic analysis. The derating may be as much as 30 %, which has been reported possible if the volumetric efficiency and engine speed are fixed [5], As derating is difficult to judge without experiments, a sensitivity analysis is carried out.
• It is believed that modifications for the engine gas supply system would be needed to be able to use lhv gas in engines. Although a critical issue, the aspect was not part of the present study.
Rate of heat release, ignition limits, and knock resistance are important parameters in engine combustion. They are fairly different for lhv gases than for conventional fuels, natural gas and hydrocarbon fuels. Their significance for the engine performance is fairly critical. However, it is not possible to study these in detail in the present work. The sensitivity study on derating is partly meant to study potential influences of these parameters.
The energy balance around the gas engine is presented in Table 2. The data is for natural gas and is believed to be representative for a state-of-the-art gas engine. In the performance analysis, a similar distribution of energy is assumed for the engine using lhv fuel gas. Note, however, that the net power output will be decreased (note above).
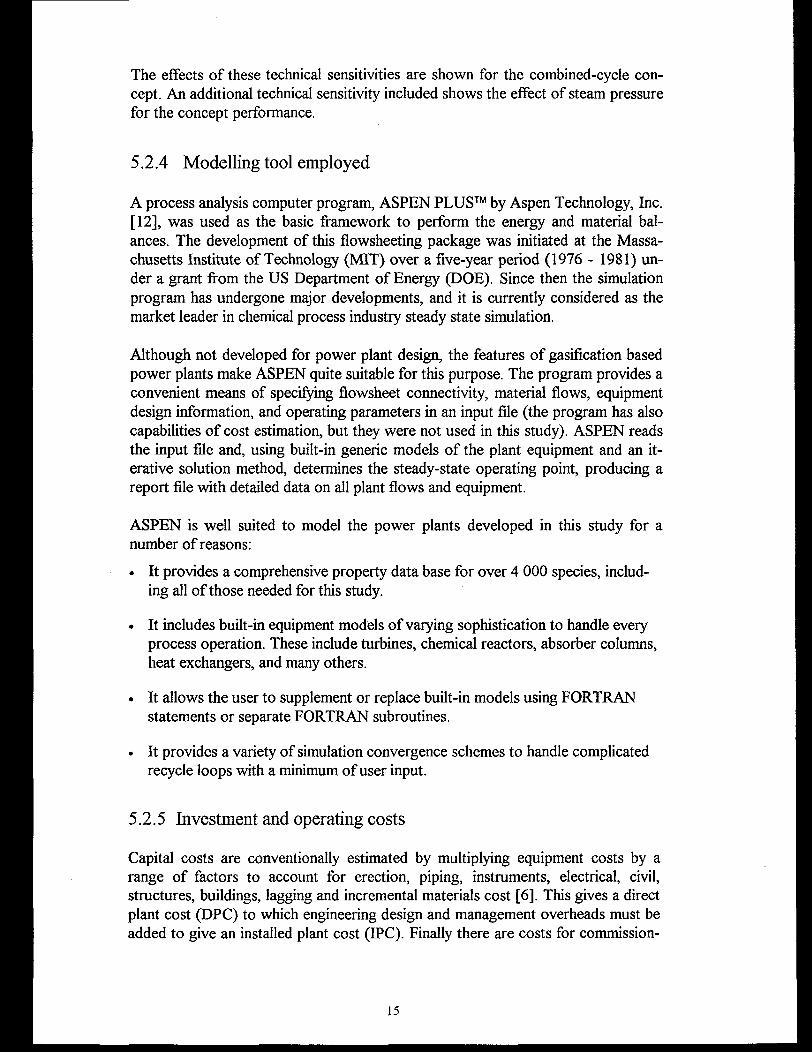
The energy balance around the diesel engine is presented in Table 3. The data is for heavy fuel oil, and is believed to be representative for a state-of-the-art engine. In the performance analysis, a similar distribution of energy is assumed for the engine using lhv fuel gas. Note, however, that the net power output will be decreased (note above).
13
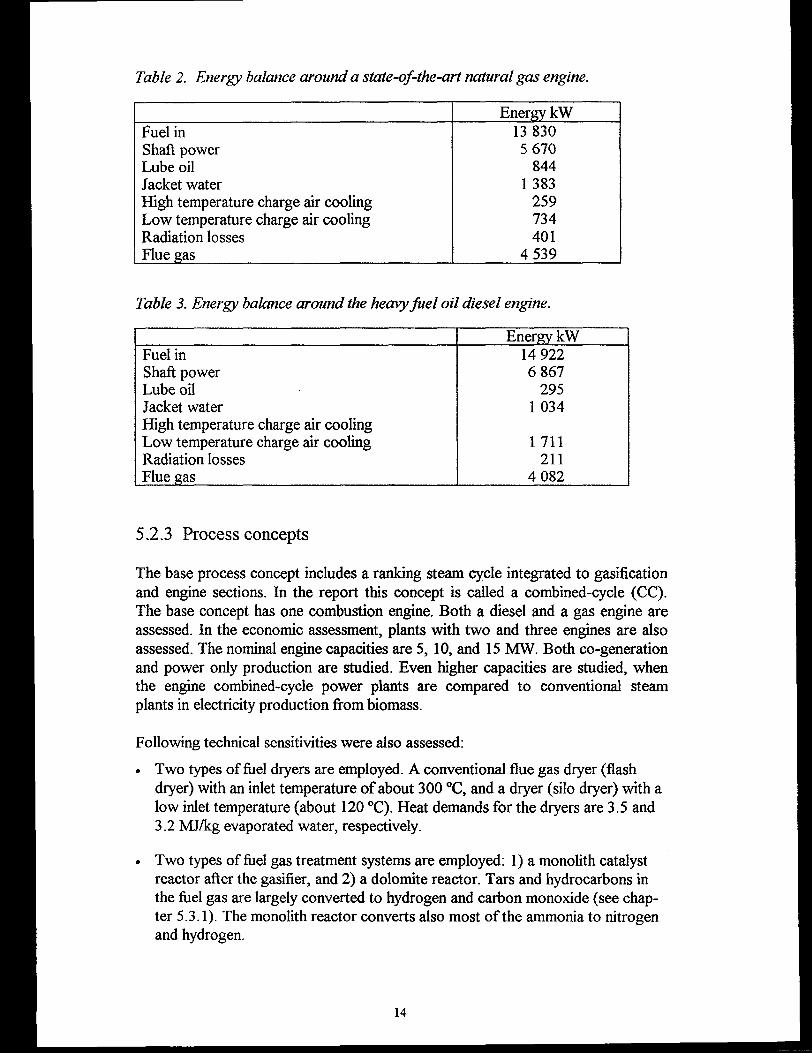
Table 2. Energy balance around a state-of-the-art natural gas engine.
Energy kWFuel in 13 830Shaft power 5 670Lube oil 844Jacket water 1 383High temperature charge air cooling 259Low temperature charge air cooling 734Radiation losses 401Flue gas 4 539
Table 3. Energy balance around the heavy fuel oil diesel engine.
Energy kWFuel in 14 922Shaft power 6 867Lube oil 295Jacket water 1 034High temperature charge air coolingLow temperature charge air cooling 1 711Radiation losses 211Flue gas 4 082
5.2.3 Process concepts
The base process concept includes a ranking steam cycle integrated to gasification and engine sections. In the report this concept is called a combined-cycle (CC). The base concept has one combustion engine. Both a diesel and a gas engine are assessed. In the economic assessment, plants with two and three engines are also assessed. The nominal engine capacities are 5, 10, and 15 MW. Both co-generation and power only production are studied. Even higher capacities are studied, when the engine combined-cycle power plants are compared to conventional steam plants in electricity production from biomass.
Following technical sensitivities were also assessed:
• Two types of fuel dryers are employed. A conventional flue gas dryer (flash dryer) with an inlet temperature of about 300 °C, and a dryer (silo dryer) with a low inlet temperature (about 120 °C). Heat demands for the dryers are 3.5 and 3.2 MJ/kg evaporated water, respectively.
• Two types of fuel gas treatment systems are employed: 1) a monolith catalyst reactor after the gasifier, and 2) a dolomite reactor. Tars and hydrocarbons in the fuel gas are largely converted to hydrogen and carbon monoxide (see chapter 5.3.1). The monolith reactor converts also most of the ammonia to nitrogen and hydrogen.
14
The effects of these technical sensitivities are shown for the combined-cycle concept. An additional technical sensitivity included shows the effect of steam pressure for the concept performance.
5.2.4 Modelling tool employed
A process analysis computer program, ASPEN PLUS™ by Aspen Technology, Inc. [12], was used as the basic framework to perform the energy and material balances. The development of this flowsheeting package was initiated at the Massachusetts Institute of Technology (MIT) over a five-year period (1976 - 1981) under a grant from the US Department of Energy (DOE). Since then the simulation program has undergone major developments, and it is currently considered as the market leader in chemical process industry steady state simulation.
Although not developed for power plant design, the features of gasification based power plants make ASPEN quite suitable for this purpose. The program provides a convenient means of specifying flowsheet connectivity, material flows, equipment design information, and operating parameters in an input file (the program has also capabilities of cost estimation, but they were not used in this study). ASPEN reads the input file and, using built-in generic models of the plant equipment and an iterative solution method, determines the steady-state operating point, producing a report file with detailed data on all plant flows and equipment.
ASPEN is well suited to model the power plants developed in this study for a number of reasons:
• It provides a comprehensive property data base for over 4 000 species, including all of those needed for this study.
• It includes built-in equipment models of varying sophistication to handle every process operation. These include turbines, chemical reactors, absorber columns, heat exchangers, and many others.
• It allows the user to supplement or replace built-in models using FORTRAN statements or separate FORTRAN subroutines.
• It provides a variety of simulation convergence schemes to handle complicated recycle loops with a minimum of user input.
5.2.5 Investment and operating costs
Capital costs are conventionally estimated by multiplying equipment costs by a range of factors to account for erection, piping, instruments, electrical, civil, structures, buildings, lagging and incremental materials cost [6], This gives a direct plant cost (DPC) to which engineering design and management overheads must be added to give an installed plant cost (DPC). Finally there are costs for commission
15
ing, contractors fee and interest during construction which all together give a total plant cost (TPC) [6,7].
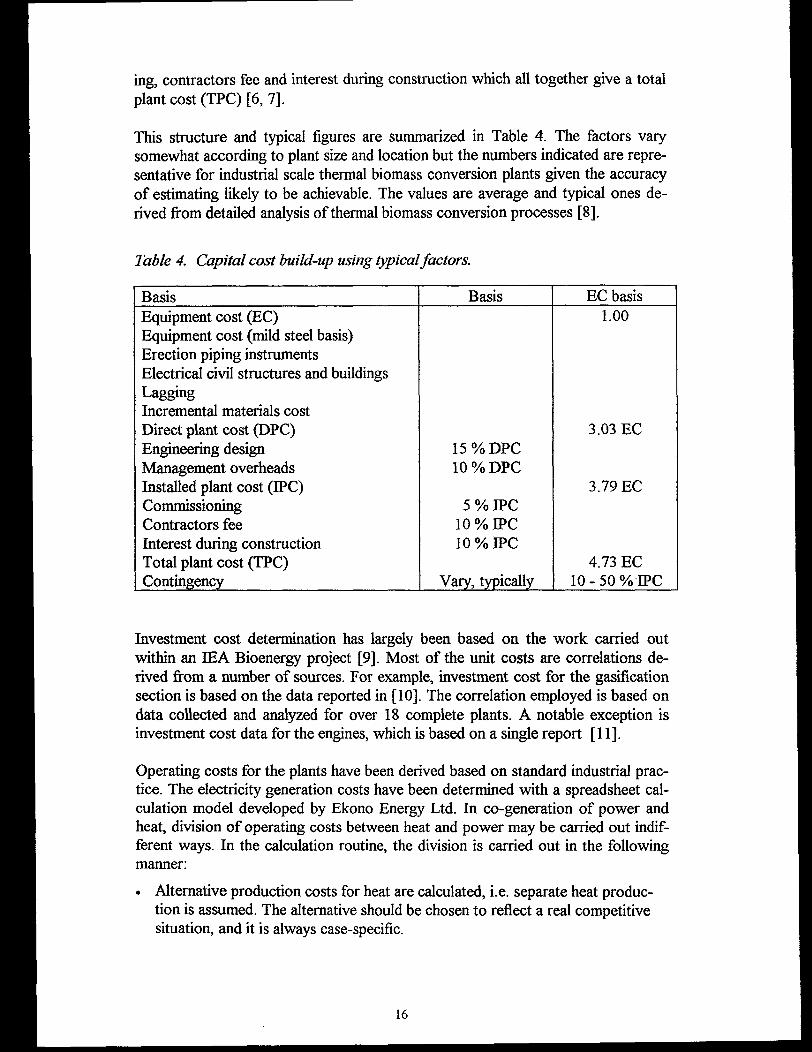
This structure and typical figures are summarized in Table 4. The factors vary somewhat according to plant size and location but the numbers indicated are representative for industrial scale thermal biomass conversion plants given the accuracy of estimating likely to be achievable. The values are average and typical ones derived from detailed analysis of thermal biomass conversion processes [8],
Table 4. Capital cost build-up using typical factors.
Basis Basis EC basisEquipment cost (EC)Equipment cost (mild steel basis)Erection piping instrumentsElectrical civil structures and buildings LaggingIncremental materials cost
1.00
Direct plant cost (DPC) 3.03 ECEngineering design 15% DPCManagement overheads 10% DPCInstalled plant cost (IPC) 3.79 ECCommissioning 5 % IPCContractors fee 10 % IPCInterest during construction 10 % IPCTotal plant cost (TPC) 4.73 ECContingency Vary, typically 10-50% IPC
Investment cost determination has largely been based on the work carried out within an IEA Bioenergy project [9], Most of the unit costs are correlations derived from a number of sources. For example, investment cost for the gasification section is based on the data reported in [10]. The correlation employed is based on data collected and analyzed for over 18 complete plants. A notable exception is investment cost data for the engines, which is based on a single report [11].
Operating costs for the plants have been derived based on standard industrial practice. The electricity generation costs have been determined with a spreadsheet calculation model developed by Ekono Energy Ltd. In co-generation of power and heat, division of operating costs between heat and power may be carried out indifferent ways. In the calculation routine, the division is carried out in the following manner:
• Alternative production costs for heat are calculated, i.e. separate heat production is assumed. The alternative should be chosen to reflect a real competitive situation, and it is always case-specific.
16
. In co-generation, these alternative fixed and variable costs are used for heat production. The remaining operating costs are charged for electricity production.
5.3 DESCRIPTION OF PROCESS CONCEPTS
Two base configurations are studied: a combustion engine power plant as such, or an engine power plant with a steam cycle (combined-cycle, CC). Both gas engines and gas diesel engines are studied. Most of the cases deal with electricity production only, but two cases include co-generation. The studied concepts are summarized in Table 5.
Table 5. Configurations studied. Combined cycle = CC.
Engine No of engines
Dryer Gastreatment
Power / Co-gen
Diesel & combined-cycle 1 Silo Monolith PowerDiesel & CC 1,2,3 Flash Monolith PowerDiesel & CC 1 Flash Dolomite PowerDiesel 1 Flash Monolith Co-genGas engine & CC 1,2,3 Flash Monolith PowerGas engine & CC 1 Flash Dolomite PowerGas engine & CC 1,2,3 Flash Monolith Co-gen
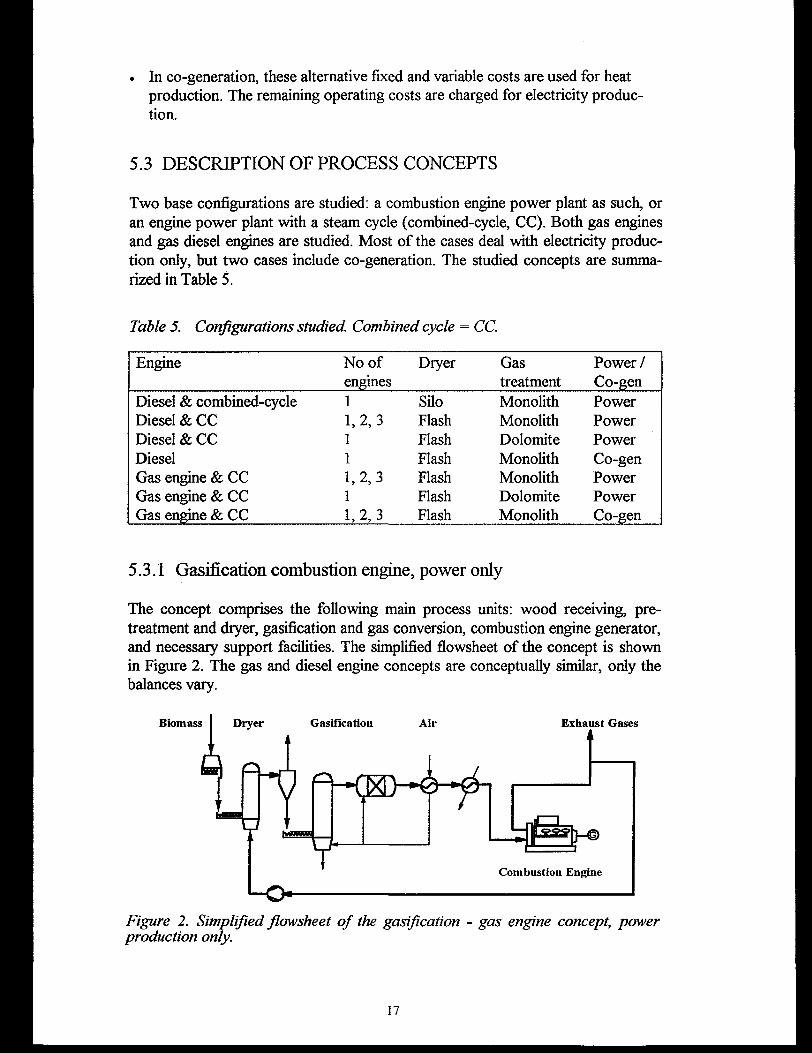
5.3.1 Gasification combustion engine, power only
The concept comprises the following main process units: wood receiving, pretreatment and dryer, gasification and gas conversion, combustion engine generator, and necessary support facilities. The simplified flowsheet of the concept is shown in Figure 2. The gas and diesel engine concepts are conceptually similar, only the balances vary.
GasificationBiomass Exhaust Gases
Combustion Engine
Figure 2. Simplified flowsheet of the gasification - gas engine concept, power production only.
17
Wet wood (50 wt% moisture) is received at receiving stations, from where it is transported to a storage bunker. The wood is milled for an appropriate particle size for downstream processing. Gas engine exhaust gas is employed in drying the feed biomass to 15 wt% moisture content. The dryer is a flash dryer. Solids are separated from the gases in cyclones. Some of the exit gas is mixed with fresh exhaust gas to control the inlet temperature at around 300 °C. Exit gas is led through a bag-house to remove entrained solid particulates.
An alternative dryer, a silo dryer, is studied as well. The main difference to the previous concept is that a silo dryer uses lower temperature heat. An inlet temperature of approximately 120 °C is employed. The dryer heat demand is also assumed slightly lower than for the flash dryer, 3.2 and 3.5 MJ/kg, respectively.
The gasifier is an air-blown, atmospheric-pressure circulating fluidised-bed reactor. The dried wood is transported pneumatically to the gasifier feed hoppers. The gasifier is operated near 1 bar, and at a temperature of 850 - 900 °C. Air enters through the bottom grid to maintain fluidization. Wood is pyrolyzed, and the products react further to produce a fuel gas mixture composing mainly of hydrogen, carbon monoxide, carbon dioxide, water vapor, lower hydrocarbons, and some tars. More than 40 mole% of gas is nitrogen from the gasification air. Most of the entrained solids (char) are separated in the cyclones and recycled back into the reactor. To remove heavy tars from the fuel gas it is send to a monolith catalyst cracker, where more air is introduced. All of the heavier tars are converted to noncondensable gas components. From the lighter hydrocarbons, 98 % and 85 % of benzene and methane are converted, respectively. In addition, 80 % of ammonia is converted to elementary nitrogen. Raw fuel gas is further cooled by preheating the gasification and converter air. Gas is finally cooled to around 40 °C with cooling water.
An alternative gas treatment concept is a dolomite cracker, which also convert tars and hydrocarbons into non-condensable gases. All the tar compounds are converted, and 95 % of benzene. No methane or ammonia is converted. A DeNOx unit is employed for the engine exhaust gas, when a dolomite cracker is included.
Cooled fuel gas is introduced to the turbo-charger of the combustion engine. The power production efficiency of the gas engine-generator set is estimated to be 38 %. The respective efficiency for the diesel engine set is 41 %. Most of the exhaust gases are used in the dryer to dry fuel wood.
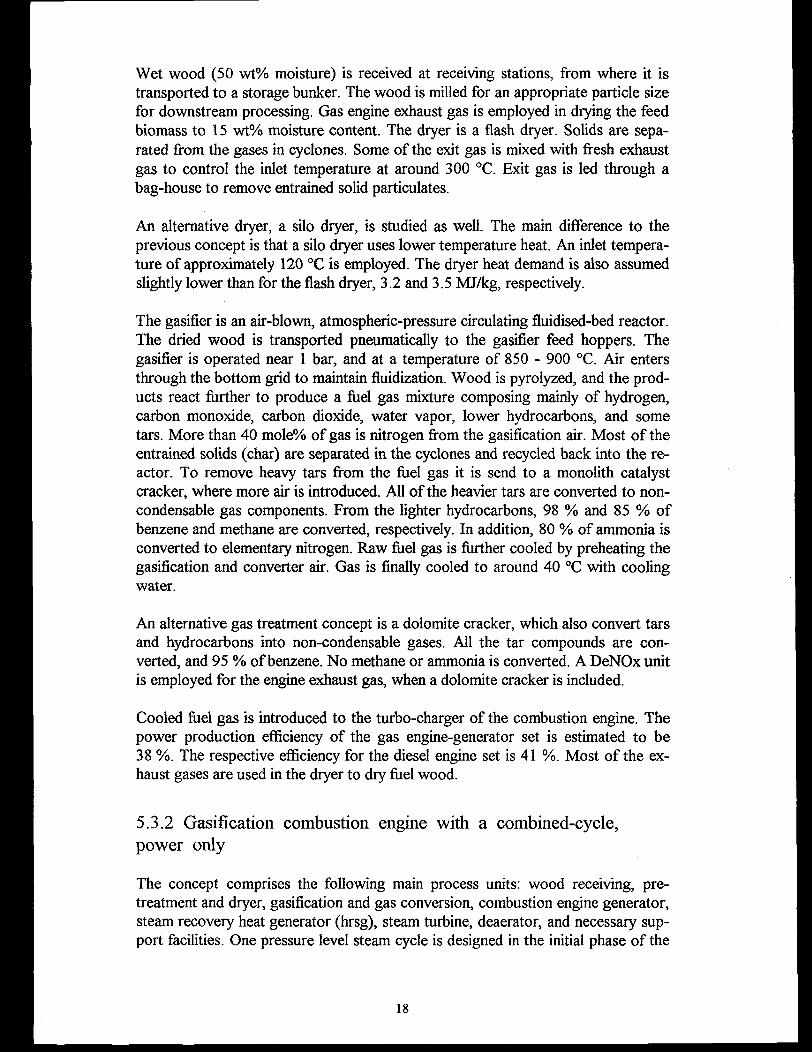
5.3.2 Gasification combustion engine with a combined-cycle, power only
The concept comprises the following main process units: wood receiving, pretreatment and dryer, gasification and gas conversion, combustion engine generator, steam recovery heat generator (hrsg), steam turbine, deaerator, and necessary support facilities. One pressure level steam cycle is designed in the initial phase of the
18
study. It is known that generating steam at two pressure levels would increase the efficiency further a couple of percentage points. The simplified flowsheet of the concept is shown in Figure 3. The gas and diesel engine concepts are conceptually similar, only the balances will vary.
The concepts is similar to the concept presented in chapter 5.3.1, except for the steam cycle, which employs waste heat from gasification and from the engine.
After gasification and converter air preheater, where the fuel gas is cooled to around 750 °C, a hrsg is installed. Superheated steam is generated and led to the steam turbine. Further steam is generated with engine exhaust gases. The steam cycle is conventional. Low-temperature engine waste heat (jacket water, high temperature charge air cooler) is employed in preheating condensates and proving part of the heat for the deaerator steam requirement. Engine exhaust gas from the hrsg is employed in fuel dryer.
Steam Turbine
Biomass Gasification
Combustion EngineExhaust Gases
Figure 3. Simplified flowsheet of the gasification - gas engine combined-cycle concept, power production only.
5.3.3 Gasification combustion engine, co-generation
Co-generation of electricity and district heat has also been assessed. The concepts is very similar conceptually to the one shown in Figure 3. Heat for district heat is produced in following areas of the power plant:
• Gasification section: cooling the fuel gas after the converter.
• Combustion engine: lube oil cooling, jacket water, high temperature charge air cooling, and exhaust gas cooling after the engine before the dryer.
19
5.3.4 Gasification combustion engine combined-cycle, co-generation
The concept is similar to the one shown in Figure 3. Heat for district heat is produced in the following areas of the power plant:
• Gasification section: cooling the fuel gas after the steam generator.
. Combustion engine: part of lube oil cooling, part of jacket water, and part of high temperature charge air cooling.
. Steam turbine condenser.
5.4 PERFORMANCE OF ASSESSED CONCEPTS
5.4.1 Overall efficiencies
Assessed power plant concepts are summarized in Table 6. The production mode (power/cogen), dryer type (silo/flash), gas treatment (monolith/dolomite), and engine type (gas diesel engine/gas engine) is also shown.
The capacities were determined in a following manner:
1. The engine power output was fixed to 5 MW.
2. Dryer feed was varied to get the right amount of fuel gas for the engine.
3. In a combined-cycle mode, maximum amount of heat available was converted for steam to the steam turbine producing additional power.
4. For two cases, plant performances for two (10 MW) and three (15 MW) engines were also determined.
A summary of efficiencies for electricity production is shown in Table 6. It may be noted that the efficiencies are fairly high for power plants employing an engine combined-cycle, between 44 and 48 %. A detailed energy balance for one of the alternatives (diesel engine with a condensing steam cycle) is shown in Appendix 1.
The efficiencies for power plants including three engine sets are compared to other concepts being developed, and commercial alternatives, too, in Figure 4. It may be seen that the CC concepts yields efficiencies, which are comparable to the highest efficiencies reported for biomass power plant concepts so far.
20
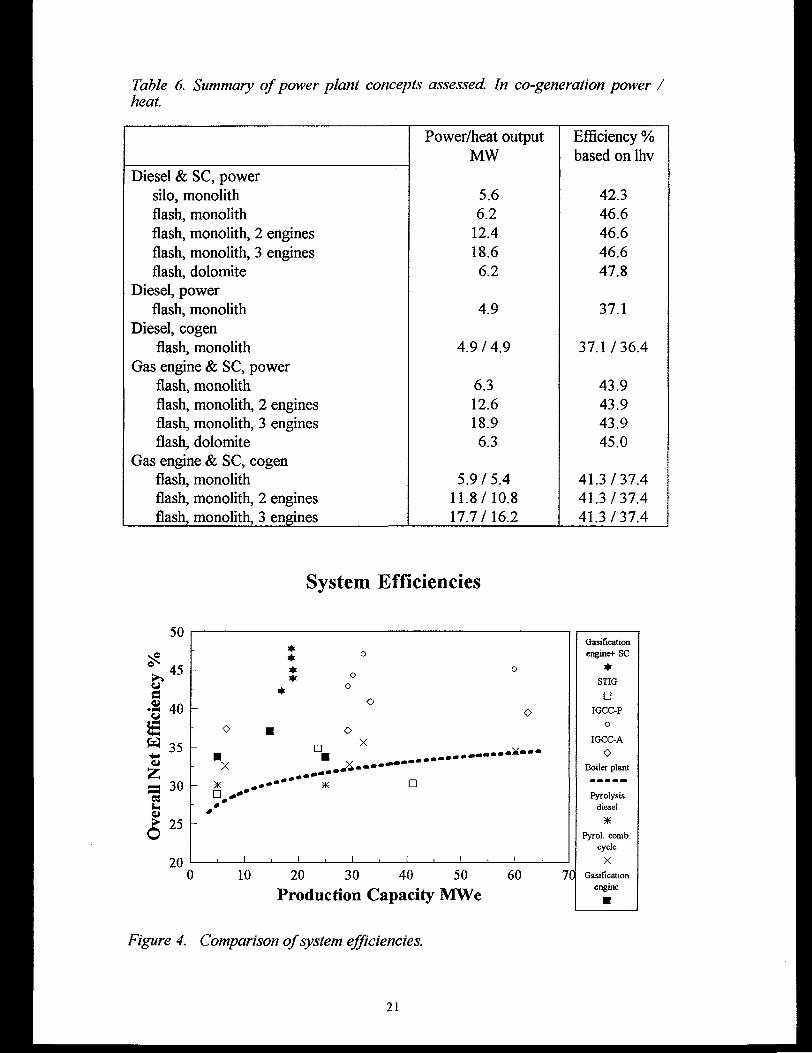
Table 6. Summary of power plant concepts assessed. In co-generation power / heat.
Power/heat output MW
Efficiency % based on lhv
Diesel & SC, powersilo, monolith 5.6 42.3flash, monolith 6.2 46.6flash, monolith, 2 engines 12.4 46.6flash, monolith, 3 engines 18.6 46.6flash, dolomite 6.2 47.8
Diesel, powerflash, monolith 4.9 37.1
Diesel, cogenflash, monolith 4.9/4.9 37.1 /36.4
Gas engine & SC, powerflash, monolith 6.3 43.9flash, monolith, 2 engines 12.6 43.9flash, monolith, 3 engines 18.9 43.9flash, dolomite 6.3 45.0
Gas engine & SC, cogenflash, monolith 5.9/5.4 41.3/37.4flash, monolith, 2 engines 11.8/10.8 41.3/37.4flash, monolith, 3 engines 17.7/16.2 41.3/37.4
System Efficiencies
Gasification engine*- SC
IGCC-P
IGCC-A
Boiler plant
Pyrolysisdiesel
Pyrol. comb.
Gasificationengine
Production Capacity MWe
Figure 4. Comparison of system efficiencies.
21
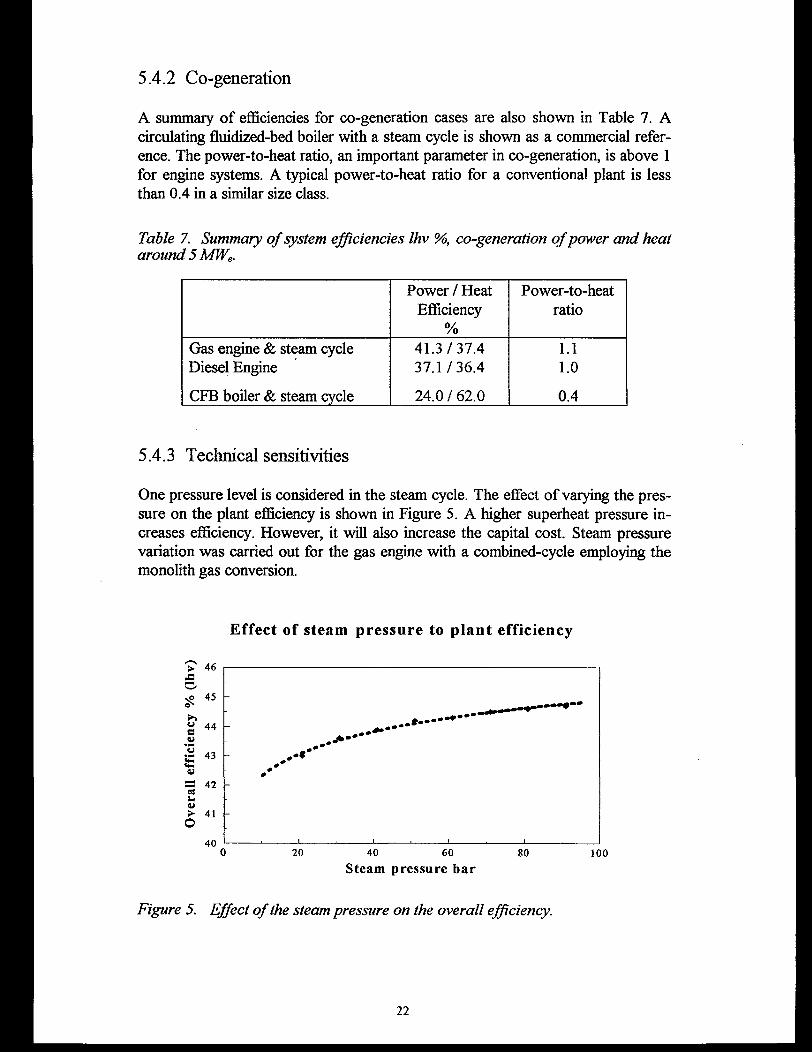
5.4.2 Co-generation
A summary of efficiencies for co-generation cases are also shown in Table 7. A circulating fluidized-bed boiler with a steam cycle is shown as a commercial reference. The power-to-heat ratio, an important parameter in co-generation, is above 1 for engine systems. A typical power-to-heat ratio for a conventional plant is less than 0.4 in a similar size class.
Table 7. Summary of system efficiencies Ihv %, co-generation of power and heat around 5 MWe.
Power / Heat Efficiency
%
Power-to-heatratio
Gas engine & steam cycle 41.3/37.4 1.1Diesel Engine 37.1 /36.4 1.0
CFB boiler & steam cycle 24.0 / 62.0 0.4
5.4.3 Technical sensitivities
One pressure level is considered in the steam cycle. The effect of varying the pressure on the plant efficiency is shown in Figure 5. A higher superheat pressure increases efficiency. However, it will also increase the capital cost. Steam pressure variation was carried out for the gas engine with a combined-cycle employing the monolith gas conversion.
Effect of steam pressure to plant efficiency
Steam pressure bar
Figure 5. Effect of the steam pressure on the overall efficiency.
22
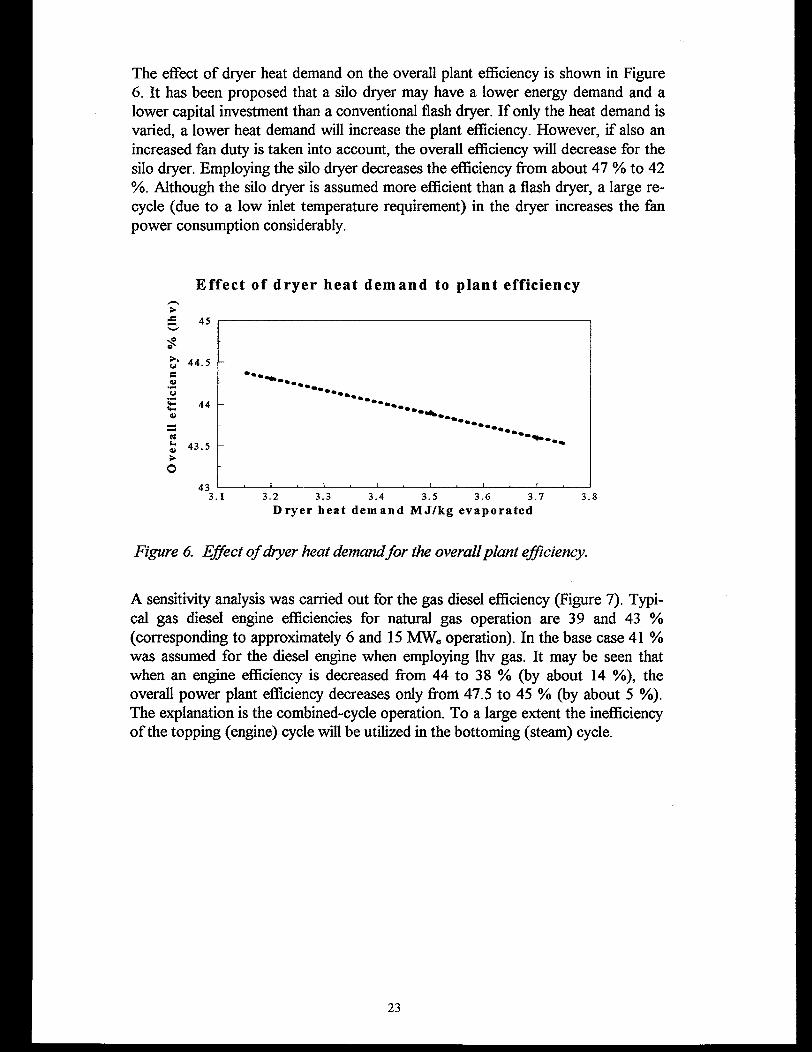
The effect of dryer heat demand on the overall plant efficiency is shown in Figure 6. It has been proposed that a silo dryer may have a lower energy demand and a lower capital investment than a conventional flash dryer. If only the heat demand is varied, a lower heat demand will increase the plant efficiency. However, if also an increased fan duty is taken into account, the overall efficiency will decrease for the silo dryer. Employing the silo dryer decreases the efficiency from about 47 % to 42 %. Although the silo dryer is assumed more efficient than a flash dryer, a large recycle (due to a low inlet temperature requirement) in the dryer increases the fan power consumption considerably.
Effect of dryer heat demand to plant efficiency
I «£S' 44.5eV
E 44oat 43.5 > o
433.1 3.2 3.3 3.4 3.5 3.6 3.7 3.8
Dryer heat demand MJ/kg evaporated
Figure 6. Effect of dryer heat demand for the overall plant efficiency.
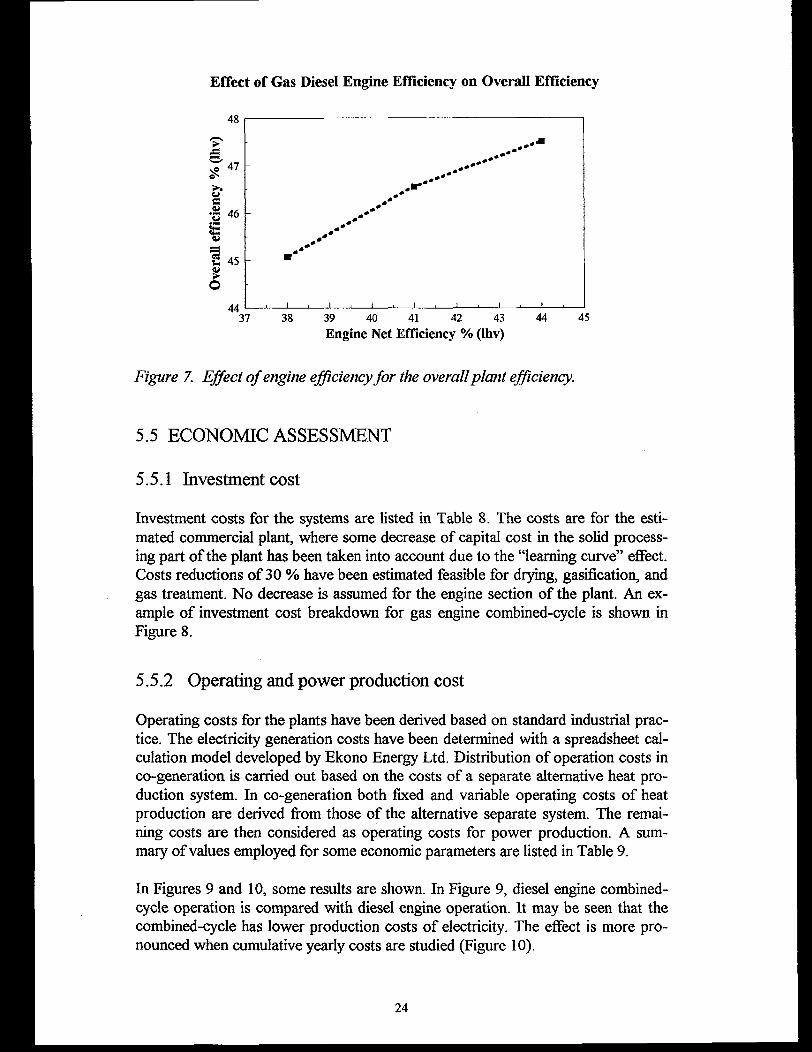
A sensitivity analysis was carried out for the gas diesel efficiency (Figure 7). Typical gas diesel engine efficiencies for natural gas operation are 39 and 43 % (corresponding to approximately 6 and 15 MWe operation). In the base case 41 % was assumed for the diesel engine when employing lhv gas. It may be seen that when an engine efficiency is decreased from 44 to 38 % (by about 14 %), the overall power plant efficiency decreases only from 47.5 to 45 % (by about 5 %). The explanation is the combined-cycle operation. To a large extent the inefficiency of the topping (engine) cycle will be utilized in the bottoming (steam) cycle.
23
Effect of Gas Diesel Engine Efficiency on Overall Efficiency
48
©44 1...,_i___ i___ i....—i-----1___ i___ i-----1-----1___ i-----1-----1-----1-----1-----1-----1
37 38 39 40 41 42 43 44 45Engine Net Efficiency % (lhv)
Figure 7. Effect of engine efficiency for the overall plant efficiency.
5.5 ECONOMIC ASSESSMENT
5.5.1 Investment cost
Investment costs for the systems are listed in Table 8. The costs are for the estimated commercial plant, where some decrease of capital cost in the solid processing part of the plant has been taken into account due to the “learning curve” effect. Costs reductions of 30 % have been estimated feasible for drying, gasification, and gas treatment. No decrease is assumed for the engine section of the plant. An example of investment cost breakdown for gas engine combined-cycle is shown in Figure 8.
5.5.2 Operating and power production cost
Operating costs for the plants have been derived based on standard industrial practice. The electricity generation costs have been determined with a spreadsheet calculation model developed by Ekono Energy Ltd. Distribution of operation costs in co-generation is carried out based on the costs of a separate alternative heat production system. In co-generation both fixed and variable operating costs of heat production are derived from those of the alternative separate system. The remaining costs are then considered as operating costs for power production. A summary of values employed for some economic parameters are listed in Table 9.
In Figures 9 and 10, some results are shown. In Figure 9, diesel engine combined- cycle operation is compared with diesel engine operation. It may be seen that the combined-cycle has lower production costs of electricity. The effect is more pronounced when cumulative yearly costs are studied (Figure 10).
24

combined-cycle has lower production costs of electricity. The effect is more pronounced when cumulative yearly costs are studied (Figure 10).
Table 8. Investment costs.
Investment Cost Million FIM
Specific Investment FIM/kW
Diesel & SC, powersilo, monolith 82 14 700flash, monolith 86 13 800flash, monolith, 2 engines 133 10 700flash, monolith, 3 engines 173 9 300flash, dolomite 85 13 700
Diesel, powerflash, monolith 70 14 200
Diesel, cogenflash, monolith 72 14 700
Gas engine & SC, powerflash, monolith 80 12 800flash, monolith, 2 engines 126 10 000flash, monolith, 3 engines 167 8 800
flash, dolomite 80 12 700Gas engine & SC, cogen
flash, monolith 83 14 000flash, monolith, 2 engines 126 10 600flash, monolith, 3 engines 166 9 400
Investment Cost BreakdownGasification Gas Engine Combined-Cycle 6 MW
Gasification
Engine 25.4%
Figure 8. Investment cost breakdown for a gas engine combined-cycle.
25
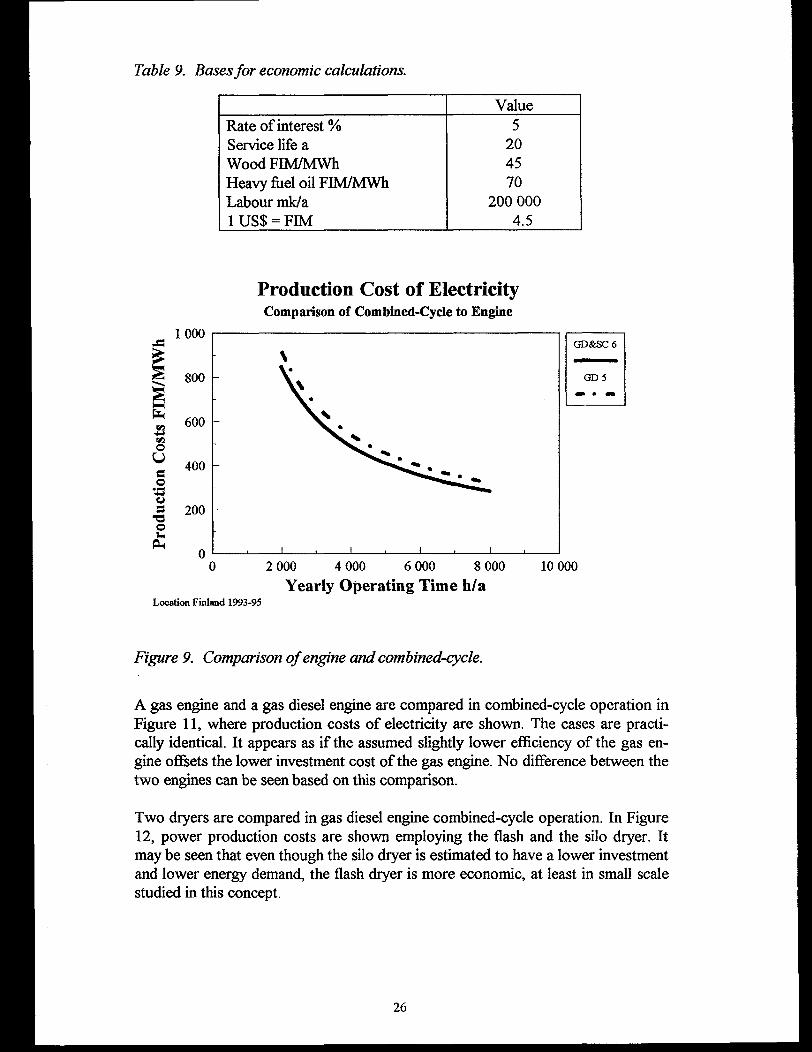
Table 9. Bases for economic calculations.
ValueRate of interest % 5Service life a 20Wood FIMZMWh 45Heavy fuel oil FIM/MWh 70Labour mk/a 200 0001 US$ = FIM 4.5
Production Cost of ElectricityComparison of Combined-Cycle to Engine
GD&SC6
800 - GD 5
6 000 8 000 10 0002 000 4 000
Yearly Operating Time h/aLocation Finland 1993-95
Figure 9. Comparison of engine and combined-cycle.
A gas engine and a gas diesel engine are compared in combined-cycle operation in Figure 11, where production costs of electricity are shown. The cases are practically identical. It appears as if the assumed slightly lower efficiency of the gas engine offsets the lower investment cost of the gas engine. No difference between the two engines can be seen based on this comparison.
Two dryers are compared in gas diesel engine combined-cycle operation. In Figure 12, power production costs are shown employing the flash and the silo dryer. It may be seen that even though the silo dryer is estimated to have a lower investment and lower energy demand, the flash dryer is more economic, at least in small scale studied in this concept.
26
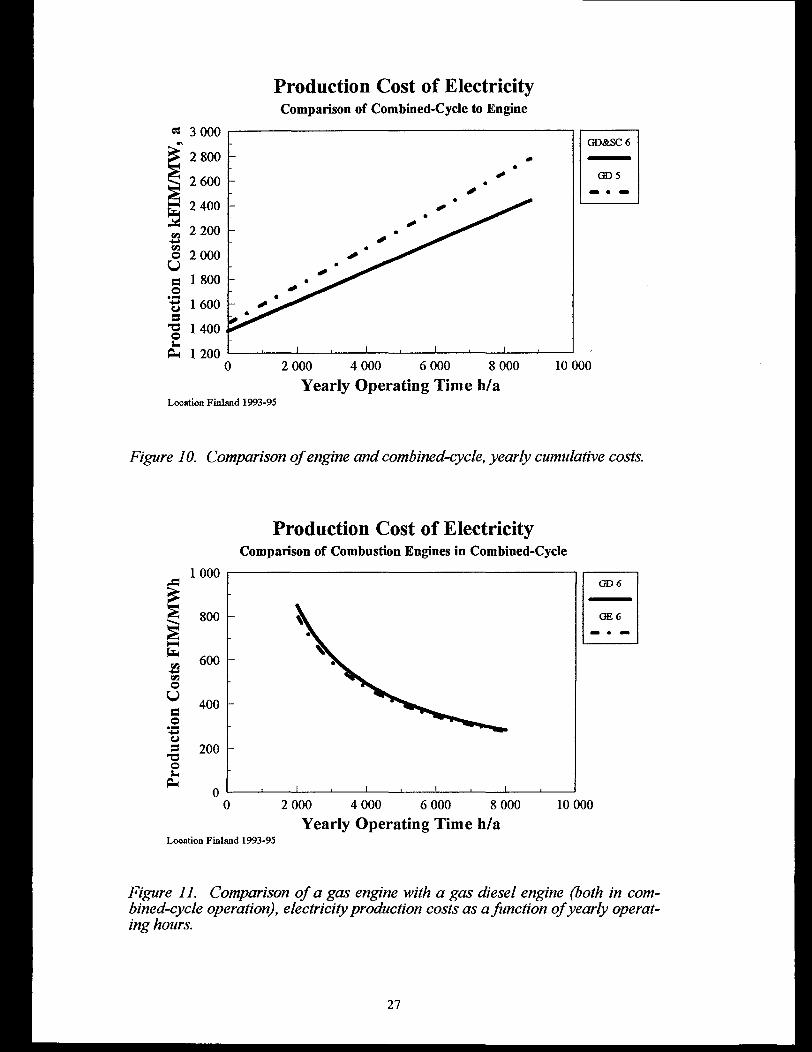
Production Cost of ElectricityComparison of Combined-Cycle to Engine
GD&SC6
10 00000 4 000 6 000 8 (
Yearly Operating Time h/aLocation Finland 1993-95
Figure 10. Comparison of engine and combined-cycle, yearly cumulative costs.
Production Cost of ElectricityComparison of Combustion Engines in Combined-Cycle
GD6
10 0002 000 4 000 6 000 8 000Yearly Operating Time h/a
Location Finland 1993-95
Figure 11. Comparison of a gas engine with a gas diesel engine (both in combined-cycle operation), electricity production costs as a function of yearly operating hours.
27
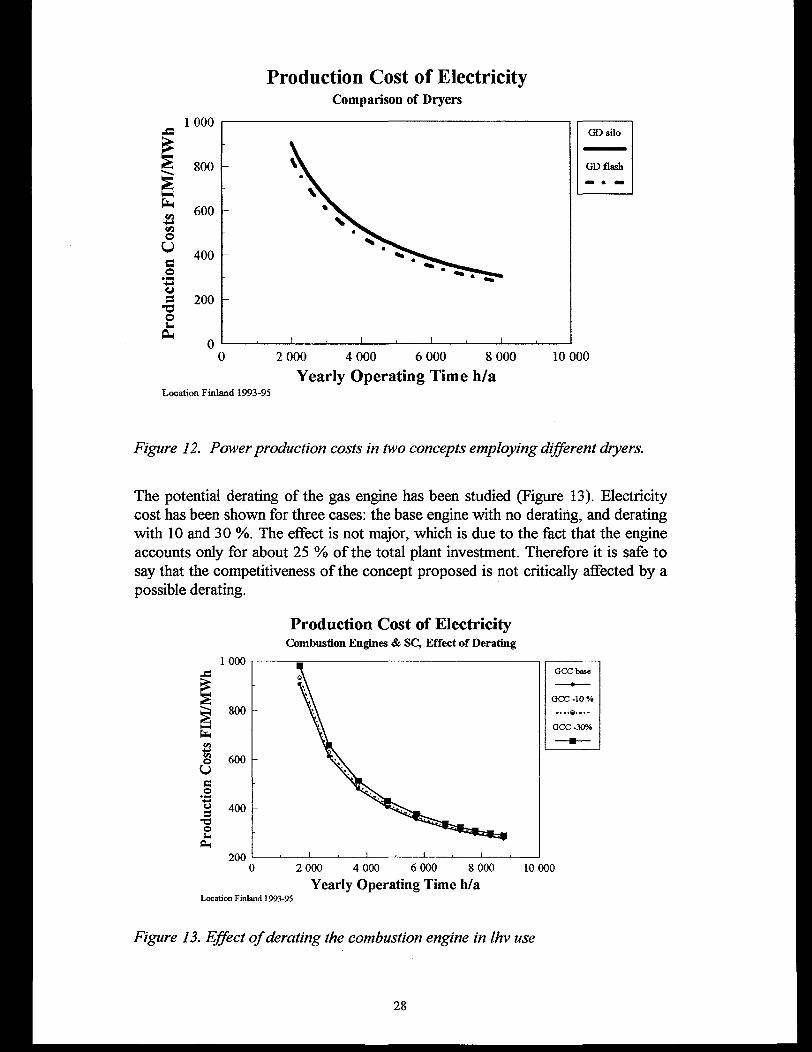
Production Cost of ElectricityComparison of Dryers
GD silo
800 - GD flash
10 00030 4 000 6 000 81
Yearly Operating Time h/aLocation Finland 1993-95
Figure 12. Power production costs in two concepts employing different dryers.
The potential derating of the gas engine has been studied (Figure 13). Electricity cost has been shown for three cases: the base engine with no derating, and derating with 10 and 30 %. The effect is not major, which is due to the fact that the engine accounts only for about 25 % of the total plant investment. Therefore it is safe to say that the competitiveness of the concept proposed is not critically affected by a possible derating.
Production Cost of ElectricityCombustion Engines & SC, Effect of Derating
1 000
GCC -10 %800 -
OCC -30%
600 -
6 000 8 000100 4 000
Yearly Operating Time h/a10 000
Location Finland 1993-95
Figure 13. Effect of derating the combustion engine in Ihv use
28
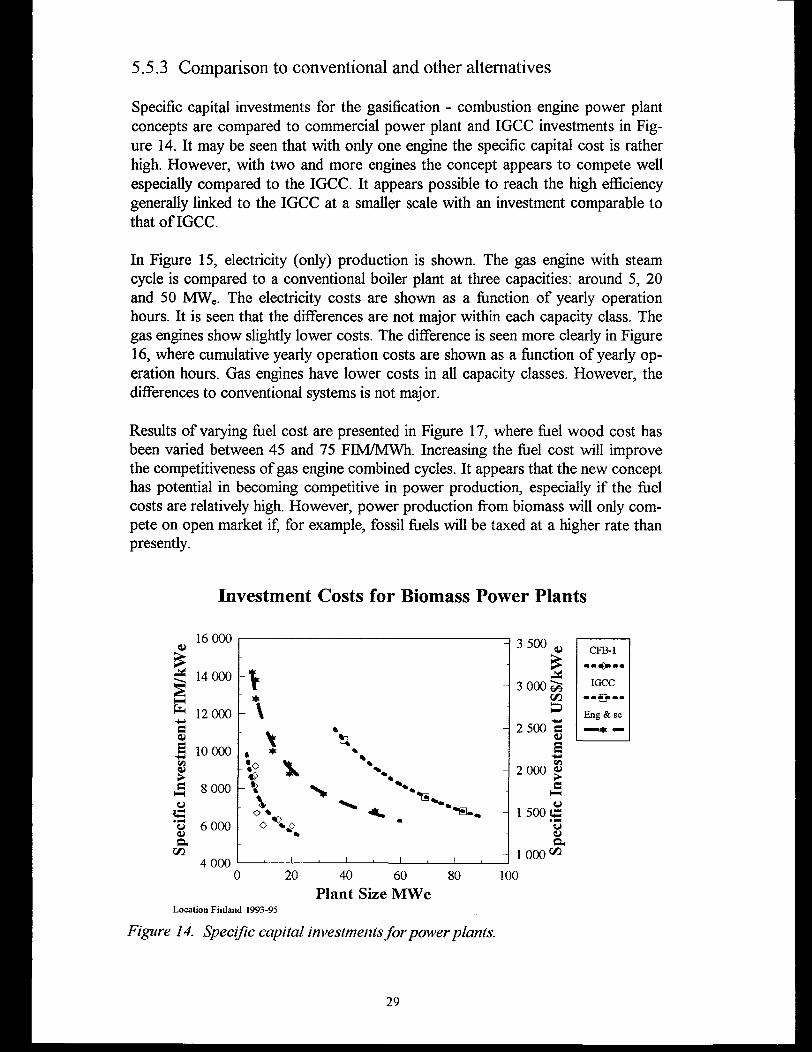
5.5.3 Comparison to conventional and other alternatives
Specific capital investments for the gasification - combustion engine power plant concepts are compared to commercial power plant and IGCC investments in Figure 14. It may be seen that with only one engine the specific capital cost is rather high. However, with two and more engines the concept appears to compete well especially compared to the IGCC. It appears possible to reach the high efficiency generally linked to the IGCC at a smaller scale with an investment comparable to that of IGCC.
In Figure 15, electricity (only) production is shown. The gas engine with steam cycle is compared to a conventional boiler plant at three capacities: around 5, 20 and 50 MWe. The electricity costs are shown as a function of yearly operation hours. It is seen that the differences are not major within each capacity class. The gas engines show slightly lower costs. The difference is seen more clearly in Figure 16, where cumulative yearly operation costs are shown as a function of yearly operation hours. Gas engines have lower costs in all capacity classes. However, the differences to conventional systems is not major.
Results of varying fuel cost are presented in Figure 17, where fuel wood cost has been varied between 45 and 75 FIM/MWh. Increasing the fuel cost will improve the competitiveness of gas engine combined cycles. It appears that the new concept has potential in becoming competitive in power production, especially if the fuel costs are relatively high. However, power production from biomass will only compete on open market if, for example, fossil fuels will be taxed at a higher rate than presently.
Investment Costs for Biomass Power Plants
11 (/)
<Z2P
E
>s
ofi.
Location Finland 1993-95
Figure 14. Specific capital investments for power plants.
29
Production Cost of ElectricityComparison of Combustion Engines to Boiler Plants
CFB 5
800 - CFB 17
CFB 60600 -
GESC6
GESC 19
GESC 50
2 000 8 000 10 0006 000Yearly Operating Time h/a
Location Finland 1993-95
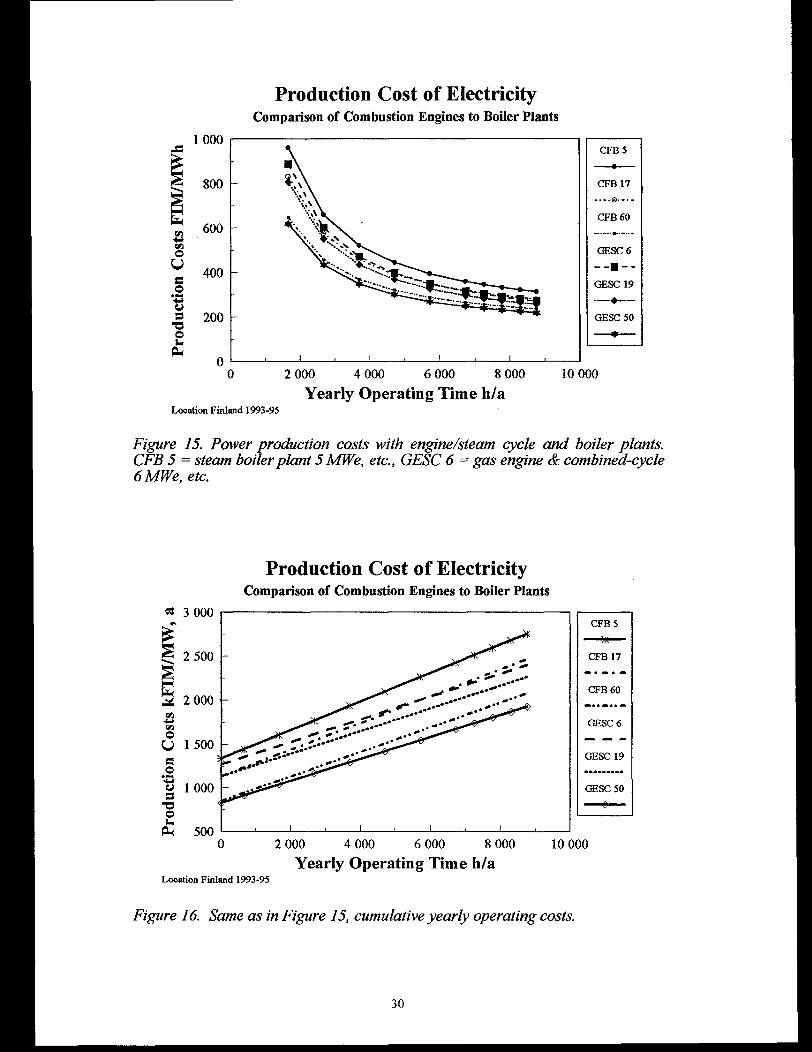
Figure 15. Power production costs with engine/steam cycle and boiler plants. CFB 5 = steam boiler plant 5 MWe, etc., GESC 6 = gas engine & combined-cycle 6MWe, etc.
Production Cost of ElectricityComparison of Combustion Engines to Boiler Plants
3 000CFB 5
2 500 CFB 17
CFB 602 2 000 -
GESC 6
u 1 500 -GESC 19
O 1 000 GESC 50
00 4 000 6 000 81
Yearly Operating Time h/a10 000
Location Finland 1993-95
Figure 16. Same as in Figure 15, cumulative yearly operating costs.
30
Production Cost of Electricity @ 7200 h/aComparison of Combustion Engines to Boiler Plants
CFB5
CFB 17
CFB60
GESC 19300 -
GESC 50250 -
Fuel Wood Cost FIM/MWhLocation Finland 1993-95
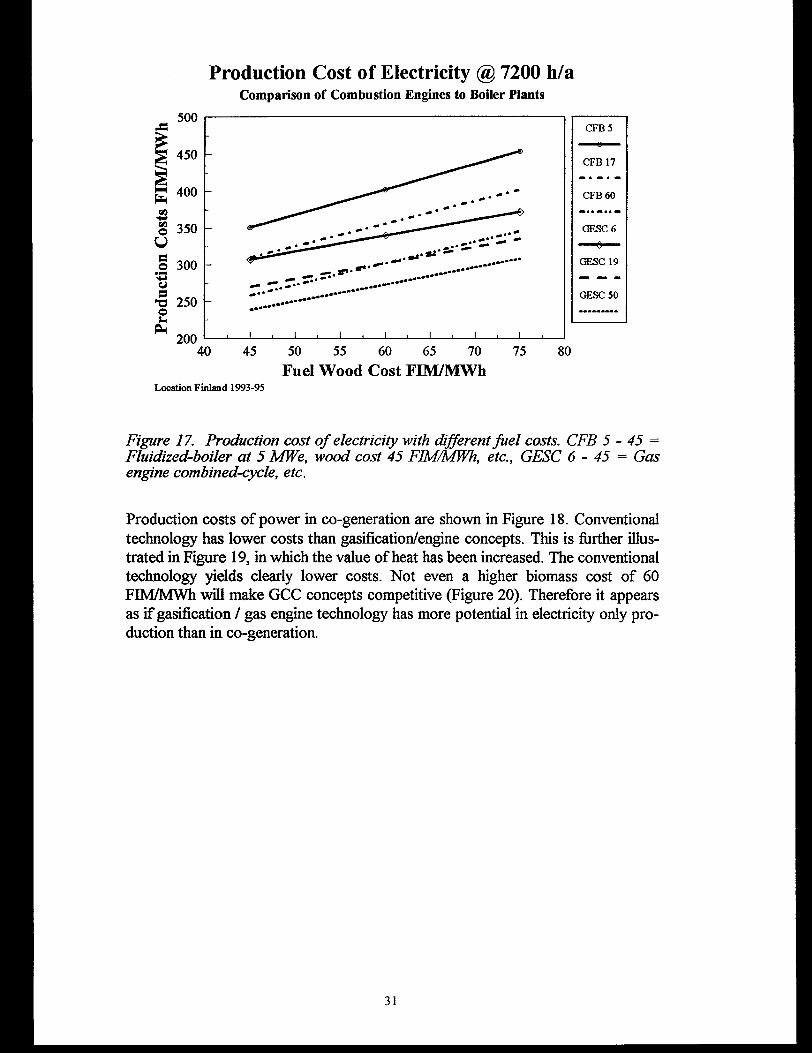
Figure 17. Production cost of electricity with different fuel costs. CFB 5 - 45 =
Fluidized-boiler at 5 MWe, wood cost 45 FIM/MWh, etc., GESC 6 - 45 = Gas engine combined-cycle, etc.
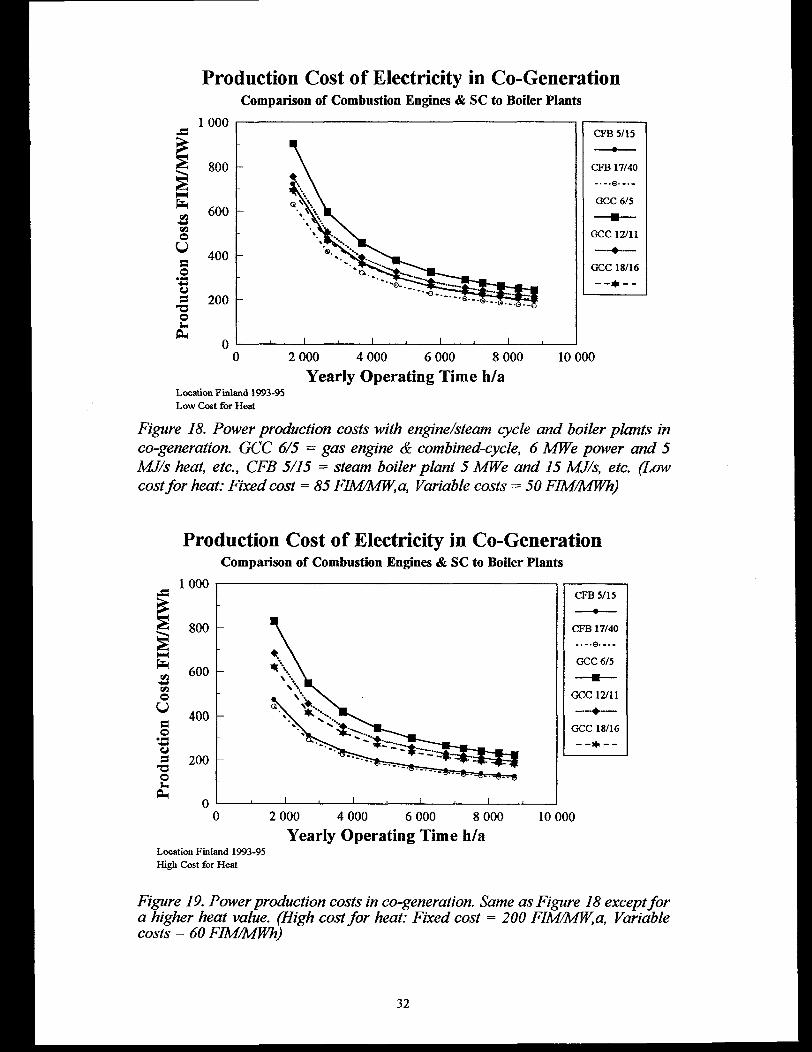
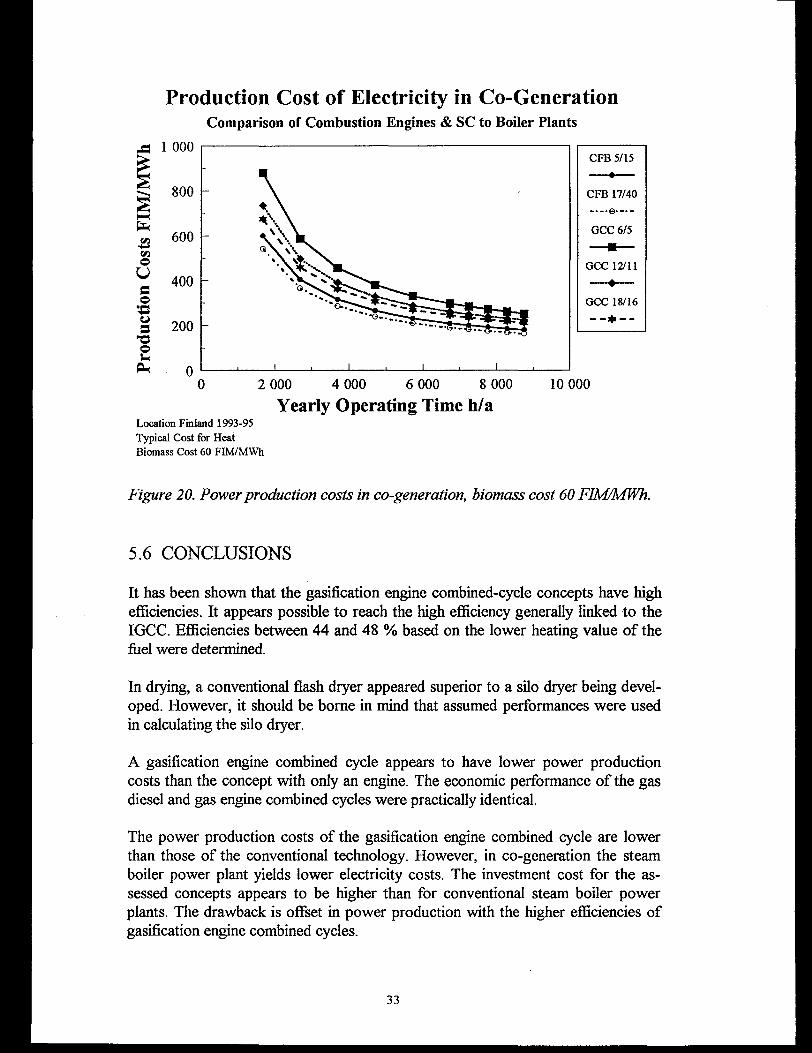
Production costs of power in co-generation are shown in Figure 18. Conventional technology has lower costs than gasification/engine concepts. This is further illustrated in Figure 19, in which the value of heat has been increased. The conventional technology yields clearly lower costs. Not even a higher biomass cost of 60 FIM/MWh will make GCC concepts competitive (Figure 20). Therefore it appears as if gasification / gas engine technology has more potential in electricity only production than in co-generation.
31
Production Cost of Electricity in Co-GenerationComparison of Combustion Engines & SC to Boiler Plants
1 000CFB 5/15
CFB 17/40
GCC6/5
GCC 12/11
400 -GCC 18/16
200 -
00 4 000 6 000 8 (
Yearly Operating Time h/a10 000
Location Finland 1993-95 Low Cost for Heat
Figure 18. Power production costs with engine/steam cycle and boiler plants in co-generation. GCC 6/5 = gas engine & combined-cycle, 6 MWe power and 5 MJ/s heat, etc., CFB 5/15 = steam boiler plant 5 MWe and 15 MJ/s, etc. (Low cost for heat: Fixed cost = 85 FIM/MW,a, Variable costs — 50 FIM/MWh)
Production Cost of Electricity in Co-GenerationComparison of Combustion Engines & SC to Boiler Plants
1000CFB 5/15
CFB 17/40
GCC 6/5
GCC 12/11
GCC 18/16
2 000 4 000 6 000 8 000 10 000Yearly Operating Time h/a
Location Finland 1993-95 High Cost for Heat
Figure 19. Power production costs in co-generation. Same as Figure 18 except for a higher heat value. (High cost for heat: Fixed cost = 200 FIM/MW,a, Variable costs = 60 FIM/MWh)
32
Production Cost of Electricity in Co-GenerationComparison of Combustion Engines & SC to Boiler Plants
©US3
132
CFB 5/15
CFB 17/40
GCC6/5
GCC 12/11
GCC 18/16
200 -
)00 4 000 6 000 8 (
Yearly Operating Time h/a10 000
Location Finland 1993-95 Typical Cost for Heat Biomass Cost 60 FIM/MWh
Figure 20. Power production costs in co-generation, biomass cost 60 FIM/MWh.
5.6 CONCLUSIONS
It has been shown that the gasification engine combined-cycle concepts have high efficiencies. It appears possible to reach the high efficiency generally linked to the IGCC. Efficiencies between 44 and 48 % based on the lower heating value of the fuel were determined.
In drying, a conventional flash dryer appeared superior to a silo dryer being developed. However, it should be borne in mind that assumed performances were used in calculating the silo dryer.
A gasification engine combined cycle appears to have lower power production costs than the concept with only an engine. The economic performance of the gas diesel and gas engine combined cycles were practically identical.
The power production costs of the gasification engine combined cycle are lower than those of the conventional technology. However, in co-generation the steam boiler power plant yields lower electricity costs. The investment cost for the assessed concepts appears to be higher than for conventional steam boiler power plants. The drawback is offset in power production with the higher efficiencies of gasification engine combined cycles.
33
6 MARKET POTENTIAL OF BIOMASS- FUELED POWER PLANTS
6.1 Global biomass use
Biomass is the world's fourth largest energy source today. The biomass resources consist of several different types of material including fuelwood and charcoal, agricultural and forestry residues, and industrial and urban wastes.
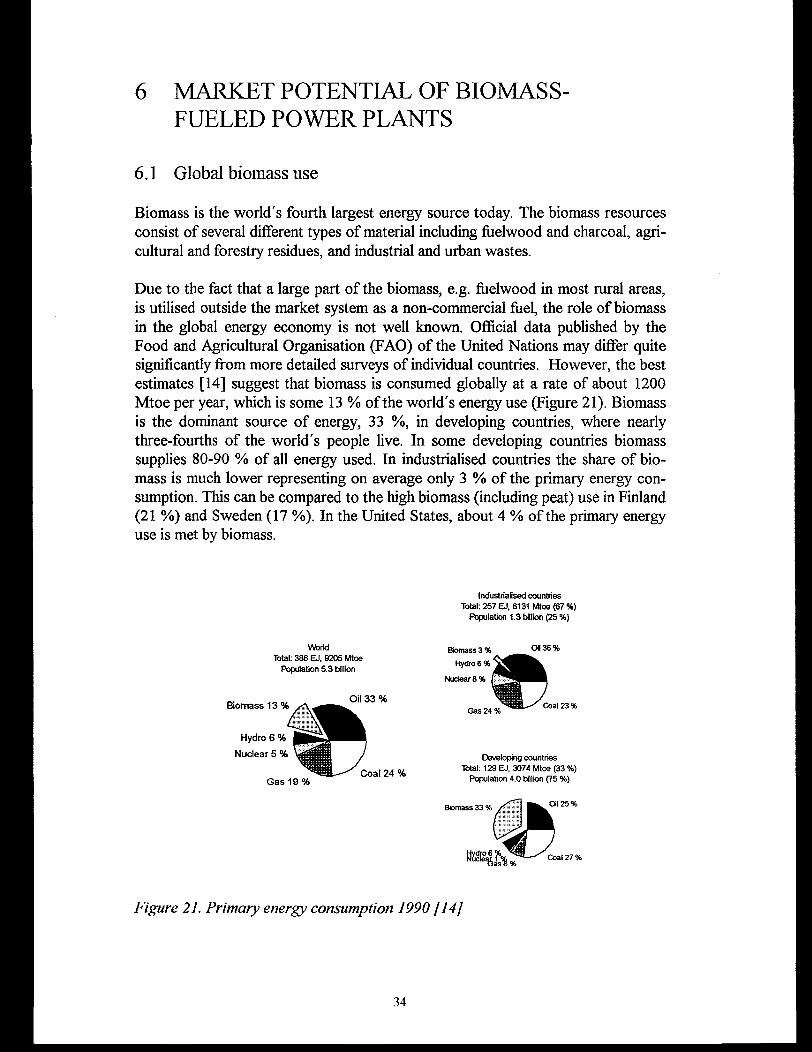
Due to the fact that a large part of the biomass, e g. fuelwood in most rural areas, is utilised outside the market system as a non-commercial fuel, the role of biomass in the global energy economy is not well known. Official data published by the Food and Agricultural Organisation (FAO) of the United Nations may differ quite significantly from more detailed surveys of individual countries. However, the best estimates [14] suggest that biomass is consumed globally at a rate of about 1200 Mtoe per year, which is some 13 % of the world's energy use (Figure 21). Biomass is the dominant source of energy, 33 %, in developing countries, where nearly three-fourths of the world's people live. In some developing countries biomass supplies 80-90 % of all energy used. In industrialised countries the share of biomass is much lower representing on average only 3 % of the primary energy consumption. This can be compared to the high biomass (including peat) use in Finland (21 %) and Sweden (17 %). In the United States, about 4 % of the primary energy use is met by biomass.
Industrialised countries Total: 257 EJ, 6131 Mtoe (67 %)
Population 1.3 billion (25 %)
WorldTotal: 386 EJ, 9205 Mtoe
Population 5.3 billion
Biomass 3% Hyd
Nuclea
3% Oil 36%
Oil 33 %Coal 23%
Gas 19 %Coal 24 %
Developing countries Total: 129 EJ, 3074 Mtoe (33 %)
Population 4.0 billion (75 %)
Figure 21. Primary energy consumption 1990 [14]
34
6.2 Supply of biomass for energy
Currently, the most important sources of biomass in industrial countries constitute residues from forestry, agriculture and industry, and domestic wastes and sludges. Because the residues are relatively inexpensive and can be used locally, they have been used as a fuel source for centuries, and have more recently provided a good feedstock for bioenergy industry in both industrial and developing countries [15]. While the residues provide an important initial feedstock for the bioenergy industry, the development of large scale energy production from biomass will in the future probably rely on specifically grown energy crops such as sugar cane, rape seed, switch grass and short rotation forestry [16]. Large-scale biomass crop production raises many questions about land availability and environmental impacts which must be addressed if bioenergy is to be accepted by the public. However, in tropical countries there are large amounts of deforested and degraded lands that would benefit from the establishment of bioenergy plantations. Species with high dry matter yields could ideally be grown on high-quality agricultural land, for example, set-aside land in Europe and USA.
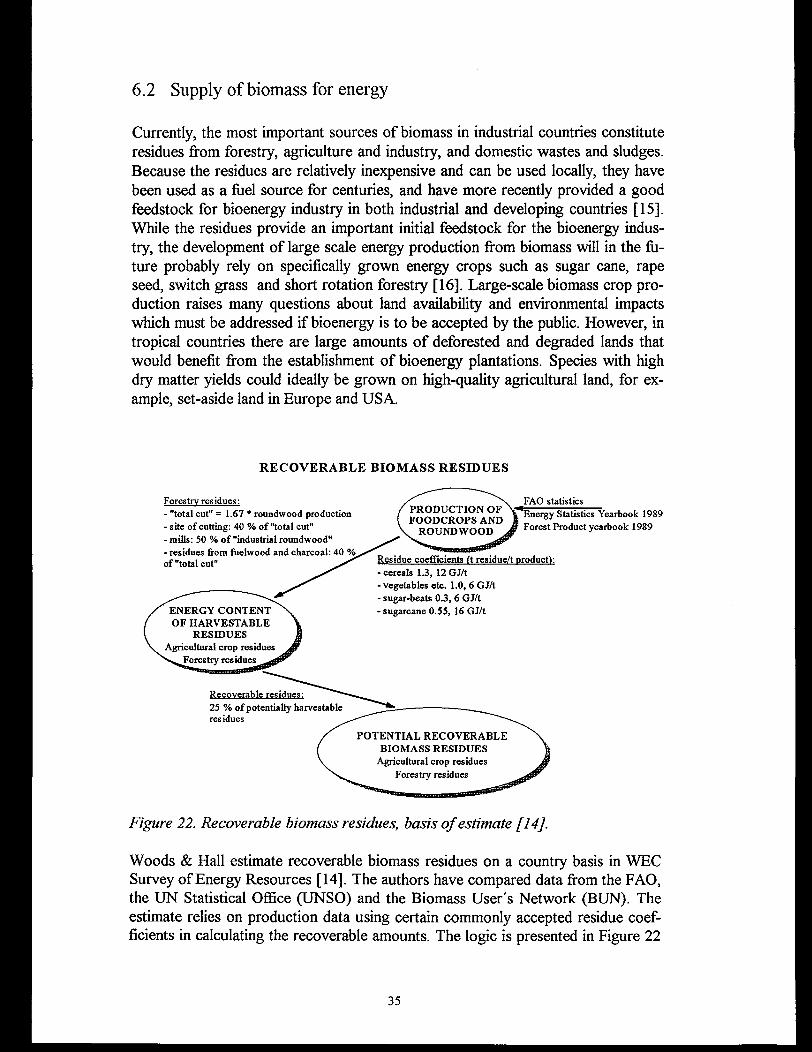
RECOVERABLE BIOMASS RESIDUES
Forestry residues:- "total cut" = 1.67 * roundwood production- site of cutting: 40 % of "total cut"- mills: 50 % of "industrial roundwood"- residues from fuelwood and charcoal: 40 of "total cut"
Energy Statistics Yearbook 1989 Forest Product yearbook 1989
residues
Figure 22. Recoverable biomass residues, basis of estimate [14].
Woods & Hall estimate recoverable biomass residues on a country basis in WEC Survey of Energy Resources [14]. The authors have compared data from the FAO, the UN Statistical Office (UNSO) and the Biomass User's Network (BUN). The estimate relies on production data using certain commonly accepted residue coefficients in calculating the recoverable amounts. The logic is presented in Figure 22
35
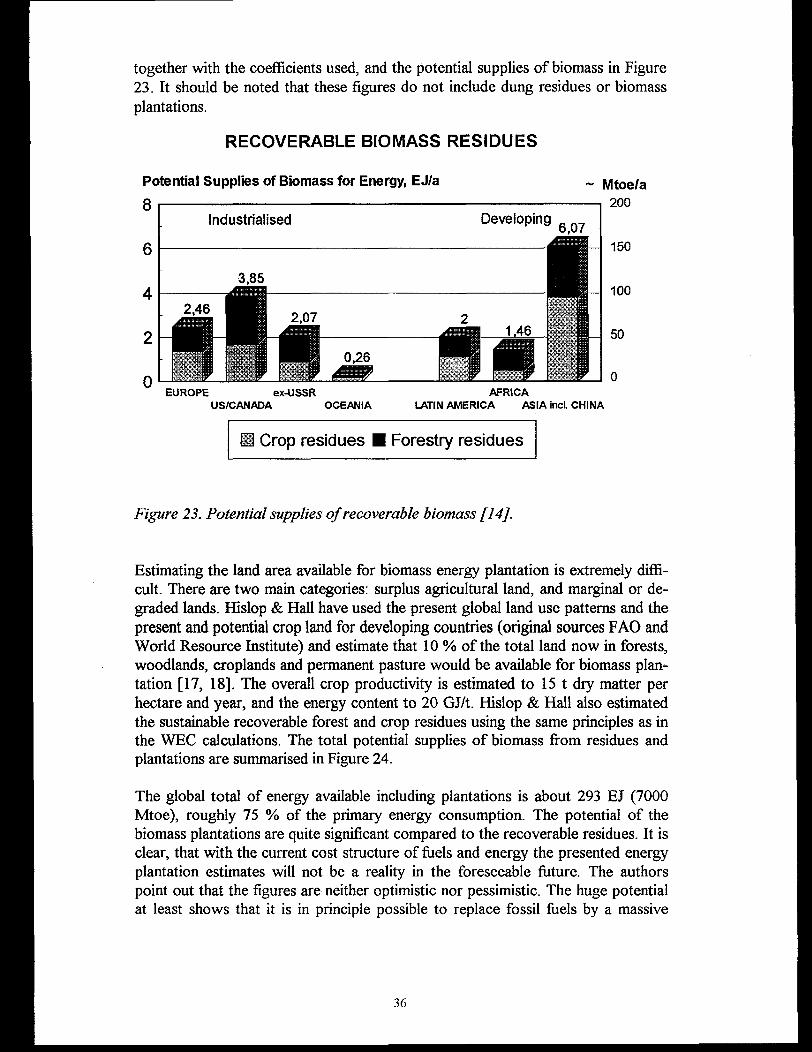
together with the coefficients used, and the potential supplies of biomass in Figure 23. It should be noted that these figures do not include dung residues or biomass plantations.
RECOVERABLE BIOMASS RESIDUES
Potential Supplies of Biomass for Energy, EJ/a ~ Mtoe/a
EUROPE ex-USSR AFRICAUS/CANADA OCEANIA LATIN AMERICA ASIA incl CHINA
Crop residues ■ Forestry residues
Figure 23. Potential supplies of recoverable biomass [14],
Estimating the land area available for biomass energy plantation is extremely difficult. There are two main categories: surplus agricultural land, and marginal or degraded lands. Hislop & Hall have used the present global land use patterns and the present and potential crop land for developing countries (original sources FAO and World Resource Institute) and estimate that 10 % of the total land now in forests, woodlands, croplands and permanent pasture would be available for biomass plantation [17, 18]. The overall crop productivity is estimated to 15 t dry matter per hectare and year, and the energy content to 20 GJ/t. Hislop & Hall also estimated the sustainable recoverable forest and crop residues using the same principles as in the WEC calculations. The total potential supplies of biomass from residues and plantations are summarised in Figure 24.
The global total of energy available including plantations is about 293 EJ (7000 Mtoe), roughly 75 % of the primary energy consumption. The potential of the biomass plantations are quite significant compared to the recoverable residues. It is clear, that with the current cost structure of fuels and energy the presented energy plantation estimates will not be a reality in the foreseeable future. The authors point out that the figures are neither optimistic nor pessimistic. The huge potential at least shows that it is in principle possible to replace fossil fuels by a massive
36
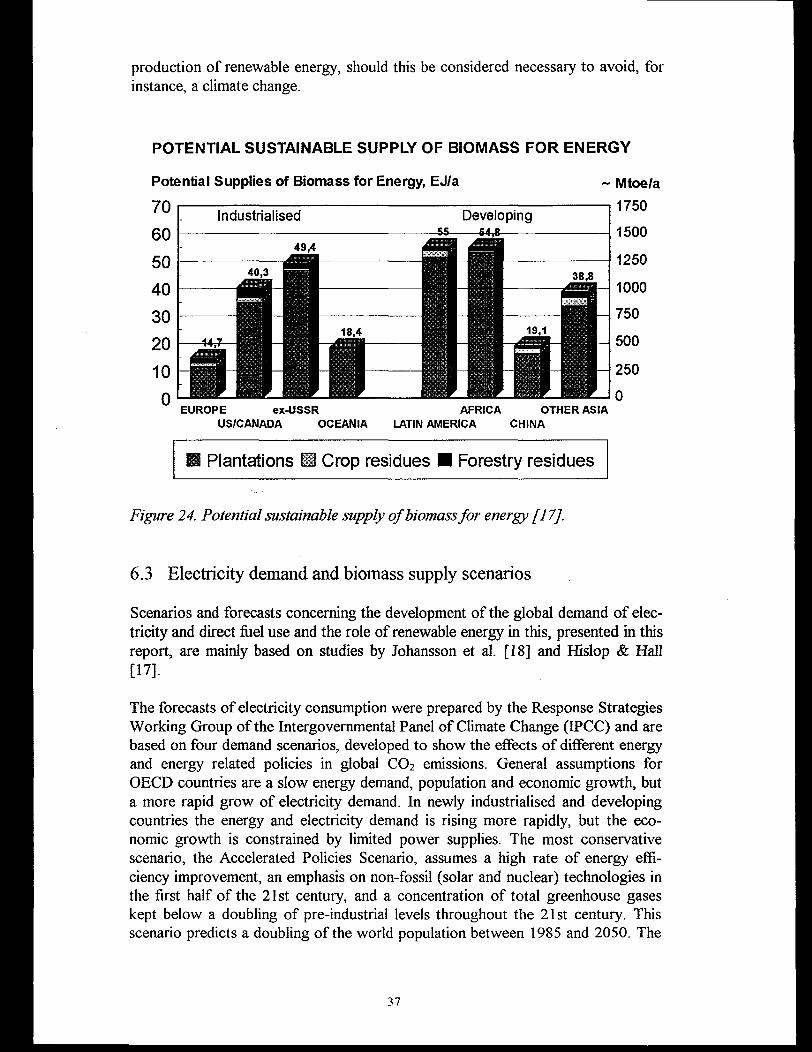
production of renewable energy, should this be considered necessary to avoid, for instance, a climate change.
POTENTIAL SUSTAINABLE SUPPLY OF BIOMASS FOR ENERGY
Potential Supplies of Biomass for Energy, EJ/a ~ Mtoe/a
1750
1500
1250
1000
750
500
250
0EUROPE ex-USSR AFRICA OTHER ASIA
US/CANADA OCEANIA LATIN AMERICA CHINA
■ Plantations H Crop residues ■ Forestry residues
Figure 24. Potential sustainable supply of biomass for energy [17].
6.3 Electricity demand and biomass supply scenarios
Scenarios and forecasts concerning the development of the global demand of electricity and direct fuel use and the role of renewable energy in this, presented in this report, are mainly based on studies by Johansson et al. [18] and Hlslop & Hall[17].
The forecasts of electricity consumption were prepared by the Response Strategies Working Group of the Intergovernmental Panel of Climate Change (IPCC) and are based on four demand scenarios, developed to show the effects of different energy and energy related policies in global CO2 emissions. General assumptions for OECD countries are a slow energy demand, population and economic growth, but a more rapid grow of electricity demand. In newly industrialised and developing countries the energy and electricity demand is rising more rapidly, but the economic growth is constrained by limited power supplies. The most conservative scenario, the Accelerated Policies Scenario, assumes a high rate of energy efficiency improvement, an emphasis on non-fossil (solar and nuclear) technologies in the first half of the 21st century, and a concentration of total greenhouse gases kept below a doubling of pre-industrial levels throughout the 21st century. This scenario predicts a doubling of the world population between 1985 and 2050. The
37
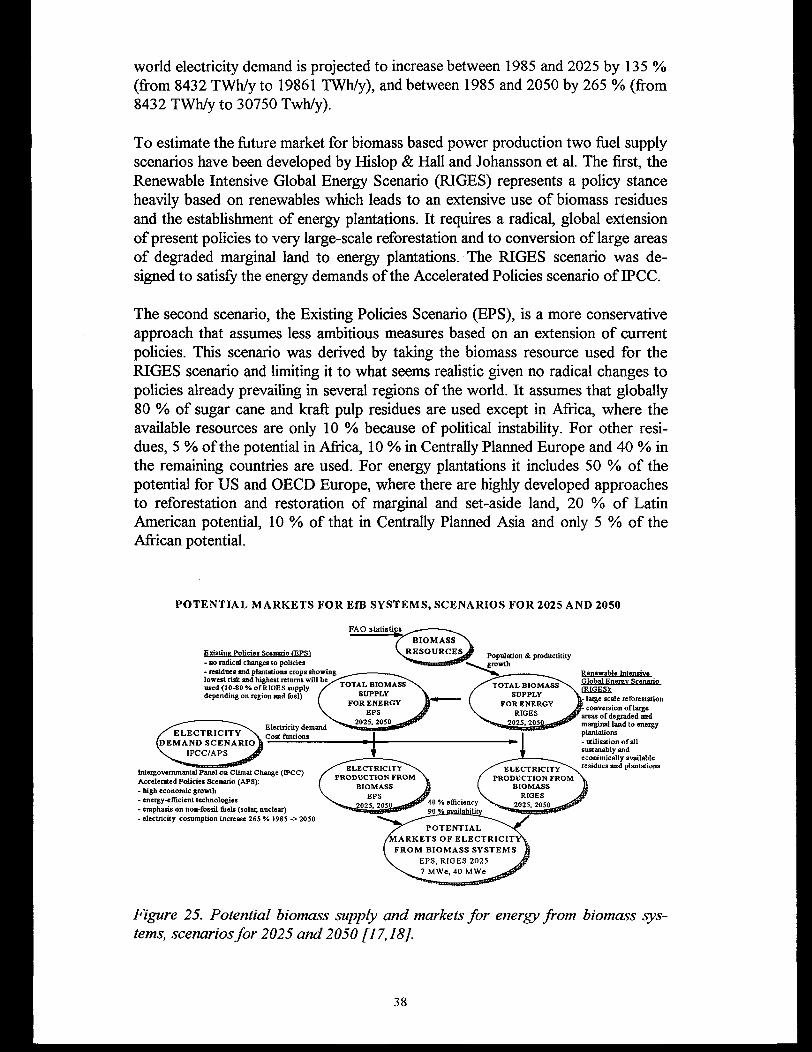
world electricity demand is projected to increase between 1985 and 2025 by 135 % (from 8432 TWh/y to 19861 TWh/y), and between 1985 and 2050 by 265 % (from 8432 TWh/y to 30750 Twh/y).
To estimate the future market for biomass based power production two fuel supply scenarios have been developed by Hislop & Hall and Johansson et al. The first, the Renewable Intensive Global Energy Scenario (RIGES) represents a policy stance heavily based on renewables which leads to an extensive use of biomass residues and the establishment of energy plantations. It requires a radical, global extension of present policies to very large-scale reforestation and to conversion of large areas of degraded marginal land to energy plantations. The RIGES scenario was designed to satisfy the energy demands of the Accelerated Policies scenario of IPCC.
The second scenario, the Existing Policies Scenario (EPS), is a more conservative approach that assumes less ambitious measures based on an extension of current policies. This scenario was derived by taking the biomass resource used for the RIGES scenario and limiting it to what seems realistic given no radical changes to policies already prevailing in several regions of the world. It assumes that globally 80 % of sugar cane and kraft pulp residues are used except in Africa, where the available resources are only 10 % because of political instability. For other residues, 5 % of the potential in Africa, 10 % in Centrally Planned Europe and 40 % in the remaining countries are used. For energy plantations it includes 50 % of the potential for US and OECD Europe, where there are highly developed approaches to reforestation and restoration of marginal and set-aside land, 20 % of Latin American potential, 10 % of that in Centrally Planned Asia and only 5 % of the African potential.
POTENTIAL MARKETS FOR E1B SYSTEMS, SCENARIOS FOR 2025 AND 2050
FAO statistics
Existing Policies Scenario (EPS)- no radical changes to policies- residues and plantations crops showing lowest risk and highest returns will be/ used (10-80 % of RIGES supply f depending on region and fuel) f
Renewable IntensiveGlobal Energy Scenario(RIGES):
1- large scale reforestation f- conversion of large areas of degraded and marginal land to energy plantations - utilisation of all sustanably and "•'onimically available
sidues and plantations
Electricity demand Cost fimtions 1-----------i
Intergovernmental Panel on Climat Change (IPCC) Accelerated Policies Scenario (APS):- high economic growth- energy-efficient technologies• emphasis on non-fossil fuels (solar, nuclear)- electricity cosumption increase 265 */• 1985 -> 2050
Figure 25. Potential biomass supply and markets for energy from biomass systems, scenarios for 2025 and 2050 [17,18].
38
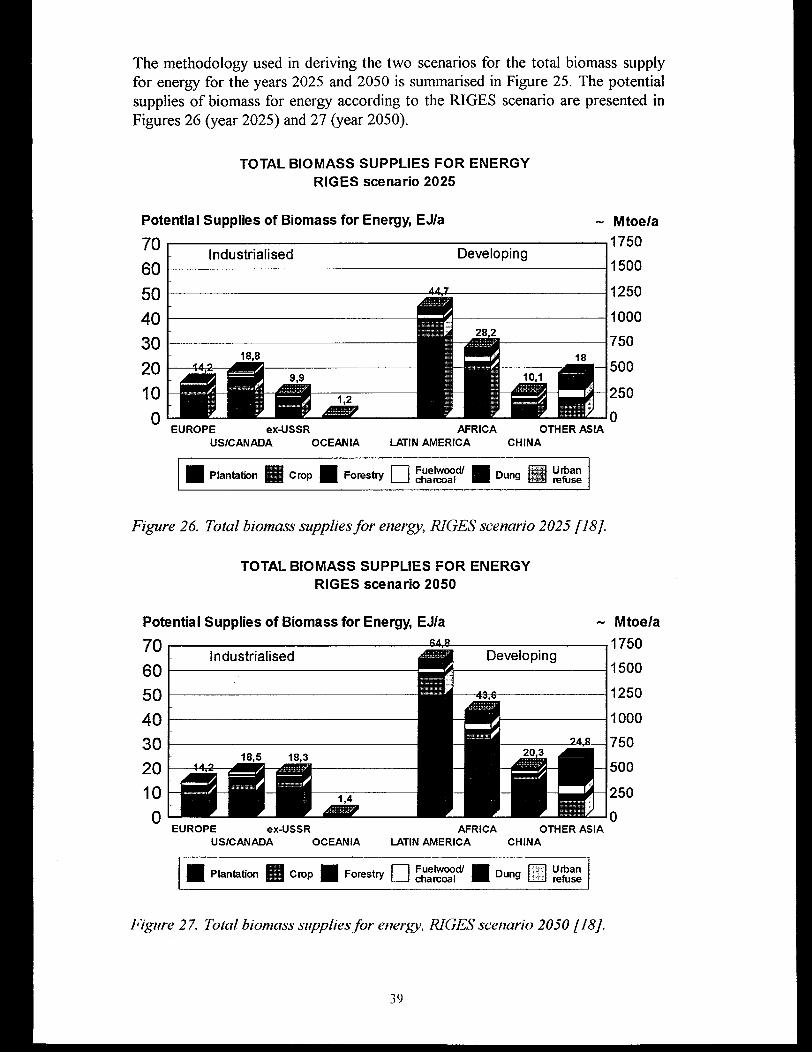
The methodology used in deriving the two scenarios for the total biomass supply for energy for the years 2025 and 2050 is summarised in Figure 25. The potential supplies of biomass for energy according to the RIGES scenario are presented in Figures 26 (year 2025) and 27 (year 2050).
TOTAL BIOMASS SUPPLIES FOR ENERGY RIGES scenario 2025
Potential Supplies of Biomass for Energy, EJ/a M toe/a
706050403020100
Industrialised
18,8
EUROPE ex-USSRUS/CANADA OCEANIA
Developing
AAJ-
1750
1500
1250
1000
750
500
250
0AFRICA OTHER ASIA
LATIN AMERICA CHINA
g Plantation g Crop g Forestry Q Dung a”” Urban refuse
Figure 26. Total biomass supplies for energy, RIGES scenario 2025 [18].
TOTAL BIOMASS SUPPLIES FOR ENERGY RIGES scenario 2050
Potential Supplies of Biomass for Energy, EJ/a M toe/a 1750
1500
1250
1000
750
500
250
0
g Plantation g Crop g Forestry Q SSEST g Dun9 Urbanrefuse
Figure 27. Total biomass supplies for energy, RIGES scenario 2050 [ 18].
39
Comparing Figures 23, 24, 26 and 27 describing present and future global biomass resources, it seems clear that the largest present biomass supply potential comprises the plantations, and that the most significant growth of available biomass resources can in the future been found in the developing countries. Regardless of the uncertainties involved in the projected scenarios, it can be concluded that the potential sustainable supply of biomass is huge.
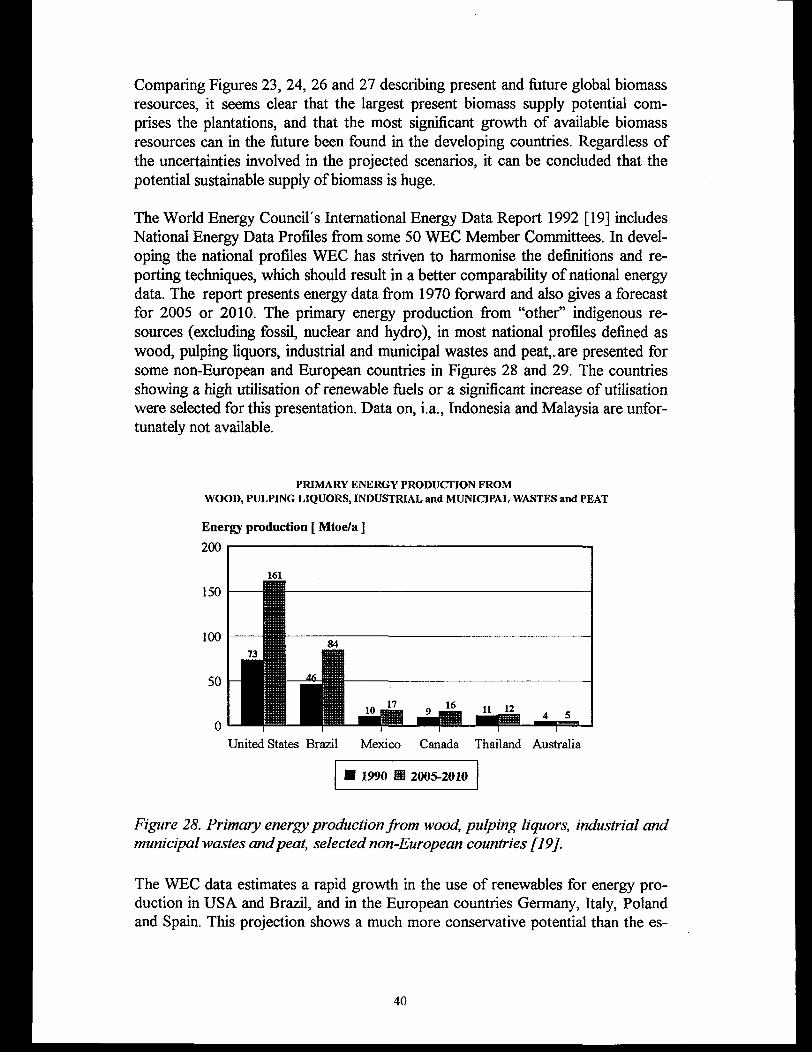
The World Energy Council's International Energy Data Report 1992 [19] includes National Energy Data Profiles from some 50 WEC Member Committees. In developing the national profiles WEC has striven to harmonise the definitions and reporting techniques, which should result in a better comparability of national energy data. The report presents energy data from 1970 forward and also gives a forecast for 2005 or 2010. The primary energy production from “other” indigenous resources (excluding fossil, nuclear and hydro), in most national profiles defined as wood, pulping liquors, industrial and municipal wastes and peat,, are presented for some non-European and European countries in Figures 28 and 29. The countries showing a high utilisation of renewable fuels or a significant increase of utilisation were selected for this presentation. Data on, i.a., Indonesia and Malaysia are unfortunately not available.
PRIMARY ENERGY PRODUCTION FROM WOOD, PULPING LIQUORS, INDUSTRIAL and MUNICIPAL WASTES and PEAT
■ 1990 8 2005-2010
Figure 28. Primary energy production from wood, pulping liquors, industrial and municipal wastes and peat, selected non-European countries [19].
The WEC data estimates a rapid growth in the use of renewables for energy production in USA and Brazil, and in the European countries Germany, Italy, Poland and Spain. This projection shows a much more conservative potential than the es-
40
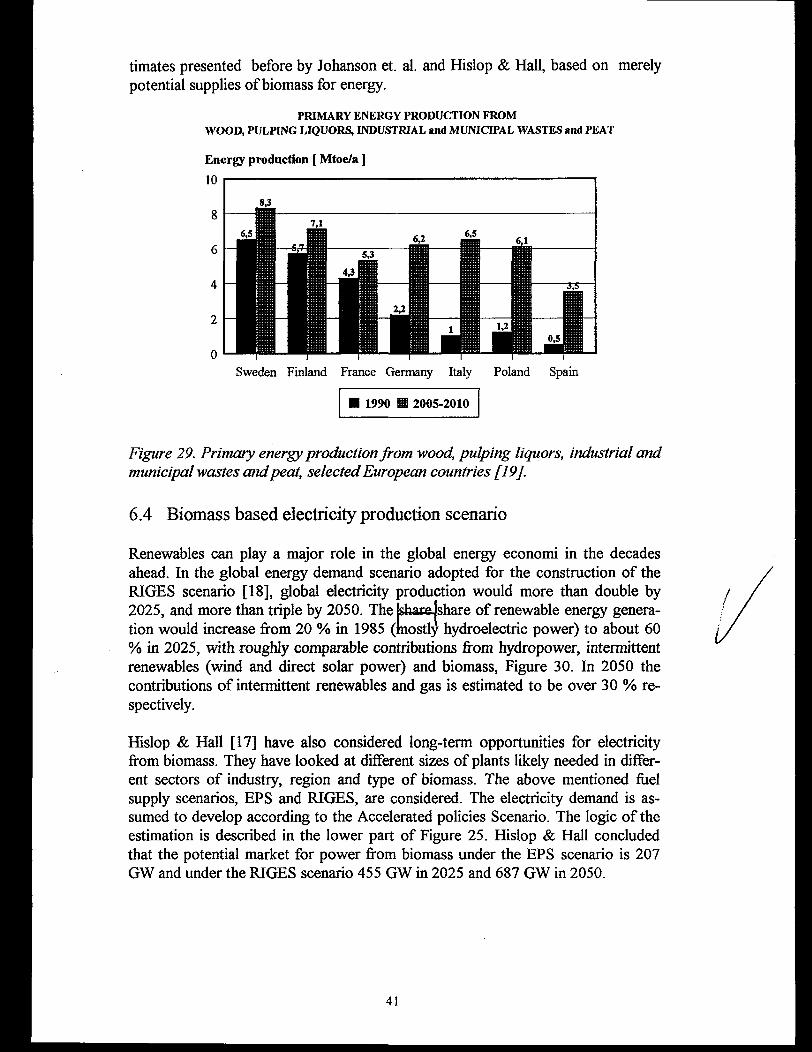
timates presented before by Johanson et. al. and Hislop & Hall, based on merely potential supplies of biomass for energy.
PRIMARY ENERGY PRODUCTION FROM WOOD, PULPING LIQUORS, INDUSTRIAL and MUNICIPAL WASTES and PEAT
Energy production [ Mtoe/a ]
Sweden Finland France Germany Italy Poland Spain
■ 1990 H 2005-2010
Figure 29. Primary energy production from wood, pulping liquors, industrial and municipal wastes and peat, selected European countries [19],
6.4 Biomass based electricity production scenario
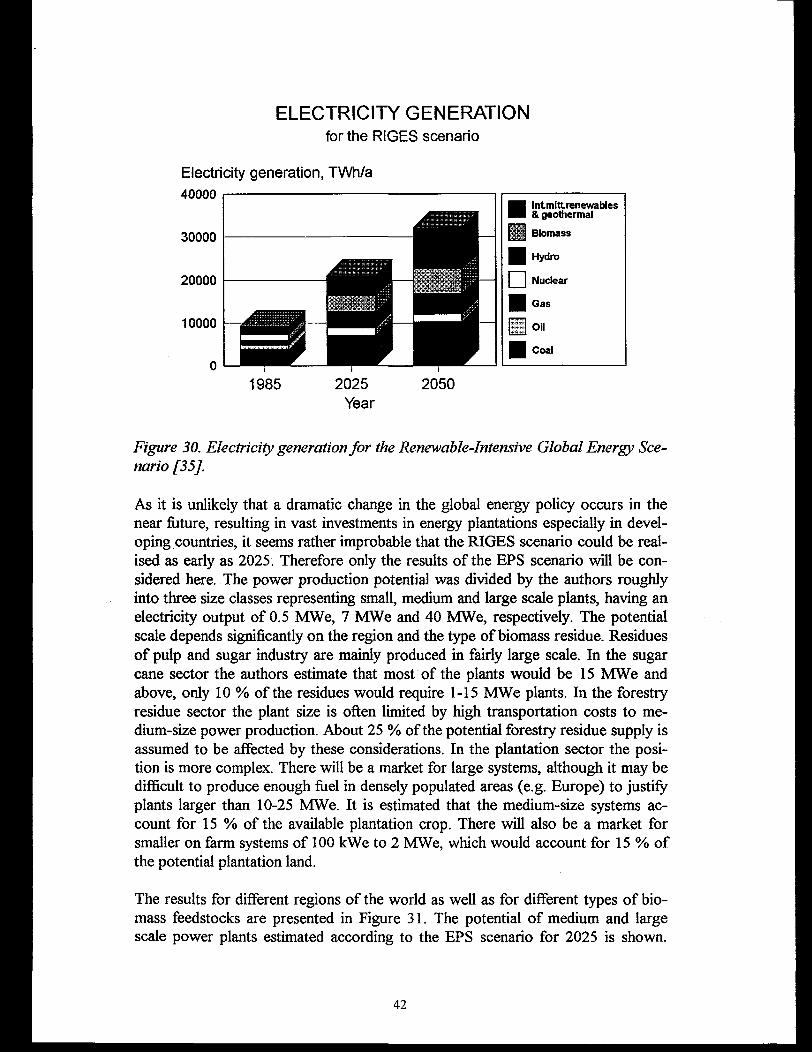
Renewables can play a major role in the global energy economi in the decades ahead. In the global energy demand scenario adopted for the construction of the RIGES scenario [18], global electricity production would more than double by 2025, and more than triple by 2050. The shaceJshare of renewable energy generation would increase from 20 % in 1985 (mostly hydroelectric power) to about 60 % in 2025, with roughly comparable contributions from hydropower, intermittent renewables (wind and direct solar power) and biomass, Figure 30. In 2050 the contributions of intermittent renewables and gas is estimated to be over 30 % respectively.
Hislop & Hall [17] have also considered long-term opportunities for electricity from biomass. They have looked at different sizes of plants likely needed in different sectors of industry, region and type of biomass. The above mentioned fuel supply scenarios, EPS and RIGES, are considered. The electricity demand is assumed to develop according to the Accelerated policies Scenario. The logic of the estimation is described in the lower part of Figure 25. Hislop & Hall concluded that the potential market for power from biomass under the EPS scenario is 207 GW and under the RIGES scenario 455 GW in 2025 and 687 GW in 2050.
41
ELECTRICITY GENERATIONfor the RIGES scenario
Electricity generation, TWh/a 40000
Intmitt renewables & geothermal
Figure 30. Electricity generation for the Renewable-Intensive Global Energy Scenario [35J.
As it is unlikely that a dramatic change in the global energy policy occurs in the near future, resulting in vast investments in energy plantations especially in developing countries, it seems rather improbable that the RIGES scenario could be realised as early as 2025. Therefore only the results of the EPS scenario will be considered here. The power production potential was divided by the authors roughly into three size classes representing small, medium and large scale plants, having an electricity output of 0.5 MWe, 7 MWe and 40 MWe, respectively. The potential scale depends significantly on the region and the type of biomass residue. Residues of pulp and sugar industry are mainly produced in fairly large scale. In the sugar cane sector the authors estimate that most of the plants would be 15 MWe and above, only 10 % of the residues would require 1-15 MWe plants. In the forestry residue sector the plant size is often limited by high transportation costs to medium-size power production. About 25 % of the potential forestry residue supply is assumed to be affected by these considerations. In the plantation sector the position is more complex. There will be a market for large systems, although it may be difficult to produce enough fuel in densely populated areas (e.g. Europe) to justify plants larger than 10-25 MWe. It is estimated that the medium-size systems account for 15 % of the available plantation crop. There will also be a market for smaller on farm systems of 100 kWe to 2 MWe, which would account for 15 % of the potential plantation land.
The results for different regions of the world as well as for different types of biomass feedstocks are presented in Figure 31. The potential of medium and large scale power plants estimated according to the EPS scenario for 2025 is shown.
42
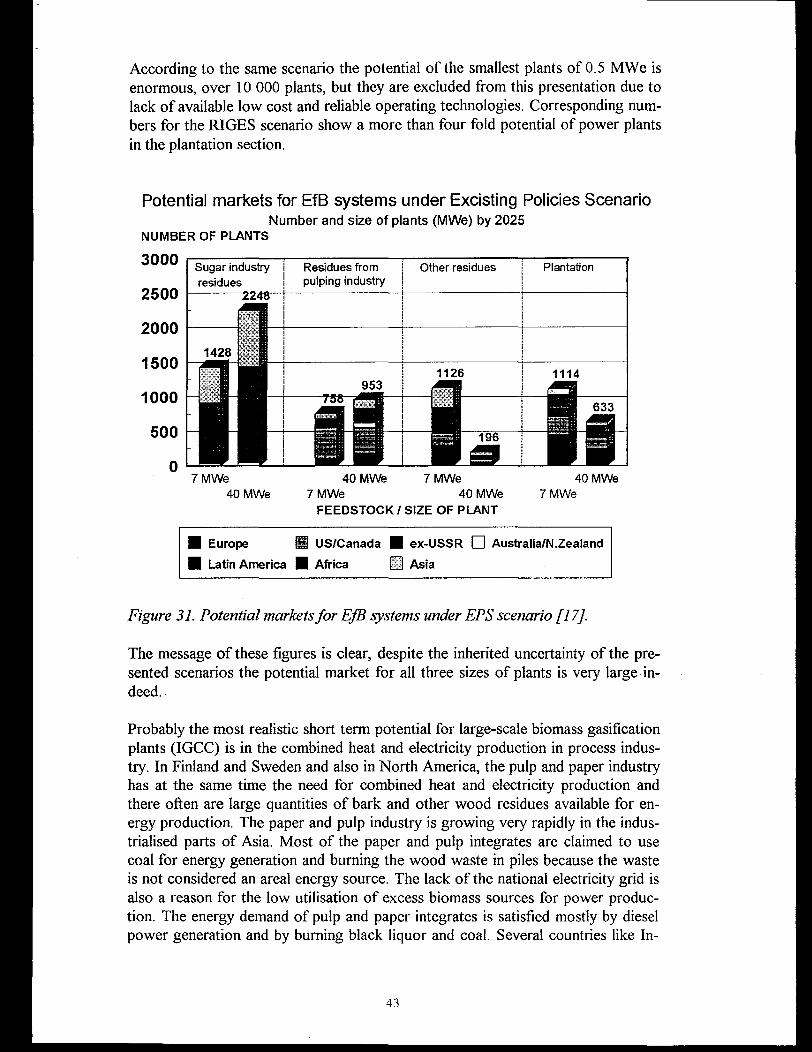
According to the same scenario the potential of the smallest plants of 0.5 MWe is enormous, over 10 000 plants, but they are excluded from this presentation due to lack of available low cost and reliable operating technologies. Corresponding numbers for the RIGES scenario show a more than four fold potential of power plants in the plantation section.
Potential markets for EfB systems under Excisting Policies ScenarioNumber and size of plants (MWe) by 2025
NUMBER OF PLANTS
3000
2500
2000
1500
1000
500
07 MWe
40 MWe40 MWe 7 MWe
7 MWe 40 MWeFEEDSTOCK / SIZE OF PLANT
40 MWe 7 MWe
H Europe H US/Canada H ex-USSR □ Australia/N.Zealand
H Latin America H Africa □ Asia
Figure 31. Potential markets for EfB systems under EPS scenario [17J.
The message of these figures is clear, despite the inherited uncertainty of the presented scenarios the potential market for all three sizes of plants is very large indeed.
Probably the most realistic short term potential for large-scale biomass gasification plants (IGCC) is in the combined heat and electricity production in process industry. In Finland and Sweden and also in North America, the pulp and paper industry has at the same time the need for combined heat and electricity production and there often are large quantities of bark and other wood residues available for energy production. The paper and pulp industry is growing very rapidly in the industrialised parts of Asia. Most of the paper and pulp integrates are claimed to use coal for energy generation and burning the wood waste in piles because the waste is not considered an areal energy source. The lack of the national electricity grid is also a reason for the low utilisation of excess biomass sources for power production. The energy demand of pulp and paper integrates is satisfied mostly by diesel power generation and by burning black liquor and coal. Several countries like In
43
dia, Pakistan, Russia and China are known to have large biomass resources and are likely to become important market arisen the future. However, it was impossible to assess the biomass potential of these countries due to lack of reliable information.
The sugar mills are another industrial field, where the growth in power demand is not matched by the growth in capacity, but low-grade biomass resources, usually residues, are under-used and readily available. According to Figure 31 there is a huge potential in medium and large scale power production especially in Latin America (mainly in Brazil) and Asia. The energy requirements of the sugar industry consists predominantly of power for machinery and of heat for evaporation processes. This energy is currently provided by bagasse. Tops and leaves are also a potential biomass resources, but currently not widely utilised.
The role and potential of the sugar cane industry is extensively reviewed in references [20, 21] (the ASEAN region, India) and [23, 24] (global potential). Bagasse is currently combusted in boilers having very low steam values and electricity production efficiencies, the order of 5 % being fairly typical to the boilers of the sugar industry. The electricity yield could be increased to about 15 % of the bagasse energy content by replacing the present boilers by high pressure boilers [20]. The use of IGCC and STIG technology could increase the electricity yield easily up to 30- 35 % depending on the size of the plant and on the design of the power cycle [23, 24]. Larson et al. [24] estimated the total global potential of bagasse-based IGCC/STIG plants at 51.5 GW on the basis of the 1985 global cane production using an electricity yield of 33 % and an annual capacity factor of 75 % (corresponding to 1 700 plants of 30 MWe). 54 % of this potential is in Latin America and 27 % in Asia.
The average size of typical sugar mills varies depending on region, age and structure of the industry. In India the mills are old and have a small capacity averaging 2100 TCD (tonnes of cane per day), in Australia and Brazil the average size is 8000 TCD, in Indonesia 5000 TCD and in Thailand the relatively new mills have an average capacity of 10-15000 TCD. The wet (50 %) bagasse residues comprise about 30 % of the cane production [21] and considering a 30 % electricity yield easily achievable with gasification systems, this corresponds to a power production potential of about 20 MWe for the smallest mills up to 80-120 MWe for the largest ones.
The prospects for gasification systems in the sugar industry depend heavily on local and regional conditions, infrastructure, availability of a national grid and national price policies. The sugar cane production is not necessarily an all-year production, which calls for other fuels (such as coal) to be used in power production during off-milling seasons.
44
6.5 European projections
The European Commission has recently prepared a scenario on European energy to 2020 [25]. Four different scenarios are developed to produce a range of energy futures that could apply in the European Community over the next 25 years. In this presentation only the Conventional Wisdom scenario is referred to. This scenario represents the “business as usual” world, the baseline (traditional) projection, with the current structural social and economical problems and a economic growth that gradually weakens in the long term.
In the Conventional Wisdom world, global energy supply is likely to grow from 8400 Mtoe in 1990 to about 12600 Mtoe in 2020, an average annual increase of 1.6 %. Natural gas is forecast to be the fastest growing fuel at around 2.7 % p.a.. The supply of solid fuels (mainly coal) will grow in the developing world and the renewable fuels are forecast to grow at about 2.0 % p.a..
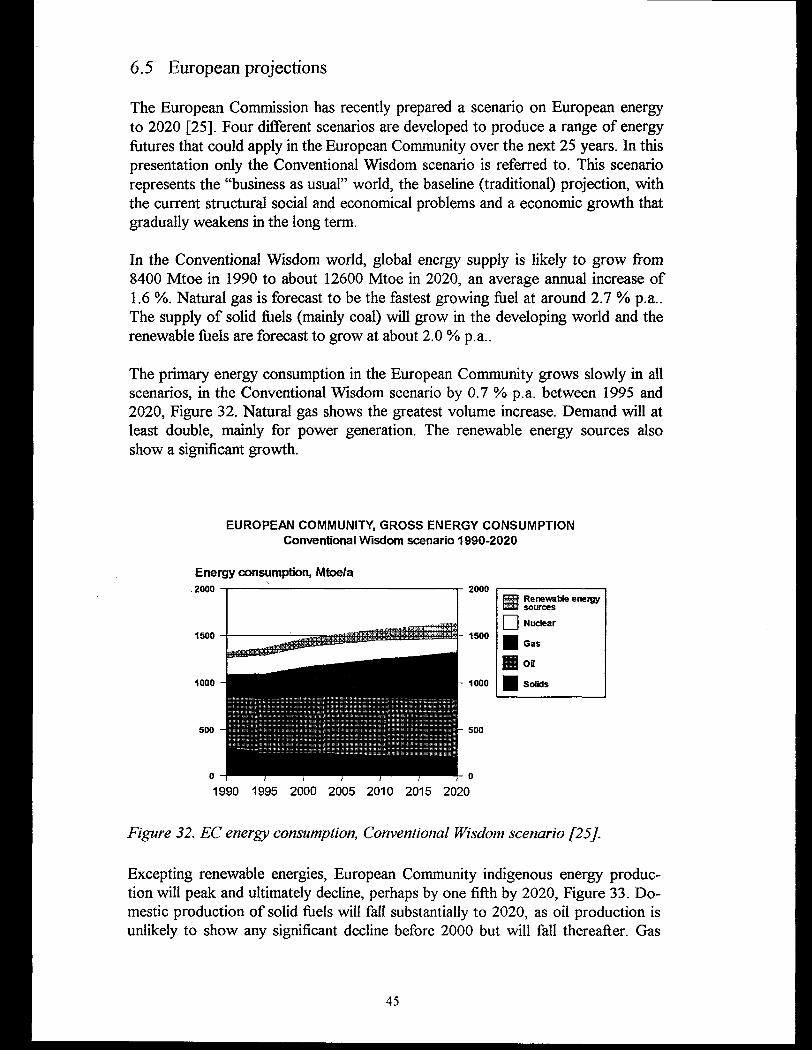
The primary energy consumption in the European Community grows slowly in all scenarios, in the Conventional Wisdom scenario by 0.7 % p.a. between 1995 and 2020, Figure 32. Natural gas shows the greatest volume increase. Demand will at least double, mainly for power generation. The renewable energy sources also show a significant growth.
EUROPEAN COMMUNITY, GROSS ENERGY CONSUMPTION Conventional Wisdom scenario 1990-2020
Energy consumption, Mtoe/a2000
1500
1000
500 -
2000
1500
1000
500
0 0
1990 1995 2000 2005 2010 2015 2020
Figure 32. EC energy consumption, Conventional Wisdom scenario [25J.
Excepting renewable energies, European Community indigenous energy production will peak and ultimately decline, perhaps by one fifth by 2020, Figure 33. Domestic production of solid fuels will fall substantially to 2020, as oil production is unlikely to show any significant decline before 2000 but will fall thereafter. Gas
45
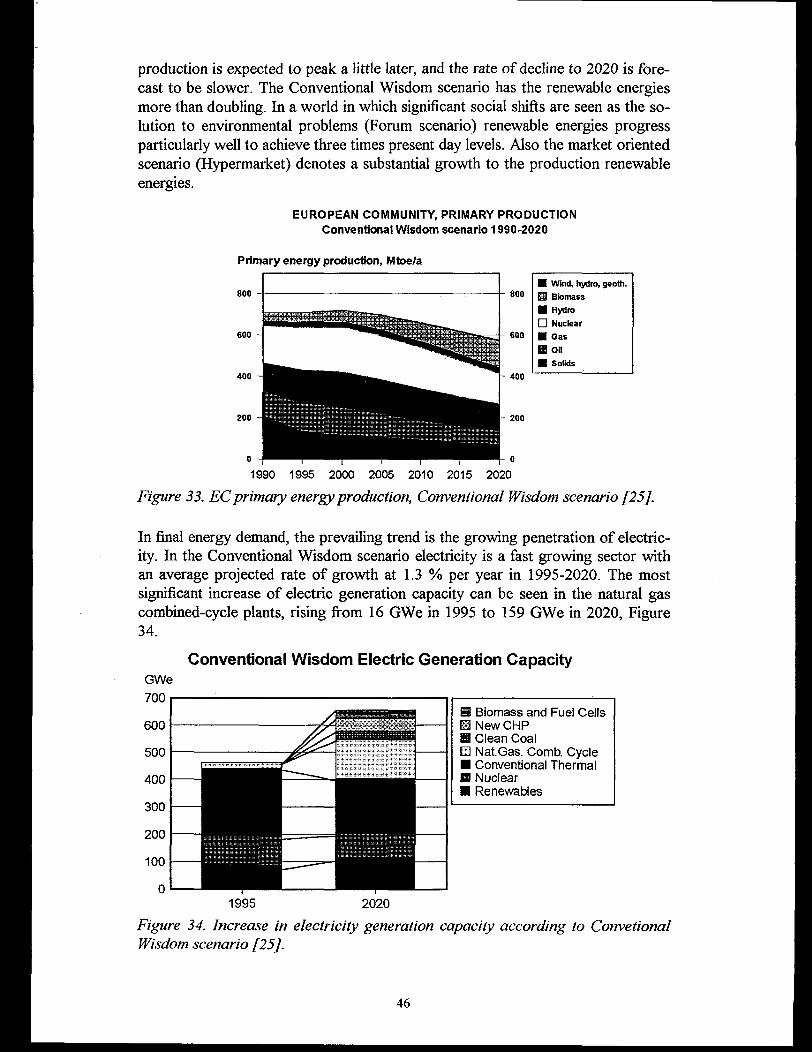
production is expected to peak a little later, and the rate of decline to 2020 is forecast to be slower. The Conventional Wisdom scenario has the renewable energies more than doubling. In a world in which significant social shifts are seen as the solution to environmental problems (Forum scenario) renewable energies progress particularly well to achieve three times present day levels. Also the market oriented scenario (Hypermarket) denotes a substantial growth to the production renewable energies.
EUROPEAN COMMUNITY, PRIMARY PRODUCTION Conventional Wisdom scenario 1990-2020
Primary energy production, Mtoe/a
1990 1995 2000 2005 2010 2015 2020
Figure 33. EC primary energy production, Conventional Wisdom scenario [25].
In final energy demand, the prevailing trend is the growing penetration of electricity. In the Conventional Wisdom scenario electricity is a fast growing sector with an average projected rate of growth at 1.3 % per year in 1995-2020. The most significant increase of electric generation capacity can be seen in the natural gas combined-cycle plants, rising from 16 GWe in 1995 to 159 GWe in 2020, Figure 34.
Conventional Wisdom Electric Generation CapacityGWe700
600
500
400
300
200
100
0
■ Biomass and Fuel Cells H New CHPB Clean Coal □ NatGas. Comb. Cycle■ Conventional Thermal■ Nuclear■ Renewables
1995 2020
Figure 34. Increase in electricity generation capacity according to Convetional Wisdom scenario [25J.
46
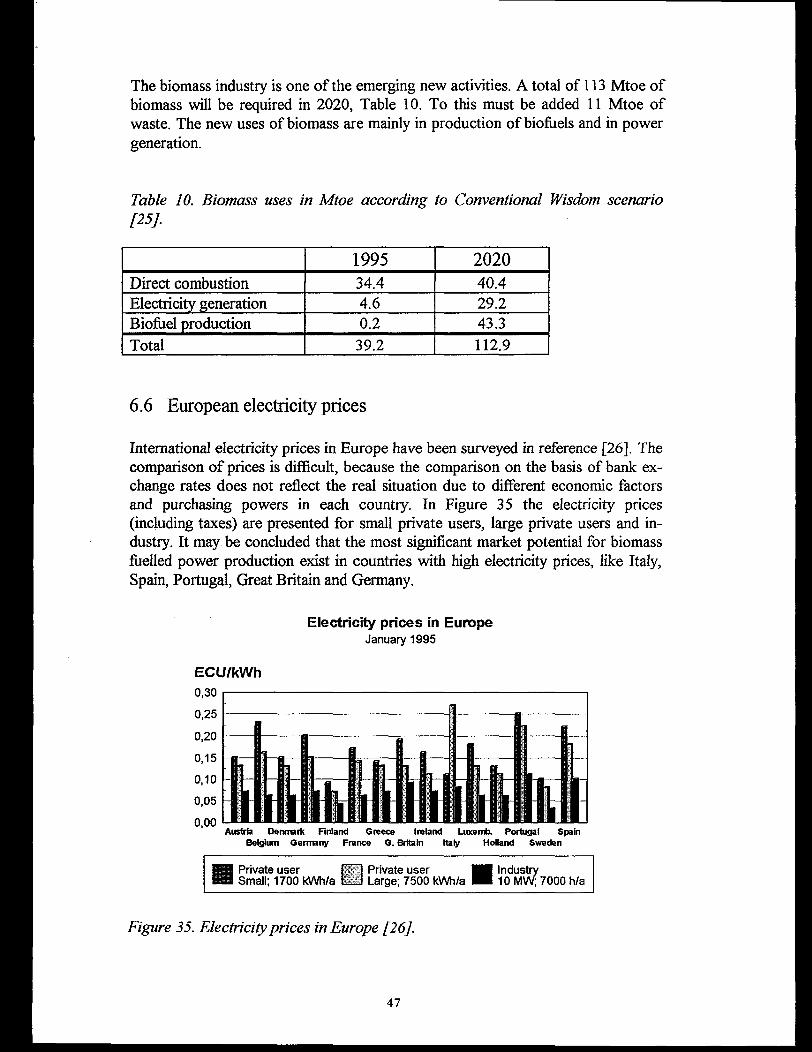
The biomass industry is one of the emerging new activities. A total of 113 Mtoe of biomass will be required in 2020, Table 10. To this must be added 11 Mtoe of waste. The new uses of biomass are mainly in production of biofuels and in power generation.
Table 10. Biomass uses in Mtoe according to Conventional Wisdom scenario/2J/.
1995 2020Direct combustion 34.4 40.4Electricity generation 4.6 29.2Biofuel production 0.2 43.3Total 39.2 112.9
6.6 European electricity prices
International electricity prices in Europe have been surveyed in reference [26]. The comparison of prices is difficult, because the comparison on the basis of bank exchange rates does not reflect the real situation due to different economic factors and purchasing powers in each country. In Figure 35 the electricity prices (including taxes) are presented for small private users, large private users and industry. It may be concluded that the most significant market potential for biomass fuelled power production exist in countries with high electricity prices, like Italy, Spain, Portugal, Great Britain and Germany.
Electricity prices in EuropeJanuary 1995
ECU/kWh0,30
0,25
0,20
0,15
0,10
0,05
0,00
■ Private user I I Private user ■■ IndustrySmall; 1700 kWh/a L__I Large; 7500 kWh/a 10 MW; 7000 h/a
Figure 35. Electricity prices in Europe [26].
47
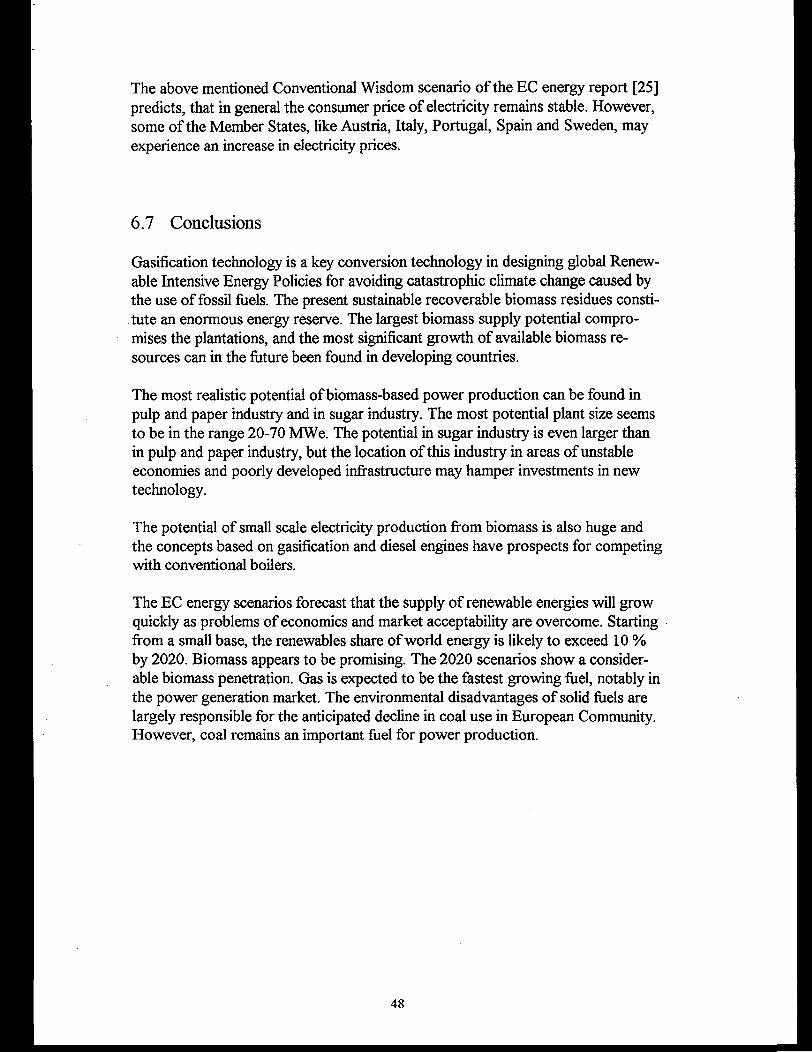
The above mentioned Conventional Wisdom scenario of the EC energy report [25] predicts, that in general the consumer price of electricity remains stable. However, some of the Member States, like Austria, Italy, Portugal, Spain and Sweden, may experience an increase in electricity prices.
6.7 Conclusions
Gasification technology is a key conversion technology in designing global Renewable Intensive Energy Policies for avoiding catastrophic climate change caused by the use of fossil fuels. The present sustainable recoverable biomass residues constitute an enormous energy reserve. The largest biomass supply potential compromises the plantations, and the most significant growth of available biomass resources can in the future been found in developing countries.
The most realistic potential of biomass-based power production can be found in pulp and paper industry and in sugar industry. The most potential plant size seems to be in the range 20-70 MWe. The potential in sugar industry is even larger than in pulp and paper industry, but the location of this industry in areas of unstable economies and poorly developed infrastructure may hamper investments in new technology.
The potential of small scale electricity production from biomass is also huge and the concepts based on gasification and diesel engines have prospects for competing with conventional boilers.
The EC energy scenarios forecast that the supply of renewable energies will grow quickly as problems of economics and market acceptability are overcome. Starting from a small base, the renewables share of world energy is likely to exceed 10 % by 2020. Biomass appears to be promising. The 2020 scenarios show a considerable biomass penetration. Gas is expected to be the fastest growing fuel, notably in the power generation market. The environmental disadvantages of solid fuels are largely responsible for the anticipated decline in coal use in European Community. However, coal remains an important fuel for power production.
48
7 BIOMASS GASIFICATION TESTS WITH THE CIRCULATING FLUIDIZED-BED GASIFIER
7.1 TESTS
The aim of the tests performed in 1995 was to study the effect of different operation parameters on the operation of the gasifier and on carbon conversion, gas quality and tarry impurities. The two-week test runs comprised 12 set points, the variables being:
. fuel: sawdust, forest residue chips
• gasification temperature: 830 - 930 °C
. air distribution: only primary air, feed of primary and secondary air
. gas velocity in the lower zone of the reactor: 2-3 m/s
. material of the circulating bed: sand, dolomite.
Most set points were run for sawdust. Only two set points were run for forest residue chips. Phasing of gasification air feed was employed in two set points and dolomite in four set points. In the tests with forest residue chips, a mixture of sand and dolomite was used as circulating material.
7.2 TEST EQUIPMENT
Experimental work was carried out with the new atmospheric circulating fluidized bed gasifier of VTT Energy commissioned in the summer of 1995. The inner diameter of the gasifier reactor is 0.15 m and height 7.9 m. The maximum efficiency of the equipment is about 350 kW. It is equipped with feeders suitable for biomass and low-grade fuels. Gasification air is fed via preheaters into the reactor in one, two or three stages. The gasifier includes two cyclones, of which the first one returns the circulating bed into the reactor and the other operates as the gas cleaning device. If desired the solids can also be recycled from the second cyclone into the reactor.
The technical data of the equipment are presented in Table 11 and the test equipment in Figure 36.
7.3 RESULTS
The carbon conversion achieved in the gasifier is shown in Figure 37. The carbon conversion of sawdust was very high, i.e. 99 %, already at the gasification temperature of 830 °C. When the gasification temperature was elevated to above 880 °C, the carbon conversion ranged 99.5 - 99.9 %. The conversion of forest
49
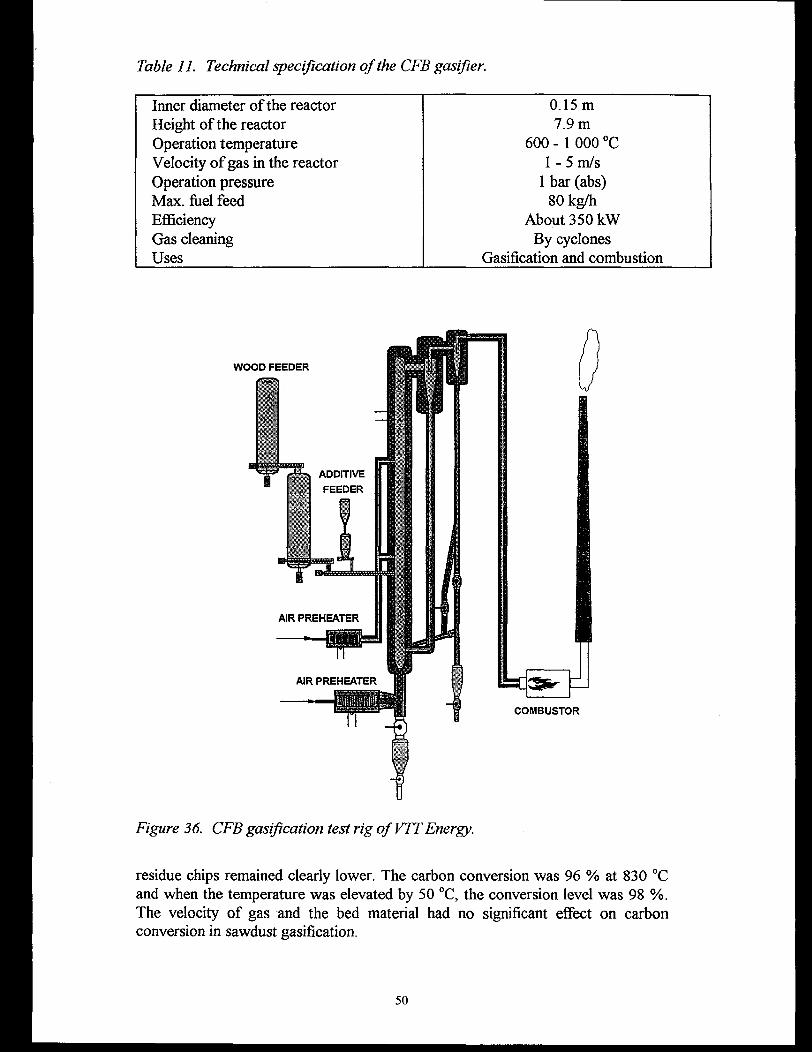
Table 11. Technical specification of the CFB gasifier.
Inner diameter of the reactor 0.15 mHeight of the reactor 7.9 mOperation temperature 600 - 1 000 °CVelocity of gas in the reactor 1-5 m/sOperation pressure 1 bar (abs)Max. fuel feed 80 kg/hEfficiency About 350 kWGas cleaning By cyclonesUses Gasification and combustion
Figure 36. CFB gasification test rig of VTT Energy.
residue chips remained clearly lower. The carbon conversion was 96 % at 830 °C and when the temperature was elevated by 50 °C, the conversion level was 98 %. The velocity of gas and the bed material had no significant effect on carbon conversion in sawdust gasification.
50
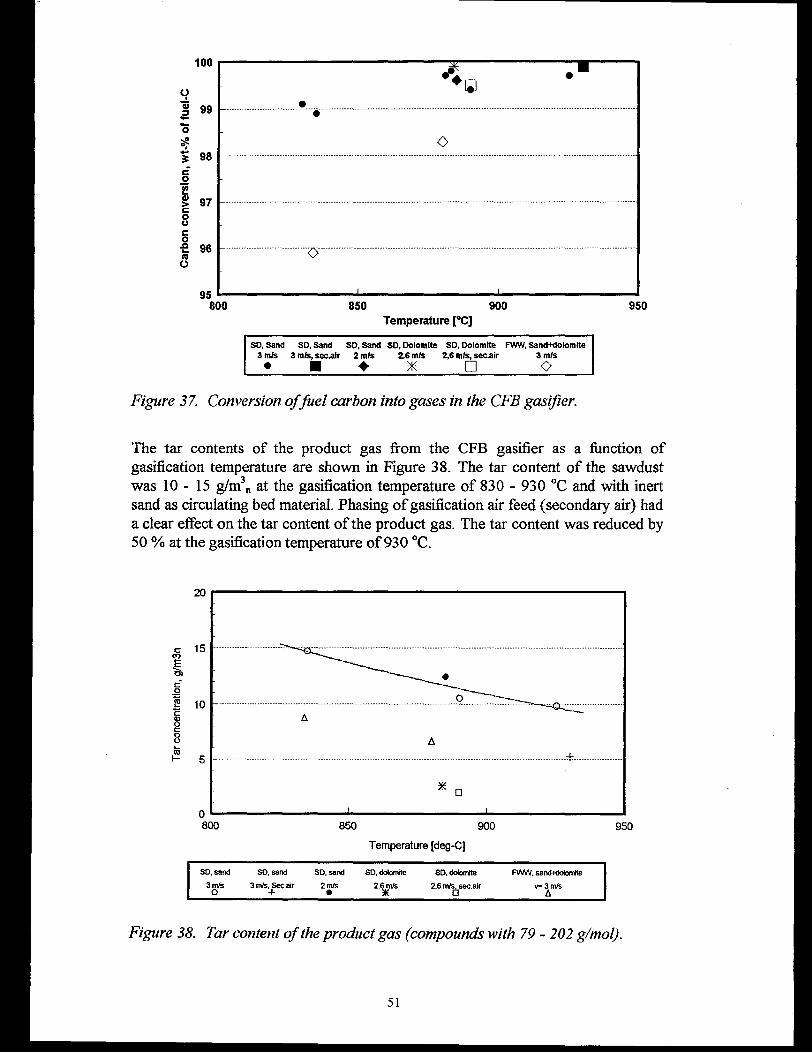
96 -
Temperature [eC]
SO, Sand SO, Sand SO, Sand SO, Dolomite SD, Dolomite FWW, Sand-Ktolomite3 tats 3 m/s, secalr 2 m/s 2.6 m/s 2,6 m/s, sec.air 3 m/s■ ♦ * □ o
Figure 37. Conversion of fuel carbon into gases in the CFB gasifier.
The tar contents of the product gas from the CFB gasifier as a function of gasification temperature are shown in Figure 38. The tar content of the sawdust was 10-15 g/m3„ at the gasification temperature of 830 - 930 °C and with inert sand as circulating bed material. Phasing of gasification air feed (secondary air) had a clear effect on the tar content of the product gas. The tar content was reduced by 50 % at the gasification temperature of930 °C.
Temperature [deg-C]
SD.sand SD.sand SD. sand SD. dolomite SD, dolomite FWW. samMolomite
3 m/s 3 mfe. Sec.air 2 mfe 2.6 mfeO + e * 6 A
Figure 38. Tar content of the product gas (compounds with 79 - 202 g/mol).
51
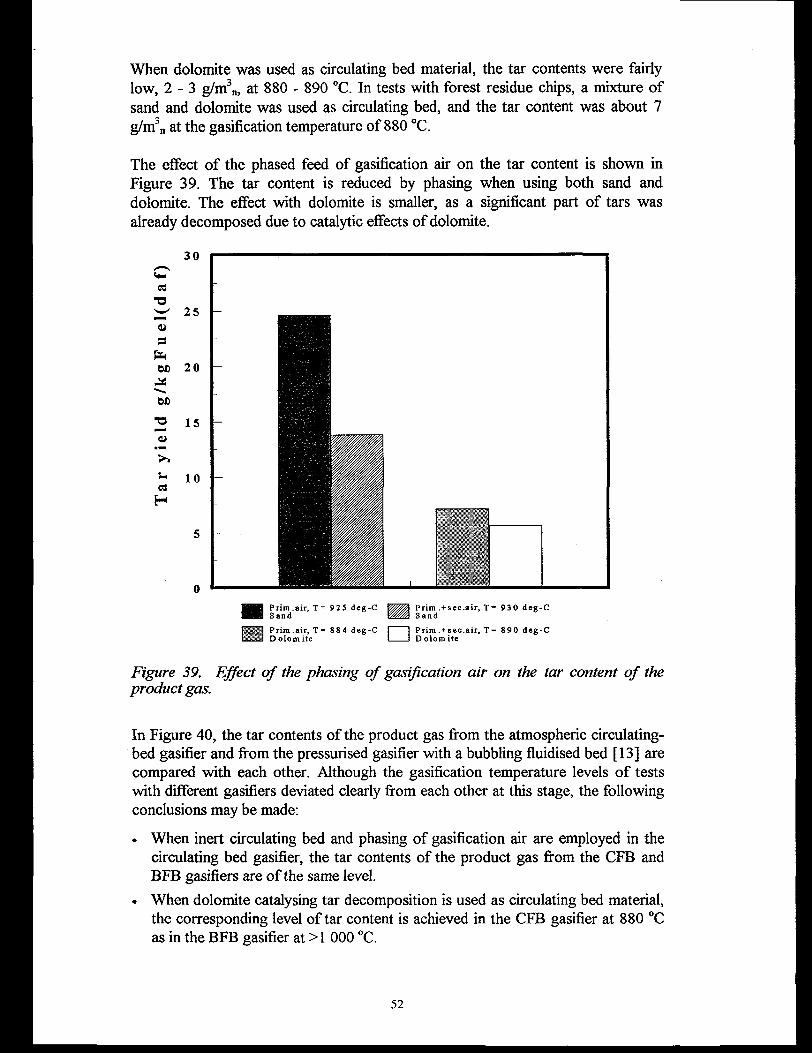
When dolomite was used as circulating bed material, the tar contents were fairly low, 2-3 g/m3n, at 880 - 890 °C. In tests with forest residue chips, a mixture of sand and dolomite was used as circulating bed, and the tar content was about 7 g/m3„ at the gasification temperature of 880 °C.
The effect of the phased feed of gasification air on the tar content is shown in Figure 39. The tar content is reduced by phasing when using both sand and dolomite. The effect with dolomite is smaller, as a significant part of tars was already decomposed due to catalytic effects of dolomite.
so ... ...—/—s<4~a
73
Figure 39. Effect of the phasing of gasification air on the tar content of the product gas.
In Figure 40, the tar contents of the product gas from the atmospheric circulating- bed gasifier and from the pressurised gasifier with a bubbling fluidised bed [13] are compared with each other. Although the gasification temperature levels of tests with different gasifiers deviated clearly from each other at this stage, the following conclusions may be made:
• When inert circulating bed and phasing of gasification air are employed in the circulating bed gasifier, the tar contents of the product gas from the CFB and BFB gasifiers are of the same level.
• When dolomite catalysing tar decomposition is used as circulating bed material, the corresponding level of tar content is achieved in the CFB gasifier at 880 °C as in the BFB gasifier at >1 000 °C.
52
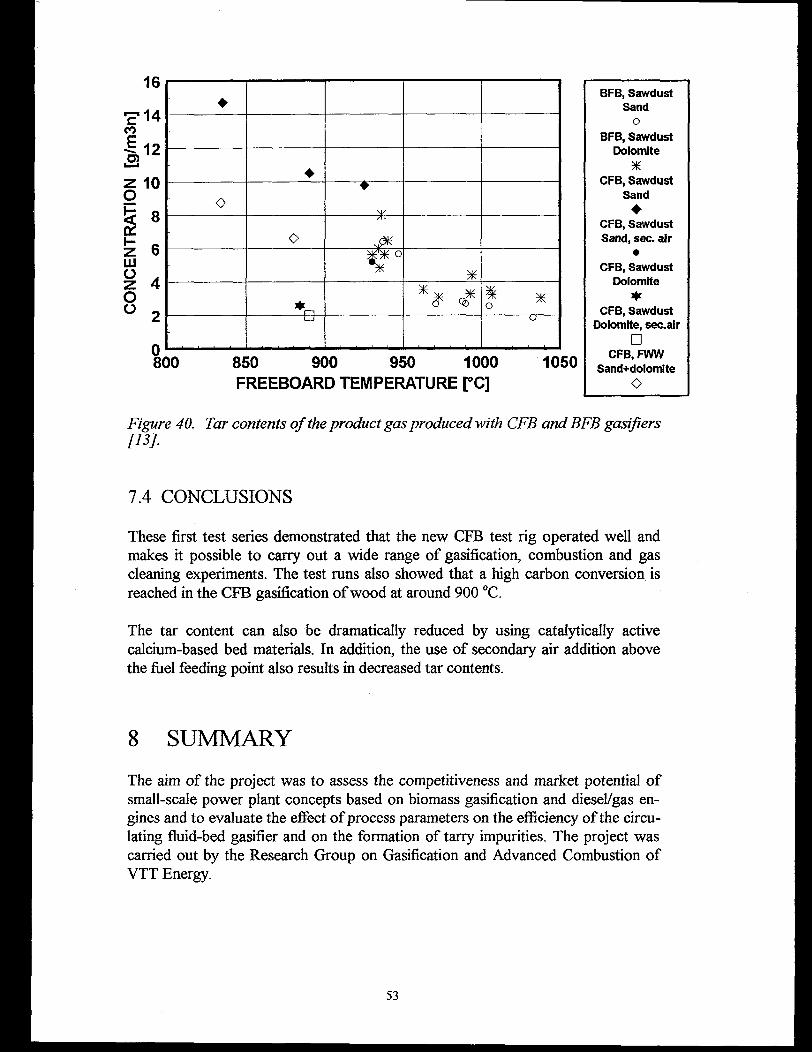
ctoEO)
16
14
12
10
8
inOzOo
♦
♦
o* '
V- o
*
*n ^ *tj u
0 800 850 900 950 1000
FREEBOARD TEMPERATURE [°C]1050
BFB, Sawdust Sand
oBFB, Sawdust
Dolomite *
CFB, Sawdust Sand♦
CFB, Sawdust Sand, sec. air
•CFB, Sawdust
Dolomite*
CFB, Sawdust Dolomite, sec.air
DCFB, FWW
Sand+dolomiteO
Figure 40. Tar contents of the product gas produced with CFB and BFB gasifiers
7.4 CONCLUSIONS
These first test series demonstrated that the new CFB test rig operated well and makes it possible to carry out a wide range of gasification, combustion and gas cleaning experiments. The test runs also showed that a high carbon conversion is reached in the CFB gasification of wood at around 900 °C.
The tar content can also be dramatically reduced by using catalytically active calcium-based bed materials. In addition, the use of secondary air addition above the fuel feeding point also results in decreased tar contents.
8 SUMMARYThe aim of the project was to assess the competitiveness and market potential of small-scale power plant concepts based on biomass gasification and diesel/gas engines and to evaluate the effect of process parameters on the efficiency of the circulating fluid-bed gasifier and on the formation of tarry impurities. The project was carried out by the Research Group on Gasification and Advanced Combustion of VTT Energy.
53
The sub-tasks of this one-year project performed in 1995 were:
1. to assess the competitiveness of power plant concepts based on atmospheric gasification and diesel/gas engines compared to a steam process,
2. to survey the market potential of biomass-fuelled small-scale power plants, and
3. to study the effect of operation parametres of the circulating fluid-bed gasifier on carbon conversion, gas quality and tar formation.
In subtask 1, alternative diesel/gas engine power plant concepts based on gasification in size class 5-50 MWe were assessed. The aim of the concept development was to achieve a high efficiency and also to minimise the investment costs. The processes were designed for a circulating fluid-bed gasifier and a diesel/gas engine. The power output of the diesel/gas engine units used in the calculations was 5 MWe.
In the basic version, where electricity is generated only by a diesel/gas engine, the efficiency level of 37 % is achieved in electricity generation. When a steam cycle is added to the process, the efficiency of electricity production increases to 44 - 48 %. The efficiencies achieved in the process are very high compared with those of biomass power plant processes on a commercial level or under development.
The costs of electricity generation for the gas engine process with a steam cycle and for the conventional steam process (boiler + turbine) are of the same magnitude, although slightly lower for the gas engine. However, the steam process is superior in combined electricity and heat generation, which is due to the higher efficiency of heat production in the steam process. The competitiveness of the gas/diesel engine process improves if the value of the heat energy decreases.
The competitiveness of the process of biomass gasification + gas/diesel engine is based largely on the high efficiency of electricity generation. Hence, the process is best suitable for applications, where the value of the electricity is high and no heat energy is required. Adding the steam cycle to the process improves the efficiency by 7 - 10 % units and decreases the cost of electricity generation by 3 - 5 %. On the basis of presently available data, the engine type (gas/diesel) has no significant effect on the cost of electricity generation.
The most significant potential of biomass-based electricity generation is made up by wastes of sugar industries in South and Central America and in Asia. There are also very extensive growth potentials of bioenergy use in the NAFTA countries (USA Canada and Mexico) and in Europe. According to WEC scenarios, the bioenergy use in Europe is expected to grow most sharply in Italy, Spain, Germany and Poland, to 3 - 6-fold compared to the present use. A significant growth in the bioenergy use is also expected in France, Great Britain and Denmark. As the price of electricity is very high in Spain, Portugal, Great Britain, Italy and Germany, it may be concluded that the most significant market potential for biomass-fuelled electricity-generating plants in Europe exists in these countries.
54
The EC energy scenarios show a considerable biomass penetration by 2020. The supply of renewables will grow quickly, and the renewables share of world energy is likely to exceed 10 % by 2020.
Experimental work was carried out in the new atmospheric circulating fluid-bed gasifier of VTT Energy. The tests carried out in 1995 comprised 12 different balance cycles with the following variables:
• fuel: sawdust, forest residue chips
. gasifying temperature: 830 - 930 °C
• air distribution: only primary air, feed of primary and secondary air
• flow rate of gas in the lower zone of the reactor: 2 - 3 m/s
• fluid-bed material: sand, dolomitic limestone.
Carbon conversion obtained in the gasifier was in the range of 99.0 - 99.9 % for sawdust and 96 - 98 % for forest residue chips in gasification in the temperature range of 830 - 930 °C. The tar content of the product gas was 10-15 g/m3„ for sawdust with sand as circulating fluid-bed. Phasing of gasifying air feed (feed of secondary air) had a clear effect on the tar content of the product gas. The tar content was reduced by 50 % at the gasification temperature of 930 °C. When dolomite was used as circulating fluid-bed, the tar contents were fairly low (2 - 3 g/m3n) at as low temperatures as 880 - 890 °C. Hence, phasing of gasifying air results in smaller tar contents of gas both with sand and dolomite. The effect was slighter with dolomite, as a significant part of tars had already been decomposed due to catalytic effects of dolomite.
It may be concluded from the test results that a very good carbon conversion is obtained in the atmospheric CFB gasifier at >900 °C gasification temperatures. The tar content of gas can be reduced sharply by phasing of gasification air and using catalytic circulating fluid-bed material.
Experimental research aiming at applications of atmospheric gasification technology was initiated by this project. The research in this project was limited to the operation of the gasifier, while the continuation project to be performed over the years 1996 - 1997 will focus on gas cleaning, which is the crucial problem of this technology in practical applications.
55
REFERENCES1. Dupont-Roc, G. The evolution of the world's energy system 1860 - 2060. In:
Proc. Development and Deployment of Technologies to Respond to Global Climate Change Concerns, Paris, 21-22 Nov. 1994. Paris: BE A/OECD, 1995.
2. Waldheim, L. & Blackadder, W. Gasification of wood fuel and electricity production with a diesel engine. Studsvik: Studsvik Energiteknik, 1990. (Studsvik Report EP-90/16). (In Swedish).
3. Ekono Oy. Kaasudieselvoimalaitosten kilpailukykyisyys. (Competitiveness of gas diesel power plants). Helsinki: Ministry of Trade and Industry, 1984. (Publications D:52). (In Finnish).
4. Ekstrom, C. Atmospheric gasification - diesel. Technical evaluation and proposal on future work. Vallingby: Vattenfall, 1991. (In Swedish).
5. Nylund, O. & Kurkela, E. Kotimaisten polttoaineiden kaasutus. (Gasification of domestic fuels). Espoo: Technical Research Centre of Finland, 1986. 77 p.+ app. 13 p. (VTT Research Reports 442). (In Finnish).
6. .Revised guide to capital cost estimation. London: Institution of Chemical Engineers, 1988.
7. Garrett, D. E. Chemical process economics. Amsterdam: Van Nostrand Reinhold, 1989.
8. Solantausta, Y., Diebold, J. P., Elliott, D. C., Bridgwater, T. & Beckman, D. Assessment of liquefaction and pyrolysis systems. Espoo: VTT Energy, 1994. 230 p. + app. 79 p. (VTT Research Notes 1573).
9. Solantausta, Y., Bridgwater, T. & Beckman, D. Electricity production by advanced biomass power systems. Espoo: VTT Energy, 1996. 115 p.+ app. 79 p. (VTT Research Notes 1729).
10. Bridgwater, A. V. & Evans, G. D. 1993. An assessment of thermochemical conversion systems for processing biomass and refuse. Report to UK DTI. London: DTI, 1993. 254 p. (ETSU B/T1/00207/REP).
11. Vuorinen, A. Generation costs of cogeneration power plants in Finnish conditions. Vaasa: Wartsila Diesel International Ltd., 1995.
12 ASPEN PLUS™ User Guide Volume 1 (1994). Release 9. Massachusetts: Aspen Technology, 1994.
13. Kurkela, E., Stahlberg, P. & Laatikainen, J. Pressurized fluidized-bed gasification experiments with wood, peat and coal at VTT in 1991 - 1992. Part 1. Test facilities and gasification experiments with sawdust. Espoo: VTT Energy, 1993. 55 p. + app. 2 p. (VTT Publications 161).
14. World Energy Council, Survey of Energy Resources 1995, Holywell Press Ltd, England. 294 p.
56

15. Hall, D O. & House, J.I., Biomass - Other than wood. In World Energy Council, Survey of Energy Resources 1995, Holywell Press Ltd, England, pp. 198-224.
16. Hall, D O. & House, J.I., Biomass: an environmentally acceptable fuel for the future, J. Power and Energy, 1995, vol. 209.
17. Hislop, D. & Hall, D O., Biomass resources for gasification power plant. A report for the IEA Bio-Energy Agreement, Thermal Gasification Activity. London, 28 April 1995, 29 p.
18. Johansson, T.B., Kelly, H., Reddy, A.K.N. & Williams, R.H., Renewable Energy - Sources for fuels and electricity. Earthscan, London, 1994. 1160 p.
19. World Energy Council, Report 1992: International Energy Data, Imediaprint, London, 1993.
20. Jaysinghe, S. et.al., Business opportunities for power generation from biomass residues in ASEAN. Volume 2: Sugar Sector. Report for the EC-ASEAN COGEN programme. Asian Institute of Technology, Bangkok, 1994. 47 p.
21. Girlish Seth & Nail Kaman Anew, Co-generation possibilities in Indian sugar industry. Chemical Industry Digest, Special Issue on Energy Conservation, October 1994. pp. 63-69.
23. Larson, E.D., Ogden, J.M. & Williams, R.H., Steam injected gas-turbine cogeneration for the cane sugar industry. PU/CEES Report No. 217. Princeton University, 1987. 104 p.
24. Larson, E.D., Svenningson, P. & Bjerle, I., Biomass gasification for gas turbine power generation. In: Johanson, T.B. et al. (eds.) Electricity: efficient end-use and new generation technology and their planning implications. Lund University Press, Sweden, 1989. pp. 697-739.
25. Energy in Europe, European energy to 2020: a scenario approach. Special Issue - spring 1996. Brussels: European Commission, 1996.
26. Pyrolysis Network for Europe, Newsletter. Issue 1 March 1996. 16 p.
57