dhl global forwarding, freight ocean freight market …...market outlook june 2019 – ocean freight...
TRANSCRIPT
1
OCEAN FREIGHT MARKET UPDATE
DHL Global Forwarding, Freight
June 2019
Publication Date 29th May 2019
Dominique von Orelli – Global Head, Ocean Freight
PUBLIC
2 2
Contents
TOPICS OF THE MONTH US – China trade war / IMO 2020
HIGH LEVEL DEVELOPMENT
MARKET OUTLOOK Freight Rates and Volume Development
ECONOMIC OUTLOOK & DEMAND DEVELOPMENT
CAPACITY DEVELOPMENT
CARRIERS
REGULATIONS
? DID YOU KNOW? 2019 global container throughput
PUBLIC
DHL Global Forwarding | OFR Market Update | June 2019
3 3
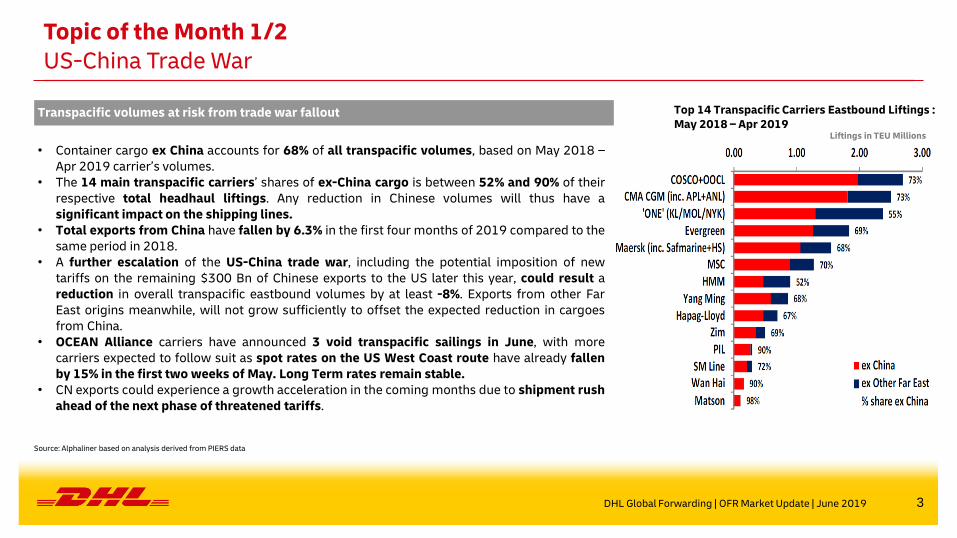
Transpacific volumes at risk from trade war fallout
• Container cargo ex China accounts for 68% of all transpacific volumes, based on May 2018 – Apr 2019 carrier’s volumes.
• The 14 main transpacific carriers’ shares of ex-China cargo is between 52% and 90% of their respective total headhaul liftings. Any reduction in Chinese volumes will thus have a significant impact on the shipping lines.
• Total exports from China have fallen by 6.3% in the first four months of 2019 compared to the same period in 2018.
• A further escalation of the US-China trade war, including the potential imposition of new tariffs on the remaining $300 Bn of Chinese exports to the US later this year, could result a reduction in overall transpacific eastbound volumes by at least -8%. Exports from other Far East origins meanwhile, will not grow sufficiently to offset the expected reduction in cargoes from China.
• OCEAN Alliance carriers have announced 3 void transpacific sailings in June, with more carriers expected to follow suit as spot rates on the US West Coast route have already fallen by 15% in the first two weeks of May. Long Term rates remain stable.
• CN exports could experience a growth acceleration in the coming months due to shipment rush ahead of the next phase of threatened tariffs.
Source: Alphaliner based on analysis derived from PIERS data
Top 14 Transpacific Carriers Eastbound Liftings : May 2018 – Apr 2019
Liftings in TEU Millions
Topic of the Month 1/2 US-China Trade War
DHL Global Forwarding | OFR Market Update | June 2019
4 4
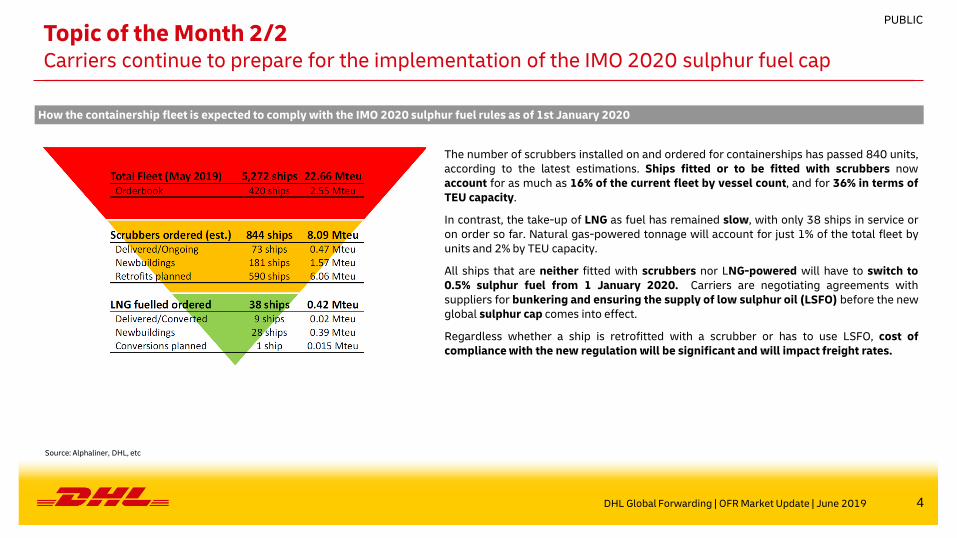
The number of scrubbers installed on and ordered for containerships has passed 840 units, according to the latest estimations. Ships fitted or to be fitted with scrubbers now account for as much as 16% of the current fleet by vessel count, and for 36% in terms of TEU capacity.
In contrast, the take-up of LNG as fuel has remained slow, with only 38 ships in service or on order so far. Natural gas-powered tonnage will account for just 1% of the total fleet by units and 2% by TEU capacity.
All ships that are neither fitted with scrubbers nor LNG-powered will have to switch to 0.5% sulphur fuel from 1 January 2020. Carriers are negotiating agreements with suppliers for bunkering and ensuring the supply of low sulphur oil (LSFO) before the new global sulphur cap comes into effect.
Regardless whether a ship is retrofitted with a scrubber or has to use LSFO, cost of compliance with the new regulation will be significant and will impact freight rates.
Topic of the Month 2/2 Carriers continue to prepare for the implementation of the IMO 2020 sulphur fuel cap
Source: Alphaliner, DHL, etc
DHL Global Forwarding | OFR Market Update | June 2019
How the containership fleet is expected to comply with the IMO 2020 sulphur fuel rules as of 1st January 2020
PUBLIC

5 5
High Level Market Development – Supply and Demand
ECONOMIC OUTLOOK GDP GROWTH BY REGION1)
PUBLIC
1) real GDP, Global Insight, Copyright © IHS, Q1 2019 . All rights reserved. 2) Demand growth = Port-to-Port Container Traffic growth. Supply growth = Fleet Growth. Source: Drewry Maritime Research. 3) Drewry, in USD/40ft container, including BAF & THC both ends, 42 individual routes, excluding intra-Asia routes, 5.5% predicted freight rate increase. 4) Shanghai Shipping Exchange, in USD/20ft container & USD/40ft ctnr for US routes, 15 routes from Shanghai. 5) Bunker Index, in USD/metric ton, Bunker Index MGO (BIX MGO) = avg. Global Bunker Price for marine gasoil (MGO) port prices; (BIX 380= avg. Global Bunker Price for all 380 centistoke (cSt) port prices; both index published on the Bunker Index website., Forecast based on HIS Market assumption of avg. USD70 per Brent barrel equaling Nov18 price. 6) DHL Global Trade Barometer Mar19, index value represents weighted average of current growth and upcoming two months of trade, a value at 50 is considered neutral, expanding above 50, and shrinking below 50.
BUNKER PRICE INDEX5) WORLD CONTAINER INDEX (WCI)3) SHANGHAI CONTAINERIZED FREIGHT INDEX (SCFI)4)
DHL TRADE BAROMETER6)
0
3,000
2,000
500
1,500
2,500
1,000
Q3 Q4
Q1 ’19
Q1 ’17
Q2
Q3
Q2
Q4 Q1 ’18
Q2 Q3
1,100
1,200
400
500
600
700
1,000
800
900
Q1 ’17
Q1 ’18
Q3 Q1 ’19
Q3 Q2 Q3 Q4 Q2 Q4 Q2
400
600
1,000
200
0
800
Q1 ’19
Q1 17
Q2 Q2 Q4 Q3 Q3 Q1 18
Q3 Q4 Q2
30
35
40
45
50
55
60
65
70
75
Q2 Q1 ’17
Q1 ’18
Q3 Q4 Q2 Q3 Q4 Q1 ’19
Ocean
Global
Actual
Forecast
Actual
Forecast
SUPPLY/DEMAND GROWTH (ANNUALIZED), IN % 2)
Supply Growth %
Demand Growth
%
0%
1%
2%
3%
4%
5%
6%
7%
2017 2018 2019F 2020F 2021F 2022F
SUPPLY/DEMAND GROWTH (ANNUALIZED), IN % 2)
DHL Global Forwarding | OFR Market Update | June 2019
2019F 2020F 2021F 2022F 2023F CAGR
(2020-23)
EURO 1.4% 1.3% 1.4% 1.6% 1.7% 1.6%
MEA 2.5% 3.1% 3.2% 3.4% 3.4% 3.3%
AMER 2.3% 2.0% 1.8% 1.7% 1.6% 1.7%
ASPA 4.7% 4.6% 4.6% 4.6% 4.6% 4.6%
DGF World 2.9% 2.8% 2.8% 2.8% 2.8% 2.8%
Mar19 index
predicts Mar-
May19 trade
development
BIX 380
BIX MGO
6 6
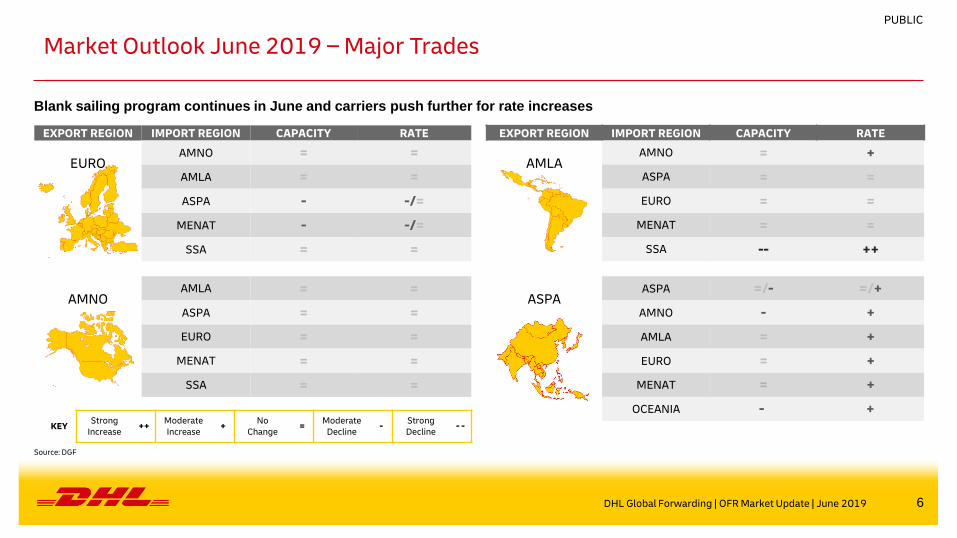
Market Outlook June 2019 – Major Trades
Blank sailing program continues in June and carriers push further for rate increases
KEY Strong
Increase ++
Moderate Increase
+ No
Change =
Moderate Decline
- Strong Decline
- -
EXPORT REGION IMPORT REGION CAPACITY RATE
EURO AMNO = =
AMLA = =
ASPA - -/=
MENAT - -/=
SSA = =
AMNO AMLA = =
ASPA = =
EURO = =
MENAT = =
SSA = =
EXPORT REGION IMPORT REGION CAPACITY RATE
AMLA AMNO = +
ASPA = =
EURO = =
MENAT = =
SSA -- ++
ASPA ASPA =/- =/+
AMNO - +
AMLA = +
EURO = +
MENAT = +
OCEANIA - +
DHL Global Forwarding | OFR Market Update | June 2019
Source: DGF
PUBLIC
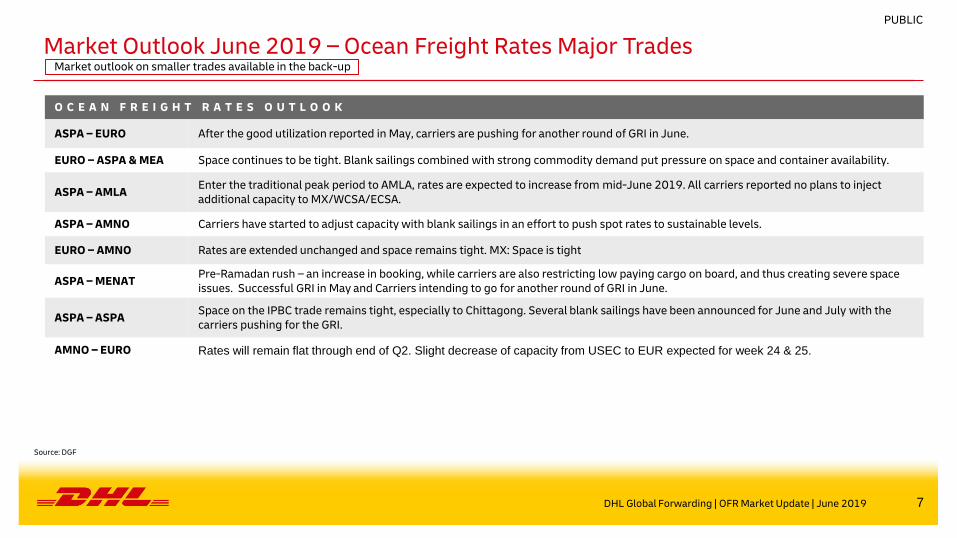
7 7
Market Outlook June 2019 – Ocean Freight Rates Major Trades Market outlook on smaller trades available in the back-up
O C E A N F R E I G H T R A T E S O U T L O O K
ASPA – EURO After the good utilization reported in May, carriers are pushing for another round of GRI in June.
EURO – ASPA & MEA Space continues to be tight. Blank sailings combined with strong commodity demand put pressure on space and container availability.
ASPA – AMLA Enter the traditional peak period to AMLA, rates are expected to increase from mid-June 2019. All carriers reported no plans to inject additional capacity to MX/WCSA/ECSA.
ASPA – AMNO Carriers have started to adjust capacity with blank sailings in an effort to push spot rates to sustainable levels.
EURO – AMNO Rates are extended unchanged and space remains tight. MX: Space is tight
ASPA – MENAT Pre-Ramadan rush – an increase in booking, while carriers are also restricting low paying cargo on board, and thus creating severe space issues. Successful GRI in May and Carriers intending to go for another round of GRI in June.
ASPA – ASPA Space on the IPBC trade remains tight, especially to Chittagong. Several blank sailings have been announced for June and July with the carriers pushing for the GRI.
AMNO – EURO Rates will remain flat through end of Q2. Slight decrease of capacity from USEC to EUR expected for week 24 & 25.
DHL Global Forwarding | OFR Market Update | June 2019
Source: DGF
PUBLIC

8 8
Economic Outlook & Demand Development Global economic growth is firming, but risk of policy mistake has risen sharply
Source: IHS Markit, IHS Purchasing Manager Index Manufacturing, a PMI at 50 is considered neutral, expanding above 50, and business shrinking below 50.
DHL Global Forwarding | OFR Market Update | June 2019
PUBLIC
EURO
Eurozone real GDP doubled the pace in Q1compared to the final two quarters in 2018. Private consumption benefited from moderating energy inflation rates, resilient employment, & higher compensation growth. The drag from net trade appears to have eased, with export growth improving somewhat. Meanwhile the uncertainty about Brexit continues, as the decision deadline has been extended to the end of Oct. The UK economy will lose some momentum in Q2 & Q3 as the stocking up that boosted Q1 real GDP growth unwinds.
AMNO Robust Q1 pace in the US is expected to be temporary, as it was driven by inventory investment & net exports, two sources of strength that could easily reverse in the next quarter. Recently announced tariff increases by the US & CN will further erode growth.
ASPA
Real exports of goods & services from JP declines in Q1, reflecting repercussions from US-CN trade tensions & sluggish IT-related demand. CN’s economic growth held steady in Q1, largely due to surging exports, mostly to the EU & ASEAN. Given EU’s sluggish growth outlook, the sustainability of the export rebound is questionable. An even bigger risk is the recent increase in US tariffs on CN exports, which will directly lower growth this year & next. CN government has gradually ramped up fiscal & monetary stimulus to support growth and will do more if needed.
EMERGING MARKETS
Re-escalating trade conflict between the US & CN will damage growth, both directly & indirectly. Other anxieties include a bad combination of politics & economics (recessions) in AR & TR, as well as a dangerous escalation of the conflict between Iran & the US.
DEMAND DEVELOPMENT
The latest purchasing managers’ indexes (PMIs) reflect a broadly stagnant manufacturing economy & slower service-sector growth. Uncertainty & trade wars remained the most commonly cited causes of reduced optimism. Especially modest readings were seen in the UK, Eurozone, & JP. Although the US led the developed world PMIs, the rate of growth eased markedly in Apr to close the gap with the other major developed economies.

9 9
C A R R I E R S
ONE has reported a net loss of USD -586m for its 1st year of operations, based on the Japanese fiscal year that runs from April to March. Fiscal Q4 earnings were the strongest of all 4 quarters, but results remained negative due to a substantial reduction in liftings during the last quarter, especially on the TP route. ONE expects to post a positive result in the coming financial year, with full year net profits of USD 85m.It expects however H2 to be negative in part because of bunker cost increases from IMO 2020. The carrier believes that most, if not all, of the bunker costs increase will be offset by the ‘ONE Bunker Surcharge’ (OBS) that it intends to apply.
COSCO Shipping Holdings has reported a net profit of RMB 687m for Q1 ’19, an increase of 280% over the same period of last year. Earnings included subsidies from the CN government of RMB 63.6m in Q1 ’19, compared to RMB 59.4m in the same quarter last year. The container shipping business posted a 62% increase in revenue to RMB 33.45bn, due to consolidation of OOCL since Aug ’18.
Hapag-Lloyd has reported a net profit of EUR 92m in Q1 ’19, significantly improving from the net loss of EUR -38m in the same quarter last year. The improvement was due to a 2.4% increase in liftings and a 4.8% increase in average freight rates. The lifting gains were driven by increased volumes on its FE-Europe, EMAO & Transatlantic tradelanes, but offset partly by reductions on its intra-Asia, Middle East & Transpacific volumes. Hapag-Lloyd’s operating margin improved to 7.0% for its best performance since Q1 ’15.
COSCO Shipping and OOIL jointly announced on 29 Apr 119 the sale of their interest in the Long Beach Container Terminal (LBCT) for a total price of USD 1.78bn to an infrastructure investment fund. The disposal was mandated by US authorities last year as part of the conditions for COSOC’s acquisition of OOCL in 2018.
Singamas, a 41% subsidiary of PIL has announced on 6 May ’19 the sale of three of its largest container manufacturing factories in CN to COSCO Shipping Financial Holdings of a total price of RMB 3.8bn (USD 565m). These represent more than 65% of Singamas’ current container production capacity of about 850’000 TEU p.a.
HMM has reported another negative quarter in Q1 ’19, recording a net loss of KRW 178bn (USD 159m). Its container shipping segment posted an operating loss of USD 96bn (USD 85m), its 19th consecutive quarter of negative earnings since 2014.
On 20 May HMM has also unveiled a new corporate identity with a new logo
Yang Ming has reported a net loss of TWD -682m (USD -22m), after taking into account higher interest expenses & other finance costs of TWD 990m (USD 32m).The results were negatively impacted by new accounting rules that came into effect this year that require the recognition of vessel leases on its balance sheet that had resulted in a 49% increase in Yang Ming’s total liabilities to reach TW 179bn (USD 5.8bn) as at the end of March.
Carriers 1/3
Source: Alphaliner, carriers
DHL Global Forwarding | OFR Market Update | June 2019
PUBLIC
Source: Alphaliner, Dynaliners, carriers
10 10
C A R R I E R S
Maersk has reported a net loss of USD 659m in Q1’19, including a USD 552m loss on its discontinued business for Maersk Drilling. For its continuing business segments Ocean, Logistics, Terminals, Manufacturing and Others, the net loss still reached USD 104m. For its Ocean business, Maersk continued to lose market share with total liftings falling by 2.2% to 6,301m TEU in Q1’19 compared to Q1’18. This was partly compensated by a 3.9% increase in average freight rates. The company said that it will continue to maintain its policy adopted since 2016 of not starting any new large terminal projects or order any new large ships.
ZIM has reported a net loss of USD 25m in Q1’19, continuing its negative streak for the sixth consecutive quarter. Volatile rate conditions continued to weight down ZIMs earnings even though average rates improved by 8.6% compared to the same quarter last year. The results were also negatively impacted by a 4.3% reduction in total liftings to 668,000 TEU, compared to Q1’18.
Carriers 2/3
Source: Alphaliner, carriers
DHL Global Forwarding | OFR Market Update | Mar 2019
PUBLIC
Source: Alphaliner, Dynaliners, carriers
11 11
0.0
0.5
1.0
1.5
2.0
2.5
3.0
3.5
4.0
4.5
Maersk Line MSC CoscoShipping
CMA CGM Hapag-Lloyd ONE Evergreen Yang Ming HMM PIL Other carriers
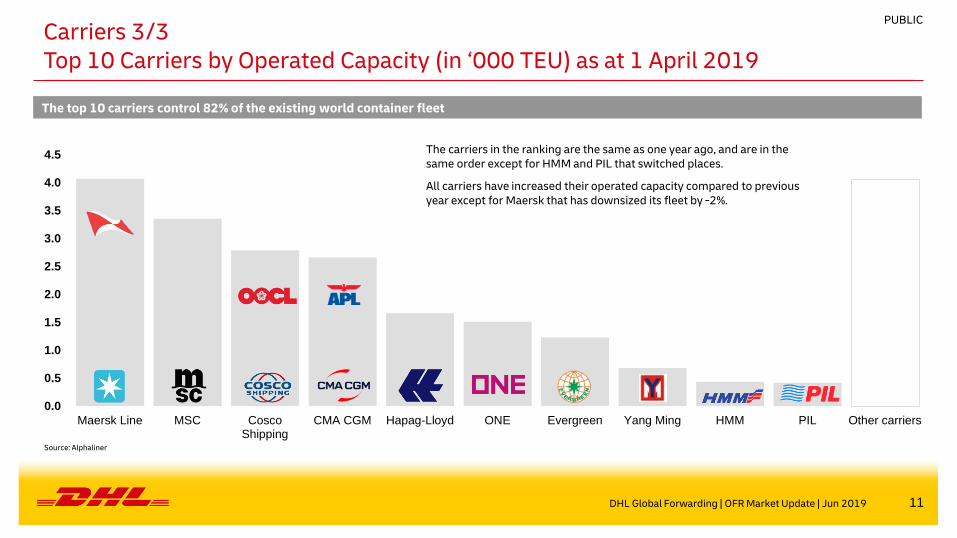
Carriers 3/3 Top 10 Carriers by Operated Capacity (in ‘000 TEU) as at 1 April 2019
DHL Global Forwarding | OFR Market Update | Jun 2019
Source: Alphaliner
PUBLIC
The carriers in the ranking are the same as one year ago, and are in the same order except for HMM and PIL that switched places.
All carriers have increased their operated capacity compared to previous year except for Maersk that has downsized its fleet by -2%.
The top 10 carriers control 82% of the existing world container fleet

12 12
Capacity Development
C A P A C I T Y
The OCEAN Alliance carriers have announced the cancellation of 3 transpacific sailings in June. The Far East – USWC ‘PSW1’ sailing from Fuzhou on 2 June (APL ESPLANADE 13,892 TEU), the Far East – USWC ‘PNW4’ sailing from Shekou on 4 June (OOCL OAKLAND 5,888 TEU) and the Far East – USEC ‘AWE4’ sailing from Qingdao on 18 June (APL SANTIAGO 9,326 TEU). These cancellations, taking place during what should have been the start of the busy peak season, further confirm a weakening demand following the implementation of increased tariffs in trade between China and the USA.
Maersk Line and Hamburg Süd are to launch in June a new North Europe – NCSA – West Coast South America service covering Columbia, Panama, Chile and Peru. They will brand it ‘CLX’ and ‘SAWC1’ respectively. The new service will be run with 4,500 TEU high-reefer capacity ships and it will encompass the current North Europe – NCSA – ‘Colombia Express’ operated with 2,500 TEU ships as part of a larger service reshuffle.
CMA CGM has disclosed full details of its revised service offering between Europe, the Caribbean, and the West Coast of South America. Three direct loops and a new transhipment alternative will be offered. The changes do not come unexpected, as Hapag-Lloyd had earlier announced its withdrawal from two joint services with CMA CGM. The moves are also related to the up-sizing of the “New MedCaribe” service to the LCS scale.
Wan Hai and PIL have replaced their Far East-Middle East ‘CMS’ joint service, run with six ships of 4,500-6,600 TEU, by new alternatives, consisting mostly in slot allocations on the new high capacity ‘MEX’ service organized in Apr by COSCO Shipping.
The idle containership fleet has reversed its recent downward trend, with the latest fleet survey recording an increase in the number of idle units to 126 units for 369,080 TEU as at 13 May, 2019, representing 1.6% of the total fleet. The increase were driven mainly by a rise in the number of skipped sailings due to the May holidays in the Far East, which put several ships temporarily out of work. An increase in the number of containerships redeliveries in the last 2 weeks has also resulted in more spot tonnage that is open for charter, with idle number rising again in the smaller sizes of bellow 2,000 TEU, as well as the classic panamax sector.
DHL Global Forwarding | OFR Market Update | June 2019
Source: Alphaliner, Dynaliners, carriers
PUBLIC
13 13
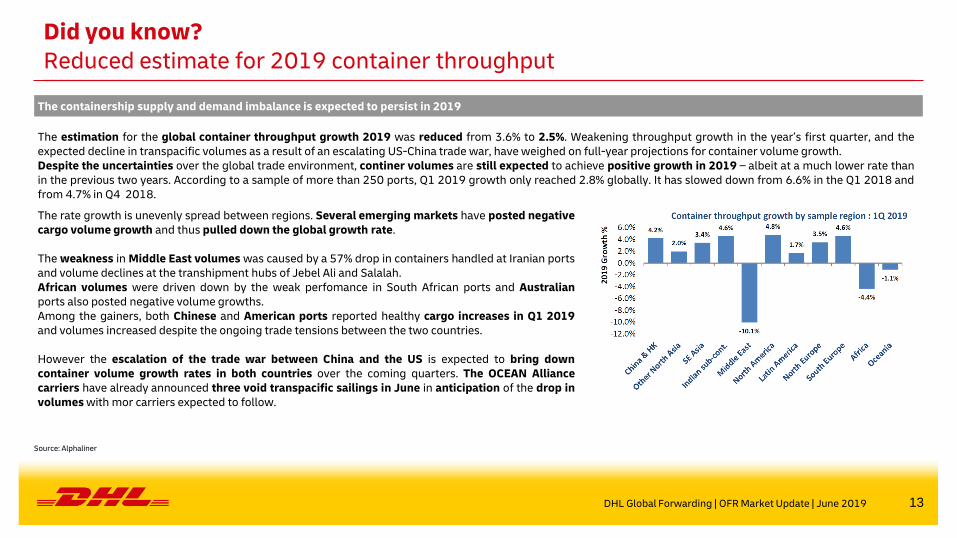
The containership supply and demand imbalance is expected to persist in 2019
The estimation for the global container throughput growth 2019 was reduced from 3.6% to 2.5%. Weakening throughput growth in the year’s first quarter, and the expected decline in transpacific volumes as a result of an escalating US-China trade war, have weighed on full-year projections for container volume growth. Despite the uncertainties over the global trade environment, continer volumes are still expected to achieve positive growth in 2019 – albeit at a much lower rate than in the previous two years. According to a sample of more than 250 ports, Q1 2019 growth only reached 2.8% globally. It has slowed down from 6.6% in the Q1 2018 and from 4.7% in Q4 2018.
The rate growth is unevenly spread between regions. Several emerging markets have posted negative cargo volume growth and thus pulled down the global growth rate. The weakness in Middle East volumes was caused by a 57% drop in containers handled at Iranian ports and volume declines at the transhipment hubs of Jebel Ali and Salalah. African volumes were driven down by the weak perfomance in South African ports and Australian ports also posted negative volume growths. Among the gainers, both Chinese and American ports reported healthy cargo increases in Q1 2019 and volumes increased despite the ongoing trade tensions between the two countries. However the escalation of the trade war between China and the US is expected to bring down container volume growth rates in both countries over the coming quarters. The OCEAN Alliance carriers have already announced three void transpacific sailings in June in anticipation of the drop in volumes with mor carriers expected to follow.
Source: Alphaliner
Did you know? Reduced estimate for 2019 container throughput
DHL Global Forwarding | OFR Market Update | June 2019
14 14
B A C K - U P
PUBLIC
15 15
Source: DGF
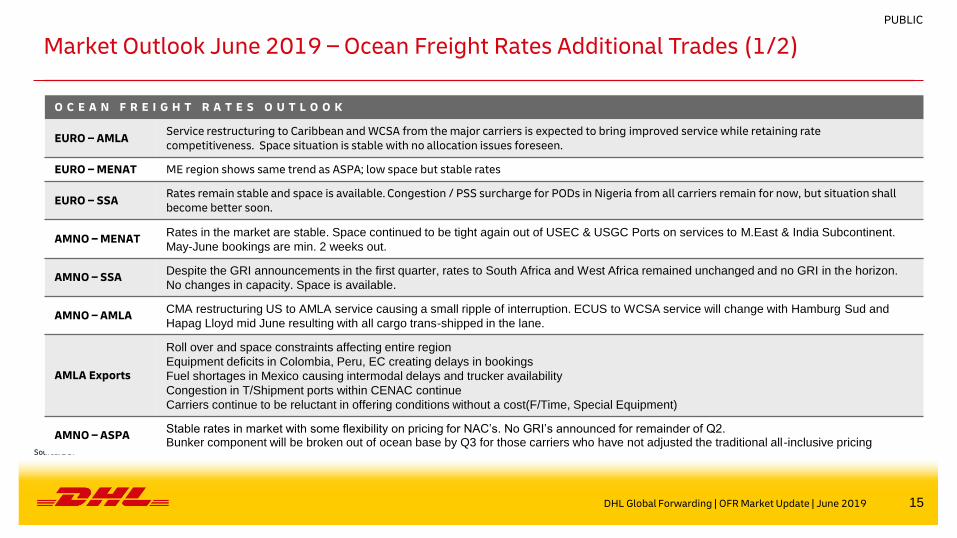
Market Outlook June 2019 – Ocean Freight Rates Additional Trades (1/2)
O C E A N F R E I G H T R A T E S O U T L O O K
EURO – AMLA Service restructuring to Caribbean and WCSA from the major carriers is expected to bring improved service while retaining rate competitiveness. Space situation is stable with no allocation issues foreseen.
EURO – MENAT ME region shows same trend as ASPA; low space but stable rates
EURO – SSA Rates remain stable and space is available. Congestion / PSS surcharge for PODs in Nigeria from all carriers remain for now, but situation shall become better soon.
AMNO – MENAT Rates in the market are stable. Space continued to be tight again out of USEC & USGC Ports on services to M.East & India Subcontinent.
May-June bookings are min. 2 weeks out.
AMNO – SSA Despite the GRI announcements in the first quarter, rates to South Africa and West Africa remained unchanged and no GRI in the horizon.
No changes in capacity. Space is available.
AMNO – AMLA CMA restructuring US to AMLA service causing a small ripple of interruption. ECUS to WCSA service will change with Hamburg Sud and
Hapag Lloyd mid June resulting with all cargo trans-shipped in the lane.
AMLA Exports
Roll over and space constraints affecting entire region
Equipment deficits in Colombia, Peru, EC creating delays in bookings
Fuel shortages in Mexico causing intermodal delays and trucker availability
Congestion in T/Shipment ports within CENAC continue
Carriers continue to be reluctant in offering conditions without a cost(F/Time, Special Equipment)
AMNO – ASPA Stable rates in market with some flexibility on pricing for NAC’s. No GRI’s announced for remainder of Q2. Bunker component will be broken out of ocean base by Q3 for those carriers who have not adjusted the traditional all-inclusive pricing
DHL Global Forwarding | OFR Market Update | June 2019
PUBLIC
16 16
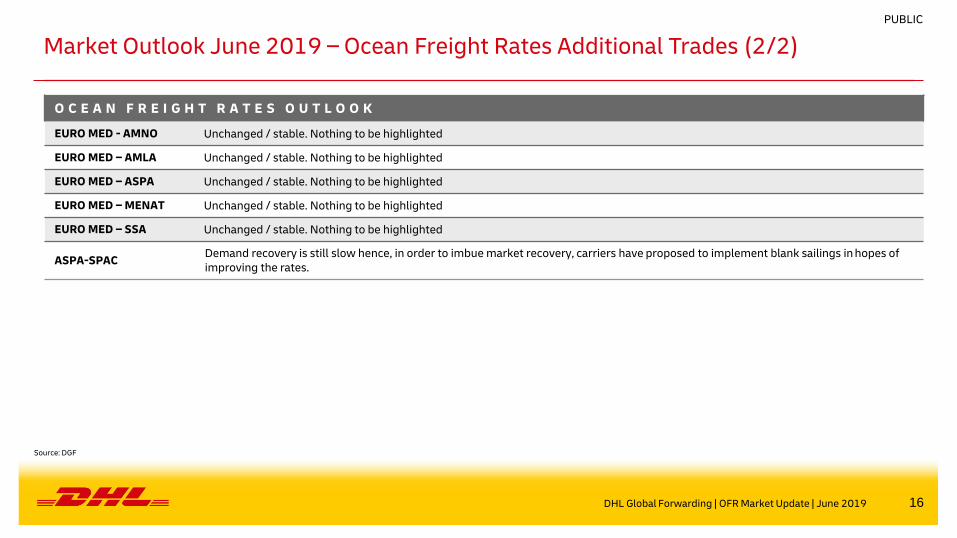
Market Outlook June 2019 – Ocean Freight Rates Additional Trades (2/2)
O C E A N F R E I G H T R A T E S O U T L O O K
EURO MED - AMNO Unchanged / stable. Nothing to be highlighted
EURO MED – AMLA Unchanged / stable. Nothing to be highlighted
EURO MED – ASPA Unchanged / stable. Nothing to be highlighted
EURO MED – MENAT Unchanged / stable. Nothing to be highlighted
EURO MED – SSA Unchanged / stable. Nothing to be highlighted
ASPA-SPAC Demand recovery is still slow hence, in order to imbue market recovery, carriers have proposed to implement blank sailings in hopes of improving the rates.
DHL Global Forwarding | OFR Market Update | June 2019
Source: DGF
PUBLIC
17 17
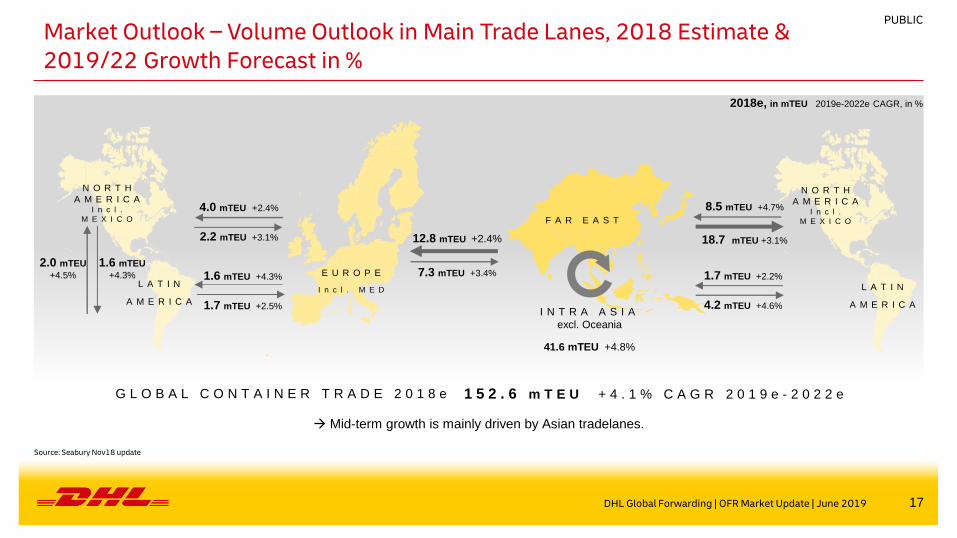
Market Outlook – Volume Outlook in Main Trade Lanes, 2018 Estimate & 2019/22 Growth Forecast in %
N O R T H
A M E R I C A I n c l .
M E X I C O
4.0 mTEU +2.4%
2.2 mTEU +3.1%
1.6 mTEU +4.3%
1.7 mTEU +2.5%
N O R T H
A M E R I C A I n c l .
M E X I C O
L A T I N
A M E R I C A
E U R O P E
I n c l . M E D
12.8 mTEU +2.4%
7.3 mTEU +3.4%
8.5 mTEU +4.7%
18.7 mTEU +3.1%
1.7 mTEU +2.2%
4.2 mTEU +4.6%
2018e, in mTEU 2019e-2022e CAGR, in %
F A R E A S T
I N T R A A S I A
excl. Oceania
41.6 mTEU +4.8%
2.0 mTEU
+4.5%
1.6 mTEU
+4.3%
L A T I N
A M E R I C A
G L O B A L C O N T A I N E R T R A D E 2 0 1 8 e 1 5 2 . 6 m T E U + 4 . 1 % C A G R 2 0 1 9 e - 2 0 2 2 e
Mid-term growth is mainly driven by Asian tradelanes.
Source: Seabury Nov18 update
DHL Global Forwarding | OFR Market Update | June 2019
PUBLIC
18 18
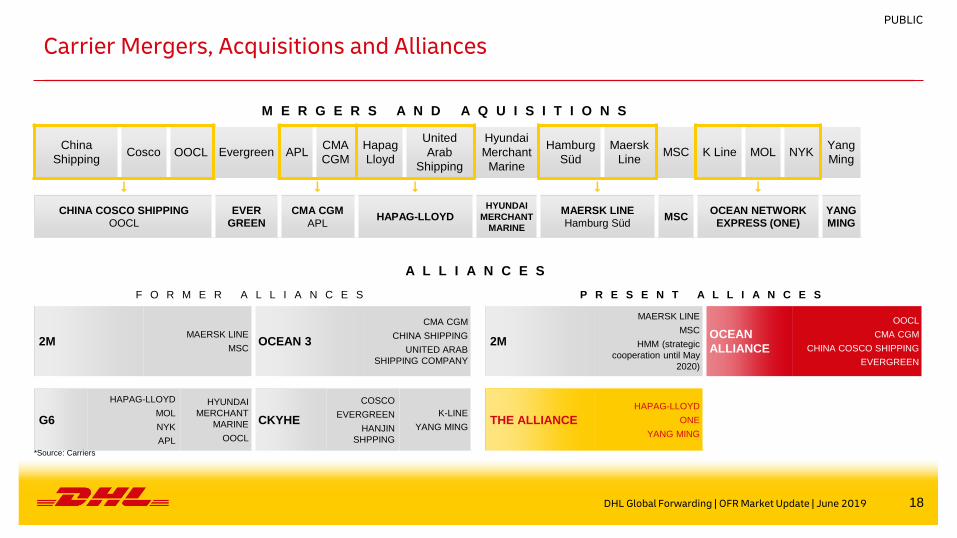
Carrier Mergers, Acquisitions and Alliances
M E R G E R S A N D A Q U I S I T I O N S
China
Shipping Cosco OOCL Evergreen APL
CMA
CGM Hapag
Lloyd
United
Arab
Shipping
Hyundai
Merchant
Marine
Hamburg
Süd Maersk
Line MSC K Line MOL NYK
Yang
Ming
CHINA COSCO SHIPPING
OOCL EVER
GREEN CMA CGM
APL HAPAG-LLOYD
HYUNDAI
MERCHANT
MARINE
MAERSK LINE
Hamburg Süd MSC
OCEAN NETWORK
EXPRESS (ONE) YANG
MING
A L L I A N C E S
F O R M E R A L L I A N C E S P R E S E N T A L L I A N C E S
2M MAERSK LINE
MSC OCEAN 3
CMA CGM
CHINA SHIPPING
UNITED ARAB
SHIPPING COMPANY
2M
MAERSK LINE
MSC
HMM (strategic
cooperation until May
2020)
OCEAN
ALLIANCE
OOCL
CMA CGM
CHINA COSCO SHIPPING
EVERGREEN
G6
HAPAG-LLOYD
MOL
NYK
APL
HYUNDAI
MERCHANT
MARINE
OOCL
CKYHE
COSCO
EVERGREEN
HANJIN
SHPPING
K-LINE
YANG MING THE ALLIANCE
HAPAG-LLOYD
ONE
YANG MING
*Source: Carriers
PUBLIC
DHL Global Forwarding | OFR Market Update | June 2019
19 19
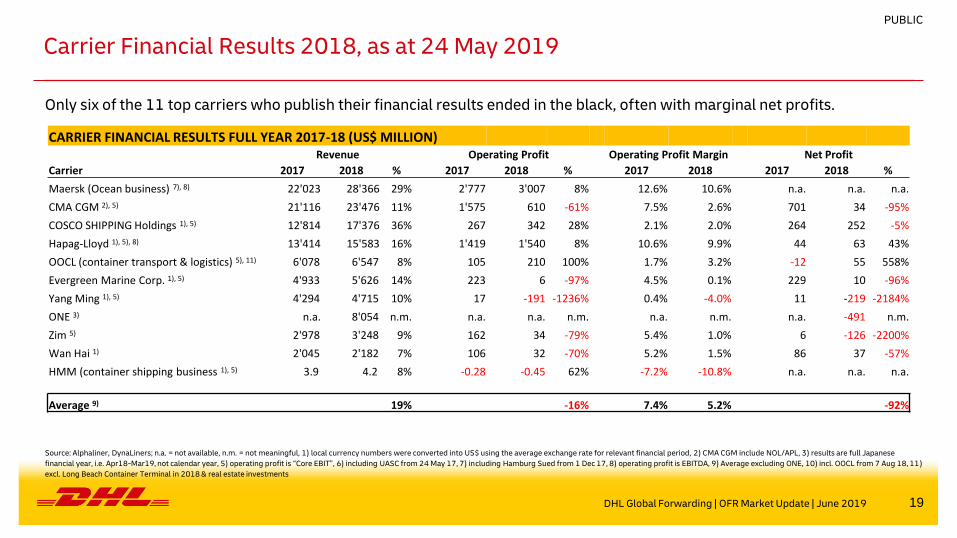
Carrier Financial Results 2018, as at 24 May 2019
DHL Global Forwarding | OFR Market Update | June 2019
Source: Alphaliner, DynaLiners; n.a. = not available, n.m. = not meaningful, 1) local currency numbers were converted into US$ using the average exchange rate for relevant financial period, 2) CMA CGM include NOL/APL, 3) results are full Japanese
financial year, i.e. Apr18-Mar19, not calendar year, 5) operating profit is “Core EBIT”, 6) including UASC from 24 May 17, 7) including Hamburg Sued from 1 Dec 17, 8) operating profit is EBITDA, 9) Average excluding ONE, 10) incl. OOCL from 7 Aug 18, 11)
excl. Long Beach Container Terminal in 2018 & real estate investments
PUBLIC
CARRIER FINANCIAL RESULTS FULL YEAR 2017-18 (US$ MILLION) Revenue Operating Profit Operating Profit Margin Net Profit
Carrier 2017 2018 % 2017 2018 % 2017 2018 2017 2018 %
Maersk (Ocean business) 7), 8) 22'023 28'366 29% 2'777 3'007 8% 12.6% 10.6% n.a. n.a. n.a.
CMA CGM 2), 5) 21'116 23'476 11% 1'575 610 -61% 7.5% 2.6% 701 34 -95%
COSCO SHIPPING Holdings 1), 5) 12'814 17'376 36% 267 342 28% 2.1% 2.0% 264 252 -5%
Hapag-Lloyd 1), 5), 8) 13'414 15'583 16% 1'419 1'540 8% 10.6% 9.9% 44 63 43%
OOCL (container transport & logistics) 5), 11) 6'078 6'547 8% 105 210 100% 1.7% 3.2% -12 55 558%
Evergreen Marine Corp. 1), 5) 4'933 5'626 14% 223 6 -97% 4.5% 0.1% 229 10 -96%
Yang Ming 1), 5) 4'294 4'715 10% 17 -191 -1236% 0.4% -4.0% 11 -219 -2184%
ONE 3) n.a. 8'054 n.m. n.a. n.a. n.m. n.a. n.m. n.a. -491 n.m.
Zim 5) 2'978 3'248 9% 162 34 -79% 5.4% 1.0% 6 -126 -2200%
Wan Hai 1) 2'045 2'182 7% 106 32 -70% 5.2% 1.5% 86 37 -57%
HMM (container shipping business 1), 5) 3.9 4.2 8% -0.28 -0.45 62% -7.2% -10.8% n.a. n.a. n.a.
Average 9) 89'700.1 107'124.3 19% 6'650.2 5'589.2 -16% 7.4% 5.2% 1'328.8 105.1 -92%
Only six of the 11 top carriers who publish their financial results ended in the black, often with marginal net profits.
20 20
Acronyms and Explanations
AMLA - Latin America OCRS - Operational Cost Recovery surcharge
AMNO - North America OOCL - Orient Overseas Container Line
AR - Argentina OWS - Overweight Surcharge
ASPA - AsiaPacific PH - Philippines
BR - Brazil PNW - Pacific North West
CAGR - Compound Annual Growth Rate Ppt. - Percentage points
CENAC - Central Amercia and Caribbean PSW - Pacific South West
CNC - CNC Line (Cheng Lie Navigation Co. Ltd.) SAEC - South America East Coast
DG - Dangerous Goods SAWC - South America West Coast
DWT - Dead Weight Tonnage SOLAS - Safety of Life at Sea
EB - Eastbound SPRC - South People’s Republic of China – South China
ECSA - East Coast South America SSA - Sub-Saharan Africa
EGLV - Evergreen Marine Corp SSL - Steam Ship Line
EURO - Europe T - Thousands
FMC - US Federal Marine Commission TEU - Twenty foot equivalent unit (20‘ container)
GRI - General Rate Increase TSA - Trans Pacific Stabilization Agreement
HMM - Hyundai USGC - US Gulf Coast
HL - Hapag -Lloyd US FMC - US Federal Maritime Commission
HSUD - Hamburg Süd USEC - US East Coast
HWS - Heavy Weight Surcharge USWC - US West Coast
IA - Intra Asia VGM - Verified Gross Mass
IPBC - India Pakistan Bangladesh Colombo VLCS - Very Large Container Ship
IPI - Inland Point Intermodal VSA - Vessel Sharing Agreement
ISC - Indian Sub Continent WB - Westbound
MENAT - Middle East and North Africa WCSA - West Coast South America
ML - Maersk Line WHL - Wan Hai
mn - Millions YML - Yang Ming Line
MoM - Month-on-Month YoY - Year-on-Year
NOO - Non-operating (vessel) owners YTD - Year-to-Date
DHL Global Forwarding | OFR Market Update | June 2019
PUBLIC