dhl global forwarding, freight ocean freight market …...market outlook december 2018 – ocean...
TRANSCRIPT
1
OCEAN FREIGHT MARKET UPDATE
DHL Global Forwarding, Freight
December 2018
PUBLIC
2 2
Contents
TOPIC OF THE MONTH
IMO 2020 regulation effective 1st January 2020
HIGH LEVEL DEVELOPMENT
MARKET OUTLOOK
Freight Rates and Volume Development
ECONOMIC OUTLOOK & DEMAND DEVELOPM ENT
CAPACITY DEVELOPMENT
CARRIERS
REGULATIONS
? DID YOU KNOW?
Top 10 Carriers Capacity Share November 2018
PUBLIC
DHL Global Forwarding | OFR Market Update | Dec 2018
3 3
International Convention for the Prevention of Pollution from Ships (MARPOL)
Topic of the Month
IMO 2020 regulation effective 1st January 2020
Source: DHL
DHL Global Forwarding | OFR Market Update | Dec 2018
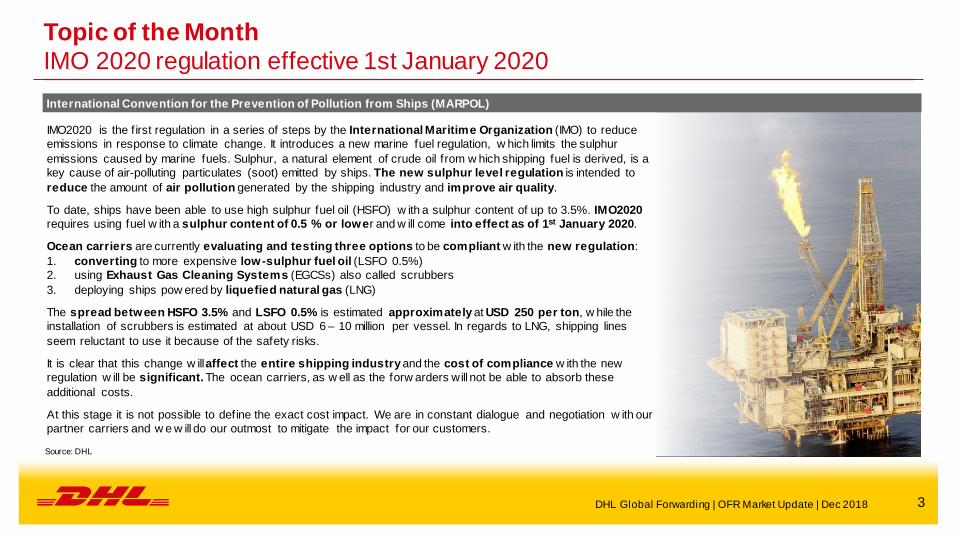
IMO2020 is the f irst regulation in a series of steps by the International Maritime Organization (IMO) to reduce
emissions in response to climate change. It introduces a new marine fuel regulation, w hich limits the sulphur
emissions caused by marine fuels. Sulphur, a natural element of crude oil from w hich shipping fuel is derived, is a
key cause of air-polluting particulates (soot) emitted by ships. The new sulphur level regulation is intended to
reduce the amount of air pollution generated by the shipping industry and improve air quality.
To date, ships have been able to use high sulphur fuel oil (HSFO) w ith a sulphur content of up to 3.5%. IMO2020
requires using fuel w ith a sulphur content of 0.5 % or lower and w ill come into effect as of 1st January 2020.
Ocean carriers are currently evaluating and testing three options to be compliant w ith the new regulation:
1. converting to more expensive low-sulphur fuel oil (LSFO 0.5%)
2. using Exhaust Gas Cleaning Systems (EGCSs) also called scrubbers
3. deploying ships pow ered by liquefied natural gas (LNG)
The spread between HSFO 3.5% and LSFO 0.5% is estimated approximately at USD 250 per ton, w hile the
installation of scrubbers is estimated at about USD 6 – 10 million per vessel. In regards to LNG, shipping lines
seem reluctant to use it because of the safety risks.
It is clear that this change w ill affect the entire shipping industry and the cost of compliance w ith the new
regulation w ill be significant. The ocean carriers, as w ell as the forw arders will not be able to absorb these
additional costs.
At this stage it is not possible to define the exact cost impact. We are in constant dialogue and negotiation w ith our
partner carriers and w e w ill do our outmost to mitigate the impact for our customers.
4 4
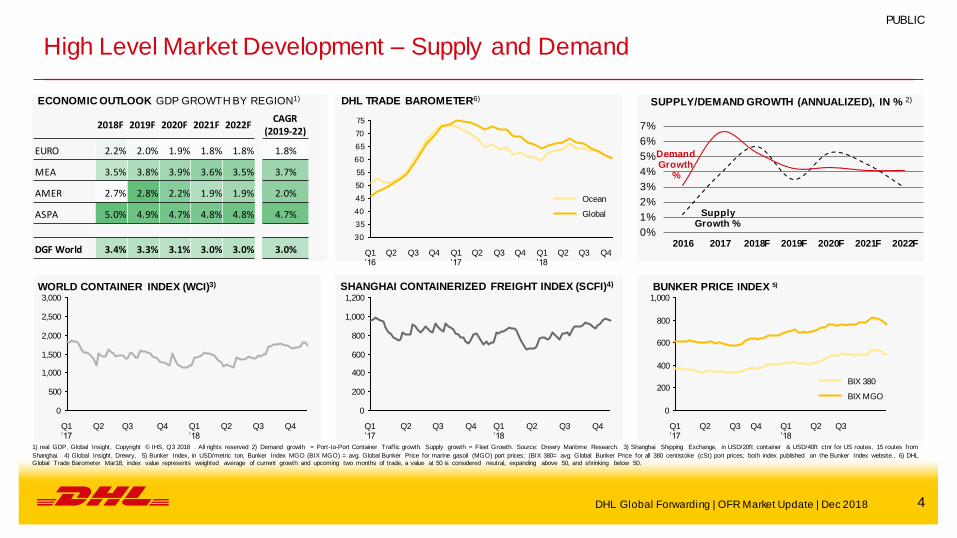
High Level Market Development – Supply and Demand
ECONOMIC OUTLOOK GDP GROWTH BY REGION1)
DHL Global Forwarding | OFR Market Update | Dec 2018
2018F 2019F 2020F 2021F 2022F CAGR
(2019-22)
EURO 2.2% 2.0% 1.9% 1.8% 1.8% 1.8%
MEA 3.5% 3.8% 3.9% 3.6% 3.5% 3.7%
AMER 2.7% 2.8% 2.2% 1.9% 1.9% 2.0%
ASPA 5.0% 4.9% 4.7% 4.8% 4.8% 4.7%
DGF World 3.4% 3.3% 3.1% 3.0% 3.0% 3.0%
PUBLIC
Supply Growth %
Demand Growth
%
0%
1%
2%
3%
4%
5%
6%
7%
2016 2017 2018F 2019F 2020F 2021F 2022F
SUPPLY/DEMAND GROWTH (ANNUALIZED), IN % 2)
1) real GDP, Global Insight, Copyright © IHS, Q3 2018 . All rights reserved 2) Demand growth = Port-to-Port Container Traffic growth. Supply growth = Fleet Growth. Source: Drewry Maritime Research. 3) Shanghai Shipping Exchange, in USD/20ft container & USD/40ft ctnr for US routes, 15 routes from
Shanghai. 4) Global Insight, Drewry, 5) Bunker Index, in USD/metric ton, Bunker Index MGO (BIX MGO) = avg. Global Bunker Price for marine gasoil (MGO) port prices; (BIX 380= avg. Global Bunker Price for all 380 centistoke (cSt) port prices; both index published on the Bunker Index website., 6) DHL Global Trade Barometer Mar18, index value represents weighted average of current growth and upcoming two months of trade, a value at 50 is considered neutral, expanding above 50, and shrinking below 50.
BUNKER PRICE INDEX 5) WORLD CONTAINER INDEX (WCI)3) SHANGHAI CONTAINERIZED FREIGHT INDEX (SCFI)4)
DHL TRADE BAROMETER6)
Q1 ’17
Q3 Q2
3,000
2,500
2,000
1,500
1,000
0
Q4 Q3 Q2
500
Q4 Q1 ’18
1,000
800
600
400
200
0
Q4 Q3 Q2 Q1 ’18
Q4 Q3
1,200
Q2 Q1 ’17
Q2 Q1 ’17
Q2 Q1 ’18
200
Q3
0
Q3 Q4
600
400
1,000
800
BIX MGO
BIX 380
30
35
40
45
50
55
60
65
70
75
Q4 Q3 Q2 Q1 ’18
Q4 Q3 Q2 Q1 ’17
Q4 Q3 Q2 Q1 ’16
Ocean
Global
5 5
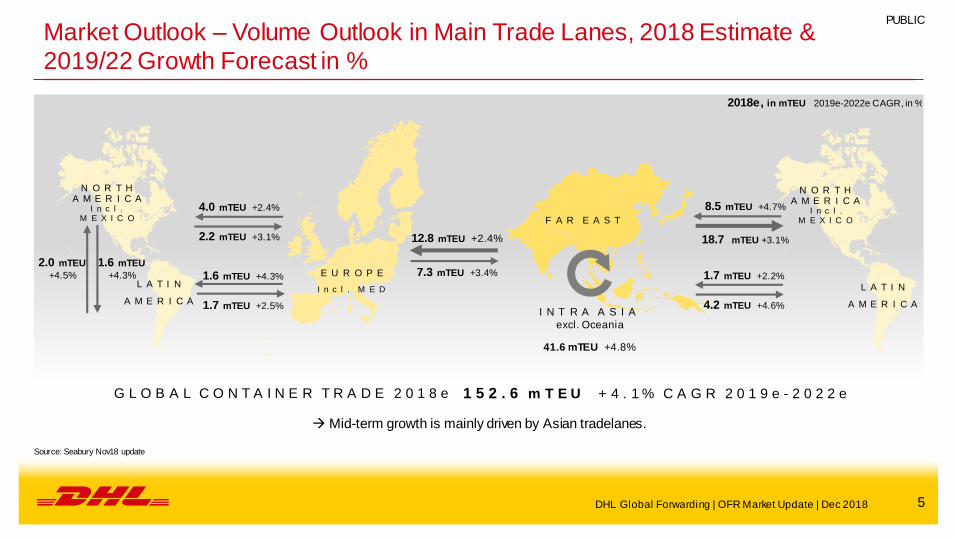
Market Outlook – Volume Outlook in Main Trade Lanes, 2018 Estimate &
2019/22 Growth Forecast in %
N O R T H A M E R I C A
I n c l . M E X I C O
4.0 mTEU +2.4%
2.2 mTEU +3.1%
1.6 mTEU +4.3%
1.7 mTEU +2.5%
N O R T H A M E R I C A
I n c l . M E X I C O
L A T I N
A M E R I C A
E U R O P E
I n c l . M E D
12.8 mTEU +2.4%
7.3 mTEU +3.4%
8.5 mTEU +4.7%
18.7 mTEU +3.1%
1.7 mTEU +2.2%
4.2 mTEU +4.6%
2018e, in mTEU 2019e-2022e CAGR, in %
F A R E A S T
I N T R A A S I A
excl. Oceania
41.6 mTEU +4.8%
2.0 mTEU
+4.5%
1.6 mTEU
+4.3%
L A T I N
A M E R I C A
G L O B A L C O N T A I N E R T R A D E 2 0 1 8 e 1 5 2 . 6 m T E U + 4 . 1 % C A G R 2 0 1 9 e - 2 0 2 2 e
Mid-term growth is mainly driven by Asian tradelanes.
Source: Seabury Nov18 update
DHL Global Forwarding | OFR Market Update | Dec 2018
PUBLIC
6 6
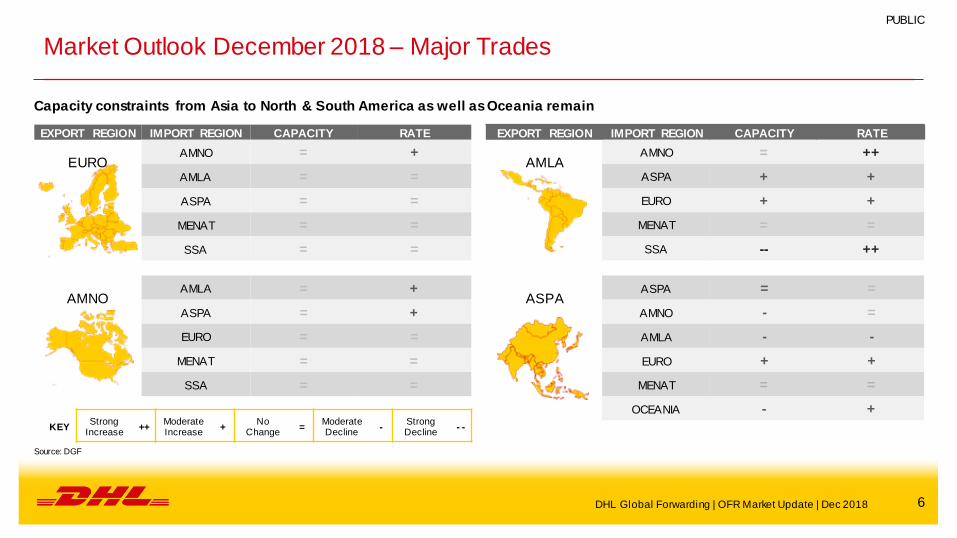
Market Outlook December 2018 – Major Trades
Capacity constraints from Asia to North & South America as well as Oceania remain
KEY Strong
Increase ++
Moderate Increase
+ No
Change =
Moderate Decline
- Strong Decline
- -
EXPORT REGION IMPORT REGION CAPACITY RATE
EURO AMNO = +
AMLA = =
ASPA = =
MENAT = =
SSA = =
AMNO AMLA = +
ASPA = +
EURO = =
MENAT = =
SSA = =
EXPORT REGION IMPORT REGION CAPACITY RATE
AMLA AMNO = ++
ASPA + +
EURO + +
MENAT = =
SSA -- ++
ASPA ASPA = =
AMNO - =
AMLA - -
EURO + +
MENAT = =
OCEANIA - +
DHL Global Forwarding | OFR Market Update | Dec 2018
Source: DGF
PUBLIC

7 7
Market Outlook December 2018 – Ocean Freight Rates Major Trades Market outlook on smaller trades available in the back-up
O C E A N F R E I G H T R A T E S O U T L O O K
ASPA – EURO After the extensive blank sailing program in November, the capacity w ill be back in December w here 2M is redeploying their AE2/Sw an
service, w hich is expected to support the volume increase pre Christmas/New Year/Chinese New Year.
EURO – ASPA & MEA Flat to no development, overall stable. LSF increase due to SHA eco zone. Last GRI approach for MENAT in Nov failed.
ASPA – AMLA Entering into the traditional slack period, rates are dropping, and carriers w ill be doing frequent blank sailing to maintain the rates. MSC
and Maersk already announced blank sailing in Nov/Dec 2018. Do not expect capacity injection to Mexico in 2019.
ASPA – AMNO Dec outlook expected to slow dow n especially the 2nd half of Dec given the festive season as w ell as the cut off for freight arriving in US
prior to the tariff increase effective Jan 2019.
EURO – AMNO Ocean rates are strong and still increasing; inland carriages in US remain problematic
ASPA – MENAT Carriers have started to increase their EBAF w .e.f 01 Dec. For all new business, CN LSF needs to be negotiated. Rates remain
constant, w ith no big surprise and/or huge increase.
ASPA – ASPA
The release and delivery of containers at Manila Port has been impacted by the trucker’s strike due to the congestion faced in recent
months. The Far East to India Subcontinent trade service re-shuffling is now in place. Some decline in market rates is expected as the
carriers try to f ill up their vessels.
AMNO – EURO Rates in the market are stable. Space continued to be an issue especially from US Gulf Coast and USEC but not as bad as earlier this
year so bookings are now out about 2 w eeks.
DHL Global Forwarding | OFR Market Update | Dec 2018
Source: DGF
PUBLIC
8 8
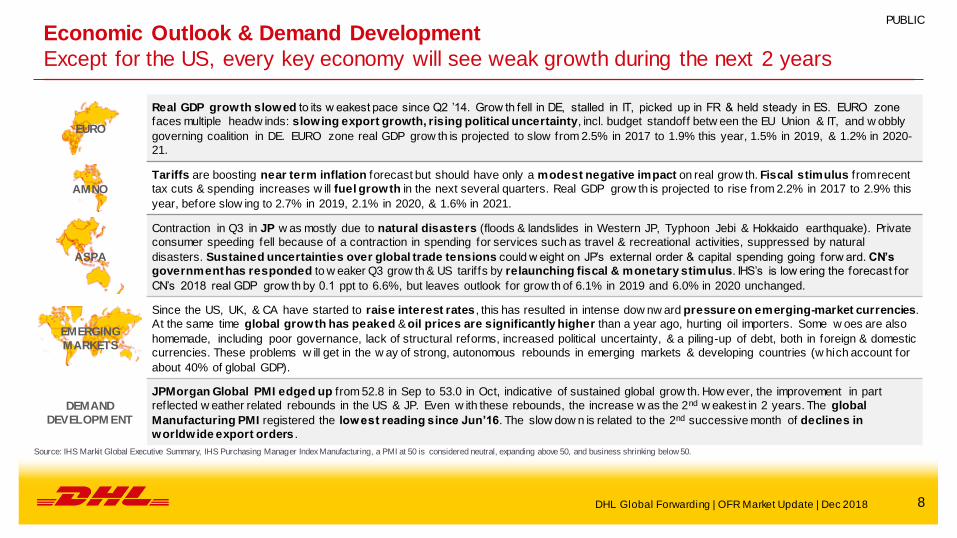
Economic Outlook & Demand Development
Except for the US, every key economy will see weak growth during the next 2 years
Source: IHS Markit Global Executive Summary, IHS Purchasing Manager Index Manufacturing, a PMI at 50 is considered neutral, expanding above 50, and business shrinking below 50.
DHL Global Forwarding | OFR Market Update | Dec 2018
PUBLIC
EURO
Real GDP growth slowed to its w eakest pace since Q2 ’14. Grow th fell in DE, stalled in IT, picked up in FR & held steady in ES. EURO zone
faces multiple headw inds: slowing export growth, rising political uncertainty, incl. budget standoff betw een the EU Union & IT, and w obbly
governing coalition in DE. EURO zone real GDP grow th is projected to slow from 2.5% in 2017 to 1.9% this year, 1.5% in 2019, & 1.2% in 2020-
21.
AMNO
Tariffs are boosting near term inflation forecast but should have only a modest negative impact on real grow th. Fiscal stimulus from recent
tax cuts & spending increases w ill fuel growth in the next several quarters. Real GDP grow th is projected to rise from 2.2% in 2017 to 2.9% this
year, before slow ing to 2.7% in 2019, 2.1% in 2020, & 1.6% in 2021.
ASPA
Contraction in Q3 in JP w as mostly due to natural disasters (floods & landslides in Western JP, Typhoon Jebi & Hokkaido earthquake). Private
consumer speeding fell because of a contraction in spending for services such as travel & recreational activities, suppressed by natural
disasters. Sustained uncertainties over global trade tensions could w eight on JP’s external order & capital spending going forw ard. CN’s
government has responded to w eaker Q3 grow th & US tariffs by relaunching fiscal & monetary stimulus. IHS’s is low ering the forecast for
CN’s 2018 real GDP grow th by 0.1 ppt to 6.6%, but leaves outlook for grow th of 6.1% in 2019 and 6.0% in 2020 unchanged.
EMERGING
MARKETS
Since the US, UK, & CA have started to raise interest rates , this has resulted in intense dow nw ard pressure on emerging-market currencies.
At the same time global growth has peaked & oil prices are significantly higher than a year ago, hurting oil importers. Some w oes are also
homemade, including poor governance, lack of structural reforms, increased political uncertainty, & a piling-up of debt, both in foreign & domestic
currencies. These problems w ill get in the w ay of strong, autonomous rebounds in emerging markets & developing countries (w hich account for
about 40% of global GDP).
DEMAND
DEVELOPM ENT
JPMorgan Global PMI edged up from 52.8 in Sep to 53.0 in Oct, indicative of sustained global grow th. How ever, the improvement in part
reflected w eather related rebounds in the US & JP. Even w ith these rebounds, the increase w as the 2nd w eakest in 2 years. The global
Manufacturing PMI registered the lowest reading since Jun’16. The slow dow n is related to the 2nd successive month of declines in
worldwide export orders .
9 9
Capacity Development 1/2
DHL Global Forwarding | OFR Market Update | Dec 2018
PUBLIC
Source: Alphaliner, carriers
C A P A C I T Y D E V E L O P M E N T
New vessel deliveries for the Oct18 YTD reaches 1.21 mTEU. An additional 140’000 TEU is expected to be delivered in Nov & Dec, bringing the full year
deliveries to ~1.35 mTEU, against 1.19 mTEU in 2017. The tendency remain tow ards large ships, w ith ships > 10’000 TEU representing 83% of this year’s
delivered capacity. Container vessel capacity scrapped by end of Oct on the other hand has reached just 52’150 TEU. The pace of scrapping still expected to be
the lowest on record since 2008. Based on these expected developments Alphaliner expects the overall container ship fleet to reach 22.30 mTEU by end of the
year, corresponding to an annual growth rate of 5.8%, w hich w ould surpass the 3.7% grow th registered last year and the 1.9% in 2016.
The idle fleet has increased to 662’260 TEU as at end of Oct, reaching a new 19 month high. Containership idling typically peaks in the aftermath of the 2
‘Golden Week’ holidays in CN in Oct. Resumption of regular sailings afterw ards and additional spot charters for lengthened services as w ell as ad hoc trips let the
idle feet fall again by some 130’000 to reach 531’868 TEU as at 12 Nov ’18.
Maersk has temporarily shifted 17’816 TEU sister ships ELEONORA MAERSK & EUGEN MAERSK to the Far East-USWC service , replacing the 13’102 TEU
MAERSK ENSENA DA & 13’568 TEU MAERSK ESSEN for the duration of one round voyage . The tw o vessels can be shifted to the Transpacif ic as 2M has
temporarily reduced capacity on the Asia-North Europe trade by suspending the ‘AE-2/Sw an’ service. Both vessels are to return to the Asia-North Europe trade for
the planned restart of the service in December.
MSC, CMA CGM , APL, COSCO Shipping and Hapag-Lloyd have revised their services connecting the Med, Red Sea, Middle East and Indian
subcontinent w ith the set up of 3 new joint serviced to be operated w ithin 3 separate agreements, w ith the partners varying w ith each agreement, thus replacing 4
existing services.
THE Alliance (Hapag-Lloyd, ONE & Yang Ming) w ill add an additional vessel to their Transatlantic loops in December-January. Stretching the service by one
w eek w ill improve schedule reliability during the winter season.
THE Alliance upgrades its South East Asia-North Europe Service ‘FE5’ to 14’000 TEU scale w ith ONE’s latest 14’052 TEU new building, the ONE COLUMBA,
replacing the 10’010 TEU Hapag–Lloyd charter vessel SEASOPN ZAMBEZI. The ONE COLUMBA w ill become the biggest container vessel to call at Leam
Chabang.
10 10
Capacity Development 2/2
DHL Global Forwarding | OFR Market Update | Dec 2018
PUBLIC
Source: Alphaliner, carriers
C A P A C I T Y D E V E L O P M E N T
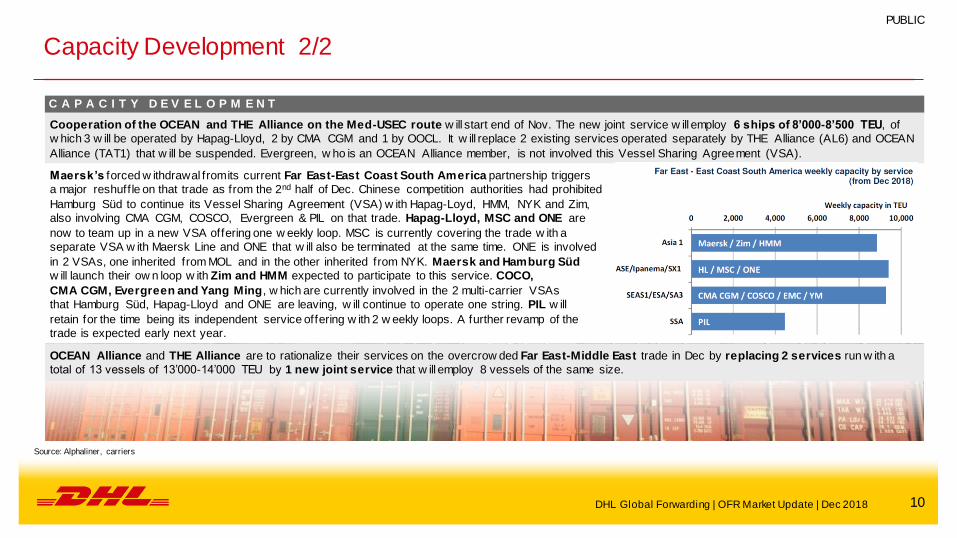
Cooperation of the OCEAN and THE Alliance on the Med-USEC route w ill start end of Nov. The new joint service w ill employ 6 ships of 8’000-8’500 TEU, of
w hich 3 w ill be operated by Hapag-Lloyd, 2 by CMA CGM and 1 by OOCL. It w ill replace 2 existing services operated separately by THE Alliance (AL6) and OCEAN
Alliance (TAT1) that w ill be suspended. Evergreen, w ho is an OCEAN Alliance member, is not involved this Vessel Sharing Agreement (VSA).
Maersk’s forced w ithdrawal from its current Far East-East Coast South America partnership triggers
a major reshuff le on that trade as from the 2nd half of Dec. Chinese competition authorities had prohibited
Hamburg Süd to continue its Vessel Sharing Agreement (VSA) w ith Hapag-Loyd, HMM, NYK and Zim,
also involving CMA CGM, COSCO, Evergreen & PIL on that trade. Hapag-Lloyd, MSC and ONE are
now to team up in a new VSA offering one w eekly loop. MSC is currently covering the trade w ith a
separate VSA w ith Maersk Line and ONE that w ill also be terminated at the same time. ONE is involved
in 2 VSAs, one inherited from MOL and in the other inherited from NYK. Maersk and Hamburg Süd
w ill launch their ow n loop w ith Zim and HMM expected to participate to this service. COCO,
CMA CGM, Evergreen and Yang Ming, w hich are currently involved in the 2 multi-carrier VSAs
that Hamburg Süd, Hapag-Lloyd and ONE are leaving, w ill continue to operate one string. PIL w ill
retain for the time being its independent service offering w ith 2 w eekly loops. A further revamp of the
trade is expected early next year.
OCEAN Alliance and THE Alliance are to rationalize their services on the overcrow ded Far East-Middle East trade in Dec by replacing 2 services run w ith a
total of 13 vessels of 13’000-14’000 TEU by 1 new joint service that w ill employ 8 vessels of the same size.
11 11
Carriers – Q3 ’18 Results (1/2)
Source: Alphaliner, carriers
C A R R I E R S
OOCL volumes grow amidst stagnating freight rates. Total liftings increased by 6.9% to reach a record of 1.71 mTEU but freight rates remained flat at
USD910/TEU. Transpacific trade show ed the best grow th w ith 7.3% volume increase w hile average rates increased by 7.6%. Asia-Europe on the other hand
saw volume growth of 10.4% but average freight rates fell by -9.5%. The intra-Asia & Australasia volumes also grew by 6.6% but rates fell by -4%. The
Transatlantic trade registered a -1.5% volume decline but rates increased by 5.5%.
Would COSCO not have received 1’125 mRMB (162 mUSD) in subsidies form the CN Government for scrapping 8 vessels in 2016 & 2017, their Q3 earnings
w ould have been negative. The carrier could now post a net profit of 822 mRMB for Q3 w hile liftings increased by 7.3% to 5.02mTEU. The additional OOCL
liftings of 1.71 mTEU w ould bring the group’s consolidated liftings to 6.7 mTEU.
In line w ith their profit w arning from 16 Oct, ONE reports -192 mUSD net loss in Q3 (f iscal Q2), bringing its total losses for the f irst 6 months of its operations to
311 mUSD. ONE blames lower liftings, higher empty repositioning costs and a shortfall in expected cost savings for the result. Although lif tings on the
Asia-North America & Asia-Europe route have recovered and utilization has reached 90% on the headhaul, the backhaul has remained w eak at only 33% from
North America & 47% from Europe. ONE has also adjusted its projected synergy cost savings target of 240 m to only 160 mUSD due to higher fuel consumption
caused by unexpected w eather delays.
Hapag-Lloyd posts 112 mEUR net profit in Q3, its best quarter since 2015. The improved results came from record liftings of 3.05 mTEU, an increase of 8.7%
over the same quarter last year. It also benefitted from increasing freight rates, even though the average rate of 1’055 USD/TEU w as 1% low er than in the same
quarter last year. Rate declines on the Middle East trade w ere offset by increases on the Transpacif ic, Transatlantic and Lat in America trades.
Yang Ming has reported a net loss of -910 mNTD (30 mUSD) in Q3, extending its cumulative net loss YTD to 6.67 bnNTD (220 mUSD). An increase in total
liftings to a record of 1.41 mTEU during the quarter w as not enough to lif t the carrier out of the red. Total revenue increased by 8.2%. Yang Ming blamed the
continued supply-demand imbalance for the weak freight rates and the higher bunker fuel costs for the negative performance. The company w ill introduce
four 14’000 TEU chartered new buildings next year, w hile returning 7 higher-cost chartered vessels.
DHL Global Forwarding | OFR Market Update | Dec 2018
PUBLIC
Source: Alphaliner, Dynaliners, carriers
12 12
Carriers – Q3 ’18 Results (2/2)
Source: Alphaliner, carriers
DHL Global Forwarding | OFR Market Update | Dec 2018
PUBLIC
Source: Alphaliner, Dynaliners, carriers
C A R R I E R S
Maersk Ocean has posted an increase in top line revenue & EBITDA in Q3 , mainly due to the addition of Hamburg Süd. Total revenue reached 7’321 mUSD
(+32%), EBITDA 925 mUSD (+16%). How ever, EBITDA margins dropped from 14.4% to 12.6% due to higher bunker costs and lower than expected liftings .
Liftings w ere 26.7% higher in YoY but fell -1.9% compared to Q2 due to low er volumes in Europe & LATAM. Maersk also failed to capitalize on the Transpacif ic
volume strength due to its relative under-w eight position on that trade.
With an operating loss of -110 bnKRW (-98 mUSD) in Q3 HMM is now loss–making for 16 consecutive quarters. Its operating margin of -8.6% leaves the carrier
at the bottom of the main carriers. HMM failed to capitalize on rising liftings and freight rates during the quarter and continues to suffer from high operating
costs w hile capacity utilization was reported to have dropped from 79.3% in Q2 to 79.0% in Q3.
CMA CGM posts net profits of 103 mUSD in Q3, reversing the negative results of the 1st half of the year. Operating profits (core EBIT) reached 2’241 mUSD
for a positive operating margin of 4.0%. Total liftings reached 5.26 mTEU (+5.5% YoY) w hile average freight rates increased by +0.8% YoY and +4.9% QoQ
to 1’154 USD/TEU mainly due to gains on the transpacif ic. Fuel costs increase to 922 mUSD (+49%) YoY resulting in reduced margins.
Zim ’s revenue rose 2.4 bnUSD (+8%) in Q3, w hile liftings increased by +13% to 2.2 mTEU. Revenue per TEU dropped by -4% to USD 1’089, EBITDA by -
60% and net results turned from a positive 31 mUSD to -74 mUSD.
13 13
Carriers
Source: Alphaliner, carriers
DHL Global Forwarding | OFR Market Update | Dec 2018
PUBLIC
Source: Alphaliner, Dynaliners, carriers
C A R R I E R S
CMA CGM has received regulatory approval from the EU Commission to take over the shortsea carrier “Containerships” on 31 Oct ’18. The transaction w as
announced on 20 June. All container logistics operations are to be integrated in CMA CGM’s intra-regional market offering in North Europe and the Mediterranean.
Costamar Shipping agreed to install scrubbers and increase the charter rates for 5 vessels that are currently on 10-year charters to MSC. The ships involved
are the 2014-built 9’403 TEU container vessels MSC AZOV, MSC AJACIO & MSC AMALFI and the 2013-built 8’827 TEU MSC ATHENS & MSC ATHOS.
Capital Product Partners have agreed w ith HMM to equip w ith scrubbers five 5’023 TEU widebeam container vessels currently on long term charters to
HMM. The 5 ships involved all delivered in 2013 w ith 12-year charters from Capital. Effective 1 Jan ’20 or from the installation date of the scrubbers, HMM w ill pay
USD 4’900 per day more for the charter hire of each ship. As the charters run until 2025 HMM w ould pay an extra of 9 mUSD per ship.
Yang Ming opts for scrubbers on 8 newbuildings of 2’800 TEU ordered in Aug ’18. The price has been revised in Nov by 4 mUSD per ship due to “new
installation of marine equipment”, that is believed to be related to the installation of scrubber on the ships.
Maersk has committed 80 mUSD for the installation of scrubbers and retrofitting for a selected part of its f leet. Alphaliner estimates that 10-20 vessels will be
f itted based at a reported cost of betw een 4 mUSD and 8 mUSD each.
Hapag-Lloyd has ordered 10 scrubbers to be retrofitted on its HAMBURG EXPRESS 13’169 TEU class vessels. Earlier the carrier had already disclosed a pilot
project to convert one of its vessels to LNG propulsion.
Moller-Maersk, CMA CGM, Hapag-Lloyd, MSC and ONE are discussing the creation of common IT standards w hich shall be openly available and free of
charge for all stakeholder in the container shipping industry to pave the w ay for digitalization and standardization. The founding carriers control 58% of the global
capacity but does not include some of the largest Asian carriers.
14 14
Regulations
Source: Alphaliner, carriers
R E G U L A T I O N S
South Africa: High Cube Container Notification - UPDATE
The ministry of transport has agreed in a meeting w ith representative of the Freight Association to extend the current leniency of Regulation 224 of the Road
Traff ic Act w hich means that 40 foot high cube containers can continue to be transported on standard trailers. This extension w ill be effective from 01 January
2019 until 01 January 2020.
Source: DHL
DHL Global Forwarding | OFR Market Update | Dec 2018
PUBLIC
15 15
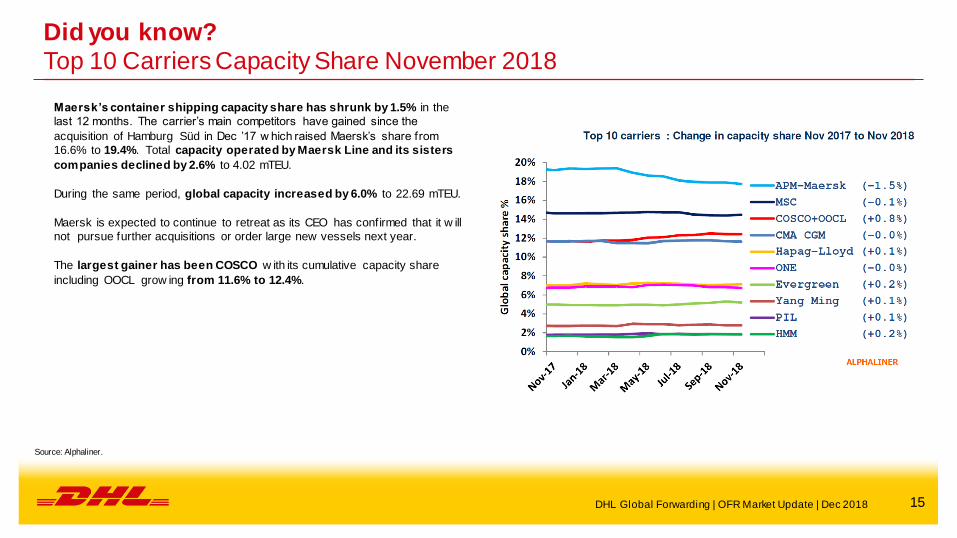
Maersk’s container shipping capacity share has shrunk by 1.5% in the
last 12 months. The carrier’s main competitors have gained since the
acquisition of Hamburg Süd in Dec ’17 w hich raised Maersk’s share from
16.6% to 19.4%. Total capacity operated by Maersk Line and its sisters
companies declined by 2.6% to 4.02 mTEU.
During the same period, global capacity increased by 6.0% to 22.69 mTEU.
Maersk is expected to continue to retreat as its CEO has confirmed that it w ill
not pursue further acquisitions or order large new vessels next year.
The largest gainer has been COSCO w ith its cumulative capacity share
including OOCL grow ing from 11.6% to 12.4%.
Did you know?
Top 10 Carriers Capacity Share November 2018
Source: Alphaliner.
DHL Global Forwarding | OFR Market Update | Dec 2018
16 16 B A C K - U P
PUBLIC
17 17
Source: DGF
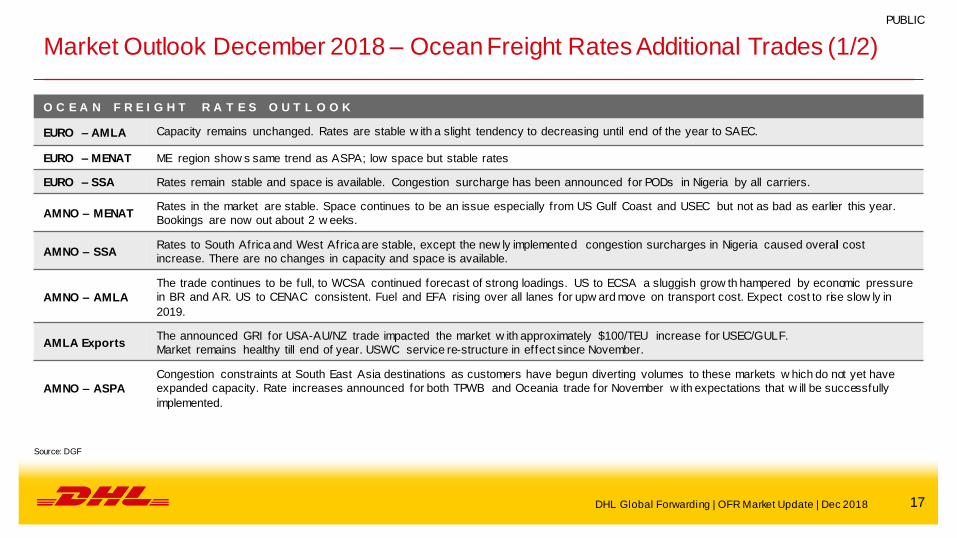
Market Outlook December 2018 – Ocean Freight Rates Additional Trades (1/2)
O C E A N F R E I G H T R A T E S O U T L O O K
EURO – AMLA Capacity remains unchanged. Rates are stable w ith a slight tendency to decreasing until end of the year to SAEC.
EURO – MENAT ME region show s same trend as ASPA; low space but stable rates
EURO – SSA Rates remain stable and space is available. Congestion surcharge has been announced for PODs in Nigeria by all carriers.
AMNO – MENAT Rates in the market are stable. Space continues to be an issue especially from US Gulf Coast and USEC but not as bad as earlier this year.
Bookings are now out about 2 w eeks.
AMNO – SSA Rates to South Africa and West Africa are stable, except the new ly implemented congestion surcharges in Nigeria caused overall cost
increase. There are no changes in capacity and space is available.
AMNO – AMLA
The trade continues to be full, to WCSA continued forecast of strong loadings. US to ECSA a sluggish grow th hampered by economic pressure
in BR and AR. US to CENAC consistent. Fuel and EFA rising over all lanes for upw ard move on transport cost. Expect cost to rise slow ly in
2019.
AMLA Exports The announced GRI for USA-AU/NZ trade impacted the market w ith approximately $100/TEU increase for USEC/GULF.
Market remains healthy till end of year. USWC service re-structure in effect since November.
AMNO – ASPA
Congestion constraints at South East Asia destinations as customers have begun diverting volumes to these markets w hich do not yet have
expanded capacity. Rate increases announced for both TPWB and Oceania trade for November w ith expectations that w ill be successfully
implemented.
DHL Global Forwarding | OFR Market Update | Dec 2018
PUBLIC
18 18
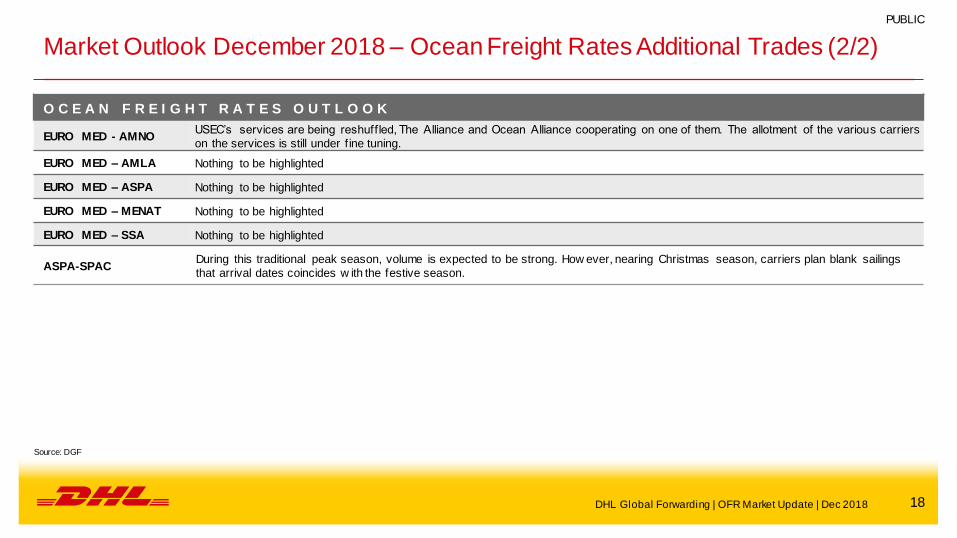
Market Outlook December 2018 – Ocean Freight Rates Additional Trades (2/2)
O C E A N F R E I G H T R A T E S O U T L O O K
EURO MED - AMNO USEC’s services are being reshuffled, The Alliance and Ocean Alliance cooperating on one of them. The allotment of the various carriers
on the services is still under f ine tuning.
EURO MED – AMLA Nothing to be highlighted
EURO MED – ASPA Nothing to be highlighted
EURO MED – MENAT Nothing to be highlighted
EURO MED – SSA Nothing to be highlighted
ASPA-SPAC During this traditional peak season, volume is expected to be strong. How ever, nearing Christmas season, carriers plan blank sailings
that arrival dates coincides w ith the festive season.
DHL Global Forwarding | OFR Market Update | Dec 2018
Source: DGF
PUBLIC
19 19
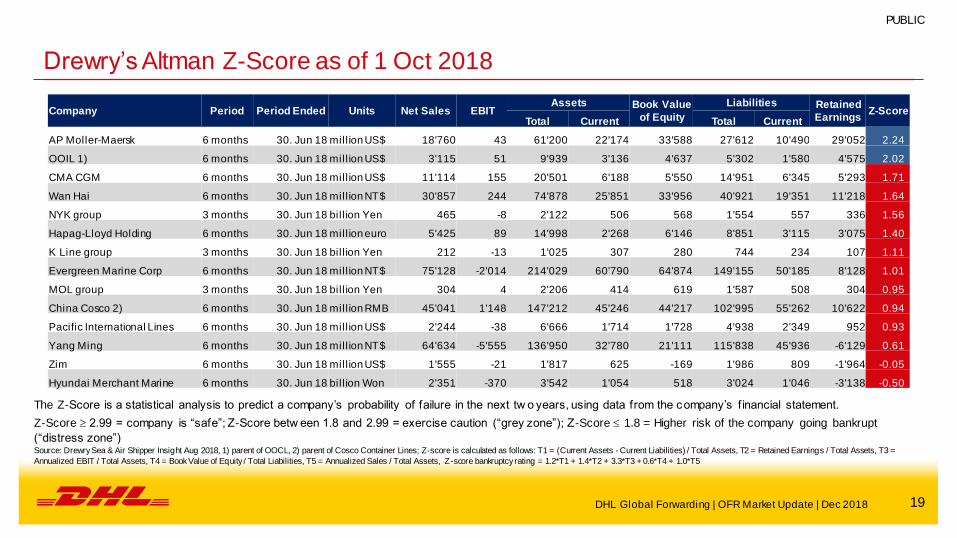
Drewry’s Altman Z-Score as of 1 Oct 2018
DHL Global Forwarding | OFR Market Update | Dec 2018
PUBLIC
Source: Drewry Sea & Air Shipper Insight Aug 2018, 1) parent of OOCL, 2) parent of Cosco Container Lines; Z-score is calculated as follows: T1 = (Current Assets - Current Liabilities) / Total Assets, T2 = Retained Earnings / Total Assets, T3 =
Annualized EBIT / Total Assets, T4 = Book Value of Equity / Total Liabilities, T5 = Annualized Sales / Total Assets, Z-score bankruptcy rating = 1.2*T1 + 1.4*T2 + 3.3*T3 + 0.6*T4 + 1.0*T5
The Z-Score is a statistical analysis to predict a company’s probability of failure in the next tw o years, using data from the company’s f inancial statement.
Z-Score 2.99 = company is “safe”; Z-Score betw een 1.8 and 2.99 = exercise caution (“grey zone”); Z-Score 1.8 = Higher risk of the company going bankrupt
(“distress zone”)
Company Period Period Ended Units Net Sales EBIT Assets Book Value
of Equity
Liabilities Retained
Earnings Z-Score
Total Current Total Current
AP Moller-Maersk 6 months 30. Jun 18 mill ion US$ 18'760 43 61'200 22'174 33'588 27'612 10'490 29'052 2.24
OOIL 1) 6 months 30. Jun 18 mill ion US$ 3'115 51 9'939 3'136 4'637 5'302 1'580 4'575 2.02
CMA CGM 6 months 30. Jun 18 mill ion US$ 11'114 155 20'501 6'188 5'550 14'951 6'345 5'293 1.71
Wan Hai 6 months 30. Jun 18 mill ion NT$ 30'857 244 74'878 25'851 33'956 40'921 19'351 11'218 1.64
NYK group 3 months 30. Jun 18 bill ion Yen 465 -8 2'122 506 568 1'554 557 336 1.56
Hapag-Lloyd Holding 6 months 30. Jun 18 mill ion euro 5'425 89 14'998 2'268 6'146 8'851 3'115 3'075 1.40
K Line group 3 months 30. Jun 18 bill ion Yen 212 -13 1'025 307 280 744 234 107 1.11
Evergreen Marine Corp 6 months 30. Jun 18 mill ion NT$ 75'128 -2'014 214'029 60'790 64'874 149'155 50'185 8'128 1.01
MOL group 3 months 30. Jun 18 bil l ion Yen 304 4 2'206 414 619 1'587 508 304 0.95
China Cosco 2) 6 months 30. Jun 18 mill ion RMB 45'041 1'148 147'212 45'246 44'217 102'995 55'262 10'622 0.94
Pacific International Lines 6 months 30. Jun 18 mill ion US$ 2'244 -38 6'666 1'714 1'728 4'938 2'349 952 0.93
Yang Ming 6 months 30. Jun 18 mill ion NT$ 64'634 -5'555 136'950 32'780 21'111 115'838 45'936 -6'129 0.61
Zim 6 months 30. Jun 18 mill ion US$ 1'555 -21 1'817 625 -169 1'986 809 -1'964 -0.05
Hyundai Merchant Marine 6 months 30. Jun 18 bill ion Won 2'351 -370 3'542 1'054 518 3'024 1'046 -3'138 -0.50
20 20
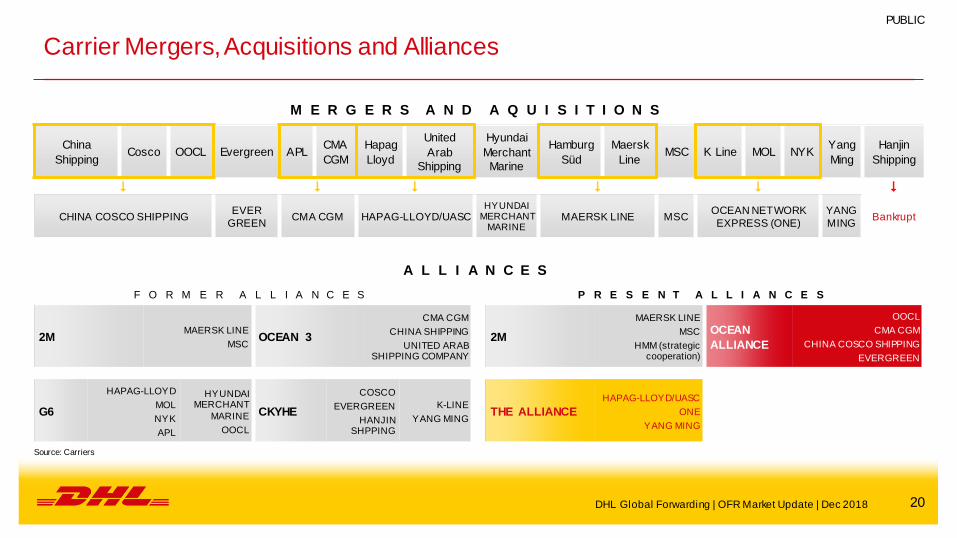
Carrier Mergers, Acquisitions and Alliances
M E R G E R S A N D A Q U I S I T I O N S
China
Shipping Cosco OOCL Evergreen APL
CMA
CGM
Hapag
Lloyd
United
Arab
Shipping
Hyundai
Merchant
Marine
Hamburg
Süd
Maersk
Line MSC K Line MOL NYK
Yang
Ming
Hanjin
Shipping
CHINA COSCO SHIPPING EVER
GREEN CMA CGM HAPAG-LLOYD/UASC
HYUNDAI MERCHANT
MARINE MAERSK LINE MSC
OCEAN NETWORK
EXPRESS (ONE) YANG
MING Bankrupt
A L L I A N C E S
F O R M E R A L L I A N C E S P R E S E N T A L L I A N C E S
2M MAERSK LINE
MSC OCEAN 3
CMA CGM
CHINA SHIPPING
UNITED ARAB SHIPPING COMPANY
2M
MAERSK LINE
MSC
HMM (strategic cooperation)
OCEAN
ALLIANCE
OOCL
CMA CGM
CHINA COSCO SHIPPING
EVERGREEN
G6
HAPAG-LLOYD
MOL
NYK
APL
HYUNDAI MERCHANT
MARINE
OOCL
CKYHE
COSCO
EVERGREEN
HANJIN SHPPING
K-LINE
YANG MING THE ALLIANCE
HAPAG-LLOYD/UASC
ONE
YANG MING
Source: Carriers
PUBLIC
DHL Global Forwarding | OFR Market Update | Dec 2018
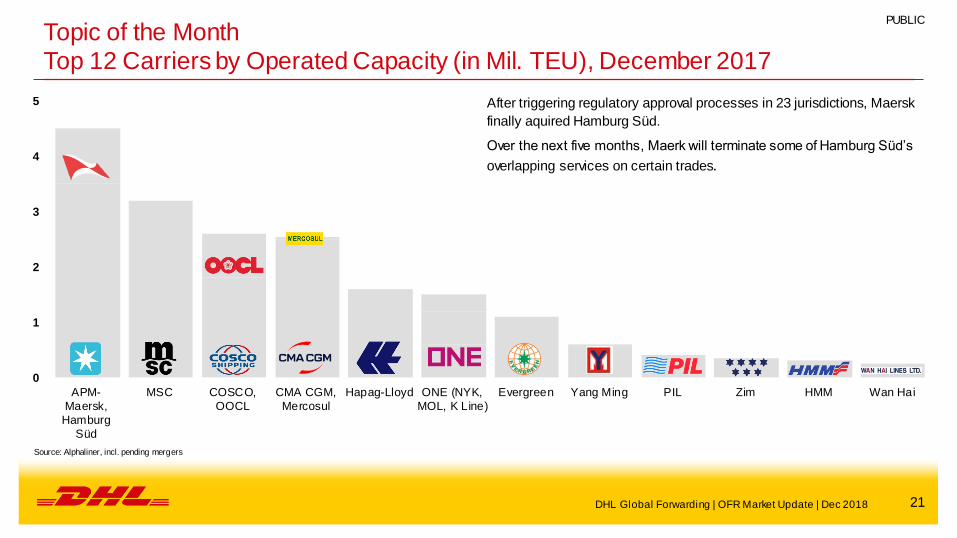
21 21
Topic of the Month
Top 12 Carriers by Operated Capacity (in Mil. TEU), December 2017
0
1
2
3
4
5
APM-
Maersk,
Hamburg
Süd
MSC COSCO,
OOCL
CMA CGM,
Mercosul
Hapag-Lloyd ONE (NYK,
MOL, K Line)
Evergreen Yang Ming PIL Zim HMM Wan Hai
Source: Alphaliner, incl. pending mergers
After triggering regulatory approval processes in 23 jurisdictions, Maersk
finally aquired Hamburg Süd.
Over the next five months, Maerk will terminate some of Hamburg Süd’s
overlapping services on certain trades.
PUBLIC
DHL Global Forwarding | OFR Market Update | Dec 2018
22 22
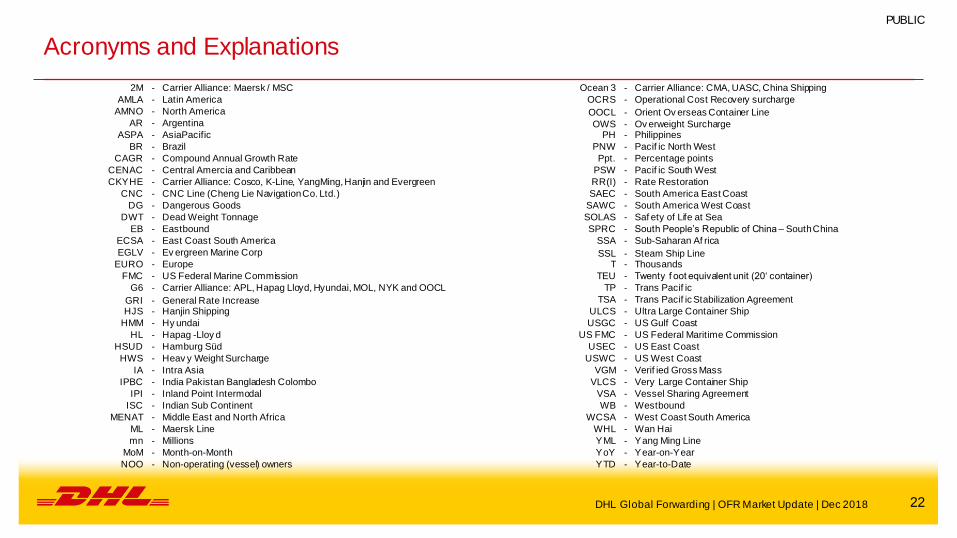
Acronyms and Explanations
2M - Carrier Alliance: Maersk / MSC Ocean 3 - Carrier Alliance: CMA, UASC, China Shipping
AMLA - Latin America OCRS - Operational Cost Recovery surcharge
AMNO - North America OOCL - Orient Ov erseas Container Line AR - Argentina OWS - Ov erweight Surcharge
ASPA - AsiaPacific PH - Philippines
BR - Brazil PNW - Pacif ic North West
CAGR - Compound Annual Growth Rate Ppt. - Percentage points
CENAC - Central Amercia and Caribbean PSW - Pacif ic South West
CKYHE - Carrier Alliance: Cosco, K-Line, YangMing, Hanjin and Evergreen RR(I) - Rate Restoration
CNC - CNC Line (Cheng Lie Navigation Co. Ltd.) SAEC - South America East Coast
DG - Dangerous Goods SAWC - South America West Coast
DWT - Dead Weight Tonnage SOLAS - Saf ety of Life at Sea
EB - Eastbound SPRC - South People’s Republic of China – South China
ECSA - East Coast South America SSA - Sub-Saharan Af rica
EGLV - Ev ergreen Marine Corp SSL - Steam Ship Line EURO - Europe T - Thousands
FMC - US Federal Marine Commission TEU - Twenty f oot equivalent unit (20‘ container)
G6 - Carrier Alliance: APL, Hapag Lloyd, Hyundai, MOL, NYK and OOCL TP - Trans Pacif ic
GRI - General Rate Increase TSA - Trans Pacif ic Stabilization Agreement
HJS - Hanjin Shipping ULCS - Ultra Large Container Ship
HMM - Hy undai USGC - US Gulf Coast
HL - Hapag -Lloy d US FMC - US Federal Maritime Commission
HSUD - Hamburg Süd USEC - US East Coast
HWS - Heav y Weight Surcharge USWC - US West Coast
IA - Intra Asia VGM - Verif ied Gross Mass
IPBC - India Pakistan Bangladesh Colombo VLCS - Very Large Container Ship
IPI - Inland Point Intermodal VSA - Vessel Sharing Agreement
ISC - Indian Sub Continent WB - Westbound
MENAT - Middle East and North Africa WCSA - West Coast South America
ML - Maersk Line WHL - Wan Hai
mn - Millions YML - Yang Ming Line
MoM - Month-on-Month YoY - Year-on-Year
NOO - Non-operating (vessel) owners YTD - Year-to-Date
DHL Global Forwarding | OFR Market Update | Dec 2018
PUBLIC