dry bulk freight market: prospects for recovery
TRANSCRIPT

May 2013
Whilst care and attention has been taken to ensure that the information contained is accurate, it
is supplied without guarantee. SSY Consultancy & Research can accept no responsibility for any
errors or omissions or consequences arising therefrom.
Dry Bulk Freight Market:
Prospects For Recovery
Platts 9th Steel Markets Europe Conference
London 24 May 2013
freight story in the year to date
• capes experience major seasonal plunge in earnings for fourth consecutive year due to reduced cargo availability and re-acceleration in newbuilding deliveries
• panamax spot earnings briefly reach 10-month high as congestion exaggerates Latin America grain effect
• soft start to the year for geared vessels before seasonal upswing re-establishes supras as highest earning sector in year to date
• uneven shift in sentiment
May 2013

capesize iron ore spot rates to China:
monthly averages
0
10
20
30
40
50
60
70
80
90
100Jan
-03
Ju
l-03
Jan
-04
Ju
l-0
4
Jan
-05
Ju
l-05
Jan
-06
Ju
l-06
Jan
-07
Ju
l-07
Jan
-08
Ju
l-08
Jan
-09
Ju
l-09
Jan
-10
Ju
l-10
Jan
-11
Ju
l-1
1
Jan
-12
Ju
l-12
Jan
-13
$/t
W.Australia
Brazil
May 2013

freight’s share of delivered iron ore prices
to China
May 2013
0
10
20
30
40
50
60
70
Ja
n-0
6
Ap
r-0
6
Ju
l-0
6
Oct
-06
Ja
n-0
7
Ap
r-0
7
Ju
l-0
7
Oct
-07
Ja
n-0
8
Ap
r-0
8
Ju
l-0
8
Oct
-08
Ja
n-0
9
Ap
r-0
9
Ju
l-0
9
Oct
-09
Ja
n-1
0
Ap
r-1
0
Ju
l-1
0
Oct
-10
Ja
n-1
1
Ap
r-1
1
Ju
l-1
1
Oct
-11
Ja
n-1
2
Ap
r-1
2
Ju
l-1
2
Oct
-12
Ja
n-1
3
Ap
r-1
3
% S
ha
re
Australia Avg 2006-13
Brazil Avg 2006-13

freight’s contribution to $/t steel
production costs
May 2013
0
2
4
6
8
10
12
14
16
18
0
10
20
30
40
50
60
70
80
90
% S
ha
re
$/t
weighted average freight ($/t)
% Share

4
6
8
10
12
14
16
18
20
Jan
-09
Ju
l-09
Jan
-10
Ju
l-10
Jan
-11
Ju
l-11
Jan
-12
Ju
l-12
Jan
-13
Ju
l-13
Jan
-14
Ju
l-14
Jan
-15
Ju
l-15
$/t
Actual FFA (23 May 13)
W.Australia-China capesize iron ore rates
May 2013
does freight have any more surprises for
the steel and iron ore industry?
• dry bulk market overwhelmed by excess newbuilding deliveries…
• but positive Chinese-led trade growth continues
• with planned influx of additional iron ore export capacity planned adding to upside for dry bulk trade
• depressed freight rates have triggered supply-side responses - slower steaming, record scrapping and reduced newbuilding orderbook
• port congestion remains a feature of the iron ore trades and potential source for future volatility
May 2013

quarterly dry bulk carrier deliveries by size
0
4
8
12
16
20
24
28
32
361q
08
2q
08
3q
08
4q
08
1q
09
2q
09
3q
09
4q
09
1q
10
2q
10
3q
10
4q
10
1q
11
2q
11
3q
11
4q
11
1q
12
2q
12
3q
12
4q
12
1q
13
2q
13(f
)
3q
13(f
)
4q
13(f
)
Md
wt
Capesize Panamax
Handymax Handy
May 2013
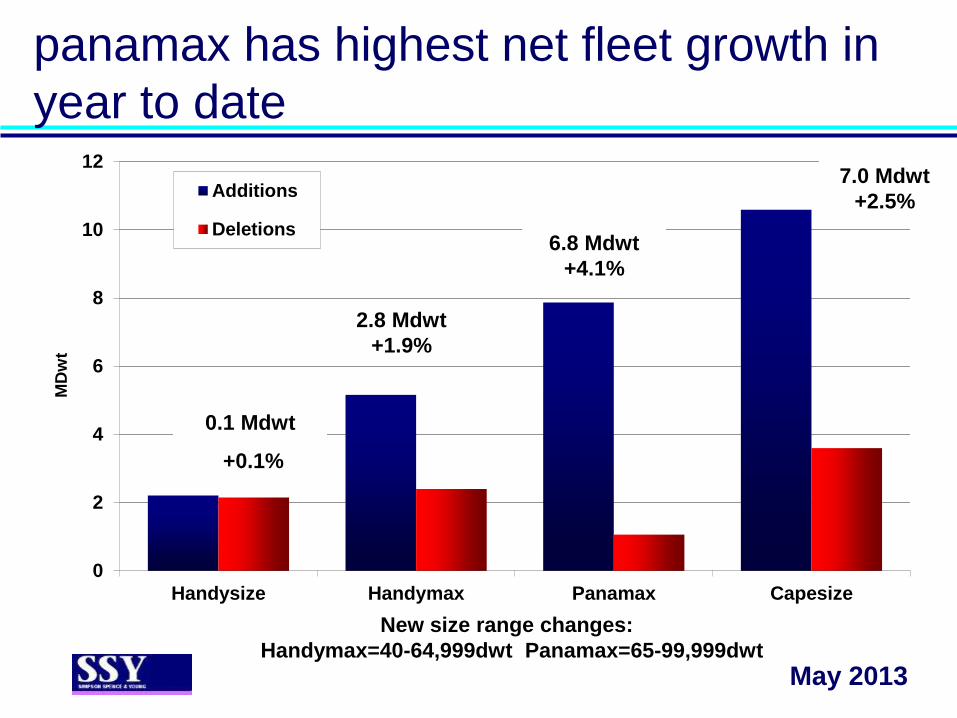
panamax has highest net fleet growth in
year to date
0
2
4
6
8
10
12
Handysize Handymax Panamax Capesize
MD
wt
Additions
Deletions
0.1 Mdwt
+0.1%
2.8 Mdwt
+1.9%
7.0 Mdwt
+2.5%
6.8 Mdwt
+4.1%
May 2013
New size range changes:
Handymax=40-64,999dwt Panamax=65-99,999dwt

SSY capesize iron ore port congestion
index for China
May 2013
0
2
4
6
8
10
12
14
16
18Ja
n-0
8
Ma
r-0
8
Ma
y-0
8
Ju
l-0
8
Se
p-0
8
No
v-0
8
Ja
n-0
9
Ma
r-0
9
Ma
y-0
9
Ju
l-0
9
Se
p-0
9
No
v-0
9
Ja
n-1
0
Ma
r-1
0
Ma
y-1
0
Ju
l-1
0
Se
p-1
0
No
v-1
0
Ja
n-1
1
Ma
r-1
1
Ma
y-1
1
Ju
l-1
1
Se
p-1
1
No
v-1
1
Ja
n-1
2
Ma
r-1
2
Ma
y-1
2
Ju
l-1
2
Se
p-1
2
No
v-1
2
Ja
n-1
3
Ma
r-1
3
Ma
y-1
3
We
igh
ted
ave
rag
e d
ela
ys
(d
ays
)
60 Capes =
4% of fleet
87 Capes =
10% of fleet
44 Capes = 3% of fleet

Chinese dry bulk imports: sustained
upward trend
May 2013
0
100
200
300
400
500
600
700
800
900
1,000
1,100
1,200
1,300
1,400
2000 2001 2002 2003 2004 2005 2006 2007 2008 2009 2010 2011 2012 2013a
mill
ion
to
nn
es
All Others Grains
Total coal Iron Ore
Source: SSY
"Other" comprises steel products, bauxite/alumina, pulp, fertilizers, ferrous scrap, nickel, copper, chrome and manganese ores

Brazilian iron ore exports & Capesize
earnings
May 2013
0
5,000
10,000
15,000
20,000
25,000
30,000
35,000
40,000
60.0
65.0
70.0
75.0
80.0
85.0
90.0
95.0
100.0
1q10 2q10 3q10 4q10 1q11 2q11 3q11 4q11 1q12 2q12 3q12 4q12 1q13
$/D
ay
Millio
n to
nn
es
Exports Average TC Earnings
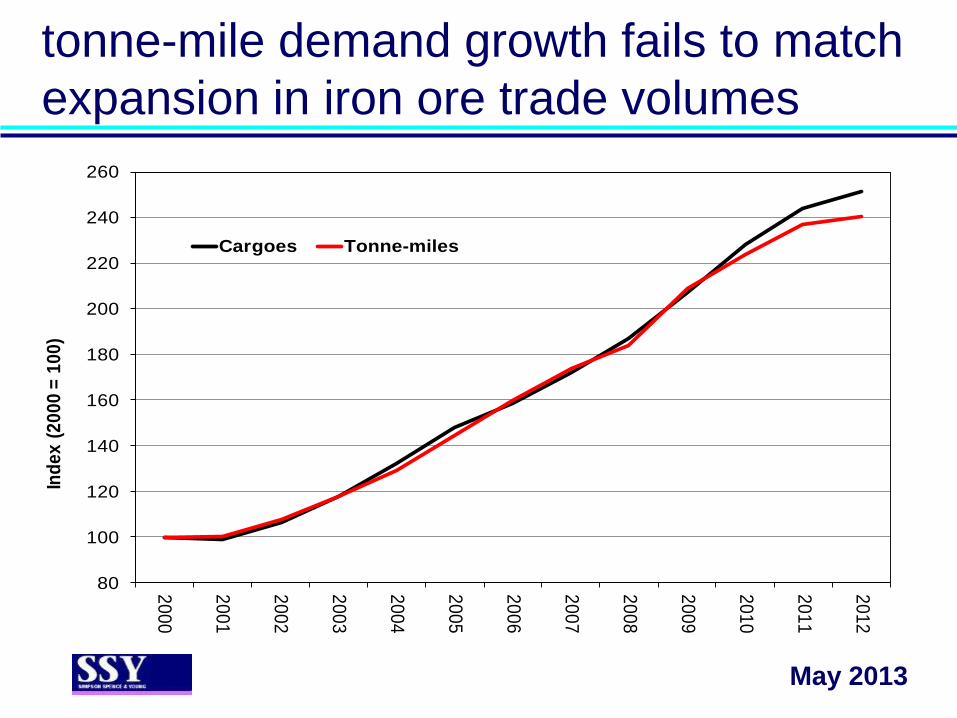
tonne-mile demand growth fails to match
expansion in iron ore trade volumes
May 2013
80
100
120
140
160
180
200
220
240
260
20
00
20
01
20
02
20
03
20
04
20
05
20
06
20
07
20
08
20
09
20
10
20
11
20
12
Ind
ex
(2
00
0 =
10
0)
Cargoes Tonne-miles

is fleet supply growth finally coming
under control?
• dry bulk carrier demolition set a new annual record of
34 Mdwt in 2012 and ship scrap prices remain at
relatively firm levels
• falling asset values are expanding the demolition pool
beyond 25+ years for Panamaxes, as well as Capes
• newbuilding orderbook has fallen to a 5 year low with
financing of new orders a constraining factor
• …but with shipbuilding prices at lowest since 2003 and
yards marketing eco-designs, more Capesize
newbuilding contracts are emerging
May 2013

capesize (100+ kdwt) fleet by year of build
May 2013
0
5
10
15
20
25
30
35
40
45
50
Pre
19
89
19
89
19
90
19
91
19
92
19
93
19
94
19
95
19
96
19
97
19
98
19
99
20
00
20
01
20
02
20
03
20
04
20
05
20
06
20
07
20
08
20
09
20
10
20
11
20
12
20
13
20
14
20
15
20
16
Md
wt
Pending/options
On Order
Existing
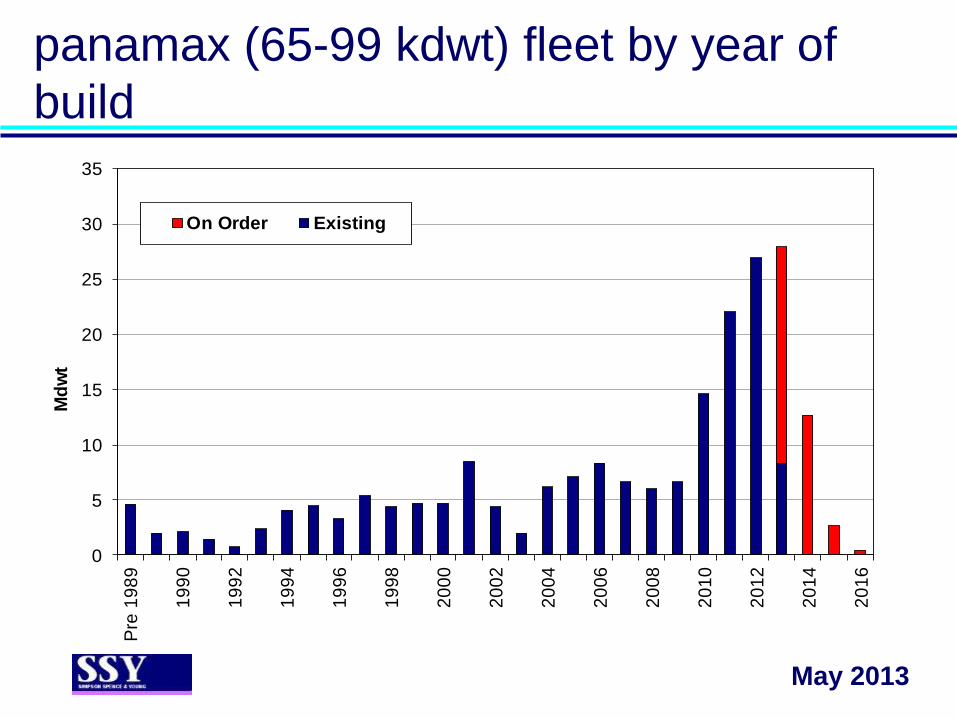
panamax (65-99 kdwt) fleet by year of
build
May 2013
0
5
10
15
20
25
30
35
Pre
19
89
19
90
19
92
19
94
19
96
19
98
20
00
20
02
20
04
20
06
20
08
20
10
20
12
20
14
20
16
Md
wt
On Order Existing

dry bulk carrier demolition
May 2013
0.0
0.5
1.0
1.5
2.0
2.5
3.0
3.5
4.0
4.5
5.0Ja
n-0
9
Ma
r-0
9
Ma
y-0
9
Ju
l-0
9
Se
p-0
9
No
v-0
9
Ja
n-1
0
Ma
r-1
0
Ma
y-1
0
Ju
l-1
0
Se
p-1
0
No
v-1
0
Ja
n-1
1
Ma
r-1
1
Ma
y-1
1
Ju
l-1
1
Se
p-1
1
No
v-1
1
Ja
n-1
2
Ma
r-1
2
Ma
y-1
2
Ju
l-1
2
Se
p-1
2
No
v-1
2
Ja
n-1
3
Ma
r-1
3
Millio
n D
wt
Monthly volume 3 month average

scrapping potential & tonnage on order
0.0
10.0
20.0
30.0
40.0
50.0
60.0
70.0
Handysize Handymax Panamax Capesize
MD
wt
On Order
25+ years
20+ years
15+years
May 2013
New size range changes:
Handymax=40-64,999dwt Panamax=65-99,999dwt
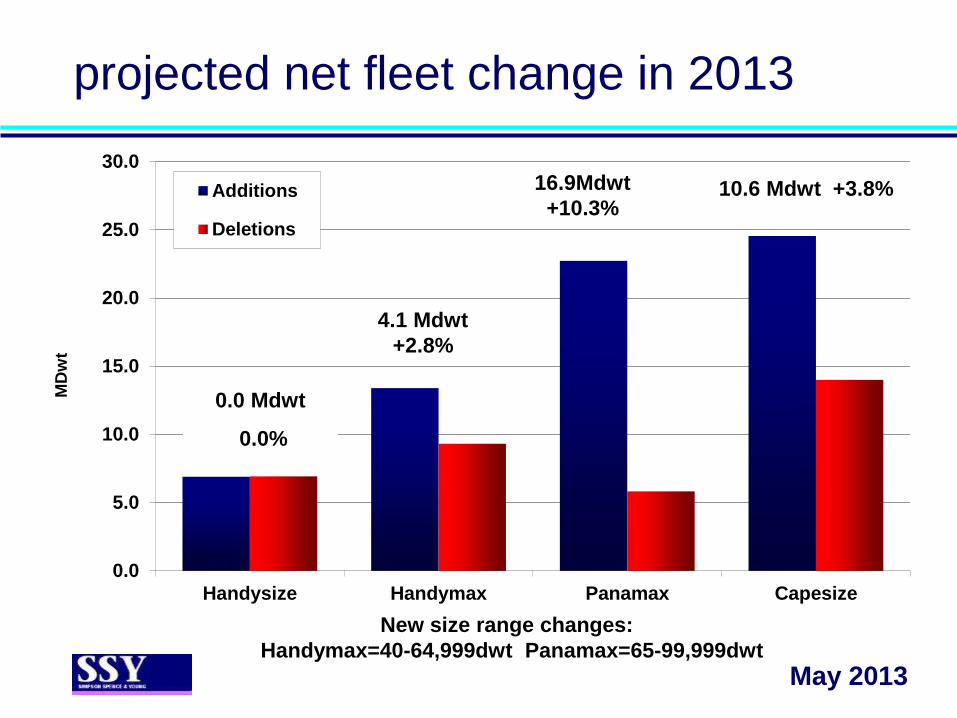
projected net fleet change in 2013
0.0
5.0
10.0
15.0
20.0
25.0
30.0
Handysize Handymax Panamax Capesize
MD
wt
Additions
Deletions
0.0 Mdwt
0.0%
4.1 Mdwt
+2.8%
10.6 Mdwt +3.8% 16.9Mdwt
+10.3%
May 2013
New size range changes:
Handymax=40-64,999dwt Panamax=65-99,999dwt
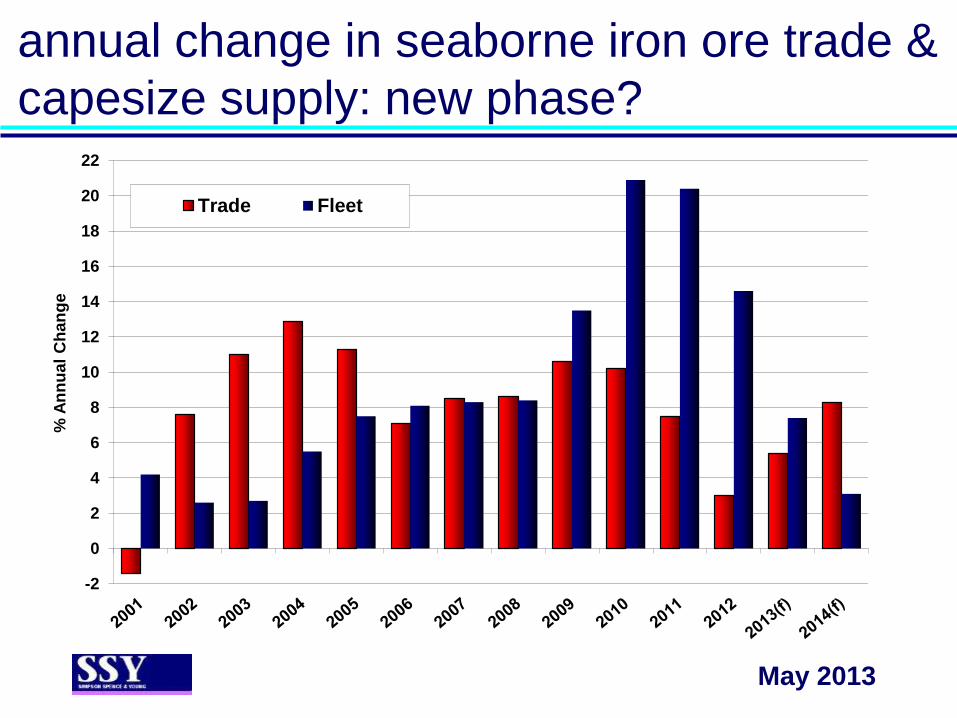
annual change in seaborne iron ore trade &
capesize supply: new phase?
-2
0
2
4
6
8
10
12
14
16
18
20
22
% A
nn
ua
l C
ha
ng
e
Trade Fleet
May 2013

conclusions
• by 4q13 rate of growth in seaborne iron ore trade set
to outpace increases in dry bulk fleet supply,
reversing trend of last 5 years
• prospect for divergence in relative rates of supply-
side growth to widen in 2014, adding to potential
freight rate volatility and raising freight’s share of
delivered iron ore prices
• but only if (1) record scrapping, (2) slower deliveries
and (3) sustained trade growth (requiring increased
cargo availability, as well as end-user demand)
May 2013

SSY LONDON TEL: +44 207 977 7404
SINGAPORE TEL: +65 6854 7122
email: [email protected]
web: ssyonline.com
May 2013