dhl global forwarding, freight ocean freight market update · dhl global forwarding, freight...
TRANSCRIPT

1
OCEAN FREIGHT MARKET UPDATE
DHL Global Forwarding, Freight
November 2017

2 2
Contents
DHL Global Forwarding | OFR Market Update | Nov 2017
TOPIC OF THE MONTH
Global GDP Growth vs. Container Throughput Growth: 1990-2020F
HIGH LEVEL DEVELOPMENT
MARKET OUTLOOK
Freight Rates and Volume Development
ECONOMIC OUTLOOK & DEMAND DEVELOPMENT
CAPACITY DEVELOPMENT
CARRIERS
§ REGULATIONS
? DID YOU KNOW ?
Evolution of CMA CGM Capacity, 1995-2017
3 3
Topic of the Month
Global GDP Growth vs. Container Throughput Growth: 1990-2020F
C O N T A I N E R T R A D E G R O W T H R E B O U N D S
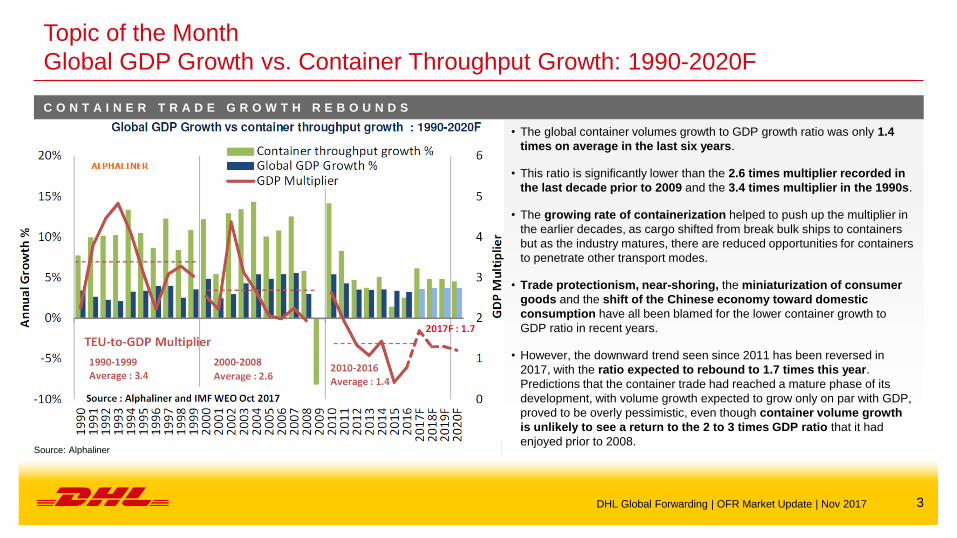
• The global container volumes growth to GDP growth ratio was only 1.4
times on average in the last six years.
• This ratio is significantly lower than the 2.6 times multiplier recorded in
the last decade prior to 2009 and the 3.4 times multiplier in the 1990s.
• The growing rate of containerization helped to push up the multiplier in
the earlier decades, as cargo shifted from break bulk ships to containers
but as the industry matures, there are reduced opportunities for containers
to penetrate other transport modes.
• Trade protectionism, near-shoring, the miniaturization of consumer
goods and the shift of the Chinese economy toward domestic
consumption have all been blamed for the lower container growth to
GDP ratio in recent years.
• However, the downward trend seen since 2011 has been reversed in
2017, with the ratio expected to rebound to 1.7 times this year.
Predictions that the container trade had reached a mature phase of its
development, with volume growth expected to grow only on par with GDP,
proved to be overly pessimistic, even though container volume growth
is unlikely to see a return to the 2 to 3 times GDP ratio that it had
enjoyed prior to 2008. Source: Alphaliner
DHL Global Forwarding | OFR Market Update | Nov 2017
4 4
High Level Market Development – Supply and Demand
1’200
0
1’000
600
800
400
200
Q3 Q4 Q1
16
Q3 Q1
15
Q2 Q2 Q1
17
Q2 Q3 Q4
2’000
1’500
1’000
500
0
2’500
Q2 Q2 Q3 Q4 Q1
17
Q1
15
Q3 Q2 Q3 Q1
16
Q4
0
200
600
800
400
Q1
17
Q2 Q4 Q2 Q3 Q1
15
Q3 Q4 Q1
16
Q3 Q2
BIX 380
BIX MGO
SHANGHAI
CONTAINERIZED
FREIGHT INDEX
(SCFI)3)
WORLD
CONTAINER
INDEX (WCI)2)
BUNKER
PRICE
INDEX 5)
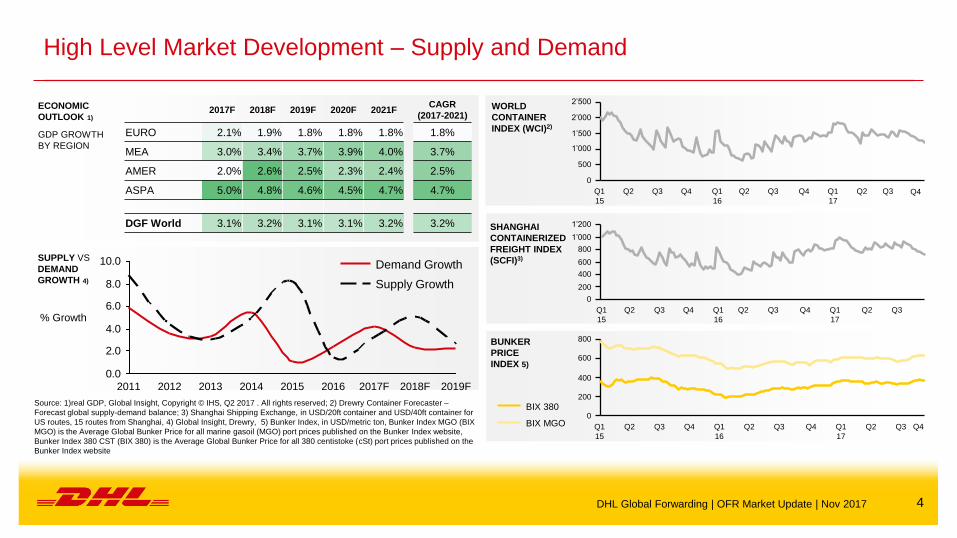
ECONOMIC
OUTLOOK 1)
GDP GROWTH
BY REGION
SUPPLY VS
DEMAND
GROWTH 4)
Source: 1)real GDP, Global Insight, Copyright © IHS, Q2 2017 . All rights reserved; 2) Drewry Container Forecaster –
Forecast global supply-demand balance; 3) Shanghai Shipping Exchange, in USD/20ft container and USD/40ft container for
US routes, 15 routes from Shanghai, 4) Global Insight, Drewry, 5) Bunker Index, in USD/metric ton, Bunker Index MGO (BIX
MGO) is the Average Global Bunker Price for all marine gasoil (MGO) port prices published on the Bunker Index website,
Bunker Index 380 CST (BIX 380) is the Average Global Bunker Price for all 380 centistoke (cSt) port prices published on the
Bunker Index website
0.0
2.0
4.0
6.0
8.0
10.0
2012 2013 2011 2014 2017F 2019F 2016 2015 2018F
% Growth
Demand Growth
Supply Growth
DHL Global Forwarding | OFR Market Update | Nov 2017
2017F 2018F 2019F 2020F 2021F CAGR
(2017-2021)
EURO 2.1% 1.9% 1.8% 1.8% 1.8% 1.8%
MEA 3.0% 3.4% 3.7% 3.9% 4.0% 3.7%
AMER 2.0% 2.6% 2.5% 2.3% 2.4% 2.5%
ASPA 5.0% 4.8% 4.6% 4.5% 4.7% 4.7%
DGF World 3.1% 3.2% 3.1% 3.1% 3.2% 3.2%
Q4
Q4

5 5
Market Outlook November 2017 – Major Trades
Market slightly picking up again after Chinese Golden Week
KEY Strong
Increase ++
Moderate
Increase +
No
Change =
Moderate
Decline -
Strong
Decline - -
EXPORT REGION IMPORT REGION CAPACITY RATE
EURO AMNO = =
AMLA - +
ASPA = =
MENAT = =
SSA = =
AMNO AMLA - +
ASPA = =
EURO = =
MENAT = =
SSA = =
EXPORT REGION IMPORT REGION CAPACITY RATE
AMLA AMNO - ++
ASPA - ++
EURO - +
MENAT - +
SSA = ++
ASPA ASPA - +
AMNO - +
AMLA = +
EURO = +
MENAT = =
OCEANIA = +
DHL Global Forwarding | OFR Market Update | Nov 2017
Source: DGF

6 6
Market Outlook August 2017 – Ocean Freight Rates Major Trades Market outlook on
smaller trades available
in the back-up
O C E A N F R E I G H T R A T E S O U T L O O K
ASPA – EURO High vessel utilization after the Golden week holiday due to the extensive blank sailing program and addition port omissions.
GRI announced for 1st November & additional blank sailings in wk46
EURO – ASPA & MEA rates are dropping for high volume spot cargo; no influence on tender pricing, which is still kept stable
ASPA – AMLA
MX & WCSA rates expected to increase on 1st Nov, to capitalize on final shipments to arrive AMLA destination in time for Christmas. For
ECSA, expecting 2 extra loaders in early Nov, proposed GRI may not be successful. Still, bookings must be placed 15 days before
vessel arrive at origin.
ASPA – AMNO Overall space continue to be tight due to blank sailings in October. Space situation expected to continue in Nov with THE all iance
already announcing their blank sailings in wk 46 & 47.
EURO – AMNO Rates are stable to USEC & GU, small increase to USWC. Vessels are well utilized and space can be a concern depending on Carrier,
Week and Loop. Early bookings is advised.
ASPA – MENAT
Rates have been reduced slightly and/or extended till End October except for Middle East. Tight vessel utilization after Golden Week,
(mainly due to blank sailing that Carriers have implemented). Carriers are trying to go for another round of GRI w.e.f 01 Nov.
Severe thunder storm has worsened the situation in Durban. This bad ailment has caused some damages at the terminal, vessels and
affecting ships operations. All vessels calling Durban are affected. At this moment, cargos are expected to suffer at least a week delay.
ASPA – ASPA Space is tight with the blank sailings during the China Golden Week period, especially to IPBC and expected to remain in the month of
November. Several carriers have announced a NOV GRI for IPBC.
AMNO – EURO Unchanged and stable
DHL Global Forwarding | OFR Market Update | Nov 2017
Source: DGF

7 7
Economic Outlook & Demand Development
F O R 1 S T T I M E S I N C E 2 0 1 1 , G D P G R O W I S I N L I N E W I T H P R E V I O U S Y E A R ’ S F O R E C A S T
EURO
2017 GDP growth has been upgraded by 0.3% to 2.1% as EURO economy has further strengthened, and its upside potential over the short
term has improved. Markedly improved labor markets, decent global demand, accommodative monetary policy, and elevated business and
consumer confidence support growth.
AMER 2017 AMNO GDP forecast was slightly down due to expected volatility of US economic activity over the next few quarters, induced by
Hurricane Harvey. Weaker doller, combined with stronger growth abroad, accounted for unexpected turnaround in export growth in US.
ASPA
Robust start into 2017 for most major AP economies with support from strong demand for electronics industry, recovering agricultural
production, higher commodity prices, and stronger-than-expected conumption activity led a slight forecast upgrade. Export forecasts strongly
revised down for KR & IN, leading to decline of the regional forecast.
EMERGING
MARKETS
Growth of BR economy was unbalanced in the beginning of 2017, as exports grew, but private consumption, investment, and government
spending declined. MX exports outlook was revised upwards.
DEMAND
DEVELOPMENT
Global Manufacturing PMI was at 75-month high in Aug. EURO PMI continuously pointed to strengthening industrial activity within the
disclosed period. In US the Manufacturing PMI signaled strong expansion and both Asian manufacturing PMI’s (Caixin and Nikkei) signaled
expansion in Aug. BR manufacturing PMI dipped in June but returned into expansion zone in Jul. Also MX PMI signaled improvement in Aug.
Source: Global Executive Summary, IHS Markit, Sep 2017. The Purchase Manager Index is an IHS proprietary metric that polls purchasing managers to understand if they are to order more or less in the future, hence giving a representative estimation
of the global business sentiment. Assessed monthly, a PMI at 50 is considered neutral, expanding above 50, and shows business shrinking below 50.
DHL Global Forwarding | OFR Market Update | Nov 2017

8 8
Capacity Development
Source: Alphaliner, carriers
C A P A C I T Y D E V E L O P M E N T
Zim will continue to offer its med-ECAS service through a slot arrangement on the new joint loop that Hapag-Lloyd and MSC are setting up in Oct. COSCO pursues
Europe-ECSA link through slots on new joint service of Maersk, Hamburg Süd and CMA CGM. The changes on this trade lane were triggered by the absorption of
Hamburg Süd by Maersk Line.
Weekly capacity on the Far East-West Africa route has increased by more than 35% since Jul, with the launch of 3 new services (Maersk ‘FEW7’, Maersk/CMA
CGM ‘FEW5/WAX2’, COSCO/GSL ‘WAX5/FA3’) and the upgrade of MSC’s African Express service.
Idle fleet edged upwards due to a lack of demand in the larger sizes from the effects of China’s ‘Golden Week’ holidays. Unlike in previous years when carriers
would have announced capacity withdrawals for the slack season starting in Oct, there have not been any announcements yet, regarding the main carrier’s winter
deployment plans while carriers keep battling for market share.
Chinese port volumes surged in Sep just ahead of Chinese National ‘Golden Week’ holidays, reflecting a strong peak season, although there were no reports of
space shortages as carriers deployed multiple extra loaders to cater for the additional demand.
Source: Alphaliner, carriers
DHL Global Forwarding | OFR Market Update | Nov 2017
9 9
Carriers
Source: Alphaliner, carriers
C A R R I E R S
Hapag-Lloyd has completed on 17 Oct its capital increase that was agreed upon as part of the merger of Hapag-Lloyd and UASC. The proceeds from a rights issue
offered to all shareholders on 28 Sep amounted to EUR 352m. The capital increase was backstopped by the four primary shareholders CSAV Germany Container
Holding GmbH, Kuehne Martime GmbH, Qatar Holding Germany GmbH and The Public Investment Fund of the Kingdom of Saudi Arabia who acquired all the
remaining unsubscribed shares.
Yang Ming to raise USD 197m from the issue of 500m new shares. 80% of the new shares that are to be issued are reserved for existing shareholders while 10% is
reserved for employees, leaving 10% of the shares open to the public. The new capital increase follows its first round of capital increase in Feb 17 which raised USD
55. The carrier had earlier planned to complete the 2nd stage of its recapitalization program in Jun 17 but the plan was delayed due to weak market conditions. The
Taiwan government is expected to contribute the main portion of the cash to be raised. The share price fell by 28% from its recent peak.
The two state-owned shipping groups China COSCO Shipping and China Merchant Shipping intend to dispose of their equity shares in Shanghai Jin Jiang
Shippings (SJJ), a Chinese regional carrier offering short sea container services in East Asia. The current majority shareholder of SJJ is Shanghai International Port
Group (SIPG), which holds a 79.2% equity share.
APL has announced the launch of its enhanced ‘Eagle Guaranteed’ program to cater for priority shipments on the eastbound transpacific from 1 Nov ’17. The
program consists of 3 separate products:
• Eagle GO (EGO), where the EGO surcharge paid by the shipper will be refunded if shipment not loaded on specified vessel
• Eagle GET (EGT) guarantees the discharge of containers within 12 hrs of vessel cargo operation for a flat EGT surcharge
• Eagle REACH (ERC) provides a day definite rail delivery to reach 6 inland destinations in the US
HMM has announced on 13 Oct a rights issue to raise KRW 693.6bn (USD 614m) from its existing shareholders. The company will issue 120m new shares and
plans to use KRW 293.6bn from the expected proceeds for working capital and KRW 400bn to invest in new ships & terminals. Korea Development Bank (KDB),
which currently holds a 13.1% in HMM, is expected to fund most of the capital increase. The share price has tumbled by 15% since the announcement.
Source: Alphaliner, carriers
DHL Global Forwarding | OFR Market Update | Nov 2017

10 10
Regulations
Source: Alphaliner, carriers
R E G U L A T I O N S
The newly introduced Thailand customs ACT B.E.2560 will replace the Customs ACT B.E.2469 on cargoes with departure and arrival from 13 Nov ’17 onwards.
Section: 211: all cases of packages containing goods shall bear marks and numbers and such marks and numbers shall be shown on all documents and the
cargoes. If an importer or exporter refuses or neglects to comply with the aforesaid requirements, such person/company shall be liable to a fine not exceeding
50’000 baht.
The shipping marks must be shown on all documents related to the shipment. This includes:
• HBL
• Commercial Packing list
• The cargo itself.
Note: “Blank” or “no mark” is no longer acceptable by the customs.
According to a survey from ExxonMobil, shipping lines are unprepared for the 2020 deadline for ships to burn low-sulphur fuel. In 2016 the International Maritime
Organization (IMO) promised to have greenhouse gas emissions regulations in place from 2020 onwards when a 0.5% sulphur cap on marine fuel consumption will
come into effect.
Source: DHL, Ti
DHL Global Forwarding | OFR Market Update | Nov 2017
11 11
Did You Know ? Evolution of CMA CGM Capacity, 1995-2017
Source: Alphaliner
A C Q U I S I T I O N S A N D S P E C T A C U L A R G R O W T H
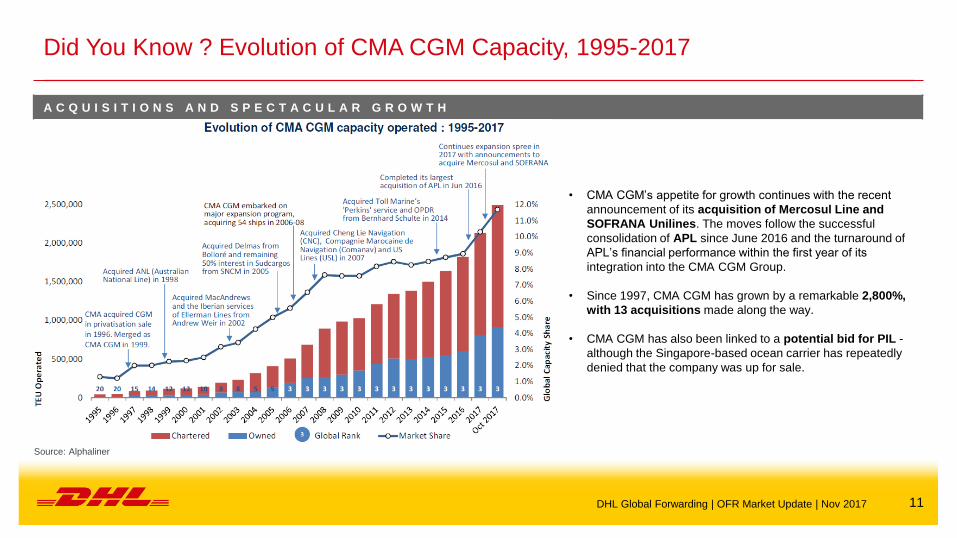
• CMA CGM’s appetite for growth continues with the recent
announcement of its acquisition of Mercosul Line and
SOFRANA Unilines. The moves follow the successful
consolidation of APL since June 2016 and the turnaround of
APL’s financial performance within the first year of its
integration into the CMA CGM Group.
• Since 1997, CMA CGM has grown by a remarkable 2,800%,
with 13 acquisitions made along the way.
• CMA CGM has also been linked to a potential bid for PIL -
although the Singapore-based ocean carrier has repeatedly
denied that the company was up for sale.
DHL Global Forwarding | OFR Market Update | Nov 2017

12 12 B A C K - U P

13 13
Source: DGF
Market Outlook November 2017 – Ocean Freight Rates Additional Trades (1/2)
Ocean Freight Rates Outlook
EURO – AMLA next step of rate increases to SAEC materialized for November. It´s a more slight increase as expected, as carriers are still cautious and are
still monitoring capacity and utilization carefully.
EURO – SSA unchanged stable, well utilized vessels. Space to South Africa will become tight during the next weeks due to upcoming Christmas / Summer
Holidays in South Africa.
AMNO – MENAT
No change in the current market situation. Space is still tight from USEC & USGC Ports.
1 or 2 weeks out from USEC and 2-3 weeks from USGC.. It appears that current rates will stay the same until
end of this year or might even drop few dollars from USEC to main ports in MEA such as Jebel Ali/Jeddah in November
AMNO – SSA
Space is available to all destinations in South & West Africa.
E. Africa is tighter due to routing via congested transshipment ports.
APL & CMA applied GRIs to most African destinations
AMNO – AMLA
Rate trending upward all US to WCSA and selected ECSA destinations.
Rate trending upward Gulf to all AMLA
Capacity reduced slightly w/CMA cancelling Gulf to CL on Brasex
AMLA Exports
Rates from SAEC continue to rise as fruit season begins and capacity is cut to EURO
Bookings are being made 4-6 weeks out(SAEC)
Space issues continue on WCSA
Numerous GRI’s being announced
Source: DGF team
Source: DGF team
Source: DGF team
DHL Global Forwarding | OFR Market Update | Nov 2017
14 14
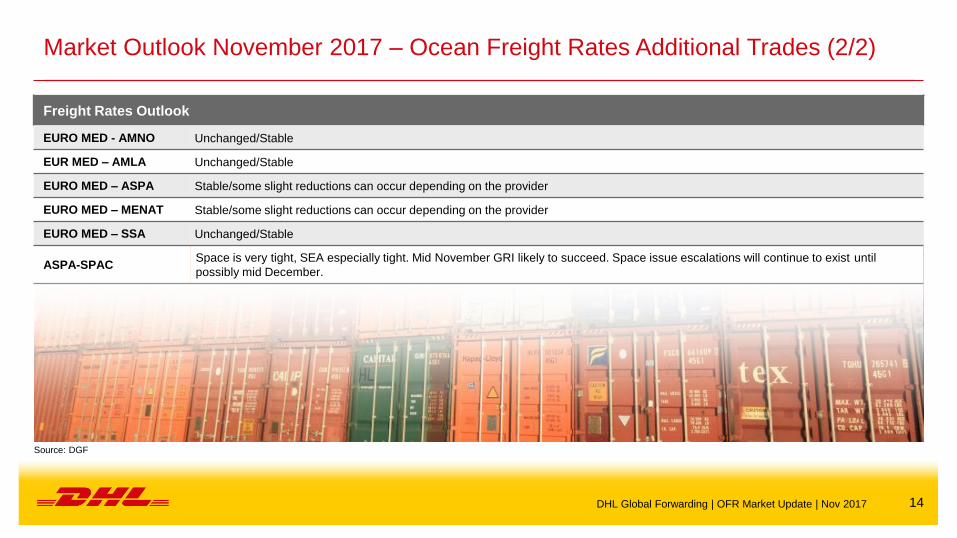
Market Outlook November 2017 – Ocean Freight Rates Additional Trades (2/2)
Freight Rates Outlook
EURO MED - AMNO Unchanged/Stable
EUR MED – AMLA Unchanged/Stable
EURO MED – ASPA Stable/some slight reductions can occur depending on the provider
EURO MED – MENAT Stable/some slight reductions can occur depending on the provider
EURO MED – SSA Unchanged/Stable
ASPA-SPAC Space is very tight, SEA especially tight. Mid November GRI likely to succeed. Space issue escalations will continue to exist until
possibly mid December.
DHL Global Forwarding | OFR Market Update | Nov 2017
Source: DGF
15 15
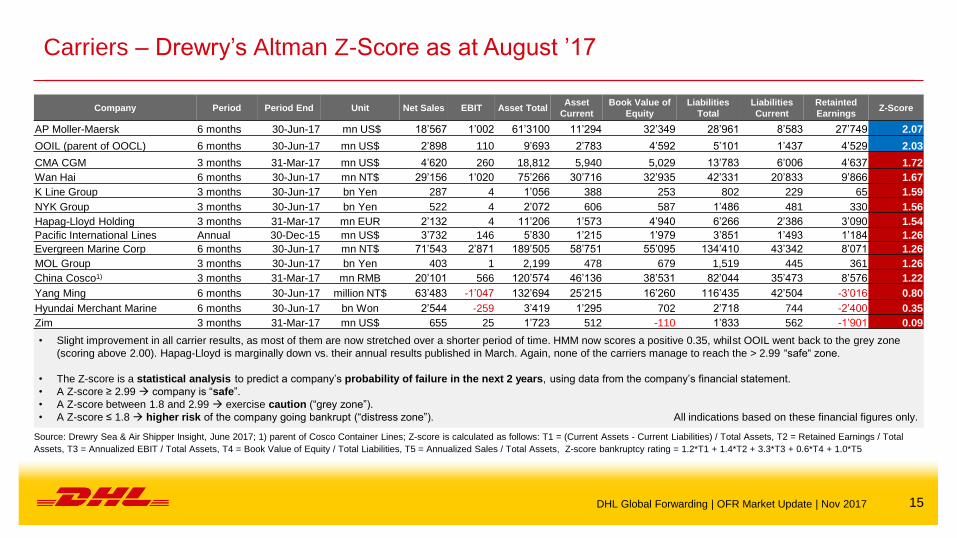
Carriers – Drewry’s Altman Z-Score as at August ’17
Company Period Period End Unit Net Sales EBIT Asset Total Asset
Current
Book Value of
Equity
Liabilities
Total
Liabilities
Current
Retainted
Earnings Z-Score
AP Moller-Maersk 6 months 30-Jun-17 mn US$ 18’567 1’002 61’3100 11’294 32’349 28’961 8’583 27’749 2.07
OOIL (parent of OOCL) 6 months 30-Jun-17 mn US$ 2’898 110 9’693 2’783 4’592 5’101 1’437 4’529 2.03
CMA CGM 3 months 31-Mar-17 mn US$ 4’620 260 18,812 5,940 5,029 13’783 6’006 4’637 1.72
Wan Hai 6 months 30-Jun-17 mn NT$ 29’156 1’020 75’266 30’716 32’935 42’331 20’833 9’866 1.67
K Line Group 3 months 30-Jun-17 bn Yen 287 4 1’056 388 253 802 229 65 1.59
NYK Group 3 months 30-Jun-17 bn Yen 522 4 2’072 606 587 1’486 481 330 1.56
Hapag-Lloyd Holding 3 months 31-Mar-17 mn EUR 2’132 4 11’206 1’573 4’940 6’266 2’386 3’090 1.54
Pacific International Lines Annual 30-Dec-15 mn US$ 3’732 146 5’830 1’215 1’979 3’851 1’493 1’184 1.26
Evergreen Marine Corp 6 months 30-Jun-17 mn NT$ 71’543 2’871 189’505 58’751 55’095 134’410 43’342 8’071 1.26
MOL Group 3 months 30-Jun-17 bn Yen 403 1 2,199 478 679 1,519 445 361 1.26
China Cosco1) 3 months 31-Mar-17 mn RMB 20’101 566 120’574 46’136 38’531 82’044 35’473 8’576 1.22
Yang Ming 6 months 30-Jun-17 million NT$ 63’483 -1’047 132’694 25’215 16’260 116’435 42’504 -3’016 0.80
Hyundai Merchant Marine 6 months 30-Jun-17 bn Won 2’544 -259 3’419 1’295 702 2’718 744 -2’400 0.35
Zim 3 months 31-Mar-17 mn US$ 655 25 1’723 512 -110 1’833 562 -1’901 0.09
• Slight improvement in all carrier results, as most of them are now stretched over a shorter period of time. HMM now scores a positive 0.35, whilst OOIL went back to the grey zone
(scoring above 2.00). Hapag-Lloyd is marginally down vs. their annual results published in March. Again, none of the carriers manage to reach the > 2.99 “safe“ zone.
• The Z-score is a statistical analysis to predict a company’s probability of failure in the next 2 years, using data from the company’s financial statement.
• A Z-score ≥ 2.99 company is “safe”.
• A Z-score between 1.8 and 2.99 exercise caution (“grey zone”).
• A Z-score ≤ 1.8 higher risk of the company going bankrupt (“distress zone”). All indications based on these financial figures only.
Source: Drewry Sea & Air Shipper Insight, June 2017; 1) parent of Cosco Container Lines; Z-score is calculated as follows: T1 = (Current Assets - Current Liabilities) / Total Assets, T2 = Retained Earnings / Total
Assets, T3 = Annualized EBIT / Total Assets, T4 = Book Value of Equity / Total Liabilities, T5 = Annualized Sales / Total Assets, Z-score bankruptcy rating = 1.2*T1 + 1.4*T2 + 3.3*T3 + 0.6*T4 + 1.0*T5
DHL Global Forwarding | OFR Market Update | Nov 2017

16 16
Market Outlook – Volume Outlook in Main Trade Lanes, 2017 Estimate & Growth
Forecast 2017/20 in %
N O R T H
A M E R I C A I n c l .
M E X I C O
3.5 mTEU +1.2%
1.7 mTEU +0.9%
1.7 mTEU +1.3%
0.2 mTEU +3.0%
N O R T H
A M E R I C A I n c l .
M E X I C O
L A T I N
A M E R I C A
E U R O P E
I n c l . M E D
11.9 mTEU +1.6%
7.0 mTEU +0.9%
7.6 mTEU +0.7%
15.8 mTEU +0.9%
7.0 mTEU +0.9%
4.5 mTEU +2.8%
2017e, in mTEU 2017e-2021e CAGR, in %
F A R E A S T
I N T R A A S I A
excl. Oceania
35.1 mTEU +3.1%
3.5 mTEU
+1.3%
2.0 mTEU
+0.7%
L A T I N
A M E R I C A
G L O B A L C O N T A I N E R T R A D E 2 0 1 7 e 1 3 8 . 5 m T E U + 2 . 3 % C A G R 2 0 1 7 e - 2 0 2 0 e
Mid-term growth is mainly driven by Asian tradelanes.
Source: Drewry
DHL Global Forwarding | OFR Market Update | Nov 2017
17 17
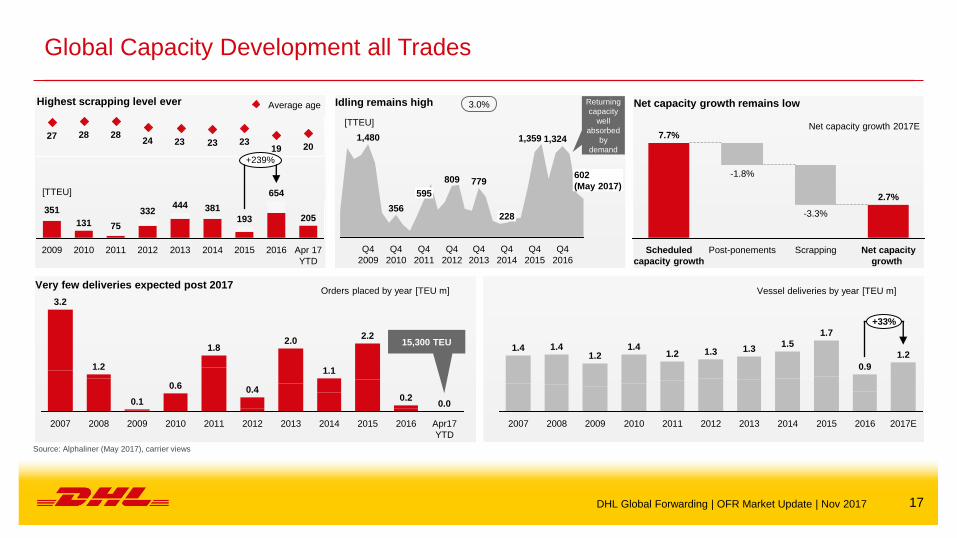
Global Capacity Development all Trades
20 19 23 23 23 24
28 28 27
Highest scrapping level ever Idling remains high
[TTEU]
602
(May 2017)
1,324
Q4
2016
Q4
2015
1,359
Q4
2014
228
Q4
2013
779
Q4
2012
809
Q4
2011
595
Q4
2010
356
Q4
2009
1,480
Returning
capacity
well
absorbed
by
demand
3.0%
[TTEU]
381
2013
444
2012
332
2011
75
2010
131
2009
351
+239%
Apr 17
YTD
205
2016
654
2015
193
2014
Average age Net capacity growth remains low
Net capacity growth 2017E
Scrapping Net capacity
growth
2.7%
-3.3%
-1.8%
Scheduled
capacity growth
Post-ponements
7.7%
Orders placed by year [TEU m] Vessel deliveries by year [TEU m]
0.2
2015
0.0
2016
2.2
2014
1.1
2013
2.0
2012
0.4
2011
1.8
2010
0.6
2009
0.1
2008
1.2
2007
3.2
Apr17
YTD
+33%
1.2
2017E 2016
0.9
2015
1.7
2014
1.5
2013
1.3
2012
1.3
2011
1.2
2010
1.4
2009
1.2
2008
1.4
2007
1.4 15,300 TEU
Very few deliveries expected post 2017
Source: Alphaliner (May 2017), carrier views
DHL Global Forwarding | OFR Market Update | Nov 2017

18 18
Carrier Mergers, Acquisitions and Alliances
M E R G E R S A N D A Q U I S I T I O N S
China
Shipping Cosco
OOCL TBC
Evergreen APL CMA
CGM Hapag
Lloyd
United
Arab
Shipping
Hyundai
Merchant
Marine
Hamburg
Süd Maersk
Line MSC K Line MOL NYK
Yang
Ming Hanjin
Shipping
CHINA COSCO SHIPPING EVER
GREEN CMA CGM HAPAG-LLOYD/UASC
HYUNDAI
MERCHANT
MARINE MAERSK LINE MSC
OCEAN NETWORK
EXPRESS (ONE) YANG
MING Bankrupt
A L L I A N C E S
F O R M E R A L L I A N C E S P R E S E N T A L L I A N C E S
2M MAERSK LINE
MSC OCEAN 3
CMA CGM
CHINA SHIPPING
UNITED ARAB
SHIPPING COMPANY
2M
MAERSK LINE
MSC
HMM (strategic
cooperation)
OCEAN
ALLIANCE
OOCL
CMA CGM
CHINA COSCO SHIPPING
EVERGREEN
G6
HAPAG-LLOYD
MOL
NYK
APL
HYUNDAI
MERCHANT
MARINE
OOCL
CKYHE
COSCO
EVERGREEN
HANJIN
SHPPING
K-LINE
YANG MING THE ALLIANCE
HAPAG-LLOYD/UASC
ONE
YANG MING
Source: Carriers
DHL Global Forwarding | OFR Market Update | Nov 2017

19
Acronyms and Explanations
2M - Carrier Alliance: Maersk / MSC OCRS - Operational Cost Recovery surcharge
AMLA - Latin America OWS - Overweight Surcharge
AMNO - North America PH - Philippines
AR - Argentina PNW - Pacific North West
ASPA - AsiaPacific Ppt. - Percentage points
BR - Brazil PSW - Pacific South West
CAGR - Compound Annual Growth Rate RR(I) - Rate Restoration
CENAC - Central Amercia and Caribbean SAEC - South America East Coast
CKYHE - Carrier Alliance: Cosco, K-Line, YangMing, Hanjin and Evergreen SAWC - South America West Coast
CNC - CNC Line (Cheng Lie Navigation Co. Ltd.) SOLAS - Safety of Life at Sea
DG - Dangerous Goods SPRC - South People’s Republic of China – South China
DWT - Dead Weight Tonnage SSA - Sub-Saharan Africa
EB - Eastbound SSL - Steam Ship Line
ECSA - East Coast South America T - Thousands
EURO - Europe TEU - Twenty foot equivalent unit (20‘ container)
FMC - US Federal Marine Commission TP - Trans Pacific
G6 - Carrier Alliance: APL, Hapag Lloyd, Hyundai, MOL, NYK and OOCL TSA - Trans Pacific Stabilization Agreement
GRI - General Rate Increase ULCS - Ultra Large Container Ship
HJS - Hanjin Shipping USGC - US Gulf Coast
HMM - Hyundai US FMC - US Federal Maritime Commission
HSUD - Hamburg Süd USEC - US East Coast
HWS - Heavy Weight Surcharge USWC - US West Coast
IA - Intra Asia VGM - Verified Gross Mass
IPBC - India Pakistan Bangladesh Colombo VLCS - Very Large Container Ship
IPI - Inland Point Intermodal VSA - Vessel Sharing Agreement
ISC - Indian Sub Continent WB - Westbound
MENAT - Middle East and North Africa WCSA - West Coast South America
mn - Millions YML - Yang Ming Line
MoM - Month-on-Month YoY - Year-on-Year
NOO - Non-operating (vessel) owners YTD - Year-to-Date
Ocean 3 - Carrier Alliance: CMA, UASC, China Shipping
DHL Global Forwarding | OFR Market Update | Nov 2017