development of a thermoelectric battery-charger with ...edge.rit.edu/edge/p11462/public/battery...
TRANSCRIPT

Development of a thermoelectric battery-chargerwith microcontroller-based maximum power
point tracking technique
Jensak Eakburanawat a, Itsda Boonyaroonate b
a Division of Energy Technology, School of Energy and Materials,
Faculty of Engineering, King Mongkut�s University of Technology Thonburi,
Bangmod, Tungkru, Bangkok, Thailandb Department of Electrical Engineering, Faculty of Engineering,
King Mongkut�s University of Technology Thonburi,
Bangmod, Tungkru, Bangkok, Thailand
Abstract
This article describes a battery charger, which is powered by thermoelectric (TE) power modules.This system uses TE devices that directly convert heat energy to electricity to charge a battery. Thecharacteristics of the TE module were tested at different temperatures. A SEPIC dc–dc converter wasapplied and controlled by a microcontroller with the maximum power point tracking (MPPT) fea-ture. The proposed system has a maximum charging power of 7.99 W: that is better than directcharging by approximately 15%. The objectives are to study the principle of TE power generationand to design and develop a TE battery charger that uses waste heat or another heat source asthe direct input power.
Keywords: Thermoelectric generator; dc–dc converter; SEPIC; MPPT

Nomenclature
A cross-sectional area of thermoelement (mm)2
D % duty cycle of gate signalIL load current (A)L length of the thermoelement (mm)LC thickness of the contact layer (mm)M conversion ratioN number of thermoelements per modulen electrical-contact parameterPo power output (W)r thermal-contact parameterRint internal resistance of TE generator (X)RL load resistance (X)ri input resistance at the maximum power point (X)Tc cold-side temperature of module (�C)Th hot-side temperature of module (�C)Vi input voltage of converter (V)Vo output voltage of converter (V)vi input voltage at the maximum power point (V)Voc open-circuit voltage of TE generator (V)
Greek symbols
a thermoelectric material Seebeck coefficient (V/K)DT temperature difference (�C)k thermal conductivity of thermoelementkc thermal conductivity of contact layerq electrical resistivityqc contact resistivity between thermoelements and copper contactsr material electric conductivity (X�1 cm�1)
Abbreviation
CCM continuous-current modeMPPT maximum power point trackingSEPIC single-ended primary inductance converterPWM pulse width modulation
1. Introduction
Currently in Thailand, the electrical-power demand is increasing which prompts thegovernment to build new power plants. Electrical energy is important for modern day liv-ing. However, some areas in Thailand do not have electricity and the residents desire someof the advantages and conveniences that electricity provides. Nowadays, the electricalpower in remote areas is generated primarily by gasoline motor-generators. But, most peo-ple believe these generators are too noisy, require too much maintenance, and have highfuel costs [6].

Renewable energy, such as solar energy, wind energy or hydropower is preferred, but ithas limited use and is dependent on weather and topography. Thermoelectrics can convertheat energy to electrical power directly. Thermoelectric power generation has the advan-tages of being maintenance free, silent in operation and involving no moving or complexparts.
In the past years, much work has been reported on the TE power generator. Killander[1] developed a stove-top generator using two TE power modules, model HZ-20. Duringthe operating time, the output of the generator was about 10 W and supplied the batterywith a net input from 1 to 5 W. Rahman [2] developed the thermoelectric generator to sup-ply portable electronic equipment or to charge a lap-top computer battery. The generatoris powered from butane gas; it has a potential power output of about 13.5 W. Roth et al.[3] developed and tested a photovoltaic/thermoelectric hybrid system as a power supplyfor a mobile telephone repeater. The developed system supplies enough for 50 W perma-nent loads. All of the above research uses the converter to boost-up the output voltage tocharge the battery but do not use the maximum power point tracking control in thesystem.
2. Thermoelectric power generator
2.1. Theory of thermoelectric power generator
The TE effect was first discovered in 1822 by Seebeck, who observed an electric flowwhen one junction of two dissimilar metals, jointed at two places, was heated while theother junction was kept at a lower temperature [4]. A typical multicouple thermoelectricpower module is shown schematically in Fig. 1: n-type and p-type semiconductor thermo-elements are connected in series by highly-conducting metal strips to form a thermocouple.Based upon an improved theoretical model which takes into account the thermal and elec-trical contact resistance, the output voltage VO, current IO and power PO when the moduleis operated with a matched load, are given by [5]:
Fig. 1. Schematic of a single thermoelectric-couple.

V O ¼aNðT h � T cÞ1þ 2rLC=L
; ð1Þ
IO ¼aAðT h � T cÞ
2qðLþ nÞð1þ 2rLC=LÞ ; ð2Þ
P O ¼a2
2q� NA
ðLþ nÞð1þ 2rLC=LÞ2� ðT h � T cÞ2; ð3Þ
where n = 2qC/q, r = k/kC, a is the TE material Seebeck coefficient (V/K), q is electricalresistivity (X cm), qC is electrical contact resistivity, N is the number of the thermoele-ment in the module, A is the cross-sectional area of the thermoelements (mm)2, L isthe length of the thermoelement (mm), Lc is the thickness of the contact layer (mm),Th is the temperature at the hot side, Tc is the temperature at the cold side, k is the ther-mal conductivity of the thermoelement and kC is the thermal conductivity of the contactlayer.
2.2. Thermoelectric module characteristics
TE power modules from Taihuaxing Co. Ltd. are used in the experiment. The specifi-cations of the module are as follows.
� Part number TEP1-1264-1.5.� Size: 40 mm · 40 mm.� Open circuit voltage: 8.6 V.� Internal resistance: 3 X.� Match load output-voltage: 4.2 V.� Match load output-current: 1.4 A.� Match load output-power: 5.9 W.� Heat flux across the module: about 140 W.� Heat flux density: about 8.8 W/cm2.
2.3. Finding the electrical characteristics of TEP1-1264-1.5
In this research, we designed and built the TE power generator (see Fig. 2). The electricheater is used as a heat source to supply heat energy to the hot side of TE modules. A heatsink was mounted on the cold side of the TE modules to maintain a constant temperature.The electrical characteristics of TEP1-1264-1.5 were tested by setting the hot-side temper-ature at 100, 125, 150, or 175 �C, and maintaining the cold-side temperature at 40 �C. Arheostat was connected to the thermoelectric modules as a load, and the resistance set at 1,2, 3, . . ., or 10 X and the voltage and the current measured in each step. The voltage, cur-rent and power which 1 TE module can produce for each degree of temperature is shownin Figs. 3–5.
The variation of the output V–I characteristics of a TE module as a function of temper-ature differential (DT) between the hot side and cold side of the TE module is shown inFig. 6. The DT changes affect mainly the TE output power.

Fig. 2. The detail structure of a TE generator.
Fig. 3. Output voltage of single TE module (TEP1-1264-1.5) compared with load resistance at 40 �C cold-sidetemperature.
3. Converter and controller
3.1. Basic operation principle of the SEPIC converter
The SEPIC converter is a non-inverting dc–dc converter and can generate voltageseither above or below the input. The input current is non-pulsating, but the output current

Fig. 4. Output current of single TE module (TEP1-1264-1.5) compared with load resistance at 40 �C cold-sidetemperature.
Fig. 5. Output power of single TE module (TEP1-1264-1.5) compared with load resistance at 40 �C cold-sidetemperature.
is pulsating. The name SEPIC is an acronym for single-ended primary inductance con-verter. A typical circuit diagram is shown in Fig. 7. This circuit has three dynamic energystorage elements, L1, L2 and C1. The ratio of the output voltage to the input voltage andthe duty cycle are defined as:
M ¼ V O
V i
; ð4Þ
D ¼ tON
T. ð5Þ
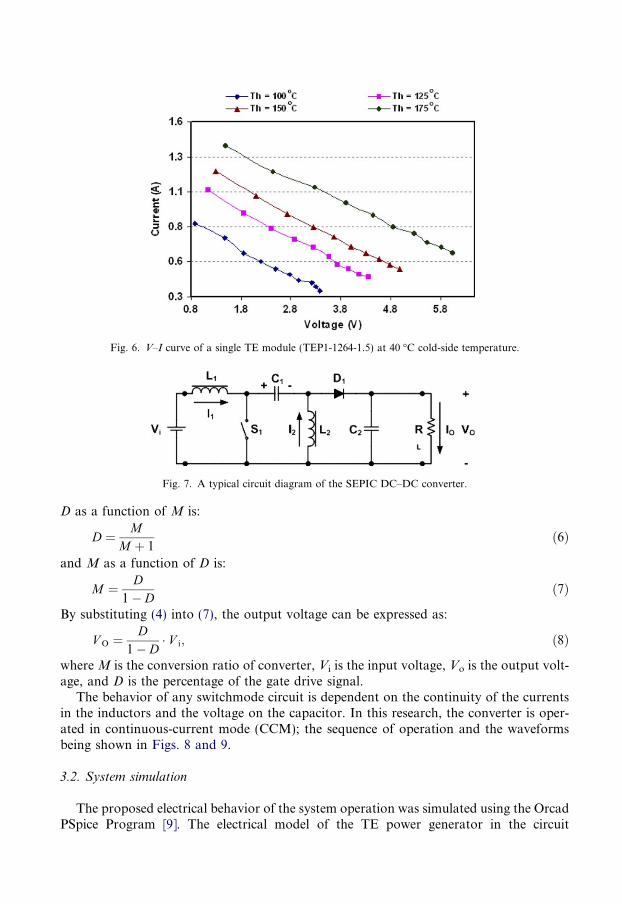
Fig. 6. V–I curve of a single TE module (TEP1-1264-1.5) at 40 �C cold-side temperature.
Fig. 7. A typical circuit diagram of the SEPIC DC–DC converter.
D as a function of M is:
D ¼ MM þ 1
ð6Þ
and M as a function of D is:
M ¼ D1� D
ð7Þ
By substituting (4) into (7), the output voltage can be expressed as:
V O ¼D
1� D� V i; ð8Þ
where M is the conversion ratio of converter, Vi is the input voltage, Vo is the output volt-age, and D is the percentage of the gate drive signal.
The behavior of any switchmode circuit is dependent on the continuity of the currentsin the inductors and the voltage on the capacitor. In this research, the converter is oper-ated in continuous-current mode (CCM); the sequence of operation and the waveformsbeing shown in Figs. 8 and 9.
3.2. System simulation
The proposed electrical behavior of the system operation was simulated using the OrcadPSpice Program [9]. The electrical model of the TE power generator in the circuit
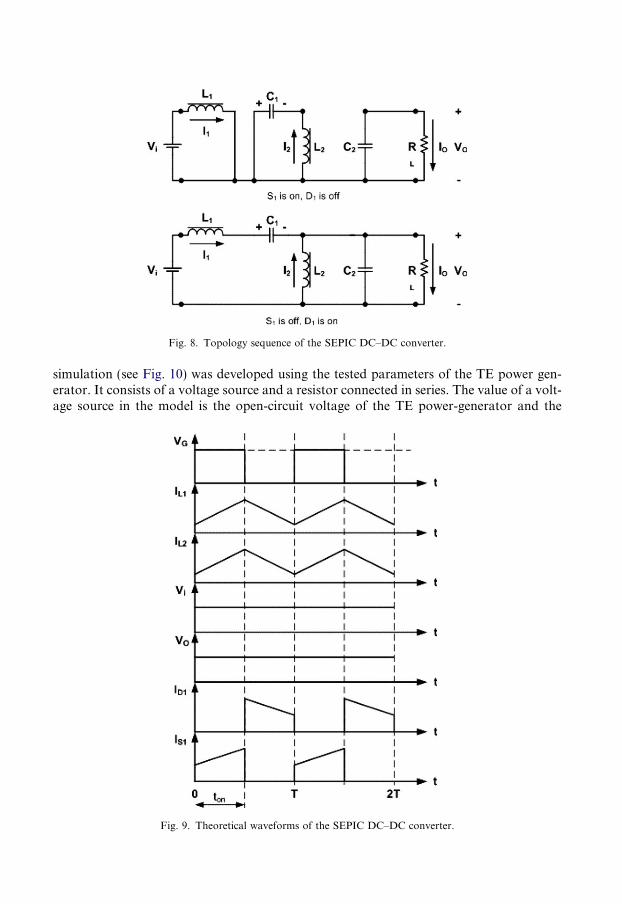
Fig. 8. Topology sequence of the SEPIC DC–DC converter.
simulation (see Fig. 10) was developed using the tested parameters of the TE power gen-erator. It consists of a voltage source and a resistor connected in series. The value of a volt-age source in the model is the open-circuit voltage of the TE power-generator and the
Fig. 9. Theoretical waveforms of the SEPIC DC–DC converter.

value of the resistor is the internal resistance of the TE power-generator. From Fig. 11, theprocedure for testing is connecting 6 TE modules in series, input heat energy to the hotside of TE module, measuring the open-circuit voltage (VNL), switching-on the S1 to con-nect the RL in the circuit and measuring the load current (IL). Then, the internal resistanceof the TE power-generator is calculated by:
V oc ¼ IL � Rint þ RLð Þ; ð9Þ
Rint ¼V oc
IL
� RL; ð10Þ
where Voc is the open-circuit voltage, IL is the load current, RL is the load resistance andRint is the internal resistance (see Fig. 12).
From the test results of the TE power generator internal-resistance in Table 1, 17.8 Xinternal resistance and the 27.8 V open-circuit voltage were chosen for the electrical modelof TE power generator. The simulation was at 18 kHz, 35% duty cycle of gate signal andthe load was a 6 V battery with 0.1 X internal resistance (see Fig. 10). The simulation re-sults for the input voltage, the input current, the output voltage and the output current ofthe dc–dc converter are shown in Fig. 13. The output power of the dc–dc converter thatcharges the battery was about 9 W.
3.3. Maximum power point tracking [6–9]
The TE battery-charger system was implemented by using the parameters from the sim-ulated circuit. The maximum power point was changed as the temperature varies (see
Fig. 10. The circuit diagram of the TE battery charger system for simulation.
Fig. 11. The circuit diagram of the internal-resistance testing method.

Table 1Testing results for the TE power generator internal-resistance
Module hot-sidetemperature (Th), �C
Open-circuitvoltage (Voc), V
Load current (IL), A Internal resistance (Rint), X
90 13.00 0.55 13.63100 14.20 0.60 13.67110 16.50 0.70 13.57120 18.00 0.75 14.00130 19.80 0.80 14.75140 21.20 0.85 14.94150 23.20 0.90 15.78160 24.90 0.95 16.21170 26.00 0.98 16.53180 27.80 1.00 17.80
RL = 10 X; the module cold side temperature = 40 �C.
Fig. 12. The internal-resistance of the TE power generator.
Fig. 13. The simulation results of the TE battery charger system.
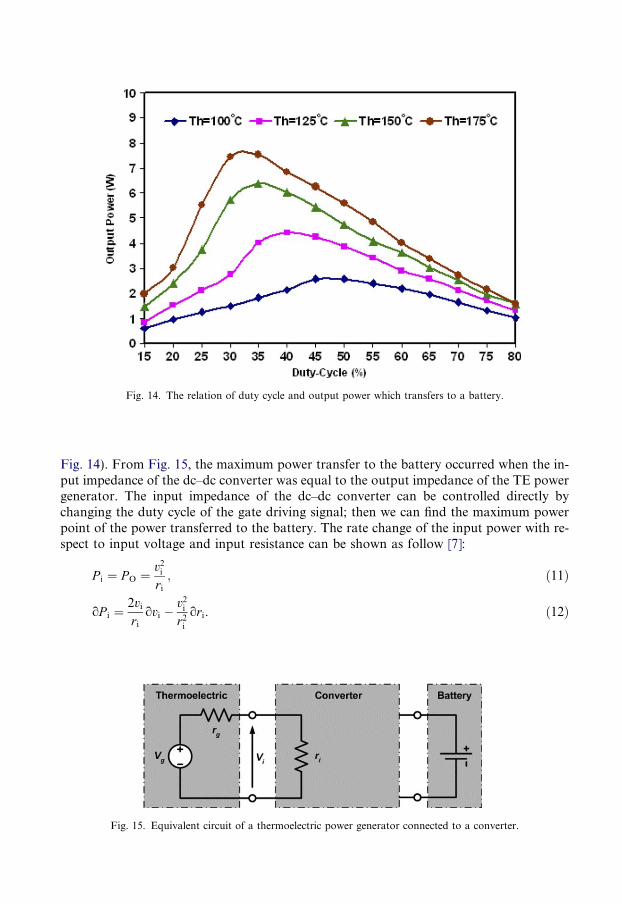
Fig. 14. The relation of duty cycle and output power which transfers to a battery.
Fig. 14). From Fig. 15, the maximum power transfer to the battery occurred when the in-put impedance of the dc–dc converter was equal to the output impedance of the TE powergenerator. The input impedance of the dc–dc converter can be controlled directly bychanging the duty cycle of the gate driving signal; then we can find the maximum powerpoint of the power transferred to the battery. The rate change of the input power with re-spect to input voltage and input resistance can be shown as follow [7]:
P i ¼ P O ¼v2
i
ri
; ð11Þ
oP i ¼2vi
ri
ovi �v2
i
r2i
ori. ð12Þ
Fig. 15. Equivalent circuit of a thermoelectric power generator connected to a converter.

At the maximum power point, the rate change of the input power is zero. Hence
oP i ¼ 0) ovi
ori
¼ vi
2ri
; ð13Þ
where vi and ri are input voltage and input resistance at the maximum power pointrespectively.
In the battery charging application, where the dc–dc converter output voltage can beassumed almost constant, a feed-forward MPPT controller may be applied [8]. The valueof the battery-charging current is directly controlled by the duty cycle of the PWM controlsignal, which is applied to the dc–dc converter. An output power increase results in both ahigher output current and a higher PWM control signal duty cycle, until the maximumpower is transferred to the load.
4. Proposed system
A detailed circuit diagram of the proposed system is shown in Fig. 16. A SEPIC dc–dcconverter is used to interface the TE power-generator output to the battery and to trackthe maximum power point of the TE power generator. The TE power generator consists of6 TE power modules connected electrically in series and thermally in parallel, giving a27.8 V open-circuit voltage at 180 �C hot-side temperature and 60 �C cold-side tempera-ture. The SEPIC dc–dc converter consists of a RFP50N06 power MOSFET rated at60V 50A Rds(ON) = 0.022 X, the fast-switching type diode D1, the capacitor values areC1 = 4.7 lF, C2 and the inductors C3 = 1000 lF, the inductors values are L1,L2 = 500 lH and the inductors are wound on a ferrite core. The output of a SEPIC dc–dc converter is connected to A 6 V, 12 Ah battery.
The MPPT control-system consists of the 8-bit ATMEL microcontroller unitT89C51AC2 and features 5-I/O port, 8-bit PWM on-chip, 10-bit resolution A/D converterwith 8 multiplexed inputs and the signal conditioner. The microcontroller unit used by thecontrol program measures the signals required for the power flow control. This type of
Fig. 16. The proposed system�s circuit-diagram.

microcontroller was chosen because it has the necessary features for the proposed system,such as an on-chip A/D converter, PWM output, high clock rate, low power consumptionand low cost.
The signal conditioner consists of a 0.5 X carbon-metal film resistor connected inseries with the battery to measure the charged current from the system and send itto the non-inverting amplifier circuit. The output signal of a non-inverting amplifieris sent to the internal A/D converter of a microcontroller to convert it to digital datafor use in the control program. The output PWM channel of a microcontroller is con-nected to the complementary transistors to amplify the output PWM signal. For higheraccuracy, a Hall-effect sensor could be used. However, the Hall-effect sensor is moreexpensive.
The algorithm of the proposed program with the MPPT feature can be explained by theflowchart, which is shown in Fig. 17. The output of an A/D converter is used to calculate aPWM command duty cycle to drive a power switch. When the system starts operating, theprogram variable is set to an initial condition. The first PWM command is 25% duty cycleand the reference current Ipass is zero. The dc–dc converter starts operation and the currentflows to the battery. The first signal captured from the signal conditioner is set to Ipresent tocompare it with the reference current Ipass. If Ipresent is more than Ipass, the program in-creases the duty cycle. Then, the battery-charging current increases. The system operatesat the maximum power point by adding the PWM command duty cycle. On the otherhand, if Ipress is more than Ipresent, then the duty cycle is over: the program goes to the nextloop to decrease the duty cycle and returns to the previous loop when Ipass was more thanIpresent again. Finally, the program can operate at the steady-state operation range auto-matically. The detailed MPP tracking process is shown in Fig. 18. The range of the8-bit PWM is 256 steps that change the on time of the duty cycle. The Dd is a programvariable with values either 1 or �1, indicating the direction that must be followed onthe hill-shaped charging current curve.
5. Experimental and results
A prototype of a TE battery charger system has been developed and tested in the lab-oratory. The temperature was measured using K-type thermocouples which determine thehot-side and cold-side temperatures of the TE power modules. The K-type thermocoupleswere mounted just below the copper plate and the heat sink (see Fig. 2) and connected to adata logger which recorded one set of readings every 4 s. The power was recorded using apower analyzer (FLUKE 43B) to measure and record data every 4 s. The experimentalprocedures is as follows:
(a) Connect the TE power generator to a battery directly for direct charge. Switch-onthe power supply to provide power to the heater. Start recording all data. The max-imum power transfer to the battery is 6.35 W in the steady state.
(b) Connect the TE power generator to the input of the dc–dc converter and connectthe output of the dc–dc converter to a battery; use a function generator togenerate the 18 kHz 35% duty cycle drive gate signal provided to the powerswitch. Switch-on the power supply to provide power to the heater. Start record-ing all data. The maximum power transfer to the battery is 7.63 W in the steadystate.

Fig. 17. Program flowchart of MPPT tracking process.
(c) Connect the MPPT control unit to the system to use the automatic controlfunction. The maximum power transfer to the battery is up to 7.99 W in the steadystate.
For the direct charging method, the system starts operation at the ambient temperature.The TE power generator could not produce a voltage because the temperature of the hotside and the cold side of TE were not different. Then, the TE module connected to the bat-tery acted as the load. The current must flow to the TE power generator. Some loss ofpower was expected. For charging with the dc–dc converter, the converter topology hasa flyback diode which can block the current flow up to the TE power generator. So, the

Fig. 18. The MPPT tracking process.
system can start operating although the generator voltage is less than the battery voltage.The hot-side and cold-side temperatures is shown in Fig. 19. A comparison of the batterycharging power is shown in Fig. 20.
The maximum powers transfers from each method, i.e. direct charging, charging byusing a dc–dc converter and charging using the dc–dc converter with MPPT control are6.35, 7.63 and 7.99 W, respectively. The comparison of the power from each method isshown in Fig. 20. The input power measured at the front of the dc–dc converter is about8.4 W. It is the maximum power that the dc–dc converter can get from the TE power
Fig. 19. The comparison of hot-side and cold-side temperatures of the TE power module.

Fig. 20. The battery charging power.
generator, namely the power source and the load matches. The output power of the dc–dcconverter is 7.99 W. The efficiency of the dc–dc converter is 95.11% when using the MPPTcontrol. It is better than the direct charging method by about 15%.
Using the same experimental procedure, we staggered the heat supply at intervals;(switch-on the heater power supply 6 min, switch-off 2 min and switch-on again) providingthe heat to the TE power generator. The comparisons of the battery charging power areshown in Fig. 21. The waveform of gate signal, input and output current of the dc–dc con-verter when using the MPPT control are shown in Fig. 22.
Fig. 21. Response of the battery charging power to turning the heat source off and on.

Fig. 22. The waveform of the gate signal; and the input and output currents of the dc–dc converter.
6. Conclusion
The advantage of the TE battery-charger system using MPPT is that the system cancharge the battery by using the heat energy directly, and not having moving parts. Itcan be applied to heating devices such as a cook-stove, a boiler or another heat sourcefor waste-heat recovery. This system is the most feasible to use in a rural community ora remote area. The photovoltaic system provides electrical power during sunshine, whilethe TE battery charger system provides power as long as the heating device is in use.The best power output of the system depends on the heat dissipation of the heat sink.However, the system design may be improved by redesigning the heat exchanger (heat re-ceiver and heat sink) appropriate to the ambient temperature. The aim of this paper is toprovide a new method for generating electrical power; it might not be economic initially,but the results derived here may lay a foundation for further investigations of TE batterycharger systems.
References
[1] Anders Killander, John C Bass. A stove-top generator for cold areas. In: Proceedings of the IEEE 15thinternational conference on thermoelectrics; 1996. p. 390–3.
[2] Mahmudur R, Roger S. Thermoelectric power-generation for battery charging. In: Proceedings of the IEEEconference on energy management and power delivery, vol. 1; 1995. p. 186–91.
[3] Roth W, et al. Grid-independent power-supply for repeaters in mobile radio networks using photovoltaic/thermoelectric hybrid systems. In: Proceedings of the 16th international conference on thermoelectrics; 1997.p. 582–5.

[4] Min G, Rowe DM. Peltier devices as generators. CRC handbook of thermoelectrics. London: CRC Press;1995 [Chapter 38].
[5] Rowe DM, Min G. Design theory of thermoelectric modules for electrical power generation. IEE Proc-SciMeas Technol 1996;143(6):351–6.
[6] Eakburanawat J, Khedari J, Hirunlabh J, Daguenet M, Maneewan S, Teekasap S. Solar-biomassthermoelectric power generation simulation. In: Proceeding of 22nd international conference on thermoelec-trics, La Grande Motte, Montpellier, France; 2003.
[7] Chung Henry Shu-Hung, Tse KK, Ron Hui SY, Mok CM, Ho MT. A novel maximum power point tracking-technique for solar panels using SEPIC or Cuk converter. IEEE Trans Power Electron 2003;18(3):717–24.
[8] Koutroulis Eftichios, Kalaitzakis Kostas, Voulgaris NC. Development of a microcontroller-based, photo-voltaic maximum power point tracking control system. IEEE Trans Power Electron 2003;16(1):717–24. 46–54,2001.
[9] Orcad PSpice Version 9.2, Copyright 1986–1999 by Cadence Design Systems.