determinants of south african exports - tips · this paper reviews several studies of the...
TRANSCRIPT

Determinants of Exports in South Africa
Merle Holden Andre GouwsDepartment of Economics Metropolitan CouncilUniversity of Natal PretoriaDurban
Presented at the Trade and Industrial Policy Secretariat Annual Forum,
Glenburn Lodge, September 1997

2
2
1.0 Introduction
This paper reviews several studies of the determinants of exports in South Africa in the light
of the policy directions, which have emphasised the importance of an export led growth path
for the economy. Major trading partners and the composition of trade are examined as are
the role of the real exchange rate, capital intensity, research and development, export
incentives and the vent for surplus theories of export behaviour.
2.0 Composition and Direction of Exports
2.1 Composition of Exports
Table 1 shows that in 1990, 89 per cent of mining production was exported, 10 per cent of
agricultural production and only 13 per cent of manufacturing production. Within
manufacturing, iron and steel, non ferrous metals, clothing, textiles and glass provided an
above average share of their domestic production for the foreign market. The propensity to
export in the manufacturing sector is rather low demonstrating the direction of trade policy
towards import substitution rather than the encouragement of exports. South Africa is
essentially a primary good exporter. If mining derivative exports are included with the
mining exports it is clear that comparative advantage lies in what has been termed the
minerals - energy complex (Fine and Rustomjee, 1996).
If gold is excluded from total exports, 26,5 per cent of total exports were primary products
in the form of food, raw materials, ores and minerals, fuels and non-ferrous metals. Other
exports that include gold, arms and ammunition (unclassified by source) form 41 per cent of
total exports. Manufactures make up the difference with 32,5 per cent of total exports.
In a recent study of the composition of exports Hirsch (1993) noted that the largest increase
in manufactured exports took place in 1990, the year of the introduction of the GEIS and

3
3
the first year of the recession. Although exports increased in all categories of manufactures,
the most notable increase of 71 per cent occurred in machinery and transport equipment
over a two - year period. Hirsch observes that
Table 1: Exports by Economic Sector
Sector Exports1991
(R bn)
Exports as %of production
1990Agriculture 2.3 10Mining 13.8 89Manufacturing: 22.6 13 Food 2.7 8 Beverages 0.3 4 Tobacco 0.0 7 Textiles 1.2 20 Clothing 0.2 24 Leather 0.2 17 Footwear 0.0 9 Wood 0.3 12 Furniture 0.1 11 Paper 1.6 11 Printing 0.1 2 Industrial Chemicals 2.6 12 Other Chemicals 0.4 6 Rubber 0.1 5 Plastic 0.1 2 Pottery 0.0 3 Glass 0.1 17 Other Nonmetallics 0.4 7 Iron & Steel 5.9 37 Non – ferrous 1.8 36 Metal Products 1.4 6 Machinery 1.2 10 Electrical Machinery 0.4 4 Motor Vehicles 0.9 5 Other Transport 0.3 24 Other Manuf 0.3 34 Unclassified 26.2
4
4
Source: Industrial Development Corporation Sectoral Data Series 1990 and GATT TradeReview, 1993.
As a proportion of world trade, South Africa's export share in primary products has
declined from 0,783 in 1988 to 0,701 in 1990, while its export share in manufactures
increased from 0,293 in 1988 to 0,339 in 1990.
Bearing in mind the incentives that have been created under the auspices of the GEIS, it isn't
surprising that machinery and capital goods exports have flourished. The interesting question
is whether these exports would occur in the absence of the GEIS and in the climate of a
buoyant economy. The World Bank (Fallon, 1993) is of the view that for a broad range of
exports the GEIS has been fundamental in sustaining their performance.
Levy (1991) contributes to the debate on the relationship between export growth and
employment in South Africa by questioning whether export led growth in and of itself will
stimulate employment growth. Levy suggests that as iron and steel, selected basic
chemicals, non-ferrous metals and pulp and paper products account for 49 per cent of
manufacturing exports that are highly capital intensive, export growth may not be as
employment creating as we would expect in an apparently labour abundant economy.
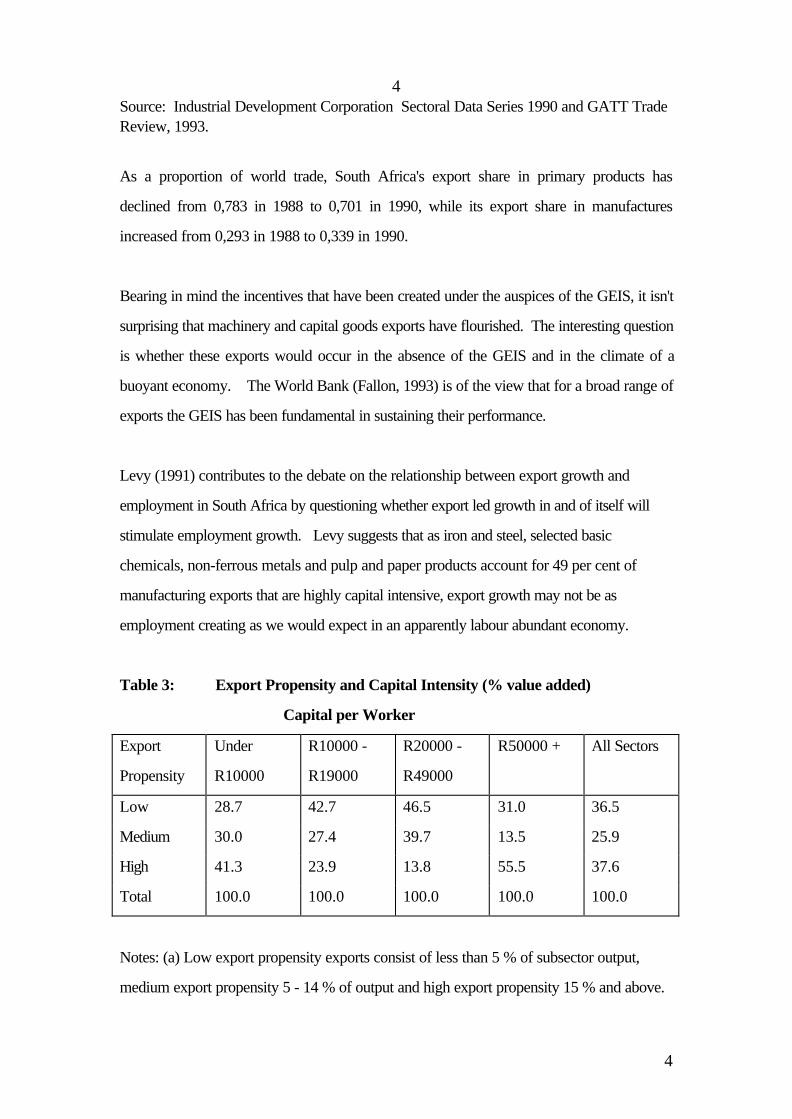
Table 3: Export Propensity and Capital Intensity (% value added)
Capital per Worker
Export
Propensity
Under
R10000
R10000 -
R19000
R20000 -
R49000
R50000 + All Sectors
Low 28.7 42.7 46.5 31.0 36.5
Medium 30.0 27.4 39.7 13.5 25.9
High 41.3 23.9 13.8 55.5 37.6
Total 100.0 100.0 100.0 100.0 100.0
Notes: (a) Low export propensity exports consist of less than 5 % of subsector output,
medium export propensity 5 - 14 % of output and high export propensity 15 % and above.

5
5
(b) Source: Levy (1991).
Table 3 shows that for high levels of export propensity the proportion of value added
declines as capital intensity rises. At R50000 per worker the proportion of value added
originating in the high export propensity grouping rises. Conversely, low propensities to
export were associated with rising proportions of value added up to R50000. Significantly,
at the R50000 grouping the export propensities are reversed. Medium levels of export
propensity displayed a more erratic relationship with capital intensity. The explanation for
these results probably lies in the development of certain strategic industries during the
apartheid years. These industries are both capital intensive and have become major
exporters. By providing selective encouragement to these capital-intensive industries the
economy was placed on a path towards creating fewer jobs. If export incentives and
industrialisation policy had been less selective and more uniform the market would have
ensured a more labour intensive pattern of growth. This pattern has observed for those
industries where capital intensity was less than R50000 per worker.
Scerri (1990) examines the role of research and development in conjunction with that of
physical and human capital, and labour. This study shows that the level of capital intensity is
positively and significantly related to the share of net exports in sales, while the proportion of
human capital in total labour is negatively correlated. When the share of research and
development expenditures are included in the regressions R and D expenditures were found
to be negatively correlated with net exports. Scerri therefore concludes that comparative
advantage in manufacturing is to be found in capital intensive industries, which employ a
relatively low level of human capital and research and development. As this study focussed
on data for the late seventies and early eighties it could be argued that the characteristics of
manufactured exports may have changed and should therefore form part of a future research
agenda.
2.2 Export Markets and their Determinants

6
6
Table 2 shows the major markets for exports for 1993 and 1996. Zimbabwe and
Mozambique moved up in the ranks of major trading partners. However, the bulk of trade
continues to be conducted with OECD countries. If gold were included in these exports the
importance of the OECD countries would be heightened particularly as this trade is
conducted in dollars.
Table 2: Major Export Markets: 1993 and 1996
Market Exports 1993 Market Exports 1996
Switzerland 7606.1 United Kingdom 13748.5
United Kingdom 3943.2 United States 9903.0
United States 3480.4 Japan 8782.2
Japan 3132.1 Zimbabwe 6215.0
Germany 2724.3 Germany 5994.1
Belgium 2310.1 Netherlands 3578.3
Taiwan 2165.5 Belgium 3446.6
Netherlands 2076.9 Taiwan 3289.2
Zimbabwe 1745.2 Switzerland 3269.2
Hong Kong 1701.2 Korea 2858.5
Israel 1680.2 Italy 2704.6
Italy 1431.7 Spain 2587.9
Zambia 1305.9 Hong Kong 2586.7
Korea 1274.7 Mozambique 2251.9
Mozambique 961.6 France 2045.5
Spain 938.8 Singapore 1803.5
France 758.9 Brazil 1759.3
China 597.4 Israel 1671.8

7
7
Malawi 591.7 Zambia 1663.7
Norway 568.9 Australia 1644.6
A model explaining the direction of trade on the basis of trading partners’ size, location and
income was recently developed in the context of establishing whether regional groupings had
played a role in South Africa’s pattern of trade A variant of the gravity model was used to
test for the determinants of the direction of trade for South Africa.
The research proposed the following model:
T GDPPC POP DIST IMPOPE
PTA SACU SADC PREF EU US TYPTA
TYSACU TYSADC TYPREF TYEU TYUS
D D D D
i n
t
it it it it it
it it it it it it it
it it it it it
it
= + + + + +
+ + + + + +
+ + + + + +
+ + + + +
==
β β β β β
β β β β β β β
β β β β β
β β β β µ
0 1 2 3 4
5 6 7 8 9 10 11
12 13 14 15 16
17 18 19 2090 91 92 93
1
1989
ln( ) ln( ) ln( ) ( )
( ) ( ) ( ) ( ) ( ) ( ) ( )
( ) ( ) ( ) ( ) ( )
( ) ( ) ( ) ( )
............. ;
,.........1993 (1.0)
where i is the ith trading partner and t represents the year. The equation was estimated in
logarithmic form. The dependent variable, Tit is South African exports to each trading
partner. GDPPC is gross domestic product per capita and population is represented by
POP . DIST represents the traditional distance variable. IMPOPE is a variable
representing the openness of each trading partner’s economy. The construction of this
variable is discussed below.
The dummy variables for regional groupings incorporate the Preferential Trading Area
(PTA/COMESA), the South African Customs Union (SACU), the Southern African
Development Community (SADC), preferential bilateral trading agreements (PREF), the

8
8
European Union (EU) and the United States/Canada NAFTA agreement (US). The
changing influence of the regional groupings additional dummies is measured by the creation
of additional dummies. These are represented by TYPTA, TYSACU, TYSADC,
TYPREF, TYUS and TYEU taking the values 1 through 5 from 1989 to 1993. General
time dummies to measure the changing effects of sanctions are represented by D90, D91,
D92 and D93.
IMPOPE was used to capture differences in trade and exchange rate policy on the part of
the trading partners. The variable was constructed by regressing each country’s share of
imports in gross domestic product on the time dummies, and the natural logarithms of gross
domestic product and population. The index of openness is the sum of the time shifts and
the residuals. Openness is therefore measured by the extent to which each country deviates
from what would have been expected given its level of per capita income and size of
population. This measure captures the combined effect of both trade and exchange rate
policy on a country’s import share.
To measure openness, the following equations were estimated by ordinary least squares.
ln( ) ( ) ( ) ( ) ( )
ln( ) ln( )
( ) ( ) ( ) ( )
MGDP D D D D
GDPPC POP
then
IMPOPE a a D a D a D a D e
it
it it it
it it
= + + + + ++ +
= + + + + +
α α α α αα α ε
0 1 2 3 3
4 5
0 1 2 3 4
90 91 92 93
90 91 92 93
(2.0)
The model was estimated using South African exports excluding gold and armaments, to one
hundred and thirty - six countries over the five year period 1989 to 1993. The availability
of data on the essential variables - GDP, exports and imports - determined whether a
country was included in the sample. Tobit maximum likelihood estimation was used in place
of ordinary least squares as exports to a number of countries were either nonexistent or zero
in certain years.

9
9
The estimating equation was run for 680 observations on pooled time series cross section
data. The major results are shown in Table 3 and show the importance of the role of
geographic and economic influences. Merchandise exports are positively related to per
capita gross domestic product and population and negatively related distance. South
Africa’s location at the tip of Africa resulted in transport costs being an important
determinant of trade direction. Furthermore, the more open economies were shown to
absorb more exports from South Africa. The dummy variables played a minor role in the
determination of the direction of exports. Apart from the SACU dummy and the D92
dummy all the other dummies are insignificant indicating that regional groupings had not
influenced the direction of exports. In addition, the impact of the regional groupings on
purchases of South African goods did not significantly change, despite the raising of
sanctions. The gradual lifting of sanctions in the early 1990s is marginally reflected in the
positive sign and level of significance of the D92 dummy variable for 1992. In addition, the
introduction of the General Export Incentive Scheme in early April 1990 failed to be
reflected in the dummy for 1990.
Table 3: Tobit Estimates for Export Equation 1.0
Variable Estimate Standard Error t-Statistic
Constant 5.79965 3.80769 1.52314
LnGDPPC 2.15007** 0.125812 17.0896ln POP 1.55085** 0.082457 18.8079LnDIST -4.46981** 0.496619 -9.00049IMPOPE 1.89368** 0.2786 6.79715
PTA 1.14207 1.37818 0.828675SACU -14.6751** 3.38311 -4.33776SADC -0.961565 2.83906 -0.338691PREF 1.75656 2.92850 0.599816EU -0.663664 1.40994 -0.470704US -1.79317 4.16892 -0.430128
TYPTA -0.151982 0.39170 0.383628TYSACU 0.783487 0.989886 0.791493TYSADC 0.08914 0.850592 0.104798TYPREF -0.575577 0.88054 -0.653663

10
10
TYEU 0.00414338 0.411731 0.010063TYUS 0.033601 1.24817 0.02692
D90 0.048906 0.483593 0.10113D91 0.498860 0.493097 1.01169D92 0.839198* 0.508781 1.64943D93 0.09335 0.529937 0.176153** Significant at 1% level * Significant at 5% level No. of Observations = 680Note: Exports, the dependent variable, are estimated in logs for values greater than zero.
The negative sign on the SACU dummy indicates a significant understatement of exports to
the SACU countries given their levels of per capita income and population. The difficulties
with the recording of intra SACU trade, accounts for this result.
Table 4: Tobit Estimates for Export Equation 1.0 excluding SACU
Variable Estimate Standard Error t-Statistic
Constant 5.15754 3.97002 1.29912
lnGDPPC 2.04488** 0.12684 16.12128lnPOP 1.59448** 0.084479 18.8743lnDIST -3.77748** 0.509696 -7.41124IMPOPE 1.96093** 0.28932 6.77773
COMESA 1.90916 1.47098 1.29788SADC -3.63134 2.63321 -1.37905PREF 3.79455 2.85632 1.32847EU -0.55133 1.44588 -0.381312US -1.82568 4.27298 -0.427261
TYPTA -0.155392 0.422508 -0.367786TYSADC 0.058686 0.778035 0.075429TYPREF -0.564609 0.860269 -0.656317TYEU 0.012706 0.422261 0.030090TYUS 0.033079 1.27922 0.025859

11
11
D90 0.176594 0.502755 0.351252D91 0.532395 0.512201 1.03943D92 0.881429* 0.527437 1.67115D93 0.155511 0.548067 0.283744
** Significant at the 1 % level * Significant at the 5 % level
As the SACU data is understated, it was decided to exclude the SACU dummy and apply
the Tobit analysis without Lesotho, Swaziland, Namibia and Botswana. The results are
shown in Table 4. The exclusion of SACU and the SACU countries has little effect on the
overall result. Given that all the SACU countries are contiguous to South Africa, it is
interesting that the level of significance of the distance variable is increased and the
coefficient decreases in absolute size.
To investigate the nature of the adjustment process, the lagged dependent variable was
introduced into the equation. Table 5 shows the results. The time dummies which provide
some measure of the overall effect of sanctions, played a more significant role for the years
1991 and 1992 when sanctions gradually relaxed. The coefficient on the
1993 dummy was not estimated due to the existence of multicollinearity. The one year lag
proved to be significant and indicated that the adjustment process was only partially
completed within a year.
Table 5: Tobit Estimates for Exports incorporating a lagged dependent variable
Variable Estimate Standand Error t-statistic
Constant 3.14406 3.36258 0.935015
LnGDPPC 0.895358 0.132016 6.78216LnPOP 0.756888 0.086948 8.70508LnDIST -1.85885 0.456315 -4.07362IMPOPE 0.997511 0.253292 3.93818
PTA 1.55002 1.63594 0.947534SACU -9.95122 4.08806 -2.43421SADC -0.839355 3.43788 -0.244149PREF 0.411585 3.54681 0.116044EU -1.32717 1.68127 -0.789382

12
12
US -2.35993 5.03662 -0.468554
TYPTA -0.394549 0.434066 -0.90896TYSACU 1.42463 1.08526 1.31271TYSADC 0.162675 0.931022 0.174728TYPREF -0.216073 0.963818 -0.224185TYEU 0.308098 0.450074 0.684549TYUS 0.458363 1.36597 0.335557
D90 0.582313 0.415185 1.40254D91 0.8949 0.391356 2.28666D92 1.00449 0.375735 2.67341
LnEXPORT(-136) 0.551252 0.036016 15.3058** Significant at 1% level * Significant at 5% level
3.0 Export Incentives
At the present time the export incentives remaining in force are duty drawbacks and
exemptions to exporters, the reduced level of GEIS, limited low interest IDC loans,
export credit re-insurance, discounted electricity, export marketing assistance and newer
WTO- friendly supply side measures that will be discussed below.
Exporters can only use the drawbacks and exemptions of duty if they can show why duty
free imports will aid the export effort. These incentives are not available automatically, and
furthermore, if exporters availed themselves of the GEIS they were not allowed to use the
drawbacks and exemptions.
When the GEIS was first introduced the cash grant under the GEIS was larger depending
on the degree of processing and the local content. It has been estimated that by value 33
per cent of export trade qualified for assistance under the GEIS (Davis, 1993). Bearing in

13
13
mind that gold and precious metals and stones, certain maize, petroleum products,
uranium, motor vehicles and parts were excluded from the benefits of the GEIS it is clear
that most of manufacturing industry is included. Clothing, carpets, footwear, fabricated
metals, machinery and appliances received the maximum 19,5 per cent, and sectors such as
chemicals and certain food processing sectors, a low of 2 per cent (Davis, 1993).
However, the GEIS has been gradually phased out. In 1994 benefits to Category 2,
beneficiated primary products were eliminated. Benefits in Category 3, material intensive
products were reduced to 3 per cent from 12.5 per cent, and Category 4, manufactured
products from 25 per cent to 14 per cent. The phase down of the GEIS has accelerated in
1996 with the announcement by the Department of Trade and Industry that as from July 1
the payout on Category 4 will be reduced from 12 per cent of 1996 to 6 per cent and
Category 3 presently at 2 per cent to zero per cent. The GEIS will be finally terminated in
December 1997.
The reasons for the phase out of the GEIS that have been given by the Department of Trade
and Industry are as follows:
1. Anti - export bias has been reduced by a number of measures including the reduction in
tariffs and supply side measures
2. The incompatibility of the GEIS with GATT obligations
3. The possible ineffectiveness of GEIS
4. Fiscal constraints
The Supply - Side Programmes that are in place at the present time are as follows:
1. Support Programme for Industrial Innovation
2. Technical and Human Resources for Industrial Progress
3. Small Business Development Programmes
4. Export Marketing Assistance
5. National Investment Promotion Agency

14
14
6. Competitiveness Fund
7. Pre-Shipment Export Guarantee Scheme
8. Low interest finance for the promotion of exports available of with investment greater
than R1 million with 30 per cent or more of production directed at exports.
9. Duty credit certificate scheme for exporters of textiles and clothing.
10. Motor Industry Development Programme
In addition, research according to industry clusters is ongoing. This research will enable
each cluster to identify specific areas for funding. The Department of Trade and Industry
has allocated R181m to fund programmes that can be shown to be sustainable. It is felt that
a scheme such as the GEIS was not sustainable as it was not developing the capacity for
exporting without continual funding.
Several criticisms have been levelled at the GEIS. Firstly, it is contrary to the rules of the
WTO that of course is not to say that the supply measures that are now in place may also be
considered unfriendly if exporters are successful in penetrating foreign markets. Secondly,
and more fundamentally, the GEIS created the opportunity for corruption in the form of
firms importing goods and adding large mark - ups to claim local content under the GEIS,
overinvoicing exports and finally, exporting goods of little value at high prices then re-
importing in a different form with low prices. These considerations combined with the cut in
allocated expenditure to the Department of Trade and Industry in 1996 has hastened the
demise of the GEIS.
If the GEIS had not stimulated investment in export capacity then the view of the
Department of Trade and Industry is justified. Their view is supported by a cross country
study by Levine and Renelt (1992) who upon finding strong correlations between investment
and trade concluded that the beneficial effects of trade reform operate rather through greater
resource accumulation rather than through the price mechanism and a more efficient
allocation of resources. Of course it isn’t sufficient to observe greater investment in traded
goods and then conclude that prices had been unimportant in stimulating investment in export
capacity.

15
15
4.0 Anti - Export Bias
The bias inherent in a trade regime has been shown to transfer resources either in the
direction of import substitution or export promotion activities in the economy. Measures of
bias in economies have been calculated in order to ascertain firstly the orientation of the
whole economy , and secondly, at the micro level to establish how an individual industry is
orientated. The bias of a regime measures the extent to which domestic and international
prices provide incentives, which differ from those that, are faced by firms under free trade.
In many countries it has been difficult to obtain reliable data in order to measure bias. In
the case of South Africa it has been particularly difficult to measure bias given the paucity of
data on prices and the various incentive measures which have been adopted. Therefore,
using a methodology developed by Greenaway and Milner (1987) the incidence of
protection was estimated for South Africa for the period 1974 to 1987 (Holden, 1992).
This analysis is general equilibrium in nature and estimates the extent to which a tariff
changes the relative prices of importables to exportables and nontradables. The results
indicate that when the price of gold is included in the price of exports, a substantial
proportion of the protection given to importables is shifted in the form of an implicit tax onto
exportables. When gold is not included,only 34 per cent of the protection given to
importables is shifted onto manufacturing exportables. It is therefore, not surprising, that
prior to the real depreciation of the rand in 1984 and 1985, manufactured exports failed to
perform (Holden, 1990). These results also accord with the estimates of effective protection
which were made by the Industrial Development Corporation where the average rate of
effective protection granted to the manufacturing sector was 30 per cent., i.e. domestic
value added in manufacturing was increased by 30 per cent as a result of the tariff structure.
A further study at the individual industry level found that when the favourable incentives of
the GEIS are combined with the protective structure of tariffs, 27 industries would have
found it attractive to produce for the foreign market, and 40 industries would still prefer the
domestic market (Holden, 1993).

16
16
In a recent study on the changes in ‘true’ protection and subsidy rates incorporating the
Uruguay Round offer and the elimination of the GEIS (Holden, 1995), the conclusion is
reached that even though import tariffs are reduced with the elimination of the GEIS the
economy still maintains a strong measure of anti export bias. The true rate of protection and
subsidy namely t* and s* calculated in this study are shown in Table 6. These have been
calculated to show the effect of the GATT offer on the true values.
Table 6: True Protection and Subsidy Rates
Trade Regime t*(%)
s*(%)
Pre - GATT 1.6 -5.03Post - GATT 2.4 -7.5
The estimated incidence parameter, the average nominal rates of protection for
manufacturing and the average rates of subsidy under the GEIS were used to calculate the
true rates. The average import tariff rates before and after the GATT agreement are 16.6
and 10.81 per cent respectively, and the average rate of subsidy under the GEIS was 9 per
cent (See GATT Trade Review, 1993). Even though tariffs have been cut, because the
GEIS is also eliminated, less pressure is placed on the price of nontradables, and therefore
the true rate of protection actually rises. As is to be expected, the bias against exports, in
terms of increasing the negative subsidy to exporters, rises from -5.03 to -7.5 per cent. The
study concludes that positive import protection combined with an increase in the price of
nontradables, and, the elimination of the cash subsidy may well discourage the production of
exports unless bias against exports can be reduced by other measures. Clearly, a further
reduction in import tariffs would also reduce anti - export bias.
Recently, the IDC (1997) calculated effective rates of protection given to importables and
exportables. Table 7 shows the results of their calculations for the economy and
manufacturing.
Table7: Anti-export bias (including Export incentives)

17
17
1993 1996 1999
Total Economy 1.19 1.32 1.32
Total Manufacturing 1.27 1.45 1.44
In 1993 high import tariffs averaging 16 per cent were partially counterbalanced by the
GEIS (12 per cent), Articles 470.03 and 521.00 and transport rebates. The anti-export
bias coefficient is calculated to be 1.19 for the economy and 1.27 for manufacturing. The
lowering of import tariffs and the rationalisation of the tariff schedule coupled with the
reduction in GEIS benefits results in an increase in the coefficient to 1.32 in both 1996 and
1999 for the economy. Whereas in manufacturing the coefficient rises to 1.45 in 1996 and
1.44 in 1999. Although the IDC calculations confirm the results from the earlier incidence
study of the direction of change in anti-export bias, they do indicate a greater degree of bias
against exports.
It is difficult to quantify the effects of the new supply measures on anti - export bias. An
indication of the extent of resources to be used on these supply side measures are the
amounts spent. During 1995/6 the Department of Trade and Industry spent R364m on the
export credit reinsurance scheme and export trade promotion, R80m on small business
development and R8m on export marketing assistance. These amounts must be compared
against R1883m spent on GEIS and R850m on the Regional Industrial Development
Programme during the same period.
5.0 Productivity and Exports
The link between productivity and trade was explored on a subsectoral basis for the
manufacturing sector in South Africa for the period 1973 to 1993 in a recent study (Holden,
1996). The approach incorporates imperfect competition, returns to scale and research and
development effects. Using an approach developed by Harrison (1994) and Harrison and
Revenga (1995), the production function for each subsector at the four digit level was given
by:
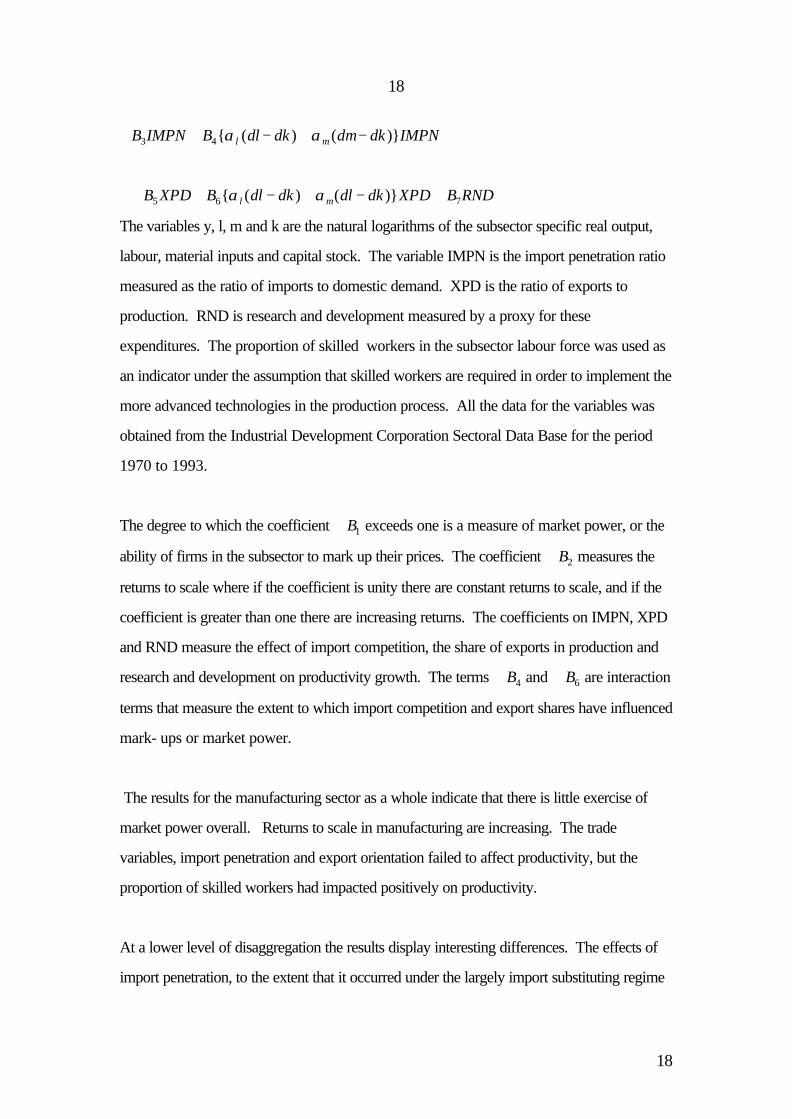
dy B B dl dk dm dk B dkl m= + − + − +0 1 2{ ( ) ( )}α α
18
18
+ + − + −B IMPN B dl dk dm dk IMPNl m3 4{ ( ) ( )}α α
+ + − + − +B XPD B dl dk dl dk XPD B RNDl m5 6 7{ ( ) ( )}α α
The variables y, l, m and k are the natural logarithms of the subsector specific real output,
labour, material inputs and capital stock. The variable IMPN is the import penetration ratio
measured as the ratio of imports to domestic demand. XPD is the ratio of exports to
production. RND is research and development measured by a proxy for these
expenditures. The proportion of skilled workers in the subsector labour force was used as
an indicator under the assumption that skilled workers are required in order to implement the
more advanced technologies in the production process. All the data for the variables was
obtained from the Industrial Development Corporation Sectoral Data Base for the period
1970 to 1993.
The degree to which the coefficient B1 exceeds one is a measure of market power, or the
ability of firms in the subsector to mark up their prices. The coefficient B2 measures the
returns to scale where if the coefficient is unity there are constant returns to scale, and if the
coefficient is greater than one there are increasing returns. The coefficients on IMPN, XPD
and RND measure the effect of import competition, the share of exports in production and
research and development on productivity growth. The terms B4 and B6 are interaction
terms that measure the extent to which import competition and export shares have influenced
mark- ups or market power.
The results for the manufacturing sector as a whole indicate that there is little exercise of
market power overall. Returns to scale in manufacturing are increasing. The trade
variables, import penetration and export orientation failed to affect productivity, but the
proportion of skilled workers had impacted positively on productivity.
At a lower level of disaggregation the results display interesting differences. The effects of
import penetration, to the extent that it occurred under the largely import substituting regime

19
19
is mixed. Table 8 groups together those industries where the coefficient on the import
penetration variable was significant but either negative or positive.
Table 8: Import Penetration Effect
Positive Coefficient Negative Coefficient
Medicines Clothing
Malt Spinning
Clay Other Paper Products
Animal Feeds Oils
Other Chemicals Fertilisers
Cocoa Products
Other Basic Chemicals
Agricultural Machinery & Equip.
The growth in productivity was adversely affected by greater import penetration in eight
industries including the clothing industry. Only five industries experienced improvements in
productivity as a result of greater import penetration.
The effects of greater export orientation on the growth in productivity was only felt in a
minority of industries. These are shown in Table 9. Of the few industries where productivity
was affected by changes in export orientation, six experienced an increase productivity
growth as the proportion of output exported increased. On the other hand, five industries
including the important motor vehicle industry, experienced a decrease in the rate of
productivity increase. As many exporters in South Africa are known to export when the
economy is depressed it is not surprising that in industries such as clothing, footwear and
motor vehicles productivity growth was observed to be lower when the proportion of output
exported grew. This finding highlights the problem of establishing the direction of causality
between the variables included in this model.
Table 9: Export Orientation

20
20
Positive Coefficient Negative Coefficient
Other Metals Jewellery
Grain Products Motor Vehicles
Other Basic Chemicals Clothing
Iron and Steel Radio and TV
Agricultural Machinery
&Equipment
Footwear
Structural Clay Products
The coefficient on the economies of scale variable was found to be greater than one, in
twenty four industries. These increasing returns were found in motor vehicles, knitting,
clothing, machinery and iron and steel manufacture. Although decreasing returns were found
in forty two industries, overall increasing returns were found to prevail in the manufacturing
sector as a whole. The importance of a larger market both domestic and foreign, therefore
has important implications for the costs of production in the manufacturing sector.
Significantly, market power was used in twenty nine industries. These industries included
motor vehicles, knitting, spinning, pulp, carpets, other chemicals and more importantly due
to its upstream position, iron and steel. The exploitation of such market power would have
impeded the competitive position of the downstream domestic users of iron and steel,
knitting and spinning products. Seventeen of the industries that exercised market power
have been classified as exhibiting high concentration in the period 1982 to 1988 (Fourie and
Smith, 1993). These results provide prima facie evidence that in the case of South Africa
bigness has been associated with monopoly pricing policies. However, many firms in motor
vehicles, knitting and clothing also enjoyed economies of scale in production. A notable
exception to this was in the machinery subsector where protection was low, economies of
scale high and market power was not exercised.

21
21
The import penetration and export orientation interaction terms provided mixed results. Six
industries, including motor vehicles and footwear decreased mark up as a result of rising
import penetration ratios. Only three industries actually increased mark up. Greater export
orientation had the effect of decreasing mark up in three industries including motor vehicles.
Mark up in eight industries was increased as a result of greater export orientation.
Clothing, footwear and carpets were among those industries that increased mark up as the
proportion of output exported rose.
The proxy for research and development, namely the proportion of skilled workers in the
labour force yielded mixed results. Eight industries experienced positive effects on
productivity from an increase in the proportion of skilled workers while ten industries
experienced negative effects. Using panel data up to 1983 Scerri (1990) concludes that
South African manufacturing industries failed to compete internationally in technology
intensive commodities lending support to the results obtained in this analysis.
6.0 Other Determinants of Exports
Policy makers can use the exchange rate in one of two different ways. The exchange rate
can either be directed at achieving a real target, such as maintaining competitiveness, the
trade balance and employment, or it can used domestically as a nominal anchor for the price
level. Exchange rate policy in South Africa when focused on a real target has aimed to
maintain the competitiveness of the gold mining industry. Whereas if the exchange rate had
been used as a nominal anchor, it would in a sense have been precommitted with
government policy leading the private sector to reduce the rate of inflation. Over the past
two decades major shocks in the form of gold price changes, and capital outflows emanating
from political crises, have complicated the management of the exchange rate and blurred the
objectives of exchange rate policy. The interests of this study relate to the role of the real
exchange rate in maintaining the competitiveness of manufactured exportables.
The real exchange rate in South Africa has been driven largely by the price of gold through
changes in the terms of trade and capital flows (Gerson and Kahn, 1985, Mainardi, 1995)

22
22
For example the sharp rise in the price of gold over the late seventies led to an appreciation
in the nominal exchange rate and an increase in the price of nontraded goods. This real
appreciation would have squeezed the profitability of import - substituting firms and
exporting firms. On the other hand, the real depreciations of the eighties were particularly
helpful to the producers of tradables.
During the late seventies and early eighties the variability of real rates exceeded that of
nominal exchange rates (Holden, 1985). Since 1985 the real exchange rate has been
relatively stable while the nominal rate has steadily depreciated. As changes in exchange
rates have been shown to influence the movement of resources into and out of the
production of tradables, it is in this light that the variability in rates must be viewed.
6.1 The Determinants of Exports in Aggregate
Econometric evidence for South Africa supports the view that real exchange rates have
played a role in influencing the volume of exports and imports. Holden (1985) in a demand
and supply model for manufacturing exports and nongold mining exports concludes that the
effective exchange rate is a highly significant determinant of the demand for exports. The
model shows that a nominal depreciation by raising the domestic currency price of exports
expands the supply of exports. The increase in the price of exports in the model represents
a real depreciation. The elasticities of supply for manufacturing (2.29) and nongold mining
exports (0.19) accord with expectations that nontraditional exports are more sensitive to
changes in price. However, manufacturing exports were found to be positively related to
the extent of excess capacity in the South African economy. On the other hand, nongold
mining exports failed to be affected by the state of the economy. However, both
manufacturing and nongold mining exports were influenced by the world demand.
In an examination of the determinants of the supply of manufactured exports the World
Bank (1994) suggests that although the share of exports in domestic production is sensitive
to changes in the real exchange rate, the elasticity of response is low (0.63). Although not
strictly comparable with the Holden study, this elasticity estimate when measured as the

23
23
response of export volumes to the real exchange rate ranges between 0.63 and 0.72
depending on whether it is assumed that the increase in exports is at the expense of
production for the domestic market. Lower capacity utilisation was found to impact
positively on the share of production exported, whereas the effect of world demand on the
share of production exported was weak. As manufactured exports consist of commodities
such as chemicals and iron and steel the world demand for which is declining the Bank is not
surprised by this result. However, the analysis also concedes that sanctions played a part in
depressing the effect of changes in world demand on South African exports. Given that
Holden’s work covered the presanctions era, the difference between the role played by
world demand in the two analyses can be explained.
Although aggregate manufacturing exports have been shown to be sensitive to changes in the
real exchange rate and hence sensitive to changes in prices, whether this translates into
greater or lesser sensitivity to the extent of bias against exports has not been established. A
future export capacity research agenda should address this question.
6.2 Disaggregated Export Determinants
Gouws (1997) while studying the effect of the GEIS on individual industries notes that
Balassa (1986) argued that export supply exhibits a significant response to a change in
relative prices. Sachs (1989), on the other hand concludes that strong export growth occurs
mainly in the presence of large unemployment of domestic resources.. In the South African
environment there are not only the normal complexities of determining capacity or
appropriate prices, but additional factors such as sanctions, over-invoicing export sales to
claim additional export incentives and under-invoicing export sales and over invoicing of
imports to avoid the stringent currency controls regulations.
Probably the most important factor on the demand-side, is the level of economic activity in
the international markets. In the short-run, as foreign income increases so should the demand
for South Africa’s products. This is especially true if industrial output increases because
most of South African exports are raw materials used as inputs in industry. The trading

24
24
partners’ capacity to import is important including not only income, but in addition the
availability of foreign exchange. However, those countries that have maintained exchange
control have also been low income and or slow growing. Therefore, an income variable
could well capture the effect of such controls.
Nevertheless Gouws (1997) hypothesises that the most important factors determining the
behaviour of the exporter are the profitability of exports in the foreign market and the
pressure of domestic demand given that anti-export bias exists. When exporters or
manufacturers have faced increased demand in South Africa, the trend has been for them to
forsake the foreign markets in favour of the home market. The effect of the subsidies such as
the GEIS was to increase the profitability of exports.
Gouws therefore hypothesised that the level of exports is dependent on the price received
for the exports (the REER is used as a proxy); the spare capacity available (both capacity
utilisation and spare capacity due to lack of demand were tested); the demand for South
African exports (the OECD’s GDP was used as a proxy); and the export incentive measure
(GEIS).
Xt = β0+β1X(t-1) + β2GEIS t + β3REER t + β4CAPUT t (or UUDEM t) + β5OECDGDP t + ε t
where
Xt is the level of exports;
GEISt is the value of export assistance given under the General Export Incentive
Scheme;
REER t is the real effective exchange rate;
CAPUTt is the capacity utilisation;
UUDEMt is the spare capacity due to lack of demand; and
OECDGDPt is the OECD’s GDP

25
25
The parameters were estimated using Ordinary Least Squares. Similar results were achieved
using the Two-Stage Method and the Seemingly Unrelated Regression Method. The
Durbin-Watson test was used to test first order auto-correlation. With low Durbin-Watson
values, the Breusch-Godfrey Serial Correlation LM Test was used to check for serial
correlation and was corrected using autoregression techniques.
Data Requirements
(1) The export data used in the Gouws study were obtained from the IDC and aggregated
to the three digit SIC level, enabling analysis of 26 manufacturing sectors with quarterly
data from 1988 to 1994. It is hoped that with an extended data set to continue modelling
export behaviour incorporating adjustment in export behaviour to the changes in the
incentive structure.
(2) The GEIS data was obtained from the Department of Trade and Industries database. It
was downloaded on a disaggregated basis, using the original HS classifications. These data
were converted to SIC using the CSS concordance (conversion) tables. Although it would
have been interesting to analyse the growth in category 4 exports, it was not possible to
obtain the export data (dependent variable) from the IDC in a disaggregated basis. Sectors
were therefore analysed in aggregate and not according to GEIS category. Since GEIS
claims take some time to be submitted by the exporter and then to be verified by the
Department of Trade and Industry, only data from the inception of the scheme until 1994
were used as this ensured that all claims were covered.
(3) As export prices were only available on an annual basis, it was decided to use the real
exchange rate (REER) as a proxy for price. The real effective exchanges rate has been
calculated by the Reserve Bank and the IDC. The IDC has calculated the REER per sector
for use in their General Equilibrium Model, the IDCGEM. Both series were used and
selection depended on which gave the better statistical fit.

26
26
(4) The capacity utilisation index is compiled quarterly at a three digit SIC level by CSS.
(5) As South Africa’s major trading partners are OECD countries, OECD GDP weighted
by trade shares was used.
(6)Certain products are exported seasonally and seasonal dummy variables were used.
Sanctions were imposed on certain products that were lifted. A dummy variable is therefore
included in selected sectors. The textile industry also benefited from the SAPs. Although no
values were put to these, clearly changes in the SAP/duty credit system had an impact on
exports. A dummy was therefore used to measure the impact of the “announcement effect”.
Summary Results
Of the 23 equations estimated, the R-squared exceeded 0,70 for 13 industries and 0,65 for
eight. The F-statistic in all cases rejects the hypothesis that the partial slope coefficients are
simultaneously equal to zero at the 95 per cent confidence level. The equations with low
explanatory power were for the iron and steel and paper industries. Nevertheless, the results
would suggest that for the majority of the industrial activities GEIS, REER, capacity
utilisation or capacity due to lack of demand, and the OECD's GDP, when taken together,
are important determinants of the level of South African exports.
Summary of findings
SectorGEIS REER
Capacityutilisation
OECDGDP
Food -0,862(-1,720)
522967(0,239)
-22784103(-4,296)
21492(1,078)
Beverages -0,734(-0,4418)
555662(0,8482)
-1465451(1,0888)
37780(5,3675)
Tobacco 44,0202(1,864)
60350(1,0676)
54108(0,7716)
-679,89(-0,852)
Textiles -0,2913(-0,1288)
1872831(1,1889)
-3891188(-2,1799)
-100915(-7,8113)
Clothing 3,4504(1,3947)
307505(0,3865)
5597888(2,6650)
2958,9(0,7867)
Footwear 2,8657(2,0325)
-138389(-1,698)
170258(2,6124)
5109,6(2,6096)
Wood products -0,5469(-05449)
-1266676(-3,0693)
123426(0,1413)
10514,8(1,7037)
Furniture 0,0102(1,5568)
-0,0541(-2,2042)
0,2394(3,0837)
0,6098(04972)
Paper and paper -0,0069 -0,0875 -0,1982 0,7016

27
27
products (-1,0904) (-3,5590) (-2,3559) (0,5649)
Printing -0,0678(-2,7147)
-0,0368(-3,0383)
-0,0098(-0,3351)
0,0006(2,6208)
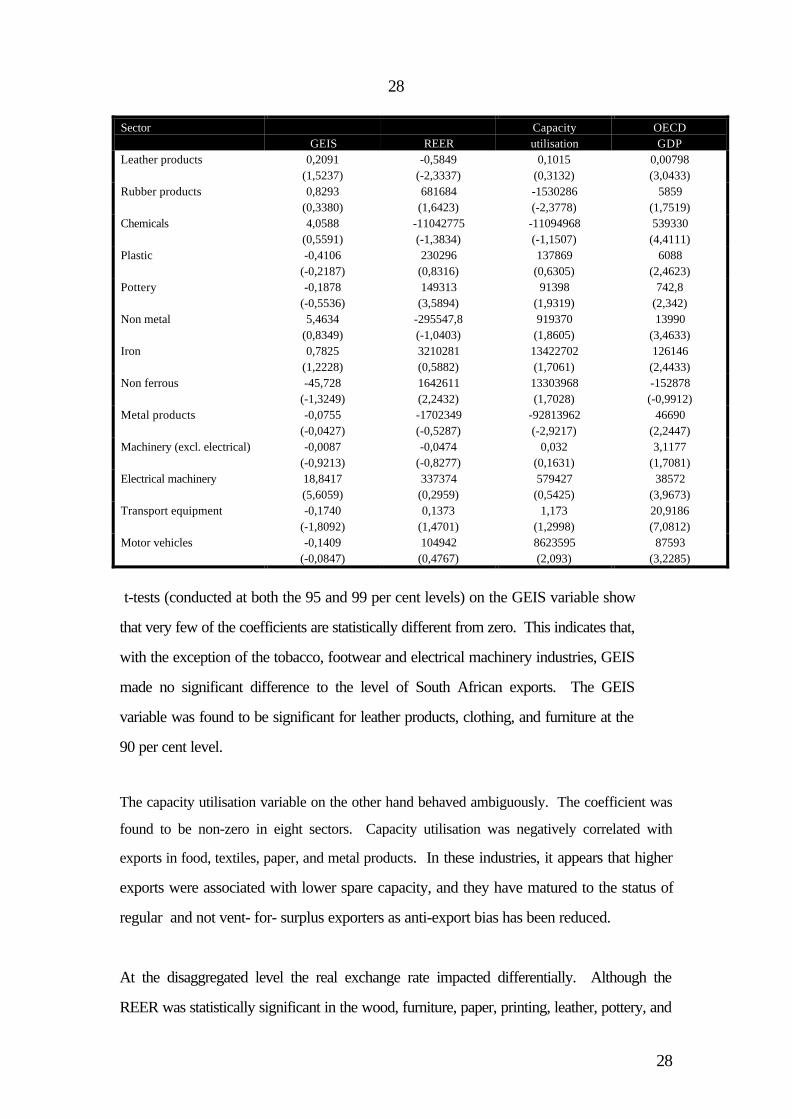
28
28
SectorGEIS REER
Capacityutilisation
OECDGDP
Leather products 0,2091(1,5237)
-0,5849(-2,3337)
0,1015(0,3132)
0,00798(3,0433)
Rubber products 0,8293(0,3380)
681684(1,6423)
-1530286(-2,3778)
5859(1,7519)
Chemicals 4,0588(0,5591)
-11042775(-1,3834)
-11094968(-1,1507)
539330(4,4111)
Plastic -0,4106(-0,2187)
230296(0,8316)
137869(0,6305)
6088(2,4623)
Pottery -0,1878(-0,5536)
149313(3,5894)
91398(1,9319)
742,8(2,342)
Non metal 5,4634(0,8349)
-295547,8(-1,0403)
919370(1,8605)
13990(3,4633)
Iron 0,7825(1,2228)
3210281(0,5882)
13422702(1,7061)
126146(2,4433)
Non ferrous -45,728(-1,3249)
1642611(2,2432)
13303968(1,7028)
-152878(-0,9912)
Metal products -0,0755(-0,0427)
-1702349(-0,5287)
-92813962(-2,9217)
46690(2,2447)
Machinery (excl. electrical) -0,0087(-0,9213)
-0,0474(-0,8277)
0,032(0,1631)
3,1177(1,7081)
Electrical machinery 18,8417(5,6059)
337374(0,2959)
579427(0,5425)
38572(3,9673)
Transport equipment -0,1740(-1,8092)
0,1373(1,4701)
1,173(1,2998)
20,9186(7,0812)
Motor vehicles -0,1409(-0,0847)
104942(0,4767)
8623595(2,093)
87593(3,2285)
t-tests (conducted at both the 95 and 99 per cent levels) on the GEIS variable show
that very few of the coefficients are statistically different from zero. This indicates that,
with the exception of the tobacco, footwear and electrical machinery industries, GEIS
made no significant difference to the level of South African exports. The GEIS
variable was found to be significant for leather products, clothing, and furniture at the
90 per cent level.
The capacity utilisation variable on the other hand behaved ambiguously. The coefficient was
found to be non-zero in eight sectors. Capacity utilisation was negatively correlated with
exports in food, textiles, paper, and metal products. In these industries, it appears that higher
exports were associated with lower spare capacity, and they have matured to the status of
regular and not vent- for- surplus exporters as anti-export bias has been reduced.
At the disaggregated level the real exchange rate impacted differentially. Although the
REER was statistically significant in the wood, furniture, paper, printing, leather, pottery, and
29
29
nonferrous metal products industries, pottery and nonferrous metals were found to positively
correlated with the REER while the other industries were negatively correlated.
OECD GDP proved to be an important factor in determining the level of South Africa's
exports. This is not only the case with primary products, as one would expect but also with
manufactured products. The model determined that generally the OECD's GDP was the
most common factor influencing South African exports, with exports in sixteen of these
industries being driven by economic activity in the OECD. However, one, the textile
industry, had the incorrect sign. It would therefore appear that although exports in certain
sectors have risen to African countries, the economic conditions in the OECD still remain an
important determinant of export performance.
6.0 Conclusion
In conclusion there is evidence from the sectoral studies of export behaviour that differs to
that found for aggregate manufactured exports. Manufacturing exports have been found to
be influenced by the real exchange rate with varying sensitivity. Furthermore, there is
evidence of vent –for- surplus behaviour with respect to surplus capacity, and manufactured
exports were stimulated by greater foreign economic activity. Productivity improvements
failed to be associated with a greater share of exports in production, even though the
proportion of skilled workers in an industry impacted positively on manufacturing
production. This finding appears to be at variance with work by Scerri (1990) who found
that research and development and human capital inputs were not associated with better
export performance.
At the sectoral level, there is evidence to suggest that the real exchange rate is not always a
determinant of export performance, nor that all industries export their surpluses when
domestic demand is depressed. Some industries were found to have enjoyed greater
productivity as the proportion of output exported grew. Overwhelmingly however most
industries were found to export more when growth in the OECD countries was higher.

30
30
On a sectoral basis it was found that the GEIS had not impacted positively in many sectors
on exports, despite the calculated reduction in anti-export bias arising from the GEIS. This
raises the issue of the credibility of this form of trade policy. Many exporters had not
incorporated the GEIS into calculations of profitability rather treating the large payments
under the scheme as the proverbial cherry on the top. This finding also suggests that any
reduction in anti-export bias can only be achieved through the introduction of credible
changes in trade policy.
Schemes such as Section 470.03 with their lack of transparency and time lags involved are
not a credible option, nor are export subsidies such as the GEIS. Given the response of
exporters to the real exchange rate it may well be that changes in the exchange rate have
also been viewed as less than credible by exporters. Therefore, if an export led growth path
is envisaged for the economy, then firstly it is important for monetary and fiscal policy to be
conducted in such a manner so as to ensure stability in the real exchange rate at an
appropriate level. Secondly, it would appear that in order to reduce anti- export bias further
tariff liberalisation should be embarked upon. The recent reduction in ad valorem duties on
luxury type goods to 15 per cent is a first step in that direction. Even though Customs and
Excise have been unable to enforce present tariff structures, this illegal trade liberalisation is
neither credible nor sustainable.
Bibliography
Balassa, B. (1986), ‘Comparative Advantage in Manufactured Goods’, Review of
Economics and Statistics, 68(2)
Bell,T, (1992), ‘Should South Africa Further Liberalise its Foreign Trade’, Economic
Trends Working Paper No 16.

31
31
Bell, M and Pavitt, K. (1992). ‘Accumulating Technological Capability in Developing
Countries’, Proceedings of the World Bank Annual Conference on Development
Economics.
Belli, P., Finger M. and Ballivian A. (1993), ‘South Africa: A Review of Trade Policies’,
Informal Discussion Papers on Aspects of the Economy of South Africa , Discussion
Paper No 4, World Bank, Washington D C.
Central Economic Advisory Service, (1993) `The Restructuring of the South African
Economy: A Normative Model Approach.'
Corden, W M, (1971) `The Theory of Protection" Oxford, Clarenden Press.
Chenery, H, (1960) ‘Patterns of Industrial Growth' American Economic Review, Vol 50
No 3, pp 624 -664.
Davis, G, (1993), South African Managed Trade Policy: The Wasting of a Mineral
Endowment, PhD dissertation, Penn State University.
Dornbusch, R, (1992) `The Case for Trade Liberalisation in Developing Countries,'
Journal of Economic Perspectives, Vol 6 No1
Edwards, S. (1991) `Trade Orientation, Distortions and Growth in Developing Countries,
NBER, Working Paper 3716.
Edwards, S, (1992), ‘Trade Growth and Developing Countries’, Journal of Economic
Literature, Vol XXXI.
Edwards, S and Cox Edwards, A (1991), Monetarism and Liberalization, The
Chilean Experiment, Rev. Ed., Chicago, University of Chicago Press.

32
32
Fallon, P, A Aksoy, Y Tsikata, P Belli and L Pereira da Silva, (1993) `South Africa:
Economic Performance and Some Policy Implications', World Bank Informal Discussion
Papers on Aspects of the Economy of South Africa.
Fallon, P and L Pereira da Silva, (1994), ‘South Africa: Economic Performance and
Policies’, Informal Discussion Papers on Aspects of the Economy of South Africa,
Discussion Paper No 7, World Bank, Washington, D C.
Fine, B. and Z. Rustomjee, (1996), The Political Economy of South Africa.
Johannesburg Witwatersrand Univeristy Press.
Fourie F and A Smith, (1993) `Concentration, Tariff Protection and Industrial Performance
in South Africa 1972 - 1988,' unpublished manuscript.
GATT (1993), Trade Policy Review, South Africa, Vol 1, Geneva.
Gouws, A. (1997), An Analysis of Export Support Measures with Special Reference to
South Africa; and the Impact of the General Export Incentive Scheme, unpublished Masters
Dissertation, University of Natal.
Grossman, G and Helpman E (1991), Innovation and Growth in the Global Economy,
Cambridge, MIT Press.
Harrison, A (1994), ‘Productivity, Imperfect Competition and Trade Reform’, Journal of
International Economics, 36.
Harrison, A and Revenga, A (1995), ‘The Effects of Trade Policy Reform: What do we
Really Know?’ Columbia University Conference on Economic Reform in Developing and
Transitional Economies.

33
33
Hirsch, A (1993) `Trade Pattern Trends: Manufactured Exports' Trade Monitoring
Project, No 1 February ,University of Cape Town.
Holden, M (1983), ‘Empirical Tests of the Heckscher - Ohlin model for South Africa - A
Reappraisal of the Methodology’, South African Journal of Economics, 51(2).
Holden, M, (1985), `The Choice of Exchange Rate Regime in a Small Open Economy,'
Occasional Paper, Economic Research Unit, University of Natal
Holden, M, (1990) `The Growth of Exports and Manufacturing in South Africa from 1947
to 1987' Development Southern Africa , Vol 7 No 3.
Holden, M, (1992), `The Structure and Incidence of Protection in South Africa' in P Black
and B Dollery, L̀eading Issues in South African Microeconomics' Southern Book
Publishers.
Holden, M, (1993), ‘Trade Policy and Industrial Restructuring in South Africa’, Paper
presented at the Western Economic Association Meetings, LakeTahoe.
Holden, M (1996), ‘Economic Integration and Trade Liberalization in Southern Africa: Is
there a Role for South Africa?’, World Bank Discussion Paper No. 342. Washington, D C.
Holden, M (1996), ‘Trade and Industrial Policy’, African Institute for Policy Analysis,
unpublished working paper.
Holden, M. and Holden P. (1981), ‘The Employment Effects of Different Trade Regimes in
South Africa’, South African Journal of Economics, 49(3).
Industrial Development Corporation (1990), `Modification of the Application of Protection
Policy,' June.

34
34
Industrial Development Corporation (1997), “Calculations of Effective Protection and Anti-
Export Bias’.
Joffe, A, D Kaplan, R Kaplinsky and D Lewis, (1993) `Meeting the Global Challenge: A
Framework for Industrial Revival in South Africa' Paper presented at the Aspen/Idasa
conference on South Africa's International Economic Relations in the 1990s.
Krueger, A, (1978) Foreign Trade Regimes and Economic Development:
Liberalisation Attempts and Consequences, NBER, Ballinger.
Krueger, A (1981), Trade and Employment in Developing Countries, Chicago,
University of Chicago Press.
Krueger, A, (1984) `Trade Policies in Developing Countries' in R Jones and P Kenen (ed)
Handbook of International Economics, North Holland.
Lall, S, (1993), `What will make South Africa internationally competititve?', Paper
presented at the Aspen/Idasa conference on South Africa's International Economic
Relations in the 1990s.
Levine and Renelt (1992), ‘A Sensitivity Analysis of Cross - Country Growth
Regressions’, American Economic Review, 82(4).
Levy, B, (1991) `How can South African Manufacturing Efficiently Create Employment?
An Analysis of the Impact of Trade and Industrial Policy, CECPS, World Bank
Michaely, M, D Papageorgiou and A Chokski, (1991) `Liberalising Foreign Trade :
Lessons of Experience in the Developing World' Vol 7 Blackwell.
Romer, P, (1992) `Two Strategies for Economic Development: Using Ideas vs Producing
Ideas, World Bank Annual Conference on Development Economics.

35
35
Rodrik, D, (1992) `The Limits of Trade Polciy Reform in Developing Countries', Journal
of Economic Perspectives, Vol 6 No1
Scheepers, C, (1969), `The Effect of Import Substitution on the Volume and Structure of
South Africa's Imports 1926/27 - 1963/64', Finance and Trade Review.
Scerri, M (1990), ‘R and D and the International Competitiveness of the South African
Manufacturing Sector’, South African Journal of Economics, Vol 58.
Thomas V and J Nash, (1991) `Reform of Trade Policy : Recent Evidence from Theory and
Practice, The World Bank Research Observer, Vol 6 No 2.
Tybout, J (1992), ‘Linking Trade and Productivity: New Research Directions’ World
Bank Economic Review, 6(2)
World Bank, (1991) World Development Report, New York, Oxford University Press.

36
36