african agricultural trade status report 2017: chapter 5. determinants of african agricultural...
TRANSCRIPT

Chapter 5. Determinants of African agricultural exports
Extracted from
African Agricultural Trade Status Report
2017

125
CHAPTER 5. DETERMINANTS OF AFRICAN AGRICULTURAL EXPORTS
Getaw Tadesse, International Food Policy Research Institute (IFPRI), Eastern and Southern
Africa Office, Addis Ababa, Ethiopia
Ousmane Badiane, International Food Policy Research Institute, Washington DC
5.1 Introduction
Trade is an important engine for economic growth, food security, reducing poverty and overall
development. However, it is a complex and sensitive subject for policymaking as it involves
negotiations, dialogues and agreements between partner countries residing in different socio-
political boundaries. It becomes more complicated when linked with agriculture, which is a sector
profoundly reliant on continuous social and ecological dynamism. Therefore, success in
agricultural trade heavily depends on the extent of understanding of the constraints facing
agriculture and its cross-broader trade.
Following the 1980s trade liberalizations, a series of studies have been conducted to document
agricultural trade trends, determinants and prospects both in Africa and elsewhere (Bouët, Bureau,
Decreux, & Jean, 2005; Bouët, Mishra, & Roy, 2008; Bureau, Jean, & Matthews, 2006; Croser &
Anderson, 2011; Moïsé, Delpeuch, Sorescu, Bottini, & Foch, 2013). These studies highlighted a
wide array of constraints that are crucially important for improving African agricultural trade.
More importantly they have indicated the importance of global trade policy actions and the need
to address the different trade constraints in a holistic manner. According to these studies,
agricultural trade determinants can be broadly classified into five major thematic areas, namely
production capacity, cost of trade, trade policies, domestic agricultural supports and global
market shocks. While production capacity and cost of trade are usually referred to as supply side
constraints, many trade policies (except export taxes) and agricultural supports in importing
countries are considered to be demand side constraints. Constraints related to global food, oil and
financial crises are taken as market level trade constraints. These constraints influence imports and
exports in different ways and to different extents both from the demand and supply sides.
Supply-side determinants limit the competitiveness of a country in global or regional markets by
increasing costs of production as well as costs of trading. These constraints include the nature and
extent of resource endowments, productivity (technology), quality of infrastructure and institutions

126
that facilitate trade, and domestic agricultural support services provided to smallholder producers
and traders in an exporting country. Demand side constraints usually emerge from trade protection
measures of importing countries. Africa exports more than 75 percent of its agricultural product
value outside of the continent. Many of its trade partners impose several trade protection measures
which directly or indirectly limit agricultural exports. This is particularly the case for certain
commodities such as tobacco, cotton, coffee, cocoa, and oilseeds, in which Africa has the
comparative advantage. Therefore, close monitoring of the extent and nature of these constraints
and their linkages with the flow of agricultural exports is required to guide effective evidence-
based trade policymaking in Africa.
The purpose of this chapter is to offer comprehensive and updated evidence to African agricultural
trade policy discussions through highlighting determinants that hinder the performance and
competitiveness of agricultural exports and underlining areas that should receive priority policy
attention at the continental, regional and national levels. Africa aspires to triple the current level
of regional agricultural trade by the year 2025, which requires a wide range of interventions in the
form of policies and investments. For these interventions to be effective and achieve the intended
targets, key areas of intervention have to be identified, prioritized and monitored regularly. In this
chapter, we attempt to review existing evidence, identify key determinants of trade in general, and
describe how these determinants are specifically important to African agricultural trade. In doing
so, we provide empirical evidence that shows the relative importance of trade constraints and
explains how the constraints are trending over time and varying across countries.
The chapter is structured as follows. The next section briefly reviews specific factors included in
each of the five major determinants of trade and their conceptual and empirical links with trade.
Following this section, the empirical assessment approach used to estimate the relative importance
of trade determinants is presented. This section explains the sources of data used, the variables
selected, and the overall results of gravity models estimated for global-Africa and intra-Africa
bilateral export trade. The subsequent section describes, discusses and tracks the major
determinants included in the gravity models. In this section, we discuss the significance of the
determinants, their magnitude and trends, and the conditions under which a factor becomes
detrimental. The last section summarizes major findings and draws conclusions that would help
policy dialogue and actions.

127
5.2 Review of trade determinants
The extent of agricultural exports has been constrained by many domestic and international factors
both from the demand and supply sides. Theoretical and empirical evidence suggests that these
factors can be broadly classified into five major thematic areas including production capacity, cost
of trade, trade policies, domestic agricultural supports and global market shocks. These
constraints influence imports and exports in different ways and at different magnitudes.
Production capacity refers to those factors that affect the production capacity of a country. These
factors include resource endowments and other technological and institutional factors that enhance
the productivity and comparative advantages of a country in global and regional markets. Both
classical and neoclassical theories have exhaustively explained the importance of comparative
advantage for improving performance of trade among countries. However, there has been strong
contention regarding the source of this production capacity and thereby the source of comparative
advantage. While the Ricardian hypothesis advocates the importance of technological (or
productivity) change as the major source of comparative advantage, the Heckscher-Ohlin
hypothesis argues for the importance of relative factor endowments as a prime source of trade.
According to the Ricardian theory, the relative efficiency of producing goods and services
determines the direction and magnitude of trade between two countries. In contrast, the Heckscher-
Ohlin factor endowment theory predicts that countries with an abundance of one or more of the
factors of production (land, labor and capital) will specialize in commodities that require much of
the abundant resources. However, empirical studies have confirmed that differences in
productivity (technology) and factor endowment explain a very small part of trade performance
variations over time and across countries (Bergstrand, 1990; Bernstein & Weinstein, 2002).
Moreover, recent evidence has suggested the importance of relative factor endowment over
productivity or technology to explain international trade (Amoroso, Chiquiar, & Ramos-Francia,
2011).
Cost of trade: factors that exacerbate costs of trade are very diverse. The two most important
factors that increase the cost of trade are poor infrastructure and institutional inefficiency related
to trade. Costs also include financial fees related to export and imports.
The role of infrastructure in enhancing trade has been widely discussed in policy circles and in the
literature (Bouët et al., 2008; Bougheas, Demetriades, & Mamuneas, 1999; Francois & Manchin,

128
2007; Moïsé et al., 2013). Empirical studies have generally confirmed positive and significant
effects of infrastructure quality in exporting countries on trade values. However, the relative
importance of infrastructural elements varies across studies. While road density has significant
positive effects on trade volumes of low income countries, the effect of mobile phone density has
been found to be less significant (Bouët et al., 2008).
Institutional efficiency refers to the ease of doing business in relation to agricultural imports and
exports. It includes procedures and delays in customs clearing, access to finance for traders, and
the strength of contractual enforcement. Although customs and administrative procedures are
essential for facilitating trade and implementing trade policies, they have the potential to restrict
trade, particularly in less developed countries where administrative systems are less automated,
capacitated and transparent. These procedures and requirements delay delivery and cause extra
costs related to storage costs and losses. Empirical studies have indicated that a 10 percent
reduction in the time spent to clear exports, the number of signatures required to clear exports, or
the number of documents needed to cross borders increases trade by 6 to 11 percent globally
(Wilson, 2007). Trade is more responsive to the number of documents than to the other metrics.
Trade policies include measures aimed at protecting trade through tariffs and non-tariff barriers.
The effect of tariffs on trade performance has been studied using economy-wide simulations (e.g.
Bouët, Bureau, et al., 2005), gravity equations (e.g. Bouët et al., 2008), and trade restrictiveness
indexes (e.g.Croser & Anderson, 2011). Although the magnitudes are different, all of the studies
indicated that the effect of import taxes on trade volumes is convincingly negative and significant.
Bilateral, regional and international trade agreements are also part of tariff policies that either
reduce tariffs through Free Trade Agreements (FTA) or facilitate cross border trade. The most
important of these agreements are trade preferences, particularly the non-reciprocal ones which
target opening markets to individual or sets of developing countries. This involves complete or
partial lifting of import tariffs and quotas for specified products. Preferences are usually designed
to offer commercial opportunities for poor countries. However, preferences are widely criticized
for not being utilized due to rules of origin, their focus on commodities for which developing
countries have little competitive advantage, and the presence of associated stringent standards
related to sanitary and phytosanitary requirements (Brenton, 2003; Panagariya, 2003; Topp, 2003).
Despite these critics, some recent studies have shown that preferences are still useful and beneficial

129
to less developed countries, particularly to countries in Africa south of the Sahara (Bouët,
Fontagné, & Jean, 2005; Bouët, Laborde, Dienesch, & Elliott, 2012; Wainio & Gehlhar, 2004).
Non-tariff measures include those trade barriers that limit the quantity and volume of imports
through a variety of technical and non-technical standards. UNCTAD classifies non-tariff trade
measures into sixteen broad categories, each of which constitutes several specific classifications.
The major ones are sanitary and phytosanitary (SPS) requirements, technical barriers to trade
(TBT) which include packing, labeling and standardizing, price controls (anti-dumping), licensing,
quantitative restrictions, export subsidies and export taxes. Non-tariff barriers constrain trade
through increasing the cost of inspection, certification and testing. This is particularly important
for developing countries which have poor quality assurance infrastructure and technological
capacity to conduct these processes and hence have to recruit third parties to access the services.
Domestic agricultural supports: Both developed and developing countries provide financial and
technical support to their agricultural producers for different reasons. However, the support
provided by industrial countries to protect their agricultural sectors has been considered to be the
most damaging for trade from developing countries. Supports in these countries take the form of
border measures (import tariffs, export subsidies) and domestic measures (production and input
subsidies). Domestic supports can be implemented through markets or through direct payments.
Both approaches have the potential to reduce the amount of imports from foreign countries. These
supports raise the price received by the producers of the supported country above the world price
so that they become artificially more competitive than imports from outside of the country.
Empirical studies assessing the link between domestic subsides and trade have revealed mixed
results depending on the type of support (coupled or decoupled) and commodity. Many have
argued that the removal of EU and US agricultural subsidies could have a significant effect on
world prices of some commodities such as cotton, tobacco and soybean (Bouët, Bureau, et al.,
2005; Bureau et al., 2006). However, the impact of domestic subsidies is lower than other cross-
border measures (Anderson & Martin, 2005; Hoekman, Ng, & Olarreaga, 2004).
Payments less related to the quantity produced (decoupled) have lesser impacts than payments
directly related to production (coupled); as a result many OECD countries are moving towards
payments which are less tied to the quantity of domestic production (Urban, Jensen, & Brockmeier,
2016).

130
Developing countries do also provide technical, financial and institutional support to smallholder
producers to boost productivity and improve market efficiency, thereby enhancing agricultural
exports. The extent of agricultural support provided to smallholders depends on the size, allocation
and efficiency of public agricultural expenditure. Agricultural public expenditure serves to
accumulate capital stock that would enhance the production as well as trading capacity of
smallholder producers (Benin, Mogues, & Fan, 2012). However, the actual effect on trade depends
on the focus and efficiency of public investments. Investments focused on export sectors would
likely improve trade more than those investments focused on domestic food production or food
security.
Global market shocks: Global food, financial and oil markets are increasingly interconnected
(Tadesse, Algieri, Kalkuhl, & Braun, 2014). Shocks to any of these markets would likely affect
the nature and extent of agricultural trade. The 2007/2008 food price crisis, for example, has caused
many countries to impose export barriers and relax import restrictions on food products, which has
further aggravated the problem of price spikes and adversely affected agricultural trade (Anderson,
2014; Anderson & Nelgen, 2012; Anderson & Thennakoon, 2015; Bouet & Laborde, 2012; Yu,
Tokgoz, Wailes, & Chavez, 2011). Similarly, the ongoing oil price crises may also affect the extent
of agricultural exports, particularly in those countries which are oil dependent. When the oil price
is declining, oil dependent countries would likely attempt to shift export dependence from oil to
agricultural products, for which prices are relatively stable.
5.3 Empirical assessment
5.3.1Data and methods
We used gravity-type econometric equations to examine the empirical and relative relevance of
the determinants listed above in the African context. The models are used to estimate the logarithm
of bilateral agricultural export values of African countries over a number of demand and supply
side factors. In addition to the four14 major thematic determinants explained above, scale variables
are included to control for the size of importing and exporting economies and income differences
between trading partners. Two to five specific variables were chosen to proxy each of the major
thematic determinants. Total GDP of both importing and exporting countries are used to proxy the
14 Variables to represent the fifth thematic determinant, global market shocks, are not considered due to their
invariability across countries. These variables can be captured in a time-series setting.

131
size of the economies of partnering countries. While GDP per capita in importing countries is used
to capture income effects, GDP per capita in exporting countries is used as a proxy for capital
endowment. Other assets such as farm machinery, irrigation facilities, etc., would have been a
good indicator of capital for agriculture, but the data on these variables suffers from a large number
of missing values. Quantity of land and labor are included to measure resource endowments; road
density, quality of port, index of trade infrastructural quality, index of customs clearing efficiency
and financial fees for exporting are used to measure costs of trade; frequency of non-tariff
measures, average ad valorem equivalent tariff rates and regional trade agreements are considered
to proxy external trade policy; and the ratio of the agricultural producer price index to the
manufacturing producer price index of importing countries and agricultural public expenditure of
exporting countries are used to measure the effect of domestic agricultural policy in importing and
exporting countries respectively. The list of determinants considered in the analysis and the metrics
used to estimate their magnitudes are described in Annex 1.
Data used in this analysis are obtained from different sources, mainly from World Bank World
Development Indicators (WDI), UN Comtrade, and World Integrated Trade Solution (WITS).
While data on income, resource endowments, infrastructure and efficiency of institutions are
gathered from World Bank WDI, UN Comtrade is used for trade data, and data on tariffs were
extracted from WITS. Other sources such as WTO, ReSAKSS, FAOSTAT, and OECD are used
for data on specific variables such as non-tariff barriers, public agricultural expenditure, producer
price indices and producer support estimates (PSE) respectively. The quality of trade data in Africa
has always been a big concern as sizable cross-border transactions are carried out informally and
unrecorded. However, the purpose of this chapter is not to show the size of trade, but rather to look
into the determinants of export flows. Thus, as long as the omitted trade transactions are random,
they will have little impact on our results. All export values are for agricultural products unless
and otherwise mentioned.
All the regressions are estimated using cross sectional data from 2013, which is the most recent
year for which adequate data are available for many of the determinants. However, one year lagged
values are used for some variables (productivity and public agricultural expenditure) which are
deemed to be endogenous to export values. Visualization of trade data over years indicates that
there were no extraordinary events in 2013 that could bias the results.

132
Two groups of models are estimated. The first group is used to estimate African agricultural
exports to the global market. In this models, only African countries are included as exporters ( i ).
In addition to African countries, countries from all continents which had frequent transactions with
Africa are included as importers ( j ). In general, a total of 49 exporters15 and 161 trade partners
are considered. The second group of models is used to estimate intra-African exports, with African
countries as both exporters and importers. We also estimated African exports to the rest of the
world for comparison purposes.
Of all possible pairwise transactions between 49 exporting countries and 161 importing countries,
about 58 percent have zero trade transactions. Excluding these transactions would likely cause
selection bias, while inclusion of them would cause censoring bias. Though previous studies have
excluded them and tried to control the selection bias using the Heckman approach, we choose to
include them in the analysis and address the censoring bias using a Tobit model approach. We
assume zero trade is an optimal outcome instead of a strategic choice of a country not to trade with
a specific partner.
Due to multiple data sources for different variables, the dataset is seriously affected by missing
values. To overcome the problem of missing values, several specifications are considered through
step-wise inclusion of explanatory variables, which have different sets of observations and
represent specific sets of determinants. A total of six specifications are estimated for African global
exports.
The first model estimates the effect of resource endowments together with scale variables. The
second model includes infrastructural and institutional variables in addition to the variables in
model one. The third model adds public agricultural expenditure and hence represents a domestic
trade model in which only domestic (supply side) constraints are included. The fourth model
includes international (demand side) variables such as non-tariff barriers, tariffs and regional trade
agreements. The fifth and sixth models are Tobit specifications without and with the agriculture-
to-manufacturing price ratio variable that represents domestic agricultural supports by OECD
15 Five southern Africa countries (Lesotho, South Africa, Botswana, Namibia and Swaziland) are treated as one
country as they have a common customs union called SACU. Trade data in many sources is reported for the five
countries together; for other variables we use the average or the sum of all or some of the countries, depending on the
variable.
133
countries. Since the price ratio is calculated only for OECD countries, the number of observations
is greatly reduced in the final specification.
5.3.2 Empirical Results
Table 5.1 shows results of the six specifications for African global agricultural exports. The
columns, denoted by the numbers 1 to 6, present the results of different specifications that could
help to test robustness under different numbers of observations and examine the predictive power
of additional variables. In general, many determinants show the theoretically expected signs,
except resource endowment variables. Variables related to infrastructure and institutional
efficiency are more significant than other domestic factors. These variables explain about 11
percent of the variation in agricultural export growth among African countries. Public expenditure
in agriculture appears to have positive and generally significant effect on trade. Trade policy
variables appear to be important determinants, next to the cost of trade, though there exists
significant variation between policy instruments. Non-tariff barriers and regional trade agreements
appear more important than tariffs. Resource endowment seems to be a less important factor for
African agricultural trade. The effect of producer price ratios which represent domestic agricultural
support in importing countries seems significant, but requires further explanation.
Table 5.2 shows results of intra-Africa trade determinants in comparison with African exports to
the rest of the world. In this case, we used the comprehensive models (four and five), as agriculture-
to-manufacturing price ratios are not available for most African countries. The results indicate that
many of the determinants are equally important for African exports either within Africa or outside
of Africa. The level of per capita income in importing countries is more relevant for intra-African
trade than for African exports to the rest of the world. Similarly, resource endowments and non-
tariff barriers are not as relevant for intra-African trade as they are for African trade with countries
in other regions. This is consistent with the facts that resource endowments within Africa are
closely similar and non-tariff barriers are not stringent as they are outside of Africa. We also learn
that public expenditures in agriculture are more relevant to reach markets outside of Africa than
markets within Africa.
Since the determinants for intra-African and global African exports are similar, in the subsequent
section we discuss why some variables are significant over the others, and track trends and

134
distributions of key determinants using the results of the global-Africa agricultural export
estimations. However, we briefly discuss the importance of a determinant for intra-Africa trade
whenever necessary.

135
Table 5.1. Response of African global agricultural export value to domestic and international
factors
Determinants
Logarithm of value of exports from i countries to j countries
OLS Tobit
(1) (2) (3) (4) (5) (6)
Importer’s GDP (billions of US$) 1.57*** 1.65*** 2.16*** 2.23*** 3.35*** 2.70***
Exporter’s GDP (billions of US$) 0.79*** 0.88*** 0.92*** 1.19*** 1.80*** 1.48***
Per capita GDP of exporters (US$) -
1.14*** -1.17*** -2.11*** -2.30*** -3.63***
-
2.67***
Per capita GDP of importers(US$) -
0.10*** -0.12*** -0.13*** 0.03 -0.04 -0.21
Arable land (millions of hectares) -
0.52*** -0.69*** -0.52*** -0.47*** -0.52***
-
0.91***
Agricultural labor (millions) -0.02 0.25*** -0.38** -0.43** -0.77*** 0.05
Road density (km per km2 of land) 0.01 -0.03 -0.02 0.03 0.37***
Quality of port 4.43*** 4.26*** 4.62*** 6.94*** 8.63***
Quality of transport infrastructure 1.80*** 1.17** 1.15** 0.82 1.47
Efficiency of customs clearing index 1.24*** 1.64*** 1.69*** 3.81*** 0.03
Export cost ($US per container) -0.05 -0.07 -0.01 -0.27 -0.13
PAE per agricultural GDP of exporter 0.12** 0.16** 0.46*** 0.28*
Incidence of importer’s non-tariff
barriers -0.32*** -0.39***
-
0.32***
Average tariff rate of importer -0.06 -0.18* -
0.46***
Being in a similar REC 3.52*** 5.39*** 5.24***
The ratio of agricultural PPI to
manufacturing PPI
-
5.96***
Constant 5.44*** -2.43* 3.30* 1.66 0.9 -1.44
Sigma (test for censoring) 4.32*** 3.21***
R-squared 0.30 0.41 0.41 0.49
N 6552 4836 4524 3113 3113 754
Note: All the determinants except REC are in logarithmic form and hence the coefficients are elasticities. i countries
refer to the 49 exporting African countries andjcountries include importing countries all over the world. PPI denotes
Producer Price Index and PAE denotes Public Agricultural Expenditure. The lagged value of PAE is used to control
for possible endogeneity.

136
Table 5.2. Determinants of intra-Africa agricultural exports
Determinants
Intra-Africa export African export to the rest of
the world
OLS Tobit OLS Tobit
Importer’s GDP (billions of US$) 1.91*** 2.75*** 2.31*** 3.48***
Exporter’s GDP (billions of US$) 0.32** 0.44* 1.22*** 1.84***
Per capita GDP of exporters (US$) -1.39** -1.89* -2.51*** -4.03***
Per capita GDP of importers(US$) 1.24*** 2.24*** 0.01 -0.06
Arable land (millions of hectares) -0.21 -0.1 -0.53*** -0.62***
Agricultural labor (millions) -0.43 -0.54 -0.43** -0.81***
Road density (km per km2 of land) -0.22 -0.37 0.03 0.12
Quality of port 4.46*** 6.83*** 4.68*** 7.05***
Quality of transport infrastructure 0.71 -0.45 1.26** 1.13
Efficiency of customs clearing index 2.39* 5.45** 1.51** 3.39***
Export cost ($US per container) -0.14 -0.63 0.02 -0.18
PAE per agricultural GDP of exporter 0.2 0.62** 0.14** 0.41***
Incidence of importer’s non-tariff barriers 0.2 0.24 -0.35*** -0.39***
Average tariff rate of importer 0.53*** 0.95*** -0.11 -0.32***
Being in a similar REC 3.55*** 5.68***
Constant -9.64* -20.95** 2.62 2.49
sigma 4.53*** 4.13***
R-squared 0.435 0.519
N 619 619 2494 2494
Note: All the determinants except REC are in logarithmic form and hence the coefficients are elasticities. i countries
refer to the 49 exporting African countries andjcountries include importing African countries for intra-African
trade and importing countries outside of Africa for export to the rest of the world. PAE denotes Public Agricultural
Expenditure. The lagged value of PAE is used to control for possible endogeneity.

137
5.4 Describing and tracking key determinants
5.4.1 Resource endowment and productivity
As this study exclusively considers agricultural products, we assume that agriculture is land and
labor intensive in the African context but less capital intensive compared to other sectors’ products,
expecting a negative effect of capital and positive effects of land and labor on agricultural exports.
However, all three resource endowment variables, labor, land and capital (represented by
exporters’ per capita income), show negative effects on agricultural exports (see Table 5.1).
According to this result, countries with higher per capita income are less likely to export
agricultural products than countries with lower per capita income. This is in line with the relative
resource endowment theory which predicts that a country specializes in an industry that requires
less of the scarcest resource in the country. Hence, while countries grow (accumulate capital), their
export portfolio shifts from agriculture (less capital intensive) to sectors which are more capital
intensive. Thus, capital endowment reduces exports of primary agricultural products.
The results also suggest that countries with scarce arable land and agricultural labor export more
than countries with abundant agricultural land and labor endowments. The negative effect of land
on agricultural exports is due to the exclusion of land productivity from the models. When land
and labor productivity are included in the model, the results become significantly different (Table
5.3). If productivity is controlled for, land positively affects the performance of agricultural exports
both to the world and African markets. The elasticity is greater for intra-African trade than for
global trade. The impact of labor has remained negative. Labor-abundant countries export less than
labor-scarce countries, keeping productivity constant. This could be due to the fact that African
agriculture is not labor intensive as we expected. Alternatively, in an area where labor is abundant
with low productivity, agricultural production may serve only for household subsistence without
any significant contribution to exports.
Similarly, while countries with high land productivity export at a higher rate than countries with
low land productivity, countries with high labor productivity export at a lower rate than countries
with low labor productivity. Labor productivity negatively affects trade, probably because
wherever the productivity of labor is high, the local market becomes more attractive to producers
than the export market. Increased agricultural labor productivity might be good for reducing
poverty, but it seems to negatively affect agricultural export performance in Africa. But the

138
negative effect may indicate the extent of economic transformation. Countries with higher labor
productivity are countries in which economic activity is shifting to the non-agricultural sector, and
hence the composition of their exports is shifting from agricultural to non-agricultural products.
All these imply that while availability of arable land and increased land productivity can positively
affect agricultural trade, having abundant labor alone does not necessarily lead to higher trade;
rather it may retard the continent’s global as well as intra-regional trade. Moreover, trade seems
more elastic for land productivity than land availability, implying that investment in land
productivity-enhancing technologies or institutions would help not only to increase farmers’
income but also to boost regional trade. A 1 percent increase in land productivity increases trade
flows by about 6 percent to the global market and 7 percent to the African market. Land
productivity has a stronger effect on intra-African trade than on global trade, which further
explains the importance of improving land productivity to triple intra-African trade. This is
because many African countries have similar resource endowments and closely similar trade
facilities, so their competitiveness in regional trade mainly depends on the extent of agricultural
productivity.
Table 5.3. African agricultural export response to land and labor endowments and productivity
(elasticity)
Endowment and productivity indicators Global trade Intra-African trade
(3) (7) (8) (9) (10)
Arable land (millions of hectares) -0.52*** 5.82*** 7.15***
Agricultural labor (millions) -0.38** -6.00*** -6.88***
Land productivity (US$ per ha) 6.24*** 0.56*** 7.21*** 0.35***
Labor productivity (US$ per person) -6.43*** -0.13 -7.40*** 0.00
R-squared 0.41 0.49 0.51 0.44 0.44
N 4524 3113 3435 3101 3397
Source: Authors’ estimation based on international sources
Note: Global trade denotes bilateral trade between African countries and selected countries globally, including other
African countries. Intra-African trade denotes trade among African countries only. Estimations include additional
variables for which results are not presented here.

139
5.4.2 Infrastructural quality and institutional efficiency
Variables addressing the quality of ports and transport, road density, efficiency of customs
clearing, and financial export costs have explained a significant part of the variation in agricultural
export performance among African countries (Table 5.1). However, there appear to be significant
differences among cost indicators in explaining trade flows. On one hand, road density and
financial export costs do not have statistically significant effects on export growth. On the other
hand, the quality of port infrastructure and the efficiency of customs clearing consistently and
positively affect trade performance.
Since the cost of trade affects not only export performance but also trade competitiveness, which
is defined as the ratio of a country’s exports to total African exports to the world or to the African
market, further analysis is made to shed light on how cost indicators affect the competiveness of a
country in global and regional markets.
Table 5.4 presents the effects of trade cost indicators on global and regional competiveness. From
these results, it is obvious that although road density and financial export costs have no effect on
export volumes, they do have significant effects on competiveness. This is particularly significant
when it comes to financial payments to clear exports. Financial export costs include all costs
exporters pay for documents, administrative fees for customs clearance and technical control,
customs brokers, terminal handling charges, and inland transport, and these costs are found to be
very crucial for trade competiveness. The lower these fees, the more likely a country becomes
competitive both in regional and global markets. Unfortunately, financial fees for exports are
increasing over time in Africa South of the Sahara (SSA) (Figure 5.1). Sixteen African countries
do not have their own ports. These countries incur higher per unit financial export costs than costal
countries. The cost gap between these groups of countries is widening over time. Lack of port
access may induce preferential fees for port services and increase inland transport costs, thereby
raising export costs. It also creates business insecurity.

140
Table 5.4. Effect of trade costs on agricultural trade competiveness in Africa (elasticity)
Cost indicators
Share of country i ’s supply in total African supply to
Global markets African markets
Road density (km per km2 of land) 0.002*** 0.003***
Quality of port 0.105*** 0.118***
Quality of transport infrastructure -0.003 0.000
Efficiency of customs clearing index -0.016*** -0.019**
Financial fees for export ($US per container) -0.004*** -0.006***
Source: Authors’ estimation based on international sources
Note: Estimations include additional variables for which results are not presented here.
Figure 5.1. Trends of average financial costs for export in SSA
Source: Authors’ calculation based on World Bank Development Indicators
Note: Land locked countries are those SSA countries which do not have their own ports. Costal countries are all SSA
countries which have their own port(s).
Although the effect of road density on export performance was insignificant in most specifications
(Table 5.1), it appears to have a strong and positive effect on competiveness (Table 5.4). This
100
02
00
03
00
04
00
0
US
$ p
er
co
nta
iner
2006 2008 2010 2012 2014
SSA Landlocked countries Costal countries
Figure 1. Trends of average financial costs for export in SSA

141
could be due to the fact that the African road networks are biased to connect local markets more
than regional markets (Gwilliam et al., 2008).
Even though domestic road networks have improved in many African countries over the past two
decades, they are not well-connected to the regional roads, and hence they failed to increase export
volumes but still contribute to the country’s competiveness. Unlike export volumes, which depend
primarily on external efficiency, competitiveness depends mainly on internal efficiency. A country
might be competitive compared to other producers but its export volumes may not grow at a faster
rate than others. This is exactly what the road density results demonstrate. Improved road density
improves a country’s internal competiveness to supply cheaper products to external markets, so
that the share of that country is higher than those of countries with lower road density. However,
since the roads do not adequately connect local markets with regional or global markets, their
effect on absolute export volumes remains insignificant. Despite the significance of road density,
Africa still remains poorly connected both internally and externally. According to the World Bank
Rural Accessibility Index, only 34 percent of the rural population in Africa South of the Sahara
lives within 2 kilometers of an all-weather road (Carruthers, Krishnamani, & Murray, 2010).
Port quality has remained important both for absolute export volumes (Table 5.1) and trade
competiveness (Table 5.4). However, Africa has the lowest port quality of all regions. Based on
the quality of port infrastructure, the World Bank classifies ports into 7 groups, 1 being extremely
underdeveloped and 7 being considered efficient by international standards. According to this
classification Africa South of the Sahara scores 3.65, which is 13 percent below the world average
and 29 percent below the average for high income countries. This indicates an urgent need for
African countries to invest in port infrastructure to improve both regional and global trade.
Other variables related to transport infrastructure and institutional efficiency are important for
export growth but not for competiveness (Table 5.4). The negative effect of institutional efficiency
on competiveness is very hard to explain. The institutional efficiency indicator is developed based
on the number of documents, number of signatures and number of days required to clear customs,
both for imports and exports. The mix of these requirements may explain how the institutional
efficiency index is related to trade competiveness.

142
Figure 5.2. Number of days and documents needed to clear exports
Source: Authors’ calculation based on World Bank World Development Indicators
Note: HIC refers to high income countries and LDCs to least developed countries according to the UN classification.
Values refer to the mean of an average country in the group.
Figure 5.2 shows the number of documents and number of days required for clearing exports across
different regions. In many instances, more requirements are imposed on imports than exports for
all indicators. SSA has the highest requirements for all indicators compared to other regions. On
average it takes more than 32 days to clear exports in Africa South of the Sahara as compared to
less than 10 for high-income countries and 27 days in all least developed countries. We observe
significant differences across regional economic communities, the worst being SADC member
states in which an average export takes close to 50 days. The same is true for the number of
documents required to clear exports. However, both indicators are declining over time (Figure
5.3). The number of documents has already declined from nine on average in 2006 to seven in
2010 and remained constant thereafter. It seems that countries’ progress in improving customs
clearing processes has stalled. The number of days continues to decline from 36 in 2006 to below
30 days in 2014, but the rate of decline remains very slow.
4.5
12.7
7
27.4
7.4
27.8
7.4
30.7
7.5
32.4
7.5
33.3
8.3
41.2
8.3
49.50
10
20
30
40
50
mea
n 2
00
6-2
01
4
HIC
LD
Cs
EC
OW
AS
Afr
ica
SS
A
CO
ME
SA
EC
CA
S
SA
DC
Figure 2. Number of days and documents needed to clear exports
Documents Days

143
Figure 5.3. Trends of export clearing efficiency in Africa South of the Sahara
Source: Authors’ calculation based on World Bank World Development Indicators
5.4.3 Public Agricultural Expenditure
The effect of domestic agricultural support in exporting countries could be an important
determinant of export growth in developing countries due to the fact that farmers and traders in
these countries are poor and less commercialized, and therefore less able to facilitate production
and trade by themselves. The support provided in these countries is different from the support
provided in high income countries. In developing countries support is given to facilitate provision
of agricultural extension, advisory, market access and financial services. Public agricultural
expenditure (PAE) is used as a proxy variable to measure the significance of government support
in promoting agricultural exports in Africa. The empirical results reveal that there exists a positive
and statistically significant association between PAE and export growth. On average a 10 percent
increase in public agricultural expenditure relative to agricultural GDP increases agricultural
exports in the following year by about 2 to 4 percent.
The correlation between public agricultural spending and export performance significantly varies
across countries. Figure 5.4 illustrates the correlation coefficients for selected African countries
calculated using time series data for the last ten years. Unexpectedly, public agricultural
expenditure has no or negative correlation with exports in many countries. While Ethiopia stands
30
32
34
36
Nu
mb
er
of da
ys
7.4
7.6
7.8
88
.2
Nu
mb
er
of do
cu
me
nts
2006 2008 2010 2012 2014
Number of documents Number of days
Figure 3. Trends of export clearing efficiency in Africa South of the Sahara

144
out as the country with the largest negative correlation, Rwanda takes the leading role as the most
successful country on the positive end.
Many factors could explain why countries experience a negative correlation. First, these countries
might have focused more on domestic food security and hence, public expenditure has little or no
relevance in promoting external trade. This is the case in Ethiopia, where a significant part of the
public budget is allocated to mega food security projects such as the Productive Safety Net
Program (PSNP) and extension personnel who primarily provide services for food crop production.
The country’s competitive commodities such as coffee, oilseeds, and hides and skins have been
receiving very little budget allocation, relative to their importance to exports. Second, these
countries’ investments in export commodities might be less efficient in facilitating trade and
production. Third, a decline in the terms of trade could explain part of the paradox, but empirically
this should have little contribution to the negative correlation.
On the other end of the graph (Figure 5.4), there are many countries which are able to utilize the
public budget to motivate agricultural exports. Rwanda is followed by Liberia, Ghana, and
Zimbabwe, in which expenditures and exports are strongly correlated, with coefficients above 0.8.
Policymakers aiming to achieve the Malabo target may consider having a preferential public
expenditure allocation towards commodities in which they have competitive advantage, and
should balance investments in domestic food self-sufficiency (non-tradables) and the export sector
(tradables).

145
Figure 5.4. Correlation between public agricultural expenditure and agricultural exports
Source: Authors’ estimation based UNCOMTRADE export data and ReSAKSS public expenditure data.
Note: Correlations are calculated between current export values and previous year’s public expenditure.
5.4.4 Regional trade agreements
Regional trade agreements remove or reduce tariffs and facilitate joint trade for member states of
Regional Economic Communities (RECs). These agreements create trade within the trade
agreement zone and divert imports from the rest of the world. Empirical results have shown that
the trade creation effect of African RECs such as COMESA, ECOWAS, SADC and ECCAS are
stronger than their trade diversion effects (Figure 5.5). The overall trade creation effect as captured
by the variable REC, which takes 1 if the importing and exporting countries are from the same
RECs and zero otherwise, has a positive and statistically and economically significant effect on
export growth. Being a member of any of the RECs increases a country’s export value by 3 to 5
percent. This effect captures not only the effect of free trade agreements but also the effect of trade
facilitations commonly targeted for cross-border trade. Countries within the same REC are
geographically closer to each other, and hence this variable may also capture proximity effects as
well. In any case, the trade creation effects of African RECs are convincingly large and significant.
-1-.5
0.5
1
Corre
latio
n co
effic
ent
Ethi
opia
Moz
ambi
que
Gui
nea
Equa
toria
l Gui
nea
Cong
o
Nige
ria
Buru
ndi
Mau
ritan
ia
DRC
Gui
nea-
Biss
au
Eritr
ea
Nige
r
Tuni
sia
Cent
ral A
frica
Mau
ritiu
s
Sene
gal
Burk
ina
Faso
Togo
Keny
a
Gam
bia
Cote
d'iv
ore
Ugan
da
Mal
awi
Zim
babw
e
Gha
na
Libe
ria
Rwan
da
Figure 4. Correlation between public agricultural expenditure and agricultural export

146
Figure 5.5. Trade creation and diversion effects of RECs in Africa
Note: The values under “REC” indicate the trade creation effects of all communities. REC is a dummy variable that
takes the value 1 if both importing and exporting countries are from the same REC and 0 otherwise. Effects denoted
by each of the RECs indicate the trade diversion effects. For example, the value under “COMESA” indicates the effect
of a variable that takes 1 if the importing country is a COMESA member and the exporting country is a non-member
and 0 otherwise, and hence measures the trade diversion effect of COMESA. The same holds for the other RECs. The
graph shows coefficients and 95 percent confidence intervals. If zero is included within the confidence interval, the
coefficient is interpreted as statistically insignificant.
The trade diversion effects of these RECs are not yet significant and uniform. The effects were
captured by including dummy variables for each REC that take the value of 1 if the importing
country is a member of a given REC and the exporting country is not, and zero otherwise. This
variable measures openness of member states to non-member states. As shown in Figure 5.5, the
variable representing ECOWAS has a significant and positive effect on exports, implying that
being a member of ECOWAS makes countries open to non-member states, signifying a positive
trade diversion effect. SADC has a protective effect, but it is only significant at 10 percent (90
percent confidence interval). COMESA and ECCAS have shown negative diversion effects, which
may imply import protecting effects to the detriment of non-member states, but the coefficients
are not statistically significant. The results are consistent with previous evidence (Makochekanwa,
2012). Since welfare depends on the extent of both trade diversion and trade creation, policymakers
REC
COMESA
ECOWAS
SADC
ECCAS
-1 0 1 2 3 4Coefficencts
Figure 5. Trade creation and diversion effects of regional economic comunities in Africa

147
should target increasing the diversion as well as the creation effects. Internal institutions and
efficiency may explain the differential effects of RECs on trade diversion.
5.4.5 Tariffs and Preferences
Despite declining trends in tariff rates imposed on agricultural products worldwide, tariffs are still
important determinants of trade. According to our estimation (Table 5.1), a 10 percent increase in
tariff rates reduces African agricultural exports by about 3 percent, which is closely similar to
previous studies (Bouët et al., 2008; Moïsé et al., 2013). Luckily, Africa, particularly SSA, is
increasingly receiving tariff preferences from importing countries. Figure 5.6 shows the average
tariff rates imposed by selected countries on agricultural products imported from the world as a
whole, least developed countries (LDCs), and SSA. Though India and Pakistan impose the largest
tariff rates on agricultural imports globally, they impose lower tariff rates for imports from SSA
than imports from the world. Other countries such as the US, Canada and Russia also impose lower
average duties on imports from SSA. As expected, SSA countries impose lower taxes on imports
from the region than imports from outside the region.
Figure 5.6. Tariff rates imposed by major African trade partners on agricultural imports
Source: Authors’ estimation based on WITS data. Note: Tariff rates are weighted averages based on amount of
imports. Each country or group of countries levies different rates for different countries for the same product. The
rates are averaged for three groups: for all countries, for LDCs and for SSA.
0 10 20 30Percent (weighted average)
Australia
Malaysia
US
Japan
Middle East
Russia
EU
Canada
China
Pakistan
SSA
Turkey
India
Figure 6. Tariff rates imposed by major African trade partners on agricultural imports
On all countries On LDCs On SSA
148
In some countries and regions, including the EU, China and the Middle East, agricultural products
from SSA are being taxed more than the world average. This could be due to the fact that
preferences, especially by the EU, are given for selected products and that preference rates are
exceeded by the tariff rates imposed on non-preferential products. In many countries, African
products are taxed at higher rates than the average for LDCs. This indicates that although several
preferences are enacted in the EU and the US, African products are still highly taxed compared to
other developing countries. Most importantly, SSA countries impose import tax on other SSA
countries at a higher rate than they impose on all LDCs. This implies that some African countries
are providing a lower tax rate for non-African countries than they impose on African countries.
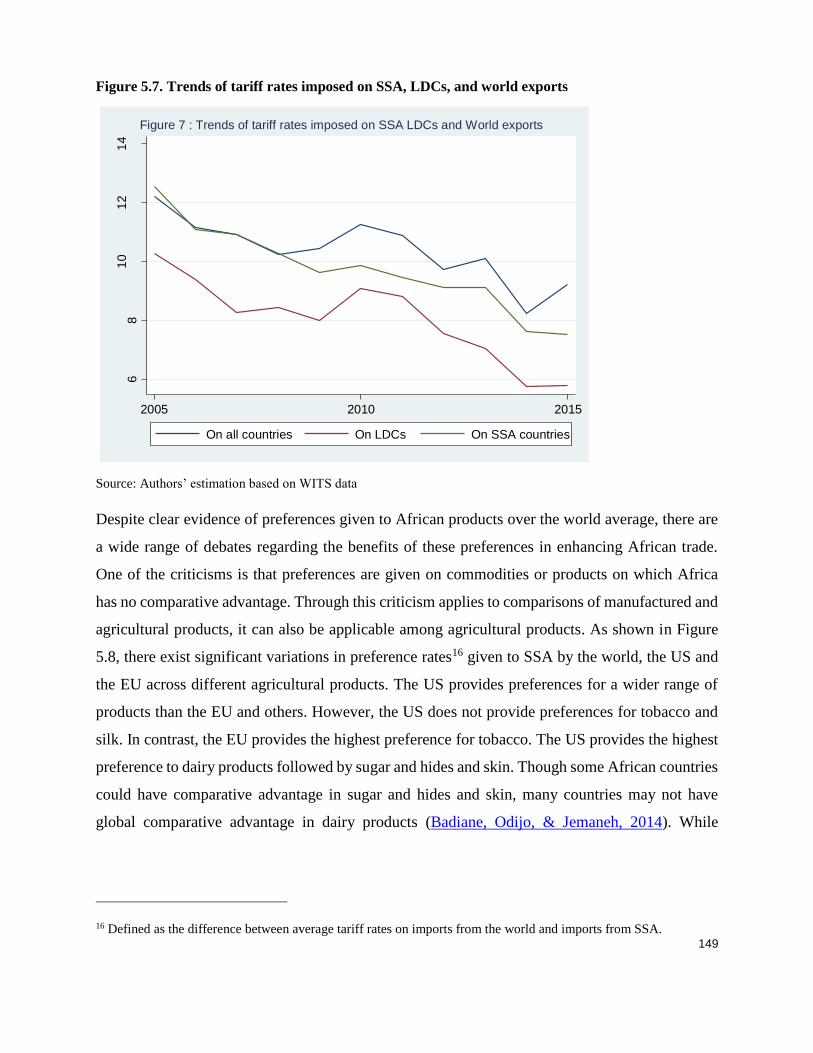
Tariff rates applicable on imports of agricultural products from any part of the world are sharply
declining (Figure 5.7). Average tariff rates declined from above 12 percent in 2005 to close to 8
percent in 2014, which indicates a 3 percent annual rate of decline. Multilateral negotiations
through WTO and the increasing global food demand as demonstrated by the food price crisis in
2007/2008 might have contributed to this effect.
The decline is proportionally similar among the rates applicable to the whole world, SSA and
LDCs. Globally, African products are being taxed at lower rates than the world average since 2009
and the gap between these tax rates has widened since then.
149
Figure 5.7. Trends of tariff rates imposed on SSA, LDCs, and world exports
Source: Authors’ estimation based on WITS data
Despite clear evidence of preferences given to African products over the world average, there are
a wide range of debates regarding the benefits of these preferences in enhancing African trade.
One of the criticisms is that preferences are given on commodities or products on which Africa
has no comparative advantage. Through this criticism applies to comparisons of manufactured and
agricultural products, it can also be applicable among agricultural products. As shown in Figure
5.8, there exist significant variations in preference rates16 given to SSA by the world, the US and
the EU across different agricultural products. The US provides preferences for a wider range of
products than the EU and others. However, the US does not provide preferences for tobacco and
silk. In contrast, the EU provides the highest preference for tobacco. The US provides the highest
preference to dairy products followed by sugar and hides and skin. Though some African countries
could have comparative advantage in sugar and hides and skin, many countries may not have
global comparative advantage in dairy products (Badiane, Odijo, & Jemaneh, 2014). While
16 Defined as the difference between average tariff rates on imports from the world and imports from SSA.
68
10
12
14
%, ave
rag
e
2005 2010 2015
On all countries On LDCs On SSA countries
Figure 7 : Trends of tariff rates imposed on SSA LDCs and World exports

150
preference rates for cocoa are reasonably significant, preference rates for coffee and tea are
minimal, confirming that preferences are given irrespective of comparative advantage.
Figure 5.8. Rates of preference given to SSA exports for major products
Source: Authors’ estimation based on WITS data
Note: Values (rates of preferences) are calculated as average tariff rates imposed by all countries (world), the EU and
the US on world imports minus tariff rates imposed on SSA imports.
5.4.6 Non-tariff barriers (NTBs)
There is much empirical evidence, including the findings of this paper, that indicates that trade is
more responsive to non-tariff barriers than tariffs (Table 5.1). This shows the increasing
importance of non-tariff barriers following the declining trends of tariffs due to bilateral and
multilateral trade agreements and preferences. However, despite the growing understanding of the
significance of non-tariff barriers to trade, there are certain issues that are not yet clear. These
include 1) which type of non-tariff barriers cause significant impacts on trade; 2) which type of
non-tariff barriers are prevalent in agricultural trade; 3) how these measures are trending; and 4)
what strategic options African countries have to reduce the effect of NTBs on trade performance.
Figure 5.9 shows the prevalence of different NTBs across major African trade partners, which
import about 90 percent of African agricultural exports. Of all the countries, the US takes the lead
-10 -5 0 5 10 15
VEGETABLES
TOBACCO
SUGARS
SILK
OIL SEEDS
MEAT
LIVE TREES
LIVE ANIMALS
HIDES AND SKINS
FISH
DAIRY and EGGS
COTTON
COFFEE and TEA
COCOA
CEREALS
FRUIT AND NUTS
Figure 8. Rates of preferences given to SSA exports for major products
World EU US

151
in terms of the number of measures imposed on imports of agricultural products. During the past
four years, the US has imposed about 1,000 measures annually, which are counted across products
and types of NTBs. Close to 50 percent of these relate to SPS measures. SPS measures followed
by TBT are the dominant type of NTBs in many countries. Quantitative restrictions are widely
prevalent in the EU. Unlike many other measures, SPS requirements are politically and
environmentally acceptable as they relate to health, safety and hygiene. Unfortunately, these
requirements impact trade more than any other measures (Figure 5.10). A ten percent increase in
the number of products affected by SPS measures reduces trade by about 3 percent. This result is
consistent with a previous study which shows that SPS penalizes poor countries more strongly
than others (Disdier, Fontagne, & Mimouni, 2008). Export subsidies, which are prevalent in the
EU, the US and Turkey, are the next type of NTB which negatively and significantly affects
African agricultural trade. The involvement of state enterprises in imports and exports positively
affects African exports, probably due to the discretionary preference that these enterprises may
provide to African imports. The involvement of state enterprises in agricultural trade is most
prevalent in China and India and in some EU member states. The number of NTBs in general are
steadily increasing over time both in the US and the EU, which impose the largest number of trade-
reducing non-tariff barriers of all of Africa’s trading partners (Figure 5.11).
Figure 5.9. Frequency of non-tariff measures on agricultural products (average 2012-2015)
Source: Authors’ calculation based on WTO data Note: Frequency of non-tariff barriers is measured as the sum of all
types of measures for all HS6 classified products. For example, if 2 measures are imposed on one product, 3 measures
on 3 products, and zero on all other products, the frequency will be 2*1+3*3=11.
0
200
400
600
800
1,00
0
US
EU
Japa
n
Chi
na
Aust
ralia
Can
ada
Indi
a
Sing
apor
e
Turk
ey
Mid
dle
East
Rus
sia
Mal
aysi
a
SSA
Paki
stan
Figure 9. Frequency of non-tariff measures on agricultural products (mean 2012-2015)
SPS TBT Trade defence
Quantitative restriction Export subsidy State trading

152
The significant impact of NTBs on trade and their growth over time present significant challenges
to policymakers as to how to minimize the adverse effects of these measures. Because of domestic
public concerns, reducing their prevalence through international negotiation is not likely to be
possible. Rather, policymakers in Africa should focus on reducing the vulnerability of their trade
to these measures. The majority of the measures demand certification and labeling, which increase
the cost of trading. Efficient institutional and infrastructural arrangements are required to reduce
these costs. Establishing a certification and accreditation center for an individual country could be
costly and in some cases impossible. Therefore, regional cooperation should be an important area
of focus for African policymakers. Furthermore, there are areas in which individual countries can
facilitate exports by establishing export facilitation centers that would primarily assist exporters in
fulfilling the requirements imposed by importers.
Figure 5.10. Effects of non-tariff measures on export growth in Africa
Source: Authors’ calculation based on WTO data
Note: SPS refers to sanitary and phytosanitary measures and TBT refers to technical barriers to trade based on the
UNCTAD classification. The graph shows coefficients and confidence intervals. If zero is included within the
confidence interval, the coefficient is interpreted as statistically insignificant.
SPS
TBT
Trade_defense
Quantitative_restriction
Export_subsidy
State_trading
-.5 0 .5 1Elasticities
Figure 10. Effects of NTMs on export growth in Africa

153
Figure 5.11. Trends of non-tariff measures in US and EU
Source: Authors’ calculation based on WTO data
5.4.7 Domestic agricultural supports in OECD countries
The empirical link between domestic agricultural supports in OECD countries and the value of
agricultural exports in African countries is assessed using a ratio of agricultural and non-
agricultural producer prices. This price ratio may capture the effect of all border and domestic
supports including tariffs, export subsidies, and production and input subsidies. Since tariffs and
non-tariff barriers are included as explanatory variables, the price ratio should predict the effect of
domestic supports. As shown in Table 5.1, the effect of this price ratio is negative and statistically
significant. According to this estimation, a 1 percent increase in the price ratio reduces African
exports by about 5 percent. However, the implication of this elasticity depends on the actual
correlation of the price ratio with domestic support. Many economists argue that since most
payments to agricultural producers are made through direct payments, the impact of agricultural
subsidies on trade is very limited (Anderson & Martin, 2005; Croser & Anderson, 2011; Hoekman
et al., 2004). But if we compare producer prices of agricultural and manufacturing products, in
many cases we get a ratio greater than one, which implies that agriculture is treated preferentially
and that this treatment restricts imports from developing countries.
520
540
560
580
600
620
Nu
mb
er
of m
easure
s
2012 2013 2014 2015
USA EU
Figure 11. Trends of non - tarff measures in USA and EU

154
Generally we conclude that although the effect of domestic support might not be as large as cross
border measures such as tariffs and non-tariff barriers, it still plays a significant role.
It appears, however, that the rate of agricultural support in general is declining over time in many
OECD countries. Figure 5.12 shows trends in Producer Support Estimates (PSE) estimated by
OECD for selected countries and groups of countries. Of all countries considered, EU countries
provided the highest support throughout the last two decades. Emerging economies such as China
and Russia are also increasingly supporting their producers despite the instability and
unpredictability of their support. In these countries, support is said to be mainly through tariffs and
non-tariff barriers instead of subsidies.
Figure 5.12. Trends of Producer Support Estimates (PSE) in OECD countries
Source: Authors’ estimation based on OECD data
Both our empirical analysis and trends in the PSE suggest the importance of domestic support in
high income countries for the performance of African exports. However, African countries in
particular and developing countries in general have very few policy options to curb the adverse
effects of this domestic policy action in foreign countries.
01
02
03
04
0
Pe
rce
nt
2000 2005 2010 2015
EU Russia USA China OECD
Figure 12. Trends of Producer Support Estimates ( PSE ) in OECD countries

155
Although multilateral trade negotiations through the WTO are usually of limited effectiveness,
they remain the most likely avenue for developing countries to compel high income countries to
reduce or redesign their agricultural supports. Economic growth in many African and Asian
countries and the increasing threat of climate change may create leverage for developing countries
to organize themselves and enforce effective global policy actions through the WTO.
5.5 Conclusions
African countries are striving to expand market opportunities for domestic producers regionally as
well as globally. However, this effort is being impeded by emerging and evolving constraints.
Though many of the constraints seem conventional and traditional, the nature and extent of the
constraints are evolving dramatically following global and regional shocks and opportunities. This
chapter aims to closely monitor these evolutions and identify key determinants of trade
performance with the purpose of provoking discussions among policymakers and development
partners on how to help Africa achieve the targets set by the Malabo Declaration. To do so, existing
theoretical and empirical evidence is reviewed and comprehensive empirical assessments are made
to supplement existing evidence.
The review generally found that the existing evidence is not sufficiently comprehensive, updated
and focused on African context. Realistic and updated assessments are required to feed the
increasing policy momentum to improve African agriculture. We also learned that agricultural
trade determinants are diverse and complex, ranging from farm level supply side constraints to
global level demand side barriers. This calls for regular monitoring and prioritization of these
constraints for immediate policy and development actions.
The empirical analysis that aimed at identifying and tracking key determinants of trade indicated
that supply side constraints, which include production capacity and cost of trade, are more
important determinants than demand side global constraints. This gives the opportunity for African
policymakers to focus on domestic production and trade facilitation which can easily be influenced
through national and regional policies and investments. A lot can be achieved by simply focusing
on domestic factors instead of assuming that international factors are the culprits for low and, in
some countries, declining agricultural exports. This does not, however, rule out the importance of
cooperation, both regionally and globally.

156
Regional cooperation is key for enhancing trade through reducing trade barriers and increasing
productivity. The empirical analysis clearly confirmed that regional economic communities in
Africa are significantly contributing to the growth of agricultural exports. These regional units can
be further utilized to reduce regional as well as global barriers. One important function of regional
bodies could be joint trade facilitation initiatives that can help to fulfil the growing non-tariff trade
requirements of African trade partners.
Despite a growing tendency toward import tariff reductions partly due to preferential trade, non-
tariff barriers are significantly increasing and impacting African exports more than tariffs. This
trend demands not only regional cooperation but also global cooperation. Ensuring global
cooperation has always been a challenge for developing countries. However, there are growing
opportunities that can enhance the bargaining power of developing countries in general and
African countries in particular. These are the growing economic importance of the continent for
markets and investments and the global climate threat, in that Africa can play pivotal role in
mitigating the problem. However, global cooperation should not be viewed only as an instrument
to influence international trade policies; rather Africa should also seek this cooperation for
facilitating trade and enhancing domestic agricultural value addition.

157
References
Amoroso, N., Chiquiar, D., & Ramos-Francia, M. (2011). Technology and endowments as determinants
of comparative advantage: Evidence from Mexico. The North American Journal of Economics and
Finance, 22(2), 164-196.
Anderson, K. (2014). The intersection of trade policy, price volatility, and food security. Annual Review
of Resource Economics, 6(1), 513-532.
Anderson, K., & Martin, W. (2005). Agricultural trade reform and the Doha Developemnt Agenda. The
World Economy, 28(9), 1301-1327.
Anderson, K., & Nelgen, S. (2012). Agricultural trade distortions during the global financial crisis.
Oxford Review of Economic Policy, 28(2), 235-260.
Anderson, K., & Thennakoon, J. (2015). Food price spikes and poor, small economies: What role for
trade policies. African Journal of Agricultural and Resource Economics, 10(1), 16-31.
Badiane, O., Odjo, S., & Jemaneh, S. (2014). More resilient domestic food markets through regional
trade. In O. Badiane, T. Makombe & G. Bahiigwa (Eds.), Promoting Agricutral Trade to Enhance
Resilience in Africa. ReSAKSS Annual Trends and Outlook Report 2013. Washington DC: International
Food Policy Research Institute.
Benin, S., Mogues, T., & Fan, S. (2012). Agricultural growth and poverty reduction impacts of public
investments: Assessment concepts and techniques. In T. Mogues & S. Benin (Eds.), Public Expenditures
for Agricultural and Rural Development in Africa. UK: Routledge.
Bergstrand, J. H. (1990). The Heckscher-Ohlin-Samuelson Model, the Linder Hypothesis and the
determinants of bilateral intra-industry trade. The Economic Journal, 100(403), 1216-1229.
Bernstein, J., & Weinstein, D. (2002). Do endowments predict the location of production? Evidence from
national and international data. Journal of International Economics, 56, 55-76.
Bouët, A., Bureau, J.-C., Decreux, Y., & Jean, S. (2005). Multilateral agricultural trade liberalisation: The
contrasting fortunes of developing countries in the Doha Round. The World Economy, 28(9), 1329-1354.
Bouët, A., Fontagné, L., & Jean, S. (2005). Is Erosion of Tariff Preferences a Serious Concern? CEPII
Working Paper 2005-14. Paris: CEPII.
Bouet, A., & Laborde, D. (2012). Food crisis and export taxation: The cost of non-cooperative trade
policies. Review of World Economics, 148(1), 209-233.
Bouët, A., Laborde, D., Dienesch, E., & Elliott, K. (2012). The costs and benefits of duty-free, quota-free
market access for poor countries: Who and what matters. Journal of Globalization and Development,
3(1), 1-27.
Bouët, A., Mishra, S., & Roy, D. (2008). Does Africa Trade Less than It Should, and If So, Why? The
Role of Market Access and Domestic Factors. IFPRI Discussion Paper 770. Washington, DC:
International Food Policy Research Institute.
Bougheas, S., Demetriades, P. O., & Mamuneas, T. P. (1999). Infrastrucutre, transport costs and trade.
Journal of International Economics, 47(1), 169-189.

158
Brenton, P. (2003). Integrating the Least Developed Countries into the World Trade System: The Current
Impact of EU Preferences under Everything But Arms. World Bank Policy Research Working Paper
3018. Washington, DC: World Bank.
Bureau, J.-C., Jean, S., & Matthews, A. (2006). The Consequences of Agricultural Trade Liberalization
for Developing Countries. Paper presented at the International Association of Agricultural Economists
Conference, Gold Coast, Australia, Aug. 12-18, 2006.
Carruthers, R., Krishnamani, R. R., & Murray, S. (2010). Africa Infrastructure Country Diagnostic:
Improving Connectivity: Investing in Transport Infrastructure in Sub-Saharan Africa. Washington, DC:
World Bank.
Croser, J. L., & Anderson, K. (2011). Agricultural distortions in Sub-Saharan Africa: Trade and welfare
indicators, 1961 to 2004. The World Bank Economic Review, 25(2), 250-277.
Disdier, A.-C., Fontagne, L., & Mimouni, M. (2008). The impact of regulations on agricultural trade:
Evidence from SPS and TBT agreements. American Journal of Agricultural Economics, 90(2), 336-350.
Francois, J., & Manchin, M. (2007). Institutions, Infrastructure and Trade. CEPR Discussion Paper 6068.
London: Centre for Economic Policy Research.
Gwilliam, K., Foster, V., Archondo-Callao, R., Briceño-Garmendia, C., Nogales, A., & Kavita Sethi.
(2008). Africa Infrastructure Country Diagnostic: Roads in Sub-Saharan Africa. Washington, DC: World
Bank.
Hoekman, B., Ng, F., & Olarreaga, M. (2004). Agricultural tariffs or subsidies: Which are more important
for developing economies? The World Bank Economic Review, 18(2), 175-204.
Makochekanwa, A. (2012). Impacts of Regional Trade Agreements on Trade on Agrifood Products:
Evidence from Eastern and Southern Africa. Paper presented at the African Economic Conference 2012,
Kigali, Rwanda, Oct. 30-Nov. 2, 2012.
Moïsé, E., Delpeuch, C., Sorescu, S., Bottini, N., & Foch, A. (2013). Estimating the Constraints to
Agricultural Trade of Developing Countries. OECD Trade Policy Paper 142. Paris: OECD Publishing.
Panagariya, A. (2003). Aid through Trade: An Effective Option? Mimeo.
Tadesse, G., Algieri, B., Kalkuhl, M., & Braun, J. v. (2014). Drivers and triggers of international food
price spikes and volatility. Food Policy, 47, 117-128.
Topp, A. (2003). Are Trade Preferences Useful in Advancing Economic Development? Australian
National University Working Paper 0503.
Urban, K., Jensen, H. G., & Brockmeier, M. (2016). How decoupled is the Single Farm Payment and does
it matter for international trade? Food Policy, 59, 126-138.
Wainio, J., & Gehlhar, M. (2004). MFN Tariff Cuts and U.S. Agrciutral Imports Under Nonresprocal
Trade Preference Programs. Paper presented at the 7th Annual Conference on Global Economic
Analysis, Washington, DC, June 17-19, 2004.
Wilson, N. (2007). Examining the Trade Effect of Certain Customs and Administrative
Procedures. OECD Trade Policy Paper 42. Paris: OECD Publishing.

159
Yu, T.-h., Tokgoz, S., Wailes, E., & Chavez, E. (2011). A quantitative analysis of trade policy responses
to higher world agricultural commodity prices. Food Policy, 36, 545-561.

160
Annex 1. List of determinants and their indicators used to estimate African agricultural export
performance
Determinants Indicators and definitions
Size and income
level
Total GDP and per capita GDP are used to control for the size of both importing and exporting
economies. GDP is measured as real values deflated by 2005 constant price in billions of US$.
Per capita GDP is measured in US$ per person. In both cases, the 2013 values are used.
Missing values are replaced by values of the previous year.
Resource
endowment &
productivity
Land and labor of the exporting countries are chosen to test the role of resource endowment
for trade. Land is measured as the total arable land in millions of hectares and labor is
measured as total agricultural labor in millions of persons. The productivity of these resources
are also included at a later stage of the analysis to test the relevance of endowment vs.
technology. Land productivity is measured as agricultural value added per hectare of land;
similarly labor productivity is estimated as the ratio of agricultural GDP to agricultural labor
force. All the data are obtained from the ReSAKSS database (www.resakss.org).
Infrastructural
quality:
Road density, quality of port and quality of trade transport infrastructure quality are used to
measure the effect of infrastructure on trade performance. Road density is obtained from
publicly available international sources17 and measured in terms of kilometer per square
kilometer. Indices of port and trade transport qualities are obtained from the World Bank
survey on ‘doing business”. The indices are represented by scalar cores that ranges from 1 to
7; 1 being extremely poor/inaccessible and 7 being very efficient/accessible. Since the survey
data is available in different years for different countries, the average of available data from
2010 to 2013 are used.
Institutional
efficiency
The World Bank Logistics Performance Index specific to the efficiency of customs clearance
process (1=low to 5=high) is used to proxy institutional efficiency related to trade. It
aggregates the respondents’ ranking of the efficiency of customs clearance processes (i.e.
speed, simplicity and predictability of formalities), on a rating ranging from 1 (very low) to 5
(very high). Scores are averaged across all respondents.
Financial cost of
exports
Both infrastructural quality and institutional efficiency used to proxy costs of trade do not
capture all costs involved in the export of import of commodities. The cost of export estimated
by the World Bank is used to control for unaccounted trade costs. The cost measures the fees
levied on a 20-foot container in U.S. dollars. All the fees associated with completing the
procedures to export or import the goods are included. These include costs for documents,
administrative fees for customs clearance and technical control, customs broker fees, terminal
handling charges and inland transport. The cost measure does not include tariffs or trade
taxes. The average cost from 2010 to 2013 of the exporting country is used.
17 http://www.nationmaster.com/country-info/stats/Transport/Road-density/Km-of-road-per-100-sq.-km-of-land-area
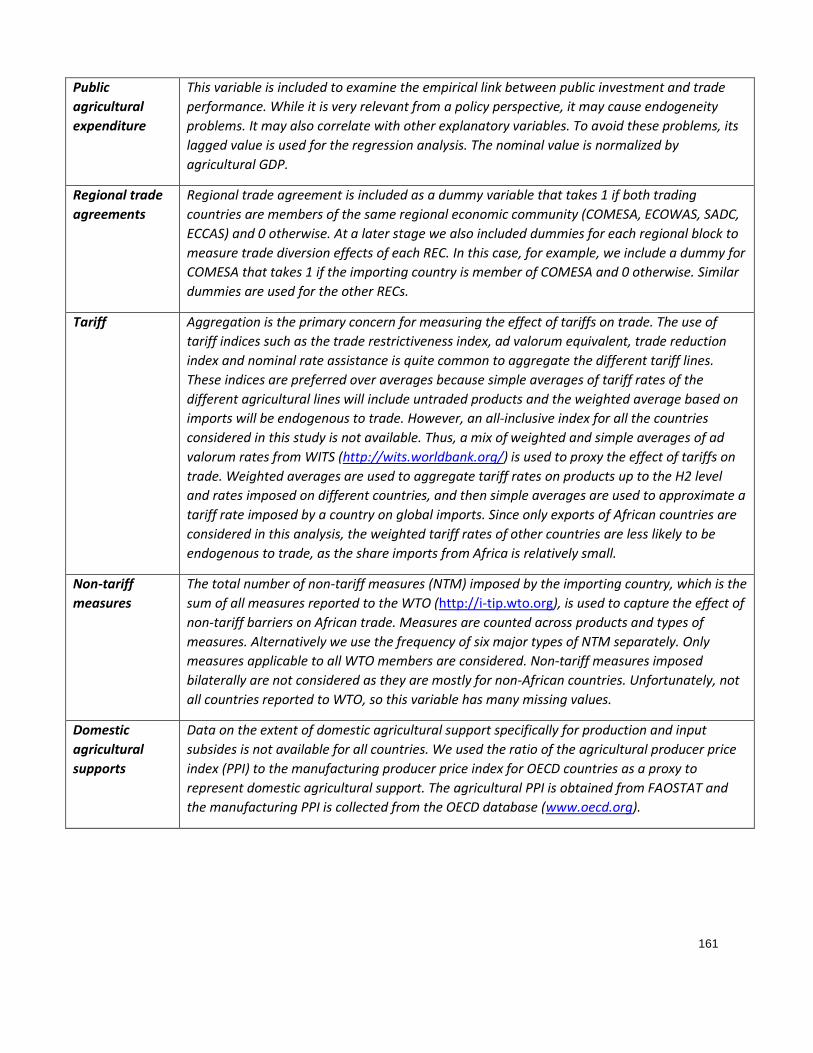
161
Public
agricultural
expenditure
This variable is included to examine the empirical link between public investment and trade
performance. While it is very relevant from a policy perspective, it may cause endogeneity
problems. It may also correlate with other explanatory variables. To avoid these problems, its
lagged value is used for the regression analysis. The nominal value is normalized by
agricultural GDP.
Regional trade
agreements
Regional trade agreement is included as a dummy variable that takes 1 if both trading
countries are members of the same regional economic community (COMESA, ECOWAS, SADC,
ECCAS) and 0 otherwise. At a later stage we also included dummies for each regional block to
measure trade diversion effects of each REC. In this case, for example, we include a dummy for
COMESA that takes 1 if the importing country is member of COMESA and 0 otherwise. Similar
dummies are used for the other RECs.
Tariff Aggregation is the primary concern for measuring the effect of tariffs on trade. The use of
tariff indices such as the trade restrictiveness index, ad valorum equivalent, trade reduction
index and nominal rate assistance is quite common to aggregate the different tariff lines.
These indices are preferred over averages because simple averages of tariff rates of the
different agricultural lines will include untraded products and the weighted average based on
imports will be endogenous to trade. However, an all-inclusive index for all the countries
considered in this study is not available. Thus, a mix of weighted and simple averages of ad
valorum rates from WITS (http://wits.worldbank.org/) is used to proxy the effect of tariffs on
trade. Weighted averages are used to aggregate tariff rates on products up to the H2 level
and rates imposed on different countries, and then simple averages are used to approximate a
tariff rate imposed by a country on global imports. Since only exports of African countries are
considered in this analysis, the weighted tariff rates of other countries are less likely to be
endogenous to trade, as the share imports from Africa is relatively small.
Non-tariff
measures
The total number of non-tariff measures (NTM) imposed by the importing country, which is the
sum of all measures reported to the WTO (http://i-tip.wto.org), is used to capture the effect of
non-tariff barriers on African trade. Measures are counted across products and types of
measures. Alternatively we use the frequency of six major types of NTM separately. Only
measures applicable to all WTO members are considered. Non-tariff measures imposed
bilaterally are not considered as they are mostly for non-African countries. Unfortunately, not
all countries reported to WTO, so this variable has many missing values.
Domestic
agricultural
supports
Data on the extent of domestic agricultural support specifically for production and input
subsides is not available for all countries. We used the ratio of the agricultural producer price
index (PPI) to the manufacturing producer price index for OECD countries as a proxy to
represent domestic agricultural support. The agricultural PPI is obtained from FAOSTAT and
the manufacturing PPI is collected from the OECD database (www.oecd.org).