on the determinants of exports survival
TRANSCRIPT
On the determinants of exports survival∗
Marco Fugazza# United Nations Conference on Trade and Development, Geneva
Ana Cristina Molina∗
Graduate Institute of International Studies, Geneva
This version February 2011
Abstract: This paper qualifies the duration pattern of trade relationships across three country groups (Developing South, Emerging South and North) and aims at identifying its major determinants. The duration of trade relationships is found to increase monotonically with the level of economic development of the exporting country. Empirical investigations reveal three key results. First, initial export value is positively correlated with export survival. Second, the relationship between export duration and the type of product illustrates the degree of competition/information patterns characterizing products. Third, fixed costs to export affect export duration differently across country groups. They increase duration of exporting in Developing South economies and decrease it in Emerging South and North countries. Estimation is based on HS 6-digit product level data for 96 countries from 1995 to 2004. Keywords: Duration, Trade, Fixed Costs JEL Classification: F1, C41
∗ Acknowledgements: We are grateful to Olivier Cadot, Marcelo Olarreaga for helpful comments and suggestions. We also thank seminar participants at the Geneva Graduate Institute, the University of Geneva and UNCTAD for valuable comments. # Corresponding author: Marco Fugazza, UNCTAD, Palais des Nations, 1211 Geneva 10 (Switzerland), tel: +41229175772 fax. +41229170044, [email protected]. ∗ The Graduate Institute, Avenue de la Paix 11A, CH-1202 Geneva. Email: [email protected]

2
1. Introduction Trade duration (and its determinants) has been most of the time overlooked in both theoretical and
empirical literature. This is rather surprising considering that the length of trade relationships remains the
main driver of the intensive margin, which is the most influential component of export growth (see inter
alia Kehoe and Ruhl, 2009; Helpman et al., 2008; Besedes and Prusa, 2007; Brenton and Newfarmer
2007;, Felbermayr and Kohler, 2006; Evenett and Venables, 2002).1 Our data show that the number of
times trade is disrupted after a short period of time is very large.2 On average 3 out of 5 new trade
relationships fail within our period of investigation (i.e. 10 years), implying that improving survival rates
is a key component of a country’s export strategy. This paper examines the potential factors influencing
the length of trade partnerships.
There is no theoretical framework that directly analyzes the duration of trade relationships. Yet, one
possible explanation for trade relationships' stability (i.e. persistence of export status) goes back to the
hysteresis trade literature of the 80's (Baldwin, 1988, 1990; Baldwin and Krugman, 1989 and Dixit,
1989). Inspired by the effects of the dollar overvaluation between 1980 and 1985, these models explain
the persistence, i.e. hysteresis, of firms’ export participation as a consequence of the sunk costs associated
with the entry into new markets. Following the dollar appreciation, foreign firms entered the US market
(while American firms exited some markets), but since they incurred entry costs - firms have to meet
market-specific standards and regulations, adapt their packaging, establish distribution channels,
accumulate information about foreign markets, etc. - they did not necessarily exit once the exchange rate
went back to its initial value. These studies suggest, thus, that fixed costs of entry, that are mostly sunk,
can have an impact on firm’s export status and therefore on trade duration. Theoretical insights in that
vein can be found in Irarrazabal and Opromolla (2009), who introduce ex-post uncertainty (firms'
productivity evolves stochastically as a Brownian motion) in a trade model with heterogeneous firms and
fixed cost to export. The latter can be either sunk or paid on a per-period basis. Using simulations, they
test how a cut in per-period fixed costs and sunk costs could affect exporters and non-exporters’ status.
They find that history-dependent export decisions are a salient feature when export fixed costs are sunk
upon entry in a foreign market. It is not necessarily the case when fixed costs are paid on a per-period
basis. Moreover, the implications for the persistence of the export status are also different. An increase in
per-period fixed costs decreases the average time spent as an exporter. The logic behind this result is that
1 Trade can be decomposed into an intensive and extensive margin. An expansion of the intensive margin implies an increase in the exports of existing products with existing partners. Growth can also take place at the extensive margin, that is, countries can expand their exports by introducing a new product in a new market, an existing product in a new market or a new product in an existing market. 2 i.e. the number of times trade amounts to zero.

3
as fixed costs increase, the probability that an exporter would be able to cover his fixed costs decreases.
On the other hand, an increase in sunk costs increases the average time spent as an exporter. In line with
the latter theoretical result, Eaton et al. (2008) find that a significant fraction of Colombian exporting
firms switch to lower export quintiles on a year-to-year basis without changing status. It is also consistent
with Das, Roberts and Tybout (2007) theoretical predictions and empirical findings obtained using plant-
level panel data on Colombian chemical producers. Other empirical evidence of the role of entry fixed
costs in the export decision process is provided by Roberts and Tybout (1997) and Bernard and Jensen
(1999, 2004). They explicitly investigate the presence of entry sunk costs and its influence on firms’
market participation. They all use lagged export status as a proxy for entry sunk costs and find that they
play a significant role in the decision to export. Roberts and Tybout (1997) employ a dynamic probit
model to analyze the entry and exit decision patterns of a panel of Colombian manufacturing firms from
1981 to 1989. In their model, each firm has to pay a fixed cost before entering the export market.
Following entry, firms only bear variable costs. They introduce dummies to control for the firm's past
export status and show that exporting history matters. Bernard and Jensen (2004) use a linear probability
framework to investigate the role and magnitude of sunk costs in a panel of U.S. manufacturing plants.
They also find that the entry costs are significant and that the probability of being an exporter today
increases by 36% the probability of being an exporter tomorrow.
All these contributions point to the importance of entry fixed costs whether they are sunk or periodic for
export duration. Empirically, we should then observe a negative relationship between per-period fixed
costs and survival rates, and a positive relationship between sunk costs and survival rates.
Another study that indirectly analyzes the duration of business relationships is by Rauch and Watson
(2003), who explore the creation and evolution of partnerships between buyers (in developed countries)
and suppliers (in less developed countries). One of their findings suggests a positive relationship between
the size of the initial transaction and the expected length of a partnership. Their model consists of three
stages: search, investment (deepening), and rematch (abandon current relationship and search for another
supplier). A unique solution exists and three actions are possible for a buyer who has just been matched
with a foreign supplier: immediate investment implying a large initial value of trade, a small initial value
of trade to learn about the supplier before investing, or rejection of the supplier. The model predicts that
the length of a trade relationship is positively correlated with the initial amount of the transaction, and that
the propensity to start low value transactions increases with the cost of search and decreases with
reliability.

4
On the empirical side, few studies have focused on the duration of trade. Besedes and Prusa (2006a and
2006b) are pioneers. In their first seminal contribution, the authors focus on the length of US imports,
while in the second they test some of the main implications of the Rauch-Watson model using data on
imports from the United States at the TS (Tariff scheduled) 7-digit level and at the HS 10-digit level. The
authors find that the duration of U.S. imports is short; the median duration being two years, and it is
shorter for homogeneous goods than for differentiated products. Their results also suggest that short
trading relationships tend to be low-valued. In a more recent study Besedes (2008) focuses on the
persistency of short and low-valued relationships by applying Rauch-Watson search model. In this
framework, buyers, i.e. importers, start with small purchases because of the uncertainty surrounding the
supplier. Orders increase only if the seller delivered and complied with his clients’ expectations. In
Besedes and Prusa (2007), the authors use non-parametric survival techniques (Kaplan Meier) to analyze
the duration of the bilateral manufacturing exports of 46 countries at the SITC 4-digit level between 1975
and 2003. They find higher survival rates for developed and successful developing countries. These
results are consistent with those found in Nitsch (2009), who analyzes the duration of German imports
and its determinants at the 8-digit level from 1995 to 2005. In his analysis, the majority of trading
relationships are of short duration and very often last only between one and three years. He also finds that
duration depends on exporter and product characteristics, and on the size of the transaction. All the
authors cited above emphasize the role of the type of product and of trade values in determining the
duration of trading relationships, but ignore the role of fixed costs, emphasized by the hysteresis
literature.
The scope of this paper is essentially to account for the set of predictions obtained in the various
theoretical frameworks found in the literature and to assess their empirical relevance using a dataset with
large country coverage. The main contribution of the paper thus stays in the enlargement of the list of
duration determinants taken into consideration, the list being inspired by the recent theoretical
developments on the dynamics of trade relationships. In particular, we focus on the role of countries’
income level, the type of product, exports values and fixed costs to export.
We explore the patterns and determinants of trade duration for a set of 96 countries over the 1995-2004
period. To this end, we analyze the sequence of export status at the HS 6-digit level using an extended
version of the semi-parametric Cox survival model and a Probit model with random effects controlling for
factors likely to influence export survival. The use of the Probit specification is motivated by the presence
of unobserved heterogeneity that can not be fully accounted for in our version of the Cox model.
5
We find that the initial export size appears to be positively correlated with export survival in the long run.
Our results further suggest that the relationship between trade duration and the type of product portrays
the degree of competition/information patterns characterizing traded products. Finally, export fixed costs
do affect trade duration, but their effect differs across country groups.
The rest of the paper is organized as follows. The next section describes the raw data and identifies
geographic specificities of trade duration. Section 3 presents the empirical strategy adopted. Empirical
results are summarized in Section 4. The last section concludes.
2. Duration, trade and development
In this section we analyse trading relationships among 96 developed and developing countries in order to
sketch trade duration patterns across country groups. The data presented here are also used to carry out
the empirical analysis. Our data are extracted from BACI, a trade database maintained by CEPII.3 Based
on the United Nations’ COMTRADE database, BACI provides harmonized bilateral trade data4 at the HS
6-digit level for a total of 5,017 categories.5 Its main advantage is that by applying different
harmonization procedures (for details see Gaulier and Zignago, 2008), BACI reconciles mirror flows, thus
providing a more complete and refined geographical coverage. Therefore, BACI achieves a greater
accuracy of the zeros (i.e. absence of trade) in the trade matrix, which is of particular importance in the
present case, as it directly enters into the definition of trade duration.
For the purpose of our analysis, we define three groups of countries: North (30 countries), Emerging
South (22 countries) and Developing South (44 countries).6 This broad categorization reflects only major
differences in economic development but already permits a relevant characterization of trade duration.
We define a trading relationship as the combination of an exporter, an importer and a product. We
excluded trading relationships with values below US$ 1,000 and trade relationships involving oil
products. Based on this definition, we identified 6,354,751 trading relationships over the 1995-2004
3 BACI is the French acronym for Base pour l'Analyse du Commerce International: Database for International Trade Analysis. CEPII stands for Centre d'Etudes Prospectives et d'Informations Internationales. 4 Different procedures have been developed to harmonise the data: the evaluation of the quality of country declarations to average mirror flows, the evaluation of CIF rates to reconcile import and export declarations, the conversion in tonnes of other units of quantities exchanged. 5 In our analysis we can not distinguish the number of exporting firms since we use product-level data. However, the absence of trade in one category allows inferring that no firm exports, and a positive trade value allows concluding that at least one firm exports the product. This implies that aggregation does smooth firms' entry-exit sequences but only partially. 6 Our classification follows the one in Akın and Kose (2007), who divide developing countries into two groups based on the extent of their integration into the global economy. The emerging economies group roughly corresponds to the economies included in the MSCI Emerging Economies index. Appendix 1 contains the complete list of countries included in the sample as well as their group affiliation.

6
period, 672,287 (ca. 17,000 per country) of which involve exporters from the Developing South (DS)
group, 1,897,719 (ca. 96,000 per country) involve exporters from the Emerging South (ES) group and
3,784,745 (ca. 141,000 per country) involve exporters from the North (N) group.
2.1. Trade duration: a first mapping
We first investigate the patterns and differences in trade duration, i.e. the length of a trade relationship,
across country groups. The duration can be simply assessed by counting the number of years, not
necessarily consecutive, an exporter has served a market.7 Besides recording errors, the approach is
unavoidably subject to right and especially left censoring due to the limited and relatively short period of
time covered by the analysis. Despite these drawbacks, and leaving statistical methods used to correct for
them to the econometric analysis presented in section 4, we believe that a glance at the data remains
relevant to identify any specific patterns in trade duration possibly related to differences in economic
development or any other characteristic. We sort trading relationships based on their durations and report
the results in Figures 1a and 1b.
Figures 1a and 1b: Trade matrix composition (1995-2004)
First, we observe that the duration of trading relationships varies strongly across country groups. Second,
trading relationships are mostly of short duration. One and two-year old relationships account for at least
one third of the total number of trading relationships in each country group. The share is the largest in the
case of the Developing South, with 67% of total trading relationships. On the other hand trading
relationships with no interruption, i.e. with ten-year duration, account only for a small share in the trade
7 Nevertheless, we reiterated the analysis counting only the duration of single spells. The impact on average trade duration remained very limited.
020
4060
8010
0
shar
e in
the
tota
l num
ber
trad
e re
latio
nshi
ps
N ES DS
Trade matrix composition (1995-2004)
1 to 2 years3 to 6 years7 to 9 years10 years
Duration
01,
000
2,00
03,
000
4,00
0
num
ber
trad
e re
latio
nshi
ps
N ES DS
Trade matrix composition (1995-2004)
1 to 2 years3 to 6 years7 to 9 years10 years
Duration
These graphs do not include values below US$ 1,000.

7
matrix: 32% in the case of the North, 20% in the case of the Emerging South and 4% in the case of the
Developing South group. The distribution of other durations i.e. durations longer than two years and
shorter than 10 years, exhibits a remarkably similar pattern across country groups as shown in Figure 1b.
We then examine the extensive margin for each group of countries. New trade relationships8 represent
81% of total trade relationships recorded for the Developing South group. The figure is 62% and 47% for
the Emerging South and North group respectively. We then qualify trade failure patterns, by counting the
number of these trade relationships that disappeared during the period under consideration. The data show
that 68% of the trade relationships initiated by the Developing South’s exporters failed within that period.
In the case of the Emerging South 57% of the new trading relationships failed, while in the North group
failure affected 62% of the new trading relationships.
These figures show that although trade failure affects country groups in a similar way; the length of the
period of time before failure varies strongly across country groups.
2.2. Duration and trade values
Another important feature of a trade relationship is its value. All existing models dealing with trade
duration generate a positive relationship between initial trade values and the length of a trade relationship.
Such result unambiguously leads to a positive correlation also between the yearly average of the value
and the duration of a trade relationship. The graphs presented below are based exclusively on average
trade values but similar results are obtained using initial trade values. However, the use of average limits
the potential bias due to either reporting errors or multiple spells relationships.
The average trade value of a relationship is given by the sum of the trade values in each year divided by
the number of years of service. In order to get a sense of how average trade values vary with trade
duration, we classify trade relationships for each country group according to their average trade and
according to their duration.9 The resulting two-dimensional distributions are plotted in Figures 2a to 2c.
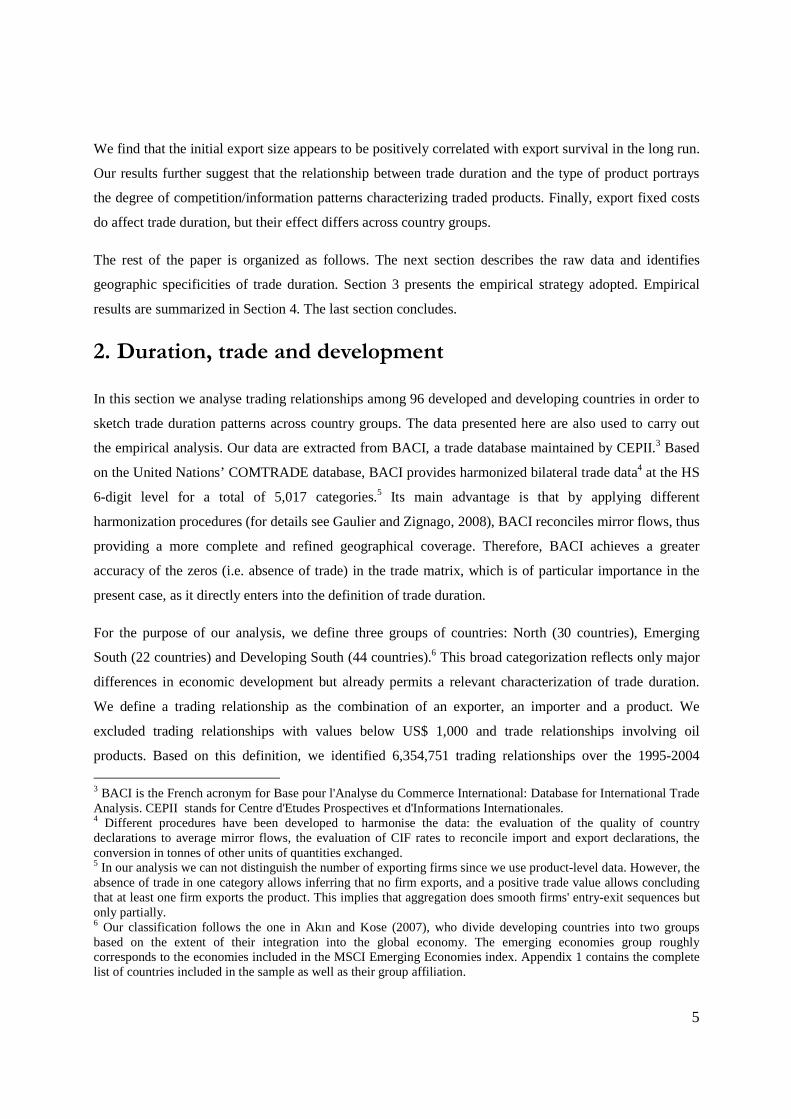
We obtain that between 55% (North) and 75% (Developing South) of the total number of trade
relationships generate less than US$ 50,000 on average per year. Trade relationships with an average
value between US$ 50,000 and US$ 500,000 per year account for around 30% in the North and Emerging
8 A trade relationship is assumed to be "new" in our sample if it appeared in 1996 or latter. We also conducted the analysis including as new only those relationships appeared in 1997 or after. In the latter case results in relative terms are only marginally modified. 9 For accuracy purposes we exclude from our sample the one-year old trade relationships observed in 1995 (since we don’t know if it started before) and in 2004 (for we don’t know if they continue), as well as the ones concerning transportation equipment goods which are often a one-year-only transaction involving high trade values (these correspond to HS 2-digit codes 86 to 89).
8
050
01,
000
1,50
0
tota
l num
ber
of tr
ade
rela
tions
hips
in th
ousa
nds
1 2 3 4 5 6 7 8 9 10
N: Average trade values by duration
trade<1010<trade<5050<trade<100
100<trade<500500<trade
Average trade in US thousands
010
020
030
040
0
tota
l num
ber
of tr
ade
rela
tions
hips
in th
ousa
nds
1 2 3 4 5 6 7 8 9 10
DS: Average trade values by duration
trade<1010<trade<5050<trade<100
100<trade<500500<trade
Average trade in US thousands
010
020
030
040
0
tota
l num
ber
of tr
ade
rela
tions
hips
in th
ousa
nds
1 2 3 4 5 6 7 8 9 10
ES: Average trade values by duration
trade<1010<trade<5050<trade<100
100<trade<500500<trade
Average trade in US thousands
South, and for 20% in the Developing South. Trade relationships with an average value of more than US$
500,000 per year are rare, representing less than 15% in all three country groups but again occurring
relatively more in the North.
Figure 2a: Average trade values by duration in the North
Figures 2b and 2c: Average trade values by duration in the South
Across country groups more than half of the trade relationships that last for only one year have an average
trade value lower or equal to US$ 10,000 per year. This is also the case for around half of trade
relationships that last for 2 years. From 2 years on, the majority of trade relationships have an average
trade value larger than US$ 10,000. In other words as duration increases, the share of low-valued trade
relationships (less than US$ 10,000) decrease (i.e. the bottom zone shrinks). At the other end most of the

9
relationships that lasted for 9 to 10 years have an average trade value that is larger than US$ 50,000 per
year.
The above figures suggest that a positive relationship exists between duration and trade value. Country
level analysis does confirm it. It further indicates that the length of a trade relationship varies across
country groups. Export survival and the average value by trade relationship seemed to increase with the
level of development of an economy. The median duration among developing countries is at most 2 years,
against 10 years in developed countries. As for the average trade value, the median in developing and
developed economies amounts up to US$ 20,000 and US$80,000 respectively.10
Overall, results from our descriptive analysis reveal two features that call for further and more in-depth
analysis as presented in the next section. First, the patterns of trade relationships duration portray the
exporting country level of development. Second, the relative influence of the determinants of duration is
also expected to vary the exporting country level of development.
3. Empirical analysis
In this section, we discuss our empirical strategy and present the explanatory variables used in our
analysis. The statistical details of our empirical specifications, which are standard, are omitted as they
have been extensively presented in other papers pertaining to the same literature.
3.1. Empirical strategy
The length of trade relationships and its determinants can be examined using survival analysis techniques.
In this paper we use the semi-parametric Cox (1972) model to assess the impact of explanatory variables
on the hazard rate. This model treats time as a continous variable and has the main advantage that it does
not require the specification of the survival distribution. Despite the suitability of its properties, the use of
the Cox model has been questioned when applied to the duration of trade relationships as discussed in
details in Hess and Persson (2010). One of the major concerns is the validity of the proportionality
assumption. We carried out the Schoenfeld test based on the regression residuals to assess the validity of
the latter. The overall result pointed to the rejection of this assumption. This is common, especially when
time-varying covariates are included in the model, which is the case in the present study (i.e. GDP, trade
10 Figures are not shown due to space considerations.

10
value, exchange rate).11 To take into account of the time dependency of certain covariates, we relax the
proportionality hypothesis and implement an extended version of the Cox model by including time-
dependent covariates of the variables whose effects are suspected to vary with time. This is for instance
the case of export fixed costs (e.g. the time spent on export procedures). It is reasonable to think that once
exporters have learnt how to proceed, the time required to export in the next period would be lower. To
account for such possibility we add an interaction term between the fixed costs and the time duration of a
relationship (i.e. number of years, in logs).12 Interaction terms will correct for intrinsically non-
proportional effects of some control variables but they can not account for non-proportional effects due to
unobserved heterogeneity.13 Another issue is the handling of ties that is the presence of a large number of
spells of trade with the same duration. Such feature is proper to non-continuous cases and in the case of
our continuous model this implies that the partial likelihood can only be approximated. As a consequence
estimated coefficients and standard errors could be biased. There is unfortunately no satisfactory way to
tackle the problem of ties in a Cox model framework.
Following Hess and Persson (2010) results and conclusions, we also estimate a probit model with random
effects. The latter estimation strategy proves to be the most efficient in handling non- proportionality and
tied duration times. Moreover, it can easily treat unobserved heterogeneity whenever present. Sueyoshi
(1995) provides an extensive presentation and discussion of the use of binary responses models in the
context of duration analysis.
3.2. Duration Data
A number of caveats in our dataset need to be highlighted. First and as already mentioned observations
are likely to be subject to left and/or right censoring. In the case of left censoring we don’t know if trading
relationships with a positive value in 1995 began that year or any year before. For accuracy purposes we
exclude possibly left censored relationships and keep only the ones that were established strictly after
1995. This reduces our sample by 19% in the case of the Developing South (i.e. 544,552 trading
relationships remain), 38% in the case of the Emerging South (i.e. 1,176,586 trading relationships remain)
11 In this case, the usual procedure is to model time dependency by introducing an interaction effect between some function of time and the covariate that does not comply with the proportionality assumption. By doing so, we relax the assumption that the hazard ratios are proportional across time for the covariate in question. 12 In the Cox model, the dependent variable is time until an event occurs; this is why the variable “Time” is not included when it is interacted with other covariates in the model. If we include time as a covariate, we would be explaining time until event occurs with a time counter (Box-Steffensmeier et al., 2003). 13 Brenton and al. (2009) address the possible issue of heterogeneity by estimating a Prentice Gloeckler model incorporating a gamma mixture distribution. Their results suggest that individual heterogeneity is likely to bias results in a standard Cox model. However, the application of Brenton and al. (2009) approach does not correct for intrinsically non-proportional effects of explanatory variables.

11
and by 53% in the case of the North (i.e. 1’778’830 trading relationships remain). As for right censoring,
it involves trading relationships observed in 2004, for which we don’t know if 2004 was the exit year.
Unlike left censoring, right censoring can be easily handled by survival methods.
Second, there is the issue of multiple spells: a trading relationship can stop and be re-established once or
several times over our 10-year period, after an interruption of one or more years.14 In our dataset 13% (in
the case of the Developing South) to 20% (in the case of the North) of the trading relationships show
multiple spells.15 In this exercise, we include only first spells duration, while controlling for the existence
of multiple spells.
Finally, trade data can suffer from measurement errors. This is particularly important in the case of
multiple spells. However if the interval between spells is just one year, the probability that this is due to
misreporting is very high i.e. no trade recorded when in reality there was trade. Overlooking this issue
could lead to the underestimation of the duration of the first spell. In order to correct for this possibility
we assume that a one–year gap is a measurement error and thus merge into one all the spells with a one-
year gap.
3.3. Control variables
Our main interest is to identify the factors that could explain the duration of trading relationships across
country groups. Our set of possibly explanatory variables consists of “gravity” type, product type, trade
costs and other standard control variables. Sources and details for each variable are provided in Appendix
2.
Gravity type variables
Rauch (1999) suggests that proximity to markets, common language and colony ties are important factors
in the establishment of business relationships. These variables facilitate business partnerships and are
most likely to influence also their success (i.e. their duration). We include distance (in log), landlocked16,
border, common language and colonial links as explanatory variables in our analysis. These are also used
in standard gravity equations. Our findings in section 2.2 suggest a positive relationship between export
duration and development, hence we add the GDP per capita (in log) of both importers and exporters to
14 In other words, a multiple spell is composed by more than one spell, each of them separated by one or several years of non-service i.e. no trade. 15 These figures refer to the situation after we corrected for the possibility of measurement errors. 16 This variable is not used in the case of the estimation that considers only emerging economies, since none of these countries are landlocked.
12
account for countries level of development. The GDP per capita is an average over the period of service
and is included in its log form for both exporting and importing countries.
Products characteristics
We control for the type of product. We follow the classification used by Rauch (1999) in which products
are classified according to their degree of differentiation: commodities or reference priced goods,
homogeneous products and differentiated products. The first category of goods refers to goods that are
traded on organized exchange markets and that involve specialized traders that centralize prices.
Homogeneous goods are goods that are not traded in organized exchange but have a reference price (for
instance quoted in trade publications). Finally heterogeneous goods are “branded” goods. We expect that
trade relationships based on differentiated goods will exhibit longer duration as they face lower
competition.
Fixed costs
To control for the fixed costs that exporters face, we use data from the Doing Business (DB) project,
namely the time required to export.17 This variable refers to the time (in days) necessary to comply with
all procedures required to export.18 In our analysis, we prefer this time variable to the number of
documents required to export (also provided by the DB database), which we consider less accurate:
countries with the same number of procedures can require a different amount of time to complete them.
We also consider the time required to import as a proxy for import costs and the time to start a business as
a control for the business environment. The Doing Business project provides data for all the 96 countries
in our sample but only from 2004 onwards in the case of the “Starting a Business” variables and from
2006 onwards in the case of the “Trade across Borders” variables. To deal with the lack of data between
1995 and 2003, we construct a set of dummies. For each cost variable we first compute the median cost
across the whole sample. The associated dummy takes the value of 1 if the cost value is higher than the
median time to export (which is 20 days) and 0 otherwise. In doing so we assume that countries that were
in the upper half (lower half) of the cost distribution between 2004 and 2008, were also in the upper half
(lower half) of the cost distribution between 1995 and 2004. This assumption is based on the observation
17 Time is recorded in days. The time calculation for a procedure starts from the moment it is initiated and runs until it is completed. The procedures include preparation of bank documents, customs declaration and clearance documents, port filing documents, import/export licenses and other official documents exchanged between the concerned parties. Logistic procedures are also included; these range from packing the goods at the factory to their departure from the port of exit, like for instance the time to load a cargo. This implies that this variable, although it refers to fixed costs, its impact on business could decrease across time as a result of learning effects. 18 Other authors have also identified time as a trade barrier, although they have only focused on the time associated to transport (Hummels, 2001; Djankov S., Freund C. and Pham C. S., 2006).

13
that variation of costs over the period 2004-2008 is relatively low. Therefore the probability of a country
switching from one half to the other over the 1995-2004 period will also be low. At the same time a
change in the ranking within one half does not affect the value of the dummy and thus of the results. We
construct three cost related variables in the same way: one for the export costs, one for the import costs
and finally one for the costs related to starting a business.
Other control variables
We also add the initial value of exports19, which can reflect the degree of uncertainty as suggested by
Rauch (1999) and Albornoz et al. (2010). We test for the impact of the macroeconomic environment (i.e.
competitiveness) by accounting for the variation in the real exchange rate with respect to the US Dollar
over the spell of each trade relationship. We control for multiple spells by adding a dummy that is 1
whenever a relationship has more than one spell. By doing so, we want to control for the possibility that
the first spell in a multiple-spell relationship is systematically shorter than single-spell relationships.20 If
that was the case and uncontrolled for that could bias the results.21 Finally, country group dummies are
included whenever relevant.
Several variables of interest such as the fixed costs indicators are exporter/importer and spell-specific. As
a consequence we can not include exporter/exporter-product fixed effects in our estimations of the Cox
model, since they would absorb most of the effect of these covariates. In all Cox specifications, however,
dummies for the initial year of the trade spell and for sectors defined at the HS 2-digit level (97 sectors)
have been included.
In probit estimations exporter-importer-product random effects can be included without affecting the set
of other covariates. Results obtained with the latter specification would give an indication of how
important unobserved export-product factors are in affecting the termination rate of a trade relationship.
4. Results
We first estimate our survival models for the whole sample. Results are reported in Table 1. We then
estimate an augmented version of the standard Cox model and the probit random effects model for each
country group separately. Results are reported in Table 2.
19 We do not include the average value since this would introduce an endogeneity problem in our estimation. 20 First spells with only one year of service in a multiple-spell relationship accounted for 67.5% of the total number of trading relationships, and first spells with less than three years accounted for 92% of the total number of trading relationships. 21 See for instance Hamerle (1989) for discussion and empirical illustration.

14
All coefficients are presented in their exponential form. A value lower than one indicates that the effect of
the covariate on the hazard rate is negative: higher values of the covariate decrease the hazard rate and so
have a positive effect on duration. A value larger than one indicates that the effect of the covariate on the
hazard rate is positive (higher values of the covariate increase the hazard rate), thus implying a negative
effect on duration.
4.1. Export survival, all countries
Table 1 includes three different specifications. Column (1) reports results obtained with a standard Cox
specification. Column (2) reports results obtained with the augmented version of the Cox model in which
non-proportionality has been treated by including some additional controls. The latter are interactions
between the log of the duration of the trade spell and those variables that according to the Schoenfeld test
appear not to have a constant effect on the hazard rate. Column (3) reports results from the estimation of
the probit model with exporter-importer-product random effects. In what follows we essentially refer to
results presented in columns (2) and (3) as column (1) results are likely to be biased due to the most
probable existence of non-proportional effects of covariates in the Cox hazard rate estimation context.
A first glance at the results obtained in columns (2) and (3) points to possibly opposite effects across
estimation strategies. The comparison is not straightforward for variables interacted with the log of
duration as the overall impact of the very variable is conditional on the value the two interacted variables
take.22 Nevertheless, the sign of the interaction still characterizes how the direct impact varies over the
length of the trade relationship.
22 Additional computations based on Ai and Norton (2003) show that the sign of the impact obtained for the interacted variable alone prevails for short duration relationships (no more than 2 years), while the sign of the estimate of the interaction (with the duration variable) term effect prevails for longer duration relationships (more that 2 years) whenever different from the former one.

15
Table 1: Hazard ratios (HR) estimates, all countries
(1) (2) (3) Variables HR HR Probit exporter GDP (log) 0.932ª 0.998b 1.069a
(0.001) (0.001) (0.001) importer GDP (log) 0.922ª 0.982a 0.987a
(0.001) (0.000) (0.001) initial trade value (log) 0.932ª 1.014a 0.926a
(0.000) (0.000) (0.000) common language 1.022ª 1.062a 1.019a (0.002) (0.001) (0.001) border 0.968ª 0.795a 0.999 (0.003) (0.002) (0.003) colonial link 0.923ª 0.990a 0.947a (0.002) (0.002) (0.002) landlocked 1.052ª 0.972a 1.063a (0.003) (0.001) (0.002) distance (log) 1.088ª 1.325a 1.086a (0.001) (0.001) (0.001) change_RER (initial) 0.999 0.982a 1.000 (0.001) (0.001) (0.000) multiple_spells 2.039ª 1.072a 1.845a (0.003) (0.001) (0.001) differentiated goods 0.950ª 0.982a 0.944a (0.003) (0.001) (0.001) homogeneous goods 1.059ª 1.005b 1.089a (0.005) (0.002) (0.003) business (time) 0.952ª 1.003a 0.988a (0.002) (0.001) (0.001) export costs (time) 0.920ª 1.080a 1.044a (0.002) (0.001) (0.002) import costs (time) 0.907ª 0.992a 1.023a
(0.001) (0.001) (0.001) time * export costs 0.819a (0.002) time * import costs 0.993a (0.002) time * initial trade value 0.942a (0.000) time * change RER 1.043a (0.004) time * distance 0.556a

16
(0.000) country group DS 1.204ª 1.028a 1.364a (0.004) (0.001) (0.003) country group ES 0.900ª 0.964a 1.020a (0.002) (0.001) (0.002) duration fixed effects - - Yes Observations 3'499'968 3'499'968 11.1*106 Id 3'496'842 Log Likelihood 23 -36'616'135 -35'065'332 -3'197'154.6 Rho - - 0.04 a Notes: Year (starting year of the trade relationhsip) and sector (HS 2-digit) fixed effects are included in all HR regressions but are not shown. The probit model includes exporter-importer-product random effects. Rho denotes to the fraction of the error variance that is due to variation in the unobserved individual factors. Errors are clustered by exporter-product. Cluster-robust standard errors in parenthesis. Significance level: a p<0.01, b p<0.05, c p<0.1
Once accounting for the latter features, the most striking contrasting results are obtained for the GDP per
capita of the exporter variable, initial trade values, the real exchange rate variable, and the three costs
variables.
In the augmented-Cox estimation the exporter GDP is found to lower the hazard rate although only
slightly. In the Probit estimation the probability of terminating a trade relationship increases with the
exporter’s GDP. This may sound counter-intuitive as we found that duration grows on average with the
level of economic development. Yet, what these contrasting results reveal is that unobserved
heterogeneity is at play. Probit results would be coherent with a situation where, once exporter, importer
and product characteristics are all taken into consideration, an increase in the internal expenditure could
redirect exports towards the domestic market. As a consequence exporters may become less eager to stay
in international markets and this reasonably could decrease the average duration of trade relationships.
This result may also reflect a greater ability of exporters in Northern countries to adjust to new markets
and business conditions implying a relatively greater turnover in products and destinations. Finally the
relationship is also consistent with the fact exporters in Northern countries are on average larger and
(potentially) generate more new trade relationships. Larger exporters tend to sell more products, serve
more markets, and are likely willing to look for more export opportunities. Yet, exploring new markets
involve higher risk and therefore greater volatility in terms of duration.
23 In Cox models the likelihood function is approximated by the pseudo-likelihood.

17
Higher initial trade values are also associated with longer duration in the probit estimation. This would
confirm the result already established in Rauch and Watson (2003).24 The opposite result is found with the
Cox-augmented model which again coulsd reflect the existence of unaccounted heterogeneity.
Results obtained with the Cox-augmented model show that the changes in the real exchange rate have a
negative impact on the hazard rate. However, the effect diminishes with duration. In other words
depreciation could lead to longer duration spells but primarily for short periods of time. However,
changes in the real exchange rate with respect to the US dollar seem not to affect the termination rate in
the Probit model estimation. Its coefficient equals one and is not significantly different from zero. It is
plausible to think that in the case of assessing the impact of changes in the real exchange rate factors that
are exporter and product specific play an important role. 25
Column (3) results show a negative effect of the business environment variable on the probability of
termination while column (2) results show an opposite effect on the hazard rate although the magnitude of
the effect remains limited. Overall we may want to take the two set of results as indicating that a sound
business environment (captured in our case by the Doing Business variable measuring the cost in terms of
days of starting a business) affects only marginally the length of trade relationships of exporting firms.
Augmented-Cox model estimation results suggest that higher export fixed costs will increase the hazard
rate but that the effect diminishes with the length of the trade relationship. Yet the results in the Probit
estimation suggest that net effect of export costs on the duration of trade relationships would be negative.
This result could also imply that the dominant effect of export costs is the one faced by new entrants in
export markets. As for the imports costs variables, they have a negative effect on the hazard rate in the
case of the Augmented-Cox model. The probit model results reveal the opposite effect. Here again,
unobserved factors are likely to be the main driver of contrasting results across estimation approaches.
Results obtained for other control variables are less controversial across estimation strategies and
essentially echo those found in the literature. We thus discuss only the results that we find the most
interesting.
24 As a robustness check, we used the average trade value as a measure for the size of the trade relationship instead of the initial trade value. Results are similar but are not shown due to space considerations. In terms of magnitude, the variation between the two sets of results is at maximum 5%. This difference could highlight the endogeneity problem that was mentioned previously and that could associated with the used of average trade values. 25 It could also be argued that the inclusion of the US in sample affect the results as their currency is the reference. We therefore run both regressions excluding the US from the sample with no significant impact on any coefficient estimates.

18
Exporting to richer destination countries is associated with longer spells. Trade relationships that are
disrupted at least once and re-established face a hazard rate/termination rate larger than trade relationships
that consist of one spell. In other words, the first spell of a multiple spell trade relationships will be
systematically shorter than single spells trade relationships. If the second spell is larger, this could suggest
that a first export experience positively affects the success of exporters’ futures experiences. Such finding
could indicate the presence of a learning effect. The analysis of the structure of multiple spells goes
however beyond the scope of this study.
As for the type of products, we choose reference priced goods as the base category. Our results show that
the hazard rate/termination rate for differentiated goods is lower than that of reference priced goods. In
the case of homogeneous goods the hazard rate/ termination rate is higher than the one for reference
priced goods. These results are comparable to those of Besedes and Prusa (2006b). Differentiated
products survive the longest, followed by reference priced goods and then by homogeneous goods. In
other words, trade duration increases as products become more differentiated. A possible explanation for
this result could be that exporters of homogeneous products such as primary goods are likely to face
fiercer competition in international market, which probably increases the probability to exit the market.
Coefficients on the country group dummies DS and ES are both statistically significant in all
specifications. The North country group is the reference group. In the Cox approach trade relationships
from the Developing South are shorter while the ones from the Emerging South last longer. With the
probit estimation we obtain that both country groups are associated with higher termination rates and thus
shorter durations compared to the North country group. Nonetheless the termination rate of trade
relationships from the ES country group is only slightly larger.
4.2. Export survival by stage of development
Results shown in Table 2 are obtained with estimations done for each country-group separately using the
augmented version of the Cox model (columns(1)) and the probit model with random effects
(columns(2)). Each country group sub-sample is made up of the exports from that country group’s
countries to the world. This exercise allows us to evaluate more formally our previous findings. We want
to identify for instance those elements that could explain the relatively high incidence of short duration
spells in the Developing South country group.
Differences in results across estimation strategies reflect to a large extent those found with estimations
based on the whole sample. In what follows, we focus on the differences observed across country groups.
19
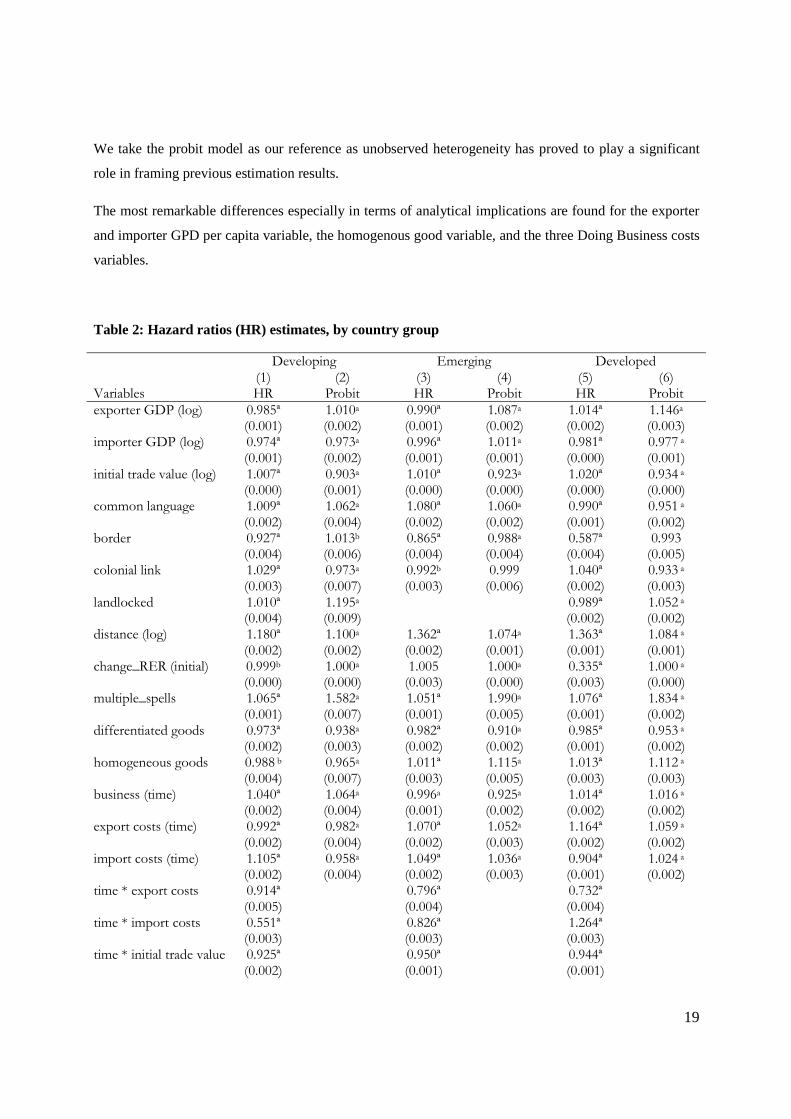
We take the probit model as our reference as unobserved heterogeneity has proved to play a significant
role in framing previous estimation results.
The most remarkable differences especially in terms of analytical implications are found for the exporter
and importer GPD per capita variable, the homogenous good variable, and the three Doing Business costs
variables.
Table 2: Hazard ratios (HR) estimates, by country group
Developing Emerging Developed (1) (2) (3) (4) (5) (6) Variables HR Probit HR Probit HR Probit exporter GDP (log) 0.985ª 1.010a 0.990ª 1.087a 1.014ª 1.146a (0.001) (0.002) (0.001) (0.002) (0.002) (0.003) importer GDP (log) 0.974ª 0.973a 0.996ª 1.011a 0.981ª 0.977 a (0.001) (0.002) (0.001) (0.001) (0.000) (0.001) initial trade value (log) 1.007ª 0.903a 1.010ª 0.923a 1.020ª 0.934 a (0.000) (0.001) (0.000) (0.000) (0.000) (0.000) common language 1.009ª 1.062a 1.080ª 1.060a 0.990ª 0.951 a (0.002) (0.004) (0.002) (0.002) (0.001) (0.002) border 0.927ª 1.013b 0.865ª 0.988a 0.587ª 0.993 (0.004) (0.006) (0.004) (0.004) (0.004) (0.005) colonial link 1.029ª 0.973a 0.992b 0.999 1.040ª 0.933 a (0.003) (0.007) (0.003) (0.006) (0.002) (0.003) landlocked 1.010ª 1.195a 0.989ª 1.052 a (0.004) (0.009) (0.002) (0.002) distance (log) 1.180ª 1.100a 1.362ª 1.074a 1.363ª 1.084 a (0.002) (0.002) (0.002) (0.001) (0.001) (0.001) change_RER (initial) 0.999b 1.000a 1.005 1.000a 0.335ª 1.000 a (0.000) (0.000) (0.003) (0.000) (0.003) (0.000) multiple_spells 1.065ª 1.582a 1.051ª 1.990a 1.076ª 1.834 a (0.001) (0.007) (0.001) (0.005) (0.001) (0.002) differentiated goods 0.973ª 0.938a 0.982ª 0.910a 0.985ª 0.953 a (0.002) (0.003) (0.002) (0.002) (0.001) (0.002) homogeneous goods 0.988 b 0.965a 1.011ª 1.115a 1.013ª 1.112 a (0.004) (0.007) (0.003) (0.005) (0.003) (0.003) business (time) 1.040ª 1.064a 0.996a 0.925a 1.014ª 1.016 a (0.002) (0.004) (0.001) (0.002) (0.002) (0.002) export costs (time) 0.992ª 0.982a 1.070ª 1.052a 1.164ª 1.059 a (0.002) (0.004) (0.002) (0.003) (0.002) (0.002) import costs (time) 1.105ª 0.958a 1.049ª 1.036a 0.904ª 1.024 a (0.002) (0.004) (0.002) (0.003) (0.001) (0.002) time * export costs 0.914ª 0.796ª 0.732ª (0.005) (0.004) (0.004) time * import costs 0.551ª 0.826ª 1.264ª (0.003) (0.003) (0.003) time * initial trade value 0.925ª 0.950ª 0.944ª (0.002) (0.001) (0.001)

20
time * change RER 1.014ª 1.048ª 3.025ª (0.003) (0.011) (0.054) time * distance 0.575ª 0.519ª 0.537ª (0.001) (0.001) (0.000) duration fixed effects - Yes - Yes - Yes Observations 544'552 1'437'660 1'176'586 3'767'051 1'778'830 5'901'568 Id 543'826 1'176'092 1'776'924 Log Likelihood -5’000’991 -509’253 -10’328’014 -1'462’704 -17’214’743 -2’399’049 Rho - 0.03 a - 0.04a - 0.04 a Notes: Year (starting year of the trade relationhsip) and sector (HS 2-digit) fixed effects are included in all HR regressions but are not shown. The probit model includes exporter-importer-product random effects. Rho denotes to the fraction of the error variance that is due to variation in the unobserved individual factors. Errors are clustered by exporter-product. Cluster-robust standard errors in parenthesis. Significance level: a p<0.01, b p<0.05, c p<0.1
Wealthier domestic markets are associated with higher hazard rates in all cases. However, in the case of
Developing South countries the effect of the GDP per capita is significantly smaller than for the two other
groups. Following the interpretation given previously, this would mean that international markets are
more important to exporters in Developing South countries than their domestic one. This would be
consistent with the fact that a sizable share of exports are of products with relatively small domestic
consumption (e.g. coffee in several African producing countries). The interpretation is to some extent
corroborated by the relative magnitude of the impact of the importer GDP per capita variable. It is the
strongest for Developing South countries. Nevertheless, richer partners are not associated with longer
duration in the case of Emerging economies.
The effect of homogeneous goods also differs significantly across country groups. In the case of the
Developing South, the corresponding coefficient is below unity, while those obtained for the two other
country groups are significantly larger than one. The results obtained with the full-sample are thus driven
by the Emerging and Developed country groups. This set of estimated coefficients could suggest that
despite an overall fiercer competition in homogenous goods markets, Developing South countries enjoy
some comparative/competitive advantage and as a consequence longer duration spells compared to the
base group.
The estimated coefficients obtained for the domestic business environment variable are coherent with
straightforward theoretical conjecture for both Developing and Northern countries. A better domestic
business environment is associated with lower termination rates. In the case of Emerging countries the
contrary is verified. There is no easy interpretation of such a result. In that context, costs to set up an
activity would act as sunk costs in the sense of Irarrazabal and Oppromola (2009) and then could give rise
to some hysterisis in exporters' behaviour.

21
For Developing South countries we find that both export and import costs are negatively related to
terminations rates. This implies that trade relationships from developing countries with high export and/or
import costs have a higher probability of survival. This result could be once again consistent with the
hysteresis mechanism. In the case of emerging and developed economies the reverse is observed. This
suggests that high export costs increase the termination rate (i.e. negatively affect duration). If the fixed
costs were to reflect mainly per-period costs this would be in line with Irarrazabal and Oppromola (2009)
who find a negative correlation between fixed export costs per–period and the persistence of export status.
Overall the number a days that need to be spent in dealing with exporting act as a sunk cost for exporters
in Developing South and as a per-period cost for exporters in Emerging South and Developed North
country groups. This difference could be due to differences in the structure and composition of exports
across the three country groups. Namely, as countries develop from an economic point of view their
exports are less exposed to time delays in export procedures.
Differences appear also for two gravity variables: common language and border. A common language is
found to increase the survival of trade relationships only in the case of exporters in the Developed country
group. This may reveal that exporters from the Developing and Emerging South groups face higher
difficulties in establishing a trade relationship even when the language is common. The existence of a
common border increases the termination rates of exporters from Developing Southern economies and
decreases, although only slightly, those of exporters from the Emerging South and Developed North. In
the case of the Developed North, the effect is not statistically significant.
We implemented a series of robustness checks. We excluded the US from all sub-samples to assess the
sensitivity of the exchange-rate variable coefficient. We also estimated a stratified Cox model to allow for
group-specific variation in the baseline hazard. We set our stratification group to be the type of product
defined at the 4-digit level of the HS classification. In all specifications results remained qualitatively
similar to those presented above.
5. Conclusions
Exporters’ survival in foreign markets is essential to achieve sustained export growth. This paper presents
an empirical investigation of possible determinants of export survival. It builds on recent theoretical
developments and empirical findings, in particular those related to the role of fixed costs to export. Our
analysis is based on disaggregated bilateral trade data for a sample of 96 developed and developing
countries over the 1995-2004 period.

22
Data reveal that the pattern of duration of trade relationships varies significantly with the level of
development of an economy. Descriptive statistics reveal a series of stylized facts that qualifies this
variation: a) more advanced countries are involved in a larger number of trade relationships than less
advanced countries; b) the extensive margin of trade is more prominent in trade relationships for less
advanced countries; c) failure rates do not vary much across groups of countries d) the time preceding
failure is considerably shorter for trade relationships in less advanced countries; e) across country groups
the majority of trade relationships have an average trade value lower than US$ 50,000 f) trade
relationships with low average trade values (less than US$ 10,000) tend to have shorter durations and g)
trade duration portrays countries’ level of development.
Some of these unconditional properties are confirmed by the results of our survival analysis. Our
estimation strategy is twofold. We use an extended version of the Cox model that relaxes the
proportionality hypothesis by including time-dependent covariates (i.e. time interaction terms) and a
Probit model with exporter-importer-product specific random effects to control for heterogeneity. Our
results show that overall trade relationships with higher initial trade values face lower termination rates.
This confirms a result already established in Rauch and Watson (2003). We also find that the duration of
trade varies with the type of product, which is in line with Besedes and Prusa (2006b). Moreover, this
result is consistent across country groups. Trade relationships involving differentiated goods show a
probability of failure that is lower than the one obtained for trade relationships involving homogeneous
goods.
As for trade costs, export and import fixed costs have a positive effect on the duration of trade
relationships in the case of the Developing South. This is consistent with predictions obtained in a model
where fixed costs to export are sunk. This gives rise to hysteresis in exporting status. Firms continue to
export even if current profits are negative. This would occur if their expected discounted profits are larger
compare to an exit-re-entry strategy in which they would have to pay again the sunk costs. In the case of
the North and the Emerging South, the opposite is true. High export and import costs increase termination
rates in these regions which is in line with theoretical predictions based on the existence of export fixed
costs to be paid on a periodic basis.
Our results highlight the challenge that survival in foreign markets is for exporters. One way of improving
export survival rates could be to implement policies that aim to increase export revenues and therefore to
consolidate exporters’ market position. As stated in Das and al. (2007), these policies can range from
having preferential access to inputs, credits, insurance to policies that reduce transports costs or any other
variable cost that firms face. According to their findings on a sample of Colombian manufacturing

23
producers, these type of policies can have a more significant impact on export revenues (per dollar spent)
than subsidies that aim to reduce the entry (sunk) costs or entry fixed costs faced by new exporters.
Indeed, such policies would not only help incumbent exporters to increase their profits and therefore to
improve their survival rates, but also encourage the entry of firms into the export market.
Further research could explore to what extent poor survival prevents developing economies from
diversifying into new products or new markets.
References AI C. R. and E. C. Norton, 2003. Interaction terms in Logit and Probit Models. Economics Letters 80(1) 123-129. Albornoz, F., E. Ornelas, H. Calvo Pardo and G. Corcos, 2010.Sequential Exporting. London School of Economics, unpublished manupcript. Akin, C. and M. A. Kose, 2007. Changing Nature of North-South Linkages: Stylized Facts and Explanations. IMF Working Paper 07/280. Baldwin, R., 1990. Hysteresis in Trade. Empirical Economics 15(2) 127-42 Baldwin, R., 1988. Hysteresis in Import Prices: The Beachhead Effect. American Economic Review. 78 (4) 773-785. Baldwin, R. and P. Krugman, 1989. Persistent Trade Effects of Large Exchange Rate Shocks. The Quarterly Journal of Economics 104(4) 635-654. Bernard, A. B. and J. B. Jensen, 2004. Why Some Firms Export. Review of Economics and Statistics 86(2) 561-569. Bernard, A. B. and J. B. Jensen, 1999. Exceptional exporter performance: cause, effect, or both? Journal of International Economics 47(1) 1-25. Besedes, T. A., 2008. Search Cost Perspective on Formation and Duration of Trade Review of
International Economics. 16(5) 835-849.
Besedes, T. and T. J. Prusa, 2007. The Role of Extensive and Intensive Margins and Export Growth. NBER Working Papers 13628.

24
Besedes, T. and T. J. Prusa, 2006a. Ins, Outs, and the Duration of Trade. Canadian Journal of Economics 39(1) 266-295. Besedes, T. and T. J. Prusa, 2006b. Product Differentiation and Duration of U.S. Import Trade? Journal of International Economics 70(2) 339-58. Box-Steffensmeier, J. M., D. Reiter and C., Zorn 2003. Nonproportional Hazards and Event History Analysis in International Relations. Journal of Conflict Resolution 64(4) 1069-1094. Brenton, P., C. Saborowski and E. Von Uexküll, 2009. What Explains the Low Survival rate of Developing Country Export Flows. World Bank Policy Research Working paper 4951. Brenton, P. and R. Newfarmer, 2007. Watching More than the Discovery Channel: Export Cycles and Diversification in Development. World Bank Policy Research Working Paper 4302. Cox, D. R., 1972. Regression Models and Life Tables. Journal of the Royal Statistical Society 34(2) 187–220. Das, M., M. Roberts and R. Tybout, 2007. Market Entry Costs, Producer Heterogeneity and Export Dynamics. Econometrica 75(3) 837-873. Dixit, A., 1989. Hysteresis, Import Penetration, and Exchange Rate Pass-Through. Quarterly Journal of Economics 104(2) 205-228. Djankov, S., C. Freund and C. S. Pham, 2006. Trading on time. The World Bank Policy Research Working Paper Series 3909. Eaton, J., M. Eslava, M. Kugler and J. Tybout, 2008. The Margins of Entry into Export Markets: Evidence from Colombia. in Elhanan Helpman, Dalia Marin and Thierry Verdier, eds., The Organization of Firms in a Global Economy, Cambridge, MA: Harvard University Press. Evenett, S. and A. Venables, 2002. Export Growth by Developing Countries: Market Entry and Bilateral Trade Flows, University of Bern working paper, unpublished manuscript. Ezell, M., K. Land and L. Cohen, 2003. Modeling Multiple Failure Time Data: A Survey of Variance-Corrected Proportional Hazards Models with Empirical Applications to Arrest Data. Journal of Sociological Methodology 33 111-167. Felbermayr, G. J. and W. Kohler, 2006. Exploring the Intensive and Extensive Margins of World Trade. Review of World Economics 142(4). Gaulier, G. and S. Zignago, 2008. BACI: A World Database of International Trade Analysis at the Product-level. CEPII Working Paper 24.

25
Hamerle, A., 1989. Multiple-Spell Regression Models for Duration Data. Journal of Applied Statistics 38(1) 127-138. Helpman, E., M. Melitz and Y. Rubinstein, 2008. Estimating Trade Flows: Trading Partners and Trading Volumes. Quarterly Journal of Economics 123(2) 441-487. Hess, W. and M. Persson, 2010. The Duration of Trade Revisited. Continuous-Time vs. Discrete-Time Hazards. Working Papers 2010:1, Lund University, Department of Economics. Hummels, D., 2001. Time as a Trade Barrier. GTAP Working Papers 1152. Irarrazabal, A. and L. D. Opromolla, 2009. A theory of Entry and Exit into Exports Markets. unpublished manupcript. Kovacevic, M. and R. Georgia, 2007. Modelling durations of multiple spells from longitudinal survey data. Survey Methodology 33(1) 13-22. Kehoe, T. J. and K. J. Ruhl, 2009. How important is the new goods margin in International Trade. Staff Report Federal Reserve Bank of Minneapolis. Mayer, J., A. Butkevicius and A. Kadri, 2003. Dynamic Products in World Exports. Review of World Economics, 139(4) 121-137. Nitsch, V., 2009. Die Another Day: Duration in German Import Trade. Review of World Economics 145 133-154. Rauch, J. E., 1999. Networks versus Markets in International Trade. Journal of International Economics 48(1) 7-35. Rauch, J. E. and J. Watson, 2003. Starting Small in an Unfamiliar Environment. International Journal of Industrial Organization 21(7) 1021-1042. Roberts, M. and R. Tybout, 1997. The Decision to Export in Colombia: An Empirical Model of Entry with Sunk Costs. American Economic Review 87(4) 545-564. Shepherd B., 2007. Product Standards, Harmonization, and Trade : Evidence from the Extensive Margin. World Bank Policy Research Working Paper No. 4390. Sueyoshi, G.T., 1995. A Class of Binary responses Models for Grouped Duration Data. Journal of Applied Econometrics 10 337-344.

26
Appendix 1
exporter region exporter region exporter region
Algeria DS Tanzania DS Australia NAngola DS Trinidad and Tobago DS Austria NBahamas DS Tunisia DS Belgium NBahrain DS Uganda DS Canada NBangladesh DS United Arab Emirates DS Czech Republic NBolivia DS Uruguay DS Denmark NCambodia DS Vietnam DS Estonia NCameroon DS Yemen DS Finland NCosta Rica DS Zambia DS France NCote d'Ivoire DS Zimbabwe DS Germany NDominican Republic DS Greece NEcuador DS Hungary NEl Salvador DS Argentina ES Ireland NGhana DS Brazil ES Israel NGuatemala DS Chile ES Italy NHonduras DS China ES Japan NIran DS Colombia ES Latvia NJamaica DS Egypt ES Lithuania NKenya DS Hong Kong, China ES Netherlands NKuwait DS India ES New Zealand NLebanon DS Indonesia ES Norway NLiberia DS Jordan ES Poland NMauritania DS Malaysia ES Portugal NMauritius DS Mexico ES Slovakia NNicaragua DS Morocco ES Slovenia NNigeria DS Pakistan ES Spain NOman DS Peru ES Sweden NPanama DS Philippines ES Switzerland NParaguay DS Singapore ES United Kingdom NQatar DS South Africa ES United States NSaudi Arabia DS Taiwan, China ESSenegal DS Thailand ESSri Lanka DS Turkey ESSudan DS Venezuela ES

27
Appendix 2
variables description source GDP per capita in US PPP for the 1994-2005 period. IMF
distance Distance in Km between the two largest cities in each country. CEPII
border Dummy variable, equals 1 if common border. CEPII
landlocked Dummy variable, equals 1 if country is landlocked. CEPII
common language Dummy variable, equals 1 if common language. CEPII
colonial link Dummy variable, equals 1 if colonial relationship. CEPII
Depreciation rate World Development Indicators
The change in the real exchange rate by spell. The exchange rate is the value of national currency in real value per USD dollars for the 1994-2005 period.
Business costs Doing Business, WB
(entry regulations)
Include the number of procedures and the time until the process is complete before a business can be established. (2004-2008)
Export costs Doing Business, WB
(Trading across borders) Include the number of export procedures and time until the procedures are completed (2006-2008).
Import costs Doing Business, WB
(Trading across borders) Include the number of import procedures and time until the procedures are completed (2006-2008).