determinants of the egyptian exports … · determinants of the egyptian exports ... changes in...
TRANSCRIPT

DETERMINANTS OF THE EGYPTIAN EXPORTS MARKET ACCESS TO THE EUROPEAN UNION+
Ahmed Farouk Ghoneim*
+ The original version of this study has benefited from financial support by the European Commission within the context of the decentralized research program FEMISE administrated by the Institute de la Méditrranée and the Economic Research Forum for Arab Countries, Iran and Turkey (ERF). This is a shorter version of the original study. The original version is available upon request from the author. The author would like to thank the participants of the round table organized by the Center of Economic and Financial Research Studies (CEFRS) on the 10th May 2000 for their helpful comments and suggestions on an earlier draft of this study. Helpful comments from Prof. Heba Handoussa, Prof. Heba Nassar, Prof. Hanaa Kheir-Eldin, Prof. Samiha Fawzy and Dr. Richard Reichel are highly acknowledged. Any errors or omissions remain the sole responsibility of the author. *Currently Lecturer at Economics Dept., Faculty of Economics & Political Sciences, Cairo University. The project was undertaken when the author was a Ph.D. Student at the Faculty of Economics, Erlangen-Nuermberg University, Germany.
Working Paper 2037

1. Introduction
While Egypt is negotiating a free trade area (FTA) with the European Union (EU)1,
hereinafter referred to as EU-Med, the issue of market access of the Egyptian exports to the EU has not been rigorously analyzed in the literature. Literature on regional trade agreements (RTAs) emphasized the benefits of a better market access as an immediate gain likely to happen due to the removal of tariff and non-tariff barriers between two parties pursuing a RTA (see for example: Viner, 1950; Balassa, 1961). However, it does not seem to be the case with the findings of the recent literature reviewed on the EU-Med. The reasons are either considering a better market access as a by-product of the dynamic gains of foreign direct investment (FDI) and technology transfer, which are only likely to materialize in the long-term, or arguing that achieving a better market access is not at least a short-term aim as Egypt already enjoys a preferential (mainly duty free) access for its manufactured exports in the EU within the context of the General Cooperation Agreement since 1977 (Hoekman and Djankov, 1997; Petri, 1997a). Moreover, agricultural exports are not likely to have a better market access due to the protectionist Common Agricultural Policy (CAP) of the EU.
The conceptual framework of the study is based on studying the factors affecting both the demand and supply functions of the Egyptian exports in the EU. The study has three major aims: to evaluate the performance of the Egyptian exports in the EU over the period 1986-1996 with special emphasis on market share developments; to analyze the determinants of market access of the Egyptian exports in the EU and; to provide some policy suggestions, based on the results obtained from the analysis, for the roles of the EU, Egyptian government and Egyptian export promotion agencies to enhance the market access of the Egyptian exports in the EU.
Following this introduction, Section Two provides a detailed analysis of the development of the Egyptian exports’ performance and market share in the EU over the period 1986-1996. Different levels of data disaggregation (ranging from 1 to 4 SITC digit level) are made use of and other regional importing markets are brought into perspective to provide a comparative dimension in the analysis. Some measures
1 The European Union was formerly named the European Economic Community (EEC) since 1957 till
1993. With the entry into force of the Treaty on European Union (Masstricht treaty) and the inception of the Single Market in 1993, the EEC was named European Union (EU) and the EEC Treaty (Rome treaty in 1957 establishing the EEC) was renamed EC Treaty. See Weidenfeld, Werner and Wolfgang Wessels (1997), Europe from A to Z, Guide to European integration, Luxembourg: Office for Official Publications of the European Communities, see esp. p. 228.
of export data analysis are utilized to examine the performance and the development of the Egyptian exports in the EU
2. Based on the results obtained from such analysis,
Sections Three and Four discuss a number of determinants that are highly related to the market access of the Egyptian exports to the EU. They are divided in two subsets of determinants (external/demand and internal/supply). The external/demand determinants include: historical trade preferences given to the Egyptian exports by the EU; competition among some other Mediterranean Non-member Countries (MNCs)
3;
competition due to exports of Central and Eastern European competitors; non-tariff measures (NTMs) included in the EU-Med agreement between Egypt and the EU (mainly antidumping and rules of origin) and finally; the link between FDI and exports. Internal/supply determinants include: non-tariff barriers (NTBs) from the Egyptian side; inefficient services provided to promote exports; role of export promotion agencies and; absence of coordination among producers. Section Five concludes and provides some policy suggestions to be adopted by the EU, Egyptian government and Egyptian export promotion agencies to promote exports within the context of the EU-Med agreement and increase their market access and share in the EU.
2. Analysis of the Performance Development and Market Share Status of the Egyptian Exports in the EU
We start by specifying the special characteristics of the Egyptian exports in the EU market and investigate whether they are different from features of the Egyptian exports in other regional markets or not (Section 2.1.). Secondly, we use two simple quantitative measures to assess the performance of the Egyptian exports in the EU market. Measures used include: the concentration ratio and rate of introducing new
2 The EU referred to here in the analysis consists of the currently 15 members of the EU together with
Iceland and Switzerland. The inclusion of 15 members of the EU in the analysis is accounted for since 1986, though some current members were not yet members during the period of the analysis (1986-1996). This is not likely to bias the results obtained due to the small share the late members (Austria, Finland and Sweden) constitute in the total imports of the EU from Egypt. Incorporating Iceland and Switzerland is one of the limitations of the data base used which does not allow their separation. The inclusion of Iceland and Switzerland, as well, is not expected to bias the results due to the trivial amounts of their imports from Egypt which does not exceed 1-2 percent of the total exports of Egypt to the EU. 3The MNCs include 12 countries: Egypt, Morocco, Tunisia, Algeria, Syria, Lebanon, Jordan, Palestinian
Authorities, Israel, Turkey, Cyprus and Malta. The EU-Med agreements aim towards implementing bilateral FTAs between the EU on one hand and each of the MNCs on the other hand as a first stage. At a latter stage, the EU-Med initiative aims toward extending the bilateral FTAs between the EU and each of the MNCs to an overall FTA covering all the MNCs and the EU. It should be noted that the negotiations with Turkey (already concluded a customs union with EU), Cyprus and Malta aim towards future accession of these countries to the EU.
export products as a proxy for diversification (Section 2.2.). Finally, we invoke a specific methodology that incorporates developments on the demand side (i.e., changes in imports on the behalf of the importing partner) together with the supply side aspects (i.e., changes in exports on the behalf of the exporting partner) to explain the progress of the Egyptian exports market share in the EU over time. We refer to this methodology as an Egyptian Exports Matrix (Section 2.3.).
2.1. Characteristics of the Egyptian Exports in the EU
Geographical distribution of Egyptian exports and development of market shares:
Table 1. traces the development of the regional distribution of the Egyptian exports over the period 1987-1996.
Table1. reveals that Egyptian exports have shifted towards industrialized countries in general and to the EU and North America in specific and diverted away from developing countries. However, such development was not translated in increased market shares of the Egyptian exports in all industrialized countries as shown in Table 2.
A comparison of Table 1. and Table 2. reveals analogous developments in the share of exports directed to regional markets as percentage of total Egyptian exports and the market shares of Egyptian exports in different markets with a notable exception of the EU. On the one hand, exports directed to the EU have been increasing with a sustainable rate as a percentage of the total Egyptian exports and, on the other hand, Egyptian exports have been losing market share in the EU. The explanation of the loss in market share in the EU despite the increase of the Egyptian exports directed to the EU as percentage of total Egyptian exports lies in the relationship between 3 variables, namely; the rate of growth of Egyptian exports directed to the EU, the rate of growth of total Egyptian exports and the rate of growth of total EU imports. In this case, the rate of growth of exports directed to the EU was higher than the rate of growth of total Egyptian exports and lower than the rate of growth of EU imports.
Compositional structure and compositional change:
Table 3. shows the compositional structure and compositional change of the Egyptian exports directed to the EU and other regional markets at a 1 SITC digit level over the period 1987-1996. The percentages shown in Table 3. are related to each market in isolation. For example, in the food and animals category (SITC 0) in 1987, 3.95 percent of the total Egyptian exports to the EU were concentrated in this category whereas 1.45 percent of total Egyptian exports to North America were in this category. As can be deducted from the table, Egyptian exports to the EU are
concentrated in two main SITC groups, group 3 (mineral fuels, etc.) and group 6 (basic manufactures). Within those two main SITC groups there are 3 main 3-digit SITC group products that dominate the lion’s share in group 3 (SITC 333 Crude Petroleum, SITC 334 Petroleum byproducts refined and SITC 335 Residual petroleum products, nes), and 3 main 3-digit SITC group products dominate the lion’s share in group 6 (SITC 651 Textile yarn, SITC 652 Cotton fabrics, woven and, SITC 684 Aluminum).
As evident from Table 3. the structure of the Egyptian exports directed to the EU shares a high degree of similarity with the structure of the Egyptian exports directed to other destinations. A number of characteristics of the compositional structure and change of the Egyptian exports are worth commenting on. First, the percentage of the Egyptian exports of food and animals (SITC 0) in total Egyptian exports directed to the EU is higher than the counterpart percentages of exports directed to Japan and North America and lower than that directed to the developing countries. The higher percentage of food and animals products in the total structure of the Egyptian exports directed to the EU when compared to North America and Japan can be a result of the preferential treatment, though highly constrained as will be discussed later, granted to some of the Egyptian agricultural exports by the EU. Second, the decline in the share of mineral fuels (SITC 3) in total exports directed to the EU is common among other regional markets too. Such phenomenon is probably due to price fluctuations of oil rather than a matter of structural change in the supply of exports. Third, the miscellaneous manufactured products (SITC 8) group is experiencing a high growth rate, thus resulting in its increased share of total exports directed to the EU. This increase is shared among Egyptian exports directed to other markets too, though with different degrees. This is a positive development, since SITC 8 on average consists of manufactured goods with a relatively high value added compared to other SITC groups that Egypt is relatively specialized in exporting (SITC 3 and 6).
2.2. Simple Measures of Egyptian Exports Performance in the EU
Concentration ratio:
The concentration ratio of the Egyptian exports in the EU is investigated by cumulating the percentage share of the largest ten exports (at a 3-SITC digit level) for the years 1987, 1991 and 1996. The calculation revealed positive developments over the period investigated where the concentration ratio of the largest 10 export commodities declined from 90.79 percent in 1987 to 86.96 percent in 1991 and finally to 80.63 percent in 1996. However, most of the positive development is attributed to the decline in the share of oil and oil products which can be a result of price fluctuations more than being a real improvement, despite the usage of moving average

method to lessen the effect of such price fluctuations. Seven products remained dominant as large exports. The seven dominant products included petroleum oils, petroleum products refined, aluminum, textiles yarn, cotton, vegetables and, cotton fabrics.
To assess the development of the concentration ratio of the Egyptian exports in the EU on a comparative dimension, similar analysis was undertaken for the Egyptian exports directed to Japan, North America, industrialized countries (aggregated) and developing countries (aggregated). Accordingly, Egyptian exports to the EU have performed relatively worse than exports directed to the other regional markets in terms of the number of dominant products (with the exception of aggregated industrialized markets). It performed similarly to other markets in terms of the declining trend of the concentration ratio with the exception of the aggregated developing markets which performed relatively better. However, this declining concentration ratio is mainly attributed to the oil price fluctuations.
Diversification:
To analyze the diversification performance of the Egyptian exports in the EU and other regional markets a simple measure was utilized. The number of new products at a 4 SITC digit level introduced in the Egyptian exports structure, each constituting at least 0.2 percent of the total Egyptian exports directed to each market separately, was counted in 1987, 1991 and 1996. Table 4. shows the results obtained for that measure. When comparing the diversification of the Egyptian exports in the EU with diversification in other markets, two results are obtained. First, the Egyptian exports directed to the EU are more diversified (as share of total Egyptian exports to EU) than exports directed to other regional export markets in industrialized countries. However, it remains lagging behind the achievement of exports diversification in developing countries markets. Second, the rate of increased diversification of the Egyptian exports in the EU, trend wise, is in a middle position when compared to other markets.
The two measures; concentration ratio and diversification, provide us with a comparative view of the performance of the Egyptian exports especially when related to the performance of the Egyptian exports in other regional markets. Though the concentration ratio revealed that exports directed to the EU are performing modestly when compared to other regional markets, the diversification measure did not confirm such relative modest performance. Moreover, the characteristics of the Egyptian exports, in terms of compositional structure and change, did not enable us to identify any particular trends that show that the performance of the Egyptian exports directed to the EU deviated largely from the behavior of the Egyptian exports directed to other
markets. The main reason for the inability of such measures to explain the different trends of market share development of the Egyptian exports in the EU compared with other markets is mainly embedded in their emphasis on the supply side without considerable attention to the developments on the demand side. It is worth noting that measures of exports performance utilized in the literature (see for example, Hoekman, 1995; Petri, 1997a) concentrate only on the supply side issues and neglect the developments happening in the importing market. Hence such measures are not sufficient if our main concern is studying the market share and market access conditions rather than exports performance. Consequently, other measures that incorporate both demand and supply conditions are still needed to explain the different developments of the Egyptian exports market shares which is the aim of what follows.
2.3. Egyptian Exports Matrix:
This subsection explains the changing patterns over time of market shares of the Egyptian exports in the EU. A methodology that incorporates changes in demand in the importing partner together with developments of the supply side in the exporting country is utilized.
A Methodological Note:
The analysis provided divides the Egyptian exports in the EU into four categories: Rising Stars, Declining Stars, Missed Opportunities and Retreats.
Rising Stars are exports that satisfy two conditions: First, they have enjoyed an increase in the overall demand (not confined to Egyptian exports) by the EU, measured by their increased share in the structure of total European imports. Second, Egypt was able to increase its market share in those specific exports, measured by share of the exports of those specific commodities from Egypt to the overall imports of those commodities by the EU. Note that such classification is independent on the absolute changes in the level of the total Egyptian exports to the EU and independent on the increase in the relative share of this export commodity in the overall export structure of Egypt. Thus, for example, we can have a commodity A that has enjoyed absolute increase in its growth rate and a relative increase in its share in the structure of the Egyptian exports, however, due to changes in the demand conditions of that specific commodity in the EU, that commodity failed to enjoy an increased market share in the EU. Moreover, such methodology helps in reducing the biased effect of the dominance of oil exports and their price fluctuations on the analysis. These conditions are better explained mathematically as follows:
Let Mi be the value of imports of commodity i , where i n= 1,....

M j be the value of all imports originated in exporting country j which is equivalent
to the total exports of country j
hence; Mij represents the imports of commodity i from the exporting country j
Let the final year be FY and the base year be BY
Consequently a Rising Star would satisfy the following:
M Mi FY M Mi BYii
n
ii
n
= =∑ ∑⟩
1 1
( ) ( )
and;
M M FY M M BYij i ij i( ) ( )⟩
whereas an absolute increase in imports of the EU of commodity i ( Mi ) or a relative
increase in the Egyptian exports of the commodity i ( M Mij j ) does not guarantee
an increased market share for Egypt in the EU for that commodity i . The increase in market share is mainly dependent on the relation between Mij (the supply side) and
Mi (the demand side) in both time periods FY and BY . The relation between Mi
and Mii
n
=∑
1
in both time periods FY and BY has no direct effect on the market share
of the commodity i , however, it has an indirect effect. For if the growth rate of Mi
is higher than the average growth rate of Mii
n
=∑
1
starting from the BY then this
indicates that Mi is a dynamic import ending up with a higher ratio of M Miii
n
=∑
1
in
the FY than in the BY . Consequently, it is expected, however, with no guarantee that M Mij i can increase if the exporting country was able to satisfy the increase in
Mi by increasing its exports of product Mij with the same/higher rate than the rate
of increase in Mi .
Alternatively, a Declining Star would satisfy the following criteria:
M Mi FY M Mi BYii
n
ii
n
= =∑ ∑⟨
1 1
( ) ( )
and
M M FY M M BYij i ij i( ) ( )⟩
which is the case of a commodity whose demand is apparently stagnant or declining in the importing country, however, the exporting country is still able to increase its market share.
The third case is the Missed Opportunity which satisfies the following criteria:
M Mi FY M Mi BYii
n
ii
n
= =∑ ∑⟩
1 1
( ) ( )
and;
M M FY M M BYij i ij i( ) ( )⟨
In this case the commodity is experiencing an increased demand in the importing country (i.e. dynamic), however, the exporting country failed to match this increased demand and hence its market share fell.
The last case is Retreat which satisfies the following criteria:
M Mi FY M Mi BYii
n
ii
n
= =∑ ∑⟨
1 1
( ) ( )
and;
M M FY M M BYij i ij i( ) ( )⟨
which is the case of a stagnant or declining commodity in the import market as well as on the supply side.
Following this annotation, an exporting country can only increase its market share if its exports were concentrated in Rising Stars and/or Declining Stars. Rising Star is the optimum case as it predicts that the demand for this product is expanding and hence the possibilities for increasing market share are optimistic. Declining Stars, on the other hand, despite their role in increasing market share do not provide an optimistic view for potential export chances as the relative demand on such products in the overall structure of imports in the importing market is decreasing. Moreover,
maintaining the current level of exports in a declining market might create friction among exporters as well as between exporters and the importing country as the smaller cake (imports of the related commodity in the final year) has to be distributed among the same number of exporters compared to the case when the cake was relatively larger (imports of the related commodity in the base year). Missed Opportunities provide, as their name indicates, lost chances of expanding imports, however, with insufficient supply from the exporting country resulting in lost market share
4. Finally, Retreats represent a case of exports where the exporting country has
lost market share, nevertheless, the demand for such commodities was declining as well, thus implying that future prospects of exporting such commodities were not optimistic. The following table summarizes the reasons of changes in market share according to this classification.
Having said that, it should be noted that such analysis is highly sensitive to two aspects: First, the time period investigated and the base and final years chosen. To overcome this sensitivity, a three years moving average was used instead of particular years, with the exception of 1996 which used a two years moving average as it was the end of the time series available for the author. Second, the analysis is highly sensitive to the degree of data disaggregation utilized. Implementation of the exercise at a 1 SITC digit-level is expected to yield different results from analysis using a 2 or 3 or 4 SITC digit-level classification. This is mainly due to problems associated with SITC data aggregation. Therefore, caution should be taken in interpreting the results when aggregation is employed. The best interpretation for the Matrix is to compare the performance of exports between the two time periods identified. In this study, we present the Exports Matrix of Egypt in the EU at a 1 SITC digit level. To gain more insight on the case of the Egyptian exports in the EU market another 2 Export Matrices at a 4 SITC digit (with and without crude oil exports) are constructed.
The 1 SITC level matrix of the Egyptian exports in the EU explains the different patterns in changes of the Egyptian exports market share in the EU, however on a highly aggregated level of data analysis. The large decline of the Egyptian exports share from 0.28 percent of the total import market of the EU in 1986 of the import
4 Theoretically speaking, Missed Opportunities can result in an increased market share if the increase in the
ratio of the imported product to the overall imports was substantially higher than the decrease in the market share of the exporting country in that particular product. However, such a possibility according to the empirical investigation undertaken in this study never appeared whether at a 1 SITC digit level or at a 4 SITC digit level. By the same token, Declining Stars can result in reduced market share if the decrease in the ratio of the import product to the overall imports was substantially higher than the increase in the market share of the exporting country in that particular product. Again, empirical investigation did not support this case at any level of SITC classification.
market of the EU to 0.19 percent in 1990 (recall Table 2.) is mainly attributed to the fact that 86.73 percent of the Egyptian exports were included in the missed opportunities and/or retreats categories (losing market share categories) whereas only 13.28 percent were included in the rising stars and/or declining stars categories (gaining market share categories). Over the period 1990-1996, the percentage of exports belonging to missed opportunities and retreats categories decreased substantiality to 5.41 percent of the Egyptian exports in 1996 whilst the share of Egyptian exports belonging to rising stars and/or declining stars increased considerably to a share of 93.8 percent of the Egyptian exports in 1996 (this increase is highly affected by high level of aggregation where for example oil exports (SITC 333) which dominates the SITC 3 moved from retreats category, in this level of aggregation, in the first period to declining stars category in the second period moving with it all other subsectors of SITC 3, a problem resolved afterwards by imposing the disaggregated version of the matrix which is likely to yield more accurate results). This increase in the share of rising stars and/or declining stars mitigated the negative effect of the declining share of exports belonging to missed opportunities and/or retreats which in turn lessened the market share deterioration of the Egyptian exports share to 0.16 percent of the import market of the EU in 1996. This analysis which took in consideration both supply and demand sides of the Egyptian exports was able to portray, more precisely, the mechanism of the deterioration of the Egyptian exports market share in the EU over time. If analysis was devoted only to demand side aspects by considering the dynamic imports of the EU, a false interpretation is likely to result. For example, in the first period considered, a higher percentage of Egyptian exports was concentrated in the dynamic imports of the EU (rising stars and missed opportunities) than the second period considered, nevertheless, the market share of the Egyptian exports in the EU in the first period happened to experience a relatively worse deterioration than the second period. A wrong indication is likely to result if analysis was confined to the supply side, proxied by the Egyptian exports which increase with a higher percentage growth rate than the average growth rate of the total Egyptian exports directed to the EU (dynamic exports) resulting in a higher share of those dynamic exports relative to the total Egyptian exports directed to the EU. If the first period is considered in the case of EU, we find that SITC sectors 6 and 9, on average, were considered dynamic exports, however, they did not contribute to the increase in the market share of the Egyptian exports as they were classified as missing opportunities. In the second period, SITC 3, on average, contributed to the increase in the market share, however it was considered a declining export (i.e., its share in total Egyptian exports directed to the EU declined). Moreover, SITC 5, on average, which was considered a dynamic export, did not contribute to the increase in the market share of the Egyptian exports in the EU as it was classified as a missed opportunity.

The case of the Egyptian exports directed to the EU reveals positive and negative developments. On the negative side is the decline of share of exports relative to total Egyptian exports to EU belonging to the rising stars in the second period compared with the first period. On the positive side, is the decline in the share of exports belonging to retreats and missed opportunities in the second period compared to the first period. This positive development, nevertheless, was translated to an increase in share of exports belonging to declining stars, which though helped to reduce the rate of decline in the market share, remained non-optimal relatively to the case if they would have been translated in increases in rising stars, which would have had more opportunities for increased market share. To sum up, the huge deterioration of the market share of the Egyptian exports in the EU over the period 1986-1990 is largely due to the concentration of the Egyptian exports in retreats. The relatively positive development achieved in the period 1990-1996 is largely due to the concentration of exports in declining stars. Hence, the utilization of Export Matrices at a 1 SITC digit-level enabled us to understand the mechanisms by which market share changes occur over different time periods.
The exports matrix at a 1 SITC digit level remained short in revealing details about a specific market. The high level of aggregation led to the un-precise classification of commodities as rising stars, declining stars, missed opportunities and retreats as the dominant subgroups pull other subgroups in the direction of their performance development in the importing market. Consequently, the same exercise was repeated at the most detailed level of data available (4 SITC digit level). The produced matrix confirmed the trends observed in the 1 SITC digit level matrix, but it provided more precise magnitudes for the exports percentages belonging to rising stars, declining stars, missed opportunities and retreats as shown in the consolidated results represented in following Exports Matrix (see below). For example, whereas it increased the share of exports belonging to rising stars, it reduced the share of exports belonging to declining stars, however the same trends of gains in market shares were reserved, though with reducing the gap between them in the two periods considered. This shows how this analysis is very sensitive to the degree of data disaggregation as mentioned before. Finally, the positive developments in the second period relatively to the first period are confirmed by counting the export products which enjoyed RCA. In the first period, they were only 53 products at a 4 SITC digit level and increased to 77 in the second period mostly concentrated in declining stars.
The results obtained from the Exports Matrix at 4 SITC digit level helped to provide a clearer view of the developments in market share of the Egyptian exports in the EU, however, it remained largely affected by crude oil exports (SITC 3330). Therefore, to obtain a clearer view, the exercise was repeated with excluding the crude oil exports
which represented 59.75 percent of total Egyptian exports directed to the EU in 1990 and 44.55 percent in 1996. Thus, the following matrix deals with the total Egyptian non-crude oil exports directed to the EU. Removal of crude oil exports affected the percentage of Egyptian exports concentrated in retreats and magnified the relatively positive developments obtained in the second period when compared with the first period.
After showing the mechanism by which the market share of the Egyptian exports in the EU changes over time and how it is subject to both supply and demand considerations, which affect the ratio M Mij i
and how these changes occur over time
the question now is what are the determinants (external and internal) that affect this ratio precisely in the EU which is the subject of analysis in Sections 3 and 4.
3. External Determinants of the Egyptian Exports Market Access to the EU
In this subsection a number of external determinants of the Egyptian exports market access to the EU are investigated as identified in the Introduction
5.
3.1. Historical Preferences under the Old General Cooperation Agreement
In January 1977 the General Cooperation Agreement (GCA) was signed between Egypt and the European Community (EC). It included provisions for an improved market access of Egyptian exports in the EC market accompanied by financial assistance within the context of Financial Protocols and technical assistance
6. Similar
GCAs were signed with other Mashreq and Maghreb countries (including Syria, Jordan, Morocco, Tunisia and Algeria). The GCAs were characterized by certain features among which are the one sided trade concessions granted by the EC for exports from the aforementioned Maghreb and Mashreq countries with duty free access for most of the industrial products and preferences for agricultural products; “sensitive” commodities as textiles, yarn and fabrics and processed agricultural products were excluded from the duty free access treatment and were in most cases
5 It should be noted that the categorization of some of the external determinants might seem ambiguous. For
example, in the case of historical preferences under the old General Cooperation Agreement (Section 3.1.), the problem might be the inability of the Egyptian side to utilize effectively such preferences, thus rendering it as a supply side problem. The FDI link with exports (Section 3.5.) could be as well viewed as supply side issue. Thus, the categorization of external/demand and internal/supply determinants is a subjective matter chosen by the author. 6For more details on the Egyptian exports preferential treatment under the GCA see Shalaby (1997),
Chapter One.

subject to quotas7; the application of the Most-Favored-Nation (MFN) tariff on the EC
products exported to the associated Maghreb and Mashreq countries was applied; additional Protocols to mitigate the negative effects of the accession of Spain and Portugal to the EC on the agricultural exports of Maghreb and Mashreq countries in the Community market were signed bilaterally with each country (European Commission, 1995: p. 21).
To judge whether Egypt was able to benefit from the preferential treatment provided by the EU within the context of the GCA, it is important to differentiate between the status of industrial and agricultural products.
The industrial products:
Regarding the effectiveness of the preferential treatment and despite the free access of the Egyptian industrial products to the EU, the low or zero MFN tariff applied by the EU on its industrial imports in general eroded part of the preferential treatment granted to the Egyptian products. For example, 58 percent of the Egyptian total exports to the EU directly before the Uruguay Round enjoyed zero MFN tariff rate, leaving only 14 percent out of total Egyptian exports to the EU enjoying a preferential treatment, probably zero tariff rate under the General System of Preferences (GSP
8),
(see Table 6.) (For more details see Shiells and Subramanian, 1996; Yeats, 1994). The rest of exports, 27 percent, were either subject to quotas or other constraints as those applied to agricultural goods. Moreover, the 14 percent of Egypt exports to the EU which had a preferential treatment are likely to face either total or partial erosion of this treatment as a result of the liberal trade commitments that the EU has made in the last Uruguay Round where a reduction of 40 percent on average of MFN tariff rates were decided to be undertaken by OECD countries. Consequently the Egyptian products could be displaced by other competitors which were denied similar preferences given to Egypt
9.
Apart from the preferential treatment of the Egyptian exports in the EU that will be eroded, a major problem is embedded in the non-tariff barriers (NTBs) that EU
7 The rules governing the access of Egyptian industrial exports to the EC market and the textile quotas
which were similar to quotas under the Multi-Fiber Arrangement were included under Article 9, 10, 11, 12, 13, 14, 15 and 16 of the General Cooperation Agreement respectively. The rules governing the agricultural exports were included under Articles 17, 18, 19 and 20 and amended by the additional protocol signed in 1987. 8 There is a complication in that ceilings or quotas may be applied to products receiving GSP treatment in
OECD markets. Once these quotas are exceeded further imports are taxed at the prevailing MFN tariff rate. 9 For a similar argument see Yeats (1994), p.33.
applies against the Egyptian exports. The GATT described the GCAs with the Mediterranean countries to suffer from several NTBs, and few agricultural preferences that are mostly subject to ceilings (cited in Winters, 1993: p. 117) indicating that the EU is partly responsible for the sluggishness of the Egyptian exports’ market access. NTBs are mainly directed to the two group of commodities, namely, processed foodstuffs and textiles, besides high tariff rates that are imposed by the EU on those two types of products. For example, the highest tariffs in the EU are 35 percent duties on various pastry products exported from Egypt while several jam and fruit preserve products face tariffs between 27 to 30 percent. European quotas similar to Multi-Fiber-Arrangement (MFA) restrictions are applied to almost all of Egypt’s yarn and fabrics exports with quotas on cotton yarns primarily responsible for the 98 percent coverage ratio for SITC 65(Yeats, 1994: p. 37).
But let us examine the development of the Egyptian non-agricultural and non-oil exports market share in the EU between 1986 and 1996 to stand on the ability of Egypt to utilize the preferential treatment (i.e., we exclude SITC 0 and 3). Calculating the market share of all Egyptian exports, with the exception of SITC 0 and SITC 3 revealed that the Egyptian exports have been losing market share (as percent of total European imports) where it declined from 0.062 in 1986 to 0.055 in 1990 and further to 0.045 in 1996 (calculated from TradeCAN Database). Moreover, we can obtain some indication of whether the failure of Egypt to enjoy the preferential treatment is due to demand and/or supply conditions. According to the methodology identified in Section 2.3. if the share of the Egyptian exports was merely concentrated in declining stars, then it is a matter of demand conditions that constrained Egypt from utilizing the preferential treatment whereas if it fell in missed opportunities then the problem was mainly embedded in supply conditions. The classification of rising stars and retreats is hard to interpret where demand and supply conditions are moving in the same directions (when considering their share at a certain point of time), however their development over time can give some useful indication of the Egyptian exports orientation (when considering their trend). Table 7. shows the classification of Egyptian exports with the exclusion of SITC 0 and 3 over the two periods 1986-1990 and 1991-1996.
As can be deducted from the table most of the Egyptian exports, excluding SITC 0 and 3, were concentrated in declining stars over the two periods identified implying that demand conditions were not favorable for the commodities in which Egypt was increasing its market share. Though the declining stars and missed opportunities absolute share in total Egyptian exports increased, this increase can be due to the decrease of oil exports prices and share in total Egyptian exports and/or the increase in the number and thus the value of the other commodities (belonging to all SITC

groups excluding SITC 0 and 3) exported which inflated the share of exports in total Egyptian exports shown in the table from 28.57 percent in the first period to 34.09 percent in the second period. Therefore when adjusting the total absolute shares to 100 percent as shown in the figures in parentheses, we find that the relative share of declining stars and missed opportunities remained the same. The significant change actually happened in the rising stars where the percentage of the Egyptian exports belonging to them decreased over time which is certainly a supply problem as the demand conditions were favorable. The increase in the share of exports belonging to retreats is a bad sign as well as it implies that Egyptian exports are getting more and more concentrated in commodities that are losing market share and as well are facing declining demand in the EU. This implies that for industrial products, demand conditions were unfavorable from the beginning to the type of exports Egypt was relatively heavily exporting (declining stars). However, over time, the main reason for the deterioration of the market share is mainly due to supply responses as identified by the increase of share of exports belonging to retreats and the decrease in share of exports belonging to rising stars.
Despite the optimistic attitude of some prominent economists regarding the cutting down of the NTBs facing Egyptian exports as a result of the commitments made by the EU and other OECD countries in the last Uruguay Round
10, it does not seem to be
the case in reality. The reason is that most of the exports in which Egypt enjoys a revealed comparative advantage (RCA) belong to the declining stars category (e.g., SITC 65 of textiles). The concentration of Egyptian exports in this category creates a lot of protective measures from the EU side and intensifies the competition among exporters over a stagnant market in the EU. Consequently, it is expected that simultaneously with the decline and abolishment of quantitative restrictions, the Egyptian textile industry will face other restrictive measures. The same is true for other sensitive industries as the processed food industry.
Agricultural products:
According to the GCA and the additional protocols, the Egyptian agricultural exports were subject to a number of rules and regulations: Some of the agricultural exports as green beans, dried onions, garlic and cucumbers were allowed a duty free entry during
10
“As a result of the UR NTM concessions, the profile of protection facing regional countries’ exports has been altered substantially. Post-Uruguay Round NTM coverage ratios should fall from their current 10 percent level to between 1and 2 percent. The average decline for Egypt will be dramatic- the ratio will fall from 32 to approximately 2 percent. Essentially, this is due to the fact that all NTBs formerly applied to Egyptian and other regional countries; agricultural products, textiles , clothing and ferrous metals have been removed” (Yeats, Alexander, 1994: p. 45).
a specific period of the year and up to a fixed quota. Some products, as tomato, were allowed a duty free entry during a specific period, without any quantitative restrictions (Delegation of the European Commission in the Arab Republic of Egypt, 1996: pp. 4-5; for a comprehensive discussion of the access conditions of MNCs agricultural products to the EU see Tangermann, 1997). Table 8. shows the development of the Egyptian agricultural exports market share together with the development of the European agricultural imports developments.
Table 8. shows that Egypt has increased its market share in commodities related to SITC 0 despite the protectionist CAP of the EU. This does not imply that the CAP did not have an effect on the market access of the Egyptian exports as some might conclude especially that the European imports belonging to the products in which Egypt is exporting have experienced an increase in their share of the total European imports as the third row in the table shows. The methodology identified above helps us to examine whether the demand conditions were restricting the Egyptian agricultural exports market access in the EU or rather it was a matter of supply conditions which proved to be rigorous in the case of industrial exports. By the same token adopted in Table 7. we classify the Egyptian agricultural exports (SITC 0) to rising stars, declining stars, missed opportunities and retreats as shown in Table 9.
Table 9. reveals that the Egyptian agricultural products to the EU were concentrated in rising stars which explains the ability of Egypt to increase its market share in this protectionist market. However, what is troublesome is the increasing share of the Egyptian agricultural exports that belong to declining stars which increased dramatically to 3.12 percent of the total Egyptian exports to the EU (44 percent of the total agricultural Egyptian exports to the EU) between 1991-1996 compared to the period of 1986-1990 where it only accounted for 0.83 percent of the total Egyptian exports to the EU (21 percent of the total agricultural Egyptian exports to the EU). The small percentage of the Egyptian agricultural products belonging to missed opportunities in the two periods confirm that the problem was not related to the supply side. On the contrary, the increased percentage of agricultural exports belonging to declining stars, whereas retreats have a low constant share and rising stars have a high constant, though slightly declining, share over the two periods show that the problem of the agricultural exports market access in the EU is demand driven. The increase in the share of Egyptian agricultural exports related to declining stars has led to several protectionist measures on behalf of the EU and is likely to continue in the future. Thus it can be argued that Egypt could have increased its market access and obtained a larger market share if the demand conditions were favorable for its agricultural products, which is unfortunately not the case. The role of the EU in hindering the market access of the agricultural exports is vivid in many cases as

follows: the Egyptian agricultural exports had to follow the aforementioned rules which could not be described as fully free access to the EU as claimed by some European institutions
11. There was a high degree of rigidity in changing the timing of
entering the Egyptian agricultural exports duty free to the EU market. Such timings were set up in 1988 (due to the additional protocol in 1987 after the accession of Spain and Portugal) and did not change till the year 1997. Given the nature of the agricultural cycle, the production timing of such products was not coping with the duty free entry to the EU market. Another example revealing the bias of the European Union’s agricultural policy against the Egyptian products is the case of potatoes in 1988. The customs union (CU) agreement of 1988 between the EC and Cyprus had adverse implications on the Egyptian exports of early potatoes that compete with those from Cyprus. Yet, the GCA did nothing to safeguard the Egyptian position. The total value of Egyptian exports of agricultural commodities fell from $127 million to $104 million during the period 1989-1992 (Wilson, 1994: p. 271). Other examples include the variable import levies facing cane molasses (Egypt’s largest food export with over $9 million traded) and the reference import prices encountered by Globe Artichokes and fresh oranges (Yeats, 1994: p. 44). Such biased treatment against the Egyptian agricultural products led to a loss of the preferential treatment granted to them under the auspices of the GCA
12. Moreover, southern accession (of Spain,
Portugal and Greece) has increased internal opposition to the concessions provided for the Egyptian agricultural exports in the EU (Winters, 1993: pp. 118-119).
On the other hand, Egypt was also partly responsible for losing the preferential treatment provided by the EU for its agricultural products. Egypt failed in many cases to meet the requirements and standards of the EU, which in turn lessened the capability of many products as potatoes and onions to penetrate the EU market and exploit their assigned quotas
13.
To sum up, the old GCA was not successful in increasing the market access of the Egyptian exports to the EU (whether industrial or agricultural products). In the case of
11
Such terms for market access were ironically described by the Delegation of the European Commission in Egypt to have duty free access to the European market where the report argues that 70 percent of the Egyptian agricultural products are allowed a duty free access to the EU. It assumes that such rules and conditions do not affect the duty free access. See Delegation of the European Commission in the Arab Republic of Egypt (1996), p. 4. 12
for more details on the issue of the GCA rules rigidity in respect to Egyptian agricultural exports see Shalabi (1997), op.cit., pp. 14-15. 13
Noted in: Al-Bayomi (1996), p. 6.
industrial products, the problem was mainly supply driven whereas in the case of agricultural products the failure is mainly attributed to demand conditions.
3.2. Competition Among Mediterranean Non-member Countries
Table 10. provides a comparative static view of the development of some trade measures in Egypt and other MNCs. It reveals that Egypt’s trade integration in the world economy is lagging behind other MNCs. It has the weakest performance among its competitors in the Mediterranean basin whether in terms of trade integration (column 4) and has experienced the worst development of exports regarding their ratio to GDP (column 1 and 2) compared to a positive development achieved among its competitors.
Thus, the performance of the Egyptian exports can be clearly seen to have experienced a sluggish if not deteriorating development over the last two decades when compared to other MNCs in the sample shown. Such performance is reflected in the development of market shares of different MNCs exports in the EU as shown in Table 11..
Table 11. shows that MNCs can be classified into three categories: (a) countries that gained substantial market share: Tunisia, Morocco, Syria, and Turkey. (b) countries that maintained their market share: Jordan, Lebanon, Cyprus, Israel and Malta and; (c) countries that lost significant market share: Egypt and Algeria. Egypt’s rank among MNCs market shares in the EU decreased from the 4th in 1986 to the 6th in 1996 where Morocco and Tunisia have surpassed Egypt significantly.
Whether this differences in the relative performance of the exports of Egypt and other MNCs could have had an effect on the demand of the EU for the Egyptian exports has been investigated in the literature utilizing two main measures. The measures used were similarity in export profiles and correlation index of the RCA among different MNCs. One study that has dealt with the issue of correlation index of RCAs between MNCs is Havrylyshyn (1997) where he calculated a correlation index for global exports RCA among MNCs for the period 1991-94 at a 3 SITC digit level. He concluded that the RCAs among MNCs exports are different implying that the competition between MNCs in global markets is not likely to be vigorous and thus in our case there will be no substitution of the Egyptian exports in the EU by exports of MNCs. The other measure utilized in the literature is export similarity. Finger and Krenin (1979) have provided this measure. If the countries’ exports are completely identical the measure will take the value of 100. However, this measure can bias our results in the case of Egypt when compared to other MNCs which do not share the same exports structure that is heavily dominated by oil exports. Similarly, it can lead

to high similarity indexes with oil exporting countries and low indexes with non-oil exporting countries since it depends on the share of exports in the total exports of Egypt whereas it could be that Egypt has an exports structure more similar to a non-oil exporting country if the RCA or imports market share are the basis of comparison.
Our approach to test the similarity of exports between Egypt and other MNCs follows a slightly different track from that of Havrylyshyn (1997). We will calculate the RCA for the Egyptian exports in the EU market and not globally in three different years, 1986, 1990 and 1996 (see technical Note No. 2 for elaboration on how RCA was calculated). We will then list the first 20 products with the highest RCA together with the market share of those products in the EU and the percentage they count for in total Egyptian exports in each respective year. We then investigate whether some of the MNCs have a RCA in those products or not. We examine three countries which we believe that they might have substituted the Egyptian products. Those countries include Tunisia, Morocco and Turkey. Other countries are excluded due to the different production structures they maintain and thus the possibility that they might substitute the Egyptian products on average is minimized (recall the substitution of the Cyprus potatoes for the Egyptian ones). Moreover, Turkey, Tunisia and Morocco are the only three countries (besides Syria) that have increased their market share substantially over the period 1986-1996 where over the same period it was only Egypt and Algeria that have lost market share substantially. Thus, if any substitution would have occurred, then it is likely to have come from those three rivals. Table 12. lists the commodities at a 4-SITC digit level in which Egypt had the highest RCA.
As shown from the table, Egyptian products with the highest RCA did not change much over time.12 commodities featured prominently in the three years. The next step is to question the status of the three rivals (Tunisia, Morocco and Turkey) regarding those commodities. The same exercise was undertaken for Tunisia, Morocco and Tunisia. The exercise showed that there is high correlation between the RCA of Egypt and that of Tunisia, Morocco and Turkey in the products which Egypt enjoys the highest RCA in the EU. In 1986 Morocco had RCA in 8 products out of the list of 20 products with the highest RCA in Egypt whereas Tunisia had RCA in 6 and Turkey in 12. In 1990, Morocco had 9, Tunisia 7 and Turkey 10. In 1996, Morocco had 12, Tunisia 7 and Turkey 13. Egypt enjoyed having RCA in 5 products in 1986, 6 in 1990 and 3 in 1996 in which the other countries did not acquire a RCA. The fierce competition comes mainly from Turkey, followed by Morocco and finally Tunisia. This implies, contrary to the findings of Havrylyshyn (1997), that Egypt has similar RCA with some of the MNCs. Consequently, it can be argued that the market share gained by the aforementioned MNCs is likely to have affected the loss in market share of the Egyptian exports in the EU or at least have constrained the increase in market
share that could have been gained in some products. Moreover, such impact is likely to be reinforced in the future when Turkey becomes a full member of the EU as announced in the Helsinki Summit that took place in late 1999.
3.3. Competition due to Exports of Central and Eastern European Competitors
In 1991, EU concluded a series of association agreements “Europe Agreements”14
with a number of Central and Eastern European countries (CEECs) (Bulgaria, Czech. Republic, Hungary, Poland, Romania and Slovak Republic). In the Helsinki Summit the EU announced the future accession of 8 CEECs (the aforementioned countries in addition to Estonia and Slovenia) to the EU. Some analysts expect that the accession of those countries to the EU will have negative impact on the MNCs due to different reasons, among the most important are; trade diversion, investment diversion, the substitution of guest workers from the MNCs by workers from CEECs, and the substitution of MNCs by CEECs in outward processing trade arrangements
15 (OPT)
(see for example Sideri, 2000; Alessandrini, 2000). Others argue that despite the similarity in the RCA of some products between the two regions yet the competition is likely to be more intense within the regions rather than between the regions (Hoekman and Djankov, 1998: p. 290). Two studies have intended to investigate the similarity between export profiles of CEECs with MNCs. Hoekman and Djankov (1998) calculated the correlation between RCAs (to the whole world) for a number of countries in the two regions (calculation of the correlation of RCAs of Egypt was not solely calculated) and concluded that similarity of export profiles is evident in some cases, but on average the correlation of RCAs within the MNC per se is much stronger than with that of the CEECs. Another study (Tovias, forthcoming) used the exports similarity index identified in the above subsection. He concluded that in the case of Egypt there is a high similarity in export profiles with Estonia, Latvia and Lithuania (Estonia is an announced future member whereas Latvia and Lithuania are possible potential members, though not identified above). His results are possibly due to the high share of oil exports in the total structure of exports of those countries. The approach we are going to adopt to check for the impact of the exports of such
14
The Europe Agreements are highly similar to the EU-Med agreements. However, they are said to be more “deep” than the EU-Med agreements as they entail the right of establishment in some sectors (absent from the EU-Med, or at least postponed for future negotiations), temporary movement of natural persons is allowed in the case of services provision and there are special provisions for maritime and air transport services. 15
Outward processing trade agreements are agreements where a specific product is exported from a country to another to be further processed (assembled and/or partly manufactured) and then re-exported back to the first country. Among the MNCs, Tunisia and Morocco have made muse of this system while Egypt was not successful in utilizing it. For more details see Alssandrini, 2000.

countries on the Egyptian exports market access in the EU is similar to the one we used in the case of Tunisia, Morocco and Turkey. Our intention is to check to what extent do CEECs have RCA in the EU in the same top 20 list products with the highest RCA in Egypt in the EU (Table 12.). Data limitations allowed us to check only for Bulgaria, Hungary, Poland and Romania to which disaggregated data at the 4 SITC digit level were available.
Contrary to the findings of Hoekman and Djankov (1998) and Tovias (forthcoming) the exercise showed that there exists overlapping between the commodities in which Egypt enjoys high RCA in the EU and those commodities with high RCA in CEECs. The most fierce competition comes mainly from Bulgaria and Hungary whereas Poland and Romania provide lesser threat to the exports of Egypt in the EU. Moreover, the overlapping RCAs seem to appear in all different kinds of commodities ranging from agricultural products (SITC 0) to manufactures (SITC 5, 6, 7 and 8) to oil and mineral products (SITC 2 and 3).
To sum up, market access of the Egyptian exports in the EU and consequently its market share is highly affected by competitors from MNCs and CEECs. Turkey seems to be the strongest competitor followed by Morocco, Bulgaria and Hungary. Tunisia, Poland and Romania have a significant effect though not strong as that of the other aforementioned countries.
3.4. Conditions for Market Access in the EU-Med agreement
Our aim in this subsection is not to provide a general discussion of the EU-Med expected economic impact on Egypt (see for example the two volumes edited by Galal and Hoekman, 1997 and; Fawzy, 1997), but rather to pinpoint two important factors that are likely to affect the Egyptian exports market access in the EU namely, the usage of antidumping by the EU against the Egyptian products and the issue of rules of origin. The choice of those two factors stems from their importance as factors that can threaten the duty free access of the Egyptian exports in the EU. The negative impact of those two factors on members in RTAs has been thoroughly discussed in the literature (see for example, Bhagwati, 1995; Finger, 1993; Hoekman and Leidy, 1993 and; Hoekman, 1998), however examining their effect in the EU-Med context has been scarce (see for example on antidumping: Ghoneim, 1999; UNCTAD, 1998 and for rules of origin see Friedrich-Naumann Stiftung, 1996) emphasizing the need for further research in this area.
Our approach depends on the reservoir of the available historical information on antidumping and on determination of rules of origin in contemporary RTAs to
anticipate the impact of those two factors on market access of the Egyptian exports in the EU.
Antidumping:
The MNCs, on average, were not a target of the EU antidumping policy where only two countries have been affected by the EU antidumping actions (Turkey and Egypt) out of the 12 MNCs over the period 1978-1999 (WTO, 1999).
The frequency of antidumping cases initiated by the EU against Egypt intensified between 1990-1995 (3 cases) compared with only one case between 1978-1989. The frequency of cases initiated was further intensified after 1995 where 3 cases happened between 1996-1999. Moreover, it is important to note that all the affected products enjoyed a high RCA and a significant market share in the EU in the years preceding the initiations of the cases (with the exception of cotton fabrics, bleached, the case that was initiated in 1997). To study the impact of the antidumping initiations on the market share of the affected Egyptian products we build up our opinion on the available data for two cases. In the case of cotton yarn, the case that was initiated in 1990, Egypt had a market share of 6.08 percent in 1988 and a share of 6.01 percent in 1990. Two years after the initiation of the case the share declined to 5.66 percent. The share of cotton yarn in total Egyptian non crude oil exports to the EU was 16 percent in 1988 and 15 percent in 1990 and declined to 12 percent in 1992. In the case of wire rod case initiated in 1991, Egypt had a market share of 0.71 percent in 1991. Two years afterwards the share declined to 0.42 percent. The share of wire rod in total Egyptian non crude oil exports to the EU was 1.2 percent in 1991 and declined to 0.66 percent in 1993. Thus, it can be argued that the antidumping cases affected negatively the market access of the Egyptian exports in the EU. Though the case of wire rod shows that market share was insignificant, the case of cotton yarn shows the contrary. Our data set does not enable us to check the market share of bed linen and cotton fabrics, unbleached (the two cases that were initiated in 1996) after the initiation of the cases, but the market shares of those two products were rather significant in 1994 (1.82 percent for bed linen and 3.7 percent for cotton fabrics, unbleached) so as well their share in total Egyptian non crude oil exports to the EU in 1994 (2.4 percent for bed linen and 4 percent for cotton fabrics, unbleached). Consequently, we conclude that the antidumping ‘harassment effect’ is evident in the two cases of wire rod and cotton yarn. The harassment effect is the effect through which exporters are either reluctant to export to the market in which its antidumping authorities have initiated an antidumping case, fearing from being subject to antidumping duties, or reduce their competitive punches in the concerned market by raising the prices they ask for their products, thus leading at the end to a reduced market share as well (for literature on the harassment effect of antidumping see Tharakan, 1995 and; Hindley and Messerlin,
1993). This can have negative impact on the market access of the Egyptian products in the EU though the cases discussed show that the impact, till now, has not been substantial.
Rules of Origin:
Restrictive preferential rules of origin, say in the EU (to differentiate it from the non-preferential rules of origin that are applied to non-members of a FTA) leave producers and exporters (say in Egypt) with two choices. They have to import their inputs and intermediate goods from the EU to satisfy those rules of origin and enjoy a duty free access for their products in the EU, however, this might imply trade diversion. The other choice is to continue importing from the low cost suppliers outside the EU and forego the duty free treatment of their products in the EU. In both cases, it is evident that restrictive rules of origin negatively affect the market access of the Egyptian products in the EU if the EU suppliers were not the lowest cost providers of inputs and intermediate goods. The economic literature is full of evidence of the success of influential lobbying groups tailoring the preferential rules of origin to cope with their protectionist aims in FTAs as in the case of NAFTA (the textile and clothing manufacturers in the US heavily affected the preferential rules of origin of yarn, see Bhagwati, 1995; Palmeter, 1993). The same is true for the EC-EFTA FTAs( Woolcok, 1996). The message is that ‘sensitive sectors’ as textiles will always suffer from extremely high restrictive rules of origin imposed by the stronger member in a FTA. Consequently, we expect that rules of origin in the EU-Med reflect this dimension of restriction in sensitive sectors. But how does the EU-Med compare on average with other FTAs worldwide regarding the issue of restrictive rules of origin?
The determination of rules of origin within the context of the EU-Med incorporates some positive aspects that lend their categorization to be described as relatively liberal. For example, the EU-Med allows Egypt to cumulate its inputs with other MNCs that have concluded similar FTAs with the EU as well as among themselves and that adopt the similar set of rules of origin (diagonal cumulation) to satisfy for the required rules of origin of a certain product when exported by Egypt to the EU. However, such liberal provision remains idle in practice due to the adoption of the Maghreb countries (Morocco and Tunisia) of a different set of rules of origin from that adopted by Egypt. The low-intra regional trade between Egypt and the MNCs Mashreq countries deprives Egypt from the utilization of such liberal aspect (In 1994, Egyptian products from MNCs Mashreq countries accounted for only 3.8 percent of total Egyptian imports whereas its exports accounted for only 2.4 percent of its total exports, see Petri, 1997a).
The EU-Med contains two positive aspects namely, the “roll-up” system and the “General Tolerance Rule”. Under the “roll-up” system, once a product acquires an Egyptian origin, the percentage of non-originating products or value used in the manufacture of the product is no longer considered. This system is said to make the ROO more liberal. The ‘General-Tolerance Rule’(sometimes referred to as de minimis principle or provision) permits the use of the inputs of a third non-member country to the EU-Med in an amount that exceeds the normal criteria specified by the preferential ROO as long as they do not exceed 10 percent of the value of the product exported (ex-works price
16) to be granted the preferential treatment under the context
of the EU-Med (Taha, 1998). This gives the system some flexibility and helps minimize the number of cases in which production or processing decisions are based on the need to gain origin status. This compares to NAFTA where the “roll-up system” was absent and the EU-Med was relatively more generous in the application of the ‘General-Tolerance Rule’ (10 percent compared to 7 percent in case of NAFTA).
The ‘sensitive sectors’ contain a mixture of restrictive and non-restrictive rules of origin (For more details see El-Diwany, 1996). A major loophole that can withdraw the benefits of relatively liberal rules of origin in the EU-Med is the Article concerned with the issue of “duty drawback”. The EU-Med establishes a broad prohibition to the granting of drawback
17, or any exemption for custom duties on imported inputs, when
those inputs are used to manufacture products for export to the EU (to be applied after four years from the entry into force of the EU-Med). However, all manufactured products can be granted a concession of duty drawback refund in the range of 5-10 percent if Egyptian authorities apply for. As this Article reveals, the fact that this duty drawback is not automatically granted to the Egyptian exporter, rather has to be applied for by the related Egyptian authorities (probably Customs Authority), throws doubts on the effectiveness of such provision. Furthermore, the burden of proving that no exemption from the duty drawback refund was granted is placed on the exporter,
16
Ex-works price means the price paid for the product ex-works to the manufacturer in whose undertaking the last working or processing is carried out, provided the price includes the value of all the materials used, minus all internal taxes which are, or may be, repaid when the product obtained is exported. See: Protocol No. 4, Article 1 in the Tunisian-European Partnership Agreement. 17
At the time of writing, the author was informed by the head of the Egyptian negotiations team of the EU-Med, Ambassador Gamal Al-Bayomi that duty draw back provision in the EU-Med has been changed where Egyptian exporters to the EU can continue to enjoy a refunding of the differences in duties between the Egyptian and the EU MFN rates. However, since the agreement was not still signed and there was no official document stating such change in the possession of the author (the draft of the agreement that the author possess states the prohibition of the duty draw back), it was decided to leave this part as it is.

who must present to the competent authorities all necessary documents attesting to the fact. The effect of this provision will vary from an exporter to another depending on his usage of imported inputs. However, it can be argued that an elimination of existing duty drawback is likely to offset the benefits of the duty free access to the EU. Moreover, there is an obvious discrimination in the European treatment to other MNCs. While this prohibition was mentioned in the FTA between the EU and Israel (Friedrich-Naumann Stiftung,1996) as well as in the ‘Europe Agreements’ with the CEECs
18, it has not been the case with other countries. In the case of the MNCs, and
especially in the cases of Tunisia and Morocco, no special Article was devoted to this issue in their EU-Med agreements
19.
To sum up, theoretically speaking EU-Med rules of origin do not seem to be so restrictive, especially when compared with those of NAFTA, and despite the difficulty in anticipating their impact on the market access of the Egyptian products in the EU their seem to be no particular evidence that they can hinder it substantially. However, the issue of denying the benefits of ‘duty drawback’ to Egyptian exporters wishing to export to the EU will have an influential effect on the market access of the Egyptian products. Moreover, the adoption of different MNCs for different sets of rules that determine ROO means that in practice that diagonal cumulation will continue to be idle.
3.5. Link between FDI and Exports
The main two questions that this subsection will try to answer are: What was the relation between FDI and market access of the Egyptian exports in the EU over the period 1986-1996? And what are the expectations for the future regarding this link?
To answer the first question it is important to review the relationship between FDI and exports in Egypt. FDI inflows to Egypt had the main intention of serving the local market and not exploiting Egypt as an exporting platform. This has been documented in several studies where the correlation between FDI and exports—including products in which Egypt enjoys a high RCA as textiles and processed food— has been weak (Khatab, 1997: pp. 102-104; UNCTAD, 1999: p. 19). Other studies have confirmed the continuity of such trend where FDI has been directed to projects with minimal interest in exporting activities (see for example Petri, 1997b: p. 29). Thus, despite the
18
In the cases of Eastern and Central European countries, they were allowed for being granted the duty drawback in the range of 5-10 percent, depending on the kind of product for a transitional period of two years that can be extended. See: Taha ,1998. 19
See the Tunisian and Moroccan-European Partnership Agreements, the Articles related to the rules of origin.
pervasive shift of FDI interest from import substitution to export oriented activities (Lawrence, 1996: Chapter Two), this has not been the case with FDI directed to Egypt. Among the reasons for such inward orientation of FDI are the high tariff barriers supplemented by large market size, when measured by the population size, and high fixed production costs which result in high profits when serving the local market compared with foreign markets. Indeed, a study found that a producer receives a premium of 21.7 percent for serving the local market and not exporting (Nathan Associates, 1998). The results of these studies imply that the relationship between FDI and exports in general has been weak. This in turn leads to the conclusion that the relationship between FDI and market access of the Egyptian exports in the EU has been weak as well.
Regarding the future relationship between FDI and exports within the context of the EU-Med, two arguments could be raised. The first argument is concerned with the positive correlation between additional FDI inflows and joining RTAs that has been observed in some countries as Spain and Portugal after joining the EC. However, such correlation has not been pervasive as in the case of Greece which did not enjoy this increase of FDI inflows upon joining the EC (Petri, 1997b). Moreover, the recent evidence of FDI data for some of the MNCs that have concluded EU-Med agreements (Turkey, Morocco, Tunisia and Jordan) do not confirm such positive correlation. Therefore, it can be argued that based on empirical data for analogous countries, there is nothing that confirms an upsurge of FDI (whether export oriented or inward oriented) when the EU-Med between Egypt and the EU enters into force. On the contrary, the hub and spoke argument which asserts the possibility of the concentration of FDI in EU (hub) instead of the MNCs (spokes) as producers located in the EU can enjoy free access to EU and MNCs, in contrast to producers located in Egypt who will have free access only to the EU and not the MNCs, unless they conclude FTAs among them. The hub and spoke argument is supported by the high tariff rates prevalent in Egypt as well as other MNCs and the different rules of origin they acquire which prevent the MNCs from the utilization of accumulation of inputs to enjoy the duty free access of their exports in the EU.
The second argument is concerned with the shifting of interest of the incumbent FDI in Egypt to serve foreign markets. The answer for the possibility of this shift of interest lies in the incentive structure for FDI, and investment in general, of the profitability of different options (serving the local or the foreign markets). So long the profitably of selling in the local market is higher than exporting, the interest of FDI will remain inward oriented. Despite the efforts of the Egyptian government to overcome the institutional impediments (enacting of Law 8/1997 which aims to increase FDI inflows through increasing the economic sectors in which it can

approach, tax breaks and additional incentives) and other impediments that raise trade-related transaction costs (e.g., port services reforms), there has not been any efforts to improve the main structural incentives for exporting. Among such impediments are the high import tariff rates (the average weighted rate was 28 percent in 1996 compared to an average of 21.4 percent for developing countries see Alonso-Gamo, Fennell and Sakr, 1997: p. 13) accompanied by an overvaluation of the Egyptian pound (which has appreciated in real terms by more than 50 percent between 1991 and 1998, see Radelet, Sachs and Cook, 1999: p. 15). Such main features of the Egyptian economy do not allow to anticipate any possible change of FDI interests to serve the foreign markets and hence strengthen the relationship between the FDI and market access of the Egyptian exports in the EU.
To sum up, the relationship between FDI inflows and market access of the Egyptian exports to the EU has been weak and is likely to continue to be so in the future so long the Egyptian government does not correct the incentive structure for exporting by insisting on having high MFN tariff rates and overvalued real exchange rate.
4. Internal Determinants
This section deals with the Egyptian “home grown” determinants of the market access of the Egyptian exports to the EU as identified in the Introduction. As evident from the list of the internal determinants, it is not comprehensive. It does not deal for example with other major determinants as the role of the exchange rate and the problem of the “quality gap” of the Egyptian exports. Excluding those important determinants is mainly because of insufficient data on “the quality gap” and the space limitations to deal with the problem of the overvalued exchange rate and its impact on the market access of the Egyptian exports. Nevertheless, it should be noted that other studies in the case of quality gap problem (Petri, 1997a) and the exchange rate overvaluation (Nathan Associates, 1998; Radelet, Sachs and Cook, 1999) have concluded that such two factors have a negative effect on the development and performance of the Egyptian exports.
4.1. Non-Tariff-Barriers (NTBs) on the Egyptian Side
To start with, we have to confine our definition of NTBs within the framework of the study. Thus the NTBs include all the directly and indirectly related inefficient policies and institutions (excluding the provision of services and the promotion of FDI which are dealt with in other subsections) in Egypt that hinder the promotion of exports and consequently affect their market access to the EU. This subsection will be concerned with only export restrictions and quality control procedures for imports as examples of NTBs.
Regarding export restrictions, Egypt had performed relatively well in eliminating all export restrictions, which include three measures, namely export quotas, export bans and prior approvals on exports (Kheir El-Din and El Dersh, 1992). The trade reform started in 1991 under the auspices of the Economic Reform and Structural Adjustment Program (ERSAP). Export quotas were completely eliminated in 1993 whereas export bans which covered 20 items before 1991 were reduced to two items in 1993 which were further planned to be removed in 1998. Items requiring prior approvals for exporting were reduced to only one item in 1991 down from 37 items (Refaat, 1999: p. 10). Thus, all quantitative controls and prohibitions on exports of certain commodities have been eliminated, except for governmental monopoly control over Egypt’s cotton exports, which is scheduled to be eliminated within Egypt commitments under the WTO agreement (RIS and MOE, 1998: p. 43). Moreover, the abolishment of NTBs was complemented by the removal of export duties. A survey undertaken to test the perceptions of the exporting community in Egypt towards a number of institutional impediments revealed that the customs procedures related to exports have improved substantially in the last five years (Ghoneim:2000). Two major impediments remain significant for exporters regarding exporting procedures. The first is the unofficial payments paid to customs officials which increase the transaction costs of the exporting process and hence reduce the competitiveness of the Egyptian exports. The second is the method adopted in reporting the weight of commodities exported where a wrong reporting, even if insignificant, on behalf of the exporter which can be due to the use of different balances (of the exporter and the customs authority) or being affected by exogenous factors (e.g., climate in case of agricultural products) can result in imprisonment for the exporter
20.
Having said that, NTBs affecting exports directly seem to have diminished to a large extent and do not represent a major obstacle in hindering the market access of the Egyptian exports to the world in general and to the EU in specific.
The NTBs that affect exports indirectly are mainly related to the imports side. Exporters depend on imports as inputs in their production process (especially if they are exporting manufactured products). Several obstacles are related to this issue, besides the high tariff rates on imports that Egypt continues to apply even after the latest tariff cuts in the Uruguay Round which resulted in a decline of the maximum tariffs by 20-25 percent (see Table 13.). Among the most significant NTBs is the non-recognition of internationally known certification bodies or international standards. This raises the costs for traders and reduces the incentives for enterprises to employ
20
Based on an interview with exporters of ready made garments undertaken by the author.

services of certification entities and increase their awareness of the importance of quality standards in international trade. Governmental organizations involved in the importing bureaucratic process are voluminous. Quality control (inspection) by the General Organization for Export and Import Control (GOEIC) is illustrative. It increases the transaction costs and raises the amount of time consumed by traders. The GOEIC inspects a sample of every consignment of goods entering Egypt that is on a list of products subject to quality control. Some 1,550 tariff lines (25 percent of tariff schedule) are subject to quality control. The GOEIC reportedly ignores internationally recommended methods of testing and certification, and in many instances does not recognize internationally known and accepted quality and certification marks (such as that of the EU or the International Standards Organization) (Hoekman, 1995: pp. 4-5; Delvin and Page, 1999: p. 4). Recently, a presidential decree No. 106/1999 was announced that aimed to consolidate all the activities of the aforementioned agencies and institutions in one stage undertaken by the GOEIC where representatives of such agencies perform their job there. The decree announced, as well, the adoption of what has been called the “White List” where traders that have developed a good reputation in adhering to quality and standard rules be exempted from the cumbersome procedures of GOEIC and only random checking might be applied to their products (an exception are food imports). The zeal of such celebrated presidential decree was to reduce the transaction costs of trade activities in Egypt. However, the author is skeptic of any substantial positive effect of this decree for the following reasons: First, the decree opted for a ‘positive list approach’, the so called “White List” where only the exporters and importers that have developed good reputation are allowed to benefit from this special treatment. This means that all exporters and importers are considered “guilty”, in terms of having bad reputation of conforming to standards and quality, till they prove otherwise. Have the approach been a “negative list approach” where all exporters and importers are considered “innocent” till they prove otherwise the decree might have had substantial positive effects. Second, by exempting certain exporters and importers from the cumbersome procedures of customs clearance and quality control, the government is discriminating against other traders. The reason is that those privileged traders are probably dominant figures in the exporting and importing processes where they have been used to circumvent the awkward procedures and thus it does not affect the trade activity per se, though it might still reduce their profits. Other non-dominant traders and/or potential ones have to face these clumsy procedures, which in turn reduce their initiatives to trade (export and import) and hence leading at the end to reduced market access and market share of the Egyptian exports in foreign markets as the EU.
Thus, while the abolishment of a large number of NTBs affecting exports directly have been well implemented, the NTBs that affect the exporting process indirectly have become prominent, despite the recent governmental efforts to overcome them. The proposed EU-Med Article concerned with harmonization of customs procedures and rules and regulations affecting trade could certainly have a positive impact in this respect. This is certainly one of the major institutional gains (though difficult to quantify) that Egypt can accrue from pursuing the EU-Med agreement where the importation of pre-tested internationally compatible institutions can decrease the transaction costs of Egyptian exporters and hence improve the market access of the Egyptian exports in the EU.
4.2. Inefficient Services Provided to Promote Exports
Our main intention in this subsection is two-folded. First, to show the channels through which inefficient services affect the performance of the Egyptian exports in general and hence their ability to penetrate the EU market. Second, to pinpoint two major pitfalls of the recent domestic reforms undertaken in the services sector which affect the market access of the merchandise goods in the EU.
There are three main channels by which inefficient domestic service sector can negatively affect the performance of exports. The three main channels include: high transaction costs, crowding out of FDI and/or skewed investment incentives and, negative effect on the balance of payments.
High transaction costs:
Inefficient services in Egypt have resulted in high transaction costs. Several studies have found that doing business in Egypt is costly. One of the main reasons behind this result was inefficient services sector (high price/low quality) besides bureaucracy and red tape measures (see for example Fawzy, 1998; Galal, 1996). High transaction costs have negative impact on reducing the competitiveness of the Egyptian exports. Evidence from cross-country analysis has shown that inefficient services have a negative impact on increasing production costs and reducing output (World Bank, 1998b: pp.2-4). But what about the case of Egypt in specific? The following examples related to the port services give an impression of the severity of the problem and its negative impact on the performance of exports. In the case of port services, a study found that the comparative cost of shipment and loading of a container in Egypt in 1994 was higher than that of Jordan, Syria and Turkey by approximately 27 percent, 22 percent and 19 percent respectively (cited in Mohieldin, 1997a: pp.244-245. See also World Bank, 1995: p. 23). Thus, while freight costs to Europe, for example, are lower than other countries, the costs of loading and stevedoring are higher, which make the total cost in Egypt the highest compared to other countries in the
Mediterranean region. Consequently, Egypt's proximity to Europe does not count for much, given these export inefficiencies (for more details see for example Benham, 1997: p. 14). Similar examples of inefficient services (high price/low quality) can be found in other sectors as telecommunications (Ibid.: p.4).
Crowding out of fdi and skewed investment incentives:
Inefficient protected services markets have negative effects on the allocation of resources and investment incentives (Hoekman and Primo Braga, 1997). A study found that the structure of the effective rate of protection
21 (ERP) in Egypt is
completely different when one considers the cost of inefficient services (Hoekman and Djankov, 1997). The simulation exercise, carried out in the aforementioned study, proved that a large number of manufacturing industries which currently enjoy high positive ERPs (due to the high tariff rates that Egypt adopts on analogous products to their output) will suffer negative ERPs during and after the implementation of the EU-Med (as they lose protection on their goods but continue to be confronted with input prices that are higher than they would be if service markets were contestable). This means that the efforts of the Egyptian government to promote investment (domestic and foreign) in certain sectors are hindered by the absence of an efficient services sector. Moreover, there is substantial evidence that FDI in services accompany FDI in manufactures to provide the needed efficient services (see for example Lawrence, 1996). As long as the Egyptian government willingness to liberalize its service sectors is limited and/or unclear and/or not “anchored”
22, it is likely that Egypt will suffer
from a dual effect of crowding out of FDI. First, existing FDI in non-services activities (industry and agriculture) will flow to other countries which have efficient services infrastructure and other favorable conditions for FDI. Second, the potential FDI in services will be diverted to other countries as long as it faces impediments in
21
Effective rate of protection is not a measure of the cost of protection, since all it does is provide information on differences on the level of protection across industries without taking into account the quantity of output that is protected (industry size). Its simplest formula for calculation is as follows:
gt a t
ai i
i
=−−1
where g is the effective rate of protection, t is the nominal tariff rate on the final
commodity, ai is the ratio of the cost of inputs to the price of the price of the final commodity in the
absence of tariffs and, ti is the nominal tariff rate on the inputs (in our case it is equivalent to the high
prices of domestic services due to inefficiency which acts as a tax on exporters.) 22
by anchoring we mean that Egypt binds the domestic reforms by locking them in an international agreement as the GATS or a regional agreement as the EU-Med, which prevents backsliding on such reforms or rather make it too costly to backlash.
contesting the Egyptian services market. The end result is low investments (domestic and foreign) in the manufactures and consequently low export performance.
Negative impact on the balance of payments:
One of the main counter-arguments for not liberalizing trade in services is the fear from its negative impact on the balance of payments. This argument presumes that developing countries are at a comparative disadvantage in the provision of services (for a review of such arguments see for example World Bank, 1998b: pp. 14-15). If we concentrate on the case of Egypt, we find that such an argument is false as revealed by the RCA that Egypt enjoys in commercial services
23 (see ERF, 1998: p.
71) and by the currently positive contribution of the services to the current account. Moreover, Egypt featured on the list of the largest 40 world exporters of commercial services in several years (which never happened in the case of merchandise goods) where the latest ranking of 1998 placed Egypt in the 32nd position with a share of 0.6 percent of the total world trade in commercial services (see WTO website: http://www.wto.org/statis/stat.htm, Date: 17/4/2000). The curing of the chronic deficit in the balance of merchandise goods, which is increasing, can be achieved, at least partly, through the provision of efficient services, specially if they constitute a large share of the production costs. Thus, opening the services sector in Egypt to foreign competition might have negative impact on the balance of trade in services (its final outcome will depend on many variables, including the development of the Egyptian exports of services which could enjoy an increase if its cost of dependency on other services decrease as a result of liberalization, e.g. the decrease in the telecommunication costs for the hotel and tourism services). But, on the other hand, it is likely to have a positive effect on the balance of trade in merchandise goods, if the liberalization of the services sector is translated to a competitive and contestable efficient services markets. Moreover, the General Agreement on Trade in Services (GATS) allows for safeguard measures that can be utilized in case of severe balance of payments problems. The point that has to be clearly made is that an inefficient services sector can exacerbate the weak performance of the Egyptian exports and hence have a negative impact on the balance of payments problems rather than reduce it.
23
According to the International Monetary Fund Balance of Payments Classification, commercial services constitute of: transportation (sea, air and other); travel (business and personal); other services (communications, construction, insurance, financial, computer and information, royalties and license fees, other business services, personal, cultural and recreational and government services not identified elsewhere).

Pitfalls of the current domestic reforms:
The negative consequences of an inefficient service sector on the exports’ performance in Egypt are obvious as shown above. Despite the efforts of the Egyptian government to eliminate the inefficiency in the services sector (as for example Law 8/1997), these efforts still remain short of being sufficient. A study carried out in 1999 investigated the perception of the exporting community towards the provision of different services in Egypt and its effect on their trading activity (Ghoneim, 2000). The study showed that the exporting community believes that the last five years have witnessed a positive change in the quality of services provided. However, exporters emphasized that the cost of such services still remain high. Thus it can be argued that the recent reforms in the services sector in Egypt have moved it from a high cost/low quality sector to a high cost/better quality sector. However, the Egyptian government had maintained two mistakes that can negatively affect the enhancement of efficiency of the services sector, namely: the absence of a competition law and foregoing the possibility of “anchoring” the domestic reforms.
The absence of a competition law is a fatal drawback of the reforms undertaken which is the first mistake of the government. This law has been hanging for the Parliament approval for several years (cited in Mohieldin, 1997b). The absence of an adequate regulatory framework is a major drawback of the reforms undertaken and can lead to deterring the payoffs from reforms if not quickly implemented. The reason is that many services sectors have monopolistic or oligopolistic structures (telecommunications is a vivid example) where privatization alone can (maybe) result in the provision of better quality services, however with no guarantee until the markets become contestable. Otherwise, privatization alone will probably result in high prices as long as a competition law is absent (since the monopolist or oligopolists can always charge high prices to maximize their profits backed up by the absence of an efficient regulatory body that prevent any abuse of their dominant position in the market). This leads to negative consequences on the performance of the Egyptian exports and their market access in the foreign market and especially the EU (the largest market).
The second mistake that the government had made was foregoing the possibility of “anchoring” the domestic reforms by locking them in the GATS or the EU-Med. The EU-Med calls for future talks on the liberalization of services to start five years after the entry into force of the agreement. Meanwhile, it delegates the services liberalization status to the commitments undertaken by the two parties (EU and Egypt) in the GATS. Egypt’s GATS commitments have been described as a matter of binding the protectionist status quo and do not imply any liberalization (Hoekman and
Primo Braga, 1996). Nevertheless, the government embarked on tremendous liberalization and reform measures in the services sector starting from 1997 onwards. It might be argued that this explains the inability of Egypt to bind its commitments as the GATS round ended in 1994. However, this is not true as the telecommunications sector reveal. The GATS negotiations on telecommunications ended in 1997 where 69 governments, among which 40 developing countries, made commitments to reform and liberalize their telecommunications sector. Moreover, the commitments undertaken did not require that reforms should be implemented immediately (for a review of the countries commitments in the telecommunications see Mattoo, 1999). This example shows that not anchoring the reforms was a choice of the Egyptian government with no clear explanation. But how does this affect exports performance. The link between not anchoring reforms and exports performance is indirect and is mainly related to the ability of the country to attract investment (domestic and foreign). By not anchoring reforms through an international or a regional agreement, the government signals to investors that reforms undertaken might not be serious and there is a possibility for backsliding. Investors in services will avoid such countries whereas investors in non-services activities (manufactures and agriculture) will suffer from the absence of an efficient service infrastructure (due to the lack of investment in services). At the end, the country loses potential investors in services as well as in agriculture and manufactures. Loss of investment is translated to less output and hence less exports.
4.3. Role of Export Promotion Agencies24
In this subsection we concentrate on two types of export promotion agencies, namely; the governmental agencies (commercial representative offices abroad, Egyptian Exports Promotion Center, Trade Point, Marketing Center of the Ministry of Public Enterprise, General Organization for International Fairs and Exhibition Fairs (GOIEF), the Management Development Center for Business Sector) and the non-governmental agencies (Egyptian Exports Association (Expolink) and different business associations). We investigate their role in helping the Egyptian exports to gain better market access in the EU and other regional markets mainly through gathering information on the foreign markets and marketing the Egyptian products.
Two studies, World Bank (1994) and Fawzy (1998), showed that the Egyptian business community faces problems in exporting. Among the problems identified by
24
The analysis in this subsection draws heavily on Ghoneim, Ahmed Farouk(2000), “Institutional Reform to promote Exports: Egypt and the EU”, in Handouss, Heba and Noha El-Mikawy (eds), Institutional Reform and Economic Development in Egypt: Which Institutions and Why, Bonn: Center for Development Research, Bonn University. Forthcoming

the World Bank study and related to the market access were the ability to penetrate foreign markets, keeping track of consumer needs, achieving the required high standards for products and packaging and identifying business opportunities abroad (World Bank, 1994: p. 20). The second study, Fawzy (1998), mentioned that among the problems facing the business community in the exporting process is the absence of marketing and distribution agencies (Fawzy, 1998: p. 18). Consequently, and based on the results of those two studies, it can be concluded that there is an urgent need for export promotion agencies that aim, at least, to gather information on the foreign markets and market the output of the exporters.
However, a recent study (Ghoneim, 2000) based on survey analysis and focusing on the Egyptian exporting community rather on the business community as a whole showed that the need for export promotion agencies is rather limited, at least, in fulfilling the aims of information gathering and products marketing. For example, to gather information on trends in foreign markets, the survey showed that exporters mainly depend on personal contacts and international exhibitions whereas the use of non-governmental and governmental agencies is almost absent, with Expolink and commercial representative offices the two cited examples, however, with low dependency on their services. In the case of marketing products, exporters mainly depend on international exhibitions and the traditional importing agency. Commercial representative offices were ranked far below as a method to market exports so as well the Marketing Center of the Ministry of Public Enterprise. Thus, based on the results of this study, we can conclude that role of export promotion agencies is rather limited in achieving a better market access for the Egyptian exports in the EU and other regional markets. The author in the latter study (Ghoneim, 2000) tried to explain the contradictory results of his analysis with results of the former two studies (World bank, 1994; Fawzy, 1998) by referring to three aspects. The first aspect is related to the sample used in the three studies. Whereas the former two studies based their results on the business community, which includes exporters and non-exporters (potential exporters), the latter study was mainly confined to incumbent exporters whose dependency on these organization is rather limited.
The second aspect is related to the exporting process per se. Even if potential exporters are the ones investigated, they do not need such agencies except in the “start-up” phase of their exporting activity when they are completely ignorant about the process of exporting. Once they pass this phase, learning by doing complemented by international exhibitions and personal contacts suffice to replace the role of such export promotion agencies in providing information on export markets and marketing their exports.
The third aspect is related to the loss of credibility of such agencies. The study showed that a number of exporters have reported to have sought help from the governmental agencies, however, such agencies did not follow up on their contacts with such exporters. This led exporters to lose trust in all such agencies (governmental and non-governmental).
To sum up, it seems that the role of export promotion agencies in achieving a better market access for the Egyptian exporters in the EU is rather limited as long as they remain only involved in the conventional services of providing information and marketing.
4.4. Absence of Coordination Among Producers
Small and medium enterprises (SMEs) play a key role in the industrial structure of Egypt. They represent more than 98 percent of the firms in the private sector, contribute more than 50 percent of the value added in the manufacturing sector (World Bank, 1994: p. 26) and provide more than 75 percent of the total private jobs (Giugale and Mobarak, 1996: p. 8). Nevertheless, their contribution to exports has been almost nil (UNCTAD, 1999: pp. 20-21) and hence they had no role in enhancing the market access of the Egyptian exports in the EU.
The contribution of SMEs to the enhancement of the Egyptian exports market access has been weak due to the absence of an effective subcontracting scheme that aims at the enrollment of SMEs in the exporting process. Few large firms undertake subcontracting with SMEs. Among the reasons for the failure of SMEs to develop forward linkages with large firms are the quality of their products, where it is claimed by large firms that it has been the major impediment in dealing with SMEs (cited in Delvin and Page, 1999: p. 13) and absence of business brokers and trade houses with sufficient information and ability to coordinate the demand of large firms with the supply of SMEs (The Alexandrian Businessmen’s Association, 1996: p. 171). Moreover, the denial of extension of the duty draw back system for indirect exporters (that is producers of intermediate goods producing for exporters of final goods but import some of their inputs which do not enjoy the benefits of duty draw back, see Nathan Associates, 1998: p. 10) puts the SMEs and all producers of intermediate goods at a relative disadvantage with their competitors outside Egypt, reinforces the weak production linkages in the economy, and hence keep the role of the SMEs marginalizied in the exporting process.
To sum up, one of the main reasons for the weak supply response of the Egyptian exports to penetrate the EU market is attributed to the absence of efficient coordination among producers. Prospects for better utilization of the role of SMEs are

promising and easily achievable if the right organizations and policies to deal with them are established (See Section 5.2.).
5. Conclusion and Policy Implications: Expected Roles of EU, Export Promotion Agencies and the Egyptian Government
The study showed that market access of the Egyptian exports in the EU hinges on a number of external/demand and internal/supply determinants. It tried to gain depth in examining the role of those determinants, which was traded off against inclusion of other aspects of significant importance as the role of the exchange rate and the quality gap problem of the Egyptian exports. The study explained how the market share of the Egyptian exports in the EU has been declining over two time periods (1986-1990 and 1991-1996). The methodology adopted showed that this was mainly due to the fact that Egyptian exports were more concentrated in commodities that faced declining overall demand in the EU (declining stars and retreats, to use the typology of the methodology). The nature of the RCA that Egyptian exports enjoy, which was relatively stable over the period investigated (recall Table 12.), has been the main reason for this “miss-configuration” of the Egyptian exports to fit in the import demand structure of the EU. Crude oil exports’ price fluctuations in general and its decreasing trend in specific has been another paramount factor in explaining the declining market share of the Egyptian exports in the EU especially that it constituted on average more than 50 percent of the Egyptian exports directed to the EU. A number of additional determinants that help explaining why Egyptian exports market share has been declining and that have influential effect on the market access of the Egyptian exports in the EU have been investigated. The external variables examined proved to be influential in affecting the market access of the Egyptian exports in the EU. The room for affecting most of the external determinants by Egypt is rather limited, whereas the EU has a wider maneuver in this regard, though still limited. The internal determinants, by definition, are all under the control of Egypt and the EU can still have a role to affect some of them. However, in most cases, they were wrongly and/or insufficiently handled as shown in the analysis. The analysis did not aim to prioritize or rank the impact of different determinants. The zeal was to find whether those determinants had an influential significant effect on the market access or not and how do they affect the market share of the Egyptian exports in the EU.
The rest of this section deals with some policy implications concerning the expected roles of the EU, Egyptian government and Egyptian export promotion agencies to enhance the market access of the Egyptian exports in the EU. However, it should be noted that policy implications do not aim at providing some kind of industrial and trade policies that target “picking up winners”.
5.1. Expected Role of EU
The role of the EU in enhancing the Egyptian exports market access is mainly related to four aspects namely, antidumping procedures, rules of origin relationship with the duty draw back system, treatment of agricultural exports and finally technical assistance within the context of the decentralized programs.
Antidumping Procedures: The analysis in Section 3.4. showed that although Egypt was not a main target of the antidumping policy of the EU, yet the policy has negatively affected the market share of the products accused in subsequent years, which could be due to the “harassment effect”. Nevertheless, there is room for avoiding a large number of potential antidumping cases if the EU was to exclude Egypt from the cumulation procedure. Cumulation procedure is an optional rule that can be applied by the European Commission (it is not mandatory in the EU antidumping legislation in contrast to the US legislation where it is mandatory) following the existence of a number of conditions
25. Cumulation procedure adds up
the market shares of accused exporters in the EU in order to decide on the presence of injury to the domestic industry by the accused dumped products
26. In all the cases that
Egypt was accused in starting from the 1990s it was subject to the cumulation
25
Council Regulation (EC) No. 3283/94 states that “where imports of a product from more than one country are simultaneously subject to AD investigations, the effects of such imports shall be cumulatively assessed only if it is determined that (a) the margin of dumping established in relation to the imports from each country is more than the minimis… and that the volume of imports from each country is not negligible, and (b) a cumulative assessment of the effects of imports is appropriate in the light of conditions of competition between the imported products and the like Community products”. Article 9 (3) defines the margin of dumping as de minimis when it is less than 2 percent of the export price, and Article 5(7) states that the AD proceedings should not be initiated against countries whose imports represent a market share of below 1 percent, unless such countries collectively account for 3 percent or more of the Community consumption. For more details see P. K. M. Tharakan, D. Greenaway and J. Tharakan, 1998: p. 322. 26
The European Commission’s injury determination process is taken in two separate steps. In the first step, the Commission decides on the presence of injury while in the second step the actual injury margin is calculated. In their first step the Commission often takes recourse to the practice of cumulating market shares of all the defendants involved in the case. To give an example of how the cumulation procedure works: suppose an AD investigation is initiated against Hungary, Poland and Czechoslovakia. Cumulation means that the Commission sums up the individual import market shares of the three defendants involved. Suppose each individual defendant has a market share in the EU of 3 percent, the three together represent an import market share of 9 percent. By taking the cumulated figure, it decides on the presence of injury. The Commission then moves on to calculate an individual margin for each defendant separately to calculate the injury margin. It is not difficult to see that cumulation is a bias in favor of protection. If in the first step of the injury determination process each defendant’s market share had been considered separately, it would have been difficult for the Commission to argue that an import market share of 3 percent is substantial enough to cause injury to a domestic European Union’s industry (the example is taken from H. Vandenbussche , 1996: p. 128).

procedure. Thus if the European Commission was to abide by the option of not cumulating the Egyptian exports’ market share in the antidumping cases, Egypt would benefit substantially.
Duty Drawback and Rules of Origin: EU can contribute positively to the enhancement of the Egyptian exports market access in the future if the prohibition of granting duty drawback to the exports of Egyptian origin (as mentioned in Section 3.4.) was canceled within the context of the EU-Med. Duty drawback is one of the most important export promotion tools that have been successfully implemented in Egypt (Ghoneim, 2000). Furthermore, it is in line with the WTO rules and regulations where it has been given a waiver in the Agreement on Subsidies and Countervailing Measures reached in the Uruguay Round 1994
27.
Treatment of Agricultural Exports: It is a well known fact that the CAP of the EU is protectionist by its nature. However, the data shown in Table 9. pinpointed the fact that contrary to this protectionist policy, the European demand for the type of agricultural products that Egypt is exporting is increasing as demonstrated by the increase in the relative share of those imports in the overall structure of European imports. This asserts that the possibility for attaining a more liberal import policy towards Egyptian agricultural products by the EU is manageable without deviating from the CAP main protectionist theme.
Technical Assistance within the Context of Decentralized Programs: EU should increase the technical assistance that deals directly with beneficiaries. Recently, the EU has initiated a new program for the Modernization of the Egyptian Industry. In such program, the EU deals with the beneficiaries in a relatively more transparent and direct way than the conventional method of aid granting that takes place between governments. This method of granting aid is relatively more efficient in at least two ways: It deals directly with beneficiaries and thus achieves both conditionality and cost savings. It allows for a direct contact between the similar professionals in both Egypt and the EU which helps in providing a better device for skills and technology transfer. Analogous aid programs that target exporters are highly recommended.
27
A illustrative list of export subsidies was provided in Annex I to the Agreement on Subsidies and Countervailing Measures. Among the more important exclusions from the list was the duty drawback schemes, where the precise amount of duty is rebated on the export of a component incorporated in a final good, is not considered to be an export subsidy. For an accessible reference see Laird, 1997: p.6. Though it might be argued that duty draw back cannot be applied in a free trade area, it is not clear from the GATT whether it is allowed or not as no specific reference to this point as has been given in the Understanding of Article XXIV related to regional trade agreements in GATT 1994.
5.2. Expected Role of Egyptian Government
The role of government in dealing with the external determinants identified in Section 3. is minimal, with the exception of negotiating the aforementioned points in Section 5.1. with the EU. To the contrary, its role in handling a large number of the internal determinants of Section 4. is crucial. Despite the recent reforms undertaken to enhance exports, they remained insufficient mainly because of the absence of an efficient incentive structure due to the overvaluation of the Egyptian pound and the high MFN tariff rates which make selling in the domestic market more profitable than selling in foreign markets. Consequently, it is not expected that piecemeal policies to enhance exports will have a substantial positive effect on the promotion of exports as long as the main incentive measures that make selling in the domestic market more profitable than in foreign markets remain un-tackled.
Overcoming NTBs: Section 4.1. showed that the government efforts in removing direct NTBs that affect exports have been successful to a large extent. Indirect NTBs, however, were not efficiently tackled. The government should devote more effort to relinquish the remaining NTBs especially those related to quality control and customs procedures concerning imports. Exports cannot flourish if customs procedures of imported inputs are cumbersome. Exporting in many cases heavily depends on importing. As long as the latter is hindered by awkward procedures it will negatively affect the former. This point still seems to be missing in the export oriented strategy that the government is adopting.
Provision of an Efficient Service Infrastructure: The impact of inefficient services on exports has been addressed in Section 4.2.. The government, starting from 1997, has embarked on a number of reforms in the services sector mainly through privatization and allowing FDI to engage in the provision of a number of services. Nevertheless, the reform of the regulatory framework that accompany such reforms is lagging behind. Among the most important issues is the necessity of a competition law to assure the prevalence of a fair competitive environment in services sectors and insure their contestability. Otherwise, there will be only transfer of monopolistic rents from the government to those private monopolies and the improvement in the efficiency of the services provided will remain questionable.
Relationship between the Government and Export Promotion Agencies: see Section 5.3.
Handling the problem of coordination between producers:
The government should devote more efforts to enhancing the subcontracting scheme. Training programs to upgrade and educate the labor in SMEs should be intensified.

Facilitating the establishment of business brokers offices and trade companies, that coordinate the subcontracting relationship between exporters and large producers with SMEs, should gain some priority in the agenda of the prevailing government. This does not require the direct involvement of the government in the operation of business brokers and trade companies, but requires collaborated efforts to facilitate their establishment. This can be achieved by facilitating the legal procedures needed to implement such projects and helping in the provision of the necessary information required for the establishments of their databases.
The duty drawback system should be extended to the so called indirect exporters—domestic suppliers who sell their products domestically to exporters—as a method to enhance the backward linkages and strengthen the coordination among producers. Moreover, such a suggestion is expected to remove the competitive disadvantage of domestic suppliers being denied from access to duty free inputs as it is the case with other international suppliers in the world markets and it is likely to partially solve the problem of chronic merchandise trade balance by increasing the domestic value added of exports.
5.3. Expected Role of Egyptian Export Promotion Agencies
Section 4.3. showed that the role of export promotion agencies was ineffective in providing extra services other than information on foreign markets whose benefit was only confined to “new” exporters. Further, the governmental export promotion agencies suffer from lack of credibility among exporters due to their weak performance in the past. Nevertheless, there is still a scope for export promotion agencies to provide beneficial services for exporters which can be only achieved by restructuring their systems (Ghoneim 2000, revealed that exporters need special export promotion agencies that deal in specific with EU). The restructuring must encounter, at least, three dimensions. First, they have to be more concrete in terms of beneficiaries they deal with. The demands of large incumbent exporters are different from small potential exporters. Consequently, programs of export promotion that target the two groups together will not yield the expected results for one group or the other. Unless such agencies can provide exporters with extra information/facilities other than that they can obtain by themselves, their role will be confined to help the “start-up” exporters; though important, that alone does not compare with what is expected from them as one of the major pillars of the export promotion strategy that the government is undertaking. Second, export promotion agencies should classify different foreign markets according to the developments happening in each market. In other words, it is not sufficient to have a program that promote, for example, exports of ready made garments. The taste, standards, income per capita and other variables
differentiate each market from the other implying a differentiated commodity. This implies that a program for export promotion of a certain group of commodities that does not consider markets’ differences is insufficient. Third, export promotion agencies should specialize in the set of commodity groups they promote. It is unrealistic that the personnel in an export promotion agency that deal with exports of agricultural products be the same one that deals with software exports
28. To sum up,
more specialization is required to deal with different size of exporters, commodity groups and foreign markets.
There are other two important aspects that need to be addressed when discussing the expected role of promotion agencies, namely the need for technical personnel and research and development (R&D). The insufficiency of technical personnel in export promotion agencies was one of the highly cited problems of their inefficiency (Ghoneim, 2000). The importance of training programs is highly emphasized here. The EU, the Egyptian government and the Egyptian exporting community should collaborate to finance such kind of programs. The role of R&D seems to be absent from the agenda of export promotion agencies. There is no one single comprehensive database for all Egyptian exporters or even for a special sector. Databases of business associations as well as export promotion agencies are incomplete, outdated or contain wrong information. Market studies of foreign markets are rare. There is no R&D departments and if present then there role is marginalizied and is confined to “cut and paste” from international reports (an exception is a forthcoming report by Expolink that deals with every single aspect in the exporting process and has been carried out in collaboration with Harvard Business School
29). The EU, Egyptian government and
Egyptian exporting community should devote financial resources for upgrading R&D departments in export promotion agencies.
A final word has to be said regarding the governmental export promotion agencies. The loss of credibility they suffer from and the ongoing bureaucratic reputation they continue to have might imply that the government should retreat from the provision of such service. The government should delegate the mission of exports promotion to non-governmental organizations which do not suffer from bureaucratic procedures and loss of credibility. The role of the government can be confined to making part of the financial resources available (for running those agencies, training the personnel,
28
Expolink provides a right step in this direction where it has internally specialized by having five sectors for promoting different sets of commodities (textiles and ready made garments; leather, footwear and leather products; fresh and processed food products; software and information technology products and; furniture), however it remains insufficient. 29
Based on personal interview with the managing director of Expolink.

and subsidizing the attendance of international exhibitions for small exporters and potential ones) and collecting data that are hard to obtain without governmental authorization.

Technical Notes
1. In this study the European Union (EU) constitutes of the following countries: Austria, Denmark, France, Greece, Ireland, Netherlands, Portugal, Sweden, United Kingdom, Belgium, Luxembourg, Finland, Germany, Iceland, Italy, Norway, Spain, Switzerland.
North America constitutes of: Canada and the United States
Developing countries consist of :(Africa) Algeria, Kenya, Madagascar, Malawi, Morocco, Senegal, South Africa, Mauritius, Reunion, Seychelles, Tunisia and Zimbabwe. (Developing America) Argentina, Barbados, Bolivia, Brazil, Chile, Colombia, Costa Rica, Dominican republic, Ecuador, El Salvador, French Guinea, Grenada, Guadeloupe, Honduras, Jamaica, Martinique, Mexico, Nicaragua, Panama, Paraguay, Peru, St. Lucia, Trinidad and Tobago, Uruguay and Venezuela. (Developing Asia) Bangladesh, China, Cyprus, Malaysia, Hong-Kong, India, Indonesia, Jordan, Korea, Rep. Of, Macao, Oman, Nepal, Neutral Zone, Pakistan, Philippines, Saudi Arabia, Singapore, Sri Lanka, Syria, Thailand, Turkey and United Arab Emirates
2. The RCA of a certain commodity of a country considered is a measure that indicates the potential opportunities for expanded trade in that specific commodity and that the country is relatively specialized in exporting that commodity. It can take any number between 0 and infinity. If it is less than 1, it implies that the country has a revealed comparative disadvantage in that commodity. If it is greater than 1 it implies that the country has a comparative advantage in that commodity. Hence, an RCA of 4 means that this product’s share in the total export structure of the country considered is 4 times the product’s share in the overall world trade. It is given by the formula:
Xij
Xi
Xj
Xmi
n
m
n
= =∑ ∑
1 1
where Xij is the export of product j of country i ,
Xii
n
=∑
1
is the total exports of country i ,
Xj is the total world exports of product j and,
Xmm
n
=∑
1
is the total world exports of all products m
Though this is the conventional way, the RCA in this study is measured by the imports, which is the other face of the coin for exports, thus a country i will be enjoying a RCA in a certain product j if
Mij
Mi
Mj
Mmi
n
m
n
= =∑ ∑
1 1
where Mij is the export of product j of country i , however, measured as imports from the importing country
Mii
n
=∑
1
is the total exports of country i ,
Mj is the total world exports of product j , however measured as the total world imports of that product and,
Mmm
n
=∑
1
is the total world exports of all products m , however measured as total world
imports of all products m
The world can be substituted by a specific region or a country. Hence, the RCA calculated will be confined to the exports devoted to that specific country or region, which is the case implemented in this study.

References
Al-Bayomi, Gamal El Din. 1996. “Egypt-EU Partnership.” Keynote speech for the Conference on How Can Egypt Benefit from its Partnership Agreement with The EU. Cairo, 26 & 27 June.
Alessandrini, Sergio. 2000. “Consequences of EU Enlargement for The MED Countries.” Paper presented at the FEMISE Network First Annual Conference. Marseilles, 17-18 February.
Ali, Maghawry Shalabi. 1997. Egypt and the European Union: The Economic Relations from Cooperation to Partnership. Al-Ahram El Iktsady Book, No. 119, Cairo: Commercial Ahram Publisher, (Arabic).
Alonso-Gamo, Patricia, Susan Fennell and Khaled Sakr. 1997. “Adjusting to New Realities: MENA, The Uruguay Round, and the EU-Mediterranean Initiative.” IMF Working Paper No. WP/97/7. Washington, D.C.: International Monetary Fund.
Balassa, Bela. 1962. The Theory of Economic Integration. London: George Allen and Unwin LTD.
Benham, Lee. 1997. “On Improving Egypt’s Economic Performance: The Costs of Exchange.” Working Paper No. 13. Cairo: Egyptian Center for Economic Studies (ECES).
Bhagwati, Jadish. 1995. “U. S. Trade Policy: The Infatuation with Free Trade Areas” in: J. Bhagwati and A. O. Krueger, The Dangerous Drift to Preferential Trade Agreements. Washington, D.C.: American Enterprise Institute: 1-18.
Delegation of the European Commission in the Arab Republic of Egypt. 1996. Report for the European Commission. Unpublished Report.
Delvin, John and John Page. 1999. “Steppingstones: Arab Integration, Competitiveness, and the Euro-Med Agreements.” Paper presented at conference on Euro-Med Partnership. Cairo, 6-7 February.
Economic Commission for Latin America and the Caribbean (ECLAC) and the World Bank. 1999. TradeCAN Database and Software for a Competitiveness Analysis of Nations User Guide. Washington, D.C.: World Bank
Economic Research Forum for Arab Countries, Iran and Turkey (ERF). 1998. Economic Trends in the MENA Region. Cairo: ERF.
El-Diwany, Sherif. 1996. “The General Principles of Rules of Origin: A Preliminary Assessment of the Draft Egypt-EU Agreement.” Cairo: Egyptian Ministry of International Cooperation. Mimeo.
European Commission. 1995. “Strengthening the Mediterranean Policy of the European Union: Establishing a Euro-Mediterranean Partnership.” Bulletin of the European Union, Supplement 2/95, Luxembourg: Office for Official Publications of the European Communities.
Favely, Rod and Geoff Reed. 1998. “Economic Effects of Rules of Origin.” Weltwirtschaftliches Archiv, Vol. 134, No. 2: 209-229.
Fawzy, Samiha (ed.), 1997. The Partnership Agreement between Egypt and the EU: Potential Impact and Policy Implications. Cairo: Faculty of Economics and Political Sciences, Cairo University.
Fawzy, Samiha. 1998. “The Business Environment in Egypt.” Working Paper No. 34. Cairo: Egyptian Center for Economic Studies (ECES).
Finger, J. Michael (ed.), 1993. Antidumping: How It Works and Who Gets Hurt. Ann Arbor: The University of Michigan Press.
Finger, J. Michael and M. E. Krenin. 1979. “A Measure of ‘Export Similarity’ and Its Possible Uses.” The Economic Journal, Vol. 89, No. 356: 905-912.
Friedrich-Naumann Stiftung. 1996. “Total Cumulating of Rules of Origin in Exporting to the EU from Israel, Jordan, Egypt and the PNA.” Paper prepared and published within the project for Israeli-Palestinian-Jordanian Industrial Cooperation, June.
Galal, Ahmed. 1996. “Incentives for Economic Integration in the Middle East: An Egyptian Perspective.” Working Paper No. 5. Cairo: Egyptian Center for Economic Studies (ECES).
Galal, Ahmed and Bernard Hoekman (eds.), 1997. Regional Partners in Global Markets: Limits and Possibilities of the Euro-Med Agreements. London and Cairo: Centre for Economic Policy Research and The Egyptian Center for Economic Studies.
Ghoneim, Ahmed Farouk. 2000a. “Antidumping under the GATT and the European Union Rules: Prospects for The Egyptian-European Partnership Agreement” in Heba Nassar and Alfons Naeim (eds.), The Egyptian Exports and the Challenges of the Twenty First Century. Cairo: Center of Economic and Financial Research and Studies
. 2000. “Institutional Reform to Promote Exports: Egypt and the EU” in Handouss, Heba and Noha El-Mikawy (eds.), Institutional Reform and Economic Development in Egypt: Which Institutions and Why. Bonn: Center for Development Research, Bonn University. Forthcoming.
Giugale, Marcelo M. and Hamed Mobarak. 1996. “Introduction: The Rationale for the Private Sector Development in Egypt” in Marcelo M. Giugale and Hamed
Mobarak (eds.), Private Sector Development in Egypt. Cairo: The American University Press: 1-11.
Havrylyshyn, Oleh. 1997. Global Integration Strategy for the Mediterranean Countries. Washington D.C.: International Monetary Fund.
Hindley, Brian and Patrick A. Messerlin. 1993. “Guarantees of market access and regionalism” in Anderson, Kym and Richard Blackhurst (eds.), Regional Integration and the Global Trading System. New York: St. Martin’s Press: 358-384.
Hoekman, Bernard. 1995. “The WTO, the EU and the Arab World: Trade Policy Priority and Pitfalls.” Paper presented to Workshop on Strategic Visions for the Middle East and North Africa. Gammarth, 9-11 June.
. 1998. “Free Trade and Deep Integration: Antidumping and Antitrust in Regional Agreements.” World Bank Policy Research Working Paper No. 1950. Washington, D.C.: World Bank.
Hoekman, Bernard and Michael Leidy. 1993. “Holes and Loopholes in Integration Agreements: History and Prospects” in Kym Anderson and Richard Blackhurst (eds.), Regional Integration and the Global Trading System. New York: St. Martin’s Press.
Hoekman, Bernard and Simon Djankov. 1997. “Towards a Free Trade Agreement with the European Union: Issues and Policy Options for Egypt” in Ahmed Galal and Bernard Hoekman (eds.), Regional Partners in Global Markets: Limits and Possibilities of the Euro-Med Agreements. London and Cairo: Centre for Economic Policy Research and The Egyptian Center for Economic Studies: 129-155.
. 1998. “Catching up with Eastern Europe? The European Union’s Mediterranean Free Trade Initiative” in Raed Safadi (ed.), Opening Doors to the World: A New Trade Agenda for the Middle East. Cairo: the American University in Cairo Press in association with the Economic Research Forum for the Arab Countries, Iran and Turkey: 281-312.
Hoekman, Bernard and Carlos A. Primo Braga. 1996. “Trade in Services, GATS and the Arab Countries” in Said El Nagar (ed.), The Uruguay Round and the Arab Countries. Washington D.C.: International Monetary Fund: 153-185.
. 1997. “Protection and Trade in Services: A Survey.” World Bank Policy Research Paper No.1747. Washington, D.C.: World Bank.
Khatab, Mokhtar. 1997. “Prospects of FDI Inflow into Egypt in Context of the Partnership Agreement with the EU” in Samiha Fawzy (ed.), The Partnership Agreement between Egypt and the EU: Potential Impact and Policy
Implications. Cairo: Faculty of Economics and Political Sciences, Cairo University: 89-118.
Kheir El-Din, Hanaa and Ahmed El Darsh. 1992. “Trade Policies in Egypt” in Said El-Naggar (ed.), Foreign and Intra-Regional Trade Policies of the Arab Countries. Kuwait: Arab Monetary Fund (Arabic).
Laird, Sam. 1997. “WTO Rules and Good Practices in Export Policy.” World Trade Organization Staff Working Paper TDR9701.WPF, Geneva: WTO
Lawrence, Robert Z. 1996. Regionalism, Multilateralism, and Deeper Integration. Washington, D.C.: The Brookings Institution.
Matthies, Jochen. 1992. “EC Rules of Origin from an Official’s Point of View” in Edwin Vermulst, Paul Waer and Jacques Bourgeois (eds.), Rules of Origin in International Trade: A Comparative Study. Ann Arbor: University of Michigan Press; 419-432.
Mattoo, Aaditya. 1999. “Developing Countries in the New Round of GATS Negotiations: From a Defensive to a Pro-Active Role.” Paper presented to The WTO/World Bank Conference on Developing Countries' in a Millennium Round. WTO Secretariat, Centre William Rappard,Geneva, 20-21 September.
Mohieldin, Mahmoud. 1997a. “The Egypt-EU Partnership Agreement and Liberalization of Services” in Ahmed Galal and Bernard Hoekman (eds.), Regional Partners in Global Markets: Limits and Possibilities of the Euro-Med Agreements. London and Cairo: Centre for Economic Policy Research and The Egyptian Center for Economic Studies: 238-256.
. 1997b. “On Competition Policy: An Egyptian Perspective” in Samiha Fawzy (ed.), The Partnership Agreement between Egypt and the EU: Potential Impact and Policy Implications. Cairo: Faculty of Economics and Political Sciences, Cairo University: 149-176.
Nathan Associates Inc. 1998. Enhancing Egypt’s Exports. Report prepared for the Government of Egypt, Ministry of Trade and Supply.
Palmeter, David. 1993. “Rules of Origin in Customs Unions and Free Trade Areas” in Kym Anderson and Richard Blackhurst (eds.), Regional Integration and The Global Trading System. New York: St. Martin’s Press: 326-343.
Petri, Peter. 1997a. “Trade Strategies for The Southern Mediterranean.” OECD Technical Paper No. 127.
. 1997b. “The Case of Missing Foreign Investment in the Southern Mediterranean.” OECD Technical Paper No. 128.

Radelet, Steven, Jeffery Sachs and Lisa Cook. 1999. “Manufactured Exports and Economic Growth: Insights from Asia for Egypt.” Egyptian Center For Economic Studies Conference Proceedings Series.
Refaat, Amal. 1999. “New Trends in Egypt’s Trade Policy and Future Challenges.” Working Paper No. 36. Cairo: Egyptian Center for Economic Studies (ECES).
Research Information Sector (RIS) (Development Economic Policy Reform Analysis Project (DEPRA)) and Ministry of Economy (MOE) (Government of Egypt). 1998. The International Competitiveness of Egypt. First Report.
Shiells, Clinton R. and Arvind Subramanian. 1996. “Effects of the Uruguay Round on Egypt and Morocco.” IMF Working Paper No. WP/96/7. International Monetary Fund.
Sideri, Sandro. 2000. “The Impact of the EU’s Partnership For Action on The Mediterranean Economies: Dependent Development or Regional Integration?” Paper presented at the FEMISE Network First Annual Conference. Marseilles, 17-18 February.
Taha, Hisham. 1998. “Rules of Origin in the Egyptian Negotiations for Liberalizing Trade.” Ministry of Foreign Affairs, Unit of the Egyptian-European Partnership Agreement. Mimeo.
Tangermann, Stefan. 1997. “Access to European Union Markets for Agricultural Products after the Uruguay Round, and Export Interests of the Mediterranean Countries.” Study prepared for UNCTAD, UNCTAD/ITCD/TSB/Misc. 5.
Tharakan, P. K. M. 1993. “Contingent Protection: The US and the EC Anti-Dumping Actions.” The World Economy, Vol. 16, No. 5: 575-600.
Tharakan, P. K. M., David Greenaway and Joe Tharakan. 1998. “Cumulation and Injury Determination of the European Community in Antidumping Cases.” Weltwirtschaftliches Archiv, Vol. 134, No. 2: 320-339.
The Alexandrian Businessmen’s Association. 1996. “Small and Micro Enterprises in Egypt” in Marcelo M. Giugale and Hamed Mobarak (eds.), Private Sector Development in Egypt. Cairo: The American University Press: 169-176.
Tovias, Alfred. 2000. “ From 15 to 21 The Impact of the Next EU Enlargement on the Mediterranean Non-Members Countries.” Paper presented at the FEMISE Network First Annual Conference. Marseilles, 17-18 February. Forthcoming.
United Nations Conference on Trade and Development (UNCTAD). 1998. Antidumping and Safeguards in the Euro-Mediterranean Association Agreements. unpublished report.
. 1999. Investment Policy Review of Egypt. UNCTAD/ITE/IIP/Misc. 11.
Vandenbussche, Hylke. 1996. “Is European Antidumping Protection against Central Europe Too High.” Weltwirtschaftliches Archiv, Vol. 132, No. 1: 116-138.
Viner, Jacob. 1950. The Customs Union Issue. New York: Carnegie Endowment for International Peace.
Weidenfeld, Werner and Wolfgang Wessels. 1997. Europe from A to Z, Guide to European Integration. Luxembourg: Office for Official Publications of the European Communities.
Wilson, Rodney. 1994. “The Economic Relations of the Middle East: Towards Europe or within the Region.” Middle East Journal, Vol. 48, No. 2: 268-287.
Winters, L. Alan. 1993. “Expanding EC Membership and Association Accords: Recent Experience and Future Prospects” in Kym Anderson and Richard Blackhurst (eds.), Regional Integration and The Global Trading System. New York: St. Martin’s Press: 104-125.
Woolcock, Stephen. 1996. “Rules of Origin” in Organization for Economic Cooperation and Development (OECD), Regionalism and its Place in the Multilateral Trading System. Paris: OECD: 195-212.
World Bank. 1994. Private Sector Development in Egypt: The Status and the Challenges. Washington D.C.: World Bank.
. 1995. Claiming the Future: Choosing Prosperity in the Middle East and North Africa. Washington D.C.: The World Bank
. 1998a. World Development Indicators. CD ROM. . 1998b. “Making Services an Engine of Growth.” Mimeo. . 2000. Entering the 21st Century, World development Report 1999/2000. Oxford
University Press: Published for the World Bank. World Trade Organization. 1995. Regionalism and the World Trading System.
Geneva: World Trade Organization. . 1999. Data on Antidumping Actions on the Mediterranean Countries, processed
based on author demand Yeats, Alexander. 1994. “Export Prospects of Middle Eastern Countries, A Post-Uruguay Round Analysis.” World bank Policy Research Working Paper No. 1571.

Exports M
atrix of Egypt in the E
U at a 1 SIT
C digit level, 1986-1990, 1991-1996
R
ising Stars D
eclining Stars M
issed O
pportunities
Retreats
Total M
arket Share G
ains T
otal Market
Share Losses
Share of E
xports in total E
gyptian E
xports to EU
9.34% in
1990 0.11%
in 1996
3.94% in 1990
93.69% in 1996
13.28% in 1990
93.8% in 1996
Share of E
xports in total E
gyptian E
xports to EU
16.17% in
1990 5.41%
in 1996
70.56% in 1990
0% in 1996
86.73%
in 1990 5.41%
in 1996
SITC
Sectors 1
st Period (7,8,5) 2
nd Period (1,4)
1st Period (0,1,4)
2nd Period
(6,8,0,3,2)
1st Period
(6,9) 2
nd Period (7,5,9)
1st Period (3,2)
2nd Period
(none)
1st Period
(7,8,5,0,1,4) 2
nd Period (1,4,6,8,0,3,2)
1st Period (6,9,3,2)
2nd Period (7,5,9)
Share of E
xports in total E
gyptian E
xports to EU
concentrated in dynam
ic im
ports (R
S+M
O)
25.51% in
1990 5.52%
in 1996
% of E
gyptian E
xports concentrated in dynam
ic exports (1
st Period: 7,8,5, 0,1,4,6,9) (2
nd Period: 8,5,0, 1,4,6,9,2)
29.44% in
1990 38.03%
in 1996
Share of E
xports in total E
gyptian E
xports to EU
concentrated in stagnant im
ports (D
C+
R)
74.50% in
1990 93.69%
in 1996
% of E
gyptian E
xports concentrated in declining exports (1
st Period: 3,2) (2
nd Period: 3,7)
70.56% in
1990 61.97%
in 1996
Source: Author’s calculation from
TradeC
AN
Database
Exports M
atrix of Egypt to the E
U at a 4 SIT
C digit level, 1986-1990, 1991-1996
R
ising Stars D
eclining Stars M
issed O
pportunities R
etreats T
otal Market
Share Gains
Total M
arket Share L
osses Share of E
xports in total E
gyptian E
xports to EU
9.63% in 1990
13.47% in 1996
13.14% in 1990
32.97% in 1996
22.77% in 1990
46.44% in 1996
Share of E
xports in total E
gyptian E
xports to EU
8.33% in 1990
5.64% in 1996
68.53% in 1990
47.62% in 1996
76.86%
in 1990 53.26%
in 1996
Num
ber of 4 digit SIT
C
Sectors
1st Period: 156
2nd Period:132
1st Period: 111
2nd Period: 201
1st Period: 118
2nd Period: 94
1st Period: 83
2nd Period: 105
RC
A in 4 digit
SITC
Sectors 1
st Period: 15 2
nd Period: 22 1
st Period: 22 2
nd Period: 42 1
st Period: 7 2
nd Period: 6 1
st Period: 9 2
nd Period: 7
Share of E
xports in total E
gyptian E
xports to EU
concentrated in dynam
ic im
ports (R
S+M
O)
17.96% in 1990
19.11% in 1996
Share of E
xports in total E
gyptian E
xports to EU
concentrated in stagnant im
ports (DC
+R
)
81.67% in 1990
80.59% in 1996
Source: Author’s calculation from
TradeC
AN
Database
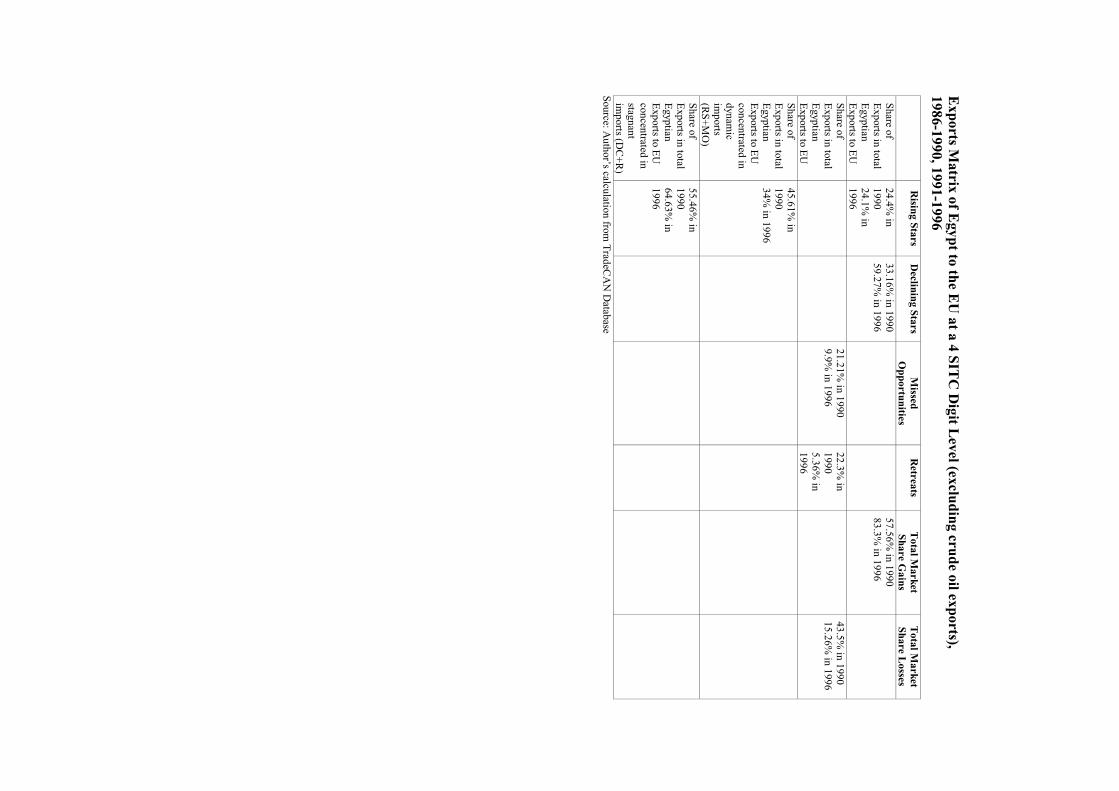
Exports M
atrix of Egypt to the E
U at a 4 SIT
C D
igit Level (excluding crude oil exports),
1986-1990, 1991-1996
R
ising Stars D
eclining Stars M
issed O
pportunities R
etreats T
otal Market
Share Gains
Total M
arket Share L
osses Share of E
xports in total E
gyptian E
xports to EU
24.4% in
1990 24.1%
in 1996
33.16% in 1990
59.27% in 1996
57.56% in 1990
83.3% in 1996
Share of E
xports in total E
gyptian E
xports to EU
21.21% in 1990
9.9% in 1996
22.3% in
1990 5.36%
in 1996
43.5%
in 1990 15.26%
in 1996
Share of E
xports in total E
gyptian E
xports to EU
concentrated in dynam
ic im
ports (R
S+M
O)
45.61% in
1990 34%
in 1996
Share of E
xports in total E
gyptian E
xports to EU
concentrated in stagnant im
ports (DC
+R
)
55.46% in
1990 64.63%
in 1996
Source: Author’s calculation from
TradeC
AN
Database

Table 1: G
eographical Distribution of the E
gyptian Exports,
1987-1996, (%)
Regional M
arket* 1987
1991 1996
European U
nion 40.5
43.9 46
North A
merica
8.4 7.8
13 Japan
2.1 1.3
1 A
ll industrialized C
ountries 51
53 60
All developing
Countries
49 47
40
Note: *For the classification of different regional m
arkets and the countries included therein see technical note No. 1.
Source: Author’s calculation from
Eurostat D
atabase
Table 2: D
evelopment of the M
arket Share of Egyptian E
xports in Different R
egional Markets, 1986-1996
Regional M
arket 1986
1990 1996
North A
merica
0.05 0.05
0.07 Japan
0.25 0.04
0.03 E
uropean Union
0.28 0.19
0.16 A
ll Industrialized Countries
0.21 0.14
0.12 A
frica 0.08
0.20 0.30
Developing A
merica
0.00 0.01
0.01 D
eveloping Asia
0.18 0.10
0.10 A
ll Developing C
ountries 0.14
0.09 0.09
Source: Author’s calculation from
TradeC
AN
Database
Table 3: C
ompositional Structure and C
ompositional C
hange of the Egyptian E
xports, 1987-1996, (%
)
SITC
G
roup
% Share in E
xports to 1987
1991 1996
0 Food &
E
U
3.95 4.5
7.08
Anim
als N
orth Am
erica 1.45
1.52 1.56
Japan 0.32
0.37 2.53
Industrialized Countries
3.35 3.98
6.04
D
eveloping Countries
13.95 17.81
16.06
1 B
everage &
EU
0
0.01 0.02
T
obacco N
orth Am
erica 0.05
0.06 0.13
Japan 0.03
0.02 0.02
Industrialized Countries
0.01 0.02
0.04
D
eveloping Countries
1.18 1.11
0.57
2 C
rude E
U
7.23 2.64
3.61
Materials
North A
merica
1.60 1.31
1.78
Excluding
Japan 34.97
32.07 26.20
Fuel
Industrialized Countries
9.03 3.38
3.88
D
eveloping Countries
6.54 7.41
7.61
3 M
ineral E
U
68.10 64.48
58.83
Fuels. Etc.
North A
merica
68.98 57.99
32.21
Japan
47.84 57.29
42.62
Industrialized C
ountries 66.42
63.42 53.96
Developing C
ountries 57.08
39.25 44.20
4 A
nimal
EU
0
0.01 0.09
V
egetable Oil
North A
merica
0 0
0
& Fat
Japan 0
0 0.01
Industrialized Countries
0 0
0.07
D
eveloping Countries
0.07 0.03
0.09
5 C
hemicals
EU
0.74
1.75 2.09
R
elated N
orth Am
erica 0.78
0.67 1.42
Products
Japan 0.30
0.17 0.31
Industrialized Countries
0.71 1.56
1.93

Developing C
ountries 3.34
6.73 5.71
6 B
asic E
U
15.40 15.29
17.11
Manufactures
North A
merica
13.23 11.58
15.27
Japan
4.26 7.57
13.79
Industrialized C
ountries 14.18
14.56 16.72
Developing C
ountries 12.72
18.49 18.38
Table 3: contd.
SITC
G
roup
% Share in E
xports to 1987
1991 1996
7 M
achines &
EU
1.94
6.58 3.14
T
ransport, N
orth Am
erica 0.46
0.43 0.27
etc.
Japan 0.04
0.03 0.81
Industrialized Countries
1.61 5.58
2.60
D
eveloping Countries
0.75 3.13
2.45
8 M
iscellaneous E
U
1.97 4.18
7.86
Manufactured
North A
merica
8.10 22.35
41.31
Products. Japan
0.56 0.82
10.59
Industrialized C
ountries 2.53
6.44 13.53
Developing C
ountries 1.9
5.75 4.67
9 O
thers E
U
0.66 0.57
0.18
N
orth Am
erica 5.33
4.08 6.05
Japan 11.69
1.65 3.11
Industrialized Countries
2.15 1.06
1.24
D
eveloping Countries
2.47 0.30
0.26 Source: A
uthor’s calculation from T
radeCA
N D
atabase
Table 4: C
oncentration Ratio of the L
argest 10 Egyptian E
xports to the EU
, Japan, North
Am
erica and Developing C
ountries (%)
Year
EU
Japan
North
Am
erica Industrialized
Countries
Developing
Countries
1987 90.79
98.99 88.78
90.75 82.51
1991 86.96
95.84 89.82
85.13 62.01
1996 80.63
90.61 81.82
76.16 69.8
Num
ber of Dom
inant C
omm
odity Groups (SIT
C 3
digit-level) over the period 1987-1996
7 4
6 7
6 Source: A
uthor’s calculation from T
radeCA
N D
atabase T
able 5: Supply and Dem
and Determ
inants of Market Share
Classification of
Com
modities
Supply Determ
inants of M
arket Share D
emand D
eterminants of
Market Share
Rising Stars
Strong Strong
Declining Stars
Strong W
eak M
issed Opportunities
Weak
Strong R
etreats W
eak W
eak T
able 6: Treatm
ent of the Egyptian E
xports in EU
, US and Japan under D
ifferent Tariff R
egimes, 1989
Share of E
gypt’s Exports under D
ifferent Tariff R
egimes
Import M
arket Z
ero MF
N
Tariffs
Under Z
ero G
SP R
ates N
onzero GSP
R
ates N
onzero MF
N
Rates
EU
58.3
14.4 0.2
27.1 Japan
40.8 3.7
0.1 55.4
US
12 3.9
0.0 84.1
Table 7: C
lassification of Egyptian E
xports (excluding SITC
0 and 3) over The T
wo P
eriods 1986-1990 and 1991-1996 U
sing SITC
4 Digit L
evel Disaggregation
Num
ber of C
omm
odities 1986-1990
% of total exports
to EU
excluding SIT
C 0 &
3
1991-1996
% of total exports to
EU
excluding SITC
0 &
3 R
ising Stars 147
4.46% (15.6%
)* 115
2.54% (7.45%
) D
eclining Stars 86
11.01% (38.5%
) 191
12.33% (36.2%
) M
issed O
pportunities 107
4.85% (17.2%
) 84
6.34% (18.59%
) R
etreats 68
8.25% (28.8%
) 85
12.88% (37%
) T
otal 408
28.57% (100%
) 475
34.09% (100%
)

Note: *percentage figures in parentheses are the percentages of total exports w
ith the exclusion of SITC
0 &3
Source: Author’s calculation from
TradeC
AN
Database
Table 8: E
gyptian Agricultural E
xports Market Share in the E
U, 1986, 1990, 1996
1986
1990 1996
Egyptian A
gricultural Exports M
arket Share 0.08
0.09 0.14
% of SIT
C 0 in T
otal EU
Imports
9.58 8.48
8.45 %
of comm
odities belonging to SITC
0 in Total E
U
Imports w
hich Egypt exports to the E
U
4.21 4.63
6.13 T
able 9: Classification of E
gyptian Agricultural E
xports (SITC
0)* over The T
wo P
eriods 1986-1990 and 1991-1996 using SIT
C 4 D
igit Level D
isaggregation %
of C
omm
odities out of T
otal Egyptian
Exports
% of A
gricultural E
xports in Total
Exports (1986-1990)
% of A
gricultural E
xports in Total
Exports (1991-1996)
Rising Stars
2.39 (61%)
3.72% (52%
)
Declining Stars
0.83% (21%
) 3.12%
(44%)
Missed
Opportunities
0.58% (15%
) 0.02%
(14%)
Retreats
0.12% (3%
) 0.22%
(3%)
Total
3.92% (100%
) 7.08%
(100%)
Notes: *percentage figures in parentheses are the percentages of total agricultural E
gyptian exports to the EU
Source: A
uthor’s calculation from T
radeCA
N D
atabase T
able 10: Some Indicators of the P
erformance of the E
gyptian Trade and E
xports Com
pared to Other
Countries*
Ratio of E
xports (G
oods &
Services) to GD
P
(1980)
Ratio of E
xports (G
oods &
Services) to GD
P
(1998)
Trade to G
DP
R
atio (1995) (T
rade O
penness)
Trade G
rowth
Less G
DP
G
rowth (1987-
1997) E
gypt 31
17 54.9
-0.6%
Morocco
17 28
51.4 4%
T
unisia 40
42 91.7
1.3%
Turkey
5 25
45.2 6.1%
Jordan
40 50
125.1 6.5%
Syria
18 29
56.8 0.4%
N
ote: *Trade’s share is also determ
ined by a country’s size, its proximity to other m
arkets, and the similarity of its factor endow
ments to
those of the rest of the world, am
ong other things. For this reason, changes in the trade share may be a reasonably good m
easure of the effect of a change in policy in a given country, but a cross-country com
parison of trade shares is not a good measure of the policy orientation of
the countries in the comparison
Source: World B
ank (1999/2000), World D
evelopment R
eport, p. 254 (Colum
ns 1 and 2), Havrylyshyn, O
leh (1997), p. 3 (Colum
n 3) and W
orld Developm
ent Indicators CD
RO
M (1998a) (C
olumn 4).
Table 11: D
evelopment of the M
arket Share of the MN
Cs in the E
U, 1986, 1990 and 1996
Market Share in the E
U
1986 1990
1996 E
gypt 0.28
0.19 0.16
Tunisia
0.16 0.18
0.22 M
orocco 0.22
0.24 0.26
Algeria
0.8 0.53
0.40 Jordan
0.02 0.01
0.01 Syria
0.07 0.09
0.12 L
ebanon 0.01
0.01 0.01
Turkey
0.43 0.5
0.61 Israel
0.30 0.31
0.30 C
yprus 0.04
0.05 0.03
Malta
0.04 0.06
0.06 Source: A
uthor’s calculation from T
radeCA
N D
atabase

Table 12: L
ist of Egyptian E
xports to the EU
with the H
ighest RC
A (at a 4 SIT
C D
igit Level)
1986, 1990, 1996
SITC
D
igit L
evel
RC
A
in 1986
Share in E
U
Market (%
)
Share in T
otal E
gyptian E
xports (%)
SITC
D
igit L
evel
RC
A
in 1990
Share in E
U
Market (%
)
Share in T
otal E
gyptian E
xports (%)
SITC
D
igit L
evel
RC
A
in 1996
Share in E
U
Market (%
)
Share in T
otal E
gyptian E
xports (%)
2631 26.95
7.51 5.23
6531 32.45
6.01 5.33
0541 48.43
7.98 3.69
6531 20.57
5.73 4.62
0541 19.97
3.7 1.4
6531 35.65
5.87 4.35
6593 18.57
5.17 0.04
2924 14.48
2.68 0.25
2634 32.20
5.3 0.07
2924 15.47
4.31 0.36
0561 14.41
2.67 0.33
0615 28.15
4.64 0.71
0019 14.9
4.15 0.03
3330 13.85
2.56 59.74
0561 27.24
4.49 0.56
6841 10.75
3.00 4.04
0615 13.69
2.53 0.32
6521 22.44
3.7 1.91
0561 10.56
2.94 0.27
6521 12.38
2.29 1.33
3232 17.88
2.95 0.99
2633 10.49
2.92 0.13
6593 11.22
2.08 0.04
2651 17.63
2.9 0.16
3330 10.36
2.89 67.65
2631 11.13
2.06 1.51
3341 16.61
2.74 7.13
0541 10.22
2.85 0.69
6841 10.08
2.01 4.46
2924 15.78
2.6 0.27
0615 8.49
2.36 0.33
2651 10.03
1.86 0.1
2631 13.09
2.16 1.34
5513 8.11
2.26 0.31
3351 8.04
1.49 0.17
2633 12.83
2.11 0.17
6521 7.65
2.13 0.98
3341 7.7
1.43 4.81
3330 12.83
2.11 44.56
2651 6.64
1.85 0.12
2634 6.89
1.28 0.01
3344 12.76
2.1 5.52
3351 6.27
1.75 0.16
6731 6.19
1.14 0.01
6584 11.04
1.82 1.83
7148 5.49
1.53 0.38
5513 6.16
1.14 0.92
8442 10.22
1.68 0.16
3341 5.29
1.47 5.06
6781 5.94
1.1 0.09
3351 9.47
1.56 0.20
0422 4.33
1.21 0.21
2911 5.7
1.05 0.05
8122 8.95
1.47 0.30
3344 2.98
0.83 2.99
3344 5.4
1 2.41
2733 8.65
1.43 0.19
6516 2.62
0.73 0.20
0545 1.97
0.36 0.53
6516 8.32
1.37 0.63