adb working paper series on regional economic integration · determinants of average value of...
TRANSCRIPT

Different Types of Firms, Products, and Directions of Trade: The Case of the People’s Republic of China
Hyun-Hoon Lee, Donghyun Park, and Jing Wang No. 101 | August 2012
ADB Working Paper Series onRegional Economic Integration

Hyun-Hoon Lee+, Donghyun Park++,and Jing Wang+++
Different Types of Firms, Products, and Directions of Trade: The Case of the People’s Republic of China
ADB Working Paper Series on Regional Economic Integration
No. 101 August 2012
+Department of International Trade and Business, Kangwon National University, Chuncheon, 200-701, Korea. [email protected]
++Economics and Research Department, Asian Development Bank, Philippines. [email protected]
+++Department of International Trade and Business, Kangwon National University, Chuncheon, 200-701, Korea. [email protected]

The ADB Working Paper Series on Regional Economic Integration focuses on topics relating to regional cooperation and integration in the areas of infrastructure and software, trade and investment, money and finance, and regional public goods. The Series is a quick-disseminating, informal publication that seeks to provide information, generate discussion, and elicit comments. Working papers published under this Series may subsequently be published elsewhere.
Disclaimer: The views expressed in this paper are those of the authors and do not necessarily reflect the views and policies of the Asian Development Bank (ADB) or its Board of Governors or the governments they represent. ADB does not guarantee the accuracy of the data included in this publication and accepts no responsibility for any consequence of their use. By making any designation of or reference to a particular territory or geographic area, or by using the term ―country‖ in this document, ADB does not intend to make any judgments as to the legal or other status of any territory or area.
Unless otherwise noted, $ refers to US dollars. © 2012 by Asian Development Bank August 2012 Publication Stock No. WPS124936

Contents . . . . . . . . . . . . . . . .
. . . . . . . . . . . . . . . . . . . . . . . . . . . . . . . . . . . . . . . . . . . . . . . . . . . . . . . . . . . . . . . . . . . . . . . . . . . . . . . . . . . . . . . . . . . . . . . . . . . . . . . . .
Abstract v
1. Introduction 1
2. Descriptive Statistics 3
2.1 Ownership Structure of the People’s Republic of China’s Firms 3
2.2 Relative Shares of the People’s Republic of China’s Trade by Different Types of Firms 4
2.3 Destination and Source Countries of the People’s Republic of China’s Trade in Parts and Components 5
2.4 Extensive and Intensive Margins 6
3. Empirical Models of the Parts and Components Trade by Different Types of Firms 7
3.1 The Basic Model 8
3.2 Partial-Adjustment Model 10
4. Empirical Results 11
4.1 The Basic Model 11
4.2 Partial-Adjustment Model 13
4.3 Summary of Puzzles from the Gravity Equations 14
5. Concluding Observations 15
References 17
ADB Working Paper Series on Regional Economic Integration 44
Figures
1. Ownership Types of Firms in the People’s Republic of China 21
2A. Trend of the People’s Republic of China’s Exports Shares Conducted by Domestic and Foreign-invested Firms (billion $) 22
2B. Trend of the People’s Republic of China’s Imports Shares Conducted by Domestic and Foreign-invested Firms (billion $) 22
Tables
1. The People’s Republic of China’s Exports and Imports of Different Types of Products by Different Types of Firms 23
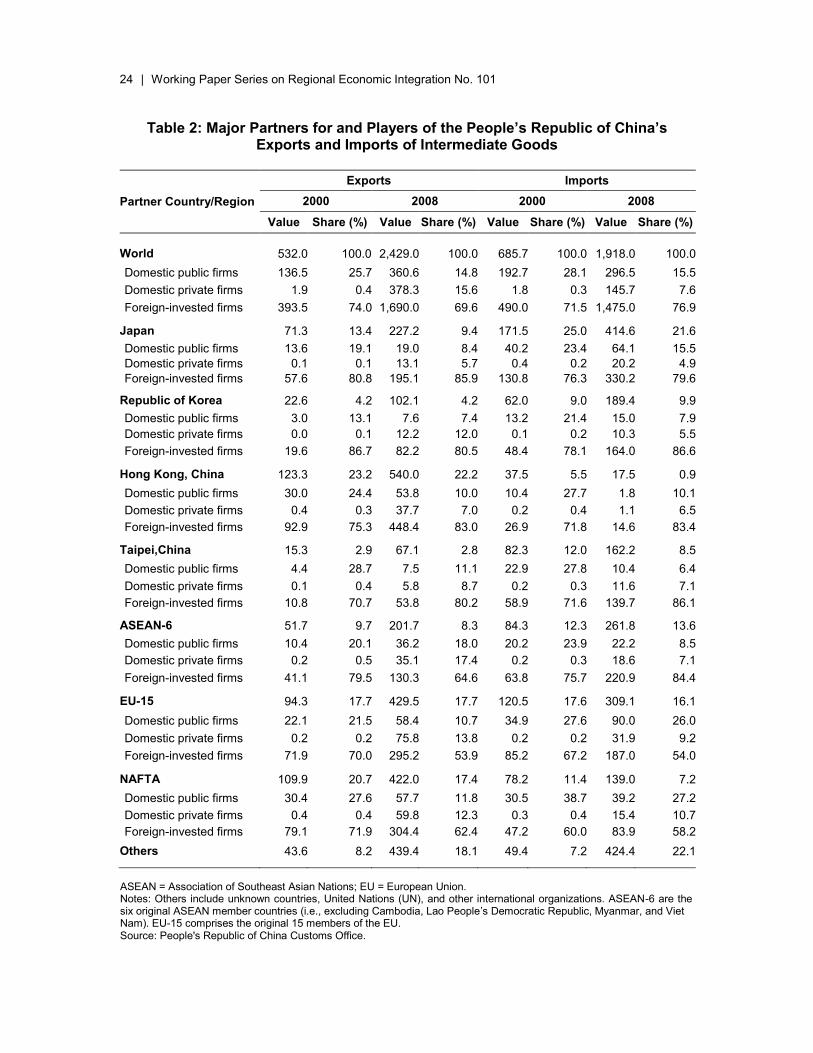
2. Major Partners for and Players of the People’s Republic of China’s Exports and Imports of Intermediate Goods 24
3. The People’s Republic of China's Parts and Components Trade at the 2-Digit HS Code Level (million $) 25

. . . . . . . . . . . . . . . .
. . . . . . . . . . . . . . . . . . . . . . . . . . . . . .. . . . . . . . . . . . . . . 4A. Goods Extensive and Intensive Margins of the People’s
Republic of China’s Exports (million $) 26
4B. Goods Extensive and Intensive Margins of the People’s Republic of China’s Imports by Different Types of Firms (million $) 27
5A. Country Extensive and Intensive Margins of the People’s Republic of China’s Exports by Different Types of Firms (million $) 28
5B. Country Extensive and Intensive Margins of the People’s Republic of China’s Imports by Different Types of Firms Firms (million $) 29
6. Determinants of Total Value of Exports: Basic Model 30
7. Determinants of Total Number of Exported Products: Basic Model 31
8. Determinants of Average Value of Exports: Basic Model 32
9. Determinants of Total Value of Imports: Basic Model 33
10. Determinants of Total Number of Imported Products: Basic Model 34
11. Determinants of Average Value of Imports: Basic Model 35
12. Determinants of Total Value of Exports: Partial Adjustment Model 36
13. Determinants of Total Number of Exported Products: Partial Adjustment Model 37
14. Determinants of Average Value of Exports: Partial Adjustment Model 38
15. Determinants of Total Value of Imports: Partial Adjustment Model 39
16. Determinants of Total Number of Imported Products: Partial Adjustment Model 40
17. Determinants of Average Value of Imports: Partial Adjustment Model 41
18. Elasticities of Partner Economies' GDP on "Goods" Extensive Margin and Intensive Margin of the People’s Republic of China’s Trade 42
19. Elasticities of Distance on "Goods" Extensive Margin and Intensive Margin of the People’s Republic of China’s Trade 43

Abstract Using highly disaggregated, Harmonized System (HS) 8-digit, product-category level data collected by the People’s Republic of China’s (PRC) Customs Office for 2000 and 2008, we perform an in-depth anatomy of the PRC's trade in manufactured goods. First, we distinguish between foreign firms and domestic firms, with the latter further divided into private firms and public firms. Second, we distinguish products as either final goods or intermediate goods. Third, we look at not only the PRC's exports but also its imports, and test for the relative importance of the extensive margin—number of goods—versus the intensive margin—the amount traded per good. Fourth, we estimate gravity equations from the perspective of dynamics utilizing a dynamic adjustment model. Overall, our analysis yields a number of new stylized facts and generates some interesting puzzles about the PRC's exports and imports. Keywords: People’s Republic of China, intermediate goods, fragmentation, foreign enterprises, firm heterogeneity JEL Classification: F14, F21, F23

Different Types of Firms, Products, and Directions of Trade | 1
1. Introduction
The focus of research on international trade has recently shifted from industries and countries to firms and products.1 It is now a stylized fact that exporting firms are larger, more productive, more skill and capital-intensive, and pay higher wages than non-exporting firms (Bernard and Jensen 1995; Bernard et al. 2007). The seminal theoretical study of Melitz (2003) assumes that there is a competitive fringe of firms that are producing horizontally differentiated varieties within the industry under monopolistic competition and enter the export market by paying a fixed entry cost. In this model, each firm produces only one good that is purchased by consumers (final good) and all firms are domestic ones. The Melitz (2003) model has been expanded in many directions. For example, Bernard et al. (2011a) generalize Melitz's (2003) framework to develop a model of a multi-product, multi-destination firm. But in their model, firms are still producing only final goods and there are no foreign-invested firms. Thus, the firm heterogeneity theory of international trade and its empirical studies are still in their infancy and there are still a few major areas that require further development. First, almost all theoretical and empirical studies in this literature neglect the importance of ownership difference. They implicitly assume exporting firms are domestic or do not explicitly differentiate domestic firms from foreign affiliates (Lu et al. 2010). Foreign-invested firms enjoy, on average, higher productivity due to entry costs and pay higher wages, and often generate productivity spillovers to the host country. Thus, foreign firms are different from domestic firms in terms of business culture and behavior, as well as in productivity, structure of employment, and other dimensions. A number of recent empirical studies use Chinese "micro-datasets‖ to investigate the consequences of firm ownership on size, productivity, capital- and skill-intensity, and wages. For example, Lu et al. (2010) compare foreign affiliate exporters with domestic exporters and find that foreign affiliate exporters are less productive than non-exporters, while domestic exporters are more productive than non-exporters. Manova and Zhang (2009) find that compared with private domestic firms, foreign-invested firms trade more and import more products from more source countries, but export fewer products to fewer destinations. Manova et al. (2011) show that foreign-owned firms and joint ventures perform better than private domestic firms. Du et al. (2012) find that exporting delivers significant productivity gains for domestic firms but not for foreign affiliates. Second, the literature on firm heterogeneity in international trade tends to assume that while products are differentiated they are all final goods and, therefore, rules out the existence of intermediate goods. Intermediate goods (parts and components) are goods used as inputs in the production of other intermediate goods or final goods and, hence, purchased by other producers, while final goods (finished goods) are purchased by consumers. Using data from 10 Organisation for Economic Co-operation and Development (OECD) and four emerging countries, Hummels et al. (2001) find that vertical specialization accounts for about 20% of the exports of these countries, an increase of almost one-third between 1970 and 1990. There have also been many
1 Bernard et al. (2011a) provide a comprehensive survey.

2 | Working Paper Series on Regional Economic Integration No. 101
studies confirming the existence of a high level of trade in intermediate goods between East Asian countries, including Arndt and Kierzkowski 2001; Athukorala 2005, 2009, and 2010; Athukorala and Yamashita 2006 and 2008; Ando and Kimura 2003 and 2009; Kimura 2009; and Lee et al. 2011. The presence of intermediate goods suggests the relevance of the theory of production networks, or production fragmentation, in which foreign direct investment (FDI) plays a major role. Foreign-invested firms trade more intensely in intermediate goods than domestic firms. The study by Goldberg et al. (2010) is of particular interest because it differentiates between final and intermediate products, unlike other empirical and theoretical studies on the trading behavior of heterogeneous firms. Goldberg et al. (2010) find that in the case of India's trade around two-thirds of the growth in imports of intermediate goods is accounted for by the extensive margin of newly imported products. They also find that industries that experienced greater tariff reductions in the early 1990s saw a larger increase in total value and a greater variety of imported intermediate inputs. Third, while the early empirical literature on firm heterogeneity in international trade looks almost exclusively at firm export behavior, most recent work using firm-level trade transaction data has begun to examine firm import behavior as well (Bernard 2011b). For United States (US) manufacturing firms, Bernard et al. (2007) find that importers are similar to exporters in that they are bigger, more productive, pay higher wages, and are more skill- and capital-intensive than non-importers. However, the majority of studies on firm behavior in international trade only address exports, mainly due to the lack of relevant micro data on importing. Fourth, much of the theoretical and empirical literature on heterogeneous firms and trade examines the cross-section distribution of trade across firms, products, and countries (Bernard et al. 2011a). Exceptions include Eaton et al. (2008); Eaton et al. (2011); Akhmetova (2011); Albornoz et al. (2011); Ruhl and Wills (2011); and Segura-Cayuela and Vilarrubia (2008). However, none of these studies examine trade dynamics in a gravity framework that highlights the importance of market size and trade costs in international trade. Baier et al. (2011) use gravity equations of intensive and extensive margins, and find that they are affected by economic integration. However, their study looks at total trade conducted by all firms irrespective of their ownership structure and types of goods. The main purpose of this paper is to address a number of issues that have been largely neglected in the literature of firm heterogeneity in international trade. For this purpose, we use Chinese firm trade flows data collected by the People’s Republic of China’s (PRC) Customs Office for 2000 and 2008.2 The database from the PRC Customs Office includes the f.o.b. value of both exports and imports of the PRC for 243 destination and source economies, and 7,526 different products at the 8-digit Harmonized System (HS) level. For each shipment, it also provides information on type and location of firm, transportation mode, and customs office.
2 The data collected by the People’s Republic of China Customs Office has also been used by Lu et al.
(2010); Manova and Zhang (2009); Manova et al. (2011) and Du et al. (2012) in their studies for the differential behavior of foreign vs. domestic firms in international trade.

Different Types of Firms, Products, and Directions of Trade | 3
The use of the PRC's trade data is of particular interest. Since joining the World Trade Organization (WTO) in 2001, the PRC’s international trade has expanded rapidly, largely due to its growing participation in international production networks. Lee et al. (2011) provide a comprehensive analysis of the extent of the PRC’s trade in parts and components for 1992–2009 and assess its determinants using an augmented gravity model. This paper is an extension of Lee et al. (2011). Using the PRC Customs Statistics database and an augmented gravity model, we distinguish exporters and importers into different types of firms and investigate how they react to the various determinants of trade in parts and components, as compared to trade in final goods. Like our paper, Manova and Zhang (2009) also use trade data collected by the PRC Customs Office to analyze the PRC's trade pattern at the firm level while distinguishing between domestic firms and foreign firms. However, this paper differs from Manova and Zhang (2009) in that we look at product differences and perform econometric analysis. Specifically, this paper contributes to the literature in four areas. First, we distinguish firms as either foreign firms or domestic firms, the latter being further divided into private firms and public firms. Second, we distinguish products as either final goods or intermediate goods. Third, we look at not only the PRC's exports but also its imports, and test for the relative importance of extensive margin—the number of goods—versus the intensive margin—the amount traded per good. Fourth, we estimate a gravity variable from the perspective of dynamics utilizing a dynamic adjustment model. Overall, our analysis yields a number of new stylized facts and generates some interesting puzzles about the PRC's exports and imports.
The paper is organized as follows. Section 2 examines the role of different types of firms and products in the PRC’s exports and imports in 2000 and 2008. Section 3 presents the empirical framework we use to estimate trade in intermediate goods, as compared to trade in final goods, by different types of firms. Section 4 reports and discusses the empirical results. Section 5 summarizes the main findings and concludes the paper.
2. Descriptive Statistics
In this section, we provide some descriptive statistics pertaining to the role of different types of firms and products in the PRC’s trade pattern.
2.1 Ownership Structure of the People’s Republic of China’s Firms
According to the Regulation of the PRC on the Management of Registration of Corporate Enterprises, Chinese firms are classified into two groups: (i) domestic firms in which the owners are solely Chinese legal entities or individuals and (ii) foreign-invested firms in which some or all investors are foreign legal entities or individuals. Domestic firms can be further categorized into two groups: (i) public firms and (ii) private firms. Public firms are again categorized into two groups: (i) state-owned enterprises (SOEs) and (ii) collective-owned enterprises. SOE refers to a business entity whose entire assets are owned by the government. That is, SOEs are business entities established by central and local governments that appoint their management team. Collective-owned
4 | Working Paper Series on Regional Economic Integration No. 101
enterprise refers to a business entity whose assets are owned collectively by a town or a group of people. Private firms are categorized into two types. A sole proprietorship company is solely invested by a natural person, whereas a joint-stock company is a company whose capital is divided into shares. Foreign-invested firms can be categorized into three types: (i) Sino-foreign cooperative enterprises, (ii) Sino-foreign joint ventures, and (iii) foreign-funded firms. In Sino-foreign cooperative enterprises, the foreign party typically supplies all or most of the capital and technologies, while the Chinese party supplies land, factory buildings, and useful facilities. In Sino-foreign joint ventures, foreign companies or individuals and Chinese companies or individuals typically invest together, operate together, take risk according to the ratio of their capital, and jointly take responsibility for their losses and profits. Foreign-funded firms can be either wholly foreign-owned enterprises, which are exclusively invested in by foreign companies, or foreign-funded shareholding companies, which are shareholding companies partially funded by foreign companies or individuals. Figure 1 summarizes different types of firms in the PRC. 2.2 Relative Shares of the People’s Republic of China’s Trade by Different
Types of Firms The PRC’s economy took off when it launched its economic reform and the Open Door Policy in 1978. FDI and international trade have since been the main drivers of the PRC’s rapid economic growth. Deng Xiaoping’s Nanxun speech in 1992 further promoted the PRC’s economic reform program and accelerated FDI inflows and international trade. Figures 2a and 2b illustrate the changing pattern of the PRC’s exports and imports, respectively, in 1993–2010. During this period, the PRC’s exports and imports grew steadily, with the exception of 2009 when world trade contracted in the wake of the global financial crisis. Since the PRC joined the WTO in November 2001, its trade has accelerated. The PRC’s exports expanded 2.7 times from US$92 billion in 1993 to US$249 billion in 2000. By comparison, its exports increased 5.7 times from aUS$249 billion in 2000 to US$1,430 billion in 2008. During this period, the majority of the PRC’s trade—both exports and imports—was carried out by foreign-invested firms, resulting from the massive FDI inflows into the PRC. This study focuses on trade data for the years 2000 and 2008, noting that the former is the year before the PRC joined the WTO and the latter is the year before global trade collapsed in the wake of the global financial crisis. Table 1 summarizes the relative shares of different firms in the PRC’s exports and imports of different kinds of products. All goods are categorized into non-manufactured goods (HS 01–27) and manufactured goods (HS 28–92), which are further categorized into final goods and intermediate goods (parts and components). Our classification of intermediate goods follows Athukorala (2010) in which a total of 525 6-digit HS codes for manufactured goods (HS 28–96) were identified as intermediate goods. One difference is that we exclude the seventeen 6-digit HS codes in HS 93-96 that are classified as "Others."

Different Types of Firms, Products, and Directions of Trade | 5
As seen in Figure 2, foreign firms accounted for the majority of the PRC’s trade in 2008. Foreign firms accounted for about 55% of both total exports and imports in 2008, up from 48% and 52%, respectively, in 2000. Foreign firms play a bigger role in the manufactured goods trade than in the trade for non-manufactured goods. In 2008, foreign firms accounted for 56.6% of the PRC’s manufactured exports and 69.4% of the PRC's manufactured imports. Within the manufactured goods trade, foreign firms play an even bigger role in the intermediate goods trade. In 2008, foreign firms were responsible for 69.6% of the PRC’s total intermediate exports and 76.9% of total intermediate imports. To summarize, foreign-invested firms dominate the PRC's trade in manufactured goods—both exports and imports—particularly in trade in intermediate goods. Among the PRC’s domestic firms, public and private firms accounted for roughly the same share (22%) of total exports, but the role of public firms is three times bigger than the role of private firms (33.8% vs. 11.0%) in the PRC’s total imports. The parts and components trade shows a similar pattern. Public enterprises and private firms each accounted for about 15% of total exports of intermediate products in 2008, while for imports public enterprises accounted for a bigger share (15.5% vs. 7.6%). However, the share of private firms is expected to increase very rapidly in the export and import of all kinds of products. Between 2000 and 2008, private firms’ share of exports rose from 1.0% to 22.8%, and their share of imports from 0.6% to 11.0, while public firms’ shares of both exports and imports declined sharply.3 Not only imports, but also exports, of parts and components increased during 2000–2008. Indeed, the value of the PRC's exports of intermediate goods is greater than that of the PRC's imports of intermediate goods (US$242.9 billion vs. US$191.8 billion). 2.3 Destination and Source Countries of the People’s Republic of China’s
Trade in Parts and Components Table 2 shows the shares of major partners for the PRC’s trade in parts and components for different types of firms. As noted earlier, foreign-invested firms took the lion’s share of the PRC’s global exports and imports of parts and components. Another notable aspect of the PRC’s trade in intermediate products is that Hong Kong, China was the major destination for the PRC's exports of intermediate goods in 2008, accounting for 22.2%, followed by the European Union (EU)-15 countries and the North American Free Trade Area (NAFTA), which accounted for 17.7% and 17.4%, respectively.4 In contrast, Japan was the largest source of the PRC's imports of intermediate goods in 2008, accounting for 21.6%. The EU-15 and ASEAN-6 are also major sources of the PRC's imports of intermediate goods, accounting for 16.1% and 13.6%, respectively, in 2008.
3 In 2003, the People’s Republic of China began accelerating the reform of SOEs. This policy led to small
SOEs facing market competition and the most inefficient ones went bankrupt. Meanwhile, the number of private enterprises has increased rapidly since 2003.
4 This is consistent with Feenstra and Hanson (2004) who found that Hong Kong, China distributes a
large fraction of the PRC's exports.

6 | Working Paper Series on Regional Economic Integration No. 101
Table 3 shows that the PRC’s trade in parts and components is highly concentrated in general machinery (HS 84) and electric machinery (HS 85). 2.4 Extensive and Intensive Margins A key implication of the Melitz (2003) model is that the extensive margin of the number of exporting firms should increase with the size of the destination market, since in larger markets firms with lower productivity can generate sufficient variable profits to cover the fixed costs of exporting. Bernard et al. (2009b) show that in the case of the US, while the majority of the variation in flows across countries can be explained by the extensive margins of the number of firms and products, year-on-year changes in trade are mostly driven by the intensive margin of trade within continuing firm–product–country trade relationships. Most researchers have examined "firm" extensive margins of trade, but recent researchers have also examined "goods" extensive margins and "country" extensive margins of trade. This section first examines the PRC's goods extensive and intensive margins and then country extensive and intensive margins. Aggregate bilateral exports (or imports) between any two countries (Tij) can be
decomposed into the "product" extensive margin of the number of product observations with positive exports (Nij) and the goods intensive margin of average product exports conditional on positive trade (Aij = Tij/Nij):
Tij = NijAij, Aij = Tij/Nij
Thus, the PRC's total world (T) exports and imports can be decomposed into the goods extensive margin of the number of product observations with positive exports (N) and the goods intensive margin of average product exports conditional on positive trade (A = T/N):
T = NA, A = T/N
Tables 4a and 4b summarize the goods extensive and intensive margins of the PRC's total world exports and imports, respectively, by different types of firms. The goods extensive margin of exports (imports) is defined as the number of HS 8-digit classification codes with positive exports (exports).5 As seen in panel B of the tables, the goods extensive margin increased between 2000 and 2008 for both exports and imports of final goods, irrespective of the types of firms. In particular, that of private firms increased by over 100% for both exports and imports. In contrast, for both exports and imports of intermediate goods, the goods extensive margin of domestic public firms and
5 Hummels and Klenow (2005) define each good as a 6-digit SITC category to decompose total trade into
the goods margin of trade. In contrast, Hillberry and McDaniel (2002) and Kehoe and Ruhl (2009) decompose post-NAFTA trade among the participating members into goods extensive and intensive margins using 4-digit SITC data. In their gravity study on the relationship between economic integration agreements and the margins of international trade, Baier et al. (2011) also use SITC 4-digit classification to decompose bilateral trade among 149 countries. In contrast, each good is defined in this paper as an 8-digit HS category, the most disaggregated category compared with other studies.

Different Types of Firms, Products, and Directions of Trade | 7
foreign-invested firms fell during the period, while that of private firms rose by over 50%. In 2008, the goods extensive margin was similar among the three types of firms for both exports and imports of both final and intermediate goods. Panel C of Tables 4a and 4b also reports the goods intensive margin, which is defined as the amount of total exports divided by the goods extensive margin. The goods intensive margin grew exceptionally fast between 2000 and 2008, for both exports and imports, irrespective of the type of firm. In particular, the goods extensive margin of domestic private firms rose by over 10,000% and 5,000% for exports and imports, respectively. Nonetheless, in 2008 the goods intensive margin was still the largest for foreign-invested firms for both exports and imports of final and intermediate goods. The PRC's total exports (or imports) against the world (T) can also be decomposed into the country extensive margin of the number of partner countries with positive exports (M)
and the country intensive margin of average exports to a partner country conditional on positive trade (B = T/M):
T = MB, B = T/M
Tables 5a and 5b (Panel B) report the country extensive and intensive margins of the PRC's exports and imports by different types of firms. The extensive country margin increased for both exports and imports, irrespective of types of goods and firms. In particular, the country extensive margin increased most rapidly for imports of intermediate goods by private firms. Comparing Tables 1, 4a and 4b, and 5a and 5b, increases in the PRC's trade (both exports and imports) of manufactured goods between 2000 and 2008 were driven by increases in the intensive margin of trade for a given good (goods intensive margin) and for a given country (country intensive margin), and by the extensive margin of trade of the number of goods (goods extensive margin), but not by the extensive margin of the number of countries (country extensive margin). In 2008, the country extensive margin of imports (the number of source countries) was greater for foreign-invested firms than for domestic public or private firms, and the country intensive margin of imports (the average imported value from a given country) was also greater for foreign firms than for domestic firms. This is consistent with Manova and Zhang (2009), who found that import product intensity and the number of source countries increase with foreign ownership. On the other hand, the country extensive margin of exports does not appear to be greater for foreign firms than for domestic firms, while the country intensive margin of exports is greater for foreign firms.
3. Empirical Models of the Parts and Components Trade by Different Types of Firms
In this section, we present the empirical framework used to estimate trade in intermediate goods.

8 | Working Paper Series on Regional Economic Integration No. 101
3.1 The Basic Model As noted in the Introduction, we use the gravity equation to assess how the three different types firms (foreign, domestic private, and domestic public) behave differently with respect to choosing their trading partners depending on different product types. Since Tinbergen (1962) and Pöyhönen (1963), the simple gravity equation—in which the volume of trade between two countries is proportional to the product of their masses, or gross domestic products (GDPs), and inversely related to the distance between them—has proved empirically highly successful. Recently, with renewed interest among economists in geography, the model has again become widely used in the literature. Indeed, many researchers have shown that the gravity equation can be derived from many different models of international trade (Helpman and Krugman 1985). Trade will be greater between country pairs that are far from the rest of the world than it will be between country pairs that are close to the rest of the world. Thus, the standard gravity equation drawn from theory can take the following form: LnTijt = α + β1LnGDPit + β2LnGDPjt + β3LnDISTijt + β4LnREMOTEit
+ β5LnREMOTEjt + ijt, (1)
where
LnTij = log of export flows from country i to country j (or imports flows to country i from country j) at time t,
LnGDPi = log of GDP of country i at time 5, LnGDPj = log of GDP of country j at time t, LnDISTij = log of geographical distance between country i and country j, LnREMOTEi = log of remoteness of country j at time t,
= log(1/∑k(GDPk/GDPw)/ DISTANCEik) where GDPw = world GDP,
LnREMOTEj = log of remoteness of country j at time t, = log(1/∑k(GDPk/GDPw)/ DISTANCEjk),
ij = random disturbance term. Because country i stands for only one country (the PRC) and we take only 2 years, variables for country i are removed from the gravity equation. Therefore, Equation (1)
becomes
LnTjt = α + β1LnGDPjt + β2LnDISTjt + β3LnREMOTEjt + jt, (2) where
LnTj = log of export flows from the PRC to country j (or imports flows to the PRC from country j) at time t,
LnDISTij = log of geographical distance between the PRC and country j.

Different Types of Firms, Products, and Directions of Trade | 9
In the equation above, we include dummy variables for island and landlocked countries.6 Taking note of the debate about the role of the WTO (Rose 2004 and 2005, Subramanian and Wei 2003), we include a dummy variable for WTO member countries. We also include a dummy variable for the PRC’s bilateral FTA partners. Lastly, we include a dummy variable for Hong Kong, China and Taipei,China, with which the PRC shares a number of commonalities such as language and culture, and maintains a special relationship. Thus, our augmented gravity equation is: LnTjt = α + β1LnGDPjt + β2LnDISTj + β3LnREMOTEjt + β4ISLANDj +
β5LANDLOCKEDj + β6RTAjt + β7WTOjt + β8HT + t + jt, (3) where
ISLANDj = 1 if country j is an island country,
= 0 otherwise, LANDLOCKEDj = 1 if country j is a landlocked country,
= 0 otherwise, RTAjt = 1 if country j is the PRC’s RTA partner at time t,
= 0 otherwise, WTOjt = 1 if country j is a WTO member at time t,
= 0 otherwise, HTt = 1 if country j is Hong Kong, China or Taipei,China,
= 0 otherwise,
t = year dummy. Among the explanatory variables, GDP (US dollars), GDP per capita, population, and area (square kilometers) are taken from the World Bank’s World Development Indicators (WDI) Online. Geographical distance is taken from Centre d'Etudes Prospectives et d'Informations Internationales (CEPII) website. The distances are weighted distances, which use city-level data to assess the geographic distribution of population inside each nation. The remoteness index is also calculated by using the weighted distances. The variables indicating whether the country is landlocked or an island are also taken from CEPII’s website. Lastly, information on WTO membership is taken from the website of the WTO and information on the PRC's regional trade agreements (RTAs) is from the PRC's official website, the PRC’s Free Trade Agreement Network. As discussed above, the PRC's aggregate bilateral trade with a country (Tj) can be
decomposed into the goods extensive margin of the number of product observations with positive exports (Nj) and the goods intensive margin of average product exports conditional on positive trade (Aj = Tj/Nj):
Tj = NjAj, Aj = Tj/Nj
6 It is also customary to include a dummy variable for country pairs sharing a land border. The PRC
shares borders with a number of countries and, hence, we included a dummy variable for these border-sharing countries but found no significant results.

10 | Working Paper Series on Regional Economic Integration No. 101
Therefore, the log of the extensive margin (Nj) and the log of the intensive margin (Aj)
will also be regressed, alternatively, against the regressors in the gravity equation presented in Equation (3). Our benchmark model of the gravity equation is static with a year dummy, as our data are based on 2 years—2000 and 2008—and country fixed effects cannot be estimated. Accordingly, in the next stage we estimate the so-called partial-adjustment model. 3.2 Partial-Adjustment Model The partial-adjustment model is useful because it can estimate not only the long-run factors, but also the short-run factors, influencing changes in trade between 2000 and 2008.7 Suppose that the desired level of LnTj at time t is LnTjt
*; then, the relationship
between the actual and the desired level of LnTj may be specified as
ΔLnTj = δ(LnTjt
* - LnTjt-1), (4)
where ΔLnTjt = LnTjt - LnTjt-1 and δ is the rate of adjustment bounded by zero and one. Because LnTjt
* is not observed, several formulations are possible. One formulation assumes that LnTjt
* is determined by the level forms of the determinants of LnTj in period t-1, as well as the difference forms, which incorporate changes in the long-run extent of LnTj between periods t-1 and t. Thus, the equation for changes in LnTij is
ΔLnTj = - δ LnTjt-1 + λ1Xjt-1 + λ2(Xjt - Xjt-1), (5)
where X is a vector of explanatory variables.
If the coefficients in Equation (5) are invariant to the choice of time period, which obtains at equilibrium with constant coefficients, and if the errors between t and t-1 are not correlated, then the λ coefficient on each level variable divided by the rate of adjustment parameter (δ) equals the corresponding long-run coefficient (β). The λ coefficients on the first-difference
variables represent the short-run adjustments to contemporaneous changes in the determinants of LnTj. In our gravity equation, the distance variable and dummies for landlocked and island countries are time-invariant and hence enter only as "level" variables. On the other hand, the PRC did not have any RTA partner in 2000 and hence the RTA dummy variable
enters only as a "difference" variable. Specifically, we estimate the following equation: ΔLnTj = -δLnTjt-1 + β1LnGDPjt-1 + β2LnDISTj + β3LnREMOTEjt-1 + β4ISLANDj
+ β5LANDLOCKEDj + β6WTOjt-1 + β7HTj + β8Δ LnGDPj + β9Δ LnREMOTEj
+ β10Δ RTAj + β11Δ WTO+ j, (6)
7 The partial-adjustment model can be found elsewhere, such as in Curry and George (1983); Stone and
Lee (1995); and Lee et al. (2008).

Different Types of Firms, Products, and Directions of Trade | 11
where t-1 = 2000,
t = 2008,
ΔLnGDPj = LnGDPjt - LnGDPjt-1,
ΔLnREMOTEj = LnREMOTEjt - LnREMOTEjt-1,
ΔRTAj = RTAjt - RTAjt-1,
ΔWTOj = WTOjt - WTOjt-1.
Thus, we can distinguish the short-run contemporaneous effect from the long-run steady-state effect. Another advantage of this model is that by first-differencing the dependent variable and the time-variant explanatory variables, this methodology also accounts for unobserved country-fixed effects as well as observed country-fixed effects. Equation (6) will also be estimated for the changes in the goods extensive margin (Nj) and in the goods intensive margin (Aj), alternatively.
4. Empirical Results In this section, we report and discuss the main empirical results. 4.1 The Basic Model Table 6 shows our benchmark regression results of the static gravity model in which the dependent variable is the value of export flows to each destination country for each category of products (final products and intermediate inputs) from the three different types of firms (public, private, and foreign). The gravity model works well for all equations, as indicated by the large size of R2. All three types of firms in the PRC export more to larger countries and less to countries that are farther away, irrespective of the types of products. A noticeable difference among the firms is that foreign-invested firms appear to be more responsive to the size of destination economies and their distance from the PRC in their exports of intermediate goods. This finding is consistent with Yi (2003), which shows that when various stages of production are spread across different countries, changes in trade costs can have a magnified impact on trade flows, because they are incurred each time that the good is traded back and forth between countries. If so, trade in intermediate goods, especially by foreign-invested firms, which are more likely to be involved in production fragmentation, would be more sensitive to geographic distance. We also find that foreign-invested firms export less to countries that are farther away from most other countries in the world. All three types of firms export less to landlocked countries, while only domestic firms export less to island countries. We have two variables related to trade liberalization: (i) WTO dummy variable and (i) RTA dummy variable. Foreign-invested firms in the PRC export more of both final and intermediate goods to WTO member countries. Domestic private firms export more final goods to WTO member countries. However, the PRC's free trade agreements do not

12 | Working Paper Series on Regional Economic Integration No. 101
have a significant effect. This is not surprising because in our sample there was no RTA partner of the PRC in 2000 and only few countries became the PRC's RTA partner between 2000 and 2008.8 However, one should not place too much confidence in such estimates because without taking full advantage of the panel data with country-pair fixed effects (partner country effects in our case) or with first differences, our regression cannot accurately estimate the precise impact of a free trade agreement, as explained by Baier and Bergstrand (2007) and Baier et al. (2011). Hong Kong, China and Taipei,China are found to be the special trading partners with respect to the PRC's exports, except for exports of intermediate products by foreign-invested firms. In particular, domestic private firms are found to have the strongest trade ties with these two economies. Table 7 reports the same benchmark regression results with the dependent variable replaced with the log of the goods extensive margin of the PRC's exports, defined as the number of HS-8 classifications that enter with positive value of export flows to each country for each category product. Table 8 reports the results when the dependent variable is the log of the goods intensive margin, defined as the average value of export flows per HS-8 classification with a positive export value. For both extensive and intensive margins of trade, the GDP of partners is positive and significant. Thus, the PRC imports more from large economies because it imports (i) larger quantities of a given good (intensive margin) and (ii) a wider set of goods (extensive margin). Our finding is consistent with Eaton et al. (2004 and 2011), which show that the number of firms and products selling to a market increases with market size, and with Bernard et al. (2011b) which show that the average exports per firm and product increases with market size. For both extensive and intensive margins, the distance variable is significant and negative. However, the absolute size of these coefficients is smaller for extensive margins than for intensive margins, irrespective of the types of goods and the types of firms. This is somewhat surprising since the well-known negative effect of distance on aggregate bilateral trade is largely accounted for by the extensive margin of the number of heterogeneous firms and products participating in trade rather than the intensive margin of the amount of trade per firm and product (Bernard et al. 2011b). The extensive margin has a significant positive relationship with the WTO membership dummy in most equations, while the intensive margin has a significant positive relationship only for exports of intermediates products from foreign-invested firms. On the other hand, the RTA dummy variable is not significantly positive. Table 9 reports the results when the dependent variable is total imports. The results are qualitatively similar, but the (absolute) sizes of the GDP and distance variables are larger in the import equations than in the export equations reported in Table 5.
8 In our sample, ASEAN (July 2005), Pakistan (July 2007), Chile (October 2006), and New Zealand
(October 2008) are the only economies that became RTA partners with the PRC between 2000 and 2008. Dates in parenthesis are the dates when the agreement entered into force.

Different Types of Firms, Products, and Directions of Trade | 13
Tables 10 and 11 report the results when the dependent variable is the goods extensive margin of imports and the goods intensive margin of imports, respectively. For both extensive and intensive margins of trade, the GDP of partners is positive and significant. Thus, the PRC imports more from large economies not only because large economies export larger quantities of a given good (intensive margin), but also because they export a wider set of goods (extensive margin). The absolute size of the estimates for the distance variable is greater for the extensive margin than for the intensive margin for final goods imports, but vice versa for intermediate goods imports. In addition, Chinese firms (both domestic and foreign) import greater varieties of both final and intermediate goods from WTO members, and import greater average values of intermediate goods only. In contrast, the RTA dummy variable is not positively significant. 4.2 Partial-Adjustment Model Table 12 presents ordinary least squares estimates of the partial-adjustment model in Equation (6) when the dependent variable is the first difference in the log of total value of exports for each category of products. As noted above, the partial-adjustment model allows us to distinguish the short-run contemporaneous effect from the long-run steady-state effect, and to account for unobserved country-fixed effects as well as observed country-fixed effects, by first-differencing the dependent variable and the time-variant explanatory variables. The adjustment rate, which is the coefficient of the lagged value of exports (LnTt-1), is the
largest in absolute terms for the equations for exports by private firms for both types of goods, suggesting that between 2000 and 2008, private firms, as compared to public firms or foreign-invested firms, increased their exports more rapidly to the destinations to which they exported less in 2000. The coefficients of the levels and difference-form variables of the log of GDP of partner economies have the expected positive signs and are significant at the 1% level. The log of distance has the expected negative sign and is highly significant in all of the equations, irrespective of the types of goods and firms. In terms of the size of the coefficient estimates, changes in exports of intermediate goods by foreign-invested firms are most responsive to geographical distance. Interestingly, the WTO membership status of trading partners does not seem to have contributed to an increase in exports of both final goods and intermediate goods, except for exports of intermediate goods by foreign-invested firms, which has a positive and significant coefficient for the level form of the WTO dummy (economies that were already members of the WTO as of 2000), but has a negative and significant coefficient for the difference form of the WTO dummy (economies that joined the WTO between 2000 and 2008). Also, only private firms increased their exports of intermediate goods to the PRC's new RTA partners. Table 13 reports the results when the dependent variable is the first difference in the log of the goods extensive margin of the PRC's exports for different types of goods traded

14 | Working Paper Series on Regional Economic Integration No. 101
by different types of firms. Surprisingly, the sign on the log of GDP of partner economies and on the first difference of GDP of partner economies is negative and significant in equations for intermediate goods exported by public firms and by foreign firms. None of the other equations carry a positive sign for the GDP of partner economies. It is puzzling that the PRC's public firms and foreign firms did not export a larger number of intermediate goods to the fast-growing economies. The distance variable is also puzzling. None of the equations carry a negative sign for the distance variable. In fact, for exports of intermediate goods, the distance variable is significant and positive, implying that the PRC's public firms and foreign firms export a larger number of intermediate goods to the more distant economies. The RTA dummy variable is positive and significant for exports of final goods, but not for exports of intermediate goods. In contrast, the WTO dummy variable (both level and difference) is positive and significant in some equations for exports of intermediate goods, but not for exports of final goods. These two findings deserve further investigation. Table 14 reports the results when the dependent variable is the first difference in the log of the goods intensive margin of the PRC's exports. The estimated coefficients for the GDP of partners and the distance variable are positive and negative, respectively, and both are significant. Therefore, the positive coefficient for the GDP of partners and the negative coefficient for the distance variable for the total value of exports, as reported in Table 12, are solely due to changes in intensive margin rather than extensive margin. Tables 15, 16, and 17 report the results when the dependent variable is the first difference in the log of total imports, the goods extensive margin of imports, and the intensive product margin of imports, respectively. The results are qualitatively similar, but the (absolute) size of the estimated coefficients for the GDP and distance variables are larger in these import equations than in the export equations reported in Tables 12, 13, and 14. 4.3 Summary of Puzzles from the Gravity Equations Table 18 summarizes the estimated coefficients for partner economies' GDP in the various gravity equations reported in Tables 6–17. Table 19 also summarizes the estimated coefficients for the geographic distances between the PRC and its partner economies in the various gravity equations reported in Tables 6–17. As summarized in Table 18, in the years 2000 and 2008 the PRC traded a greater number of goods and a greater amount per good with bigger economies. This finding is consistent with previous studies (Hummels and Klenow 2005). Also, between 2000 and 2008, the PRC traded greater amounts per given good with bigger economies, irrespective of the direction of trade, type of good, or type of firm. It is puzzling, however, to find that during this period, public firms and foreign firms reduced their exports of intermediate goods to countries whose economies were larger in 2000 and to countries whose economies grew faster.

Different Types of Firms, Products, and Directions of Trade | 15
As summarized in Table 19, in 2000 and 2008 the PRC traded fewer number of goods and a smaller amount per given good with more distant countries, a finding consistent with previous research. Between 2000 and 2008, the PRC reduced the amount per given good in its exports (imports) to (from) more distant countries, irrespective of the direction of trade and types of goods and firms. However, it is puzzling to find that during this period, public firms and foreign firms increased their exports of intermediate goods to more distant countries. During this period, those firms also increased their imports of intermediate goods from more distant countries. To sum up, unlike the static gravity equations, the dynamic gravity equations in the partial-adjustment model yield some puzzling results for both GDP and distance when the dependent variable is the goods extensive margin (number of products) of exports.
5. Concluding Observations The PRC’s phenomenal rise as a global economic heavyweight has been driven by its integration into the world economy. In particular, the explosive growth of its trade and exports since its market-oriented reforms of 1978 contributed to sustained rapid growth. The primary catalyst behind the PRC’s export-oriented industrialization was FDI, which provided the capital and technology that built up a globally competitive manufacturing base within a short period of time. Multinational corporations (MNCs) typically locate different parts of their production processes in different countries, and account for a large part of the global parts and components trade. The PRC is still in the midst of a transition toward a market economy in which a large mass of public firms coexist with a growing mass of private firms. In short, the PRC’s exports and imports are heterogeneous in terms of both trading firms and traded products. Therefore, a thorough analysis of the PRC’s trade would be incomplete without taking into account firm and product heterogeneity. At the same time, the focus of research on international trade has recently shifted from industries and countries to firms and products. This mirrors the stylized fact that firm and product heterogeneity are important dimensions of international trade. For example, exporting firms are larger, more productive, more skill- and capital-intensive, and pay higher wages than non-exporting firms. Nevertheless, the emerging literature on the implications of firm and product heterogeneity is still in its infancy and suffers from a number of shortcomings. First, almost all theoretical and empirical studies in the literature neglect ownership differences among firms. Second, the literature on firm heterogeneity in international trade assumes that all goods are final goods and rules out the existence of intermediate goods that are used in the production of other goods. Third, previous studies look primarily at firm export behavior rather than firm import behavior. Fourth, the literature tends to ignore the dynamics of firm trade behavior over time. The central objective of our paper is to address the above issues that have largely been neglected in the literature on firm heterogeneity in trade. First, we distinguish firms into foreign firms and domestic firms, and the latter are further divided into private firms and public firms. Second, we distinguish products into final goods and intermediate goods.

16 | Working Paper Series on Regional Economic Integration No. 101
Third, we look at not only the PRC's exports but also its imports, and test for the relative importance of extensive margin (number of goods) versus the intensive margin (amount traded per good). Fourth, we estimate gravity equations from the perspective of dynamics utilizing a dynamic adjustment model. Using highly disaggregated, HS 8-digit, product-category level data collected by the PRC Customs Office for 2000 and 2008, we perform an in-depth anatomy of the PRC's trade in manufactured goods. We estimate static gravity models with which we explain value of trade, extensive margins and intensive margins with a number of control variables, as well as a partial-adjustment model to capture dynamic trade behavior. Our in-depth empirical analysis of the PRC’s trade, which takes into account firm and product heterogeneity, yields a number of interesting findings and generates some puzzles. For example, foreign firms dominate the PRC’s trade in manufactured goods, especially its trade in intermediate goods. In 2008, while the goods extensive margin (number of goods traded) was similar among the three types of firms for both exports and imports of both final and intermediate goods, the goods intensive margin was higher for foreign firms in exports and imports of both types of goods. The PRC exports more to large economies not only because large economies import larger quantities of a given good (intensive margin) but also because they import a wider range of goods. Unlike the static gravity model, the dynamic gravity model based on partial adjustment yields some counterintuitive results that are at odds with previous studies. For example, public firms and foreign firms increased their exports (imports) of intermediate goods to (from) more distant countries. To conclude, we hope that our attempt to address the major shortcomings in the current literature on firm heterogeneity in trade through empirical analysis of Chinese trade micro-data will contribute to the further development of this emerging literature as well as deepen our understanding of the PRC’s trade pattern. Upon closer reflection, these shortcomings have a special resonance for the PRC. For one, given the PRC’s central role in East Asian production networks and the significant position that MNCs have in these networks, failure to distinguish between final and intermediate goods will compromise any analysis of the PRC’s trade. There are a number of promising directions for future research. Resolving the puzzles thrown by the results of our dynamic gravity equations, for GDP and distance, is one such direction. At a broader level, extending the type of analysis we carried out here to other countries where data are available, for example by applying a dynamic gravity model based on partial adjustment, will enrich our understanding of how firm and product heterogeneity influences international trade.

Different Types of Firms, Products, and Directions of Trade | 17
References Z. Akhmetova. 2011. Firm Experimentation in New Markets. Unpublished. F. Albornoz, H. Calvo-Pardo, G..Corcos, and E..Ornelas. 2011..Sequential Exporting.
Unpublished. M..Ando and F..Kimura. 2003. The Formation of International Production and
Distribution Networks in East Asia. NBER Working Paper. 10167. Cambridge, MA: National Bureau of Economic Research.
M..Ando and F..Kimura. 2009. Fragmentation in East Asia: Further Evidence. Papers.
20. Jakarta: Economic Research Institute for ASEAN and East Asia. S. Arndt and W..Kierzkowski, eds. 2001. Fragmentation: New Production Patterns in the
World Economy. New York: Oxford University Press.
P..Athukorala. 2005. Product Fragmentation and Trade Patterns in East Asia. Asian Economic Papers. 4 (3). pp.1–27.
P..Athukorala. 2009. Production Networks and Trade Patterns: East Asia in a Global Context. Departmental Working Papers. 15. Canberra: Australian National University, Economics Research School of Pacific and Asian Studies.
P..Athukorala. 2010. Production Networks and Trade Patterns in East Asia:
Regionalization or Globalization? ADB Working Paper. 56. Manila: ADB. P..Athukorala and Y.N..Yamashita. 2006. Production Fragmentation and Trade
Integration: East Asia in a Global Context. North American Journal of Economics and Finance. 17. pp. 233–256.
P..Athukorala and N..Yamashita. 2008. Global Production Sharing and US–[People’s
Republic of] China Trade Relations. In L..Song and W.T. Woo, eds. [People’s Republic of] China’s Dilemma: Economic Growth, the Environment and Climate Change. Canberra: Australian National University E Press. pp. 59–89.
S.L..Baier and J.H..Bergstrand. 2007. Do Free Trade Agreements Actually Increase
Members' International Trade? Journal of International Economics. 71. pp. 72–95. S.L. Baier, J.H. Bergstrand, and M..Feng. 2011. Economic Integration Agreements and
the Margins of International Trade. Unpublished. A.B. Bernard and J.B. Jensen. 1995. Exporters, Jobs, and Wages in US Manufacturing:
1976–87. Brooking Papers on Economic Activity: Microeconomics. pp. 67–112. A.B. Bernard, J.B. Jensen, S.J. Redding, and P.K. Schott. 2007. Firms in International
Trade. Journal of Economic Perspectives. 23 (3). pp. 105–130.

18 | Working Paper Series on Regional Economic Integration No. 101
A.B. Bernard, J.B. Jensen, S.J. Redding, and P.K. Schott. 2009b. The Margins of US Trade. American Economic Review Papers and Proceedings. 99. pp. 487–493.
A.B. Bernard, J.B. Jensen, S.J. Redding, and P.K. Schott. 2011a. The Empirics of Firm
Heterogeneity and International Trade. NBER Working Paper Series. 17627. Cambridge, MA: National Bureau of Economic Research.
A.B. Bernard, S.J. Redding, and P.K. Schott. 2011b. Multi-Product Firms and Trade
Liberalization. Quarterly Journal of Economics. 126. pp. 1271–1318. Centre d'Etudes Prospectives et d'Informations Internationales (CEPII). http://www.cepii.
fr/anglaisgraph/bdd/distances.htm China FTA Network. http://fta.mofcom.gov.cn/topic/chinaasean.shtml B. Curry and K.D. George. 1983. Industrial Concentration: A Survey. Journal of Industrial
Economics. 31. pp. 203–55. J. Du, Y. Lu, Z. Tao, and L. Yu. 2012. Do Domestic and Foreign Exporters Differ in
Learning by Exporting? Evidence from the PRC. [People’s Republic of] China Economic Review. In press.
J.S. Eaton, M. Eslava, M. Kugler, and J.R. Tybout. 2008. Export Dynamics in Columbia:
Firm-level Evidence. In E. Helpman, D. Martin, and T. Verdier, eds. The Organization of Firms in a Global Economy. Cambridge, MA: Harvard University Press.
J.S. Eaton, S. Kortum, and F. Kramarz. 2004. Dissecting Trade: Firms, Industries, and
Export Destinations. American Economic Review Papers and Proceedings. 94. pp. 150–154.
J.S. Eaton, S. Kortum, and F. Kramarz. 2011. An Anatomy of International Trade:
Evidence from French Firms. Econometrica. 79 (5). pp. 1453–1498. R. Feenstra and G. Hanson. 2004. Intermediaries in Entrepôt Trade: Hong Kong Re-
Exports of Chinese Goods. Journal of Economics and Management Strategy. 13. pp. 3–35.
P.K. Goldberg, A..K. Khandelwal, N. Pavcnik, and P. Topalova. 2010. Imported
Intermediate Inputs and Domestic Product Growth: Evidence from India. Quarterly Journal of Economics. 125 (4). pp. 1727–1767.
E. Helpman and P.R. Krugman. 1985. Market Structure and Foreign Trade. Cambridge:
MIT Press. R. Hillberry and C. McDaniel. 2002. A Decomposition of North American Trade Growth
Since NAFTA. United States International Trade Commission Working Paper. 12-A.

Different Types of Firms, Products, and Directions of Trade | 19
D. Hummels, J. Ishii, and K. Yi. 2001. The Nature and Growth of Vertical Specialization in World Trade. Journal of International Economics. 54. pp. 75–96.
D. Hummels and P.J. Klenow. 2005. The Variety and Quality of a Nation's Exports.
American Economic Review. 95 (3). pp. 704–723. T.J. Kehoe and K.J. Ruhl. 2009. How Important is the New Goods Margin in
International Trade? Federal Reserve Bank of Minneapolis Staff Report. 324. F. Kimura. 2009. The Spatial Structure of Production/Distribution Networks and Its
Implication for Technology Transfers and Spillovers. Papers. d005. Jakarta: Economic Research Institute for ASEAN and East Asia.
H.H. Lee, C.M. Koo, and E. Park. 2008. Are Exports of the PRC, Japan, and the
[Republic of] Korea Diverted in the Major Regional Trading Blocs? The World Economy. 31. pp. 841–860.
H.H. Lee, D. Park, and J. Wang. 2011. The Role of the People's Republic of China in
International Fragmentation and Production Networks: An Empirical Investigation. Working Papers on Regional Economic Integration. 87. Manila: ADB.
J. Lu, L. Yi, and Z. Tao. 2010. Exporting Behavior of Foreign Affiliates: Theory and
Evidence. Journal of International Economics. 81. pp. 197–205. K. Manova, S.J. Wei, and Z. Zhang. 2011. Firm Exporters and Multinational Activity
Under Credit Constraints. NBER Working Paper Series. 16905. Cambridge, MA: National Bureau of Economic Research.
K. Manova and Z. Zhang. 2009. [People’s Republic of] China's Exporters and Importers:
Firms, Products, and Trade Partners. NBER Working Paper Series. 15249. M.J. Melitz. 2003. The Impact of Trade on Intra-Industry Reallocations and Aggregate
Industry Productivity. Econometrica. 71 (6). pp. 1695–1725. P. Pöyhönen. 1963. A Tentative Model for the Volume of Trade Between Countries.
Weltwirtschaftliches Archiv. 90. pp. 93–100. A. Rose. 2004. Do We Really Know that the WTO Increases Trade? American Economic
Review. 94 (1). pp. 98–114. A. Rose. 2005. Which International Institutions Promote International Trade? Review of
International Economics. 13 (4). pp. 682–709. K.J. Ruhl and J.L. Willis. 2008. New Exporter Dynamics. Unpublished. R. Segura-Cayuela and J.M. Vilarrubia. 2008. Uncertainty and Entry into Export Markets.
Banco De España Working Paper. 0811. Madrid: Banco De España.

20 | Working Paper Series on Regional Economic Integration No. 101
J. Stone and H.H. Lee. 1995. Determinants of Intra-Industry Trade: A Longitudinal, Cross-Country Analysis. Weltwirtschaftliches Archive. 131. pp. 67–85.
A. Subramanian and S.J. Wei. 2007. The WTO Promotes Trade, Strongly But Unevenly.
Journal of International Economics. 72. pp. 151–175. J. Tinbergen. 1962. Shaping the World Economy. New York: Twentieth Century Fund. Wikipedia. Trade Bloc. http://en.wikipedia.org/wiki/Trade_bloc#Most_active_regional_
blocs World Bank. World Development Indicators. http://publications.worldbank.org/WDI World Trade Organization. Regional Trade Agreements Information System. http://rtais.
wto.org/UI/PublicMaintainRTAHome.aspx K. Yi. 2003. Can Vertical Specialization Explain the Growth of World Trade? Journal of
Political Economy. 111 (1). pp. 52–102.

Different Types of Firms, Products, and Directions of Trade | 21
Figure 1: Ownership Types of Firms in the People’s Republic of China
Source: Author's compilation.

22 | Working Paper Series on Regional Economic Integration No. 101
Figure 2A: Trend of the People’s Republic of China’s Exports Shares Conducted by Domestic and Foreign-invested Firms (billion $)
Source: People’s Republic of China Statistical Yearbook 2010.
Figure 2B: Trend of the People’s Republic of China Imports Shares
Conducted by Domestic and Foreign-invested Firms (billion $)
Source: People’s Republic of China Statistical Yearbook 2010.

Different Types of Firms, Products, and Directions of Trade | 23
Table 1: The People’s Republic of China’s Exports and Imports of Different Types of Products by Different Types of Firms
Item
Exports Imports
2000 % 2008 % 2000 % 2008 %
All Goods 249.2 100.0 1,428.0 100.0 225.1 100.0 1,132.0 100.0
Domestic public firms 127.0 51.0 311.9 21.8 105.1 46.7 382.6 33.8
Domestic private firms 2.4 1.0 325.7 22.8 1.4 0.6 124.8 11.0
Foreign-invested firms 119.5 48.0 790.6 55.4 117.3 52.1 619.2 54.7
Non-manufactured Goods 24.0 100.0 75.2 100.0 33.9 100.0 312.1 100.0
Domestic public firms 16.0 66.7 31.0 41.3 27.4 80.7 230.1 73.7
Domestic private firms 0.3 1.3 17.8 23.6 0.2 0.5 29.1 9.3
Foreign-invested firms 7.4 30.7 26.4 35.1 6.3 18.6 52.8 16.9
Manufactured Goods 206.9 100.0 1,269.0 100.0 188.5 100.0 812.2 100.0
Domestic public firms 101.3 49.0 267.0 21.0 76.8 40.7 151.9 18.7
Domestic private firms 1.8 0.9 282.6 22.3 1.2 0.6 95.2 11.7
Foreign-invested firms 103.8 50.2 718.8 56.6 110.1 58.4 564.0 69.4
Final Goods 153.7 100.0 1,026.1 100.0 119.9 100.0 620.4 100.0
Domestic public firms 87.7 57.0 230.9 22.5 57.5 48.0 122.3 19.7
Domestic private firms 1.6 1.1 244.8 23.9 1.0 0.8 80.7 13.0
Foreign-invested firms 64.5 41.9 549.8 53.6 61.1 50.9 416.5 67.1
Parts and Components 53.2 100.0 242.9 100.0 68.6 100.0 191.8 100.0
Domestic public firms 13.7 25.7 36.1 14.8 19.3 28.1 29.7 15.5
Domestic private firms 0.2 0.4 37.8 15.6 0.2 0.3 14.6 7.6
Foreign-invested firms 39.4 74.0 169.0 69.6 49.0 71.5 147.5 76.9
Source: People’s Republic of China Customs Office.
24 | Working Paper Series on Regional Economic Integration No. 101
Table 2: Major Partners for and Players of the People’s Republic of China’s Exports and Imports of Intermediate Goods
Partner Country/Region
Exports Imports
2000 2008 2000 2008
Value Share (%) Value Share (%) Value Share (%) Value Share (%)
World 532.0 100.0 2,429.0 100.0 685.7 100.0 1,918.0 100.0
Domestic public firms 136.5 25.7 360.6 14.8 192.7 28.1 296.5 15.5
Domestic private firms 1.9 0.4 378.3 15.6 1.8 0.3 145.7 7.6
Foreign-invested firms 393.5 74.0 1,690.0 69.6 490.0 71.5 1,475.0 76.9
Japan 71.3 13.4 227.2 9.4 171.5 25.0 414.6 21.6
Domestic public firms 13.6 19.1 19.0 8.4 40.2 23.4 64.1 15.5
Domestic private firms 0.1 0.1 13.1 5.7 0.4 0.2 20.2 4.9
Foreign-invested firms 57.6 80.8 195.1 85.9 130.8 76.3 330.2 79.6
Republic of Korea 22.6 4.2 102.1 4.2 62.0 9.0 189.4 9.9
Domestic public firms 3.0 13.1 7.6 7.4 13.2 21.4 15.0 7.9
Domestic private firms 0.0 0.1 12.2 12.0 0.1 0.2 10.3 5.5
Foreign-invested firms 19.6 86.7 82.2 80.5 48.4 78.1 164.0 86.6
Hong Kong, China 123.3 23.2 540.0 22.2 37.5 5.5 17.5 0.9
Domestic public firms 30.0 24.4 53.8 10.0 10.4 27.7 1.8 10.1
Domestic private firms 0.4 0.3 37.7 7.0 0.2 0.4 1.1 6.5
Foreign-invested firms 92.9 75.3 448.4 83.0 26.9 71.8 14.6 83.4
Taipei,China 15.3 2.9 67.1 2.8 82.3 12.0 162.2 8.5
Domestic public firms 4.4 28.7 7.5 11.1 22.9 27.8 10.4 6.4
Domestic private firms 0.1 0.4 5.8 8.7 0.2 0.3 11.6 7.1
Foreign-invested firms 10.8 70.7 53.8 80.2 58.9 71.6 139.7 86.1
ASEAN-6 51.7 9.7 201.7 8.3 84.3 12.3 261.8 13.6
Domestic public firms 10.4 20.1 36.2 18.0 20.2 23.9 22.2 8.5
Domestic private firms 0.2 0.5 35.1 17.4 0.2 0.3 18.6 7.1
Foreign-invested firms 41.1 79.5 130.3 64.6 63.8 75.7 220.9 84.4
EU-15 94.3 17.7 429.5 17.7 120.5 17.6 309.1 16.1
Domestic public firms 22.1 21.5 58.4 10.7 34.9 27.6 90.0 26.0
Domestic private firms 0.2 0.2 75.8 13.8 0.2 0.2 31.9 9.2
Foreign-invested firms 71.9 70.0 295.2 53.9 85.2 67.2 187.0 54.0
NAFTA 109.9 20.7 422.0 17.4 78.2 11.4 139.0 7.2
Domestic public firms 30.4 27.6 57.7 11.8 30.5 38.7 39.2 27.2
Domestic private firms 0.4 0.4 59.8 12.3 0.3 0.4 15.4 10.7
Foreign-invested firms 79.1 71.9 304.4 62.4 47.2 60.0 83.9 58.2
Others 43.6 8.2 439.4 18.1 49.4 7.2 424.4 22.1
ASEAN = Association of Southeast Asian Nations; EU = European Union. Notes: Others include unknown countries, United Nations (UN), and other international organizations. ASEAN-6 are the six original ASEAN member countries (i.e., excluding Cambodia, Lao People’s Democratic Republic, Myanmar, and Viet Nam). EU-15 comprises the original 15 members of the EU. Source: People's Republic of China Customs Office.

Diffe
rent
Typ
es o
f F
irm
s,
Pro
du
cts
, a
nd
Dir
ectio
ns o
f T
rad
e |
25
Ta
ble
3:
Th
e P
eo
ple
's R
ep
ub
lic
of
Ch
ina’s
Part
s a
nd
Co
mp
on
en
ts T
rad
e a
t th
e 2
-Dig
it H
S C
od
e L
eve
l (m
illio
n $
)
Ite
m
Ex
po
rts
Imp
ort
s
20
00
20
08
20
00
20
08
Pu
bli
c
Pri
va
te
Fo
reig
n
Pu
bli
c
Pri
va
te
Fo
reig
n
Pu
bli
c
Pri
va
te
Fo
reig
n
Pu
bli
c
Pri
va
te
Fo
reig
n
HS
28
- 3
8: che
mic
al p
rod
ucts
20
.7
0.0
66
.2
294
.3
5
2.4
1,7
26
.0
9.8
0
.0
3
54
.2
59
.9
71
.6
1
,535
.0
HS
39
-40
: p
lastics a
nd
ru
bbe
r
1
02
.3
2.7
1
82
.8
202
.2
434
.7
7
77
.5
119
.1
1
.2
4
00
.6
2
58
.0
1
47
.1
1
,372
.0
HS
47
-49
: w
oo
d p
ulp
pro
du
cts
21
.6
0.0
27
.1
4
9.9
40
.4
1
88
.1
5
7.1
0
.2
1
43
.6
31
.0
19
.8
231
.6
HS
50
-63
: te
xtile
s
an
d t
extile
art
icle
s
6
0.8
0
.7
7
9.2
1
21
.1
251
.8
3
55
.0
8
5.3
0
.6
1
92
.9
93
.3
44
.9
561
.3
HS
64
-67
: fo
otw
ea
r
71
.4
1.4
44
.5
6
5.1
99
.5
88
.8
1
1.8
0
.0
14
.5
5
.3
1
.4
1
2.7
HS
68
-70
: a
rtic
les o
f sto
ne
, p
laste
r, a
nd
cem
en
t
40
.7
1.5
1
46
.2
7
8.9
2
10
.1
7
03
.4
2
8.2
0
.3
1
10
.2
40
.2
32
.0
950
.4
HS
72
-83
: b
ase
me
tals
2
94
.4
1
8.7
1
50
.7
588
.8
944
.2
1,1
66
.0
124
.6
1
.3
3
23
.1
5
01
.5
2
64
.2
1
,742
.0
HS
84
: g
en
era
l m
achin
ery
4,9
72
.0
4
7.9
1
4,9
70
.0 1
5,4
70
.0
14
,870
.0 7
6,8
40
.0
6
,765
.0
92
.4
9,4
36
.0 7
1,6
70
.0
6,9
72
.0
13
,640
.0
HS
85
: e
lectr
ic m
ach
ine
ry
6
,562
.0
9
0.7
2
1,3
80
.0 1
4,5
10
.0
14
,910
.0 7
3,7
80
.0
10
,730
.0
67
.4 3
3,9
60
.0 1
0,3
60
.0
6,0
67
.0
73
,480
.0
HS
86
-87
: ve
hic
les a
nd
ra
ilwa
y
948
.3
2
3.8
9
65
.4
3,5
18
.0
5
,400
.0
7,8
25
.0
597
.8
8
.3
1,8
39
.0
2,6
84
.0
3
81
.5
8
,517
.0
HS
88
-89
: a
ircra
ft a
nd
sh
ips
8
0.9
0
.3
290
.0
342
.5
1
2.4
8
33
.8
533
.9
0.0
2
36
.5
5
68
.2
14
.8
644
.5
HS
90
-92
: p
recis
ion
m
ach
inery
4
77
.1
4.0
1,0
42
.0
825
.9
597
.1
4,6
88
.0
501
.7
4
.0
1,9
33
.0
1,3
99
.0
5
54
.3
7
,447
.0
To
tal
pa
rts
an
d
co
mp
on
en
ts
13
,652
.1
191
.7 3
9,3
44
.1 3
6,0
66
.8
37
,822
.6
----
1
9,5
64
.3
1
75
.6 4
8,9
43
.6 8
7,6
70
.6 1
4,5
70
.6
----
----
= N
o d
ata
; H
S =
Harm
oniz
ed S
yste
ms.
S
ourc
e: P
eople
's R
epublic
of
Chin
a C
usto
ms O
ffic
e.
Different Types of Firms, Products, and Directions of Trade | 25

26 | Working Paper Series on Regional Economic Integration No. 101
Table 4A: Goods Extensive and Intensive Margins of the People’s Republic of China’s Exports (million $)
Item
Total Exports
Goods Extensive Margin
Goods Intensive Margin
Number of Exporting Products
Average Exports of Each Product
2000 2008 Change (%)
2000 2008 Change (%)
2000 2008 Change (%)
Manufactured Goods 206,892 1,268,510 513.1 5,403 5,896 9.1 38.3 215.4 462.2
Domestic public firms 101,268 266,963 163.6 5,329 5,649 6.0 19.0 47.3 148.8
Domestic private firms 1,836 282,586 15,290.6 2,744 5,683 107.1 0.7 49.8 7,326.3
Foreign-invested firms 103,752 718,803 592.8 4,600 5,444 18.3 22.6 132.1 485.6
Final Goods 153,690 1,025,620 567.3 4,598 5,135 11.7 33.4 200.0 497.9
Domestic public firms 87,615 230,902 163.5 4,533 4,899 8.1 19.3 47.1 144.1
Domestic private firms 1,644 244,761 14,784.6 2,300 4,938 114.7 45.0 49.7 10.3
Foreign-invested firms 64,404 549,829 753.7 3,799 4,705 23.8 17.0 116.9 589.0
Parts and Components 53,202 242,890 356.5 805 761 -5.5 66.1 319.3 383.2
Domestic public firms 13,653 36,061 164.1 796 750 -5.8 17.2 48.1 179.7
Domestic private firms 192 37,825 19,631.3 444 745 67.8 0.4 50.7 11,633.2
Foreign-invested firms 39,348 168,974 329.4 801 739 -7.7 49.1 228.7 366.1
Notes: Number of exporting products is the number of HS 8-digit classified items. Average exports of each product is the total exports divided by the number of exporting products. Source: People's Republic of China Customs Office.

Different Types of Firms, Products, and Directions of Trade | 27
Table 4B: Goods Extensive and Intensive Margins of the People’s Republic of China’s Imports by Different Types of Firms (million $)
Item
Total Imports
Goods Extensive Margin
Goods Intensive Margin
Number of Importing Products
Average Imports of Each Product
2000 2008 Change (%)
2000 2008 Change (%)
2000 2008 Change (%)
Manufactured Goods 188,503 812,164 330.8 5,473 5,912 8.0 34.5 137.3 297.7
Domestic public firms 76,776 151,912 97.9 5,349 5,520 3.2 14.4 27.5 91.8
Domestic private firms 1,186 95,230 7,932.5 2,340 5,534 136.5 0.5 17.2 3,282.7
Foreign-invested firms 110,105 563,952 412.2 5,250 5,676 8.1 21.0 99.4 374.2
Final Goods 119,934 620,315 417.2 4,660 5,150 10.5 25.8 120.4 366.0
Domestic public firms 57,508 122,265 112.6 4,538 4,768 5.1 12.7 25.7 102.6
Domestic private firms 1,010 80,659 7,886.4 1,852 4,792 158.7 0.5 16.8 2,972.0
Foreign-invested firms 61,107 416,458 581.5 4,454 4,928 10.6 13.7 84.6 517.9
Parts and Components 68,569 191,850 179.8 813 762 -6.3 84.4 252.0 198.6
Domestic public firms 19,268 29,647 53.9 811 752 -7.3 23.8 39.4 65.4
Domestic private firms 176 14,571 8,198.2 488 742 52.0 0.4 19.7 5,355.8
Foreign-invested firms 48,997 147,495 201.0 796 748 -6.0 61.6 196.5 219.3
Notes: Number of importing products is the number of HS 8-digit classified items. Average imports of each product is the total imports divided by the number of importing products. Source: People's Republic of China Customs Office.

28 | Working Paper Series on Regional Economic Integration No. 101
Table 5A: Country Extensive and Intensive Margins of the People’s Republic of China’s Exports by Different Types of Firms (million $)
Item
Total Exports
Country Extensive Margin
Country Intensive Margin
Number of Destination Countries
Average Exports to Each Country
2000 2008 Change (%)
2000 2008 Change (%)
2000 2008 Change (%)
Manufactured Goods 206,892 1,268,510 513.1 220 232 5.5 940.4 5,467.7 481.4
Domestic public firms 101,268 266,963 163.6 220 227 3.2 460.3 1,176.0 155.5
Domestic private firms 1,836 282,586 ---- 170 228 34.1 10.8 1,239.4 11,375.5
Foreign-invested firms 103,752 718,803 592.8 213 229 7.5 487.1 3,138.9 544.4
Final Goods 153,690 1,025,620 567.3 219 232 5.9 701.8 4,420.8 529.9
Domestic public firms 87,615 230,902 163.5 218 226 3.7 401.9 1,021.7 154.2
Domestic private firms 1,644 244,761 ---- 169 228 34.9 9.7 1,073.5 10,932.9
Foreign-invested firms 64,404 549,829 753.7 212 228 7.5 303.8 2,411.5 693.8
Parts and Components 53,202 242,890 356.5 209 229 9.6 254.6 1,060.7 316.7
Domestic public firms 13,653 36,061 164.1 204 220 7.8 66.9 163.9 144.9
Domestic private firms 192 37,825 ---- 120 225 87.5 1.6 168.1 10,423.3
Foreign-invested firms 39,348 168,974 329.4 176 220 25.0 223.6 768.1 243.5
--- = No data. Notes: Number of countries is the number of countries to which the People's Republic of China exported in 2000 and 2008. Average exports to each country is the total exports divided by the number of exporting countries. Source: People's Republic of China Customs Office.

Different Types of Firms, Products, and Directions of Trade | 29
Table 5B: Country Extensive and Intensive Margins of the People’s Republic of China’s Imports by Different Types of Firms (million $)
Item
Total Imports
Country Extensive Margin
Country Intensive Margin
Number of Source Countries
Average Imports from Each Country
2000 2008 Change (%)
2000 2008 Change (%)
2000 2008 Change (%)
Manufactured Goods 188,503 812,164 330.8 184 217 17.9 1,024.5 3,742.7 265.3
Domestic public firms 76,776 151,912 97.9 172 182 5.8 446.4 834.7 87.0
Domestic private firms 1,186 95,230 7,932.5 85 189 122.4 13.9 503.9 3,512.5
Foreign-invested firms 110,105 563,952 412.2 157 211 34.4 701.3 2,672.8 281.1
Final Goods 119,934 620,315 417.2 181 213 17.7 662.6 2,912.3 339.5
Domestic public firms 57,508 122,265 112.6 169 179 5.9 340.3 683.0 100.7
Domestic private firms 1,010 80,659 7,886.4 80 183 128.8 12.6 440.8 3,391.3
Foreign-invested firms 61,107 416,458 581.5 153 204 33.3 399.4 2,041.5 411.1
Parts and Components 68,569 191,850 179.8 129 193 49.6 531.5 994.0 87.0
Domestic public firms 19,268 29,647 53.9 109 123 12.8 176.8 241.0 36.4
Domestic private firms 176 14,571 8,198.2 50 144 188.0 3.5 101.2 2,781.3
Foreign-invested firms 48,997 147,495 201.0 108 182 68.5 453.7 810.4 78.6
Notes: Number of countries is the number of countries from which the People's Republic of China imported. Average imports from each each country is the total imports divided by the number of importing countries. Source: People's Republic of China Customs Office.
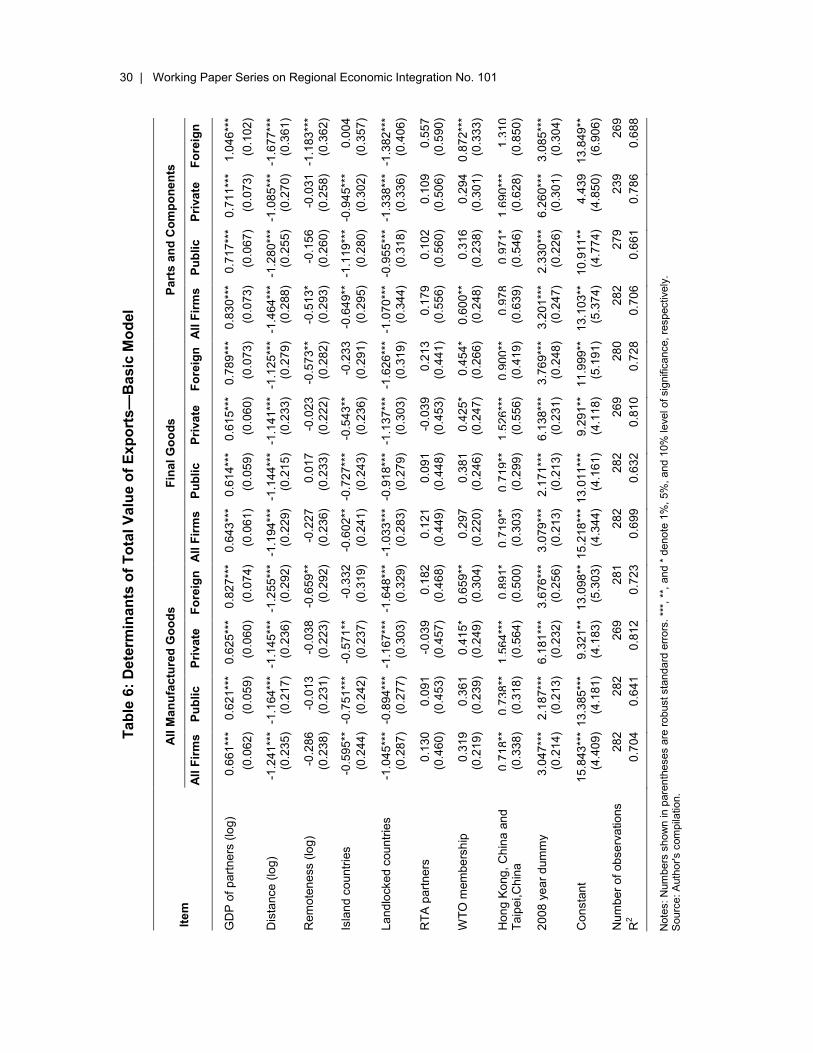
Ta
ble
6:
De
term
inan
ts o
f T
ota
l V
alu
e o
f E
xp
ort
s—
Ba
sic
Mo
del
Ite
m
All
Ma
nu
fac
ture
d G
oo
ds
Fin
al
Go
od
s
Pa
rts
an
d C
om
po
ne
nts
All
Fir
ms
P
ub
lic
Pri
va
te
Fo
reig
n
All
Fir
ms
P
ub
lic
Pri
va
te
Fo
reig
n
All
Fir
ms
P
ub
lic
Pri
va
te
Fo
reig
n
GD
P o
f p
art
ne
rs (
log
) 0
.66
1**
* 0
.62
1**
* 0
.62
5**
* 0
.82
7**
* 0
.64
3**
* 0
.61
4**
* 0
.61
5**
* 0
.78
9**
* 0
.83
0**
* 0
.71
7**
* 0
.71
1**
* 1
.04
6**
*
(0
.06
2)
(0.0
59
) (0
.06
0)
(0.0
74
) (0
.06
1)
(0.0
59
) (0
.06
0)
(0.0
73
) (0
.07
3)
(0.0
67
) (0
.07
3)
(0.1
02
)
Dis
tance
(lo
g)
-1.2
41
***
-1.1
64
***
-1.1
45
***
-1.2
55
***
-1.1
94
***
-1.1
44
***
-1.1
41
***
-1.1
25
***
-1.4
64
***
-1.2
80
***
-1.0
85
***
-1.6
77
***
(0
.23
5)
(0.2
17
) (0
.23
6)
(0.2
92
) (0
.22
9)
(0.2
15
) (0
.23
3)
(0.2
79
) (0
.28
8)
(0.2
55
) (0
.27
0)
(0.3
61
)
Rem
ote
ne
ss (
log
) -0
.28
6
-0.0
13
-0.0
38
-0.6
59
**
-0.2
27
0.0
17
-0.0
23
-0.5
73
**
-0.5
13
* -0
.15
6
-0.0
31
-1.1
83
***
(0
.23
8)
(0.2
31
) (0
.22
3)
(0.2
92
) (0
.23
6)
(0.2
33
) (0
.22
2)
(0.2
82
) (0
.29
3)
(0.2
60
) (0
.25
8)
(0.3
62
)
Isla
nd
co
untr
ies
-0.5
95
**
-0.7
51
***
-0.5
71
**
-0.3
32
-0.6
02
**
-0.7
27
***
-0.5
43
**
-0.2
33
-0.6
49
**
-1.1
19
***
-0.9
45
***
0.0
04
(0
.24
4)
(0.2
42
) (0
.23
7)
(0.3
19
) (0
.24
1)
(0.2
43
) (0
.23
6)
(0.2
91
) (0
.29
5)
(0.2
80
) (0
.30
2)
(0.3
57
)
La
nd
locke
d c
ou
ntr
ies
-1.0
45
***
-0.8
94
***
-1.1
67
***
-1.6
48
***
-1.0
33
***
-0.9
18
***
-1.1
37
***
-1.6
26
***
-1.0
70
***
-0.9
55
***
-1.3
38
***
-1.3
82
***
(0
.28
7)
(0.2
77
) (0
.30
3)
(0.3
29
) (0
.28
3)
(0.2
79
) (0
.30
3)
(0.3
19
) (0
.34
4)
(0.3
18
) (0
.33
6)
(0.4
06
)
RT
A p
art
ne
rs
0.1
30
0.0
91
-0.0
39
0.1
82
0.1
21
0.0
91
-0.0
39
0.2
13
0.1
79
0.1
02
0.1
09
0.5
57
(0
.46
0)
(0.4
53
) (0
.45
7)
(0.4
68
) (0
.44
9)
(0.4
48
) (0
.45
3)
(0.4
41
) (0
.55
6)
(0.5
60
) (0
.50
6)
(0.5
90
)
WT
O m
em
be
rsh
ip
0.3
19
0.3
61
0.4
15
* 0
.65
9**
0
.29
7
0.3
81
0.4
25
* 0
.45
4*
0.6
00
**
0.3
16
0.2
94
0.8
72
***
(0
.21
9)
(0.2
39
) (0
.24
9)
(0.3
04
) (0
.22
0)
(0.2
46
) (0
.24
7)
(0.2
66
) (0
.24
8)
(0.2
38
) (0
.30
1)
(0.3
33
)
Hon
g K
ong
, C
hin
a a
nd
T
aip
ei,C
hin
a
0.7
18
**
0.7
38
**
1.5
64
***
0.8
91
* 0
.71
9**
0
.71
9**
1
.52
6**
* 0
.90
0**
0
.97
8
0.9
71
* 1
.69
0**
* 1
.31
0
(0.3
38
) (0
.31
8)
(0.5
64
) (0
.50
0)
(0.3
03
) (0
.29
9)
(0.5
56
) (0
.41
9)
(0.6
39
) (0
.54
6)
(0.6
28
) (0
.85
0)
20
08
ye
ar
dum
my
3.0
47
***
2.1
87
***
6.1
81
***
3.6
76
***
3.0
79
***
2.1
71
***
6.1
38
***
3.7
69
***
3.2
01
***
2.3
30
***
6.2
60
***
3.0
85
***
(0
.21
4)
(0.2
13
) (0
.23
2)
(0.2
56
) (0
.21
3)
(0.2
13
) (0
.23
1)
(0.2
48
) (0
.24
7)
(0.2
26
) (0
.30
1)
(0.3
04
)
Con
sta
nt
15
.843
***
13
.385
***
9.3
21
**
13
.098
** 1
5.2
18
***
13
.011
***
9.2
91
**
11
.999
**
13
.103
**
10
.911
**
4.4
39
13
.849
**
(4
.40
9)
(4.1
81
) (4
.18
3)
(5.3
03
) (4
.34
4)
(4.1
61
) (4
.11
8)
(5.1
91
) (5
.37
4)
(4.7
74
) (4
.85
0)
(6.9
06
)
Num
be
r o
f ob
se
rva
tio
ns
28
2
28
2
26
9
28
1
28
2
28
2
26
9
28
0
28
2
27
9
23
9
26
9
R2
0.7
04
0.6
41
0.8
12
0.7
23
0.6
99
0.6
32
0.8
10
0.7
28
0.7
06
0.6
61
0.7
86
0.6
88
Note
s: N
um
bers
show
n in
pare
nth
eses a
re r
obust sta
ndard
err
ors
. **
*, *
*, a
nd *
denote
1%
, 5%
, and 1
0%
le
vel of sig
nific
ance,
respectively
.
S
ourc
e: A
uth
or's c
om
pila
tio
n.
30 | Working Paper Series on Regional Economic Integration No. 101

Ta
ble
7:
De
term
inan
ts o
f T
ota
l N
um
ber
of
Ex
po
rte
d P
rod
uc
ts—
Ba
sic
Mo
de
l
Ite
m
All
Ma
nu
fac
ture
d G
oo
ds
Fin
al
Go
od
s
Pa
rts
an
d C
om
po
ne
nts
All
Fir
ms
P
ub
lic
Pri
va
te
Fo
reig
n
All
Fir
ms
P
ub
lic
Pri
va
te
Fo
reig
n
All
Fir
ms
P
ub
lic
Pri
va
te
Fo
reig
n
GD
P o
f p
art
ne
rs (
log
) 0
.22
9**
* 0
.26
5**
* 0
.31
0**
* 0
.42
1**
* 0
.22
6**
* 0
.26
7**
* 0
.30
3**
* 0
.41
3**
* 0
.25
1**
* 0
.20
6**
* 0
.27
0**
* 0
.42
4**
*
(0
.02
5)
(0.0
26
) (0
.04
3)
(0.0
40
) (0
.02
4)
(0.0
26
) (0
.04
1)
(0.0
40
) (0
.03
0)
(0.0
27
) (0
.03
9)
(0.0
43
)
Dis
tance
(lo
g)
-0.4
25
***
-0.4
54
***
-0.6
27
***
-0.5
65
***
-0.4
36
***
-0.4
64
***
-0.6
22
***
-0.5
41
***
-0.3
81
***
-0.3
18
***
-0.5
15
***
-0.5
39
***
(0
.08
9)
(0.0
92
) (0
.16
4)
(0.1
56
) (0
.08
7)
(0.0
91
) (0
.16
0)
(0.1
53
) (0
.10
5)
(0.1
01
) (0
.13
9)
(0.1
56
)
Rem
ote
ne
ss (
log
) -0
.06
0
-0.0
19
-0.0
98
-0.4
06
***
-0.0
52
-0.0
29
-0.0
88
-0.3
94
**
-0.1
07
-0.0
19
-0.0
61
-0.4
48
***
(0
.09
7)
(0.1
02
) (0
.15
7)
(0.1
57
) (0
.09
5)
(0.1
00
) (0
.15
2)
(0.1
53
) (0
.11
9)
(0.1
12
) (0
.14
3)
(0.1
61
)
Isla
nd
co
untr
ies
-0.1
64
-0.2
22
**
-0.1
11
-0.1
05
-0.1
52
-0.2
05
* -0
.09
8
-0.0
33
-0.2
68
* -0
.47
1**
* -0
.25
3
-0.0
33
(0
.10
4)
(0.1
10
) (0
.15
9)
(0.1
73
) (0
.10
1)
(0.1
08
) (0
.15
3)
(0.1
64
) (0
.13
9)
(0.1
42
) (0
.16
4)
(0.1
72
)
La
nd
locke
d c
ou
ntr
ies
-0.6
03
***
-0.6
07
***
-0.9
92
***
-1.1
35
***
-0.6
20
***
-0.6
22
***
-0.9
81
***
-1.1
49
***
-0.5
29
***
-0.5
76
***
-0.7
03
***
-0.8
74
***
(0
.13
3)
(0.1
36
) (0
.21
1)
(0.1
94
) (0
.13
0)
(0.1
33
) (0
.20
5)
(0.1
92
) (0
.16
4)
(0.1
61
) (0
.18
9)
(0.2
00
)
RT
A p
art
ne
rs
0.0
06
0.0
31
-0.1
03
0.1
53
0.0
12
0.0
46
-0.0
82
0.1
75
-0.0
44
-0.0
58
0.0
16
0.2
45
(0
.13
1)
(0.1
93
) (0
.18
7)
(0.1
76
) (0
.13
0)
(0.1
99
) (0
.18
0)
(0.1
69
) (0
.14
8)
(0.1
70
) (0
.18
8)
(0.1
77
)
WT
O m
em
be
rsh
ip
0.2
32
**
0.2
49
**
0.3
58
**
0.5
35
***
0.2
22
**
0.2
46
**
0.3
49
**
0.4
63
***
0.3
22
**
0.2
20
* 0
.15
6
0.3
64
**
(0
.10
5)
(0.1
14
) (0
.17
9)
(0.1
73
) (0
.10
2)
(0.1
12
) (0
.17
3)
(0.1
61
) (0
.14
1)
(0.1
30
) (0
.15
6)
(0.1
69
)
Hon
g K
ong
, C
hin
a a
nd
T
aip
ei,C
hin
a
0.4
36
**
0.4
82
***
0.5
59
* 0
.87
5**
* 0
.42
4**
0
.48
1**
* 0
.50
9*
0.8
40
***
0.5
22
* 0
.34
7
0.4
83
* 0
.97
0**
(0.1
86
) (0
.16
1)
(0.3
28
) (0
.33
5)
(0.1
73
) (0
.14
8)
(0.3
07
) (0
.29
9)
(0.2
78
) (0
.26
5)
(0.2
47
) (0
.38
3)
20
08
ye
ar
dum
my
1.0
81
***
0.7
18
***
3.8
44
***
1.9
04
***
1.0
79
***
0.7
95
***
3.8
07
***
1.8
77
***
1.1
67
***
-0.0
58
3.2
61
***
1.7
06
***
(0
.09
1)
(0.0
96
) (0
.15
8)
(0.1
45
) (0
.08
9)
(0.0
94
) (0
.15
3)
(0.1
42
) (0
.11
8)
(0.1
06
) (0
.15
9)
(0.1
49
)
Con
sta
nt
5.0
93
***
4.0
32
**
2.2
63
2.8
40
5.0
25
***
4.0
01
**
2.1
62
2.6
05
2.5
31
2.4
15
0.6
92
1.4
16
(1
.73
5)
(1.8
34
) (2
.89
5)
(2.8
47
) (1
.70
1)
(1.8
10
) (2
.81
3)
(2.8
08
) (2
.08
4)
(1.8
58
) (2
.49
1)
(2.9
14
)
Num
be
r o
f ob
se
rva
tio
ns
28
2
28
2
26
9
28
1
28
2
28
2
26
9
28
0
28
2
27
9
23
9
26
9
R2
0.6
14
0.5
87
0.7
85
0.6
89
0.6
25
0.6
08
0.7
91
0.6
91
0.5
20
0.4
15
0.7
60
0.6
47
Note
s: N
um
bers
show
n in
pare
nth
eses a
re r
obust sta
ndard
err
ors
. **
*, *
*, a
nd *
denote
1%
, 5%
, and 1
0%
le
vel of sig
nific
ance,
respectively
.
S
ourc
e: A
uth
or's c
om
pila
tio
n.
Different Types of Firms, Products, and Directions of Trade | 31

Ta
ble
8:
De
term
inan
ts o
f A
ve
rag
e V
alu
e o
f E
xp
ort
s—
Ba
sic
Mo
de
l
Ite
m
All
Ma
nu
fac
ture
d G
oo
ds
Fin
al
Go
od
s
Pa
rts
an
d C
om
po
ne
nts
All
Fir
ms
P
ub
lic
Pri
va
te
Fo
reig
n
All
Fir
ms
P
ub
lic
Pri
va
te
Fo
reig
n
All
Fir
ms
P
ub
lic
Pri
va
te
Fo
reig
n
GD
P o
f p
art
ne
rs (
log
) 0
.43
3**
* 0
.35
6**
* 0
.31
5**
* 0
.40
6**
* 0
.41
6**
* 0
.34
7**
* 0
.31
1**
* 0
.37
6**
* 0
.57
9**
* 0
.51
0**
* 0
.44
1**
* 0
.62
3**
*
(0.0
44
) (0
.03
9)
(0.0
32
) (0
.04
3)
(0.0
43
) (0
.03
9)
(0.0
32
) (0
.04
2)
(0.0
51
) (0
.04
7)
(0.0
43
) (0
.06
7)
Dis
tance
(lo
g)
-0.8
16
***
-0.7
10
***
-0.5
18
***
-0.6
91
***
-0.7
59
***
-0.6
81
***
-0.5
19
***
-0.5
84
***
-1.0
83
***
-0.9
61
***
-0.5
70
***
-1.1
37
***
(0
.16
9)
(0.1
43
) (0
.12
2)
(0.1
69
) (0
.16
4)
(0.1
42
) (0
.12
1)
(0.1
60
) (0
.21
6)
(0.1
87
) (0
.16
2)
(0.2
40
)
Rem
ote
ne
ss (
log
) -0
.22
6
0.0
07
0.0
60
-0.2
53
-0.1
75
0.0
46
0.0
65
-0.1
79
-0.4
07
**
-0.1
37
0.0
30 -0
.73
5**
*
(0.1
60
) (0
.14
7)
(0.1
16
) (0
.17
0)
(0.1
59
) (0
.15
2)
(0.1
17
) (0
.16
4)
(0.2
06
) (0
.17
6)
(0.1
58
) (0
.23
8)
Isla
nd
co
untr
ies
-0.4
31
** -
0.5
28
***
-0.4
60
***
-0.2
26
-0.4
50
***
-0.5
22
***
-0.4
45
***
-0.2
00
-0.3
81
* -0
.64
7**
* -0
.69
1**
* 0
.03
7
(0
.16
9)
(0.1
60
) (0
.16
6)
(0.1
86
) (0
.16
8)
(0.1
63
) (0
.16
7)
(0.1
67
) (0
.20
3)
(0.1
85
) (0
.19
9)
(0.2
46
)
La
nd
locke
d c
ou
ntr
ies
-0.4
42
**
-0.2
87
* -0
.17
5
-0.5
13
***
-0.4
14
**
-0.2
96
* -0
.15
6 -0
.47
6**
* -0
.54
1**
-0
.38
0*
-0.6
35
***
-0.5
08
*
(0.1
86
) (0
.17
1)
(0.1
79
) (0
.18
6)
(0.1
84
) (0
.17
7)
(0.1
82
) (0
.17
7)
(0.2
22
) (0
.20
5)
(0.2
07
) (0
.28
0)
RT
A p
art
ne
rs
0.1
24
0.0
61
0.0
63
0.0
29
0.1
09
0.0
45
0.0
44
0.0
37
0.2
23
0.1
60
0.0
92
0.3
12
(0
.36
8)
(0.2
86
) (0
.34
3)
(0.3
66
) (0
.35
2)
(0.2
76
) (0
.34
1)
(0.3
37
) (0
.48
5)
(0.4
67
) (0
.37
5)
(0.5
22
)
WT
O m
em
be
rsh
ip
0.0
87
0.1
12
0.0
56
0.1
24
0.0
74
0.1
35
0.0
77
-0.0
09
0.2
77
* 0
.09
6
0.1
38
0.5
08
**
(0
.16
6)
(0.1
62
) (0
.15
3)
(0.1
88
) (0
.16
8)
(0.1
68
) (0
.15
5)
(0.1
68
) (0
.15
9)
(0.1
60
) (0
.19
5)
(0.2
39
)
Hon
g K
ong
, C
hin
a a
nd
T
aip
ei,C
hin
a
0.2
82
0.2
56
1.0
05
**
0.0
17
0.2
95
0.2
39
1.0
17
**
0.0
60
0.4
56
0.6
24
1.2
07
***
0.3
40
(0.2
20
) (0
.20
2)
(0.3
93
) (0
.25
4)
(0.1
88
) (0
.19
2)
(0.4
38
) (0
.19
2)
(0.4
89
) (0
.45
2)
(0.4
26
) (0
.57
8)
20
08
ye
ar
dum
my
1.9
66
***
1.4
68
***
2.3
37
***
1.7
72
***
2.0
00
***
1.3
76
***
2.3
31
***
1.8
92
***
2.0
34
***
2.3
88
***
2.9
99
***
1.3
79
***
(0
.14
8)
(0.1
37
) (0
.13
5)
(0.1
49
) (0
.14
8)
(0.1
39
) (0
.13
5)
(0.1
43
) (0
.16
8)
(0.1
55
) (0
.19
3)
(0.2
06
)
Con
sta
nt
10
.750
***
9.3
54
***
7.0
57
***
10
.258
***
10
.194
***
9.0
10
***
7.1
29
***
9.3
95
***
10
.572
***
8.4
96
***
3.7
47 1
2.4
33
***
(2
.98
7)
(2.6
02
) (1
.92
6)
(2.9
38
) (2
.93
3)
(2.6
00
) (1
.92
4)
(2.8
49
) (3
.76
3)
(3.2
90
) (2
.77
1)
(4.4
31
)
Num
be
r o
f ob
se
rva
tio
ns
28
2
28
2
26
9
28
1
28
2
28
2
26
9
28
0
28
2
27
9
23
9
26
9
R2
0.6
77
0.6
03
0.6
54
0.6
34
0.6
67
0.5
71
0.6
47
0.6
38
0.7
10
0.7
19
0.6
91
0.6
14
N
ote
s: N
um
bers
show
n in
pare
nth
eses a
re r
obust sta
nda
rd e
rrors
. **
*, *
*, a
nd *
denote
1%
, 5%
, and 1
0%
le
vel of sig
nific
ance,
respectively
.
S
ourc
e: A
uth
or's c
om
pila
tio
n.
32 | Working Paper Series on Regional Economic Integration No. 101

T
ab
le 9
: D
ete
rmin
an
ts o
f T
ota
l V
alu
e o
f Im
po
rts
—B
asic
Mo
del
Ite
m
All
Ma
nu
fac
ture
d G
oo
ds
Fin
al
Go
od
s
Pa
rts
an
d C
om
po
ne
nts
All
F
irm
s
Pu
bli
c
Pri
va
te
Fo
reig
n
All
Fir
ms
P
ub
lic
Pri
va
te
Fo
reig
n
All
Fir
ms
P
ub
lic
Pri
va
te
Fo
reig
n
GD
P o
f p
art
ne
rs (
log
) 0
.99
6**
* 0
.99
2**
* 0
.91
6**
* 1
.12
0**
* 0
.98
8**
* 0
.94
1**
* 0
.85
9**
* 1
.08
9**
* 1
.39
6**
* 1
.38
6**
* 1
.15
3**
* 1
.40
1**
*
(0.1
03
) (0
.10
7)
(0.1
10
) (0
.11
0)
(0.1
06
) (0
.10
8)
(0.1
11
) (0
.11
3)
(0.1
34
) (0
.17
3)
(0.1
51
) (0
.13
4)
Dis
tance
(lo
g)
-2.1
54
***
-2.3
03
***
-1.9
12
***
-1.9
19
***
-2.1
22
***
-2.3
10
***
-1.8
59
***
-1.9
23
***
-2.5
66
***
-2.7
19
***
-3.1
40
***
-2.6
47
***
(0
.34
2)
(0.3
54
) (0
.31
0)
(0.3
79
) (0
.34
0)
(0.3
56
) (0
.31
0)
(0.3
65
) (0
.51
5)
(0.5
76
) (0
.49
3)
(0.5
21
)
Rem
ote
ne
ss (
log
) -0
.59
7
-0.3
41
0.3
67
-0.7
56
* -0
.43
5
-0.1
55
0.6
97
* -0
.46
9
-2.9
44
***
-2.7
16
***
-2.5
28
***
-2.5
46
***
(0
.40
2)
(0.4
22
) (0
.40
9)
(0.4
13
) (0
.40
6)
(0.4
28
) (0
.41
6)
(0.4
15
) (0
.51
4)
(0.5
68
) (0
.48
6)
(0.5
11
)
Isla
nd
co
untr
ies
-0.2
91
-0.4
24
-0.8
77
* 0
.00
7
-0.3
87
-0.4
22
-1.0
01
* -0
.25
9
1.4
12
**
1.0
91
0.2
32
1.2
84
*
(0.4
41
) (0
.47
5)
(0.5
27
) (0
.47
1)
(0.4
52
) (0
.48
9)
(0.5
78
) (0
.47
7)
(0.7
11
) (0
.86
3)
(0.6
64
) (0
.67
1)
La
nd
locke
d c
ou
ntr
ies
-0.6
71
-0.4
39
-0.2
84
-1.2
19
**
-0.7
58
-0.4
24
-0.0
50
-1.2
35
**
-1.0
83
* -0
.43
4
-2.0
73
***
-0.9
70
(0
.48
1)
(0.5
56
) (0
.63
5)
(0.5
45
) (0
.53
3)
(0.5
67
) (0
.54
4)
(0.5
58
) (0
.58
4)
(0.7
42
) (0
.76
0)
(0.6
15
)
RT
A p
art
ne
rs
0.6
31
0.4
26
0.4
69
0.7
68
0.6
97
0.4
28
0.3
28
0.7
38
1.0
06
0.4
36
0.9
14
0.7
52
(0
.88
1)
(0.9
10
) (0
.73
3)
(1.0
17
) (0
.87
1)
(0.9
17
) (0
.73
4)
(1.0
08
) (1
.34
8)
(1.6
72
) (1
.18
3)
(1.3
45
)
WT
O m
em
be
rsh
ip
0.7
09
0.6
34
0.6
40
0.8
14
0.4
65
0.4
87
0.5
37
0.8
40
1.7
98
***
1.8
64
***
2.4
01
***
2.2
83
***
(0
.46
5)
(0.5
60
) (0
.53
0)
(0.5
06
) (0
.47
3)
(0.6
21
) (0
.55
7)
(0.5
23
) (0
.62
7)
(0.7
03
) (0
.74
3)
(0.6
17
)
Hon
g K
ong
, C
hin
a a
nd
T
aip
ei,C
hin
a
0.5
73
0.4
44
-0.2
87
0.8
90
0.6
25
0.4
97
-0.2
76
0.8
83
0.6
60
-1.0
45
-0.5
45
0.6
65
(0.6
43
) (0
.68
3)
(0.4
59
) (0
.77
5)
(0.6
87
) (0
.70
3)
(0.4
69
) (0
.78
2)
(1.1
20
) (1
.55
8)
(1.1
95
) (1
.08
9)
20
08
ye
ar
dum
my
2.7
50
***
2.1
74
***
5.3
03
***
2.5
74
***
2.8
05
***
2.1
88
***
5.3
61
***
2.6
27
***
2.2
18
***
1.5
40
**
4.1
76
***
1.8
47
***
(0
.36
9)
(0.4
17
) (0
.51
0)
(0.4
04
) (0
.38
0)
(0.4
32
) (0
.54
0)
(0.4
12
) (0
.55
1)
(0.6
12
) (0
.70
6)
(0.5
88
)
Con
sta
nt
16
.048
**
14
.575
**
3.5
35
11
.239
14
.528
**
14
.282
**
1.6
64
9.3
63
25
.150
***
23
.876
**
28
.514
***
21
.897
**
(6
.83
3)
(6.9
28
) (6
.04
0)
(7.1
59
) (6
.87
3)
(6.9
69
) (5
.89
7)
(7.1
79
) (8
.97
8)
(10
.241
) (8
.77
4)
(8.8
42
)
Num
be
r o
f ob
se
rva
tio
ns
26
6
25
6
20
1
25
3
26
5
25
1
19
6
24
7
23
1
18
3
15
0
20
8
R2
0.5
65
0.4
94
0.5
48
0.5
79
0.5
36
0.4
55
0.5
43
0.5
65
0.6
18
0.5
54
0.6
27
0.6
23
Note
s: N
um
bers
show
n in
pare
nth
eses a
re r
obust sta
ndard
err
ors
. **
*, *
*, a
nd *
denote
1%
, 5%
, and 1
0%
le
vel of sig
nific
ance,
respectively
.
S
ourc
e: A
uth
or's c
om
pila
tio
n.
Different Types of Firms, Products, and Directions of Trade | 33

Ta
ble
10
: D
ete
rmin
an
ts o
f T
ota
l N
um
ber
of
Imp
ort
ed
Pro
du
cts
—B
asic
Mo
del
Ite
m
All
Ma
nu
fac
ture
d G
oo
ds
Fin
al
Go
od
s
Pa
rts
an
d C
om
po
ne
nts
All
Fir
ms
P
ub
lic
Pri
va
te
Fo
reig
n
All
Fir
ms
P
ub
lic
Pri
va
te
Fo
reig
n
All
Fir
ms
P
ub
lic
Pri
va
te
Fo
reig
n
GD
P o
f p
art
ne
rs (
log
) 0
.61
1**
* 0
.67
2**
* 0
.58
6**
* 0
.64
6**
* 0
.61
9**
* 0
.65
1**
* 0
.56
0**
* 0
.65
0**
* 0
.55
7**
* 0
.59
5**
* 0
.49
4**
* 0
.56
3**
*
(0.0
55
) (0
.05
8)
(0.0
61
) (0
.06
1)
(0.0
56
) (0
.05
9)
(0.0
59
) (0
.06
2)
(0.0
54
) (0
.07
2)
(0.0
71
) (0
.05
9)
Dis
tance
(lo
g)
-1.1
57
***
-1.2
83
***
-1.1
83
***
-1.1
09
***
-1.2
26
***
-1.3
47
***
-1.2
11
***
-1.2
16
***
-0.7
58
***
-0.9
67
*** -1
.01
1**
* -0
.83
0**
*
(0.1
96
) (0
.20
8)
(0.2
11
) (0
.22
1)
(0.1
98
) (0
.20
8)
(0.2
04
) (0
.21
8)
(0.1
93
) (0
.21
8)
(0.2
14
) (0
.20
5)
Rem
ote
ne
ss (
log
) -1
.06
8**
* -0
.90
4**
* -0
.94
0**
* -1
.15
4**
* -0
.95
1**
* -0
.72
7**
* -0
.80
4**
* -1
.02
1**
* -1
.29
8**
* -1
.17
0**
* -1
.01
1**
* -1
.15
2**
*
(0.2
28
) (0
.24
2)
(0.2
02
) (0
.24
8)
(0.2
34
) (0
.24
6)
(0.1
99
) (0
.25
0)
(0.2
10
) (0
.23
3)
(0.2
02
) (0
.22
7)
Isla
nd
co
untr
ies
0.3
11
0.2
05
0.2
34
0.4
30
0.2
91
0.1
92
0.1
75
0.3
31
0.4
36
0.3
19
0.1
93
0.5
57
**
(0
.22
8)
(0.2
42
) (0
.25
7)
(0.2
70
) (0
.22
7)
(0.2
49
) (0
.25
3)
(0.2
63
) (0
.27
0)
(0.3
19
) (0
.30
0)
(0.2
79
)
La
nd
locke
d c
ou
ntr
ies
-0.6
37
***
-0.6
15
**
-0.5
98
***
-0.9
27
***
-0.6
31
***
-0.5
50
**
-0.5
64
** -0
.94
5**
* -0
.71
3**
* -0
.50
5* -0
.89
7**
* -0
.66
3**
(0.2
09
) (0
.25
2)
(0.2
27
) (0
.25
1)
(0.2
19
) (0
.25
5)
(0.2
27
) (0
.25
9)
(0.2
30
) (0
.30
0)
(0.2
92
) (0
.26
3)
RT
A p
art
ne
rs
0.2
87
0.1
12
0.3
42
0.2
00
0.2
57
0.0
82
0.2
71
0.1
68
0.4
34
0.1
98
0.4
92
0.2
07
(0
.38
9)
(0.4
37
) (0
.43
6)
(0.4
51
) (0
.39
6)
(0.4
34
) (0
.43
5)
(0.4
58
) (0
.38
9)
(0.4
48
) (0
.42
9)
(0.4
29
)
WT
O m
em
be
rsh
ip
0.6
55
***
0.6
17
***
0.6
86
***
0.8
32
***
0.6
77
***
0.6
60
***
0.7
20
***
0.8
58
***
0.6
12
***
0.7
30
***
0.9
03
***
1.0
35
***
(0
.19
7)
(0.2
11
) (0
.20
5)
(0.2
24
) (0
.20
8)
(0.2
32
) (0
.21
7)
(0.2
30
) (0
.19
8)
(0.2
30
) (0
.28
4)
(0.2
47
)
Hon
g K
ong
, C
hin
a
an
d T
aip
ei,C
hin
a
0.8
21
***
0.6
74
**
0.1
02
0.9
32
***
0.8
21
***
0.6
56
**
0.1
39
0.9
17
***
0.7
11
***
0.3
54
0.0
59
0.4
10
(0.2
98
) (0
.32
8)
(0.3
52
) (0
.34
5)
(0.3
00
) (0
.30
2)
(0.3
29
) (0
.33
5)
(0.2
71
) (0
.35
7)
(0.2
94
) (0
.42
6)
20
08
ye
ar
dum
my
1.4
18
***
0.8
93
***
2.8
57
***
1.4
39
***
1.3
84
***
0.8
55
***
2.7
96
***
1.3
38
***
1.0
59
***
0.5
34
** 1
.96
4**
* 0
.95
5**
*
(0.1
89
) (0
.20
2)
(0.2
62
) (0
.22
1)
(0.1
95
) (0
.20
9)
(0.2
62
) (0
.22
4)
(0.2
07
) (0
.24
0)
(0.3
21
) (0
.24
6)
Con
sta
nt
8.0
43
**
5.9
22
5.6
41
6.8
02
7.2
25
* 5
.25
3
5.1
83
6.3
47
6.4
31
* 5
.97
5
6.1
13
5.0
46
(3
.98
6)
(4.2
11
) (3
.86
6)
(4.3
55
) (4
.03
6)
(4.2
09
) (3
.73
3)
(4.3
81
) (3
.68
2)
(4.2
74
) (3
.94
2)
(3.9
04
)
Num
be
r o
f ob
se
rva
tio
ns
26
5
25
6
20
1
25
3
26
4
25
1
19
6
24
9
23
0
18
3
15
0
20
8
R2
0.7
10
0.6
95
0.7
26
0.6
79
0.7
00
0.6
66
0.7
15
0.6
82
0.6
69
0.6
22
0.6
16
0.6
25
Note
s: N
um
bers
show
n in
pare
nth
eses a
re r
obust sta
nd
ard
err
ors
. **
*, *
*, a
nd *
denote
1%
, 5%
, and 1
0%
le
vel of sig
nific
ance,
respectively
.
S
ourc
e: A
uth
or's c
om
pila
tio
n.
34 | Working Paper Series on Regional Economic Integration No. 101

Ta
ble
11
: D
ete
rmin
an
ts o
f A
vera
ge V
alu
e o
f Im
po
rts
—B
asic
Mo
de
l
Ite
m
All
Ma
nu
fac
ture
d G
oo
ds
Fin
al
Go
od
s
Pa
rts
an
d C
om
po
ne
nts
All
Fir
ms
P
ub
lic
Pri
va
te
Fo
reig
n
All
Fir
ms
P
ub
lic
Pri
va
te
Fo
reig
n
All
Fir
ms
P
ub
lic
Pri
va
te
Fo
reig
n
GD
P o
f p
art
ne
rs (
log
) 0
.38
3**
* 0
.32
0**
* 0
.33
1**
* 0
.47
4**
* 0
.36
8**
* 0
.28
9**
* 0
.29
8**
* 0
.44
0**
* 0
.83
5**
* 0
.79
1**
* 0
.65
9**
* 0
.83
8**
*
(0.0
66
) (0
.06
6)
(0.0
74
) (0
.06
8)
(0.0
68
) (0
.06
7)
(0.0
77
) (0
.07
1)
(0.0
88
) (0
.11
0)
(0.0
94
) (0
.08
4)
Dis
tance
(lo
g)
-0.9
95
***
-1.0
20
***
-0.7
30
***
-0.8
10
***
-0.8
95
***
-0.9
63
***
-0.6
48
***
-0.7
15
***
-1.7
33
***
-1.7
52
***
-2.1
28
***
-1.8
17
***
(0
.20
8)
(0.2
25
) (0
.20
4)
(0.2
12
) (0
.20
9)
(0.2
29
) (0
.21
6)
(0.2
06
) (0
.35
6)
(0.3
81
) (0
.34
5)
(0.3
53
)
Rem
ote
ne
ss (
log
) 0
.47
3**
0
.56
3**
1
.30
8**
* 0
.39
8*
0.5
17
**
0.5
72
**
1.5
01
***
0.5
67
**
-1.7
24
***
-1.5
46
***
-1.5
18
***
-1.3
93
***
(0
.23
9)
(0.2
55
) (0
.30
4)
(0.2
24
) (0
.24
0)
(0.2
58
) (0
.30
7)
(0.2
24
) (0
.33
7)
(0.3
73
) (0
.33
4)
(0.3
23
)
Isla
nd
co
untr
ies
-0.6
09
* -0
.62
9*
-1.1
10
**
-0.4
23
-0.6
84
* -0
.61
4
-1.1
77
**
-0.5
93
* 1
.05
0**
0
.77
2
0.0
39
0.7
27
(0
.34
5)
(0.3
74
) (0
.43
1)
(0.3
32
) (0
.35
3)
(0.3
79
) (0
.48
0)
(0.3
41
) (0
.49
1)
(0.5
87
) (0
.44
5)
(0.4
56
)
La
nd
locke
d c
ou
ntr
ies
-0.0
41
0.1
76
0.3
14
-0.2
92
-0.1
32
0.1
25
0.5
14
-0.2
79
-0.3
22
0.0
71
-1.1
76
**
-0.3
07
(0
.37
3)
(0.4
25
) (0
.53
5)
(0.4
04
) (0
.41
0)
(0.4
30
) (0
.44
5)
(0.4
03
) (0
.42
9)
(0.5
60
) (0
.58
9)
(0.4
58
)
RT
A p
art
ne
rs
0.3
45
0.3
14
0.1
28
0.5
67
0.4
41
0.3
46
0.0
57
0.5
64
0.6
29
0.2
38
0.4
22
0.5
44
(0
.61
4)
(0.7
07
) (0
.47
0)
(0.6
93
) (0
.61
5)
(0.7
20
) (0
.49
4)
(0.6
82
) (0
.99
9)
(1.3
02
) (0
.78
7)
(0.9
35
)
WT
O m
em
be
rsh
ip
0.0
58
0.0
17
-0.0
46
-0.0
19
-0.2
09
-0.1
74
-0.1
83
-0.0
29
1.1
37
**
1.1
34
**
1.4
99
***
1.2
47
***
(0
.36
8)
(0.4
60
) (0
.45
5)
(0.3
78
) (0
.37
2)
(0.5
00
) (0
.47
8)
(0.3
83
) (0
.47
3)
(0.5
38
) (0
.55
4)
(0.4
40
)
Hon
g K
ong
, C
hin
a
an
d T
aip
ei,C
hin
a
-0.2
53
-0.2
30
-0.3
90
-0.0
42
-0.2
00
-0.1
59
-0.4
15
-0.0
26
0.0
23
-1.3
98
-0.6
03
0.2
55
(0.5
04
) (0
.62
5)
(0.4
01
) (0
.61
7)
(0.5
34
) (0
.63
4)
(0.4
39
) (0
.59
0)
(0.9
09
) (1
.25
5)
(0.9
42
) (0
.77
6)
20
08
ye
ar
dum
my
1.3
23
***
1.2
81
***
2.4
46
***
1.1
34
***
1.4
14
***
1.3
33
***
2.5
65
***
1.3
16
***
1.2
12
***
1.0
06
**
2.2
11
***
0.8
92
**
(0
.26
2)
(0.3
00
) (0
.33
9)
(0.2
60
) (0
.27
1)
(0.3
09
) (0
.36
5)
(0.2
64
) (0
.38
3)
(0.4
19
) (0
.45
4)
(0.3
86
)
Con
sta
nt
8.0
36
**
8.6
54
**
-2.1
07
4.4
37
7.3
28
**
9.0
29
**
-3.5
19
2.9
07 1
8.7
72
***
17
.900
***
22
.401
***
16
.851
***
(3
.56
3)
(3.6
72
) (3
.65
1)
(3.4
60
) (3
.62
9)
(3.7
44
) (3
.69
0)
(3.4
93
) (5
.78
0)
(6.3
95
) (5
.50
7)
(5.4
33
)
Num
be
r o
f ob
se
rva
tio
ns
26
5
25
6
20
1
25
3
26
4
25
1
19
6
24
7
23
0
18
3
15
0
20
8
R2
0.2
63
0.1
94
0.2
89
0.2
99
0.2
36
0.1
74
0.3
17
0.2
77
0.5
36
0.4
55
0.5
42
0.5
60
Note
s: N
um
bers
show
n in
pare
nth
eses a
re r
obust sta
ndard
err
ors
. **
*, *
*, a
nd *
denote
1%
, 5%
, and 1
0%
le
vel of sig
nific
ance,
respectively
.
S
ourc
e: A
uth
or's c
om
pila
tio
n.
Different Types of Firms, Products, and Directions of Trade | 35

Note
s: N
um
bers
show
n in
pare
nth
eses a
re r
obust sta
ndard
err
ors
. **
*, *
*, a
nd *
denote
1%
, 5%
, and 1
0%
le
vel of sig
nific
ance,
respectively
.
S
ourc
e: A
uth
or's c
om
pila
tio
n.
Ta
ble
12
: D
ete
rmin
an
ts o
f T
ota
l V
alu
e o
f E
xp
ort
s—
Pa
rtia
l A
dju
stm
en
t M
od
el
Ite
m
All
Ma
nu
fac
ture
d G
oo
ds
Fin
al
Go
od
s
Pa
rts
an
d C
om
po
ne
nts
All
Fir
ms
P
ub
lic
Pri
va
te
Fo
reig
n
All
Fir
ms
P
ub
lic
Pri
va
te
Fo
reig
n
All
Fir
ms
P
ub
lic
Pri
va
te
Fo
reig
n
La
g d
ep
end
an
t va
ria
ble
-0
.42
9**
* -0
.51
6**
* -0
.66
4**
* -0
.51
9**
* -0
.42
7**
* -0
.52
2**
* -0
.66
3**
* -0
.48
2**
* -0
.61
2**
* -0
.57
5**
* -0
.79
7**
* -0
.66
9**
*
(0.0
59
) (0
.05
9)
(0.0
63
) (0
.06
0)
(0.0
58
) (0
.05
8)
(0.0
63
) (0
.06
0)
(0.0
61
) (0
.08
6)
(0.0
67
) (0
.07
6)
La
g G
DP
of p
art
ne
rs (
log
) 0
.30
7**
* 0
.33
7**
* 0
.42
5**
* 0
.43
5**
* 0
.30
2**
* 0
.34
0**
* 0
.41
7**
* 0
.39
4**
* 0
.54
2**
* 0
.44
0**
* 0
.54
3**
* 0
.80
0**
*
(0.0
64
) (0
.05
9)
(0.0
55
) (0
.07
8)
(0.0
62
) (0
.05
8)
(0.0
54
) (0
.07
5)
(0.0
83
) (0
.09
0)
(0.0
68
) (0
.12
2)
Dis
tance
(lo
g)
-0.4
11
***
-0.4
01
***
-0.6
04
***
-0.3
65
***
-0.4
13
***
-0.3
88
***
-0.6
08
***
-0.3
70
***
-0.6
64
***
-0.6
14
***
-0.5
36
***
-0.7
46
***
(0
.12
4)
(0.1
24
) (0
.21
1)
(0.1
23
) (0
.12
1)
(0.1
22
) (0
.21
3)
(0.1
24
) (0
.18
0)
(0.2
03
) (0
.14
5)
(0.1
98
)
La
g R
em
ote
ne
ss (
log
) 0
.13
5
0.4
32
***
0.3
82
**
-0.0
76
0.1
55
0.5
16
***
0.4
15
**
-0.0
83
-0.0
34
0.1
21
0.2
42
-0.1
97
(0
.12
8)
(0.1
53
) (0
.16
1)
(0.1
64
) (0
.12
7)
(0.1
64
) (0
.16
2)
(0.1
51
) (0
.20
3)
(0.1
93
) (0
.18
2)
(0.2
85
)
Isla
nd
co
untr
ies
-0.4
80
***
-0.6
33
***
-0.8
18
***
-0.3
60
**
-0.4
93
***
-0.6
39
***
-0.8
04
***
-0.4
59
***
-0.5
72
***
-0.8
96
***
-0.8
83
***
-0.4
18
(0
.14
9)
(0.2
00
) (0
.19
6)
(0.1
68
) (0
.14
9)
(0.2
06
) (0
.19
6)
(0.1
58
) (0
.20
0)
(0.2
31
) (0
.25
7)
(0.3
07
)
La
nd
locke
d c
ou
ntr
ies
0.2
31
0.1
47
-0.2
47
-0.0
69
0.2
07
0.0
92
-0.2
72
-0.0
57
0.0
04
0.1
57
-0.3
58
-0.2
66
(0
.21
4)
(0.2
02
) (0
.33
7)
(0.2
24
) (0
.20
8)
(0.2
09
) (0
.34
5)
(0.2
20
) (0
.27
9)
(0.2
85
) (0
.36
0)
(0.3
56
)
La
g W
TO
mem
be
rsh
ip
-0.0
31
-0.0
88
-0.1
41
-0.2
87
-0.0
62
-0.1
25
-0.1
64
-0.2
52
0.1
45
-0.1
04
-0.1
50
0.6
58
*
(0.1
68
) (0
.20
2)
(0.2
36
) (0
.23
3)
(0.1
66
) (0
.20
5)
(0.2
43
) (0
.23
3)
(0.2
03
) (0
.22
8)
(0.2
58
) (0
.39
9)
Hon
g K
ong
, C
hin
a
an
d T
aip
ei,C
hin
a
0.7
40
***
0.6
47
**
0.2
57
0.6
15
**
0.7
30
***
0.6
23
**
0.2
52
0.6
31
**
0.7
73
**
0.9
20
0.3
15
0.8
97
*
(0.2
44
) (0
.29
9)
(0.2
22
) (0
.29
7)
(0.2
37
) (0
.26
9)
(0.2
11
) (0
.26
8)
(0.3
81
) (0
.62
2)
(0.4
19
) (0
.52
8)
Δ G
DP
of
pa
rtne
rs (
log
) 0
.27
8**
* 0
.32
0**
* 0
.43
0**
* 0
.42
6**
* 0
.27
1**
* 0
.32
6**
* 0
.42
6**
* 0
.38
0**
* 0
.49
7**
* 0
.40
0**
* 0
.49
4**
* 0
.72
2**
*
(0.0
59
) (0
.05
4)
(0.0
53
) (0
.06
6)
(0.0
58
) (0
.05
3)
(0.0
53
) (0
.06
3)
(0.0
69
) (0
.07
2)
(0.0
64
) (0
.14
8)
Δ R
em
ote
ne
ss (
log
) -1
.83
4**
* -2
.08
8**
-1
.65
5*
-1.6
99
* -1
.86
0**
* -2
.15
0**
-1
.45
1
-1.8
63
**
-1.7
88
* -1
.81
4
-1.6
88
* -1
.58
4
(0
.70
0)
(0.9
15
) (0
.88
7)
(0.9
02
) (0
.70
4)
(0.9
45
) (0
.89
7)
(0.8
86
) (1
.03
9)
(1.1
64
) (0
.95
1)
(1.4
42
)
Δ R
TA
pa
rtn
ers
0
.03
2
0.0
53
-0.0
27
0.0
85
0.0
92
0.0
73
-0.0
53
0.1
39
-0.0
95
-0.1
25
0.2
91
**
-0.0
56
(0
.18
6)
(0.2
28
) (0
.23
0)
(0.1
84
) (0
.18
7)
(0.2
19
) (0
.23
3)
(0.1
92
) (0
.34
1)
(0.4
04
) (0
.14
8)
(0.3
38
)
Δ W
TO
mem
be
rsh
ip
-0.4
72
-0.2
45
-0.4
73
-0.2
04
-0.5
04
-0.2
03
-0.4
69
-0.3
12
-0.3
68
-0.6
13
-0.2
42
-0.7
15
**
(0
.41
7)
(0.3
40
) (0
.31
4)
(0.5
11
) (0
.41
1)
(0.3
30
) (0
.30
9)
(0.5
13
) (0
.38
5)
(0.4
49
) (0
.23
9)
(0.3
46
)
Con
sta
nt
5.6
23
***
2.9
37
7.4
23
***
5.4
96
***
5.5
53
***
2.0
93
7.2
99
***
5.9
60
***
5.6
54
**
4.9
05
* 5
.54
8**
1
.19
0
(1
.88
1)
(1.9
78
) (2
.34
1)
(2.0
06
) (1
.87
3)
(2.0
11
) (2
.35
0)
(1.9
92
) (2
.60
0)
(2.8
63
) (2
.37
7)
(3.5
93
)
Num
be
r o
f ob
se
rva
tio
ns
14
1
14
1
12
8
14
0
14
1
14
1
12
8
13
9
14
1
13
8
98
12
8
R2
0.5
34
0.5
90
0.6
42
0.6
47
0.5
33
0.5
93
0.6
34
0.6
02
0.5
99
0.5
09
0.7
99
0.5
69
36 | Working Paper Series on Regional Economic Integration No. 101

Ta
ble
13
: D
ete
rmin
an
ts o
f T
ota
l N
um
ber
of
Exp
ort
ed
Pro
du
cts
—P
art
ial
Ad
justm
en
t M
od
el
Ite
m
All
Ma
nu
fac
ture
d G
oo
ds
Fin
al
Go
od
s
Pa
rts
an
d C
om
po
ne
nts
All
Fir
ms
P
ub
lic
Pri
va
te
Fo
reig
n
All
Fir
ms
P
ub
lic
Pri
va
te
Fo
reig
n
All
Fir
ms
P
ub
lic
Pri
va
te
Fo
reig
n
La
g d
ep
end
an
t va
ria
ble
-0
.08
2
-0.1
40
-0.0
31
0.0
79
-0.1
16
-0.1
84
-0.0
63
0.1
61
0.0
65
-0.1
04
-0.3
07
**
0.0
78
(0
.16
9)
(0.1
12
) (0
.11
3)
(0.1
30
) (0
.17
2)
(0.1
21
) (0
.11
3)
(0.1
11
) (0
.12
5)
(0.1
11
) (0
.15
6)
(0.2
09
)
La
g G
DP
of p
art
ne
rs (
log
) -0
.25
9**
* -0
.12
7*
0.0
20
-0.0
92
-0.2
30
***
-0.1
01
0.0
32
-0.1
01
-0.5
02
***
-0.3
64
***
-0.0
39
-0.3
94
**
(0
.08
0)
(0.0
71
) (0
.07
7)
(0.1
11
) (0
.08
0)
(0.0
72
) (0
.07
5)
(0.1
02
) (0
.08
3)
(0.0
74
) (0
.07
7)
(0.1
56
)
Dis
tance
(lo
g)
0.3
22
* 0
.19
4
-0.1
15
0.3
39
**
0.2
12
0.1
35
-0.1
40
0.1
96
0.7
18
***
0.5
42
***
-0.1
20
0.7
58
***
(0
.17
3)
(0.1
49
) (0
.16
9)
(0.1
67
) (0
.17
2)
(0.1
51
) (0
.17
2)
(0.1
66
) (0
.20
6)
(0.1
81
) (0
.15
8)
(0.2
44
)
La
g R
em
ote
ne
ss (
log
) 0
.02
2
-0.0
20
-0.2
42
-0.1
75
-0.0
43
-0.0
27
-0.2
11
-0.2
90
0.1
00
-0.0
56
-0.3
64
0.3
76
(0
.19
8)
(0.1
83
) (0
.20
9)
(0.2
64
) (0
.19
3)
(0.1
83
) (0
.21
0)
(0.2
48
) (0
.26
9)
(0.2
22
) (0
.28
4)
(0.3
66
)
Isla
nd
co
untr
ies
0.1
09
0.1
01
-0.0
45
0.0
20
0.1
31
0.1
01
-0.0
56
-0.0
66
-0.0
40
-0.0
51
0.0
93
-0.3
61
(0
.20
0)
(0.1
82
) (0
.28
7)
(0.2
60
) (0
.19
7)
(0.1
85
) (0
.28
9)
(0.2
22
) (0
.26
6)
(0.2
34
) (0
.38
3)
(0.3
52
)
La
nd
locke
d c
ou
ntr
ies
0.0
04
-0.1
29
-0.5
52
* -0
.19
8
-0.0
53
-0.1
69
-0.6
20
**
-0.1
50
-0.0
19
-0.1
95
-0.1
53
-0.7
31
(0
.23
9)
(0.2
02
) (0
.31
1)
(0.2
95
) (0
.23
5)
(0.2
09
) (0
.30
5)
(0.2
49
) (0
.28
6)
(0.2
29
) (0
.43
8)
(0.4
84
)
La
g W
TO
mem
be
rsh
ip
0.1
91
0.0
90
0.0
21
0.0
57
0.1
66
0.0
24
-0.0
35
0.1
81
0.1
69
0.1
94
0.4
85
* 0
.20
1
(0
.26
2)
(0.2
20
) (0
.28
5)
(0.3
26
) (0
.26
1)
(0.2
25
) (0
.28
2)
(0.3
07
) (0
.24
5)
(0.2
36
) (0
.29
2)
(0.5
25
)
Hon
g K
ong
, C
hin
a
an
d T
aip
ei,C
hin
a
0.4
31
0.4
75
* -1
.14
3*
0.7
41
***
0.4
01
0.4
94
* -1
.16
6
0.6
54
**
0.3
61
0.0
88
-1.7
07
**
0.7
78
***
(0.3
54
) (0
.25
1)
(0.6
26
) (0
.22
9)
(0.3
71
) (0
.25
8)
(0.7
13
) (0
.27
5)
(0.3
48
) (0
.21
1)
(0.7
51
) (0
.25
6)
Δ G
DP
of
pa
rtne
rs (
log
) -0
.25
5**
* -0
.12
3
0.0
46
-0.0
94
-0.2
38
**
-0.1
00
0.0
62
-0.1
30
-0.4
57
***
-0.3
47
***
-0.0
54
-0.3
67
**
(0
.09
6)
(0.0
89
) (0
.07
8)
(0.1
20
) (0
.09
6)
(0.0
89
) (0
.07
7)
(0.1
15
) (0
.09
8)
(0.0
92
) (0
.07
4)
(0.1
73
)
Δ R
em
ote
ne
ss (
log
) -1
.62
3
-1.2
37
-0.3
30
-2.4
48
* -1
.32
2
-1.1
63
-0.0
48
-2.1
20
* -3
.49
9**
* -2
.59
1**
-1
.53
9
-5.2
03
***
(1
.11
3)
(0.9
12
) (1
.21
3)
(1.2
54
) (1
.12
3)
(0.9
33
) (1
.25
1)
(1.2
00
) (1
.31
5)
(1.0
61
) (1
.37
1)
(1.9
40
)
Δ R
TA
pa
rtn
ers
0
.34
5
0.3
90
**
0.5
28
* 0
.54
1*
0.4
71
* 0
.48
7**
* 0
.51
0*
0.6
09
**
-0.2
19
-0.1
72
0.3
92
-0.0
13
(0
.26
3)
(0.1
69
) (0
.28
5)
(0.2
95
) (0
.25
4)
(0.1
83
) (0
.30
2)
(0.2
51
) (0
.31
5)
(0.2
11
) (0
.28
8)
(0.3
80
)
Δ W
TO
mem
be
rsh
ip
0.1
05
-0.0
52
-0.3
49
0.4
85
* -0
.01
9
-0.0
99
-0.3
92
0.2
36
0.7
86
***
0.4
27
***
1.0
61
0.8
20
***
(0
.38
2)
(0.3
08
) (0
.33
6)
(0.2
95
) (0
.40
5)
(0.3
23
) (0
.36
3)
(0.3
68
) (0
.23
8)
(0.1
46
) (0
.87
0)
(0.2
37
)
Con
sta
nt
-1.4
38
-2.7
54
-0.6
71
-5.3
63
-0.5
00
-2.5
87
-1.0
06
-3.4
24
-2.2
46
-2.4
28
0.9
50
-8.0
15
(3
.19
9)
(2.8
46
) (3
.19
1)
(4.2
08
) (3
.16
9)
(2.8
56
) (3
.18
8)
(4.0
43
) (3
.86
9)
(3.3
93
) (3
.45
1)
(5.5
75
)
Num
be
r o
f ob
se
rva
tio
ns
14
1
14
1
12
8
14
0
14
1
14
1
12
8
13
9
14
1
13
8
98
12
8
R2
0.4
27
0.2
62
0.0
97
0.0
77
0.3
87
0.2
34
0.1
01
0.1
15
0.5
93
0.6
11
0.2
51
0.2
93
Note
s: N
um
bers
show
n in
pare
nth
eses a
re r
obust sta
ndard
err
ors
. **
*, *
*, a
nd *
denote
1%
, 5%
, and 1
0%
le
vel of sig
nific
ance,
respectively
.
S
ourc
e: A
uth
or's c
om
pila
tio
n.
Different Types of Firms, Products, and Directions of Trade | 37

Ta
ble
14
: D
ete
rmin
an
ts o
f A
vera
ge V
alu
e o
f E
xp
ort
s—
Pa
rtia
l A
dju
stm
en
t M
od
el
Ite
m
All
Ma
nu
fac
ture
d G
oo
ds
Fin
al
Go
od
s
Pa
rts
an
d C
om
po
ne
nts
All
Fir
ms
P
ub
lic
Pri
va
te
Fo
reig
n
All
Fir
ms
P
ub
lic
Pri
va
te
Fo
reig
n
All
Fir
ms
P
ub
lic
Pri
va
te
Fo
reig
n
La
g d
ep
end
an
t va
ria
ble
-0
.35
5**
* -0
.47
2**
* -0
.67
0**
* -0
.51
5**
* -0
.37
3**
* -0
.49
7**
* -0
.66
7**
* -0
.49
3**
* -0
.57
8**
* -0
.51
5**
* -0
.85
7**
* -0
.75
9**
*
(0.0
63
) (0
.06
5)
(0.0
95
) (0
.09
1)
(0.0
64
) (0
.06
5)
(0.0
92
) (0
.08
9)
(0.0
84
) (0
.09
4)
(0.0
85
) (0
.09
2)
La
g G
DP
of p
art
ne
rs (
log
) 0
.24
5**
* 0
.19
0**
* 0
.38
6**
* 0
.31
3**
* 0
.24
5**
* 0
.18
5**
* 0
.37
1**
* 0
.29
7**
* 0
.46
5**
* 0
.40
6**
* 0
.51
2**
* 0
.68
1**
*
(0.0
45
) (0
.04
1)
(0.0
43
) (0
.05
7)
(0.0
45
) (0
.04
2)
(0.0
43
) (0
.05
4)
(0.0
75
) (0
.06
6)
(0.0
53
) (0
.08
2)
Dis
tance
(lo
g)
-0.3
59
*** -0
.32
1**
* -0
.54
6**
* -0
.25
6**
-0
.37
8**
* -0
.31
2**
* -0
.53
1**
* -0
.27
4**
-0
.58
7**
* -0
.67
1**
* -0
.55
9**
* -0
.70
3**
*
(0.0
91
) (0
.09
1)
(0.1
50
) (0
.12
1)
(0.0
90
) (0
.09
3)
(0.1
50
) (0
.11
5)
(0.1
53
) (0
.16
9)
(0.1
32
) (0
.19
6)
La
g R
em
ote
ne
ss (
log
) 0
.17
4 0
.39
3**
* 0
.27
1**
-0
.02
4
0.1
72
0.4
79
***
0.2
94
**
-0.0
43
0.0
86
0.0
03
0.2
76
-0.1
44
(0
.11
4)
(0.1
33
) (0
.13
2)
(0.1
51
) (0
.11
3)
(0.1
47
) (0
.13
4)
(0.1
40
) (0
.19
0)
(0.1
66
) (0
.17
2)
(0.2
29
)
Isla
nd
co
untr
ies
-0.2
79
** -0
.33
3**
-0
.61
4**
* -0
.18
4
-0.2
94
**
-0.3
53
**
-0.5
98
***
-0.2
58
* -0
.39
6**
-0
.53
2**
* -0
.75
2**
* -0
.29
3
(0
.13
1)
(0.1
70
) (0
.16
8)
(0.1
53
) (0
.13
3)
(0.1
77
) (0
.16
9)
(0.1
46
) (0
.16
8)
(0.1
99
) (0
.21
9)
(0.2
63
)
La
nd
locke
d c
ou
ntr
ies
0.2
66
* 0
.21
5
-0.2
04
0.0
03
0.2
52
0.1
71
-0.1
88
0.0
22
0.0
09
0.0
52
-0.3
58
-0.0
54
(0
.16
1)
(0.1
53
) (0
.27
0)
(0.1
90
) (0
.15
8)
(0.1
65
) (0
.27
4)
(0.1
90
) (0
.23
0)
(0.2
20
) (0
.29
6)
(0.3
09
)
La
g W
TO
mem
be
rsh
ip
0.0
11
-0.0
47
-0.1
67
-0.1
79
-0.0
29
-0.1
00
-0.1
86
-0.1
44
0.1
77
0.0
90
-0.1
71
0.5
45
**
(0
.14
3)
(0.1
67
) (0
.19
7)
(0.2
20
) (0
.14
4)
(0.1
73
) (0
.20
1)
(0.2
21
) (0
.15
9)
(0.1
71
) (0
.19
3)
(0.2
57
)
Hon
g K
ong
, C
hin
a a
nd
T
aip
ei,C
hin
a
0.5
27
**
0.3
07
-0.0
68
0.3
61
0.4
93
**
0.2
50
-0.1
05
0.3
28
0.6
42
0.9
11
0.2
29
0.6
04
(0.2
26
) (0
.25
2)
(0.2
03
) (0
.27
0)
(0.2
09
) (0
.22
5)
(0.1
95
) (0
.22
6)
(0.4
13
) (0
.56
5)
(0.4
30
) (0
.48
9)
Δ G
DP
of
pa
rtne
rs (
log
) 0
.22
6**
* 0
.17
9**
* 0
.39
0**
* 0
.31
5**
* 0
.22
1**
* 0
.17
6**
* 0
.37
7**
* 0
.29
9**
* 0
.44
5**
* 0
.36
8**
* 0
.48
5**
* 0
.59
8**
*
(0.0
43
) (0
.03
8)
(0.0
36
) (0
.05
1)
(0.0
43
) (0
.03
9)
(0.0
36
) (0
.04
8)
(0.0
76
) (0
.05
8)
(0.0
58
) (0
.09
4)
Δ R
em
ote
ne
ss (
log
) -0
.91
9
-1.0
91
-0.4
10
-0.6
82
-0.8
84
-1.1
24
-0.2
47
-0.7
78
-1.1
15
-0.4
97
-1.3
01
-0.0
70
(0
.64
0)
(0.8
02
) (0
.75
6)
(0.8
52
) (0
.64
1)
(0.8
40
) (0
.76
2)
(0.8
17
) (0
.93
5)
(0.9
72
) (0
.88
9)
(1.1
06
)
Δ R
TA
pa
rtn
ers
0
.03
7
0.0
53
0.0
11
-0.0
23
0.0
99
0.0
65
-0.0
16
0.0
43
-0.1
54
-0.1
91
0.2
48
* -0
.19
7
(0
.15
4)
(0.1
59
) (0
.20
7)
(0.1
92
) (0
.16
2)
(0.1
58
) (0
.20
9)
(0.2
05
) (0
.31
9)
(0.3
77
) (0
.15
1)
(0.3
67
)
Δ W
TO
mem
be
rsh
ip
-0.3
82
-0.1
01
-0.3
53
-0.3
21
-0.4
13
-0.0
55
-0.3
38
-0.3
93
-0.3
40
-0.5
88
-0.2
29
-0.7
48
**
(0
.34
8)
(0.3
11
) (0
.26
5)
(0.2
90
) (0
.33
8)
(0.3
00
) (0
.26
5)
(0.2
78
) (0
.31
3)
(0.4
41
) (0
.23
6)
(0.3
53
)
Con
sta
nt
1.7
57
1.6
81
2.9
34
2.7
95
2.2
29
1.2
62
2.9
75
3.3
09
**
1.7
03
4.1
14
1.7
70
0.6
93
(1
.50
7)
(1.6
35
) (2
.18
4)
(1.8
27
) (1
.49
5)
(1.6
93
) (2
.16
9)
(1.6
85
) (2
.39
2)
(2.5
81
) (2
.24
1)
(2.8
12
)
Num
be
r o
f ob
se
rva
tio
ns
14
1
14
1
12
8
14
0
14
1
14
1
12
8
13
9
14
1
13
8
98
12
8
R2
0.3
79
0.4
22
0.6
38
0.4
29
0.4
01
0.4
57
0.6
20
0.4
29
0.4
33
0.3
78
0.7
73
0.5
95
Note
s: N
um
bers
show
n in
pare
nth
eses a
re r
obust sta
ndard
err
ors
. **
*, *
*, a
nd *
denote
1%
, 5%
, and 1
0%
le
vel of sig
nific
ance,
respectively
.
S
ourc
e: A
uth
or's c
om
pila
tio
n.
38 | Working Paper Series on Regional Economic Integration No. 101

Ta
ble
15
: D
ete
rmin
an
ts o
f T
ota
l V
alu
e o
f Im
po
rts
—P
art
ial
Ad
justm
en
t M
od
el
Ite
m
All
Ma
nu
fac
ture
d G
oo
ds
Fin
al
Go
od
s
Pa
rts
an
d C
om
po
ne
nts
All
Fir
ms
Pu
bli
c
Pri
vate
F
ore
ign
A
ll F
irm
s
Pu
bli
c
Pri
vate
F
ore
ign
A
ll F
irm
s
Pu
bli
c
Pri
vate
F
ore
ign
La
g d
ep
end
an
t va
ria
ble
-0
.54
5**
* -0
.64
5**
* -0
.70
4**
* -0
.55
1**
* -0
.60
7**
* -0
.66
0**
* -0
.81
2**
* -0
.57
0**
* -0
.46
1**
* -0
.36
9**
* -0
.56
1**
* -0
.43
6**
*
(0.0
76
) (0
.09
1)
(0.0
50
) (0
.08
4)
(0.0
75
) (0
.10
1)
(0.0
62
) (0
.08
8)
(0.0
57
) (0
.09
4)
(0.0
74
) (0
.10
4)
La
g G
DP
of p
art
ne
rs (
log
) 0
.63
2**
* 0
.72
5**
* 0
.57
8**
* 0
.86
0**
* 0
.69
4**
* 0
.72
7**
* 0
.71
0**
* 0
.93
4**
* 0
.79
4**
* 0
.68
6**
* 0
.70
1**
* 0
.75
5**
*
(0.1
30
) (0
.17
0)
(0.0
90
) (0
.15
6)
(0.1
24
) (0
.18
3)
(0.1
04
) (0
.16
1)
(0.1
43
) (0
.20
7)
(0.1
53
) (0
.22
5)
Dis
tance
(lo
g)
-0.6
69
**
-0.7
58
**
-0.6
16
***
-0.4
78
-0.7
73
***
-0.8
67
**
-0.8
64
***
-0.5
50
* -1
.07
3**
* -0
.21
6
-0.5
18
**
-1.0
40
**
(0
.27
0)
(0.3
25
) (0
.23
6)
(0.2
92
) (0
.26
1)
(0.3
41
) (0
.25
2)
(0.2
89
) (0
.32
6)
(0.4
77
) (0
.26
0)
(0.4
14
)
La
g R
em
ote
ne
ss (
log
) 0
.04
2
0.2
43
-0.4
16
* -0
.41
1
0.0
79
0.3
64
-0.0
99
-0.2
75
-1.3
82
***
-1.2
18
**
-1.0
96
* -1
.08
8*
(0
.30
1)
(0.3
05
) (0
.24
7)
(0.3
22
) (0
.32
8)
(0.3
26
) (0
.24
8)
(0.3
33
) (0
.42
1)
(0.4
90
) (0
.57
0)
(0.5
88
)
Isla
nd
co
untr
ies
-0.7
05
**
-0.8
14
**
0.0
59
0.1
31
-0.5
40
-0.6
33
-0.1
49
0.0
11
-0.0
66
-0.7
69
0.3
48
-0.2
92
(0
.35
2)
(0.3
95
) (0
.36
4)
(0.3
61
) (0
.43
7)
(0.4
61
) (0
.35
8)
(0.3
56
) (0
.50
3)
(0.7
59
) (0
.53
4)
(0.7
01
)
La
nd
locke
d c
ou
ntr
ies
0.1
84
1.0
71
**
-0.4
48
-0.0
75
0.1
70
0.9
50
**
-0.1
29
0.0
09
0.6
95
-0.4
27
0.4
59
0.7
03
(0
.40
9)
(0.4
34
) (0
.41
4)
(0.5
30
) (0
.41
1)
(0.4
47
) (0
.50
4)
(0.5
61
) (0
.51
6)
(0.6
71
) (0
.48
7)
(0.5
88
)
La
g W
TO
mem
be
rsh
ip
0.9
21
**
1.0
86
-0.2
97
0.5
17
0.8
90
* 1
.18
0
-0.3
72
0.4
37
0.4
68
0.0
11
-0.2
59
1.1
99
(0
.45
1)
(0.7
68
) (0
.26
7)
(0.4
71
) (0
.49
3)
(0.9
57
) (0
.30
2)
(0.5
20
) (0
.46
2)
(0.9
40
) (0
.49
0)
(0.8
80
)
Hon
g K
ong
, C
hin
a
an
d T
aip
ei,C
hin
a
0.8
31
**
0.8
01
**
-0.2
65
0.9
32
0.6
52
0.8
07
* -0
.65
5**
0
.69
7
1.5
50
-0.3
23 (
dro
pp
ed
) 1
.98
4
(0.4
21
) (0
.40
6)
(0.2
78
) (1
.01
1)
(0.4
25
) (0
.47
1)
(0.3
06
) (0
.97
4)
(1.7
94
) (3
.38
5)
(1
.79
0)
Δ G
DP
of
pa
rtne
rs (
log
) 0
.45
9**
* 0
.65
1**
* 0
.50
3**
* 0
.60
7**
* 0
.53
0**
* 0
.65
7**
* 0
.64
9**
* 0
.66
2**
* 0
.50
9**
* 0
.51
4**
* 0
.51
4**
* 0
.42
7**
(0.1
25
) (0
.15
5)
(0.0
91
) (0
.14
2)
(0.1
21
) (0
.16
5)
(0.0
96
) (0
.14
7)
(0.1
46
) (0
.17
6)
(0.1
56
) (0
.18
2)
Δ R
em
ote
ne
ss (
log
) 2
.52
5
1.3
66
2.4
31
* 3
.31
5
2.9
64
0.8
94
3.8
87
**
5.1
38
* 0
.45
4
-0.9
74
2.4
33
-0.4
31
(2
.19
5)
(2.3
26
) (1
.42
2)
(2.8
11
) (2
.36
6)
(2.7
08
) (1
.75
3)
(2.9
16
) (2
.90
4)
(3.0
52
) (2
.65
5)
(4.0
21
)
Δ R
TA
pa
rtn
ers
0
.00
8
0.1
26
0.7
33
* 0
.23
4
0.0
84
0.1
45
0.8
44
* 0
.29
3
0.6
82
0.9
48
1.1
38
* 0
.32
6
(0
.35
5)
(0.4
18
) (0
.40
5)
(0.4
30
) (0
.39
2)
(0.4
44
) (0
.49
8)
(0.4
56
) (0
.76
3)
(1.0
72
) (0
.60
0)
(0.7
33
)
Δ W
TO
mem
be
rsh
ip
-0.9
20
-1.1
10
* 0
.44
7**
-0
.69
3
-0.9
29
-1.0
31
0.6
65
***
-0.6
68
-1.7
32
* -2
.58
7*
-2.2
38
***
-2.0
65
**
(0
.56
7)
(0.6
48
) (0
.21
2)
(0.7
45
) (0
.59
0)
(0.6
62
) (0
.25
2)
(0.7
45
) (0
.93
1)
(1.5
57
) (0
.62
2)
(0.9
84
)
Con
sta
nt
1.1
54
-1.6
07
9.9
19
***
-2.4
96
1.3
18
-1.6
98
7.6
30
**
-4.4
49
9.6
75
* 1
.53
0
8.1
00
6.6
55
(4
.12
6)
(4.3
49
) (3
.07
1)
(5.3
01
) (4
.32
3)
(4.6
19
) (2
.99
1)
(5.7
10
) (5
.56
7)
(5.9
26
) (5
.29
8)
(6.1
64
)
Num
be
r o
f ob
se
rva
tio
ns
12
6
12
1
69
11
3
12
5
11
8
66
10
9
97
79
43
81
R2
0.5
16
0.5
84
0.8
48
0.4
60
0.5
28
0.5
41
0.8
72
0.4
54
0.4
91
0.3
78
0.7
47
0.3
80
Note
s: N
um
bers
show
n in
pare
nth
eses a
re r
obust sta
ndard
err
ors
. **
*, *
*, a
nd *
denote
1%
, 5%
, and 1
0%
le
vel of sig
nific
ance,
respectively
. S
ourc
e: A
uth
or's c
om
pila
tio
n.
Different Types of Firms, Products, and Directions of Trade | 39

Ta
ble
16
: D
ete
rmin
an
ts o
f T
ota
l N
um
ber
of
Imp
ort
ed
Pro
du
cts
—P
art
ial
Ad
justm
en
t M
od
el
Ite
m
All
Ma
nu
fac
ture
d G
oo
ds
Fin
al
Go
od
s
Pa
rts
an
d C
om
po
ne
nts
All
Fir
ms
P
ub
lic
Pri
va
te
Fo
reig
n
All
Fir
ms
P
ub
lic
Pri
va
te
Fo
reig
n
All
Fir
ms
P
ub
lic
Pri
va
te
Fo
reig
n
La
g d
ep
end
an
t va
ria
ble
-0
.10
9
-0.3
03
-0.0
84
-0.0
42
0.0
14
-0.2
85
-0.2
90
0.0
20
-1.0
77
***
-0.7
11
***
-0.8
48
***
-0.6
97
***
(0
.18
8)
(0.2
43
) (0
.26
6)
(0.1
55
) (0
.17
8)
(0.2
35
) (0
.31
0)
(0.1
53
) (0
.25
2)
(0.2
35
) (0
.23
3)
(0.2
43
)
La
g G
DP
of p
art
ne
rs (
log
) 0
.39
4*
0.6
81
***
0.3
57
0.4
53
**
0.3
40
* 0
.67
8**
* 0
.45
2
0.4
87
**
0.5
75
**
0.3
97
* 0
.63
7**
0
.35
2
(0
.20
6)
(0.2
46
) (0
.30
4)
(0.2
02
) (0
.20
1)
(0.2
36
) (0
.30
5)
(0.2
03
) (0
.24
3)
(0.2
29
) (0
.25
5)
(0.2
46
)
Dis
tance
(lo
g)
0.0
64
-0.3
47
-0.0
48
0.1
28
-0.0
21
-0.4
92
-0.4
26
0.0
22
0.3
98
0.7
28
* 0
.61
6
0.4
84
(0
.39
0)
(0.4
43
) (0
.56
7)
(0.3
50
) (0
.39
0)
(0.4
49
) (0
.61
5)
(0.3
59
) (0
.43
5)
(0.4
10
) (0
.60
6)
(0.3
90
)
La
g R
em
ote
ne
ss (
log
) -1
.60
8**
* -1
.66
3**
* -2
.94
9**
* -1
.65
9**
* -1
.48
1**
* -1
.46
1**
* -3
.09
0**
* -1
.70
6**
* -0
.86
0
-0.3
44
-0.0
07
-0.3
05
(0
.46
9)
(0.5
49
) (0
.68
2)
(0.4
00
) (0
.45
1)
(0.5
26
) (0
.70
3)
(0.3
73
) (0
.57
8)
(0.4
63
) (0
.60
7)
(0.5
06
)
Isla
nd
co
untr
ies
0.7
24
0.6
37
2.3
78
***
0.9
52
* 0
.80
0
0.5
68
2.5
39
***
1.1
42
**
-0.3
26
-0.5
67
1.0
65
* -0
.12
3
(0
.61
7)
(0.7
11
) (0
.83
5)
(0.5
39
) (0
.63
3)
(0.7
24
) (0
.81
1)
(0.5
48
) (0
.60
1)
(0.5
22
) (0
.55
2)
(0.5
93
)
La
nd
locke
d c
ou
ntr
ies
-0.4
34
0.1
29
-2.0
50
**
-0.3
90
-0.4
09
0.1
64
-1.9
61
* -0
.20
6
-0.4
30
-0.8
42
1.2
99
1.0
56
*
(0.4
71
) (0
.55
1)
(0.8
47
) (0
.40
5)
(0.4
98
) (0
.58
2)
(1.0
65
) (0
.41
4)
(0.7
33
) (0
.87
9)
(1.2
52
) (0
.58
0)
La
g W
TO
mem
be
rsh
ip
1.0
18
* 1
.24
5**
1
.32
2
1.0
54
* 1
.33
8**
1
.66
1**
1
.62
6*
0.9
98
* 0
.15
3
-0.0
72
-1.1
10
0.2
26
(0
.57
2)
(0.6
03
) (0
.87
7)
(0.5
62
) (0
.58
8)
(0.6
58
) (0
.94
3)
(0.5
37
) (0
.68
0)
(0.8
13
) (0
.98
4)
(0.8
07
)
Hon
g K
ong
, C
hin
a
an
d T
aip
ei,C
hin
a
1.2
51
1.1
89
3.9
91
***
1.5
46
1.0
75
0.9
96
4.2
44
***
1.3
46
1.8
98
***
1.6
28
***
(dro
pp
ed
) 2
.08
3
(0.8
93
) (1
.30
1)
(0.6
84
) (1
.21
5)
(0.8
99
) (1
.32
9)
(0.7
89
) (1
.19
6)
(0.5
47
) (0
.31
3)
(1
.84
8)
Δ G
DP
of
pa
rtne
rs (
log
) 0
.20
3
0.4
49
* 0
.16
1
0.3
12
* 0
.13
6
0.4
42
* 0
.23
0
0.3
09
* 0
.45
3*
0.3
39
0.8
74
***
0.3
14
(0
.17
2)
(0.2
46
) (0
.27
5)
(0.1
70
) (0
.17
6)
(0.2
44
) (0
.27
6)
(0.1
77
) (0
.24
2)
(0.2
38
) (0
.28
6)
(0.2
19
)
Δ R
em
ote
ne
ss (
log
) 1
.53
2
4.1
31
-3.5
09
0.3
63
1.9
70
4.8
16
-2.1
22
1.7
91
-4.0
45
-3.0
48
-2.7
04
-2.4
84
(3
.21
2)
(3.8
33
) (3
.45
8)
(2.5
65
) (3
.32
7)
(3.8
46
) (3
.46
3)
(2.6
48
) (3
.01
3)
(2.7
19
) (3
.56
3)
(3.1
77
)
Δ R
TA
pa
rtn
ers
-0
.29
5
-0.1
76
1.4
04
-0.5
78
-0.3
47
-0.2
11
0.4
98
-0.5
35
0.9
47
0.6
31
1.4
23
* 0
.15
9
(0
.63
0)
(0.8
93
) (0
.97
5)
(0.5
22
) (0
.65
5)
(0.9
08
) (0
.66
3)
(0.5
64
) (0
.65
0)
(0.4
38
) (0
.77
1)
(0.7
26
)
Δ W
TO
mem
be
rsh
ip
0.3
06
-0.5
86
-2.6
98
***
-0.3
11
0.0
83
-0.7
69
-3.3
04
***
-0.3
01
-0.4
37
-0.0
36
-2.7
62
***
-2.5
22
**
(1
.34
7)
(1.8
13
) (0
.57
2)
(0.9
27
) (1
.41
3)
(1.8
65
) (0
.71
3)
(1.0
76
) (0
.43
3)
(0.4
89
) (0
.57
2)
(1.1
31
)
Con
sta
nt
-4.1
85
-6.8
50
9.9
43
-6.2
25
-4.1
86
-7.9
14
12
.297
-6.0
30
-13
.981
* -1
8.0
13
*** -2
3.8
29
***
-15
.881
**
(5
.04
7)
(6.0
15
) (8
.18
2)
(4.6
04
) (5
.15
5)
(6.1
94
) (9
.05
1)
(4.7
09
) (7
.80
1)
(6.5
04
) (9
.17
3)
(6.8
38
)
Num
be
r o
f ob
se
rva
tio
ns
12
5
12
1
69
11
3
12
4
11
8
66
10
9
96
79
43
81
R2
0.2
53
0.2
55
0.4
65
0.4
08
0.2
78
0.2
58
0.4
46
0.4
67
0.4
35
0.4
07
0.4
89
0.3
62
Ta
ble
17
: D
ete
rmin
an
ts o
f A
vera
ge V
alu
e o
f Im
po
rts
—P
art
ial
Ad
justm
en
t M
od
el
Note
s: N
um
bers
show
n in
pare
nth
eses a
re r
obust sta
ndard
err
ors
. **
*, *
*, a
nd *
denote
1%
, 5%
, and 1
0%
le
vel of sig
nific
ance,
respectively
. S
ourc
e: A
uth
or's c
om
pila
tio
n.
40 | Working Paper Series on Regional Economic Integration No. 101

Ite
m
All
Ma
nu
fac
ture
d G
oo
ds
Fin
al
Go
od
s
Pa
rts
an
d C
om
po
ne
nts
All
Fir
ms
P
ub
lic
Pri
va
te
Fo
reig
n A
ll F
irm
s
Pu
bli
c
Pri
va
te
Fo
reig
n A
ll F
irm
s
Pu
bli
c
Pri
va
te
Fo
reig
n
La
g d
ep
end
an
t va
ria
ble
-0
.53
3**
* -0
.66
2**
* -0
.67
2**
* -0
.59
3**
* -0
.63
9**
* -0
.69
6**
* -0
.81
5**
* -0
.63
6**
* -0
.47
6**
* -0
.43
3**
* -0
.49
8**
* -0
.53
9**
*
(0.1
01
) (0
.09
5)
(0.0
93
) (0
.12
1)
(0.1
00
) (0
.09
4)
(0.0
97
) (0
.12
3)
(0.0
62
) (0
.10
1)
(0.1
05
) (0
.10
4)
La
g G
DP
of p
art
ne
rs (
log
) 0
.33
9**
* 0
.26
7**
0
.10
0
0.5
30
***
0.3
56
***
0.2
67
**
0.1
74
0.5
52
***
0.5
85
***
0.6
03
***
0.5
47
***
0.6
55
***
(0
.09
6)
(0.1
07
) (0
.11
7)
(0.1
00
) (0
.09
6)
(0.1
14
) (0
.12
3)
(0.1
01
) (0
.09
3)
(0.1
30
) (0
.13
0)
(0.1
27
)
Dis
tance
(lo
g)
-0.3
91
* -0
.36
0
-0.4
08
* -0
.25
1
-0.4
03
* -0
.40
5
-0.5
17
**
-0.2
50
-1.0
09
***
-0.1
86
-0.4
76
**
-1.0
98
***
(0
.23
1)
(0.2
62
) (0
.24
4)
(0.2
46
) (0
.23
0)
(0.2
68
) (0
.24
7)
(0.2
39
) (0
.30
1)
(0.3
74
) (0
.22
2)
(0.3
63
)
La
g R
em
ote
ne
ss (
log
) 0
.61
3**
0
.78
9**
0
.30
8
0.2
88
0.6
75
**
0.7
80
**
0.6
75
**
0.4
03
-0.7
64
**
-0.7
34
**
-0.8
17
* -0
.45
6
(0
.30
3)
(0.3
09
) (0
.33
9)
(0.3
01
) (0
.32
2)
(0.3
33
) (0
.32
3)
(0.3
17
) (0
.30
0)
(0.3
72
) (0
.42
6)
(0.4
23
)
Isla
nd
co
untr
ies
-0.8
01
**
-0.8
61
**
-0.2
62
-0.0
39
-0.6
74
-0.7
10
-0.6
20
-0.1
73
-0.0
28
-0.5
35
0.6
61
-0.2
73
(0
.36
3)
(0.3
77
) (0
.44
5)
(0.3
68
) (0
.43
6)
(0.4
38
) (0
.43
3)
(0.3
82
) (0
.39
0)
(0.5
67
) (0
.44
4)
(0.5
51
)
La
nd
locke
d c
ou
ntr
ies
0.6
60
1.3
77
***
-0.2
53
0.4
47
0.6
55
* 1
.21
8**
* 0
.08
8
0.4
71
1.0
82
**
0.0
66
0.2
90
1.0
67
*
(0.4
13
) (0
.44
7)
(0.4
99
) (0
.49
7)
(0.3
93
) (0
.46
5)
(0.5
37
) (0
.51
3)
(0.5
00
) (0
.50
0)
(0.4
81
) (0
.57
6)
La
g W
TO
mem
be
rsh
ip
0.7
31
* 0
.68
7
-0.5
18
0.2
66
0.5
31
0.6
45
-0.6
78
0.1
34
0.3
06
-0.4
71
-0.1
64
1.1
93
*
(0.4
44
) (0
.74
2)
(0.3
89
) (0
.48
7)
(0.4
67
) (0
.85
5)
(0.4
59
) (0
.50
7)
(0.3
90
) (0
.76
0)
(0.4
39
) (0
.68
7)
Hon
g K
ong
, C
hin
a
an
d T
aip
ei,C
hin
a
0.3
52
0.3
46
-1.5
57
***
0.1
58
0.1
16
0.2
44
-2.1
09
***
-0.1
15
1.0
04
-0.6
63 (
dro
pp
ed
) 0
.92
0
(0.4
43
) (0
.82
6)
(0.3
54
) (0
.59
4)
(0.4
92
) (0
.89
6)
(0.3
65
) (0
.53
6)
(1.6
15
) (2
.98
5)
(1
.70
0)
Δ G
DP
of
pa
rtne
rs (
log
) 0
.22
1**
0
.25
6**
0
.12
8
0.3
43
***
0.2
50
**
0.2
54
**
0.1
99
**
0.3
60
***
0.4
22
***
0.4
91
***
0.4
24
***
0.4
36
***
(0
.10
0)
(0.1
05
) (0
.10
3)
(0.0
97
) (0
.09
9)
(0.1
06
) (0
.09
8)
(0.1
00
) (0
.09
7)
(0.1
25
) (0
.14
2)
(0.1
16
)
Δ R
em
ote
ne
ss (
log
) 3
.25
0*
2.2
01
0.9
82
4.2
39
* 3
.75
9*
2.3
11
2.4
90
5.7
74
**
1.3
87
-0.3
99
1.5
83
1.3
95
(1
.94
2)
(2.0
21
) (1
.90
7)
(2.3
47
) (2
.13
5)
(2.2
24
) (2
.03
6)
(2.4
12
) (2
.07
2)
(2.5
22
) (2
.56
3)
(2.9
05
)
Δ R
TA
pa
rtn
ers
-0
.18
8
0.0
72
0.1
07
0.1
61
-0.0
46
0.1
36
0.2
31
0.2
44
0.0
99
0.8
21
1.1
32
**
0.0
59
(0
.34
9)
(0.4
49
) (0
.45
7)
(0.3
95
) (0
.39
8)
(0.4
87
) (0
.53
7)
(0.4
22
) (0
.76
0)
(0.9
80
) (0
.48
8)
(0.6
37
)
Δ W
TO
mem
be
rsh
ip
-0.8
88
-0.9
42
0.5
32
-0.2
16
-0.8
31
-0.8
07
0.9
74
**
-0.1
17
-1.6
49
* -2
.01
6
-2.0
61
***
-1.8
18
*
(0
.80
1)
(1.1
63
) (0
.39
4)
(0.7
88
) (0
.90
8)
(1.2
25
) (0
.43
2)
(0.7
59
) (0
.86
4)
(1.3
15
) (0
.38
9)
(0.9
54
)
Con
sta
nt
-2.4
88
-1.2
06
8.9
02
**
-4.9
32
-1.6
74
-0.2
26
6.7
25
* -5
.64
3
7.0
49
* -1
.33
4
4.5
94
3.3
21
(3
.97
5)
(4.1
57
) (3
.97
9)
(4.8
35
) (4
.22
9)
(4.4
02
) (3
.43
6)
(5.1
03
) (4
.27
5)
(4.8
36
) (4
.55
6)
(4.8
39
)
Num
be
r o
f ob
se
rva
tio
ns
12
5
12
1
69
11
3
12
4
11
8
66
10
9
96
79
43
81
R2
0.4
08
0.5
05
0.6
77
0.4
10
0.4
62
0.4
98
0.7
54
0.4
38
0.4
76
0.4
00
0.6
81
0.4
31
Note
s: N
um
bers
show
n in
pare
nth
eses a
re r
obust sta
ndard
err
ors
. **
*, *
*, a
nd *
denote
1%
, 5%
, and 1
0%
le
vel of sig
nific
ance,
respectively
. S
ourc
e: A
uth
or's c
om
pila
tio
n.
Different Types of Firms, Products, and Directions of Trade | 41
Tabl
e 17
: Det
erm
inan
ts o
f Ave
rage
Val
ue o
f Im
port
s: P
artia
l Adj
ustm
ent M
odel

Ta
ble
18
: E
lasti
cit
ies o
f P
art
ner
Ec
on
om
ies' G
DP
on
"G
oo
ds"
Ex
ten
siv
e M
arg
in a
nd
In
ten
siv
e M
arg
in
of
the P
eo
ple
’s R
ep
ub
lic
of
Ch
ina
’s T
rad
e
Ite
m
Ex
po
rts
Imp
ort
s
Pu
bli
c
Pri
va
te
Fo
reig
n
Pu
bli
c
Pri
va
te
Fo
reig
n
Pu
bli
c
Pri
va
te
Fo
reig
n
Pu
bli
c
Pri
va
te
Fo
reig
n
Fin
al
Go
od
s
Inte
rme
dia
te G
oo
ds
Fin
al
Go
od
s
Inte
rme
dia
te G
oo
ds
Bas
ic M
od
el (d
ep
en
de
nt
va
ria
ble
: lo
g o
f ex
po
rts [
imp
ort
s])
T
ota
l va
lue
-1.1
44
***
-1.1
41
***
-1.1
25
***
-1.2
80
***
-1.0
85
***
-1.6
77
***
-2.3
10
***
-1.8
59
***
-1.9
23
***
-2.7
19
***
-3.1
40
***
-2.6
47
***
E
xte
nsiv
e m
arg
in
-0.4
64
***
-0.6
22
***
-0.5
41
***
-0.3
18
***
-0.5
15
***
-0.5
39
***
-1.3
47
***
-1.2
11
***
-1.2
16
***
-0.9
67
***
-1.0
11
***
-0.8
30
***
In
tensiv
e m
arg
in
-0.6
81
***
-0.5
19
***
-0.5
84
***
-0.9
61
***
-0.5
70
***
-1.1
37
***
-0.9
63
***
-0.6
48
***
-0.7
15
***
-1.7
52
***
-2.1
28
***
-1.8
17
***
Pa
rtia
l-a
dju
stm
en
t M
od
el
(de
pe
nd
en
t va
ria
ble
: fi
rst
dif
fere
nc
e o
f lo
g o
f e
xp
ort
s [
imp
ort
s])
T
ota
l va
lue
-0.3
88
***
-0.6
08
***
-0.3
70
***
-0.6
14
***
-0.5
36
***
-0.7
46
***
-0.8
67
**
-0.8
64
***
-0.5
50
* -0
.21
6
-0.5
18
**
-1.0
40
**
E
xte
nsiv
e m
arg
in
0.1
35
-0.1
40
0.1
96
0.5
42
***
-0.1
20
0.7
58
***
-0.4
92
-0.4
26
0.0
22
0.7
28
* 0
.61
6
0.4
84
In
tensiv
e m
arg
in
-0.3
12
***
-0.5
31
***
-0.2
74
**
-0.6
71
***
-0.5
59
***
-0.7
03
***
-0.4
05
-0.5
17
**
-0.2
50
-0.1
86
-0.4
76
**
-1.0
98
***
Note
s: S
how
n in
pare
nth
eses a
re r
obust sta
ndard
err
ors
. **
*, *
*, a
nd *
denote
1%
, 5%
, and 1
0%
le
vel of sig
nific
ance,
respecti
vely
. S
ourc
e: A
uth
or's c
om
pila
tio
n.
42 | Working Paper Series on Regional Economic Integration No. 101

Ta
ble
19
: E
lasti
cit
ies o
f D
ista
nce o
n "
Go
od
s"
Ex
ten
siv
e M
arg
in a
nd
In
ten
siv
e M
arg
in
of
the P
eo
ple
’s R
ep
ub
lic
of
Ch
ina
’s T
rad
e
Ite
m
Ex
po
rts
Imp
ort
s
Pu
bli
c
Pri
va
te
Fo
reig
n
Pu
bli
c
Pri
va
te
Fo
reig
n
Pu
bli
c
Pri
va
te
Fo
reig
n
Pu
bli
c
Pri
va
te
Fo
reig
n
Fin
al
Go
od
s
Inte
rme
dia
te G
oo
ds
Fin
al
Go
od
s
Inte
rme
dia
te G
oo
ds
Bas
ic M
od
el (d
ep
en
de
nt
va
ria
ble
: lo
g o
f ex
po
rts [
imp
ort
s])
T
ota
l va
lue
0.6
14
***
0.6
15
***
0.7
89
***
0.7
17
***
0.7
11
***
1.0
46
***
0.9
41
***
0.8
59
***
1.0
89
***
1.3
86
***
1.1
53
***
1.4
01
***
E
xte
nsiv
e m
arg
in
0.2
67
***
0.3
03
***
0.4
13
***
0.2
06
***
0.2
70
***
0.4
24
***
0.6
51
***
0.5
60
***
0.6
50
***
0.5
95
***
0.4
94
***
0.5
63
***
In
tensiv
e m
arg
in
0.3
47
***
0.3
11
***
0.3
76
***
0.5
10
***
0.4
41
***
0.6
23
***
0.2
89
***
0.2
98
***
0.4
40
***
0.7
91
***
0.6
59
***
0.8
38
***
Pa
rtia
l-a
dju
stm
en
t M
od
el
(de
pe
nd
en
t va
ria
ble
: fi
rst
dif
fere
nc
e o
f lo
g o
f e
xp
ort
s [
imp
ort
s])
T
ota
l va
lue
(l
og
of
GD
P)
0.3
40
***
0.4
17
***
0.3
94
***
0.4
40
***
0.5
43
***
0.8
00
***
0.7
27
***
0.7
10
***
0.9
34
***
0.6
86
***
0.7
01
***
0.7
55
***
T
ota
l va
lue
(d
iffe
rence
of
lo
g o
f G
DP
)
0.3
26
***
0.4
26
***
0.3
80
***
0.4
00
***
0.4
94
***
0.7
22
***
0.6
57
***
0.6
49
***
0.6
62
***
0.5
14
***
0.5
14
***
0.4
27
**
E
xte
nsiv
e m
arg
in
(l
og
of
GD
P)
-0.1
01
0.0
32
-0.1
01
-0
.36
4**
* -0
.03
9
-0.3
94
**
0.6
78
***
0.4
52
0.4
87
**
0.3
97
* 0
.63
7**
0
.35
2
E
xte
nsiv
e m
arg
in
(d
iffe
rence
of
log
o
f G
DP
)
-0.1
00
0.0
62
-0.1
30
-0
.34
7**
* -0
.05
4
-0.3
67
**
0.4
42
* 0
.23
0
0.3
09
* 0
.33
9
0.8
74
***
0.3
14
In
tensiv
e m
arg
in
(l
og
of
GD
P)
0.1
85
***
0.3
71
***
0.2
97
***
0.4
06
***
0.5
12
***
0.6
81
***
0.2
67
**
0.1
74
0.5
52
***
0.6
03
***
0.5
47
***
0.6
55
***
In
tensiv
e m
arg
in
(d
iffe
rence
of
log
o
f G
DP
)
0.1
76
***
0.3
77
***
0.2
99
***
0.3
68
***
0.4
85
***
0.5
98
***
0.2
54
**
0.1
99
**
0.3
60
***
0.4
91
***
0.4
24
***
0.4
36
***
Note
s: S
how
n in
pare
nth
eses a
re r
obust sta
ndard
err
ors
. **
*, *
*, a
nd *
denote
1%
, 5%
, an
d 1
0%
le
vel of sig
nific
ance,
respectively
. S
ourc
e: A
uth
or's c
om
pila
tio
n.
Different Types of Firms, Products, and Directions of Trade | 43

44 | Working Paper Series on Regional Economic Integration No. 101
ADB Working Paper Series on Regional Economic Integration*
1. ―The ASEAN Economic Community and the European Experience‖ by
Michael G. Plummer
2. ―Economic Integration in East Asia: Trends, Prospects, and a Possible Roadmap‖ by Pradumna B. Rana
3. ―Central Asia after Fifteen Years of Transition: Growth, Regional Cooperation, and Policy Choices‖ by Malcolm Dowling and Ganeshan Wignaraja
4. ―Global Imbalances and the Asian Economies: Implications for Regional Cooperation‖ by Barry Eichengreen
5. ―Toward Win-Win Regionalism in Asia: Issues and Challenges in Forming Efficient Trade Agreements‖ by Michael G. Plummer
6. ―Liberalizing Cross-Border Capital Flows: How Effective Are Institutional Arrangements against Crisis in Southeast Asia‖ by Alfred Steinherr, Alessandro Cisotta, Erik Klär, and Kenan Šehović
7. ―Managing the Noodle Bowl: The Fragility of East Asian Regionalism‖ by Richard E. Baldwin
8. ―Measuring Regional Market Integration in Developing Asia: a Dynamic Factor Error Correction Model (DF-ECM) Approach‖ by Duo Qin, Marie Anne Cagas, Geoffrey Ducanes, Nedelyn Magtibay-Ramos, and Pilipinas F. Quising
9. ―The Post-Crisis Sequencing of Economic Integration in Asia: Trade as a Complement to a Monetary Future‖ by Michael G. Plummer and Ganeshan Wignaraja
10. ―Trade Intensity and Business Cycle Synchronization: The Case of East Asia‖ by Pradumna B. Rana
11. ―Inequality and Growth Revisited‖ by Robert J. Barro
12. ―Securitization in East Asia‖ by Paul Lejot, Douglas Arner, and Lotte Schou-Zibell
13. ―Patterns and Determinants of Cross-border Financial Asset Holdings in East Asia‖ by Jong-Wha Lee
14. ―Regionalism as an Engine of Multilateralism: A Case for a Single East Asian FTA‖ by Masahiro Kawai and Ganeshan Wignaraja

Different Types of Firms, Products, and Directions of Trade | 45
15. ―The Impact of Capital Inflows on Emerging East Asian Economies: Is Too Much Money Chasing Too Little Good?‖ by Soyoung Kim and Doo Yong Yang
16. ―Emerging East Asian Banking Systems Ten Years after the 1997/98 Crisis‖ by Charles Adams
17. ―Real and Financial Integration in East Asia‖ by Soyoung Kim and Jong-Wha Lee
18. ―Global Financial Turmoil: Impact and Challenges for Asia’s Financial Systems‖ by Jong-Wha Lee and Cyn-Young Park
19. ―Cambodia’s Persistent Dollarization: Causes and Policy Options‖ by Jayant Menon
20. ―Welfare Implications of International Financial Integration‖ by Jong-Wha Lee and Kwanho Shin
21. ―Is the ASEAN-Korea Free Trade Area (AKFTA) an Optimal Free Trade Area?‖ by Donghyun Park, Innwon Park, and Gemma Esther B. Estrada
22. ―India’s Bond Market—Developments and Challenges Ahead‖ by Stephen Wells and Lotte Schou- Zibell
23. ―Commodity Prices and Monetary Policy in Emerging East Asia‖ by Hsiao Chink Tang
24. ―Does Trade Integration Contribute to Peace?‖ by Jong-Wha Lee and Ju Hyun Pyun
25. ―Aging in Asia: Trends, Impacts, and Responses‖ by Jayant Menon and Anna Melendez-Nakamura
26. ―Re-considering Asian Financial Regionalism in the 1990s‖ by Shintaro Hamanaka
27. ―Managing Success in Viet Nam: Macroeconomic Consequences of Large Capital Inflows with Limited Policy Tools‖ by Jayant Menon
28. ―The Building Block versus Stumbling Block Debate of Regionalism: From the Perspective of Service Trade Liberalization in Asia‖ by Shintaro Hamanaka
29. ―East Asian and European Economic Integration: A Comparative Analysis‖ by Giovanni Capannelli and Carlo Filippini
30. ―Promoting Trade and Investment in India’s Northeastern Region‖ by M. Govinda Rao

46 | Working Paper Series on Regional Economic Integration No. 101
31. ―Emerging Asia: Decoupling or Recoupling‖ by Soyoung Kim, Jong-Wha Lee, and Cyn-Young Park
32. ―India’s Role in South Asia Trade and Investment Integration‖ by Rajiv Kumar and Manjeeta Singh
33. ―Developing Indicators for Regional Economic Integration and Cooperation‖ by Giovanni Capannelli, Jong-Wha Lee, and Peter Petri
34. ―Beyond the Crisis: Financial Regulatory Reform in Emerging Asia‖ by Chee Sung Lee and Cyn-Young Park
35. ―Regional Economic Impacts of Cross-Border Infrastructure: A General Equilibrium Application to Thailand and Lao People’s Democratic Republic‖ by Peter Warr, Jayant Menon, and Arief Anshory Yusuf
36. ―Exchange Rate Regimes in the Asia-Pacific Region and the Global Financial Crisis‖ by Warwick J. McKibbin and Waranya Pim Chanthapun
37. ―Roads for Asian Integration: Measuring ADB's Contribution to the Asian Highway Network‖ by Srinivasa Madhur, Ganeshan Wignaraja, and Peter Darjes
38. ―The Financial Crisis and Money Markets in Emerging Asia‖ by Robert Rigg and Lotte Schou-Zibell
39. ―Complements or Substitutes? Preferential and Multilateral Trade Liberalization at the Sectoral Level‖ by Mitsuyo Ando, Antoni Estevadeordal, and Christian Volpe Martincus
40. ―Regulatory Reforms for Improving the Business Environment in Selected Asian Economies—How Monitoring and Comparative Benchmarking can Provide Incentive for Reform‖ by Lotte Schou-Zibell and Srinivasa Madhur
41. ―Global Production Sharing, Trade Patterns, and Determinants of Trade Flows in East Asia‖ by Prema-chandra Athukorala and Jayant Menon
42. ―Regionalism Cycle in Asia (-Pacific): A Game Theory Approach to the Rise and Fall of Asian Regional Institutions‖ by Shintaro Hamanaka
43. ―A Macroprudential Framework for Monitoring and Examining Financial Soundness‖ by Lotte Schou-Zibell, Jose Ramon Albert, and Lei Lei Song
44. ―A Macroprudential Framework for the Early Detection of Banking Problems in Emerging Economies‖ by Claudio Loser, Miguel Kiguel, and David Mermelstein

Different Types of Firms, Products, and Directions of Trade | 47
45. ―The 2008 Financial Crisis and Potential Output in Asia: Impact and Policy Implications‖ by Cyn-Young Park, Ruperto Majuca, and Josef Yap
46. ―Do Hub-and-Spoke Free Trade Agreements Increase Trade? A Panel Data Analysis‖ by Jung Hur, Joseph Alba, and Donghyun Park
47. ―Does a Leapfrogging Growth Strategy Raise Growth Rate? Some International Evidence‖ by Zhi Wang, Shang-Jin Wei, and Anna Wong
48. ―Crises in Asia: Recovery and Policy Responses‖ by Kiseok Hong and Hsiao Chink Tang
49. ―A New Multi-Dimensional Framework for Analyzing Regional Integration: Regional Integration Evaluation (RIE) Methodology‖ by Donghyun Park and Mario Arturo Ruiz Estrada
50. ―Regional Surveillance for East Asia: How Can It Be Designed to Complement Global Surveillance?‖ by Shinji Takagi
51. ―Poverty Impacts of Government Expenditure from Natural Resource Revenues‖ by Peter Warr, Jayant Menon, and Arief Anshory Yusuf
52. ―Methods for Ex Ante Economic Evaluation of Free Trade Agreements‖ by David Cheong
53. ―The Role of Membership Rules in Regional Organizations‖ by Judith Kelley
54. ―The Political Economy of Regional Cooperation in South Asia‖ by V.V. Desai
55. ―Trade Facilitation Measures under Free Trade Agreements: Are They Discriminatory against Non-Members?‖ by Shintaro Hamanaka, Aiken Tafgar, and Dorothea Lazaro
56. ―Production Networks and Trade Patterns in East Asia: Regionalization or Globalization?‖ by Prema-chandra Athukorala
57. ―Global Financial Regulatory Reforms: Implications for Developing Asia‖ by Douglas W. Arner and Cyn-Young Park
58. ―Asia’s Contribution to Global Rebalancing‖ by Charles Adams, Hoe Yun Jeong, and Cyn-Young Park
59. ―Methods for Ex Post Economic Evaluation of Free Trade Agreements‖ by David Cheong
60. ―Responding to the Global Financial and Economic Crisis: Meeting the Challenges in Asia‖ by Douglas W. Arner and Lotte Schou-Zibell

48 | Working Paper Series on Regional Economic Integration No. 101
61. ―Shaping New Regionalism in the Pacific Islands: Back to the Future?‖ by Satish Chand
62. ―Organizing the Wider East Asia Region‖ by Christopher M. Dent
63. ―Labour and Grassroots Civic Interests In Regional Institutions‖ by Helen E.S. Nesadurai
64. ―Institutional Design of Regional Integration: Balancing Delegation and Representation‖ by Simon Hix
65. ―Regional Judicial Institutions and Economic Cooperation: Lessons for Asia?‖ by Erik Voeten
66. ―The Awakening Chinese Economy: Macro and Terms of. Trade Impacts on 10 Major Asia-Pacific Countries‖ by Yin Hua Mai, Philip Adams, Peter Dixon, and Jayant Menon
67. ―Institutional Parameters of a Region-Wide Economic Agreement in Asia: Examination of Trans-Pacific Partnership and ASEAN+α Free Trade Agreement Approaches‖ by Shintaro Hamanaka
68. ―Evolving Asian Power Balances and Alternate Conceptions for Building Regional Institutions‖ by Yong Wang
69. ―ASEAN Economic Integration: Features, Fulfillments, Failures, and the Future‖ by Hal Hill and Jayant Menon
70. ―Changing Impact of Fiscal Policy on Selected ASEAN Countries‖ by Hsiao Chink Tang, Philip Liu, and Eddie C. Cheung
71. ―The Organizational Architecture of the Asia-Pacific: Insights from the New Institutionalism‖ by Stephan Haggard
72. ―The Impact of Monetary Policy on Financial Markets in Small Open Economies: More or Less Effective During the Global Financial Crisis?‖ by Steven Pennings, Arief Ramayandi, and Hsiao Chink Tang
73. ―What do Asian Countries Want the Seat at the High Table for? G20 as a New Global Economic Governance Forum and the Role of Asia‖ by Yoon Je Cho
74. ―Asia’s Strategic Participation in the Group of 20 for Global Economic Governance Reform: From the Perspective of International Trade‖ by Taeho Bark and Moonsung Kang
75. ―ASEAN’s Free Trade Agreements with the People’s Republic of China, Japan, and the Republic of Korea: A Qualitative and Quantitative

Different Types of Firms, Products, and Directions of Trade | 49
Analysis‖ by Gemma Estrada, Donghyun Park, Innwon Park, and Soonchan Park
76. ―ASEAN-5 Macroeconomic Forecasting Using a GVAR Model‖ by Fei Han and Thiam Hee Ng
77. ―Early Warning Systems in the Republic of Korea: Experiences, Lessons, and Future Steps‖ by Hyungmin Jung and Hoe Yun Jeong
78. ―Trade and Investment in the Greater Mekong Subregion: Remaining Challenges and the Unfinished Policy Agenda‖ by Jayant Menon and Anna Cassandra Melendez
79. ―Financial Integration in Emerging Asia: Challenges and Prospects‖ by Cyn-Young Park and Jong-Wha Lee
80. ―Sequencing Regionalism: Theory, European Practice, and Lessons for Asia‖ by Richard E. Baldwin
81. ―Economic Crises and Institutions for Regional Economic Cooperation‖ by C. Randall Henning
82. ―Asian Regional Institutions and the Possibilities for Socializing the Behavior of States‖ by Amitav Acharya
83. ―The People’s Republic of China and India: Commercial Policies in the Giants‖ by Ganeshan Wignaraja
84. ―What Drives Different Types of Capital Flows and Their Volatilities‖ by Rogelio Mercado and Cyn-Young Park
85. ―Institution Building for Africal Regionalism‖ by Gilbert M. Khadiagala
86. ―What Drives Different Types of Capital Flows and Their Volatilities‖ by Rogelio Mercado and Cyn-Young Park
87. ―The Role of the People’s Republic of China in International Fragmentation and Production Networks: An Empirical Investigation‖ by Hyun-Hoon Lee, Donghyun Park, and Jing Wang
88. ―Utilizing the Multiple Mirror Technique to Assess the Quality of Cambodian Trade Statistics: by Shintaro Hamanaka
89. ―Is Technical Assistance under Free Trade Agreements WTO-Plus?‖ Review of Japan–ASEAN Economic Partnership Agreements‖ by Shintaro Hamanaka
90. ―Intra-Asia Exchange Rate Volatility and Intra-Asia Trade: Evidence by of Goods‖ by Hsiao Chink Tang
50 | Working Paper Series on Regional Economic Integration No. 101
91. ―Is Trade in Asia Really Integrating?‖ by Shintaro Hamanaka
92. ―The PRC's Free Trade Agreements with ASEAN, Japan, and the Republic of Korea: A Comparative Analysis‖ by Gemma Estrada, Donghyun Park, Innwon Park, and Soonchan Park
93. ―Assessing the Resilience of ASEAN Banking Systems: The Case of Philippines‖ by Jose Ramon Albert and Thiam Hee Ng‖
94. ―Strengthening the Financial System and Mobilizing Savings to Support More Balanced Growth in ASEAN+3" by A. Noy Siackhachanh
95. ‖Measuring Commodity-Level Trade Costs in Asia: The Basis for Effective Trade Facilitation Policies in the Region‖ by Shintaro Hamanaka and Romana Domingo
96. ―Why do Imports Fall More than Exports Especially During Crises? Evidence from Selected Asian Economies‖ by Hsiao Chink Tang
97. ―Determinants of Local Currency Bonds and Foreign Holdings: Implications for Bond Market Development in the People’s Republic of China‖ by Kee-Hong Bae
98. ―ASEAN–China Free Trade Area and the Competitiveness of Local Industries: A Case Study of Major Industries in the Lao People’s Democratic Republic‖ by Leebeer Leebouapao, Sthabandith Insisienmay, and Vanthana Nolintha
99. ―The Impact of ACFTA on People's Republic of China-ASEAN Trade: Estimates Based on an Extended Gravity Model for Component Trade‖ by Yu Sheng, Hsiao Chink Tang, and Xinpeng Xu
100. ―Narrowing the Development Divide in ASEAN: The Role of Policy‖ by Jayant Menon
*These papers can be downloaded from (ARIC) http://aric.adb.org/archives.php? section=0&subsection=workingpapers or (ADB) http://www.adb.org/publications/series/ regional-economic-integration-working -papers


Different Types of Firms, Products, and Directions of Trade The Case of the People’s Republic of China
Using highly disaggregated product-level data, Hyun-Hoon Lee, Donghyun Park, and Jing Wang perform an in-depth empirical analysis of the country’s trade in manufactured goods. The rich data set enables the authors to explore issues that existing literature has largely ignored, such as distinguishing traders into foreign firms, domestic public firms, and domestic private firms. Their analysis yields a number of new stylized facts about the exports and imports of the People’s Republic of China.
About the Asian Development Bank
ADB’s vision is an Asia and Pacific region free of poverty. Its mission is to help its developing member countries reduce poverty and improve the quality of life of their people. Despite the region’s many successes, it remains home to two-thirds of the world’s poor: 1.8 billion people who live on less than $2 a day, with 903 million struggling on less than $1.25 a day. ADB is committed to reducing poverty through inclusive economic growth, environmentally sustainable growth, and regional integration.
Based in Manila, ADB is owned by 67 members, including 48 from the region. Its main instruments for helping its developing member countries are policy dialogue, loans, equity investments, guarantees, grants, and technical assistance.
Asian Development Bank6 ADB Avenue, Mandaluyong City1550 Metro Manila, Philippineswww.adb.org/povertyPublication Stock No. WPS124936 Printed in the Philippines