determinants of software maintenance profiles: an empirical investigation
TRANSCRIPT

SOFTWARE MAINTENANCE: RESEARCH AND PRACTICE, VOL. 9, 235–251 (1997)
Research
Determinants of Software MaintenanceProfiles: An Empirical Investigation
CHRIS F. KEMERER1 AND SANDRA A. SLAUGHTER2*1Katz Graduate School of Business, University of Pittsburgh, Pittsburgh, PA 15260, U.S.A.2Graduate School of Industrial Administration, Carnegie Mellon University, Pittsburgh, PA 15213, U.S.A.
SUMMARY
Software maintenance is a task that is difficult to manage effectively. In part, this is becausesoftware managers have very little knowledge about the types of maintenance work that arelikely to occur. If managers could forecast changes to software systems, they could moreeffectively plan, allocate workforce and manage change requests. But, the ability to forecastsoftware modifications depends on whether there are predictable patterns in maintenance work.We posit that there are patterns in maintenance work and that certain characteristics ofsoftware modules are associated with these patterns.
We examine modification profiles for 621 software modules in five different business systemsof a commercial merchandiser. We find that only a small number of modules in these systemsis likely to be modified frequently, and that certain maintenance patterns emerge. Modulesfrequently enhancedare in systems whose functionality is considered strategic. Modules fre-quently repaired have high software complexity, are large in size, and are relatively older.However, modules that have been code generated are less likely to be repaired. Older andlarger modules are restructured and upgradedmore frequently. Our results suggest that thesecharacteristics of software modules are associated with predictable maintenance profiles. Suchprofile information can be used by software managers to predict and plan for maintenancemore effectively. In addition, our results suggest the use of code generators as a means ofreducing repair maintenance. 1997 by John Wiley & Sons, Ltd.
J. Softw. Maint.,9, 235–251 (1997)
No. of Figures: 0. No. of Tables: 10. No. of References: 31.
KEY WORDS: software maintenance; software complexity; software management; code generators; strategicsystems; cyclomatic complexity
1. INTRODUCTIONWhile it is well understood that software maintenance requires a significant amount oforganizational resources, there exists a relative shortage of quantitative empirical research
* Correspondence: Sandra A. Slaughter, 314A GSIA, Carnegie Mellon University, Pittsburgh, PA 15213, U.S.A.E-mail: sandras+Kandrew.cmu.edu
Contact grant sponsor: Carengie Mellon UniversityContact grant sponsor: University of Minnesota
CCC 1040–550X/97/040235–17$17.50 Received 21 February 1997 1997 by John Wiley & Sons, Ltd. Revised 26 April 1997

236 C. F. KEMERER AND S. A. SLAUGHTER
devoted to improving the performance of those who must manage this activity (Kemerer,1995). From an organizational perspective, managers find it difficult to plan for mainte-nance work and to manage maintenance requests because, in part, software managers havevery little a priori knowledge about the demand for maintenance work and about the easewith which the work can be done.
If managers could forecast the demand for changes to a system, they could moreeffectively plan releases, allocate workforce and manage change requests. For example,managers could batch changes to modules that are frequently changed to take advantageof scale economies (Banker and Slaughter, 1998). However, signals in the form of pastpatterns of maintenance are not normally made available to managers due to the effortrequired to accumulate, report and analyse detailed change request data. Furthermore, theability to forecast software modifications depends on whether there are predictable patternsin maintenance work.
In this study, we conduct an empirical investigation to determine whether there arepredictable maintenance patterns for the business systems of a commercial merchandiser.Our objective is to identify the general factors that are associated with predictable changeprofiles. This information can then be used by software managers to more effectively planfor maintenance.
2. FACTORS ASSOCIATED WITH SOFTWARE MODIFICATIONPATTERNS
2.1. Direct factors
We adopt the IEEE standard definition of software maintenance:the modification of asoftware product after delivery to correct faults, improve performance or other attributes,or adapt the product to a modified environment(IEEE, 1993). Based on this definition,we identify three major classes or profiles of software maintenance work.Enhancementsinclude adding, changing or deleting software functionality to adapt to changing businessrequirements.Repairs include corrections to errors in the software code.Preventivemaintenanceincludes technical upgrades and restructuring of software code.
There are several patterns that characterize the maintenance of a software system. Overthe lifetime of a software system, enhancements to functionality are likely to continue tobe done on a fairly regular basis after system installation. Systems that are closest toimportant areas of the business that change frequently will receive constant enhancementto keep synchronized with the business. A relatively high volume of error correctingactivity is likely immediately after system installation as ‘bugs’ are detected when clientsuse the system in the production environment. After installation, corrective work shouldstabilize until the system has been in place a number of years (Gefen and Schneberger,1996). However, as systems reach the end of their useful lives, corrective work may risedue to system entropy (Belady and Lehman, 1976). When systems age, they decay orbecome disordered due to constant modification that destroys the original structure of thesoftware. Organizations can counter this decay by reorganizing or restructuring their oldersoftware (Davis and Olson, 1985, p. 283).
J. Softw. Maint.,9, 235–251 (1997) 1997 by John Wiley & Sons, Ltd.
237DETERMINANTS OF SOFTWARE MAINTENANCE PROFILES
At the softwaremodule level, which in the context of our study is the program level,it is likely that all of the modules in a system will not be modified equally over theirlifetimes. Instead, change will be localized to certain modules in the system. This conceptof stress localizationexists because the system is liable to become pathological (or non-operative) if global changes are made rather than limited changes. Rational softwaredesigners will therefore design relatively independent modules to minimize the impact ofchanges and enable the system to remain stable (Parnas, 1972; Warnier 1976, pp. 15–64;Davis, 1987, p. 103). Thus, it is probable that some variant of the 80/20 rule willoperate—i.e., 80 per cent of the modifications will be made to 20 per cent of the softwaremodules in a system (Schaefer, 1985).
From a maintenance management perspective, this suggests that certain software modulesare much more likely to change over the life of a system. Therefore, identifying themodules and the kinds of modification that they are likely to receive can help softwaremanagers in their planning process by reducing uncertainty in the demand for mainte-nance work.
With all this as a given, the issue then becomes one of how to identify thesemodification-prone modules. We argue, based on data from the literature and fromempirical observations at field sites, that there are certain factors associated with both theamount and type of maintenance work a software module is likely to receive. Three ofthe factors are:
• functionality,• development practice, and• software complexity.
In addition, in our model wecontrol for two factors that, although not believed to bedirect causes of maintenance, have been suggested to be associated with maintenanceeffort (Chapin, 1985):
• age, and• size.
Inclusion of these factors ensures that any relationship discovered between maintenanceactivity and the first three factors is not due to a simple correlation between the directfactors and these latter two variables. In addition to possibly generating misleading results,these two latter factors may not be under the manager’s control.
2.2. FunctionalityThe kind of functionality implemented in an application is an important driver of
change. Applications such as strategic systems that interact more with a volatile andcompetitive external environment, are likely to be enhanced more frequently to keepsynchronization with that environment than are applications such as accounting systems,which are largely internal, relatively stable and narrower in scope (Davis and Olson,1985, pp. 6–7, 284–285). Thus, we posit:
1997 by John Wiley & Sons, Ltd. J. Softw. Maint.,9, 235–251 (1997)

238 C. F. KEMERER AND S. A. SLAUGHTER
Software modules in strategic systems will beenhancedmore frequently than softwaremodules in non-strategic systems.
2.3. Development practiceAnother important driver of software change is the particular practice that is employed
in the design and development of the software. One of the widely argued benefits ofComputer Aided Software Engineering (CASE) tools is that code generators (so-called‘lower CASE’ tools) should result in software with higher quality and fewer errors onaverage than software that has been created by hand. Code generators should thus havea beneficial effect in software maintenance because they reduce the variability in the codeand minimize coding errors as the code is automatically created from the software design(Necco, Tsai and Holgeson, 1989; Ehrlich, Lee and Molisani, 1990; Douglass, 1993).Hence, we suggest that:
Software modules that have been code generated will berepaired less frequently thansoftware modules that have been coded manually.
2.4. Software complexityA number of studies have linked software complexity with software maintenance
performance and software errors (Potieret al., 1982; Basili and Perricone, 1984; Banker,Datar and Kemerer, 1991). Software complexity refers to the characteristics of softwarethat make it difficult to understand and to modify (Curtiset al., 1979; Basili, 1980).There are multiple dimensions of software complexity (Banker, Datar and Zweig, 1989)—in this study, we focus on one particular dimension of software complexity: cyclomaticor decision density (Gill and Kemerer, 1991; Banker, Davis and Slaughter, 1998).
Decision density refers to the relative amount of decision or control paths in thesoftware per line of code, and has been suggested to be related to maintenance effort.Frequent decision and control flow branching within a software module obscures therelationship between inputs and outputs and increases the cognitive load of the maintenanceprogrammers because they must search among dispersed pieces of code to determine theflow of logic (Ramanujan and Cooper, 1994). Thus, software modules with complexdecision branching are liable to contain more errors and will likely be corrected morefrequently. Gill and Kemerer (1991) for example, found that this variable is positivelyassociated with maintenance effort, although they cautioned that their results were estimatedon a relatively small data sample, and they recommended further empirical testing. Thus,we posit that,
Software modules with high decision complexity will berepaired more frequently thansoftware modules with low decision complexity.
2.5. Control variable: ageWe control for two factors that are associated with change. One of these factors is
age, which has been argued to approximate for ‘system entropy’ in software systems
J. Softw. Maint.,9, 235–251 (1997) 1997 by John Wiley & Sons, Ltd.

239DETERMINANTS OF SOFTWARE MAINTENANCE PROFILES
(Vessey and Weber, 1983; Jones, 1989; Gode, Barua and Mukhopadhyay, 1990). For anumber of reasons, older software modules will likely receive more enhancements andmore repairs. The longer the system is in place, the more the business will change,requiring more enhancements to the system. In addition, as systems age, they tend tobecome less stable with frequent modification and will thus require repair to remainoperational. Because older modules are written using older technologies and techniques,they are prime candidates for restructuring and conversion to newer versions of technology.Thus, we anticipate that:
Older software modules will beenhancedmore frequently than newer software modules.
Older software modules will berepaired more frequently than newer software modules.
Older software modules will receivemore preventive maintenancethan newer softwaremodules.
2.6. Control variable: sizeOur other control factor is size. Larger modules will likely receive more enhancements
and more repairs than smaller modules,ceteris paribus, as larger modules embody greateramounts of functionality subject to change.
Larger modules will likely receive more repairs as well. The larger the module, themore difficult it is to test and validate the module’s functionality. This implies that largermodules tend to incorporate more errors. In addition, as business requirements changeand new requirements emerge, modules tend to grow in size to incorporate the additionalfunctionality needed. Therefore, larger modules are also good candidates for restructuringto reduce the complexity introduced by size. This leads us to expect that:
Larger software modules will beenhancedmore frequently than smaller software modules.
Larger software modules will berepaired more frequently than smaller software modules.
Larger software modules will receivemore preventive maintenancethan smallersoftware modules.
By the above arguments, we do not necessarily imply that only very small modulesare optimal. This would contradict good design principles, such as, minimize couplingand maximize cohesion. Rather, we suggest that, on average, larger modules will tend toreceive more maintenance work of all kinds.
Table 1 summarizes our hypotheses.
3. METHODOLOGY
3.1. Data sourceTo investigate our hypotheses, we conducted an empirical study of 621 software modules
in five different business systems of a commercial merchandiser. These modules were
1997 by John Wiley & Sons, Ltd. J. Softw. Maint.,9, 235–251 (1997)
240 C. F. KEMERER AND S. A. SLAUGHTER
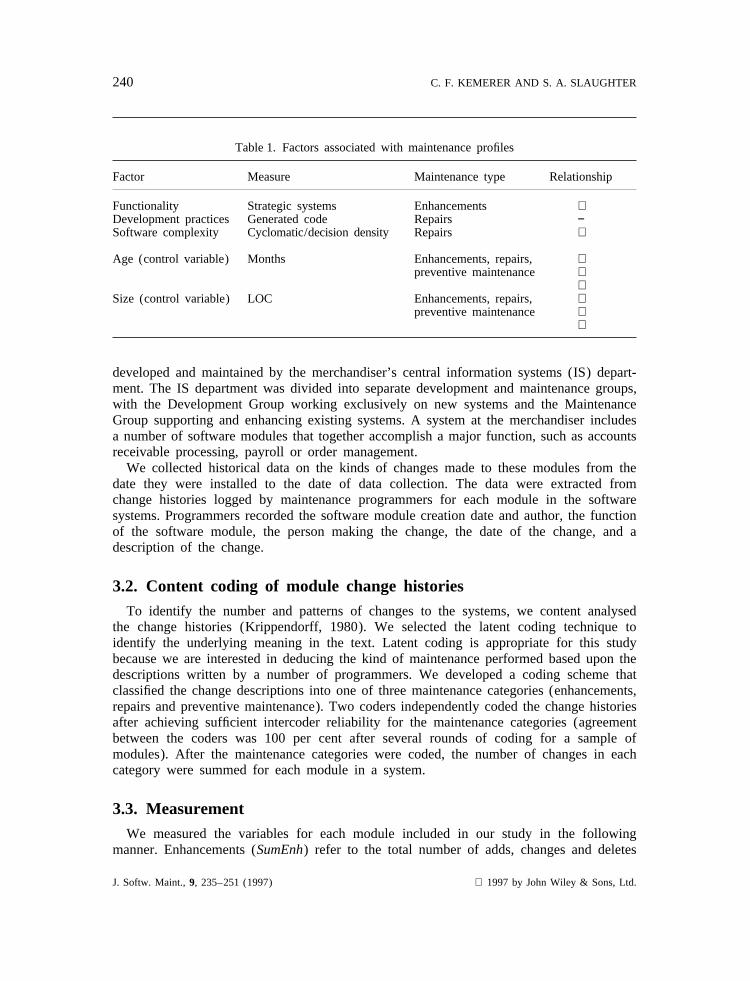
Table 1. Factors associated with maintenance profiles
Factor Measure Maintenance type Relationship
Functionality Strategic systems Enhancements +Development practices Generated code Repairs −Software complexity Cyclomatic/decision density Repairs +
Age (control variable) Months Enhancements, repairs, +preventive maintenance +
+Size (control variable) LOC Enhancements, repairs, +
preventive maintenance ++
developed and maintained by the merchandiser’s central information systems (IS) depart-ment. The IS department was divided into separate development and maintenance groups,with the Development Group working exclusively on new systems and the MaintenanceGroup supporting and enhancing existing systems. A system at the merchandiser includesa number of software modules that together accomplish a major function, such as accountsreceivable processing, payroll or order management.
We collected historical data on the kinds of changes made to these modules from thedate they were installed to the date of data collection. The data were extracted fromchange histories logged by maintenance programmers for each module in the softwaresystems. Programmers recorded the software module creation date and author, the functionof the software module, the person making the change, the date of the change, and adescription of the change.
3.2. Content coding of module change historiesTo identify the number and patterns of changes to the systems, we content analysed
the change histories (Krippendorff, 1980). We selected the latent coding technique toidentify the underlying meaning in the text. Latent coding is appropriate for this studybecause we are interested in deducing the kind of maintenance performed based upon thedescriptions written by a number of programmers. We developed a coding scheme thatclassified the change descriptions into one of three maintenance categories (enhancements,repairs and preventive maintenance). Two coders independently coded the change historiesafter achieving sufficient intercoder reliability for the maintenance categories (agreementbetween the coders was 100 per cent after several rounds of coding for a sample ofmodules). After the maintenance categories were coded, the number of changes in eachcategory were summed for each module in a system.
3.3. MeasurementWe measured the variables for each module included in our study in the following
manner. Enhancements (SumEnh) refer to the total number of adds, changes and deletes
J. Softw. Maint.,9, 235–251 (1997) 1997 by John Wiley & Sons, Ltd.
241DETERMINANTS OF SOFTWARE MAINTENANCE PROFILES
made to the functionality of the software module over its lifetime. Repairs (SumRep)refer to the total number of corrections made to coding errors in the software moduleover its lifetime. Preventive maintenance (SumPrev) refers to the total number of technicalconversions and restructurings made to the software module over its lifetime.
The Chief Information Officer and other managers at the merchandiser ranked thesystems in terms of their strategic importance from ‘1’ (low importance) to ‘5’ (highimportance). Using these rankings, we constructed a variable (Strg) for each softwaremodule and set its value to the ranking for the system to which the module belonged.
The company’s software library system tracked whether a module was the product ofa code generator. A binary variable (CodeGen) was constructed for each software moduleto indicate whether it was code generated (1) or written by hand (0).
Cyclomatic or decision density (DecDen) was measured using McCabe’s cyclomaticcomplexity metric (McCabe, 1976). This measure determines the number of decision pathsin the software module. Each software module was subjected to a commercial softwarecode analysis tool that calculated this metric. To account for the effects of size, McCabe’smetric was normalized by dividing it by the number of lines of code for each softwaremodule (Gill and Kemerer, 1991; Banker, Davis and Slaughter, 1998).
The age (AgeMths) of each software module was calculated as the number of monthsfrom the module’s initial installation date to the date of data collection.
The size (SLOC) of each software module was measured in terms of lines of code.This measure was calculated by the code analysis tool. Each module included in ourstudy was in the COBOL programming language, and therefore many of the normalcaveats about using SLOC as a size measure in cross-sectional analyses do not applyhere (Banker, Datar and Kemerer, 1991).
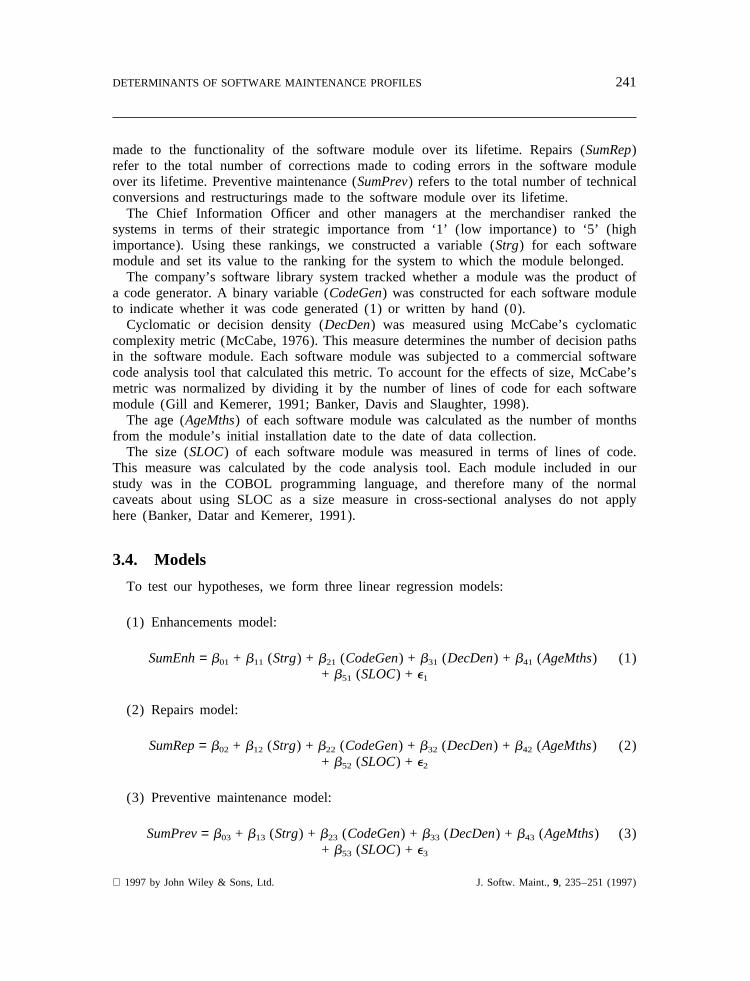
3.4. Models
To test our hypotheses, we form three linear regression models:
(1) Enhancements model:
SumEnh= b01 + b11 (Strg) + b21 (CodeGen) + b31 (DecDen) + b41 (AgeMths) (1)+ b51 (SLOC) + e1
(2) Repairs model:
SumRep= b02 + b12 (Strg) + b22 (CodeGen) + b32 (DecDen) + b42 (AgeMths) (2)+ b52 (SLOC) + e2
(3) Preventive maintenance model:
SumPrev= b03 + b13 (Strg) + b23 (CodeGen) + b33 (DecDen) + b43 (AgeMths) (3)+ b53 (SLOC) + e3
1997 by John Wiley & Sons, Ltd. J. Softw. Maint.,9, 235–251 (1997)

242 C. F. KEMERER AND S. A. SLAUGHTER
Table 2 summarizes the variables and coefficients included in these models. Note thatthe b’s represent the parameters for the explanatory variables that are statistically estimatedin the regression models. The first digit of the subscript for theb parameters representsthe designation for the explanatory variable (ranging from 0 to 5). The second digit ofthe subscript for theb parameters represents the number of the regression model (rangingfrom 1 to 3). Also, note thatb01, b02, and b03 represent the intercept terms in eachmodel, ande1, e2 and e3 refer to the disturbance (or error) terms in each model.
We use a multivariate regression to determine the association between maintenanceprofiles and the explanatory system and module variables for these models. Ordinary leastsquares (OLS) is used to individually estimate each model. Because each model hasidentical explanatory variables, OLS is as efficient as generalized least squares forestimation purposes (Greene, 1993, p. 488). Note that these models require local datacollection and validation for organizations interested in replicating the results. The precisestatistical results reported in the following section apply to the organization examined inthis study.
Table 2. Summary of maintenance profile linear regression models
Variable Coefficient(s) Definition How measured
SumEnh None—dependent Sum of enhancements Total number of times a module hasvariable been enhanced (functionality added,
changed or deleted) after installationSumRep None—dependent Sum of repairs Total number of times a module has
variable been repaired after installationSumPrev None—dependent Sum of preventive Total number of times a module has
variable maintenance been restructured or undergonetechnical conversion after installation
Strg b11, b12, b13 Strategic importance of Subjective rating(1–5) of thefunctionality strategic importance of the system to
which the module belongsCodeGen b21, b22, b23 Code generated Binary variable(0–1) indicating
indicator whether module is written by handor code generated
DecDen b31, b32, b33 Cyclomatic or decision McCabe’s cyclomatic complexitydensity measure for each module divided by
module total lines of codeAgeMths b41, b42, b43 Age in months Total number of months from
module’s installation date to date ofdata collection
SLOC b51, b52, b53 Source lines of code Total number of source lines of codein the module
J. Softw. Maint.,9, 235–251 (1997) 1997 by John Wiley & Sons, Ltd.
243DETERMINANTS OF SOFTWARE MAINTENANCE PROFILES
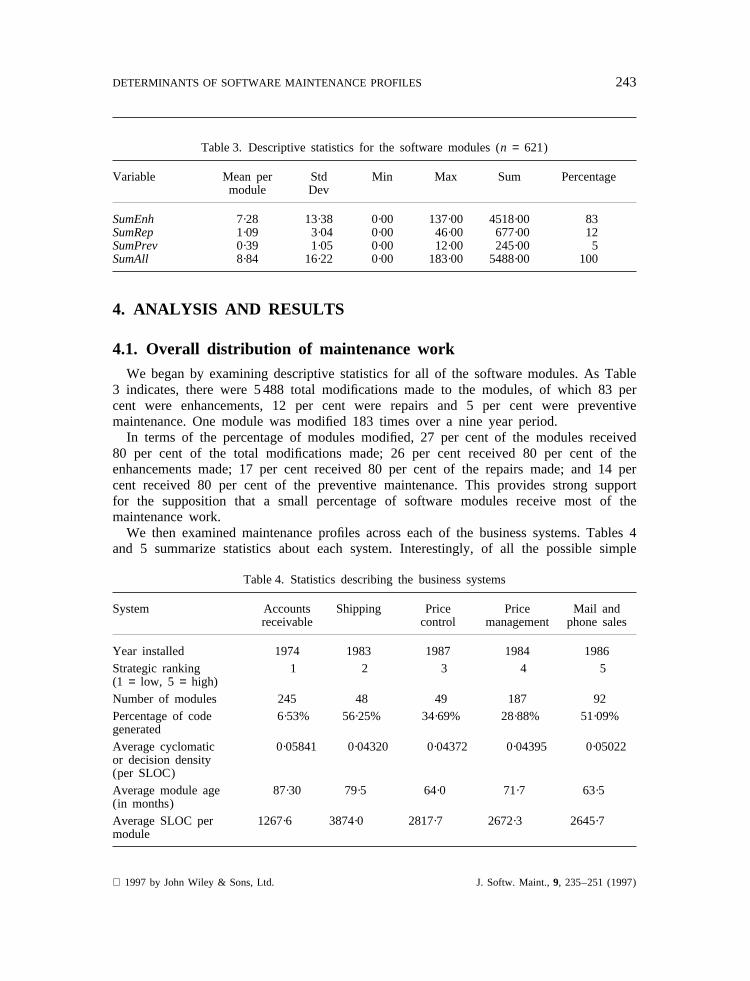
Table 3. Descriptive statistics for the software modules (n = 621)
Variable Mean per Std Min Max Sum Percentagemodule Dev
SumEnh 7·28 13·38 0·00 137·00 4518·00 83SumRep 1·09 3·04 0·00 46·00 677·00 12SumPrev 0·39 1·05 0·00 12·00 245·00 5SumAll 8·84 16·22 0·00 183·00 5488·00 100
4. ANALYSIS AND RESULTS
4.1. Overall distribution of maintenance workWe began by examining descriptive statistics for all of the software modules. As Table
3 indicates, there were 5 488 total modifications made to the modules, of which 83 percent were enhancements, 12 per cent were repairs and 5 per cent were preventivemaintenance. One module was modified 183 times over a nine year period.
In terms of the percentage of modules modified, 27 per cent of the modules received80 per cent of the total modifications made; 26 per cent received 80 per cent of theenhancements made; 17 per cent received 80 per cent of the repairs made; and 14 percent received 80 per cent of the preventive maintenance. This provides strong supportfor the supposition that a small percentage of software modules receive most of themaintenance work.
We then examined maintenance profiles across each of the business systems. Tables 4and 5 summarize statistics about each system. Interestingly, of all the possible simple
Table 4. Statistics describing the business systems
System Accounts Shipping Price Price Mail andreceivable control management phone sales
Year installed 1974 1983 1987 1984 1986Strategic ranking 1 2 3 4 5(1 = low, 5 = high)Number of modules 245 48 49 187 92Percentage of code 6·53% 56·25% 34·69% 28·88% 51·09%generatedAverage cyclomatic 0·05841 0·04320 0·04372 0·04395 0·05022or decision density(per SLOC)Average module age 87·30 79·5 64·0 71·7 63·5(in months)Average SLOC per 1267·6 3874·0 2817·7 2672·3 2645·7module
1997 by John Wiley & Sons, Ltd. J. Softw. Maint.,9, 235–251 (1997)
244 C. F. KEMERER AND S. A. SLAUGHTER
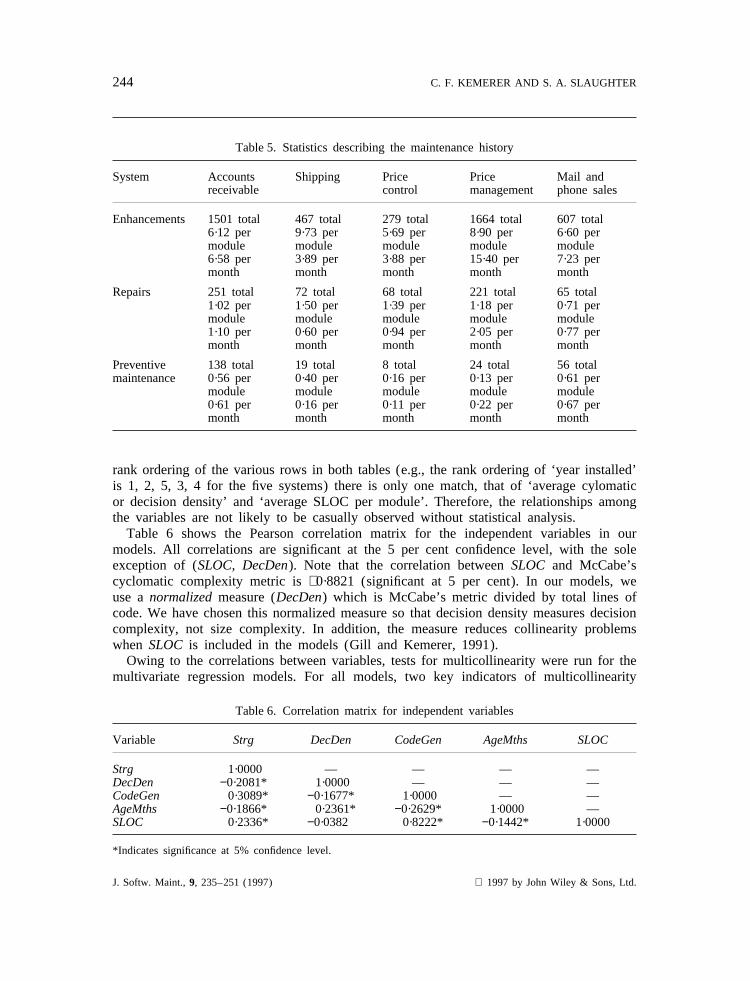
Table 5. Statistics describing the maintenance history
System Accounts Shipping Price Price Mail andreceivable control management phone sales
Enhancements 1501 total 467 total 279 total 1664 total 607 total6·12 per 9·73 per 5·69 per 8·90 per 6·60 permodule module module module module6·58 per 3·89 per 3·88 per 15·40 per 7·23 permonth month month month month
Repairs 251 total 72 total 68 total 221 total 65 total1·02 per 1·50 per 1·39 per 1·18 per 0·71 permodule module module module module1·10 per 0·60 per 0·94 per 2·05 per 0·77 permonth month month month month
Preventive 138 total 19 total 8 total 24 total 56 totalmaintenance 0·56 per 0·40 per 0·16 per 0·13 per 0·61 per
module module module module module0·61 per 0·16 per 0·11 per 0·22 per 0·67 permonth month month month month
rank ordering of the various rows in both tables (e.g., the rank ordering of ‘year installed’is 1, 2, 5, 3, 4 for the five systems) there is only one match, that of ‘average cylomaticor decision density’ and ‘average SLOC per module’. Therefore, the relationships amongthe variables are not likely to be casually observed without statistical analysis.
Table 6 shows the Pearson correlation matrix for the independent variables in ourmodels. All correlations are significant at the 5 per cent confidence level, with the soleexception of (SLOC, DecDen). Note that the correlation betweenSLOC and McCabe’scyclomatic complexity metric is+0·8821 (significant at 5 per cent). In our models, weuse anormalizedmeasure (DecDen) which is McCabe’s metric divided by total lines ofcode. We have chosen this normalized measure so that decision density measures decisioncomplexity, not size complexity. In addition, the measure reduces collinearity problemswhen SLOC is included in the models (Gill and Kemerer, 1991).
Owing to the correlations between variables, tests for multicollinearity were run for themultivariate regression models. For all models, two key indicators of multicollinearity
Table 6. Correlation matrix for independent variables
Variable Strg DecDen CodeGen AgeMths SLOC
Strg 1·0000 — — — —DecDen −0·2081* 1·0000 — — —CodeGen 0·3089* −0·1677* 1·0000 — —AgeMths −0·1866* 0·2361* −0·2629* 1·0000 —SLOC 0·2336* −0·0382 0·8222* −0·1442* 1·0000
*Indicates significance at 5% confidence level.
J. Softw. Maint.,9, 235–251 (1997) 1997 by John Wiley & Sons, Ltd.

245DETERMINANTS OF SOFTWARE MAINTENANCE PROFILES
(variance decomposition proportions and condition indices) are very low. The variancedecomposition proportions for each regression coefficient are lower than 0·5, and conditionindices for the coefficient matrices are less than nine. Note that Belsley, Kuh and Welsch(1980, pp. 112, 153–159) suggest an upper limit of 0·5 for variance decompositionproportions, and 30 for the condition index. Our figures are well below these limits,indicating that multicollinearity is not a problem in our models.
4.2. Results from the multivariate models
4.2.1. Results: enhancements model
Tables 7 to 9 display the results from our statistical estimation of the three multivariateregression models. We start with the enhancements model, summarized in Table 7.
For the enhancements model all hypotheses are supported, with signs in the predicteddirections. Our results indicate that, as anticipated, certain maintenance patterns emerge.Modules in systems whose functionality is considered strategic are significantly morelikely to be enhanced. The estimated coefficient for theStrg variable in the enhancementsmodel indicates that a one point increase in the strategic rating of the system, holdingother explanatory variables constant, leads to a 0·9126 increase in the expected numberof enhancements for a software module. In addition, a strong relationship betweenenhancement activity and bothDecDenandCodeGen, although not explicitly hypothesized,is also supported by the data. A potentialex post factoexplanation for the positiverelationship betweenDecDen and enhancements is that when modules are enhancedfrequently, there is more opportunity to introduce complexity. Or, parts of the system thatare ‘decision rich’ may be subject to greater numbers of external changes. The adjustedR2 for the model is 0·38, and can be interpreted that the model explains about 38 percent of the variance in the enhancement activity at this site.
Table 7. Regression results: enhancements model.SumEnh= b01 + b11 (Strg) + b21 (CodeGen) +b31 (DecDen) + b41 (AgeMths) + b51 (SLOC) + e1
Variables Coefficient Predicted Estimate t-value p-valuesign (one-tailed)
Intercept b01 −9·8531 −6·349 0·0001Strg b11 + 0·9126 3·174 0·0008DecDen b21 56·0795 2·798 0·0026CodeGen b31 −18·7022 −10·348 0·0001AgeMths b41 + 0·0794 8·381 0·0001SLOC b51 + 0·0048 15·235 0·0001
R2 0·3852Adjusted R2 0·3802F-test (model) 77·0706 0·0001
(F-value)
1997 by John Wiley & Sons, Ltd. J. Softw. Maint.,9, 235–251 (1997)

246 C. F. KEMERER AND S. A. SLAUGHTER
4.2.2. Results: repairs model
For the repairs model all hypotheses are supported, with signs in the predicted directions.The overall model has a similar strength of fit as the enhancements model. We find thatmodules frequently repaired have high software complexity, are large in size, and arerelatively older. The estimated coefficient for theDecDen variable in the repairs modelindicates that an increase of one decision statement per line of code leads to an increaseof 11·7581 in the expected number of repairs for a software module, holding otherexplanatory variables constant.
However, modules that have been code generated are significantly less likely to berepaired. The estimated coefficient for theCodeGenvariable in the repairs model indicatesthat the expected number of repairs is 4.3961 lower for code generated modules. Onepossible interpretation of this result is that programmers prefer not to update generatedcode, so they take another approach or live with the problem. Another potential interpret-ation of this result is that the code generator is effective for development but providespoor mechanisms for maintenance activities, and therefore, programmers minimize mainte-nance of code generated modules. However, at our particular field research site, theMaintenance Group was obligated to meet service level requirements for each system.Each year at this organization, end users for a particular system set service level (uptime)requirements in excess of 99 per cent. This means that the Maintenance Group isresponsible for making whatever corrections are necessary to the system in order that itmeets these service level guidelines. Thus, programmers could not refuse or avoidmaintenance to code generated modules or there would be a negative impact on service lev-els.
There is another interesting characteristic of the code generator used at this fieldresearch site. The code generator is a back-end CASE tool that generates COBOL code.It has the ability to incorporate ‘custom’ hand-written code in the generated code. Forexample, in a three day benchmarking test of CASE tools, the code generator was foundto require heavy custom COBOL coding outside of the tool to implement the functional
Table 8. Regression results: repairs model.SumRep= b02 + b12 (Strg) + b22 (CodeGen) + b32
(DecDen) + b42 (AgeMths) + b52 (SLOC) + e2
Variables Coefficient Predicted Estimate t-value p-valuesign (one-tailed)
Intercept b02 −1·5047 −4·041 0·0001Strg b12 0·0289 0·419 0·3376DecDen b22 + 11·7581 2·446 0·0074CodeGen b32 − −4·3961 −10·140 0·0001AgeMths b42 + 0·0077 3·392 0·0003SLOC b52 + 0·0011 14·838 0·0001
R2 0·3138Adjusted R2 0·3082F-test (model) 56·2439 0·0001
(F-value)
J. Softw. Maint.,9, 235–251 (1997) 1997 by John Wiley & Sons, Ltd.

247DETERMINANTS OF SOFTWARE MAINTENANCE PROFILES
requirements posed (Computerworld, 1991). However, the rigid format of the tool wasfound to assist in code readability. At our research site, a significant amount of customcoding was needed to meet the requirements of the end users. The custom code wasimplemented in the generated code using called subroutines. Managers and programmersindicated that most of the maintenance was to this custom code, and was made to thecalled subroutines which were outside of the tool and resided in common libraries. Thetool provides little support for updates to custom code.
While user service level agreements dictated changes to systems, these changes impactedprimarily the custom code which was outside of the code generating tool. Programmerschanged the custom code in a non-CASE environment, and then checked it against thegenerated code to ensure compatibility. Because of the difficulties inherent with modifi-cations in a CASE environment, programmers tended to make enhancements in batcheswhich had the effect of reducing the counts of enhancements to code-generated modules.This is consistent with the negative coefficient for CodeGen in our Enhancements Model.However, for repair work, programmers were required to make whatever repairs werenecessary to ensure compliance with uptime agreements. Thus, they could not batchrepairs in groups but had to correct errors as they occurred. This provides support forour result that code-generated modules have fewer errors on average than non-code-generated modules,ceteris paribus.
4.2.3. Results: preventive maintenance model
All of the hypothesized relationships among the variables in the preventive maintenancemodel are found to be significant. We find that older and larger modules tend to berestructured and upgraded more frequently on average. However, the overall fit of thismodel is not as strong as the enhancement model or repair model, with an adjustedR2
of only 0·18. In addition to the hypothesized relationships, a somewhat weaker relationshipbetweenStrg and preventive maintenance activity is also supported by the data.
Table 9. Regression results: preventive maintenance model.SumPrev = b03 + b13 (Strg) + b23
(CodeGen) + b33 (DecDen) + b43 (AgeMths) + b53 (SLOC) + e3
Variables Coefficient Predicted Estimate t-value p-valuesign (n = 621) (one-tailed)
Intercept b03 −0·3514 −2·508 0·0001Strg b13 −0·5435 −2·094 0·0184DecDen b23 −0·0848 −0·047 0·4813CodeGen b33 0·1818 1·114 0·1328AgeMths b43 + 0·0088 10·351 0·0001SLOC b53 + 0·0001 2·746 0·0031
R2 0·1915Adjusted R2 0·1850F-test (model) 29·1375 0·0001
(F-value)
1997 by John Wiley & Sons, Ltd. J. Softw. Maint.,9, 235–251 (1997)
248 C. F. KEMERER AND S. A. SLAUGHTER
Thus, the results from all three models demonstrate that certain characteristics ofsoftware modules can be associated with predictable maintenance patterns.
4.3. ‘80/20’ resultsIn examining the raw data, we find that there is rough support for the widely cited
‘80/20’ rule that about 80 per cent of all work is caused by only about 20 per cent ofall modules (Schaefer, 1985). For the five systems in this data set, 80 percent of themodifications were made to between 20 and 30 per cent of the modules. To test thisrelationship further, we classified the software modules into two groups: high/low com-plexity and high/low maintenance. To identify the high complexity group, we ordered themodules from high to low on theDecDen measure, and then assigned a ‘1’ to the top20 per cent of modules and a ‘0’ to the remaining 80 per cent of the modules. Toidentify the high maintenance group, we ordered the modules from high to low based onSumAll (the sum of enhancements, repairs and preventive maintenance). We assigned a‘1’ to the top 20 per cent of modules and a ‘0’ to the remaining 80 per cent of the modules.
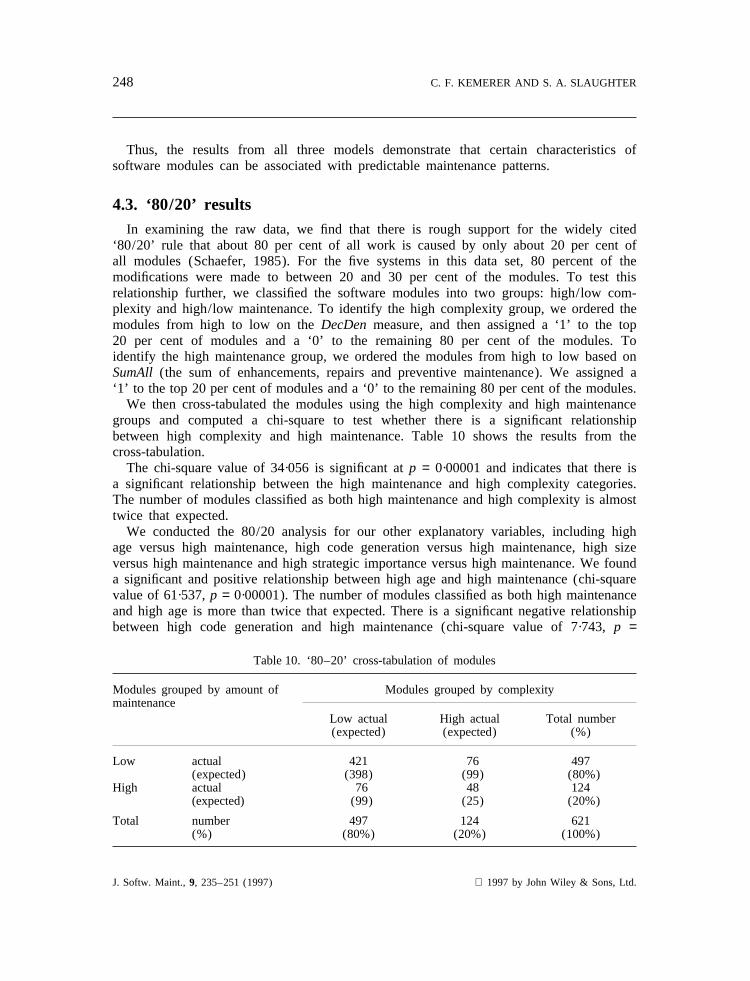
We then cross-tabulated the modules using the high complexity and high maintenancegroups and computed a chi-square to test whether there is a significant relationshipbetween high complexity and high maintenance. Table 10 shows the results from thecross-tabulation.
The chi-square value of 34·056 is significant atp = 0·00001 and indicates that there isa significant relationship between the high maintenance and high complexity categories.The number of modules classified as both high maintenance and high complexity is almosttwice that expected.
We conducted the 80/20 analysis for our other explanatory variables, including highage versus high maintenance, high code generation versus high maintenance, high sizeversus high maintenance and high strategic importance versus high maintenance. We founda significant and positive relationship between high age and high maintenance (chi-squarevalue of 61·537,p = 0·00001). The number of modules classified as both high maintenanceand high age is more than twice that expected. There is a significant negative relationshipbetween high code generation and high maintenance (chi-square value of 7·743,p =
Table 10. ‘80–20’ cross-tabulation of modules
Modules grouped by amount of Modules grouped by complexitymaintenance
Low actual High actual Total number(expected) (expected) (%)
Low actual 421 76 497(expected) (398) (99) (80%)
High actual 76 48 124(expected) (99) (25) (20%)
Total number 497 124 621(%) (80%) (20%) (100%)
J. Softw. Maint.,9, 235–251 (1997) 1997 by John Wiley & Sons, Ltd.
249DETERMINANTS OF SOFTWARE MAINTENANCE PROFILES
0·00539). The number of modules classified as both high maintenance and high codegeneration is only about half that expected. For high size versus high maintenance, wefound a non-significant relationship (chi-square value of 1·429,p = 0·23197). Interestingly,this implies that there is no relationship between size and maintenance volume for thetop 20 per cent of modules in both groups. Finally, we also found no significantrelationship between high maintenance and high strategic importance (chi-square value of0·480,p = 0·448826) for the top 20 per cent of modules in both groups.
5. CONCLUSIONS
The results of the statistical analysis suggest that maintenance activity does followpredictable patterns and therefore can be the subject of more rigorous managerial planningthan may be widely believed. The three variables,Strg, DecDenand CodeGenare allfactors that can be measureda priori, and therefore serve as useful planning tools. Inaddition, it should be noted that the hypotheses regarding these variables were supportedby the models after having controlled for both size and age, two commonly believedfactors in maintenance activity. Therefore, the results found here cannot be seen as anartefact due to possible correlation with these other factors.
Going further, these results suggest possible strategies for not simplyplanning forsoftware maintenance activity, but actively attempting toreduce it. The DecDen andCodeGenvariables are the result of activity that takes place during software development.Our models indicate that, on average, modules with high levels of decision density aresignificantly associated with both frequent enhancement and frequent repair. This suggeststhat organizations may wish to implement guidelines for upper bounds ofDecDenduringdevelopment and could recommend that software not exceed these guidelines before it isplaced into production. Similarly, during maintenance releases the code can be re-examinedto ensure that the maintenance work has not inadvertently increased this measure ofstatic complexity.
Organizations could also use these results to argue for the beneficial effects on softwarequality of so-called lower CASE tools. Our analysis supports the result that, at ourresearch site, code-generated modules were repaired significantly less on average than non-code-generated modules. This result cannot be explained by the notion that maintenanceprogrammers avoided repairing these modules, because the programmers were bound tofix errors as they occurred in order to meet user service level requirements.
Our results from the 80/20 analysis suggest that organizations do not need to investsignificant amounts of resources in implementing sophisticated techniques to identifymaintenance-prone modules. A simple ordering of modules from high to low using theDecDenor AgeMthsmeasures of complexity and age, respectively, can be used to classifythe modules into the group (20 per cent) which is likely to receive the majority ofmaintenance work. For our data set, this group includes 124 of the 621 modules. Thesemodules can then be selected for special treatment, which might include assignment to amore senior maintainer, or even to rewriting. The costs of such a procedure would needto be traded-off against the potential benefits to determine whether either restructuring orreassignment is more cost effective. We emphasize that local data collection and validation
1997 by John Wiley & Sons, Ltd. J. Softw. Maint.,9, 235–251 (1997)

250 C. F. KEMERER AND S. A. SLAUGHTER
is needed to calibrate the maintenance profile models for organizations that wish toreplicate our results.
Overall, the measure of any such study such as this one is to argue for a more rigorousand quantitative approach to software maintenance management, an activity of considerableeconomic significance to modern organizations.
AcknowledgementsThis study was funded in part by a Faculty Development Grant from Carnegie Mellon Universityand by a Grant from the Quality Leadership Center at the University of Minnesota. The authorsthank Wee Lin Sim for her data coding efforts. We gratefully acknowledge the helpful commentsof the anonymous reviewers.
ReferencesBanker, R., Datar, S., and Kemerer, C. (1991) ‘A model to evaluate variables impacting productivity
on software maintenance projects’,Management Science,37(1), 1–18.Banker, R., Datar, S. and Zweig, D. (1989) ‘Software complexity and maintainability’, inProceedings
International Conference on Information Systems, ACM, New York, NY, pp. 247–255.Banker, R., Davis, G. and Slaughter, S. A. (1998) ‘Software development practices, software
complexity, and software maintenance effort: a field study’,Management Science, forthcoming.Banker, R. and Slaughter, S. A. (1998) ‘A field study of scale economies in software maintenance’,
Management Science, forthcoming.Basili, V. (1980) ‘Quantitative software complexity models: a panel summary’, inTutorial on Models
and Methods for Software Management and Engineering, IEEE Computer Society Press, LosAlamitos, CA, pp. 232–233.
Basili, V. and Perricone, B. (1984) ‘Software errors and complexity: an empirical investigation’,Communications of the ACM,27(1), 42–52.
Belady, L. and Lehman, M. (1976) ‘A model of large program development’,IBM Systems Journal,15(1), 225–252.
Belsley, D., Kuh, E. and Welsch, R. (1980)Regression Diagnostics, John Wiley and Sons, NewYork, NY, 292 pp.
Chapin, N. (1985) ‘Software maintenance: a different view’, inAFIPS Conference Proceedings,Volume 54 NCC, AFIPS Press, Reston, VA, pp. 328-331.
Computerworld (1991) ‘Pansophic short on CASE; development and maintenance report card’,Computerworld,25(37), 37.
Curtis, B., Sheppard, S., Milliman, P., Borst, M. and Love, T. (1979) ‘Measuring the psychologicalcomplexity of software maintenance tasks with the Halstead and McCabe metrics’,Transactionson Software Engineering,SE-5(2), 96–104.
Davis, W. (1987)Systems Analysis and Design: A Structured Approach, Addison-Wesley, ReadingMA, 415 pp.
Davis, G. and Olson, M. (1985)Management Information Systems: Conceptual Foundations, Structureand Development, McGraw-Hill, New York, NY, 693 pp.
Douglass, D. (1993) ‘The costs and benefits of CASE’,I/S Analyzer,31(6), 1–16.Ehrlich, W., Lee, S. and Molisani, R. (1990) ‘Applying reliability measurement: a case study’,IEEE
Software,7(2), 56–64.Gefen, D. and Schneberger, S. (1996) ‘The non-homogeneous maintenance periods: a case study of
software modifications’, inProceedings International Conference on Software Maintenance, IEEEComputer Society Press, Los Alamitos, CA, pp. 134–141.
Gill, G. and Kemerer, C. (1991) ‘Cyclomatic complexity density and software maintenance pro-ductivity’, Transactions on Software Engineering,17(12), 1284–1288.
Gode, D., Barua, A. and Mukhopadhyay, T. (1990) ‘On the economics of the software replacement
J. Softw. Maint.,9, 235–251 (1997) 1997 by John Wiley & Sons, Ltd.

251DETERMINANTS OF SOFTWARE MAINTENANCE PROFILES
problem’, in Proceedings of the Eleventh International Conference on Information Systems,University of Copenhagen, Denmark, pp. 159–170.
Greene, W. (1993)Econometric Analysis, 2nd ed., MacMillan Publishing Company, New York, NY,791 pp.
IEEE (1993) IEEE Standard for Software Maintenance, IEEE, New York, NY, 39 pp.Jones, C. (1989) ‘Software enhancement modelling’,Journal of Software Maintenance,1(1), 91–100.Kemerer, C. (1995) ‘Software complexity and software maintenance: a survey of empirical research’,
Annals of Software Engineering,1(1), 1–22.Krippendorff, K. (1980)Content Analysis: An Introduction to its Methodology, Sage Publications,
Newbury Park, CA, 191 pp.McCabe, T. (1976) ‘A complexity measure’,Transactions on Software Engineering,SE-2(4),
308–320.Necco, C., Tsai, R. and Holgeson, K. (1989) ‘Current usage of CASE software’,Journal of Systems
Management,40(5), 6–11.Parnas, D. (1972) ‘On the criteria to be used in decomposing systems into modules’,Communications
of the ACM,15(12), 1053–1058.Potier, D., Albin, J., Ferreol, R. and Bilodeau, A. (1982) ‘Experiments with computer software
complexity and reliability’, inProceedings Sixth International Conference on Software Engineering,IEEE Computer Society Press, Los Alamitos, CA, pp. 94–103.
Ramanujan, S. and Cooper, R. (1994) ‘A human information processing approach to softwaremaintenance’,Omega,22(2), 185–203.
Schaefer, H. (1985) ‘Metrics for optimal maintenance management’, inProceedings Conference onSoftware Maintenance—1985, IEEE Computer Society Press, Los Alamitos, CA, pp. 114–119.
Vessey, I. and Weber, R. (1983) ‘Some factors affecting program repair maintenance: an empiricalstudy’, Communications of the ACM,26(2), 128–134.
Warnier, J. (1976)Logical Construction of Programs, Van Nostrand-Reinhold, New York, NY,230 pp.
Authors’ biographies:
Chris F. Kemerer holds the David Roderick Chair in Information Systems atthe University of Pittsburgh. He received his doctorate from Carnegie MellonUniversity, and was an Associate Professor at MIT’s Sloan School of Manage-ment prior to accepting his current position. Dr. Kemerer’s research interestsinclude management and measurement issues in information systems andsoftware engineering. He has published articles on these topics in leadingprofessional and academic journals. He is a former Principal of AmericanManagement Systems, Inc., the Arlington, Virginia-based software developmentand consulting firm.
Sandra A. Slaughter is an Assistant Professor at Carnegie Mellon Universityin the Graduate School of Industrial Administration. She received her doctoratein information systems from the University of Minnesota. Her research focuseson productivity and quality improvement in information systems developmentand maintenance. Her dissertation,Software Development Practices and SoftwareMaintenance Performance, received the ICIS Best Dissertation Award in 1995.Dr. Slaughter has worked for Hewlett-Packard as an information systems plannerand for Allen-Bradley Company and Square D Corporation as an informationsystems project manager.
1997 by John Wiley & Sons, Ltd. J. Softw. Maint.,9, 235–251 (1997)