determinants of accounting quality: empirical …€¦ · determinants of accounting quality:...
TRANSCRIPT
DETERMINANTS OF ACCOUNTING QUALITY: EMPIRICAL EVIDENCE FROM THE
EUROPEAN UNION AFTER IFRS ADOPTION
Inna Choban Paiva ISCTE – IUL Business School
Avenida Forças Armadas 1649-026 Lisboa – Portugal
Isabel Costa Lourenço ISCTE - IUL Business School
Avenida Forças Armadas 1649-026 Lisboa – Portugal
Área temática: A) Información Financiera y Normalización Contable
Keywords: IFRS, Accounting Quality, Earning management, EU
85a

DETERMINANTS OF ACCOUNTING QUALITY: EMPIRICAL EVIDENCE FROM THE
EUROPEAN UNION AFTER IFRS ADOPTION
Abstract
This paper reports the results of the empirical research of firm’s incentives that
determine accounting quality of firms applying IFRS. In particular, we examine earnings
management constructs often used to assess accounting standards quality. We
perform a multivariate regression analysis on firms accounting data from 2006 to 2008.
Our results provide evidence that large firms have lower cross-sectional absolute
discretionary accruals or less earnings management. Further, we find that firms with
debt issuing would have higher cross-sectional absolute discretionary accruals or more
earnings management. Also, firms whose financial statements are audited by a “Big 4”
do not appear to have a clear impact on accounting quality. The different overall results
for countries like UK and France indicate that different firms accounting incentives
dominate accounting standards in determining accounting quality. These findings
contribute to the literature by analysing the determinants of accounting quality in one
setting where high level accounting standards are already in use.

1. Introduction
This paper investigates the determinants of accounting quality of listed firms after the
compulsory adoption of IFRS by 2005. Following the recent adoption of IFRS in many
regions of the world, much attention is being given to the association between
accounting standards and accounting quality. International standards have been
usually associated to higher accounting quality (e.g. Barth et al, 2008). However, firms
and institutional incentives should also affect this feature of accounting numbers
(Soderstrom and Sun, 2007; Burgstahler et al, 2006). We analyze firm’s characteristics
influencing accounting quality in a stable context where a set of high level accounting
standards are used.
We focus on the level of earnings management as one dimension of accounting quality
that is particularly responsive to firm’s reporting incentives(e.g. Vantendeloo and
Vanstraelenm 2005; Barth et al., 2006; Hung and Subramanyam, 2007; Burgstahler et
al, 2006 ). This construct is especially relevant to our research because this relies on
managerial discretion and is therefore likely to be influenced by the incentives and
characteristics of companies preparing the financial statements.
The analysis relies on private and public firms in the European Union, listed in the
stock market that adopted IFRS compulsory by 2005. The information source is the
Worldscope Database. The analysis is based on 1084 UK firm-year and 1147 French
observations including the years 2006, 2007 and 2008.
Our results provide evidence show that accounting quality is higher in UK for big firms
and firms with greater cash flow from operation and in the French for big firms and for
firms listing in the EU. In the both of countries empirical analysis evidence accounting
quality is lower for debt issuing firms. Also, firms whose financial statements are
audited by a “Big 4” do not appear to have a clear impact on accounting quality.
The different overall results for countries like UK and France indicate that different firms
accounting incentives dominate accounting standards in determining accounting
quality.
These findings contribute to the literature by analysing the determinants of accounting
quality in one setting where high level accounting standards are already in use.
Additionally, contribute to the regulatory issue of accounting harmonization and the
debate on accounting convergence.
The remainder of the paper is organized as follows. Section 2 reviews previous
literature. Section 3 describes the research design and Section 4 analyses the
empirical results. Finally, Section 5 presents the summary and concluding remarks.
2. Previous literature
Two streams of literature are relevant to our research: studies investigating the
characteristics of the firms applying voluntarily IFRS, and studies on the association
between IFRS and accounting quality.
The characteristics of the firms applying voluntarily IFRS
Several studies provide evidence on the characteristics of firms applying IFRS
voluntarily. Al-Basteki (1995) demonstrates that audit firm and the line of business are
explanatory variables that influence Bahrain firms’ decision of voluntary adoption of
IFRS. Dumontier and Raffounier (1998) found that financial markets,
internationalisation, company’s size, type of property and the auditor are explanatory
variables of Swiss companies’ decision to apply voluntarily IFRS. Garcia and Zorio
(2002) confirm that size, internationalisation and type of auditing influence the decision
of voluntary adoption of IFRS.
In all the studies mentioned above, the type of auditing is the factor that has been
pointed out as determinant for the voluntary adoption of IFRS. In the second place, the
internationalization and the company’s size appear to be the most referred.
Studies on the association between IFRS adoption and accounting quality
It is generally accepted that the quality of IFRS is higher than most domestic
accounting standards (e.g., Leuz and Verrecchia 2000; Leuz 2003; Ashbaugh and
Pincus 2001; Barth et al.2006, 2008). That is why we expect accounting quality to be
higher after the adoption of IFRS.
Several studies provide evidence on the association between IFRS adoption and
accounting quality. Tendenloo and Vanstraelen (2005) analyses earnings management
of German firms that have adopted IFRS voluntarily, providing evidence that for firms
audited by Big-4, earning management decreases significantly. They conclude that the
mere adoption of IFRS is not sufficient to guarantee a better quality of accounting
information. Glaum et al. (2008) show that German firms applying IFRS present lower
intensity in the smoothing through provisions when comparing with firms applying
German GAAP. Christensen et al. (2008) investigate the impact of incentives on

accounting quality changes around IFRS adoption by German firms. They found that
improvements in accounting quality are confined to firms applying IFRS voluntarily.
These empirical results lead us to conclude that even in the presence of high-quality
accounting standards (IFRS), the financial information presented by firms remains a
manipulation target. A possible explanation for these findings is that accounting quality
is moulded by various factors, such as, by one hand, the strength of the execution
system (audit), firms’ size, companies’ indebtedness, market competition, firms’
compensation and, by the other hand, the regulation of the capital market, the taxation
system and the regulation structure of the country, with its functioning characteristics.
In the theoretical study worked out by Soderstrom and Sun (2007), the model of
determinants for accounting quality after the adoption of IFRS in the European Union is
debated. These authors highlight the importance of both institutional and firms factors
that could influence accounting quality. Moreover, Soderstrom and Sun (2007) refer
that empirical studies of determinants of accounting quality has now a relevant
importance, due to the fact that, as all the countries of the European Union are going to
have a group of consistent accounting rules, the future improvement of the accounting
quality will depend on the change of the political and legal system from one country to
the other and incentives of the financial report of each company.
Hail et al. (2009) also provide a theoretical revision of the analysis of economic and
political factors due to the adoption of IFRS. They highlight firms’ incentives as the
determinant keys for accounting quality, and argue that, accounting quality can change
between companies and between countries. To get to these conclusions, the authors
drew on empirical studies performed by Ball et al. (2000), Ball and Shivakumar (2006),
Lang et al. (2006). Leuz and Wysocki (2008) also develop a theoretical analysis of the

consequences of the implementation of the IFRS. They conclude that the specific
characteristics of firms are relevant to determine discrepancies in financial reports.
3. Research design
The sample
Our analysis relies on UK and French firms listed in the stock market that adopted
IFRS compulsory by 2005. The information source is the Worldscope Database. The
analysis is based on 1084 firm-year and 1147 firm-year observations including the
years 2006, 2007 and 2008.
Measurement of Accounting Quality
In order to measure accounting quality, we apply the most widely used Modified Jones
Model suggested by Dechow et al. (1995). To determine the accruals quality, Dechow
et al. (1995) uses the calculation of total accruals:
1
t t t t tt
t
CA CL Cash DEBT DEPNTCA
A −
∆ − ∆ − ∆ + ∆ −= (1)
where ?CA i,t is the change of current assets for firm i year t, ?CL i,t is the change of
current liabilities for firm i year t, ?Cash i,t is the change in cash for firm i year t; ?DEBT
i,t is the change in short-term debt in current liabilities for firm i year t; DEPN i,t is the
depreciation; A i,t-1 is total of assets in year t-1.
Thus, by applying formula (1) to each firm, in each year, we determine the metric –
accruals quality (TCA). The total of accruals can be subdivided in (i) non discretionary

accruals (NAAC), which correspond to the component resulting from the real
performance of firms and (ii) discretionary accruals (DACC) that correspond to the
component that does not derive from the real firm business, thus being interpreted as
earnings management action. Therefore, in algebraic terms:
TCA = NAAC + DACC (2)
In the literature, when it is necessary to measure the earnings management, we use
discretionary accruals (DACC) for such effect. In fact, when there is a connection
between accruals and earnings management, implicitly the studies refer to
discretionary accruals (DACC), that is, the higher the discretionary accruals (DACC),
the more intense the practical of earnings management.
Thus, once the total accruals are calculated, we use the division of TCA according to
formula (2) using for this effect the assessment, from the model called Modified Jones
Model, suggested by Dechow et al. (1995).
( )1 2 3
1 1 1
1 t t tt t
t t t
REV REC PPETCA
A A Aα α α ε
− − −
∆ − ∆= + + + (3)
where ?REV i,t is the change in Sales for firm i year t; ?REC i,t is the change in accounts
receivable for firm i year t ; PPE i,t is the gross amount of properties, plants and
equipment for firm i year t.
Accruals quality is measured as the standard deviation of a firm’s residuals. The NACC
arises from formula (3), according to the following equation:
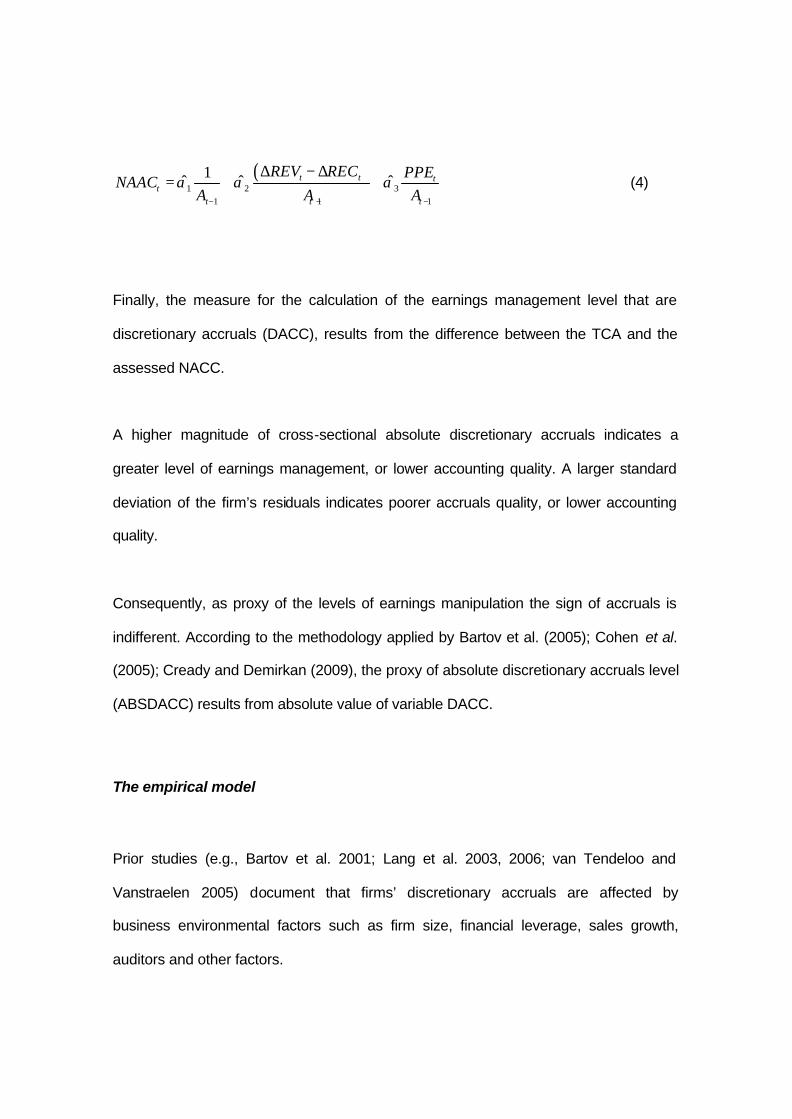
( )1 2 3
1 1 1
1ˆ ˆ ˆt t tt
t t t
REV REC PPENAAC
A A Aα α α
− − −
∆ − ∆= + + (4)
Finally, the measure for the calculation of the earnings management level that are
discretionary accruals (DACC), results from the difference between the TCA and the
assessed NACC.
A higher magnitude of cross-sectional absolute discretionary accruals indicates a
greater level of earnings management, or lower accounting quality. A larger standard
deviation of the firm’s residuals indicates poorer accruals quality, or lower accounting
quality.
Consequently, as proxy of the levels of earnings manipulation the sign of accruals is
indifferent. According to the methodology applied by Bartov et al. (2005); Cohen et al.
(2005); Cready and Demirkan (2009), the proxy of absolute discretionary accruals level
(ABSDACC) results from absolute value of variable DACC.
The empirical model
Prior studies (e.g., Bartov et al. 2001; Lang et al. 2003, 2006; van Tendeloo and
Vanstraelen 2005) document that firms’ discretionary accruals are affected by
business environmental factors such as firm size, financial leverage, sales growth,
auditors and other factors.

The literature shows that the company’s size can influence the levels of earnings
management and consequently, the quality of accounting information (van Tendeloo
and Vandstralen, 2005; Lang et al., 2006; Barth et al., 2008; Cready and Demirkan,
2009). Thus, we are going to consider the natural logarithm of the firm assets as proxy
of size (SIZE).
According to the reasoning that the firm’s financial profit/loss statement audited by “BIG
– 4” show a bigger flexibility of the accounting information, we consider the variable
dummy, that assumes the value one, if the auditor is “BIG – 4” and zero, otherwise –
AUD (Barth et al. 2008; Glaum et al., 2008).
According to Lang et al. (2006), firms with a high intensity of capital regularly need
external capital. This suggests that firms with high intensity of capital are driven to a
higher earnings management. Thus, in the model the turnover variable will be
considered, calculated as total sales divided by the total assets of the company –
TURN.
Firms of each financial market may have had a different behavior from others, so we
are going to introduce in the model a variable called XLIST, that assumes value one,
when a determined firm will be listed in a Stock Exchange of another country and zero,
when this won’t happen (Barth et al. 2008).
For issuer firms, the higher the quotation when raising new capital the better, since
they manage to maximize the respective financial collection. Therefore, the managers
can benefit in managing results so that the shares price increases. We introduced the
EISSUE variable, which is the annual percentage change in common stock and
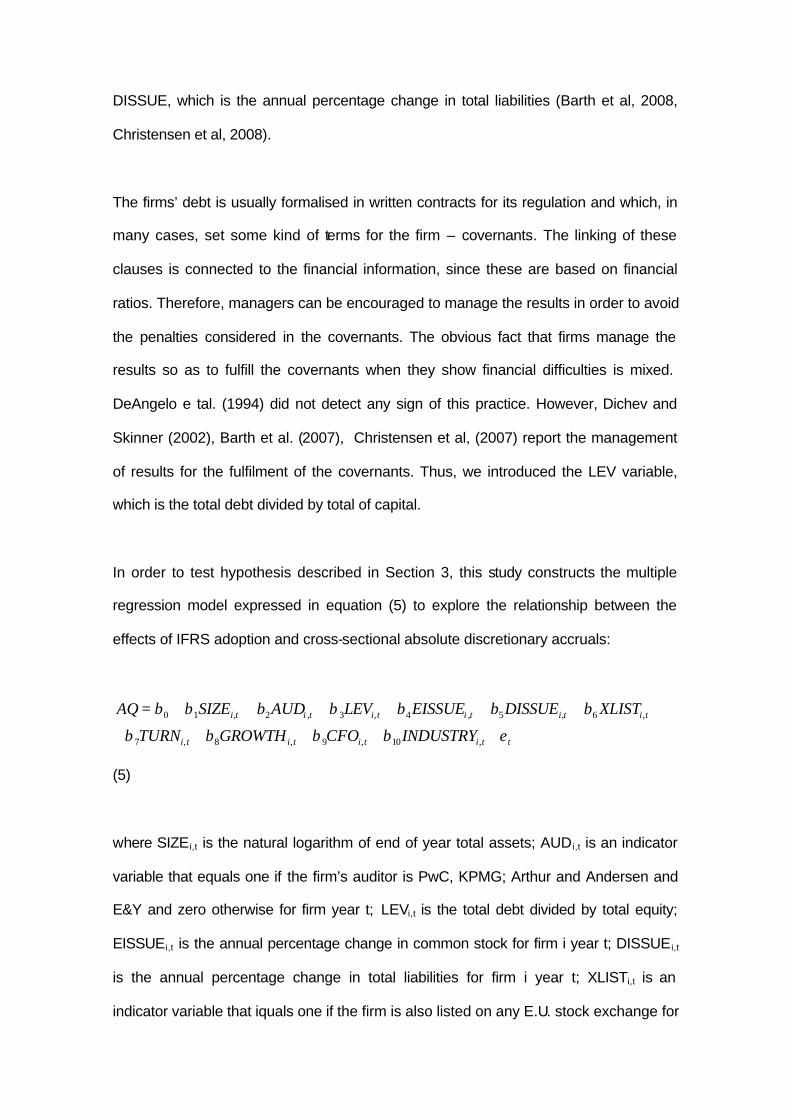
DISSUE, which is the annual percentage change in total liabilities (Barth et al, 2008,
Christensen et al, 2008).
The firms’ debt is usually formalised in written contracts for its regulation and which, in
many cases, set some kind of terms for the firm – covernants. The linking of these
clauses is connected to the financial information, since these are based on financial
ratios. Therefore, managers can be encouraged to manage the results in order to avoid
the penalties considered in the covernants. The obvious fact that firms manage the
results so as to fulfill the covernants when they show financial difficulties is mixed.
DeAngelo e tal. (1994) did not detect any sign of this practice. However, Dichev and
Skinner (2002), Barth et al. (2007), Christensen et al, (2007) report the management
of results for the fulfilment of the covernants. Thus, we introduced the LEV variable,
which is the total debt divided by total of capital.
In order to test hypothesis described in Section 3, this study constructs the multiple
regression model expressed in equation (5) to explore the relationship between the
effects of IFRS adoption and cross-sectional absolute discretionary accruals:
0 1 , 2 , 3 , 4 , 5 , 6 ,
7 , 8 , 9 , 10 ,
i t i t i t i t i t i t
i t i t i t i t t
AQ SIZE AUD LEV EISSUE DISSUE XLIST
TURN GROWTH CFO INDUSTRY
β β β β β β β
β β β β ε
= + + + + + + +
+ + + + +
(5)
where SIZEi,t is the natural logarithm of end of year total assets; AUD i,t is an indicator
variable that equals one if the firm’s auditor is PwC, KPMG; Arthur and Andersen and
E&Y and zero otherwise for firm year t; LEVi,t is the total debt divided by total equity;
EISSUEi,t is the annual percentage change in common stock for firm i year t; DISSUE i,t
is the annual percentage change in total liabilities for firm i year t; XLISTi,t is an
indicator variable that iquals one if the firm is also listed on any E.U. stock exchange for

firm i year t; TURNi,t is the sales divided by end of year total assets for firm i year t;
GROWTHi,t is net sales divided by revenues growth for firm i year t ; CFO is cash flow
from operation divided by end of year total assets for firm i year t.
4. Empirical results
Descriptive analysis
Table 1 presents descriptive statistics on all variables used in the analysis.
Table 1
Multivariate analysis
Tables 2 and 3 presents the OLS regression results. We control the heteroskedasticity
and autocorrelation of variables by Newey-West test.
Table 2 and Table 3
We find that in France and UK, accounting quality are negatively and significantly
related to firm size (SIZE) at the 1% level which indicates that firms with larger size
have lower cross-sectional absolute discretionary accruals or less earnings
management.
Additionally, we find that in France and UK, accounting quality are positively and
significantly related to debt issuing (DISSUE) at the 1% and 5% level, which indicates
that firms with changes in total liabilities have increase cross-sectional absolute
discretionary accruals or high earnings management.

We find that in France and UK firms whose financial statements are audited by a “Big
4” (AUD) and firms whose sales is growth (GROWTH) do not appear to have a clear
impact on absolute discretionary accruals, probably because the impact of absolute
discretionary accruals on accounting quality varies with the governance infrastructure
on the reporting firm. We do not find a significant relation between equity issues
(EISSUE) and the financial leverage (LEV).
Regarding UK firms, we find a negatively and significantly connection to cash-flow from
operations (CFO) at the 10% level, which indicated that firms with greater cash flow
from operation have lower cross-sectional absolute discretionary accruals or less
earnings management.
Regarding French firms, the link between cross-listing in the EU (XLIST) and absolute
discretionary accruals on accounting quality is significantly positive at the 10% level,
while that between asset turnover rates (TURN) and absolute discretionary accruals
on accounting quality is significantly negative at the 5% level.
5. Conclusions
Using empirical analysis, we investigate the determinants of accounting quality of UK
and French listed firms after the compulsory adoption of IFRS by 2005. We analyze
firm’s characteristics influencing accounting quality in a stable context where a set of
high level accounting standards are used.
The analysis relies on UK and French firms listed in the stock market that adopted
IFRS compulsory by 2005. Our results provide evidence show that accounting quality is

higher in UK for big firms and firms with greater cash flow from operation and in the
French for big firms and for firms listing in the EU.
In the both of countries empirical analysis evidence accounting quality is lower for debt
issuing firms. Also, firms whose financial statements are audited by a “Big 4” do not
appear to have a clear impact on accounting quality.
The different overall results for countries like UK and France indicate that different firms
accounting incentives dominate accounting standards in determining accounting
quality.
These findings contribute to the literature by analysing the determinants of accounting
quality in one setting where high level accounting standards are already in use.
References
Al-Basteki, H (1995) The voluntary adoption of International Accounting Standards by
Bahraini Corporations. Advances in International Accounting, (8), 47-64
Ashbaugh, H. and Pincus, M. (2001) Domestic accounting standards, international
accounting standards, and the predictability of earnings, Journal of Accounting
Research, 39(3), pp. 417–434.
Ball, R., Kothari, S. P. and Robin, A. (2000) The effect of international institutional
factors on properties of accounting earnings, Journal of Accounting and
Economics, 29(1), pp. 1–51.
Ball, R., Robin, A. and Sadka, G. (2006) Are timeliness and conservatism due to debt
or equity markets? An international test of ‘contracting’ and ‘value relevance’
theories of accounting, Working Paper, University of Chicago.
Ball, R., and Shivakumar, L., (2006) The role of accruals in asymmetrically timely gain
and loss recognition. Journal of Accounting Research, 44 (2), pp. 207–242.
Barth, M., Landsman, W., Lang, M. and Williams, C (2006) Accounting Quality:
International Accounting Standards and US GAAP. Working Paper, Stanford
University and University of North Carolina.
Barth, M., Landsman, W. and Lang, M. (2008) International accounting standards and
accounting quality, Journal of Accounting Research, 46 (3), pp. 467–498.
Bartov, E., Goldberg, S. and Kim, M. (2005) Comparative value relevance among
German, U.S., and International Accounting Standards: a German stock market
perspective, Journal of Accounting, Auditing and Finance, 20(2), pp. 95–119.
Bartov, E., Gul, F. and Tsui, J. (2001) Discretionary-accruals models and audit
qualifications. Journal of Accounting and Economics 30(3), pp. 421–452.
Burgstahler, D., Hail, L. and Leuz, C. (2006) The importance of reporting incentives:
earnings management in European private and public firms, The Accounting
Review, 81(5), pp. 983–1016.
Cohen, A., Dey, A. and Lys, T. (2005) Trends is earnings management and
informativeness of earnings announcements in the pré and post-Sarbanes Oxley

periods. Em http://papers.ssrn.com/sol3/papers.cfm?abstract_id=658782
(30/06/2009)
Christensen, H., Lee, E. and Walker, M (2008) Incentives or standards: What
determines accounting quality changes around IFRS adoption? Em
http://papers.ssrn.com/sol3/papers.cfm?abstract_id=1013054.pdf (16/04/2009)
Cready, W. and Demirkan, S (2009) Information environment characteristics of the
firms with Strategic Alliances. Working Paper. ISCTE - IUL Business School
DeAngelo, L. (1981) Auditor Size and Audit Quality, Jornal of Accounting and
Economics, 3, pp. 183-199
Dechow, P.M., Sloan, R.G and Sweeney, A.P. (1995) Detecting earnings management.
The Accounting Review, 70(2), pp. 193-225
Dumontier, P e Raffounier, B (1998) Why Firms comply Voluntary with IAS: an
empirical analysis with Swiss data. Journal of Accounting Financial Management
and Accounting, 9 (3), 216-245.
Dichev, I. E Skinner, J (2002) Large-Sample evidence on the debt covenant
hypothesis. Jornal of accounting Research, 40 (4), 1091-1123.
García Benau, M. e Zório, A. (2002) Características de las Empresas Europeas que
Aplican las Normas del IASB: Evidencia Empírica de Cara al Debate Regulador
en la Nueva Fase de Armonización Contable. Revista Española de Financiación
y Contabilidad, XXXI (111), enero-marzo 2002, 75-110.

Glaum, M., Kaiser, S. and Lindemann, J. (2008) Earning smoothing via provisions:
IFRS vs. German GAAP. Working Paper. ISCTE - IUL Business School
Hail, L., Leuz, C and Wysocki, P. (2009) Global Accounting Convergence and the
Potential Adoption of IFRS by the United States: An Analysis of Economic and
Policy Factors. Em http://papers.ssrn.com/abstract=1357331.pdf (07/06/2009)
Hung, M. and Subramanyam, K. R. (2007) Financial statement effects of adopting
International Accounting Standards: the case of Germany, Review of Accounting
Studies, 12(4), pp. 623–657.
Jones, J. (1991) Earnings management during import relief investigations, Journal of
Accounting Research, 29(2), pp. 193–228.
Lang, M., Raedy, J and Yetman, M. (2003) How representative are firms that are cross-
listed in the United States? An analysis of accounting quality. Journal of
Accounting Research, 41(2), pp. 363–386.
Lang, M., Raedy, J. S. and Wilson, W. (2006) Earnings management and cross listing:
are reconciled earnings comparable to US earnings?, Journal of Accounting and
Economics, 42(1/2), pp. 255–283.
Leuz, C. and Verrecchia, R. (2000) The economic consequences of increased
disclosure. Journal of Accounting Research, 38(Supplement), pp. 91–124.
Leuz, C. (2003) IAS versus US GAAP: information-asymmetry based evidence from
Germany’s New Market. Journal of Accounting Research, 41(3), pp. 445–472.

Leuz, C. and Wysocki, P. (2008) Economic Consequences of Financial Reporting and
Disclosure Regulation: A Review and Suggestions for Future Research. Em
http://papers.ssrn.com/abstract=1105398.pdf (07/06/2009)
Soderstrom, N. and Sun, K. (2007) IFRS adoption ans accounting quality: a review,
European Accounting Review, 16(4), pp. 675–702.
van Tendeloo, B. and Vanstraelen, A. (2005) Earnings management under German
GAAP versus IFRS, European Accounting Review, 14(1), pp. 155–180.
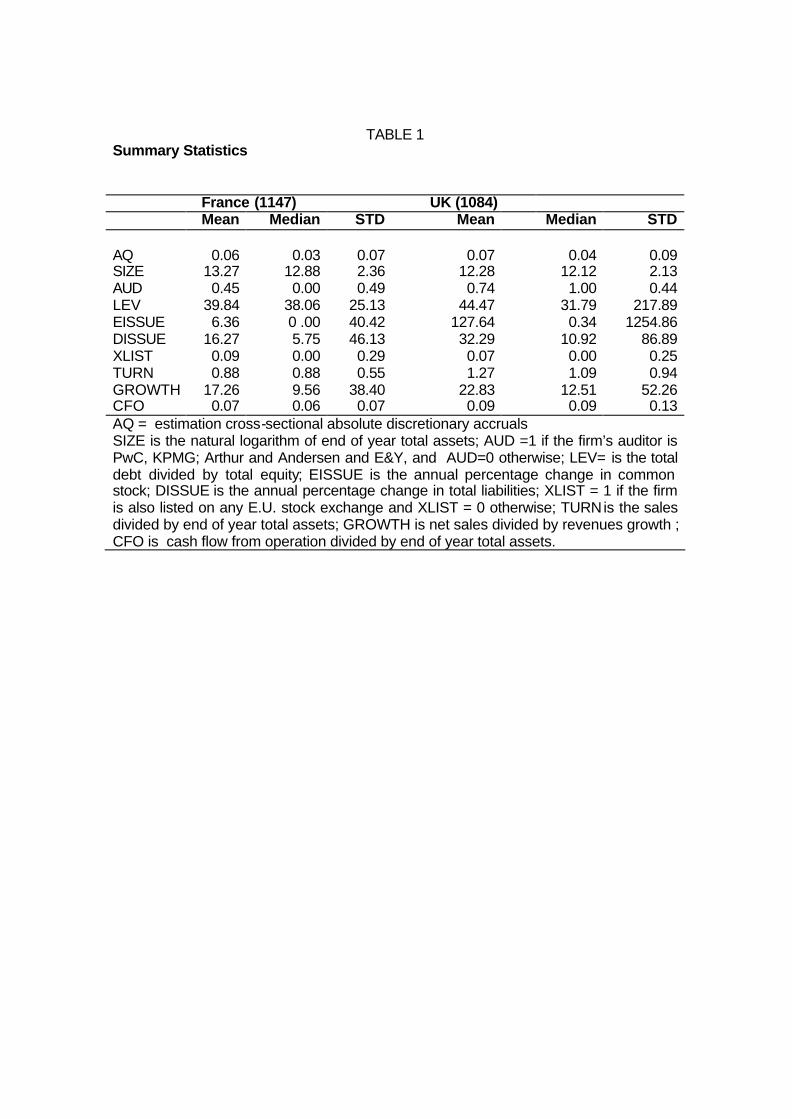
TABLE 1 Summary Statistics
France (1147) UK (1084) Mean Median STD Mean Median STD AQ SIZE AUD LEV EISSUE DISSUE XLIST TURN GROWTH CFO
0.06
13.27 0.45
39.84 6.36
16.27 0.09 0.88
17.26 0.07
0.03
12.88 0.00
38.06 0 .00 5.75 0.00 0.88 9.56 0.06
0.07 2.36 0.49
25.13 40.42 46.13 0.29 0.55
38.40 0.07
0.07
12.28 0.74
44.47 127.64 32.29 0.07 1.27
22.83 0.09
0.04
12.12 1.00
31.79 0.34
10.92 0.00 1.09
12.51 0.09
0.09 2.13 0.44
217.89 1254.86
86.89 0.25 0.94
52.26 0.13
AQ = estimation cross-sectional absolute discretionary accruals SIZE is the natural logarithm of end of year total assets; AUD =1 if the firm’s auditor is PwC, KPMG; Arthur and Andersen and E&Y, and AUD=0 otherwise; LEV= is the total debt divided by total equity; EISSUE is the annual percentage change in common stock; DISSUE is the annual percentage change in total liabilities; XLIST = 1 if the firm is also listed on any E.U. stock exchange and XLIST = 0 otherwise; TURN is the sales divided by end of year total assets; GROWTH is net sales divided by revenues growth ; CFO is cash flow from operation divided by end of year total assets.

TABLE 2
Regression Results of IFRS Adoption on Cross-Sectional Absolute Discretionary Accruals for France
0 1 , 2 , 3 , 4 , 5 , 6 , 7 , 8 , 9 , 10 ,i t i t i t i t i t i t i t i t i t i t tAQ SIZE AUD LEV EISSUE DISSUE XLIST TURN GROWTH CFO INDUSTRYβ β β β β β β β β β β ε= + + + + + + + + + + +
Pr C1 C2 C3 C4 C5 C6 C7 C8 C9 C10 C11 C12 C13 C14 C15 C16 C17 C18 C19 Intercept SIZE AUD LEV EISSUE DISSUE XLIST TURN GROWTH CFO Mining Construction Manufacturing Utilities Retail Trade Finance, Ins. Services
- - + + - + + - - ?
0.151***
-0.008***
0.001
-0.000
0.000
0.000***
0.011*
-0.013**
0.000
0.028
0.027***
0.000
0.018**
0.020**
0.024***
0.019**
0.022**
0.049***
-0.008*
-0.000
0.000
0.000**
0.003 -0.004 0.000
-0.007
0.023**
-0.004
0.015*
0.011
0.021**
0.009 0.028***
0.149***
-0.008***
0.000
0.000
0.000***
0.011*
-0.013**
0.000
0.029
0.028***
0.000
0.018**
0.020*
0.024**
0.019**
0.022**
0.151***
-0.008***
0.001
0.000
0.000***
0.012**
-0.013**
0.000
0.025
0.028**
0.000
0.018**
0.020**
0.024**
0.019**
0.022**
0.150***
-0.008***
0.001
0.000
0.000**
0.011**
-0.013**
0.000
0.028
0.028**
0.000
0.018**
0.020**
0.024**
0.019**
0.022**
0.157***
-0.008***
0.001
0.000
0.000
0.011*
-0.014**
0.000
0.030
0.027**
-0.001
0.014**
0.018*
0.021**
0.020**
0.020**
0.150***
-0.008***
0.001
0.000
0.000 0.000***
-0.001**
0.000
0.029
0.028**
-0.000
0.016**
0.018*
0.022**
0.017*
0.022**
0.127***
-0.007***
0.002
0.000
0.000 0.000***
0.012*
0.000
0.011
0.029**
0.003
0.020**
0.026**
0.022**
0.030***
0.025**
0.151***
-0.008***
0.001
0.000
0.000 0.000***
0.011*
-0.013**
0.029
0.028**
0.000
0.018**
0.020**
0.024**
0.020**
0.023**
0.151***
-0.008***
0.002
0.000
0.000 0.000***
0.012*
-0.013**
0.000
0.029**
0.001
0.018**
0.021**
0.024**
0.019**
0.023**
0.143***
-0.07***
0.058***
-0.007*
0.060***
-0.000
0.054***
0.000
0.049***
0.000***
0.055***
0.000
0.058***
-0.003
0.051***
0.000**
0.055*
**
-0.003
R2
N 0.12
1147
0.074
0.12
0.12
0.12
0.08
0.12
0.12 0.12 0.12 0.05 0.002 0.002 0.004 0.044 0.000 0.000 0.010 0.000
AQ= regression estimation cross-sectional absolute discretionary accruals SIZE is the natural logarithm of end of year total assets; AUD =1 if the firm’s auditor is PwC, KPMG; Arthur and Andersen and E&Y, and AUD=0 otherwise; LEV= is the total debt divided by total equity; EISSUE is the annual percentage change in common stock; DISSUE is the annual percentage change in total liabilities; XLIST = 1 if the firm is also listed on any E.U. stock exchange and XLIST = 0 otherwise; TURN is the sales divided by end of year total assets; GROWTH is net sales divided by revenues growth ; CFO is cash flow from operation divided by end of year total assets. *, **, *** , Signi ficant at 0.10, 0.05 and 0.01 level, respectively (two-tailed).
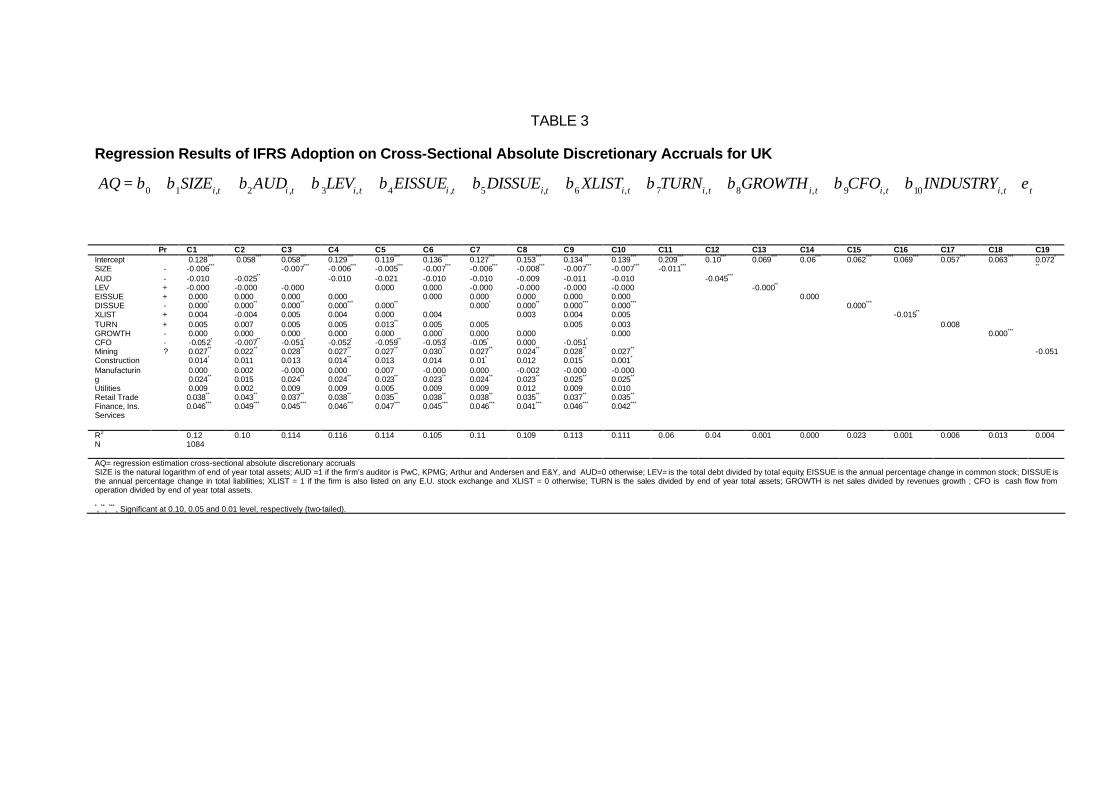
TABLE 3 Regression Results of IFRS Adoption on Cross-Sectional Absolute Discretionary Accruals for UK
0 1 , 2 , 3 , 4 , 5 , 6 , 7 , 8 , 9 , 10 ,i t i t i t i t i t i t i t i t i t i t tAQ SIZE AUD LEV EISSUE DISSUE XLIST TURN GROWTH CFO INDUSTRYβ β β β β β β β β β β ε= + + + + + + + + + + +
Pr C1 C2 C3 C4 C5 C6 C7 C8 C9 C10 C11 C12 C13 C14 C15 C16 C17 C18 C19 Intercept SIZE AUD LEV EISSUE DISSUE XLIST TURN GROWTH CFO Mining Construction Manufacturing Utilities Retail Trade Finance, Ins. Services
- - + + - + + - - ?
0.128***
-0.006***
-0.010
-0.000
0.000
0.000*
0.004
0.005
0.000
-0.052*
0.027**
0.014*
0.000
0.024**
0.009
0.038**
0.046***
0.058***
-0.025**
-0.000
0.000
0.000**
-0.004 0.007 0.000
-0.007**
0.022**
0.011
0.002
0.015
0.002
0.043**
0.049***
0.058***
-0.007***
-0.000
0.000
0.000**
0.005
0.005
0.000
-0.051*
0.028**
0.013
-0.000
0.024**
0.009
0.037**
0.045***
0.129***
-0.006***
-0.010
0.000
0.000***
0.004
0.005
0.000
-0.052*
0.027**
0.014**
0.000
0.024**
0.009
0.038**
0.046***
0.119***
-0.005***
-0.021
0.000
0.000**
0.000
0.013**
0.000
-0.059**
0.027**
0.013
0.007
0.023**
0.005
0.035**
0.047***
0.136***
-0.007***
-0.010
0.000
0.000
0.004
0.005
0.000*
-0.053*
0.030**
0.014
-0.000
0.023**
0.009
0.038**
0.045***
0.127***
-0.006***
-0.010
-0.000
0.000 0.000*
0.005
0.000
-0.05*
0.027**
0.01*
0.000
0.024**
0.009
0.038**
0.046***
0.153***
-0.008***
-0.009
-0.000
0.000 0.000**
0.003
0.000
0.000
0.024**
0.012
-0.002
0.023**
0.012
0.035**
0.041***
0.134***
-0.007***
-0.011
-0.000
0.000 0.000***
0.004
0.005
-0.051*
0.028**
0.015*
-0.000
0.025**
0.009
0.037**
0.046***
0.139***
-0.007***
-0.010
-0.000
0.000 0.000***
0.005
0.003
0.000
0.027**
0.001*
-0.000
0.025**
0.010
0.035**
0.042***
0.209***
-0.011***
0.10***
-0.045***
0.069***
-0.000**
0.06***
0.000
0.062***
0.000***
0.069***
-0.015**
0.057***
0.008
0.063***
0.000***
0.072*
**
-0.051
R2
N 0.12
1084
0.10
0.114
0.116
0.114
0.105
0.11
0.109 0.113 0.111 0.06 0.04 0.001 0.000 0.023 0.001 0.006 0.013 0.004
AQ= regression estimation cross-sectional absolute discretionary accruals SIZE is the natural logarithm of end of year total assets; AUD =1 if the firm’s auditor is PwC, KPMG; Arthur and Andersen and E&Y, and AUD=0 otherwise; LEV= is the total debt divided by total equity; EISSUE is the annual percentage change in common stock; DISSUE is the annual percentage change in total liabilities; XLIST = 1 if the firm is also listed on any E.U. stock exchange and XLIST = 0 otherwise; TURN is the sales divided by end of year total assets; GROWTH is net sales divided by revenues growth ; CFO is cash flow from operation divided by end of year total assets. *, **, *** , Significant at 0.10, 0.05 and 0.01 level, respectively (two-tailed).
