a study on determinants of dividend policy: empirical evidence
TRANSCRIPT

www.pbr.co.in
A Study on Determinants of Dividend Policy: Empirical Evidence
from FMCG Sector in India
Pacific Business Review InternationalVolume 1, Issue 1, June 2016
135
Abstract
The objective of this paper is to analyse the determinants of dividend policy (DP) of FMCG sector in India. FMCG companies included in CNX FMCG the sectoral index for NSE are 15. Only 12 companies have been taken for the study. The period of study has been considered for 10 years i.e. from 2003-04 to 2012-13.The present paper is an attempt to empirically analyze the determinants of DP of FMCG Sector in India. For this purpose, various factors affecting DP such as dividend payout ratio (DPR), debt equity ratio (DER), earnings (ERN), corporate tax (CT), earnings per share (EPS) and firm size(FS) are considered for analysis. The empirical evidence from the study reveals that DPR, DER,ERN,CT has significant impact on EPS and also good predictors of dividend payout in FMCG sector.Ordinary least square models(OLS) are used to estimate the impact of DER, DPR, ERN, FS, EPS and on the DP. The DP of overall FMCG sector is strongly influenced by DPR, DER, EPS, and CT, which reveals that the DP of FMCG sector is significantly influenced by the selected financial variables during the period of the study.The overall regression analysis shows that the determinants of DP is significantly and positively influenced by the DPR, DER and EPS
Key words: Dividend per share (DPS), Dividend policy (DP), Debt equity ratio (DER), Earnings (ERN), Earnings per share (EPS)
Introduction
Dividend policy (DP) is considered as one of the three major decisions of financial management. The decision of the firm regarding how much earnings could be paid out as dividend and how much could be retained by the firm is the concern of DP. The DP determines what proportion of earnings is paid out to shareholders by way of dividends and what proportion is ploughed back in the firm itself for reinvestment purposes. The development of such a policy will be greatly influenced by investment opportunities available to the firm and the value of dividends as against capital gains to the shareholders. Each firm should develop such a DP, which divides the net earnings into dividends and retained earnings in an optimum way to achieve the objective of maximizing the wealth of the shareholders.
FMCG (Fast Moving Consumer Goods) are those goods and products, which are non durable,mass consumption products, available off the shelf. FMCG industry has played a major role in the Indian economy during the last few years and it is registering an uptrend in growth.
Dr. N. S. PandeyAssistant Professor (Selection Grade),
Department of Commerce,
Kanchi Mamunivar Centre for P G Studies,
Pondicherry Central University
Puducherry, India.
Ashvini. NM.Phil. Research Scholar
Department of Commerce,
Kanchi Mamunivar Centre for P G Studies,
Pondicherry Central University
Puducherry, India.
Finance section
www.pbr.co.inwww.pbr.co.in
Pacific Business Review International
136
FMCG stocks are known as “dividend yield” stocks.FMCG companies are consistent dividend payers. According to CII-A T Kearney report, FMCG industry will grow at a compounded growth rate of 9 percent to reach a size 156 of 1, 43,000 crores by 2010 from present level of Rs. 93000 crores under favourable conditions. This growth can be attributed to improved performance of companies like Hindustan unilever limited(HUL), Dabur India, and Nestle India.
Fast-moving consumer goods are (FMCGs) are typically high-volume, low-value items with high public visibility and short life span, such as food, drink, confectionery, toiletries, and household goods. As the name would imply, it is one of the fastest growing sectors in the UK economy and is a multi-million pound industry. It encompasses a huge range of products and services in manufacturing, distribution and retailing.
The Indian FMCG sector is the fourth largest in the economy and has a market size of US$13.1 billion. Well-established distribution networks, as well as intense competition between the organised and unorganised segments are the characteristics of this sector. FMCG in India has a strong and competitive MNC presence across the entire value chain. It has been predicted that the FMCG market will reach to US$ 33.4 billion in 2015 from US $ billion 11.6 in 2003.16 The middle class and the rural segments of the Indian population are the most promising market for FMCG, and give brand makers the opportunity to convert them to branded products. Most of the product categories like jams, toothpaste, skin care, shampoos, etc, in India, have low per capita consumption as well as low penetration level, but the potential for growth is huge.
Review of Literature
Alzomania and Alkhadiri (2013) examined “The Factors Determining Dividend Policy represented by dividend per share for firms in the Saudi Arabia Stock Exchanges”. They used regression model and used a panel data covering the period during 2004-2010 for 105 non-financial firms listed in the stock market. The results consistently supported that Saudi Arabia non-financial firms rely on current earning per share and past dividend per share of the firm to set their dividend payments
Ranti (2013) “Determinants of Dividend Policy”: A study of selected listed Firms in Nigeria, this study investigated the determinants of dividends policy in the Nigerian Stock Exchange market. The paper was basically modeled to examine the effects of financial performance of firms, firm size, financial leverage and board independence on the dividend payout decisions of listed firms operating in the Nigerian Stock Exchange market using the regression analysis method. The study in its findings observed that there is a significant positive relationship between firms'
financial performance, size of firms and board independence on the dividend payouts decisions of listed firms in Nigeria.
Mistry, (2011) attempted to ascertain the influence of “ The Factors Affecting Dividend Decision of Indian Cement Industry” for a period from 2004-05 to 2008-09 based on secondary data of 28 out of 36 listed public firms listed in NSE. The study found that significant increase in the selected factors influence the dividend decision rather than the factors which has resulted marginal or moderate increase. The study also found that the change in total assets(TA) and profitability affects dividend decision positively while change in liquidity, inventory turnover ratio, retained .
Michaely, (2011) stuided “Corporate Dividend Policies”: Lessons From Private Firms The study compare the dividend policies of publicly and privately held firms in order to help identify the forces shaping corporate dividends, and shed light on the behaviour of privately held companies. It show that private firms smooth dividends significantly less than their public counterparts, suggesting that the scrutiny of public capital markets plays a central role in the propensity of firms to smooth dividends over time. Public firms pay relatively higher dividends that tend to be more sensitive to changes in investment opportunities than otherwise similar private firms. Ultimately, ownership structure and incentives play key roles in shaping dividend policies.
Gupta, (2010) found “The Determinants of Corporate Dividend Policy” The present study re-examines various factors that have a bearing on the dividend decision of a firm the sample size of the study is 150 companies from 16 industries the study period is January 2001 to December 2007 the tools used for analysis is a two-step multivariate procedure. First factor analysis is performed on the data to extract prominent factors from various variables and then multiple regression has been conducted on such factors. Results of factor analysis indicate that leverage, liquidity, profitability, growth and ownership structure are the major factors.Regression on these factors shows leverage and liquidity to be the determinants of the dividend policy for Indian Companies.
Tsuji, (2010) examined“What Are The Determinants Of Dividend Policy?” The Case of the Japanese Electrical Appliances Industry. This paper explores the determinants of the dividend policy of firms in the Japanese Electrical Appliances Industry. Empirical investigations reveal that in this industry, corporate managers do not cater to investors' demands in both their dividend initiation and continuation decisions. All data in this study are from QUICK Corporation . Our full sample period is from 1986 to 2006. This paper finds relations between corporate earnings and
Finance section

137www.pbr.co.in
Volume 1, Issue 1, June 2016
firm dividend payments in general. However, on an aggregate time-series basis, dividend payments tend to decrease company earnings in the Japanese Electrical Appliances industry, and this means rejection of the traditional signaling hypothesis.
Okpara, (2010) investigated “The Relationship Between Asymmetric Information and DP” in Nigeria. The data were sourced from the published data of the Nigerian Securities and Exchange Commission. To carry out research work, the researcher employed the Unit Root Test, Dickey Fuller Test, Johansen Co-integration and Vector Errorcorrection Model to ascertain the long run relationship between variables. Granger Causality Tests suggested that DP has casual impact on information asymmetry without a reverse or feedback effect. The study investigated the long run effect of the dichotomy of information on DP and found that DP is a positive and significant function of information asymmetry.
Al-kuwari, (2009) Investgate “The determinants of dividend policy for the firms listed on Gulf Co-operations Counicl (GCC)” country Stock Exchange. This study used a panel data consisting of non financial firms listed in GCC Country Stock Exchanges between the years 1999-2003. The result suggested that the main characteristics of firm dividend payout policy where that dividend payment related strong and dierctly to goverment owenership ,firm size and profitablity but negatively to the leverage ratio.
Pal and Goyal, (2007) suggested.s.”Leading Determinants of Dividend Policy”: A case Study of the Indian Banking Industry The present paper is an attempt to understand the banking dividend decisions in a competitive global economy. Dividend decisions may enhance the market value of the firm but on the other hand it may mean less availability of internal funds and more dependence on external sources and expansion purposes. Furthermore, while determining dividend payment, a prudent management strikes a balance between shareholder's expectation and firm's long term interest. Such analysis is of great relevance from the policy standpoint, because as the dividend literature suggests, if these decisions are handled efficiently, this is expected to be reflected in value of the firms. More importantly, such analysis is useful in enabling policymakers to identify the success or failure of policy initiatives or, alternatively, highlight different strategies undertaken by banking firms, which contribute to their successes.
Reddy, (2002) “Dividend Policy Of Indian Corporate Firms” The present study examines the dividend behaviour of Indian corporate firms over the period 1990-01 and attempts to explain the observed behavior with the help of trade-off theory, and signaling hypothesis. Analysis of dividend trends for a large sample of stocks traded on the NSE and BSE indicate that the percentage of companies paying dividends has declined from 60.5 per cent in 1990 to 32.1 percent in 2001 and that only a few firms have
consistently paid the same levels of dividends. Further, narrower indices appear to have higher dividends compared to that of broader indices. Industry trends indicate that firms in the electricity, mining and diversified industries have paid higher dividends where as textile companies have paid less dividends.
Objectives and Hypotheses Development of the Study
The main objective of the study is to empirically analyze the dynamics and determinants of dividend policy. The following are the specific objectives of the paper:
To analyse the determinants of DP of FMCG sector in India.
To analyse the variation in the impact of, DER, FS, DPR, ERN, CT, EPS and on the DP of FMCG sector in India.
Hypotheses
H01: “There is no significant impact of Earnings on DP of FMCG sector in India”
H02 “ There is no significant impact on Debt equity ratio on DP of FMCG sector in India”
Ho3: “ There is no significant impact on Corporate tax on DP of FMCG sector in India”
Ho4: “There is no significant impact on Firm size on DP on FMCG sector in India”
Research Methodology
Data source
The study is analytical and empirical in nature and is based on secondary data. For the present study, a sample of 12 FMCG firms listed in NSE sectoral index has been selected using multi stage sampling.The period of study is 10 years i.e. From 2003-04 to 2012-13. The data have been collected from money control website. For the analysis,descriptive statistics, correlation and regression are used.
Research Methods
To achieve the aforementioned research objectives, data for the study are collected from the annual reports of the FMCG firms concerned. The annual data for selected FMCG firms during 2003-04-2012-13 are used for calculating key financial ratios to analyse the determinants of DP.
General Form of the Regression Model
Earnings Per Share (EPS) ,Return on Equit y(ROE) Debt Equity Ratio (DER) ,Earnings (ERN), Dividend Payout Ratio (DPR).Financial Leverage(FL) .Corporate Tax(CT)
Sources of data
Data have been collected from the money control and NSE
Finance section

www.pbr.co.in138
Pacific Business Review International
website. The financial statements like, Profit and Loss Account, and Balance Sheet of selected companies are collected from the money control and websites of various FMCG firms.
Sampling technique
The study used multistage sampling technique to select sample units for the study. Out of 33 listed firms in NSE sectoral index companies 15 firms were selected based on the availability of data.Based on full-fledged data, 12 firms only have been selected for the study based on the data availability in the data source concerned.
List of Measures (ratios) Used in the Study for Analysis:
Dividend Payout Ratio:(DPR)
It Measures the percentage of a company's net income that is given to shareholders in the form of dividends. The payout ratio gives an idea to the investors about the dividend payments of the comapny. More mature companies tend to have a higher payout ratio.
The formula for calculating dividend payout ratio is
Dpr=dividend/net Income
Debt-equity Ratio (DER)
It is a measure of the relative contribution of the creditors and shareholders or owners in the capital employed in business. Simply stated, ratio of the total long term debt and equity capital in the business is called the debt-equity ratio. This financial tool gives an idea of how much borrowed capital (debt) can be fulfilled in the event of liquidation using shareholder contributions. It is used for the assessment of financial leverage and soundness of a firm and is typically calculated using previous fiscal year's data.A low debt-
equity ratio is favorable from investment viewpoint as it is less risky in times of increasing interest rates. It therefore attracts additional capital for further investment and expansion of the business. It can be calculated using a simple formula:
Der=total Liablity/shareholders Fund
Earnings:(ERN)
The amount of profit that a company produces during a specific period, which is usually defined as a quarter (three calendar months) or a year. Earnings typically refer to after-tax net income. Ultimately, a business's earnings are the main determinant of its share price, because earnings and the circumstances relating to them can indicate whether the business will be profitable and successful in the long run. The formula for calculating earnings is as follows
Earnings= Earnings Before Interest and Tax / Total Assest
Corporate Tax:(CT)
A levy placed on the profit of a firm, with different rates used for different levels of profits. Corporate taxes are taxes against profits earned by businesses during a given taxable period.
The formula for calculating corporate tax is as follows.
Corporate Tax=tax/ Profit Before Tax
Firm Size (FS):
It is determined by taking natural logrithm for total assest of company
Analysis and discussion
Descriptive analysis
Finance section

139www.pbr.co.in
Volume 1, Issue 1, June 2016
Table 1 shows the descriptive statistics of the variables used in the regression model. This shows the average indicators of variables computed from the financial statements.The average dividend payout ratio is 5.87 per cent this means on an average the firm pays about 6 per cent of their profit as dividend.
The average corporate tax 8.87 per cent is worth consideration in the sense that from the surplus income over the expenditure first of all the contractual payments in the form of interst is to be made. From those net earnings the govermental claim in the form of tax is to be paid. After the payment of tax only the dividend can be paid when the company pay huge amount of tax it indicates that there will be a deducation in the amount avaiable for dividend payment.but at the same time higher tax payment means higher earnings too.Higher earnings normally means higher capacity to pay dividend given the liquidity position of the
firm. Hence it is worthwhile to study the relationship between the current tax rate & current dividend payment.
The average debt to equity is 30.03 per cent which reflects that the firm are paying moderate level of dividend.The average & maximum of earnings per share is 16.68 per cent & 46.75 respectively which reflects the FMCG firms are in fair position in earnings during the period of study.The maximum earnings in the industry amounts to Rs. 16,867 crores where as the minimum earnings during the period under study was Rs .796.49 crores which shows a flucation in the indusrtrial earnings with the standard deviation of Rs .5835 crores. When there is a flucation in the earnings it will have a impact on the dividend policy.The average firm size of the industry is 3.05 with the standard deviation of 0.464 which indicates that the firm in the industry are almost same assest size.
Correlation Analysis
Pearson's correlation analysis is used to study the relationship between predictor variables and responding variable, and the relationship between ERN and EPS (0.538); CT and EPS (0.048); ERN and EPS (0.027) is highly significant positively at 5 per cent level; whereas the relationship between EPS and CT (0.076); is significant positively at 10 per cent level.
Regression Analysis
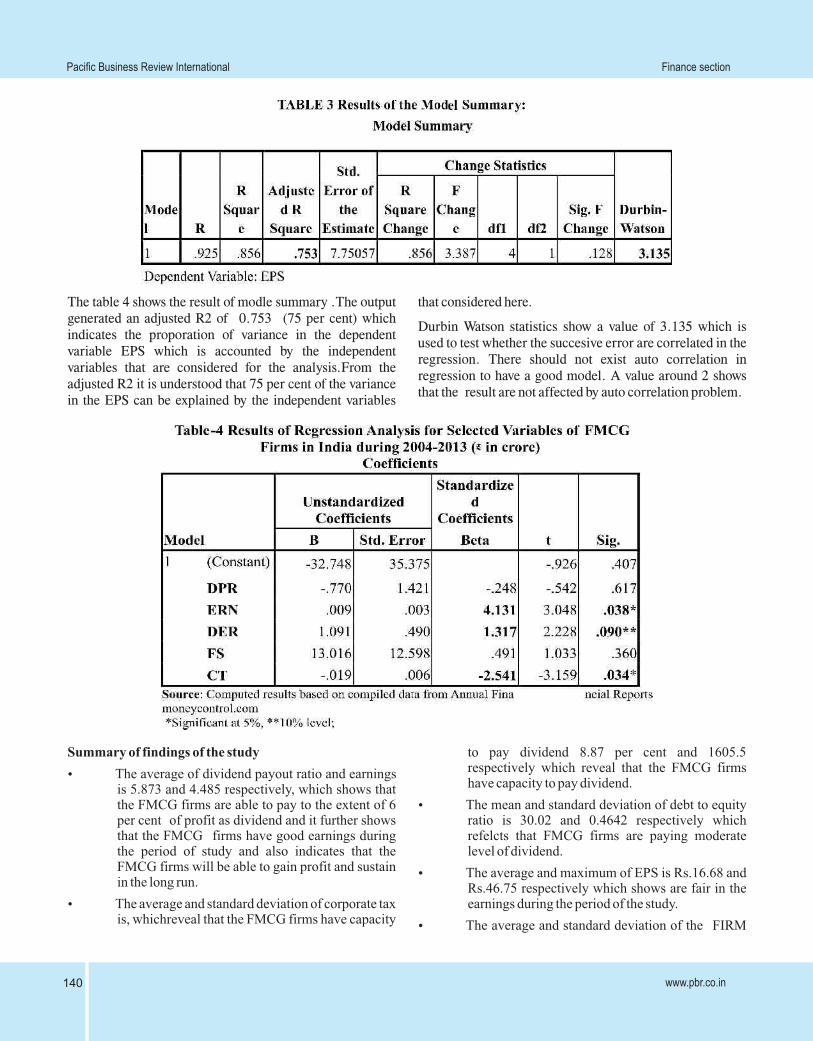
The table 3 shows that earnings are having the significant positve coefficent of (4.131) on EPS in FMCG industry. So It is rejected at 5 per cent level.DER also shows a significant
positve relationship with DP with β (1.317) at 10 per cent
level of significance.1 unit change in DER will result in 1.317 unit change in EPS. there is no significant impact of DER on EPS so it is rejected at 10 per cent level of significance.The corporate tax shows the significant negative co-effecient with EPS (-2.541) . It indicates that a unit of change in corporate tax leads to -2.541 unit change in EPS. This clearly shows that the corporate tax will have neagtive impact on DP of the firms in the FMCG industry.There is no significant impact on corporate tax on DP. So it is rejected at 5 per cent level of significant.The firm size does not show any significant relationship with EPS. So it is accepted as it does not show any significant relationship.
Finance section
www.pbr.co.in140
Pacific Business Review International
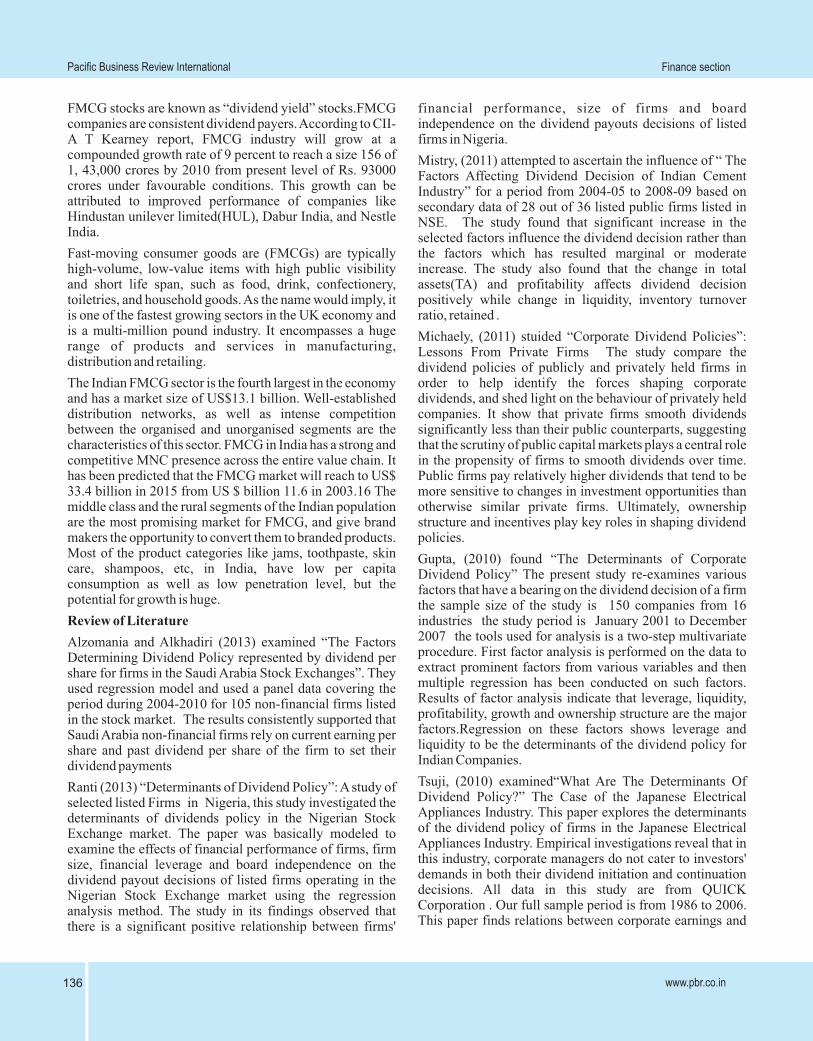
The table 4 shows the result of modle summary .The output generated an adjusted R2 of 0.753 (75 per cent) which indicates the proporation of variance in the dependent variable EPS which is accounted by the independent variables that are considered for the analysis.From the adjusted R2 it is understood that 75 per cent of the variance in the EPS can be explained by the independent variables
that considered here.
Durbin Watson statistics show a value of 3.135 which is used to test whether the succesive error are correlated in the regression. There should not exist auto correlation in regression to have a good model. A value around 2 shows that the result are not affected by auto correlation problem.
Summary of findings of the study
The average of dividend payout ratio and earnings is 5.873 and 4.485 respectively, which shows that the FMCG firms are able to pay to the extent of 6 per cent of profit as dividend and it further shows that the FMCG firms have good earnings during the period of study and also indicates that the FMCG firms will be able to gain profit and sustain in the long run.
The average and standard deviation of corporate tax is, whichreveal that the FMCG firms have capacity
to pay dividend 8.87 per cent and 1605.5 respectively which reveal that the FMCG firms have capacity to pay dividend.
The mean and standard deviation of debt to equity ratio is 30.02 and 0.4642 respectively which refelcts that FMCG firms are paying moderate level of dividend.
The average and maximum of EPS is Rs.16.68 and Rs.46.75 respectively which shows are fair in the earnings during the period of the study.
The average and standard deviation of the FIRM
Finance section

141www.pbr.co.in
Volume 1, Issue 1, June 2016
SIZE in the industry is 3.05 and 0.464 respectively indicates that the firms in FMCG which considered for the study are of same in the asset size.
The relationship between ERN and EPS (-0.538) is highly significant negatively at 1 per cent level
CT and EPS (0.048); is highly significant positively at 1 per cent level.
DER has significant positive co-efficient (0.27) on EPS of the FMCG firms in India during the study period.
CT has significant negative co-efficient (-2.541) on EPS of FMCG firms in India during the study period.
Conclusion:
The importance of the study may be viewed from its contribution to fill an important gap in literature. That is, findings of the study can add to the existing body of literature, and can serve as a starting point on which future studies can be done .
On the practical dimension, the study may help firms to focus on the major factors which will have impact on DP. Such information should help the FMCG firms in creating appropriate strategies to improve the dividend payment and firm's performance.The regression analysis used in the study to estimate the impact of predictor variables on the responding variable shows that DER has significant positive co-efficient (1.317) on EPS and DER has significant positive co-efficient (0.008) on DPR at 1 per cent level for the FMCG firms in India during the study period.This is corroborated with the correlation analysis, which shows the existence of positive relationship between the EPS and DER.The relationship between EPS and ERN (-0.538) is highly significant however, negatively at 1 per cent level, which reveals that the selected FMCG firms have smooth dividend payout pattern during the study period. It represents that the firm'searnings have grown up and the shareholders also benefited highly. Moreover, greater profitability enabled the firms to easily afford to a higher amount of dividend payouts, which does not disturb its financial needs. Dividend per share is also a positive function of profitability of FMCG firms,which implies that the firms announce more cash dividend as their net income boost up.Last, but not the least, managers' awareness on adopted dividend policies is very important for investors, because they will also suffer in respect substantial costs to obtain information in this regard. Dividend payment to common shareholders is one of the ways that a firm directly affects shareholders' wealth.
Limitations and Scope for Further Studies
The study is based on secondary data collected from the
money control data source, and websites of various firms concerned. Therefore, the quality of the study depends upon the accuracy, reliability, and quality of secondary data source.
In the study, a sample of 12 FMCG firms has been considered for analyzing the “Determinants of dividend policy”. In future, researchers can consider inclusion of more firms to take up a study with large sample units to explore more possible results. In the study, basic financial ratios, correlation, and regression are only used for analysis, therefore inclusion of some or more predictor variables may change the result of determinants of dividend policy of the FMCG firms in India.
References
Al-kuwari (2009) “Investgate the Determinants of Dividend Policy for the Firms listed on Gulf Co-operations Counicl (GCC)” The Journal of Finance and Quantitative Analysis. 8(1):47-59.
Alzomania, T.and A.Al-Khadiri. (2013) “Determination of Dividend Policy: The evidence from Saudi Arabia” International Journal of Business and Social Science 4(1) :181-92.
Gupta, Banga(2010) “The Determinants of Corporate Dividend Policy” Decision.37( 2) 56-79.
Michaely, R. Roberts (2012) “Corporate Dividend Policies: Lessons from Private Firms” The Review of Financial Studies 25 (3): 95-153.
Mistry, D. (2011)”Factors Affecting Dividend Decision of Indian Cement Industry” Management Insight 7(1): 22-30.
Okpara, G. C. (2010) “Asymmetric Information and Dividend Policy in Emerging Markets: Empirical evidence from Nigeria” International Journal of Economics and Finance 2(4): 212-17.
Pal and Goyal (2007) “Leading Determinants of Dividend Policy” e.Academic Journals 34(2): 65-89.
Ranti (2013) “Determinants of Dividend Policy” International Journal of Business and Social Science 7(17) :107-119.
Reddy (2002) “Dividend Policy of Indian Corporate Firms” Journal of Financial and Strategic Decisions. 10(2):56-96.
Tsuji (2010) “What Are The Determinants Of Dividend Policy” .Business and Economics Journal, 9(5):188-500.
Finance section