designing roads that guide drivers to choose safer speeds
TRANSCRIPT

DESIGNING ROADS THAT GUIDE DRIVERS TO CHOOSE SAFER SPEEDS
November 2009
John N. Ivan
Norman W. Garrick Gilbert Hanson
JHR 09-321 Project 04-6
This research was sponsored by the Joint Highway Research Advisory Council (JHRAC) of the University of Connecticut and the Connecticut Department of Transportation and was performed through the Connecticut Transportation Institute of the University of Connecticut. The contents of this report reflect the views of the authors who are responsible for the facts and accuracy of the data presented herein. The contents do not necessarily reflect the official views or policies of the University of Connecticut or the Connecticut Department of Transportation. This report does not constitute a standard, specification, or regulation.

(this page intentionally left blank to preserve page position for double-sided printing)
ii

Technical Report Documentation Page1. Report No. 2. Government Accession No. 3. Recipient’s Catalog No.
JHR 09-321 N/A 4. Title and Subtitle 5. Report Date
November 2009
6. Performing Organization Code
Designing Roads that Guide Drivers to Choose Safer Speeds
N/A
7. Author(s) 8. Performing Organization Report No.
John N. Ivan, Norman W. Garrick, Gilbert Hanson JHR 09-321 9. Performing Organization Name and Address 10. Work Unit No. (TRAIS)
N/A
11. Contract or Grant No.
University of Connecticut Connecticut Transportation Institute Storrs, CT 06269-5202
N/A 12. Sponsoring Agency Name and Address 13. Type of Report and Period Covered
Final
14. Sponsoring Agency Code
Connecticut Department of Transportation 280 West Street Rocky Hill, CT 06067-0207
N/A 15. Supplementary Notes
This study was conducted under the Connecticut Cooperative Highway Research Program (CCHRP, http://www.cti.uconn.edu/chwrp/index.php). 16. Abstract
This report describes an investigation into whether or not physical characteristics of the roadway and the roadside environment are associated with actual vehicle running speeds, and how actual vehicle running speeds are associated with the occurrence and severity of motor vehicle crashes in conjunction with other roadway and roadside characteristics. Actual vehicle running speeds were observed at about 300 locations in urban, suburban and rural areas across Connecticut, at locations without horizontal curves or traffic control devices. Only vehicles traveling through the section unimpeded either by leading or turning vehicles were observed in order to get true free flow traffic speeds. Roadway and roadside characteristics were observed, and statistical prediction models were estimated to learn more about how free flow vehicle speed, roadway and roadside characteristics and crash incidence and severity are related.
The factors associated with higher average running speeds are wide shoulders, large building setbacks and a residential location. The factors associated with lower average running speeds are on-street parking, sidewalks and a downtown or commercial location. These findings suggest that drivers slow down where the road feels “hemmed-in” or there is noticeable street activity, and they speed up where the road feels “wide open” or street activity is less noticeable. This finding is not surprising, but these relationships are quite strong in the observed data, and it is a useful result to isolate this short list of factors that are significantly correlated with actual vehicle running speeds.
These findings demonstrate that through careful, intentional selection of roadway and roadside design elements, it is possible to influence the running speed of traffic on a road. It appears that drivers indeed take cues from elements of the roadway and roadside environment to decide how fast to drive and these cues are independent of the posted speed limit and other considerations that might be important to the community for reducing speeds. So the good news is that it is possible to influence drivers’ choice of speed through design of roadway and roadside elements; but the bad news is that many existing roads cue drivers to travel much faster than the posted speed limit and the community would like. 17. Key Words 18. Distribution Statement
Free flow speed, running speed, observed speed, safety, crashes, traffic calming, two-lane roads
No restrictions. This document is available to the public through the National Technical Information Service Springfield, Virginia 22161
19. Security Classif. (of this report) 20. Security Classif. (of this page) 21. No. of Pages 22. Price Unclassified Unclassified 115 N/A
Form DOT F 1700.7 (8-72) Reproduction of completed page authorized
iii

iv iv

TABLE OF CONTENTS
TABLE OF CONTENTS.................................................................................................... v LIST OF FIGURES .......................................................................................................... vii LIST OF TABLES........................................................................................................... viii 1 INTRODUCTION ........................................................................................................... 1
1.1 Statement of Problem........................................................................................... 1 1.2 Objectives of Project ............................................................................................ 2 1.3 Scope of Report.................................................................................................... 3
2 PREVIOUS WORK......................................................................................................... 4 2.1 Speed and the Incidence of Crashes..................................................................... 4 2.2 Geometric Alignment and Vehicle Speed............................................................ 4 2.3 Cross-sectional Elements and Vehicle Speed ...................................................... 4 2.4 Roadside Environment and Vehicle Speed .......................................................... 5 2.5 Speed Limit and Vehicle Speed ........................................................................... 6 2.6 Road Markings and Vehicle Speed ...................................................................... 6 2.7 Land Use and Vehicle Speed ............................................................................... 7 2.8 Summary of Previous Research ........................................................................... 7
3 STUDY DESIGN AND DATA COLLECTION............................................................. 8 3.1 Site Selection........................................................................................................ 8 3.2 Geometric Measurement and Roadside Characteristics....................................... 8 3.3 Free flow Speed Measurement........................................................................... 10 3.4 Data Set Summary.............................................................................................. 11
4 PREDICTION OF RUNNING SPEED......................................................................... 17 4.1 Analysis Methodology ....................................................................................... 17 4.2 Streets Model...................................................................................................... 17 4.3 Highways Model ................................................................................................ 19 4.4 Summary of Speed Analysis .............................................................................. 21
5 ANALYSIS OF SPEED AND SAFETY....................................................................... 22 5.1 Speed and Safety Analysis Objectives ............................................................... 22 5.2 Crash Prediction Models .................................................................................... 22
5.2.1 Crash Prediction Methodology ................................................................... 22 5.2.2 Crash Prediction Results ............................................................................. 23
5.3 Severity Prediction Models ................................................................................ 26 5.3.1 Severity Prediction Methodology ............................................................... 26 5.3.2 Severity Prediction Model Selection .......................................................... 28 5.3.3 Severity Prediction Model Results.............................................................. 29
5.4 Summary of Safety Findings.............................................................................. 36 6 SUMMARY AND RECOMMENDATIONS................................................................ 37
6.1 Summary of Findings ......................................................................................... 37 6.2 Illustration of Findings ....................................................................................... 38
6.2.1 Building Setbacks ....................................................................................... 39 6.2.2 Sidewalks .................................................................................................... 40 6.2.3 On-Street Parking........................................................................................ 41
6.3 Conclusion and Recommendations .................................................................... 42

vi
REFERENCES ................................................................................................................. 44 APPENDIX A: OBSERVED DATA................................................................................ 47

vii
LIST OF FIGURES
Figure 5-1. Effects of Change in X on Predicted Probabilities ......................................... 28 Figure 5-2 . Predicted Severity Index y* Versus Mean Speed by Land Use Category .... 35 Figure 6-1. Comparison of Running Speed by Building Setback..................................... 39 Figure 6-2. Comparison of Running Speed by Presence of Sidewalk.............................. 40 Figure 6-3. Comparison of Running Speed by Presence of On-Street Parking................ 41

viii
LIST OF TABLES
Table 3-1. Variables and Categories................................................................................... 9 Table 3-2. Number of Site by Parking, Land Use Category and Road Type ................... 13 Table 3-3. Number of Sites by Road Type and Speed Limit............................................ 13 Table 3-4. Number of Sites by Road Type and Shoulder Width ...................................... 13 Table 3-5. Number of Sites by Road Type and Presence of Sidewalks ........................... 13 Table 3-6. Number of Sites by Road Type and Building Setback.................................... 13 Table 3-7. Number of Sites by Pavement Width and Posted Speed Limit ....................... 14 Table 3-8. Number of Sites by Presence of Parking and Sidewalks................................. 14 Table 3-9. Number of Sites by Presence of Parking and Building Setback ..................... 14 Table 3-10. Number of Sites by Land Use Type and Presence of Parking ...................... 14 Table 3-11. Number of Sites by Land Use Type and Presence of Sidewalks .................. 15 Table 3-12. Number of Sites by Presence of Sidewalk and Building Setback ................. 15 Table 3-13. Number of Sites by Land Use Type and Building Setback........................... 15 Table 3-14. Crashes by Road Type and Land Use Type .................................................. 16 Table 4-1. Analysis of Variance Results for the Streets Model........................................ 18 Table 4-2. Parameter Estimates for the Streets Model ..................................................... 18 Table 4-3. Analysis of Variance Results for the Highway Model.................................... 20 Table 4-4. Parameter Estimates for the Highway Model.................................................. 20 Table 5-1. Crash Prediction Models by Road Type.......................................................... 24 Table 5-2. Crash Count Models by Crash Severity .......................................................... 26 Table 5-3. Numerical Naming of Crash Severity Prediction Models............................... 29 Table 5-4. Fit Statistics: Severity Prediction Models with Mean Speed .......................... 31 Table 5-5. Fit Statistics: Severity Prediction Models with Speed Deviation.................... 32 Table 5-6. Parameter Estimates for Severity Prediction Model 3-2 ................................. 34 Table 5-7. Range of Mean Speed by Land Use Category................................................. 36 Table 6-1. Factors Significantly Associated with Average Running Speed..................... 37 Table 6-2. Recommended Design Parameters by Road Type .......................................... 42 Table 6-3. Expected Speeds on Streets by Land Use Type, Level of Parking and Posted Speed Limit....................................................................................................................... 43 Table 6-4. Expected Speeds on Highways in Rural Areas by Shoulder Width, Presence of Parking and Speed Limit (with Large Building Setbacks and no Sidewalks) .................. 43 Table 6-5. Expected Speeds on Highways in Suburban Commercial Areas by Shoulder Width, Level of Parking and Speed Limit (with Large Building Setbacks and no Sidewalks)......................................................................................................................... 43 Table A-1. Speed Characteristics...................................................................................... 48 Table A-2. Roadway Characteristics ................................................................................ 58 Table A-3. Roadside Characteristics................................................................................. 68 Table A-4. AADT by Year, 1996 to 2000 ........................................................................ 78 Table A-5. AADT by Year, 2001 to 2004 and Average................................................... 88 Table A-6. Crash Data ...................................................................................................... 98

1
1 INTRODUCTION
1.1 Statement of Problem Speeding is one of the major problems confronting traffic safety engineers. It is
estimated that about a third of all fatal crashes in the United States are speed related (NHTSA 2003). High speeds have been shown to be associated with higher risks of crash and increased injury severity on roadways (Kloeden et al. 1997, ETSC 1995). This is explained by the fact that higher speeds lessen the time available for drivers to make evasive maneuvers to avoid or respond to unexpected situations, such as other vehicles turning into or out of driveways or the sudden appearance of pedestrians (Kloeden et al. 1997). Many researchers believe that if drivers were to operate at an appropriate speed for a roadway in a given context, safety would improve significantly for all categories of road users.
However, very few North American studies have used actual vehicular speed observations in comparing the safety of multiple street and highway locations. A number of studies have focused on the effects of speed change on safety at a given location but these results are not generally transferable to other sites. Most multi-location safety studies have attempted to account for the effect of speed using the speed limit at each location, leading to spurious results due to the sometimes arbitrary and political nature of speed limit selection, and the fact that the actual speeds chosen by drivers traveling on many roads are much higher than the speed limit on the road (Fitzpatrick et al. 1995, Fitzpatrick et al. 2003).
Most road agencies attempt to achieve the right operating speed among drivers by imposing speed limits. Unfortunately several studies have shown that the speed limit is very much violated (Haglund and Aberg 2002), and at best, serves only as a guide to drivers. Due to limited resources and the vast extent of the road network, police enforcement of speed limits has had only minor success (Haas et al. 2003). Thus, there is a strong need to find other effective countermeasures to control speeds on roadways.
Why are there so many roads where a high proportion of drivers disregard the speed limit? One possible explanation is that drivers are coming to different conclusions than the applicable legal authorities about what is the “safe and reasonable” level of speed on these roads. In other words, is the design of the road and its environment projecting the right message to the driver? There are many examples of situations where drivers do not perceive school zones, town centers and primary roads through residential neighborhoods as slow speed areas.
It is generally acknowledged (but largely unsubstantiated) that roadside environment, defined as the type, density and proximity of land use and other non-road-related features, is important for explaining speeds chosen by drivers. In fact, previous research in Connecticut has found that roadside environment is a strong predictor for the severity of rural pedestrian crashes (Zajac and Ivan 2003), which basic physical mechanics demonstrates to be positively related to vehicular speeds (Kloeden et al. 1997). These compelling findings prompt investigation into the phenomenon of how drivers choose their speeds, in particular the effect of roadside environment on this decision, and how both these factors (chosen speeds and roadside environment) interact to affect the incidence of crashes.

2
It is in this light that the ability to influence vehicle speeds through the selection of the characteristics of the roadway and of the adjacent environment could be a boost to improving safety on our roadways. The idea of drivers naturally selecting appropriate speeds as a result of their perception of the total roadway environment is described in some European countries as designing “self explaining” roads (Van der Horst and Kaptein 1996). Even though this approach is gaining momentum, gaps still exist in the knowledge about how various components of the road environment and their interaction affect a driver’s chosen speed.
1.2 Objectives of Project The objectives of this project were to answer the following three questions: 1. How do the prevailing road characteristics such as the design geometry and
roadside environment influence the actual travel speeds chosen by drivers? 2. How do the actual travel speeds along with these road characteristics
influence the incidence of crashes? 3. How can we use the answers to these first two questions to design the safest
road for a given condition?
Answering these questions requires better information about the actual travel speeds on roads with different design geometries and roadside environments along with the crash experience on these same roads. To do this, we compared crash counts and actual speeds on roads in groups with similar geometric characteristics and roadside environments, controlling for the observed traffic volumes. We investigated combinations of characteristics and environments that are commonly found in Connecticut, as well as some that may be less common, but offer opportunities for isolating the effects of particular elements. Our study considered specific factors known to influence driver speed and/or crash incidence. Because these may or may not be the same factors for influencing travel speeds and crash incidence, an important secondary objective of this research was to identify characteristics that appear to affect one of these phenomena but not the other.
We collected data from two-lane road sections in rural and suburban areas, and used generalized linear modeling techniques to analyze the following, controlling for geographic area and traffic volume:
• Variance in observed travel speed by geometric and roadside features • Variance in crash count by observed travel speeds and geometric and roadside
features
The results of these analyses permit answering the following three questions: 1. Which road features are most useful for predicting expected running speeds? 2. Is knowing the actual running speed useful for predicting the expected number
and/or severity of crashes on a roadway segment?

3
3. Which are the most significant features for designing a safe road in environments such as village and town centers, school zones and residential neighborhoods?
This report answers the above questions to help identify appropriate
improvements to make to roadway and/or roadside environment features in order to reduce travel speeds where necessary and to improve the safety of roads in Connecticut.
1.3 Scope of Report This report is organized as follows:
• Chapter 2 contains a summary of previous studies of roadway and roadside characteristics, speed and safety.
• Chapter 3 describes the study design, the data collection procedure and the characteristics of the data set.
• Chapter 4 reports the methodology and results of estimating models for predicting vehicle running speed as a function of roadway and roadside characteristics.
• Chapter 5 reports the methodology and results of analyzing safety as a function of speed and other roadway and roadside characteristics.
• Chapter 6 presents the major project findings and recommendations for application.
4
2 PREVIOUS WORK
The relationship between vehicle speed and the roadway environment and its concomitant effect on traffic safety has been investigated on several fronts. These studies range from the relationship between vehicular speed and geometric characteristics, to road cross-sectional parameters, to land use, to weather, to traffic characteristics, and to the roadside environment. This study focuses on both the roadway and roadside features and how they interact to affect free flow speed.
2.1 Speed and the Incidence of Crashes Many investigators explain a high incidence of fatal crashes based on basic
physics principles: the greater the vehicle speed, the greater the severity of a resulting collision. The probability of a fatal pedestrian crash as a result of speed reduction was estimated by Anderson et al. (1997). In examining pedestrian collision and speed in Adelaide, Australia, they estimated that the reduction of the speed limit from 60 to 50 km/h could reduce fatal pedestrian crashes by about 30 percent. A similar study by Kloeden et al. (1997), also in the city of Adelaide, suggests that in 60 km/h speed zones, vehicles that were involved in casualty collisions were generally traveling faster than cars that were not involved in a crash.
However, the effect of speed is not simple. Some studies have also suggested that speed variance has more influence on crash incidence than the absolute operating speed (Lave 1985). It must be noted that these observations are also associated with roadway type. For example, limited access roads such as freeways experience very low speed variance due to the fact that there are minimal interruptions in the traffic flow.
2.2 Geometric Alignment and Vehicle Speed Numerous research studies have shown relationships between speed and
geometric variables for the purpose of assessing safety. Geometric alignment can impose a physical constraint on the operation of a vehicle and this affects a driver’s chosen speed. A study by the European Transport Safety Council reports that consistency in gradients, alignment and layouts greatly impacts the speed choice on a particular road segment (ETSC 1995). Specifically on horizontal alignments, deflection angle has been found by Fitzpatrick et al. (2000), and Schurr et al. (2002), to greatly explain the variations in free-flow speed on horizontal curves. A study by Poe and Mason (2000) on low speed urban streets also supports this relationship.
2.3 Cross-sectional Elements and Vehicle Speed Roadway cross-sectional elements are among the most widely investigated areas
with regard to their effect on vehicular speeds. Several studies have looked at the road width, shoulder width and type, total pavement width, effective lane width and their interaction with operating speed and its resultant impact on safety. Using regression models to analyze the possible relationship between numerous roadway characteristics and free-flow speed, Fitzpatrick et al. (2000) found lane width to be the most significant variable influencing free-flow speed on horizontal tangents when the effect of posted
5
speed limit is ignored. Studying the impact of speed on pedestrian safety in Maine, Gårder (2004) demonstrated that high speeds and wide roads result in more crashes.
Gattis and Watts (1999) investigated the relationship between road width and vehicle speed in a limited study that took into consideration the functional class of the roadway. They studied seven segments in a residential neighborhood with a grid layout. The streets were compared by contrasting their attributes. The traffic functions of the paired street segments were similar but each road was different in terms of width. Their results suggested a relationship between the mean speeds and traffic function as characterized by the functional class of the roadway. For local roads, the results showed that wider streets had higher mean speeds. However, road segments with a mix of local/collector functions with different widths had the same speed. Our study aims to further investigate these observations.
Narrowing lanes has often been used as a traffic-calming tool in reducing speed (Ewing 1999). Daisa and Peers (1997) concluded that wider residential streets do experience higher mean and 85th percentile speeds; however, to achieve significant reduction in speeds requires substantial reductions in the curb-to-curb width of the street. In a study involving six locations on three different streets, Marconi (1977) also showed that reductions in total road widths that still retained lane widths around 12 ft did not result in any significant reduction in speed. Lum (1984) carried out a before-after study of two streets that had 28 ft and 36 ft curb-to-curb widths respectively, but which were delineated into 9 ft lanes for both streets. However, the total roadway width remained the same. Using a before-after analysis, the study concluded that there is no statistically significant change in mean speed or speed distribution. As the results indicate, the expected reduction in speed was not realized; apparently because the physical width makes a stronger impression on drivers than the delineated lane width.
2.4 Roadside Environment and Vehicle Speed As transportation engineers continue to find ways to improve roadway safety,
more attention is being given to the effect of the roadside environment on driver behavior, in terms of speed and its safety impact. The way we perceive an object does not always reflect its true physical nature; this phenomenon is called visual illusion (Kim and Noguchi 2003) and some elements of the roadside environment have been suggested to pose such an effect and to thus influence vehicle speed. For example, it is believed that trees aligned along a street in a consistent pattern give an illusion of narrowing of the roadway. A simulation experiment by Kim and Noguchi (2003) found that driving through different road scenes caused the test subjects to perceive the actual speeds differently. Their results indicated that presence of humans, animals and trees as objects within the roadside environment generally result in overestimation of speed implying that they would chose a lower speed in that environment. Synthesis of studies relating to roadway safety by Martens et al. (1997) indicates that driving speed in built-up areas is influenced by the building setback. Reducing speed through visual perception is an interesting concept because it means drivers would choose appropriate speeds without feeling compelled to do so. However, more investigations are needed to determine if the effect on speeds is still significant when all components of the driving experience are accounted for.

6
On-street parking is recognized as having an effect on vehicle operating speed. It physically constrains both the effective lane width and the effective total pavement width. It also has a perceptional effect on motorists. Daisa et al. (1997) found the level of on-street parking to have a significant impact in reducing vehicle operating speeds. A similar study on low-speed urban streets by Smoker et al. (1996) drew the same conclusion.
The aesthetics or “beauty” of a road environment has also been investigated in relation to traffic safety. Drottenborg (1999) studied the impact of speed on streets that appear as “beautiful” due to the blossoming of cherry trees along the streets in Lund during springtime, and similar streets that lack such beautification. She found that the free-flow mean speed decreased by about 5 percent and the number of vehicles traveling at high speeds between 50-60 km/h decreased by about 12 percent during the cherry blossom period.
2.5 Speed Limit and Vehicle Speed Some studies have focused on the impact of speed limit on speed and roadway
crashes. The posted speed limit is the main instrument in roadway speed management in most jurisdictions. Speed limits are put in place to inform motorists of the higher end of speeds considered to be safe on a given section of road. The effect of changing posted speed limit on drivers’ chosen speed and crash rate has been the focus of many studies. Ullman and Dudek (1987) tested the effect of reduced speed limit on operating speed and roadway crashes in rapidly growing urban fringes. Their before-and-after study was limited to six sites of two-lane and four-lane undivided highways. The sites had 55 mph and 45 mph speed limits before and after, respectively. The after studies were carried out one-year after the speed limits had been changed. The results of the studies showed that there were no significant changes in the mean or the 85th percentile speeds or the crash rates on the selected road sections.
An FHWA (1992) study that considered both lowered and raised posted speed limits found similar results. The study employed a before-and-after method with comparison to similar sites. The changes in the speed limits had been necessitated by changing land use and traffic demand and formed part of a planned routine traffic engineering program. The study indicated that lowering the posted speed limit by 5, 10 and 15 mph or more did not result in a significant change in the 85th percentile speeds. Similarly, raising the posted speed limits by similar margins did not yield any significant change in the 85th percentile speed.
2.6 Road Markings and Vehicle Speed The effect of road markings on driver behavior in influencing speed has been the
subject of numerous small-scale studies. To make generalized deductions from these small studies, some researchers have conducted meta-analysis so as to establish the underlying relationship among the numerous findings. A meta-analysis on the effect of altered road markings on speed and lateral position by Davidse et al. (2004), suggested that roads that exhibited significant increases in mean speed were roads that prior to the introduction of edge lines had no road markings of any type. Their research further indicated that introducing a centerline marking to a road that has no markings yields a similar result. They attributed the increases in speeding to the improvement in visual guidance provided by the road markings. Unfortunately, while the lane marking impacts

7
positively in reducing the risk of run-off-the-road crashes, it is counterproductive to efforts aimed at reducing the operating speed on roadway segments.
2.7 Land Use and Vehicle Speed Land use types have been the subject of a number of studies relating to road
traffic safety. Zajac and Ivan (2003) investigated pedestrian safety by evaluating how area land use influences pedestrian injury severity, and by association, driving speeds. They found land use type to be a very important variable in influencing pedestrian crash severity. A similar study was also carried out by Ossenbruggen et al. (2001). They studied 87 sites in Stratford County, New Hampshire. The researchers collected qualitative data onsite by observing street activities and pedestrian and motor vehicle interactions. Since no vehicular speeds were collected, the study used the measures of paved shoulder width and on-street parking as surrogate measures of average operating speed for a site. The research team identified and classified three land use types within the study area, based on land use ordinance and site evaluation. Using odds ratio to compare the risk of crash and injury crash probabilities, their analysis concluded that village sites are much safer than residential and shopping sites. They explain their findings by noting that the village sites have roadside infrastructure such as sidewalk, crosswalk and traffic control devices that make such sites more pedestrian friendly.
2.8 Summary of Previous Research The key findings from the literature review indicate that vehicle operating speed
is affected by the roadside environment such as roadside parking, and roadside objects such as trees. Roadway geometric characteristics and cross-sectional elements have been shown to influence operating speeds. Lane narrowing has been shown to affect the speed chosen by drivers; however the results have not been consistent. Studies involving changing of posted speed limits by raising or lowering the posted speed limits did not result in any significant change in the 85th mean speed of the roadway segment. All the reviewed studies relating to land use showed a strong relationship to operating speed, however, none of the studies measured speed directly as a variable but rather used surrogate variables such as posted speed limit and crash severity. Most of the studies are before-and-after studies involving very limited number of sites without much consideration for interaction effect among the numerous predictor variables. Our study hopes to establish a direct relationship between free flow speed and roadway types in association with roadside environment and other roadway characteristics.

8
3 STUDY DESIGN AND DATA COLLECTION
3.1 Site Selection The experimental setup in our study is an observational cross section study. To
have a meaningful analysis, we considered a target total of 300 sites to be reasonable due to the several predictor variables and the large number of factor levels of the predictor variables. The target of 300 sites would ensure adequate cell counts in order to satisfy the assumption of independence for categorical data analysis (Stokes et al. 2001). The roadway segment sites were selected from across Connecticut. Data was collected for the geometric characteristics of each site and the speed characteristics were sampled for at least 100 free flowing vehicles per site.
Sites were selected to be representative of different road types, posted speeds, and land use types. For a site to qualify for inclusion in the sample dataset, it was desired that the segment be on both a horizontal and vertical tangent. However, it was very difficult to get sections that fully met these criteria. Therefore, segments that meet all other requirements but had minor horizontal and vertical curves were included.
We started selecting sites by viewing the video database (videolog) of two-lane roads maintained by Connecticut Department of Transportation (ConnDOT). We found the resulting sites to not fully cover the ranges of characteristics we wanted to study (for example, many ConnDOT roads do not have sidewalks or on-street parking), so we augmented our study data with sites on town-maintained roads. All town roads selected were arterials or major collectors, with similar traffic patterns as the state roads. A combination of prior knowledge of the study team of local street characteristics and site visits were used to select the non-State road study locations.
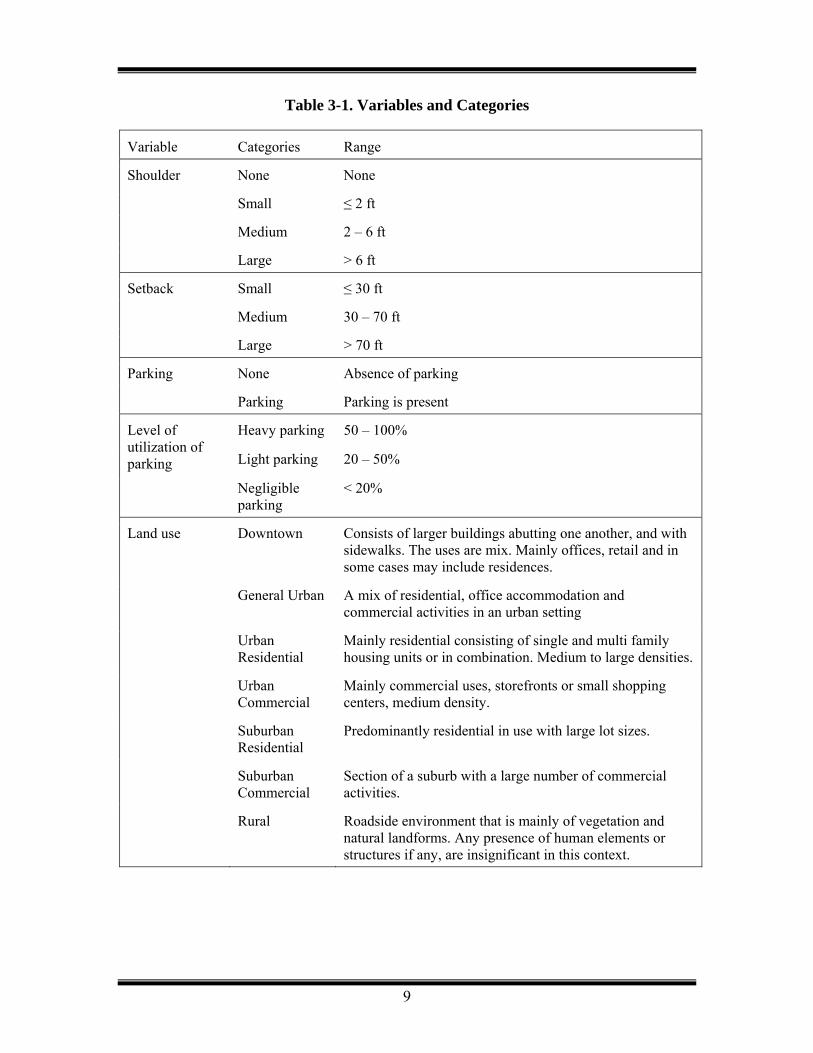
Consistency and uniformity in the roadway characteristics such as the number of lanes, lane width, presence/absence of shoulder, on-street parking, sidewalks, planting strips, road edge delineation, side curbs, and median, were important parameters in the site selection. Discontinuity in these characteristics was used in defining the boundaries of the selected sites. In most cases the boundaries of the selected sites aligned with intersecting roads, including signalized intersections. However, some sections encompassed signalized intersections, and for such sites, speed was measured only for vehicles whose free flow was not interrupted by the signals. Table 3-1 lists the variables and the definitions of the ranges of values for the categories.
3.2 Geometric Measurement and Roadside Characteristics The following geometric characteristics of each site were observed or measured
and recorded during the field visit: • Lane width • Shoulder width • Total pavement width • Parking width • Sidewalk width • Planting strips • Building setbacks
9
Table 3-1. Variables and Categories
Variable Categories Range
Shoulder None None
Small ≤ 2 ft
Medium 2 – 6 ft
Large > 6 ft
Setback Small ≤ 30 ft
Medium 30 – 70 ft
Large > 70 ft
Parking None Absence of parking
Parking Parking is present
Heavy parking 50 – 100%
Light parking 20 – 50%
Level of utilization of parking
Negligible parking
< 20%
Land use Downtown Consists of larger buildings abutting one another, and with sidewalks. The uses are mix. Mainly offices, retail and in some cases may include residences.
General Urban A mix of residential, office accommodation and commercial activities in an urban setting
Urban Residential
Mainly residential consisting of single and multi family housing units or in combination. Medium to large densities.
Urban Commercial
Mainly commercial uses, storefronts or small shopping centers, medium density.
Suburban Residential
Predominantly residential in use with large lot sizes.
Suburban Commercial
Section of a suburb with a large number of commercial activities.
Rural Roadside environment that is mainly of vegetation and natural landforms. Any presence of human elements or structures if any, are insignificant in this context.

10
• Access density • Land use types
Several other variables, including the presence of a planting strip between the road and and the sidewalk, were also observed but not mentioned here because they were not found to be significant in any of our analysis.
As discussed above, due to difficulty in obtaining sites that meet all the selection criteria, sites with minor curves were included in the site selection and the level or the degree of curvature noted. Also, curvature on roadway sections either preceding or following a selected site was noted since this could have some impact on the operating speeds within the site. Stop-controlled and signalized intersections that form the boundaries to a site or are located such that they could impact on the speeds at a site are also documented.
The variables, shoulder, setback (building setback) and roadside parking, were categorized based on the ranges of measurement encountered. Where roadside parking is present, the level of utilization of parking along the stretch of the roadway segment is estimated as heavy, light or negligible. Setback is the distance from the edge of the road to the front of the building line. In instances where the setback varies for a section of roadway, the building setback that seems dominant from a driver’s view was taken to apply to the roadway section. Driveway density and the Average Daily Traffic (ADT) were included as possible predictor variables.
In this study, we defined two major categories of roadway: “street” and “highway”. Our definitions of street and highway are based on the physical design of the roadway rather than on a hierarchal system of traffic flows specifying function. Rather than a hierarchy between mobility and land access, what is needed here is a characterization of road type based on distinct physical characteristics that are likely to affect driver behavior.
The category “street” is typical of roadways found in an urban environment, while “highway” is more characteristic of rural areas. In our definition, the primary distinction between streets and highways is that streets have no edge striping delineating shoulders while highways do. In addition, streets typically have raised continuous non-mountable curbs while highways mostly have mountable and intermittent curbs for drainage purposes. Streets also tend to have on-street parking while highways usually do not.
3.3 Free flow Speed Measurement The free flow speed data were measured using radar speed guns that recorded to
an accuracy of 1 mph. The use of speed guns was chosen over tube counters in order to confidently collect only true free flow speeds of through vehicles, and not speeds of turning vehicles, and vehicles which have slowed down for some reason. For example, research has shown that the use of cell phones while driving distracts drivers, possibly causing them to operate at reduced average speed (Rakauskas et al. 2004).
Prior to the beginning of the speed data collection, the radar guns to be used for the study were tested in an experiment to assess their accuracy and consistency. The speeds of two vehicles instrumented with on-board speed measuring tools and global positioning system (GPS) were recorded on several passes on a test track. The speeds were recorded from opposite directions and at two different distances from the test

11
vehicle. The results of the test showed no statistical difference between the radar gun measurements and that of the on-board speed measurement.
Sampling of vehicles for the data collection was limited to passenger cars, minivans, and light trucks. Vehicles were selected based on the assessment of headways such that the driver’s chosen speed is not influenced by other vehicles in its direction of travel. A six-second minimum headway was applied as suggested by Vogel (2002). In order to minimize subjective judgment in assessing headway, different free flow headway distances were estimated for different posted speed limits and used as a guide to judge headway. Applying these headway distances was very important for heavy traffic roadway segments.
Depending on the site conditions, the operator of the speed gun was seated in a passenger car or pickup truck that was parked well off the road so as not to attract attention which could influence or affect drivers’ decisions on their chosen speeds. The observation position was selected to maintain the same angle and approximate distance from the passing vehicles as was used in the validation test. In some locations, the observer sat on a garden chair on a private property when permitted by the property owner. The speed of each vehicle selected was monitored over a reasonable length of the roadway segment. Vehicles with noticeable speed fluctuation were ignored. Also, drivers who slowed to make a turn, or activate their brakes were also ignored. To eliminate the effects of night driving and adverse weather conditions, the collection of speed data was limited to daylight hours in clear weather and with dry pavement.
3.4 Data Set Summary Appendix A lists the full data set, with the speed, roadway roadside environment,
AADT and crash characteristics listed in separate tables. This section presents a summary of the data, including cross-tabulations by various pertinent variables. These cross-tabulations reveal some important correlations among the variables that reflect how roads are designed in Connecticut. Following are a few of the patterns that are easily identified:
• Table 3-2 shows that the sites with parking are nearly all classified as streets, and all appear in urban land use classifications.
• Table 3-2 also shows that the suburban and rural land use classifications appear nearly always on highways.
• Table 3-3 shows that the sites designated as streets have no speed limits over 35 mph, but the highway locations have speed limits of all values, but skewed towards the higher values.
• Table 3-4 shows that the shoulder width variable almost perfectly classifies the sites by road type, with all but one of the street locations having no shoulder, and all of the highway locations having at least a small shoulder.
• As shown in Table 3-5, the presence of sidewalks does not classify the road types as well as one might expect, however, all of the street locations have a sidewalk on at least one side, and most on both sides. The highway locations surprisingly are split evenly among having no sidewalks and a sidewalk on one or both sides.
• Table 3-6 shows that building setback tends to be smaller on streets than on highways, though there is considerable overlap in the setbacks on each road type.
• Table 3-7 shows that there is not much correlation between pavement width and posted speed limit.

12
• Table 3-8 shows that parking and sidewalks frequently co-exist: all of the sites with parking present had a sidewalk on at least one side.
• Table 3-9 shows that parking is more common at locations with small or medium building setbacks.
• Table 3-10 shows that parking and land use classification are somewhat related, with most of the sites with parking located in urban areas.
• Table 3-11 shows that nearly all of the urban sites have sidewalks on at least one side, and all land use classifications except rural have a fair percentage of sites with sidewalks.
• Table 3-12 shows a strong correlation between the presence of sidewalk and building setback, such that sites with sidewalks are more likely to have small building setbacks, and vice versa.
• Similarly, Table 3-13 shows that land use type and building setback are also highly correlated, such that urban land types tend to have small building setbacks and the large building setbacks tend to be in suburban or rural locations. Many of these observations are not surprising due to zoning regulations and road
design guidelines. Obviously, mature urban areas are more likely to have traditional street design patterns with sidewalks, on-street parking and small building setbacks, while new areas built in the suburbs are more likely to have larger building setbacks and less likely to have on-street parking or sidewalks. It is interesting to note that there are some exceptions to these expectations, particularly in the presence of sidewalks in all land use types and even on highways.
The correlations revealed in these tables affect how these variables can be used in models for predicting free flow speed or accidents. For example, because road type is so strongly correlated with on-street parking, sidewalks and land use classification, it cannot be used in models that include these variables. More importantly, these findings suggest we are better off estimating separate models for streets and highways, since it is clear that some variables will be unimportant for one or the other and would end up acting as a surrogate for road type. Consequently, we estimated separate models for each road type.
Finally, Table 3-14 lists the number of motor vehicle crashes by road type and land use type. What is interesting here is that the crash count is split 60/40 between highways and streets, respectively, but the mileage is split 79/21. This means that the number of crashes per mile is much higher on streets than it is on highways. The rates per mile are highest in downtown and general urban areas, and lowest in residential and rural areas. This is not surprising, and is likely correlated with the actual traffic volumes and pedestrian activity levels, which are not provided here in this table. What this table does show is that the issue of speed and safety is quite complicated, giving some idea as to why so few researchers have tackled it in the past.

13
Table 3-2. Number of Sites by Parking, Land Use Category and Road Type
Parking Land Use Category Streets Highways Total None General Urban 27 23 50 Urban Commercial 3 2 5 Urban Residential 5 8 13 Suburban Commercial 1 27 28 Suburban Residential 4 110 114 Rural 0 12 12 Total 40 182 222Present Downtown 9 0 9 General Urban 9 0 9 Urban Residential 0 1 1 Total 18 1 19Total 58 183 241
Table 3-3. Number of Sites by Road Type and Speed Limit
Road Type 25 mph 30 mph 35 mph 40 mph 45 mph Total Street 35 18 12 0 0 65Highway 15 31 66 48 32 192Total 50 49 78 48 32 257
Table 3-4. Number of Sites by Road Type and Shoulder Width
Road Type No Shoulder Small Shoulder Medium Shoulder Wide Shoulder TotalStreet 60 1 0 0 61Highway 0 41 97 39 177Total 60 42 97 39 238
Table 3-5. Number of Sites by Road Type and Presence of Sidewalks
Road Type No Sidewalk One Side Both Sides Total Street 0 7 55 62Highway 63 60 55 178Total 63 67 110 240
Table 3-6. Number of Sites by Road Type and Building Setback
Road Type Small Setback Medium Setback Large Setback Total Street 35 26 2 63Highway 16 101 59 176Total 51 127 61 239

14
Table 3-7. Number of Sites by Pavement Width and Posted Speed Limit
Pavement Width (ft) 25 mph 30 mph 35 mph 40 mph 45 mph Total ≤ 25 2 6 1 1 0 10> 25 and ≤ 30 11 16 19 21 6 73> 30 and ≤ 35 11 10 17 9 12 59> 35 and ≤ 40 13 10 25 8 10 66> 40 and ≤ 45 5 1 4 3 4 17> 45 3 0 3 1 0 7Total 45 43 69 43 32 232
Table 3-8. Number of Sites by Presence of Parking and Sidewalks
No Sidewalk One Side Both Sides Total No Parking 61 64 81 206Parking Present 0 2 27 29Total 61 66 108 235
Table 3-9. Number of Sites by Presence of Parking and Building Setback
Small Setback Medium Setback Large Setback Total No Parking 29 118 58 205Parking Present 19 8 1 28Total 48 126 59 233
Table 3-10. Number of Sites by Land Use Type and Presence of Parking
Land Use Type No Parking Parking Present Total Downtown 0 9 9General Urban 44 16 60Urban Commercial 4 1 5Urban Residential 12 2 14Suburban Commercial 28 0 28Suburban Residential 112 1 113Rural 11 0 11Total 211 29 240

15
Table 3-11. Number of Sites by Land Use Type and Presence of Sidewalks
Land Use Type No Sidewalk One Side Both Sides Total Downtown 0 1 8 9General Urban 2 8 51 61Urban Commercial 0 0 5 5Urban Residential 0 2 12 14Suburban Commercial 10 11 7 28Suburban Residential 40 45 25 110Rural 11 0 0 11Total 63 67 108 238
Table 3-12. Number of Sites by Presence of Sidewalk and Building Setback
Small Setback Medium Setback Large Setback Total No Sidewalk 2 25 34 61One Side 7 38 19 64Both Sides 39 63 8 110Total 48 126 61 235
Table 3-13. Number of Sites by Land Use Type and Building Setback
Land Use Type Small Setback Medium Setback Large Setback Total
Downtown 9 0 0 9General Urban 25 33 1 59Urban Commercial 2 2 1 5Urban Residential 5 8 2 15Suburban Commercial 2 17 8 27Suburban Residential 7 65 39 111Rural 0 1 10 11Total 50 126 61 237

16
Table 3-14. Crashes by Road Type and Land Use Type
Road Type Land Use Type Total
Mileage
Percent of Total Mileage
Crash Count
Percent of Total Crashes
Crashes per mile
Downtown 1.892 2.5 718 9.3 379.493General Urban 9.551 12.7 2101 27.2 219.977Urban Residential 2.331 3.1 174 2.3 74.646Suburban Residential 1.830 2.4 89 1.2 48.634
Street
Total 15.604 20.8 3082 40.0 197.513General Urban 6.307 8.4 803 10.4 127.319Urban Residential 2.855 3.8 234 3.0 81.961Suburban Commercial 8.571 11.4 1242 16.1 144.907Suburban Residential 36.407 48.5 2141 27.7 58.807Rural 5.303 7.1 219 2.8 41.297
High-way
Total 59.443 79.2 4639 60.0 78.041Total 75.047 100.0 7721 100.0 102.882

17
4 PREDICTION OF RUNNING SPEED
4.1 Analysis Methodology Cross tabulation and Spearman’s correlation coefficients were used to determine
predictor variables that have strong correlations. The General Linear Model (GLM) procedure was used to carry out ANOVA to identify significant variables in predicting mean speeds. The mean speed was used as the dependent variable.
The analysis is based on data collected for 272 sites out of the 300 sites visited. A total of 27 sites were eliminated due to problems with data collection at these sites. Of the 272 sites used in the analysis, 81 (30 percent) were classified as streets and 191 as highways. The streets are all in the lower speed limit categories of 25, 30 and 35 mph. However, the highways fall into all five speed limit categories from 25 mph to 45 mph.
All the parking occurred at study sites with posted speed limits of 35 mph or less. Almost a third of the streets had a notable level of parking compared to only 3 percent of the 191 sites classified as highways. This outcome is expected since parking is much more likely to be found in concert with many of the features that we used to classify a site as a street. All the sections classified as streets have sidewalks with the exception of a single site. Roadways with two-sided sidewalks are almost all streets. 90 percent of the streets have two-sided sidewalks. Perhaps more surprisingly, 60 percent of the sections classified as highways also had some form of sidewalk or pedestrian path. In other words, many of these highways were designed to accommodate at least a minimal level of pedestrian activity.
The streets have a roughly even distribution of the small and medium building setback with only 10 percent being of large setback. Conversely, the highways generally had medium and large building setback. It should be noted that all the small setbacks for both street and highway sections were in areas with lower posted speed limits (25 or 35 mph).
The categories of land use types for the street roadway type ranged from downtown to suburban residential (see Table 3-1). For highways the land use types range from general urban to rural. The land use types overlap for both streets and highways except for downtown and rural which fall exclusively under street and highway, respectively.
As a consequence of these observations in the data set, two separate models were estimated: one for streets and a second for highways. These two models are discussed in the next two sections.
4.2 Streets Model Results for the sub-dataset for street are presented in Table 4-1 and Table 4-2. The
variable “shoulder” was taken out of the model because, consistent with our definition, streets had no shoulders. The results indicate that posted speed limit and land use are significant in predicting mean free flow speed for streets. Parking is significant only at the 90 percent level of significance. The model with the variables posted speed limit, parking, land use and setback explains about 61 percent of the variability in the mean free flow speed. The overall model is highly significant.

18
Table 4-1. Analysis of Variance Results for the Streets Model
Source Type III Sum of Squares
Degrees of Freedom
Mean Square F-Statistic Significance
Corrected Model 888.8 7 127.0 16.2 0.000Intercept 31054.1 1 31054.1 3971.6 0.000Posted Speed Limit 89.0 2 44.5 5.7 0.005Land Use 182.3 3 60.8 7.8 0.000Parking 38.6 2 19.3 2.5 0.092Error 570.8 73 7.8 Total 99242.2 81 Corrected Total 1459.6 80
The parameter estimates in Table 4-2 show that light and heavy parking have a
correspondingly decreasing effect on speed compared to the nil or negligible level of parking. However the change from the nil or negligible to the light parking is not significant. With downtown set as the baseline for comparison to the other land use levels, general urban, Residential urban and suburban residential all indicated corresponding increases above the downtown mean speed.
The variable “setback” was not a significant predictor because of the relatively small variation in setback for streets in our data set. The variables ADT, road width, lane width, were not significant in the model individually or in conjunction with other variables. Sidewalk and planting strip were also not significant in the street model, largely because almost all streets have sidewalks.
Table 4-2. Parameter Estimates for the Streets Model
Parameter Parameter Estimate
Standard Error
t-statistic Significance
Intercept 29.937 1.160 25.812 0.000Posted Speed Limit = 35 mph 2.534 .923 2.744 0.008Posted Speed Limit = 30 mph 2.094 .766 2.733 0.008Posted Speed Limit = 25 mph 0(a) . . .Land Use = Suburban Residential 7.320 1.641 4.461 0.000Land Use = Urban Residential 5.754 1.459 3.945 0.000Land Use = General Urban 4.783 1.122 4.265 0.000Land Use = Downtown 0(a) . . .Parking = Heavy -2.334 1.057 -2.208 0.030Parking = Light -.669 1.161 -.576 0.566Parking = Nil or Negligible 0(a) . . .
a. This parameter is set to zero because it is redundant.

19
4.3 Highways Model Analysis results for the highway sub-data-set are presented in Table 4-3 and Table
4-4. The overall highway model with predictor variables posted speed limit, setback, land use, shoulder width, parking and sidewalk is significant and explains about 69 percent of the variability in the mean free flow speed. The individual predictors of posted speed limit, land use, setback and shoulder are significant at the 95 percent significance level. Roadside parking is significant at the 86 percent significance level even though only 3 percent of the highway sites within the study recorded an appreciable level of roadside parking. This indicates that roadside parking is a possible strong predictor variable that needs to be investigated further. Shoulder and parking is significant only with the inclusion of the sidewalk variable.
Table 4-4 shows the parameter estimates for the different levels for the variables in the ANOVA model for the highway data set. The effect among the various factor levels are similar and generally consistent with the results obtained for the street data analysis for those variables which appear in both models: the posted speed limit, land use and parking. The ordinal effect of the different levels of the posted speed limit on the mean free flow speed is as expected. The estimates for roadside parking indicate that mean speeds on a highway type road section with parking will be about 1.5 mph less than the highway sections without the presence of parking. Though the difference between the parking and no parking is as expected the difference is not statistically significant, perhaps because of the small number of highways with parking in our data-set, as mentioned earlier.
All the land use categories, with the exception of suburban commercial, indicated the expected change in mean speed when compared to the category of general urban as the baseline. The suburban commercial mean speed reflects a decrease from that of the baseline mean speed which is counter to expectation. The suburban residential and rural categories indicate a 1.2 and 3.7 mph increase over the general urban mean speed. Multiple comparison tests suggest three mean sub groupings for the land use levels. The sub groups are general urban, an intermediary group of suburban commercial and residential, and rural, with urban residential overlapping between the general urban group and the intermediary group.
The effect of the different levels of setback is as expected. The larger the setback, the higher the mean free flow speed over the baseline level of small setback.
The multiple test of comparison indicates that mean speeds at all the posted speed limit levels are significantly different from each other except for the 40 and 45 mph highway segments. The parameter estimates for sidewalk show a decreasing effect from one-sided to two-sided sidewalks over the “no” sidewalk even though the change in mean speed among the different levels of sidewalks are not statistically significant. However, the effect is as expected.
For the highway model, also, the variables AADT, road width, lane width, were not significant. Sidewalk and planting strip were not significant as well.

20
Table 4-3. Analysis of Variance Results for the Highway Model
Source Type III Sum of Squares
Degrees of Freedom
Mean Square F-Statistic Significance
Corrected Model 1912.0 15 127.5 26.0 0.000Intercept 31697.0 1 31697.0 6455.0 0.000Posted speed limit 537.6 4 134.4 27.4 0.000Setback 84.6 2 42.3 8.6 0.000Land use 177.7 4 44.4 9.0 0.000Shoulder 29.7 2 14.9 3.0 0.051Sidewalk 6.2 2 3.1 .6 0.532Parking 10.9 1 10.9 2.2 0.138Error 849.5 173 4.9 Total 332886.5 189 Corrected Total 2761.5 188
Table 4-4. Parameter Estimates for the Highway Model
Parameter Parameter Estimate
Standard Error
t-statistic Significance
Intercept 34.517 .952 36.270 0.000Posted Speed Limit ≥ 45 mph 7.600 .822 9.249 0.000Posted Speed Limit = 40 mph 6.183 .786 7.862 0.000Posted Speed Limit = 35 mph 3.963 .677 5.852 0.000Posted Speed Limit = 30 mph 2.579 .743 3.469 0.001Posted Speed Limit = 25 mph 0(a) . . .Shoulder = Large 1.311 .538 2.438 0.016Shoulder = Medium .498 .423 1.178 0.240Shoulder = Small 0(a) . . .Parking = Parking -1.499 1.006 -1.490 0.138Parking = No Parking 0(a) . . .Sidewalk = 2-sided -.512 .511 -1.001 0.318Sidewalk = 1-Sided -.422 .432 -.976 0.330Sidewalk = None 0(a) . . .Setback = Large 2.612 .678 3.852 0.000Setback = Medium 1.345 .609 2.210 0.028Setback = Small 0(a) . . .Land Use = Rural 3.689 .939 3.929 0.000Land Use = Suburban Residential 1.168 .548 2.132 0.034Land Use = Suburban Commercial -.857 .675 -1.270 0.206Land Use = Urban Residential 1.519 .910 1.668 0.097Land Use = General Urban 0(a) . . .
a. This parameter is set to zero because it is redundant.

21
4.4 Summary of Speed Analysis The results of the analysis indicate that roadway and road environment
characteristics affect the mean free flow speed on roadway segments. Land use, posted speed limit and roadway types, as defined our study, are significant in predicting mean free flow speeds. Land use types either by association with posted speed limit or roadway types has a very strong influence in predicting mean free flow speeds. Roadside parking is significant in reducing mean free flow speeds especially on the “street” roadway type. The results also indicate that for streets, drivers do not make much distinction between the 30 and 35 mph posted speed limits. The highways also exhibit similar characteristics for the 40 and 45 mph posted speed limits.
The results of this study are promising for providing guidance in the design of roadway cross sections with the aim of influencing the speeds chosen by drivers by means of the physical characteristics of the roadway segment. Establishing clear and distinct roadway types will reinforce the “cue” drivers take from these roadway types and cause them to adjust to reasonable speeds. This is very important, especially in Connecticut and elsewhere in the US, where, in general, two-lane rural roads have varying functionality along their length. This research clearly shows that roadway characteristics such as land use, roadside parking and building setback, perhaps even more than posted speed limit, can help achieve the objective of designing roadways that lead to the reduction in speed, based on the driving environment.

22
5 ANALYSIS OF SPEED AND SAFETY
5.1 Speed and Safety Analysis Objectives One of the questions this project proposed to answer was:
Is knowing the actual running speed useful for predicting the expected number and/or severity of crashes on a roadway segment?
This chapter describes the analyses undertaken to answer this question. First, the
procedure of estimating models for predicting the crash count as a function of speed is described, along with the results. Then, the procedure for estimating models for predicting the severity of crashes is described, along with the results.
5.2 Crash Prediction Models
5.2.1 Crash Prediction Methodology In traffic safety research, General Linear Modeling (GLIM) has been more and
more frequently adopted for estimation of crash prediction models because of its ability to relax the assumption of a normal distribution for the response variable. Instead, a GLIM framework using a Poisson-related distribution for the crash count is more appropriate, as it confirms to the non-negative and discrete nature of crash counts and leads to a more flexible discrete distribution form (Miaou 1994). In a Poisson distributed case, the probability of observing ni crashes is represented as:
!)(
i
mn
i nemnP
i −
= (5-1)
where m is the mean of the Poisson distribution, computed as NpnEm i == )( , (5-2)
with p being the probability of having a crash when the exposure is N. However, in realistic cases the mean under a Poisson distribution usually cannot
represent the crash frequency Np at different observation sites. In fact, the real mean includes the average crash frequency and an error term following a Gamma distribution, due to the between site variation in the database (Miaou 1994). In other words,
εNpem = , (5-3) assuming eε follows a Gamma distribution with mean 1 and variance δ. Then the corresponding Poisson distribution is
!)()|(
i
Npen
ii neNpenP
iεε
ε−
= (5-4)
After integrating on ε for equation (5-4), the NB distribution is obtained as in
i
ii Np
NpNpn
nnP ⎟⎟⎠
⎞⎜⎜⎝
⎛+⎟⎟
⎠
⎞⎜⎜⎝
⎛+Γ+Γ
+Γ=
θθθ
θθ
θ
)()1()()( , (5-5)

23
where θ is the inverse of the dispersion parameter k in the NB distribution. Instead of being equal to the mean, the variance of the NB distribution is
2)( kmmnVar i += . (5-6) When k is not significantly different from 0, the NB distribution is approximately equivalent to a Poisson distribution.
Many previous studies have applied NB GLIM in highway crash analysis under different circumstances. Wang and Nihan (2004) used NB GLIM to estimate bicycle-motor vehicle (BMV) crashes at intersections in the Tokyo metropolitan area. Shankar et al. (1995) also adopted NB GLIM in modeling the effects of roadway geometric and environmental features on freeway safety. Miaou (1994) evaluated the performance of negative binomial regression models in establishing the relationship between truck crash and geometry design of road segments. In this project, the crash count is assumed to have a negative binomial distribution and the total vehicle-miles-traveled (VMT) for each segment is used as the exposure. A logarithmic function is used to link the expectation of the distribution of the crash count and the explanatory variables, such as the natural log of AADT and the site characteristics.
5.2.2 Crash Prediction Results As noted in the discussion of speed prediction models, when estimating statistical
prediction models it is critical to choose the set of predictor variables used in the model very carefully. In order to estimate good models, it is important to include variables known or expected to be well correlated with the variable to be predicted. At the same time, the variables included in the model must not be highly correlated with one another, as the coefficients estimated for each variable will not be independent of one another and their effects will be confounded. This presented a problem for specifying the models for predicting crash count as a function of speed: we expected other variables to contribute to the occurrence of crashes as well, and thus wanted to include those variables in the models, however these variables were also found to be good predictors of vehicle running speed, indicating strong correlation with speed. Therefore, if we included speed in the prediction model, we could not also include road width, speed limit, presence of parking, and roadway setback, variables that were all found to be strongly associated with free flow speed and also desirable for predicting crash counts.
Consequently, we estimated simple models of crash count using only three predictor variables: the observed AADT, the observed mean free-flow speed and the land use type. The inclusion of AADT accounts for both exposure to crashes as well as an effect of the traffic intensity on the crash rate. We estimated three models: one for the segments classified as streets, a second for the segments classified as highways, and a third for all roads together. The prediction equation estimated is given in Equation (5.7):
NCRASH = L AADTβ1 exp(β0+ β1 S + β2 LU) (5-7)
Where NCRASH is the crash count on the segment during the six year time period, 1998 to 2003, L is the section length (in miles), S is the mean free flow speed (in mi/h), LU is the land use type (as defined in Table 3-1) and the β’s are coefficients to be estimated. For convenience, this equation is transformed logarithmically to:

24
ln NCRASH = ln L + β1 ln AADT + β0+ β1 S + β2 LU (5-8) Note that the segment length is included only to normalize for the variability from
one segment to another. It is included without an exponent because it is not expected to contribute to the rate of crashes. AADT is scaled to an annual value (multiplied by 365 and divided by 107) and included with an exponent, as it is known to have a nonlinear relationship with crash incidence (Ivan 2004). For the model with both road types, an additional dummy variable is added to account for differences in crash count related to streets and highways; this dummy variable takes a value of 1 for the segments classified as street and 0 for those classified as highways.
The modeling results are presented in Table 5-1. Note that the coefficient on ln AADT is greater than 1 for all three models, though not significantly so for the highway model. This is unusual; this value is usually less than 1 for general crash prediction models (Ivan 2004). The intercept is nearly the same in every model, between 4.77 and 4.96. The coefficient on the street dummy variable is not significant at 95 percent confidence, indicating there is no significant difference in safety between streets and highways; note that the coefficient value of 0.19 is also the difference between the intercept values for the street and highway models.
Table 5-1. Crash Prediction Models by Road Type
Streets Highways All Roads
Variable Coef-ficient
Std. Err. (a)
Sig. (b)
Coef-ficient
Std. Err. Sig. Coef-
ficient Std. Err. Sig.
Intercept 4.96 1.181 0.000 4.77 0.866 0.000 4.79 0.751 0.000ln AADT 1.58 0.205 0.000 1.11 0.117 0.000 1.23 0.102 0.000Mean Speed -0.01 0.027 0.597 -0.04 0.016 0.008 -0.04 0.014 0.005Street (c) (c) 0.19 0.147 0.198Downtown 1.15 0.501 0.022 (c) 1.51 0.421 0.000General Urban 0.58 0.354 0.100 1.09 0.312 0.001 1.11 0.295 0.000Urban Residential 0.13 0.401 0.736 0.77 0.352 0.028 0.65 0.313 0.036
Suburban Commercial 0.99 0.708 0.160 1.17 0.298 0.000 1.12 0.287 0.000
Suburban Residential 0 (d) 0.73 0.257 0.004 0.70 0.250 0.005
Rural (c) 0 (d) 0 (d) Dispersion 0.34 0.069 0.41 0.049 0.40 0.041 Log Likelihood 10317.2 10839.4 21153.2
Deviance 64.6 205.9 271.4 Degrees of Freedom 51 178 234
a. Standard Error. c. This variable does not appear in the indicated model. b. Significance. d. This coefficient is set to zero because it is redundant.
25
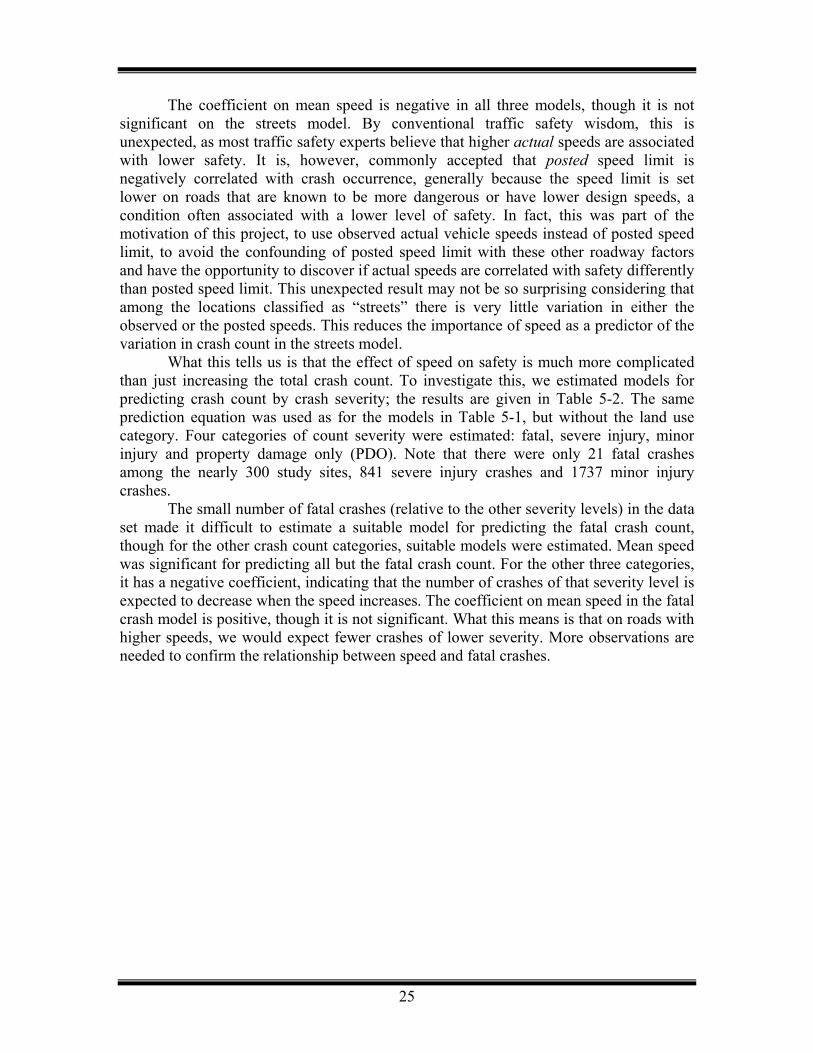
The coefficient on mean speed is negative in all three models, though it is not significant on the streets model. By conventional traffic safety wisdom, this is unexpected, as most traffic safety experts believe that higher actual speeds are associated with lower safety. It is, however, commonly accepted that posted speed limit is negatively correlated with crash occurrence, generally because the speed limit is set lower on roads that are known to be more dangerous or have lower design speeds, a condition often associated with a lower level of safety. In fact, this was part of the motivation of this project, to use observed actual vehicle speeds instead of posted speed limit, to avoid the confounding of posted speed limit with these other roadway factors and have the opportunity to discover if actual speeds are correlated with safety differently than posted speed limit. This unexpected result may not be so surprising considering that among the locations classified as “streets” there is very little variation in either the observed or the posted speeds. This reduces the importance of speed as a predictor of the variation in crash count in the streets model.
What this tells us is that the effect of speed on safety is much more complicated than just increasing the total crash count. To investigate this, we estimated models for predicting crash count by crash severity; the results are given in Table 5-2. The same prediction equation was used as for the models in Table 5-1, but without the land use category. Four categories of count severity were estimated: fatal, severe injury, minor injury and property damage only (PDO). Note that there were only 21 fatal crashes among the nearly 300 study sites, 841 severe injury crashes and 1737 minor injury crashes.
The small number of fatal crashes (relative to the other severity levels) in the data set made it difficult to estimate a suitable model for predicting the fatal crash count, though for the other crash count categories, suitable models were estimated. Mean speed was significant for predicting all but the fatal crash count. For the other three categories, it has a negative coefficient, indicating that the number of crashes of that severity level is expected to decrease when the speed increases. The coefficient on mean speed in the fatal crash model is positive, though it is not significant. What this means is that on roads with higher speeds, we would expect fewer crashes of lower severity. More observations are needed to confirm the relationship between speed and fatal crashes.

26
Table 5-2. Crash Count Models by Crash Severity
Variable Fatal Crashes
Severe Injury
Crashes
Minor Injury
Crashes
Property Damage
Only Crashes
Intercept Coefficient Standard Error
Significance
-4.77 2.57
0.064
4.120.55
0.000
5.92 0.51
0.000
7.66 0.41
0.000Ln AADT Coefficient
Standard Error Significance
1.330.65
0.041
1.310.15
0.000
1.48 0.13
0.000
1.45 0.11
0.000Mean Speed Coefficient
Standard Error Significance
0.0770.0640.234
-0.05 0.0140.000
-0.075 0.013 0.000
-0.092 0.0100.000
Dispersion Value Standard Error
1.951.96
0.59 0.089
0.54 0.071
0.500.054
Log Likelihood -63.1 413.1 2250.6 12309.6Deviance 72.2 251.6 261.2 258.2Degrees of Freedom 226 226 226 226
5.3 Severity Prediction Models
5.3.1 Severity Prediction Methodology Ordered Probit Modeling was developed for analyzing the relationship between
an ordered multiple response variable and one or more explanatory variables, which could be either continuous or categorical. An ordered response variable differs from an unordered one in that the possible values are ranked in some way. For example, the choice of travel mode (by car, bus, or train) is unordered, but bond ratings, taste tests (from strong dislike to strong liking), levels of insurance coverage (none, part, or full) are ordered by design. Take the outcome of an ordered response survey. If the responses are coded 0, 1, 2, 3, or 4, then linear regression would treat the difference between a 4 and a 3 the same as that between a 3 and a 2, whereas in fact they are only a ranking. Due to the definition of driver injury severity, the variable inherently has such an ordinal nature. In other words, the variable takes integer values, which as they increase indicate increasing levels of severity, but not necessarily in equal incremental steps.
The analysis of categorical dependent variables sometimes is motivated by threshold theory in mechanics. The main idea is, considering the case of the breaking strength of a concrete block, each block is assumed to have a threshold Ti, such that it will break if pressure equal to or greater than Ti is applied and it will not break if smaller pressure is applied. Concrete is composed of four ingredients: cement, sand, aggregate (stones, gravel, etc.), and water. The strength and other properties of concrete depend on how these four ingredients are proportioned and mixed, and the compressive strengths of different types of concrete are in different ranges. Obviously, it is impractical to test each block for its specific threshold. However, different pressures can be applied to different

27
blocks in order to obtain information about the breaking strength thresholds of any blocks in the population (Neter et al. 1996). Thus we can get the statistical distribution of the threshold value.
Ordered Probit modeling is theoretically superior to most other approaches for this type of modeling problem and is implemented in several commercially available software packages (Kockelman and Kweon 2002). Let y denote the occupant’s observed injury severity level, y* the latent (unobserved), continuous injury severity measure and μi (i=1, 2, 3) the thresholds for injury severity, such that the following hold:
y = 0 (O, no injury) if 0* ≤y (a) y = 1 (C, probable injury, but not visible) if 1
*0 μ≤< y (b) y = 2 (B, non-disabling injury) if 2
*1 μμ ≤< y (5-9) (c)
y = 3 (A, disabling injury) if 3*
2 μμ ≤< y (d) y = 4 (K, fatality) if 3
* μ>y (e) The latent injury severity measure y* is obtained using a linear equation:
ε+= Xβ'*y (5-10) where X is the set of explanatory variables, with associated parameters β, and the random error term ε indicates the effect of all unobserved factors on y* , which is assumed to follow a normal distribution with mean 0 and variance 1. Thus, we get the probability of each severity level as:
)()0( Xβ'−Φ==yP (a) )()()1( 1 Xβ'Xβ' −Φ−−Φ== μyP (b)
)()()2( 12 Xβ'Xβ' −Φ−−Φ== μμyP (5-11) (c) )()()3( 23 Xβ'Xβ' −Φ−−Φ== μμyP (d)
)(1)4( 3 Xβ'−Φ−== μyP (e) where Φ is the cumulative density function of the standard normal distribution.
However, the marginal effects of the regressors X on the probabilities are not equal to the coefficients. In fact, in an ordered model, the sign of any parameter βi can only clearly determine the marginal effect of variable xi on the extreme probabilities, in this case, the probabilities of no injury and the probability of a fatal injury (Greene and Keller 2002). The marginal effects on all other probabilities are ambiguous, since a shift in the distribution can cause the probability of intermediate injury levels to either fall or rise, depending on the position of the average response. Indeed, without a fair amount of extra calculation, it is quite unclear how the coefficients in the Ordered Probit model should be interpreted (Greene 2003).
This point could be illustrated using Figure 5-1. When the distribution plot of y* shifts due to a change in X, only the expected changes in the probability of y=0 and y=4 are obvious. Since the change of probability of a specific y value could be measured by the change in the area under the probability density function between the applicable thresholds, if the distribution plot of y* shifts as shown in the above figure, we can see that the probability of y=0 decreases while the probability of y=4 increases. However, changes in the probabilities of other possible y values (y=1, 2, 3) are ambiguous. Therefore, one must be very careful in explaining the outcomes of an ordered modeling analysis.

28
5.3.2 Severity Prediction Model Selection The goodness of fit for different models estimated from the same set of data can
be compared using either the likelihood ratio statistic (LRS) or Akaike’s Information Criterion (AIC). The LRS is only applicable with nested models, that is, when one model is a restricted version of the other, where a restriction indicates that one or more coefficients are removed or identical to one another. The form of the test is given by
⎟⎟⎠
⎞⎜⎜⎝
⎛−=
)ˆ()ˆ(ln2
θθ
u
r
LLLRS (5-12)
Figure 5-1. Effects of Change in X on Predicted Probabilities
where )ˆ(θrL is the likelihood value of the restricted model (r) and the )ˆ(θuL is the likelihood value of the unrestricted model (u). The test statistic is distributed as a chi-squared random variable, with degrees of freedom equal to the difference in the number of parameters between the two models.
AIC is useful for both nested and non-nested models. The model yielding the smallest value of AIC is estimated to be the “closest” to the unknown truth, among the candidate models considered.
KLAIC 2))ˆ(ln(2 +−= θ (5-13) where K is the number of free parameters in the model.
However, the AIC criterion may perform poorly if there are too many parameters in relation to the size of the sample. Sugiura (1978) derived a small-sample (second order) expression which leads to a refined criterion denoted as AICc,

29
1)1(22))ˆ(log(2
−−+
++−=KnKKKLAICC θ (5-14)
or
1)1(2
−−+
+=KnKKAICAICC (5-15)
where n is the sample size. Generally, AICc is recommended when the ratio n/K is small (say < 40), which is not the case with this data set.
5.3.3 Severity Prediction Model Results The focus of this analysis is to identify a relationship between the mean of the
observed speed on a road segment or its standard deviation and the severity of any crashes that occur on it. In other words, given that a crash occurs on the segment, does the mean or the standard deviation of the observed speed help to predict the severity of the crash? It was also important for the model to control for other factors that are likely to impact the severity of a crash. Past research has shown that characteristics of the persons involved in the crash are often the best for predicting the severity of the crash, such as the person’s age and whether or not the driver was under the influence of alcohol or drugs (Zajac and Ivan 2003). Unfortunately, we were not able to include these variables in this analysis. Instead, we include the following categorical variables: • Road type, in two categories, “street” and “highway”; • AADT, separated into 6 categories by the following boundaries: 3000; 8000; 12,000;
16,000 and 20,000; and • Land use, in the categories listed in Table 3-1.
The mean or the standard deviation of the observed speed was included in each model as a continuous variable stratified by one of the above three categorical variables. In other words, a different coefficient on speed was estimated for each category of the associated variable. The idea behind this was to determine if the effect of speed on crash severity depends upon the road context. So finally, six classes of models were estimated according to Table 5-3.
Table 5-3. Numerical Naming of Crash Severity Prediction Models
Speed Variable Speed Stratified by Road Type
Speed Stratified by AADT Category
Speed Stratified by Land Use Type
Mean Speed Model 1 Model 2 Model 3 Speed Deviation Model 4 Model 5 Model 6
The results of estimating these six models for predicting crash severity are given in Table 5-4 and Table 5-5 for Models 1 through 3 and 4 through 6, respectively. These tables give the significance of each categorical variable and the group of speed coefficients as a factor for predicting the crash severity. First, each model was estimated using all of the variables, then any variable classes found to be insignificant were removed and the model was estimated again without them. Such a second model was named, for example, Model 2-2 as the second iteration of Model 2. If any variable classes were insignificant in the second round, then a third model, for example, Model 2-3, was estimated with those insignificant variables removed. Note that a variable class may be

30
significant for predicting the crash severity, but certain of the individual categories may not be significantly different from one another. This is actually a very useful result as it indicates that only certain conditions are significant for predicting the crash severity.
All of the variable classes in Model 1 and Model 4 were significant, so no additional estimations were required. However, at least one variable class was not significant in the first estimation for the other models, and Model 2 required two additional iterations until all remaining variables were significant. The best fitting model is the one with the lowest AIC, which in this case is Model 3-2, which includes AADT class, land use category and mean speed stratified by land use category.
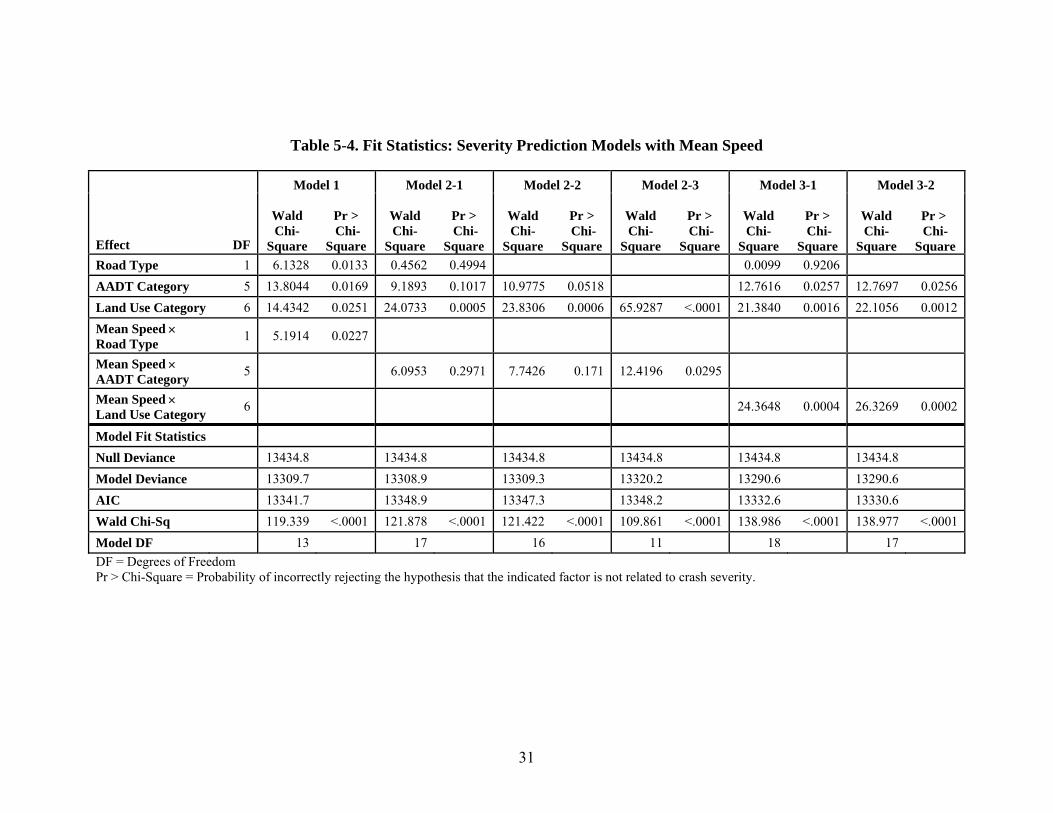
31
Table 5-4. Fit Statistics: Severity Prediction Models with Mean Speed
Model 1 Model 2-1 Model 2-2 Model 2-3 Model 3-1 Model 3-2
Effect DF
Wald Chi-
Square
Pr > Chi-
Square
Wald Chi-
Square
Pr > Chi-
Square
Wald Chi-
Square
Pr > Chi-
Square
Wald Chi-
Square
Pr > Chi-
Square
Wald Chi-
Square
Pr > Chi-
Square
Wald Chi-
Square
Pr > Chi-
Square Road Type 1 6.1328 0.0133 0.4562 0.4994 0.0099 0.9206 AADT Category 5 13.8044 0.0169 9.1893 0.1017 10.9775 0.0518 12.7616 0.0257 12.7697 0.0256Land Use Category 6 14.4342 0.0251 24.0733 0.0005 23.8306 0.0006 65.9287 <.0001 21.3840 0.0016 22.1056 0.0012Mean Speed × Road Type 1 5.1914 0.0227
Mean Speed × AADT Category 5 6.0953 0.2971 7.7426 0.171 12.4196 0.0295
Mean Speed × Land Use Category 6 24.3648 0.0004 26.3269 0.0002
Model Fit Statistics Null Deviance 13434.8 13434.8 13434.8 13434.8 13434.8 13434.8 Model Deviance 13309.7 13308.9 13309.3 13320.2 13290.6 13290.6 AIC 13341.7 13348.9 13347.3 13348.2 13332.6 13330.6 Wald Chi-Sq 119.339 <.0001 121.878 <.0001 121.422 <.0001 109.861 <.0001 138.986 <.0001 138.977 <.0001Model DF 13 17 16 11 18 17 DF = Degrees of Freedom Pr > Chi-Square = Probability of incorrectly rejecting the hypothesis that the indicated factor is not related to crash severity.

32
Table 5-5. Fit Statistics: Severity Prediction Models with Speed Deviation
Model 4 Model 5-1 Model 5-2 Model 6-1 Model 6-2
Effect DF
Wald Chi-
Square
Pr > Chi-
Square
Wald Chi-
Square
Pr > Chi-
Square
Wald Chi-
Square
Pr > Chi-
Square
Wald Chi-
Square
Pr > Chi-
Square
Wald Chi-
Square
Pr > Chi-
Square Road_Type 1 4.7000 0.0302 2.2996 0.1294 1.4901 0.2222 AADT Category 5 13.6183 0.0182 8.1997 0.1456 12.1663 0.0326 12.6105 0.0273Land Use Category 6 50.9283 <.0001 54.4386 <.0001 91.2219 <.0001 40.2136 <.0001 53.6533 <.0001Speed Standard Deviation × Road Type
1 3.8981 0.0483
Speed Standard Deviation × AADT Category
5 9.6874 0.0846 17.2574 0.004
Speed Standard Deviation × Land Use Category
6 11.9894 0.0622 12.5838 0.0501
Model Fit Statistics Null Deviance 13434.8 13434.8 13434.8 13434.8 13434.8 Model Deviance 13311.0 13305.3 13315.5 13303.1 13304.6 AIC 13343.0 13345.3 13343.5 13345.1 13344.6 Wald Chi-Sq 119.042 <.0001 124.745 <.0001 114.588 <.0001 127.005 <.0001 125.49 <.0001Model DF 13 17 11 18 17 DF = Degrees of Freedom Pr > Chi-Square = Probability of incorrectly rejecting the hypothesis that the indicated factor is not related to crash severity.

33
Table 5-6 lists the parameter estimates for each category of each variable in this model. Note that although AADT Category is significant as a factor overall for predicting the crash severity, only one of the categories is significantly different from the base category (>20,000) at 5 percent, and two more are significantly different at 10 percent. All of these coefficients are positive, which means they increase the probability of a crash being more severe than a crash on an otherwise identical road with the base AADT level. The AADT is a representation of the intensity of the traffic level on the road; the relative values of the AADT coefficients therefore make sense, as the lower AADT categories have higher coefficients, which would represent higher speed traffic conditions and more vehicles traveling at free flow speeds and less in platoons. These are the conditions that offer more opportunities for high speed impacts.
The land use category coefficients also offer some interesting results. Only one category is significantly different from the base category (downtown area) at 5 percent: Suburban Residential, with a negative coefficient. No others are significant at 10 percent. The coefficient on mean speed is significant at 10 percent for only two categories, General Urban and Urban Commercial, but with a negative slope. To illustrate the interaction between the slope on mean speed and the land use category, the predicted equation for y* is plotted versus mean speed by land use category on Figure 5-2. The AADT category of greater than 8000 and up to 12,000 veh/day was used for all categories. The significant negative slope on the two urban land use types is counter to what would be expected, as higher impact speeds are usually associated with more severe injuries to the crash victims. One possible explanation for this is that in the urban areas the locations with lower vehicular speeds may also have more pedestrian activity, and thus, more pedestrian collisions, which would have higher severities than collisions involving no pedestrians. Also, it is important to note that the mean speed is not in the same range on the roads in each land use category. Table 5-7 lists the mean, minimum and maximum values of observed mean speed for the roads in each land use category. The values of mean speed for General Urban and Urban Commercial are no lower than 28.5 mph; their predicted severity indices are no higher than the Downtown land use at that speed. Therefore, the model shows that crash severities are highest in Downtown areas (where the slope is flat, indicating that severity is not dependent on speed). This further strengthens the notion that the issue is with the dominance of pedestrian involvements in the crash data set. It is also noteworthy that nearly all of the fatalities occurred on sections with mean speeds above 35 miles per hour. Also, the data relating parking to number of crashes is relatively thin, but in general, parking is associated with higher crash rate but much lower fatality rates in most of the studies that have been conducted.

34
Table 5-6. Parameter Estimates for Severity Prediction Model 3-2
Factor Value Estimate StandardError
Wald Chi-
Square
Pr > Chi-
Square
Minor Injury 0.6355 0.4664 1.8565 0.1730
Severe Injury 1.4389 0.4666 9.5111 0.0020Intercept (µ)
Fatality 3.0157 0.4716 40.8951 < 0.0001
Mean Speed 0.0002 0.0162 0.0001 0.9922
<= 3000 0.3609 0.2270 2.5282 0.1118
> 3000 and ≤ 8000 0.2134 0.1254 2.8967 0.0888
> 8000 and ≤ 12,000 0.1777 0.1240 2.0518 0.1520
> 12,000 and ≤ 16,000 0.2851 0.1238 5.3053 0.0213
> 16,000 and ≤ 20,000 0.2139 0.1264 2.8665 0.0904
AADT Category (veh/day)
> 20,000 (a)
Downtown (a)
General Urban 0.6801 0.5182 1.7223 0.1894
Urban Commercial 1.4625 1.0046 2.1196 0.1454
Urban Residential -0.9816 0.9277 1.1196 0.2900
Suburban Commercial -0.2043 0.6863 0.0886 0.7660
Suburban Residential -1.1829 0.5680 4.3376 0.0373
Land Use Category
Rural 0.1293 1.9203 0.0045 0.9463
Downtown (a)
General Urban -0.0302 0.0176 2.9289 0.0870
Urban Commercial -0.0487 0.0295 2.7322 0.0983
Urban Residential 0.0123 0.0262 0.2211 0.6382
Suburban Commercial -0.00706 0.0205 0.1180 0.7312
Suburban Residential 0.0154 0.0181 0.7246 0.3946
Mean Speed × Land Use Category
Rural -0.0164 0.0414 0.1570 0.6920Pr > Chi-Square = Probability of incorrectly rejecting the hypothesis that the indicated factor is not related to crash severity. a. This coefficient is set to zero because it is redundant.
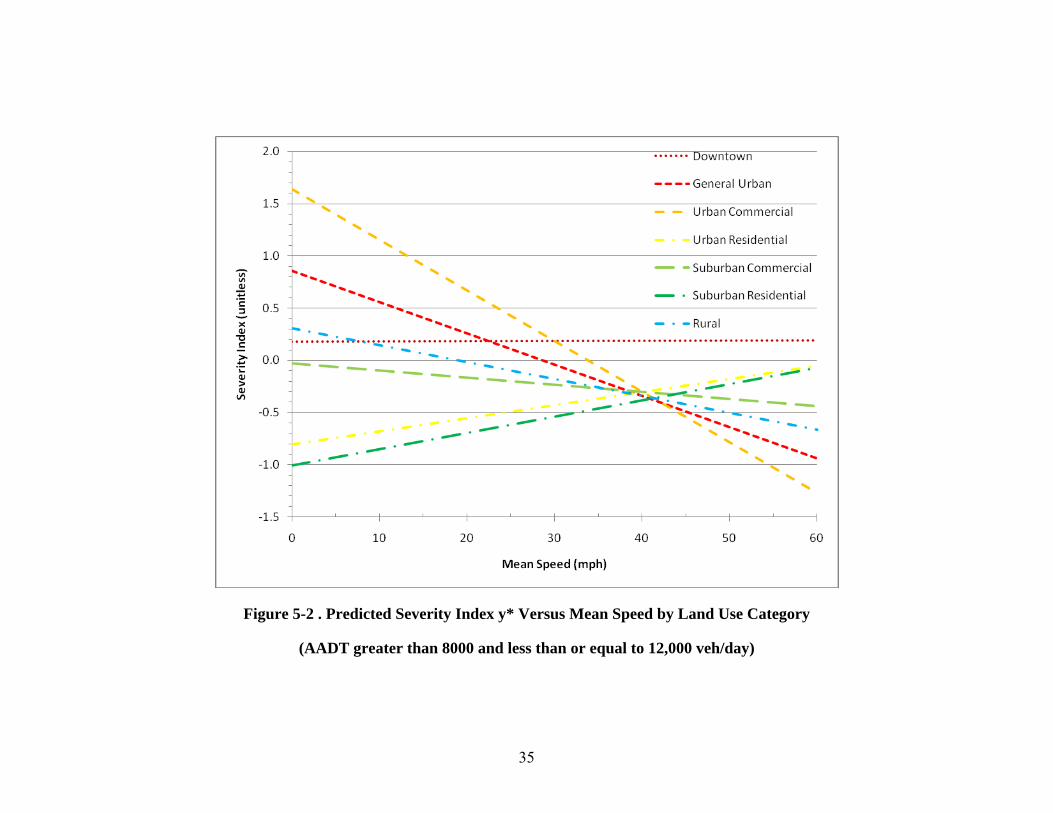
35
Figure 5-2 . Predicted Severity Index y* Versus Mean Speed by Land Use Category
(AADT greater than 8000 and less than or equal to 12,000 veh/day)
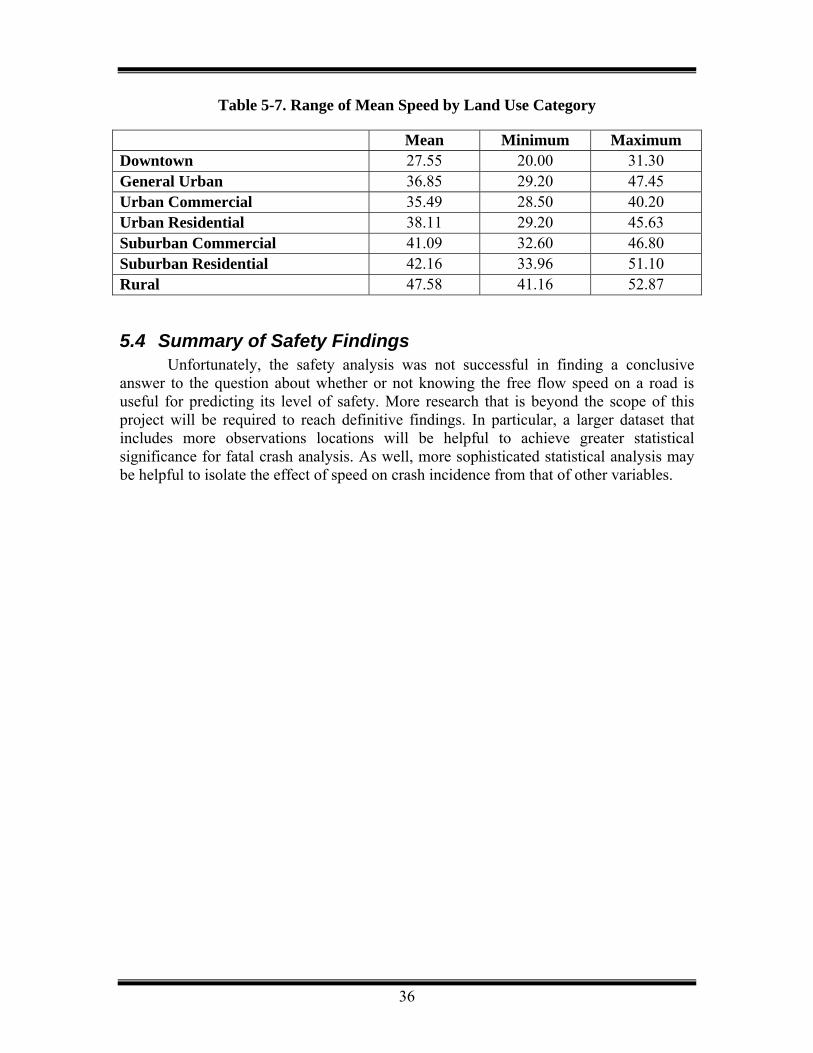
36
Table 5-7. Range of Mean Speed by Land Use Category
Mean Minimum Maximum Downtown 27.55 20.00 31.30 General Urban 36.85 29.20 47.45 Urban Commercial 35.49 28.50 40.20 Urban Residential 38.11 29.20 45.63 Suburban Commercial 41.09 32.60 46.80 Suburban Residential 42.16 33.96 51.10 Rural 47.58 41.16 52.87
5.4 Summary of Safety Findings Unfortunately, the safety analysis was not successful in finding a conclusive
answer to the question about whether or not knowing the free flow speed on a road is useful for predicting its level of safety. More research that is beyond the scope of this project will be required to reach definitive findings. In particular, a larger dataset that includes more observations locations will be helpful to achieve greater statistical significance for fatal crash analysis. As well, more sophisticated statistical analysis may be helpful to isolate the effect of speed on crash incidence from that of other variables.

37
6 SUMMARY AND RECOMMENDATIONS
6.1 Summary of Findings This report describes an investigation into whether or not physical characteristics
of the roadway and the roadside environment are associated with actual vehicle running speeds, and how actual vehicle running speeds are associated with the occurrence and severity of motor vehicle crashes in conjunction with other roadway and roadside characteristics. Actual vehicle running speeds were observed at about 300 locations in urban, suburban and rural areas across Connecticut, at locations without horizontal curves or traffic control devices. Only vehicles traveling through the section unimpeded either by leading or turning vehicles were observed in order to get true free flow traffic speeds. Roadway and roadside characteristics were observed, and statistical prediction models were estimated to learn more about how free flow vehicle speed, roadway and roadside characteristics and crash incidence and severity are related.
The objectives of the project were to answer the following questions: 1. Which road features are most useful for predicting expected running speeds? 2. Is knowing the actual running speed useful for predicting the expected number
and/or severity of crashes on a roadway segment? 3. Which are the most significant features for designing a safe road in
environments such as village and town centers, school zones and residential neighborhoods?
The rest of this section gives the answers that were found to these questions. Table 6-1 lists the features that were found to be significant for predicting running
speed. The factors associated with higher average running speeds are wide shoulders, large building setbacks and a residential location. The factors associated with lower average running speeds are on-street parking, sidewalks and a downtown or commercial location. These findings suggest that drivers slow down where the road feels “hemmed-in” or there is noticeable street activity, and they speed up where the road feels “wide open” or street activity is less noticeable. This finding is not surprising, but these relationships are quite strong in the observed data, and it is a useful result to isolate this short list of factors that are significantly correlated with actual vehicle running speeds.
Table 6-1. Factors Significantly Associated with Average Running Speed
Factors Associated with Higher Average Running Speeds
Factors Associated with Lower Average Running Speeds
Wide shoulders On-street Parking Large Building Setbacks Sidewalks Residential Location Downtown or Commercial Location
The answer to the second question about relating observed free flow speed to
safety is less definite. Speed was either not found to be significant for predicting crash count or severity or was significant with an unexpected coefficient (i.e., negative rather than positive). In the count models, the coefficient on speed when significant had a negative coefficient, indicating that an increase in speed would reduce the expected crash
38
count. In the severity count models, an increase in speed increases the count of non-fatal crashes but is not significantly related to the count of fatal crashes. In predicting the severity of a single crash, an increase in speed reduces the expected severity for some area types, increases the expected severity for some others, and is not significant for the rest. The most plausible interpretation of these results is that higher speed is actually related to the occurrence of fatal crashes, but because there were so few of these in the data set, that relationship was not significant. Another problem was that the observed running speed is related to most of the other independent variables available to the models, so that in conjunction with those variables, the speed became insignificant. More observation locations and more sophisticated statistical analyses are needed to estimate meaningful results, both of which are beyond the scope of work for this project.
The less than definitive answer to the second question limits the scope of the possibility to answer the third question. Although a definitive relationship between speed and safety was not found, it is known for certain that a crash with a higher impact speed than another crash will tend to be more severe than a crash with a lower impact speed (Kloeden et al. 1997), especially for pedestrians and bicyclists. Also, perceptions of safety can be important for place-making and the public’s acceptance of walking and bicycling as travel modes, and the presence of high speed traffic through a neighborhood reduces the attractiveness of the space for sidewalk and storefront activity. Consequently, it is reasonable to use reduced vehicle running speeds as a surrogate measure of effectiveness for safety in areas with significant pedestrian and sidewalk activity, or areas where such activity is desired or to be promoted, such as village and town centers, and residential neighborhoods. This objective suggests the following recommendations for designing roads and other elements of the right of way with respect to desired vehicle speeds:
1. Wide shoulders should only be used on roads intended for high speed through traffic, such as inter-urban roads in open land. Wide shoulders should be avoided in town and village centers or other areas where high speed traffic would be considered disruptive to the community.
2. Sidewalks and on-street parking should be considered wherever there is potential street activity, such as collections of shops and homes or in the vicinity of public institutions.
By following these guidelines, the road and roadside characteristics can be used to help enforce the desired vehicle running speed.
6.2 Illustration of Findings This section presents photo pairings of observation sites that are virtually identical
in all but one of the features found to be most significant for predicting free flow speed. The following three factors are compared:
• Building setbacks • Sidewalks • On-street parking
In each photo pair, other characteristics such as the usable pavement width, AADT and the speed limit are virtually identical.

39
6.2.1 Building Setbacks Figure 6-1 presents photographs of two roads with the following characteristics in
common: • 28-ft cross-section • 30-mph speed limit The observed average running speed, AADT and building setback value are given
next to each photo. The road with the large building setbacks has a mean speed almost 10 mph higher than the road with the small building setbacks.
Mean speed = 42.3 mph ADT = 3800 veh/day Setback = large
Mean speed = 32.6 mph ADT = 7800 veh/day Setback = small
Figure 6-1. Comparison of Running Speed by Building Setback
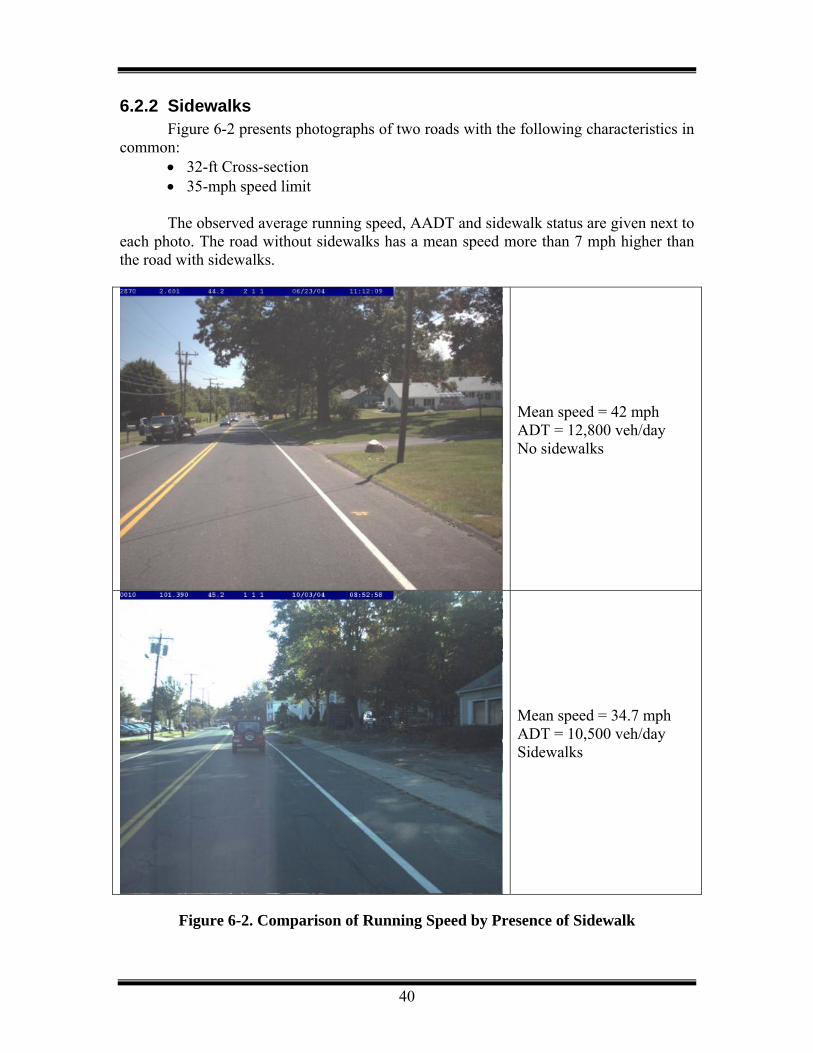
40
6.2.2 Sidewalks Figure 6-2 presents photographs of two roads with the following characteristics in
common: • 32-ft Cross-section • 35-mph speed limit The observed average running speed, AADT and sidewalk status are given next to
each photo. The road without sidewalks has a mean speed more than 7 mph higher than the road with sidewalks.
Mean speed = 42 mph ADT = 12,800 veh/day No sidewalks
Mean speed = 34.7 mph ADT = 10,500 veh/day Sidewalks
Figure 6-2. Comparison of Running Speed by Presence of Sidewalk

41
6.2.3 On-Street Parking Figure 6-3 presents photographs of two sections of the same road about a mile
apart in the same town (Rte. 77 in Guilford). The pavement widths are different, as one location has on-street parking but the other doesn’t. However, the pavement width at the site without parking is about the same as the width of the travel lanes at the site with parking.
The observed average running speed and AADT and parking situation are given next to each photo. The section without on-street parking has a mean speed more than 13 mph higher than the section with on-street parking.
Mean speed = 33.2 mph ADT = 5500 veh/day No parking
Mean speed = 20 mph ADT = 6900 veh/day Heavy Parking
Figure 6-3. Comparison of Running Speed by Presence of On-Street Parking

42
6.3 Conclusion and Recommendations The findings from this project clearly demonstrate that through careful,
intentional selection of roadway and roadside design elements, it is possible to influence the running speed of traffic on a road. It appears that drivers indeed take cues from elements of the roadway and roadside environment to decide how fast to drive and these cues are independent of the posted speed limit and other considerations that might be important to the community for reducing speeds. So the good news is that it is possible to influence drivers’ choice of speed through design of roadway and roadside elements; but the bad news is that many existing roads cue drivers to travel much faster than the posted speed limit and the community would like.
The analysis for this report defined two different types of roads, “streets” and “highways”, based on basic roadway design elements. Streets generally had very narrow shoulders, no shoulders or on-street parking, with un-mountable curbs and often with sidewalks, and were most commonly found in urban environments. Highways generally had edge striping rather than curbing and a range of shoulder widths, and generally no on-street parking, and were most commonly found in suburban or rural environments. Streets tend to have characteristics associated with lower vehicle speeds, such as on-street parking and sidewalks, and highways have characteristics associated with higher vehicle speeds, such as wide shoulders and no curbs.
Consequently, it may be convenient to use these two definitions to create a simple scheme for designing roads to cue drivers to using an appropriate speed for the environment. This scheme is to define two classes of roadway, each with a range of possible design details that are to be used in different environments depending on the surrounding land environment. For example, any road in a location with urban or residential land use should be designed as a street, and the highway design scheme should only be used in locations with suburban commercial or rural land use, generally with large building setbacks. Table 6-2 lists the recommended implementation context (land use classification) and design parameters for each road type. Table 6-3 gives the expected free flow speed on streets for different combinations of critical factors and Table 6-4 and Table 6-5 for highways in rural and suburban commercial areas, respectively (the shading on the tables indicates bands of similar speed ranges).
Table 6-2. Recommended Design Parameters by Road Type
Roadway or Roadside Feature Street Highway Implementation Context Downtown
General Urban Urban Commercial Urban Residential Suburban Residential
Suburban Commercial or Rural, with large building setbacks
Lane width ≤ 11 ft > 11 ft Shoulder width ≤ 2 ft > 2 ft On-street parking Recommended Optional Curbs and sidewalks Recommended Optional Expected speeds See Table 6-3 See Table 6-4 and Table 6-5

43
Table 6-3. Expected Speeds on Streets by Land Use Type, Level of Parking and Posted Speed Limit
Posted Speed Limit (mph) Land Use Type Parking
25 30 35 Downtown Heavy 27.6 29.7 30.1 None 29.9 32.0 32.5 General Urban Heavy 32.4 34.5 34.9 None 34.7 36.8 37.3 Urban Residential Heavy 33.4 35.5 35.9 None 35.7 37.8 38.2 Suburban Residential Heavy 34.9 37.0 37.5 None 37.3 39.4 39.8
Table 6-4. Expected Speeds on Highways in Rural Areas by Shoulder Width, Presence of Parking and Speed Limit (with Large Building Setbacks and no
Sidewalks)
Posted Speed Limit (mph) Shoulder Width Parking 25 30 35 40 45
≤ 2 ft Yes 39.3 41.9 43.3 45.5 46.9 No 40.8 43.4 44.8 47.0 48.4 > 2 and ≤ 6 ft Yes 39.8 42.4 43.8 46.0 47.4 No 41.3 43.9 45.3 47.5 48.9 > 6 ft Yes 40.6 43.2 44.6 46.8 48.2 No 42.1 44.7 46.1 48.3 49.7
Table 6-5. Expected Speeds on Highways in Suburban Commercial Areas by Shoulder Width, Level of Parking and Speed Limit (with Large Building Setbacks
and no Sidewalks)
Posted Speed Limit (mph) Shoulder Width Parking 25 30 35 40 45
≤ 2 ft Yes 34.8 37.4 38.7 41.0 42.4 No 36.3 38.9 40.2 42.5 43.9 > 2 and ≤ 6 ft Yes 35.3 37.9 39.2 41.5 42.9 No 36.8 39.3 40.7 43.0 44.4 > 6 ft Yes 36.1 38.7 40.0 42.3 43.7 No 37.6 40.2 41.5 43.8 45.2

44
REFERENCES
Anderson, R. W. G., Mclean, A. J., Farmer, M. J. B., Lee, B. H., Brooks, C. G. (1997). Vehicle Travel Speed and the Incidence of Fatal Pedestrian Crashes. Accident Analysis and Prevention. Vol. 36, p. 667-674.
Daisa, J. M., and Peers, J. B. (1997). Narrow Residential Streets: Do They Really Slow Down Speeds? ITE Annual Meeting Compendium 1997, p. 546-551.
Davidse, R., Driel, V. C., Goldenbeld, C. (2004). The Effect Of Altered Road Markings On Speed And Lateral Position-A Meta Analysis. SWOV Institute for Road Safety Research, The Netherlands.
Drottenborg, H. (1999). Aesthetics and Safety in Traffic Environments. Department of Technology and Society. Lund Institute of Technology. Traffic Planning. Lund, Sweden.
European Transport Safety Council (ETSC) (1995). Reducing Traffic Injuries Resulting from Excess and Inappropriate Speed.
Ewing, Reid, (1999). Traffic Calming: State of the Practice, Institute of Transportation Engineers.
FHWA (1992). The effects of Raising and Lowering Speed Limits on Selected Roadway Sections. US. Department of Transportation. Federal Highway Administration. Report No. FHWA-RD-92-082.
Fitzpatrick, K., Blaschke, J.D., Shamburger, C.B., Krammes, R.A., Fambro, D.B. (1995). Compatibility of Design Speed, Operating Speed, and Posted Speed. FHWA/TX-95/1465-2F; Res Rept 1465-2F; TTI: 0-1465.
Fitzpatrick, K., Carlson, P.J., Wooldridge, M.D., and Brewer, M.A. (2000). Design Factors that Affect Driver Speed on Suburban Arterials. Texas Transportation Institute; Texas Department of Transportation; Federal Highway Administration, FHWA/TX-00/1769-3.
Fitzpatrick, K., Carlson, P., Brewer, M; Wooldridge, M., Miaou, S. (2003). Design Speed, Operating Speed and Posted Speed Practices. NCHRP Report 504, Project 15-18 FY'98, Transportation Research Board, Washington DC.
Gårder, P.E. (2004). The Impact of Speed and Other Variables on Pedestrian Safety in Maine, Accident Analysis and Prevention. Vol. 36, p. 533-542.
Gattis, J. L., Watts A. (1999). Urban Street Speed Related To Width and Functional Class. Journal of Transportation Engineering, Vol. 125, No. 3, p. 193-200.
Greene, D.L., Keller, M. (2002). Dissent on Safety Issues: Fuel Economy and Highway Safety, Effectiveness and Impact of Corporate Average Fuel Economy (CAFÉ) Standards. National Academies Press, Washington, DC.
Greene, W.H. (2003). Econometric Analysis. Fifth Edition, Prentice Hall, New Jersey. Haas, K. J., Jones, B.P., Kirk, A.R. (2003). The Effect of Law Enforcement Deployment
Patterns on Motorists' Speeds. Oregon Department of Transportation and Federal Highway Administration, FHWA-OR-DF-04-04, Final Report.
Haglund M., Aberg L. (2002). Stability in Drivers’ Speed Choice. Transportation Research Part F, Vol. 5, p. 177-188.
Ivan, J. (2004). New Approach for Including Traffic Volumes in Crash Rate Analysis and Forecasting”, Transportation Research Record 1897, p. 134-141.
45
Kim, H. J., Noguchi, K. (2003). The Relationship between Speed Perception and Road Safety – An Attempt to Establish the “Illusion Engineering”, 6th Asian Design International Conference, Japan.
Kloeden, C. N., McLean, A. J., Moore, V. M., Ponte, G. (1997). Traveling Speed and the Risk of Crash Involvement. NHMRC Road Accident Research Unit, The University of Adelaide. http://casr.adelaide.edu.au/speed/
Kockelman, KM., Kweon, Y. (2002). Driver Injury Severity: An Application of Ordered Probit Models. Accident Analysis and Prevention, Vol. 33, p. 313-21.
Lave, C.A. (1985). Speeding, Coordination, and the 55-MPH Limit, American Economic Review, Vol. 75, p. 1159-1164.
Lum, H. S. (1984). The Use of Road Markings to Narrow Lanes for Controlling Speed in Residential Areas, ITE Journal, Vol. 54, No. 6, p. 50–53.
Marconi, W. (1997). Speed Control Measures in Residential Areas. Traffic Engineering, Vol. 47, p. 28-30.
Martens, M., Comte, S., Kaptein, N. (1997). The Effect of Road Design on Speed Behavior: A Literature Review. European Commission under the Transport RTD Programme.
Miaou, S.P. (1994). The Relationship between Truck Accidents and Geometric Design of Road Sections: Poisson Versus Negative Binomial Regressions, Accident Analysis and Prevention. Vol. 26, p. 471-482.
Neter, J., Kutner, M.H., Nachtsheim, C.J., Wasserman, W. (1996). Applied Linear Statistical Models, WCB/ McGraw-Hill Press, New York, NY, Chapter 14, p. 567-627.
NHTSA (2003). Traffic Safety Facts 2003, Speeding. National Highway Traffic Safety Administration, DOT HS 809 771.
Ossenbruggen, P.J., Pendharkar, J., Ivan, J.N. (2001). Roadway Safety in Rural and Small Urbanized Areas. Accident Analysis and Prevention, Vol. 33, p. 485-498.
Poe, C., and Mason Jr., M. (2000). Analyzing Influence of Geometric Design on Operating Speeds along Low-Speed Urban Streets: Mixed Model Approach. Transportation Research Record 173, p. 18-25.
Rakauskas, M.E., Gugerty, L.J., Ward N.J. (2004). Effects of Naturalistic Cell Phone Conversations on Driving Performance. Journal of Safety Research, Vol. 35, p. 453-464.
Schurr, K. S., McCoy, P. T., Pesti, G., Huff, R. (2002). Relationship of Design, Operating, and Posted Speed on Horizontal Curves of Rural Two-Lane Highways in Nebraska. Transportation Research Record 1796, p. 60-71.
Shankar, V., Mannering F., Barfield, W. (1995). Effect of Roadway Geometrics and Environmental Factors on Rural Freeway Accident Frequencies. Accident Analysis and Prevention. Vol. 27, p. 371-389.
Smoker, D., Tarris, J. P., Mason, J. M. (1996). Relationship between Zonal Variables and Individual Vehicle Speeds on Low-Speed Urban Streets. ITE Annual Meeting Compendium. p. 341-345.
Stokes, M.E., Davis, C.S., Koch, G.G. (2001). Categorical Data Analysis Using the SAS System. 2nd Edition. WA (Wiley-SAS).

46
Sugiura, N. (1978). Further analysis of the data by Akaike’s information criterion and the finite corrections, Communications in Statistics, Theory and Methods A7, p. 13-26.
Ullman, G. L., and Dudek, C. L. (1987). Effects of Reduced Speed Limits in Rapidly Developing Urban Fringe Areas, Transportation Research Record 1114, p. 45-53.
Van der Horst, R., Kaptein, N. (1996). Self-Explaining Roads. Transportation Research Record 1550, Washington,. DC, p. 30-36.
Vogel, K. (2002). What Characterizes a “Free Vehicle” in an Urban Area? Transportation Research Part F, Vol. 5, p. 15-29.
Wang, Y.H, Nihan, N. (2004). Estimating the Risk of Collisions between Bicycles and Motor Vehicles at Signalized Intersections. Accident Analysis and Prevention. Vol. 36, p. 313-321.
Zajac, S.S, Ivan, J.N. (2003). Factors Influencing Injury Severity of Motor Vehicle - Crossing Pedestrian Crashes in Rural Connecticut, Accident Analysis and Prevention, Vol. 35, p. 369-379.

47
APPENDIX A: OBSERVED DATA
Table A-1: Speed Characteristics Table A-2: Roadway Characteristics Table A-3: Roadside Characteristics Table A-4: AADT Data by Year, 1996 to 2000 Table A-5: AADT Data by Year, 2001 to 2004 and Average Table A-6: Crash Data Definitions of values in the tables: Shoulder Width 0 None None 1 Small ≤ 2 ft 2 Medium > 2 and ≤ 6 ft 3 Large > 6 ft Parking Merged Categories0 None None/negligible 1 Negligible None/negligible 2 Light Present 3 Heavy Present Setback 1 Small ≤ 30 ft 2 Medium > 30 and ≤ 70 ft 3 Large > 70 ft Land Use Type (see Table 3-1) DT Downtown GU General Urban UR Urban Residential UC Urban Commercial SR Suburban Residential SC Suburban Commercial RU Rural

48
Table A-1. Speed Characteristics
Road Name (Rt #) Beginning Road (Landmark)
Ending Road (Landmark) Town
Mile-post Start
Mile-post End
Road Type
+
Pos-ted
Speed
Mean Speed
S. D. of
Speed
Speed 85th %ile
Jackson St Ash St Summit St Windham 1 30 36.1 4.7 42 Boulevard Mountain Rd Ridgewood Rd W Hartford 1 35 37.3 4.3 42 Boulevard Ridgewood Rd Woodrow St W Hartford 1 35 38.8 4.6 43 Mountain Rd Hedwig Court Farmington Av W Hartford 1 25 35.9 4.5 41 Mountain Rd Flagg Rd Mountain Farm Rd W Hartford 1 30 41.1 4.5 46 Mountain Rd Richmond Ln Fairfield Rd W Hartford 1 30 41.1 4.8 46 Flagg Rd Coolidge Rd Blue Ridge Ln W Hartford 1 30 38.2 5.0 43 Asylum Av Lincoln Av Trout Brook Dr W Hartford 2 35 41.8 4.5 46 Farmington Av Trout Brook Dr Ardmore Rd W Hartford 1 35 36.1 4.6 41 Farmington Av N. Quaker Ln Whiting Ln W Hartford 1 35 33.0 4.7 37 Farmington Av Whiting Ln Highland St W Hartford 1 35 33.2 4.1 37 Prospect Av Cone St Farmington Av Hartford 1 30 34.2 5.1 39 Prospect Av Asylum Av Fern St Hartford 1 30 40.0 5.4 45 Prospect Av Asylum Av Albany Av Hartford 1 25 39.2 4.9 44 Prospect Av Farmington Av West Boulevard Hartford 1 30 36.0 4.6 41 Fern St Concord St Steele Rd W Hartford 2 30 38.2 4.3 42 Fern St N. Quaker Ln Trout Brook Dr W Hartford 1 25 35.1 5.0 41 Fern St Clifton Av Cobbs Rd W Hartford 1 30 36.9 4.1 41 Fern St Fernbel Lane Cobbs Rd W Hartford 1 30 37.4 4.7 42 Lake St Montauk Dr Phoenix St Vernon 2 35 38.6 4.7 43 Washington St Phoenix St Brookview St Vernon 2 25 41.9 5.6 46 Central Av Hickory St 13th St Norwich 1 25 29.8 4.3 35 Spring Hill Rd Storrs Rd Mansfield 1 25 37.1 5.1 43 Colony St Brooks St Church St Meriden 1 25 31.0 3.7 35 Oakwood Av Park Rd W Hartford 1 30 37.8 4.4 42 White St (Driveway b/f garage) Bates Pl Danbury 1 25 32.2 3.4 36 Deer Hill Rd Wilson St Wooster Rd Danbury 1 25 36.0 4.0 39 Main St Newberry St Pleasant Rd So Windsor 1 35 37.1 4.8 42 Broadway Broad St Chelsea Parade S Norwich 1 25 36.3 4.5 41

49
Road Name (Rt #) Beginning Road (Landmark)
Ending Road (Landmark) Town
Mile-post Start
Mile-post End
Road Type
+
Pos-ted
Speed
Mean Speed
S. D. of
Speed
Speed 85th %ile
Fairfield Av Ansonia St Fairfield Rd Spur Hartford 1 30 39.3 4.8 44 Fairfield Av Freeman St Maple Av Hartford 1 30 35.3 4.6 39 Flatbush Av Oakwood Av S. Quaker Ln W Hartford 1 25 38.7 4.2 42 Grand St State St Field St Waterbury 1 25 29.9 3.9 33 Main St Montowese St Harrison Av Branford 1 25 25.6 3.5 29 Park Rd S. Quaker Ln Washington Cir W Hartford 1 30 32.8 3.8 37 Quaker Ln Farmington Av Boulevard W Hartford 1 30 37.2 4.7 42 South Quaker Ln Flatbush Av Wilfred St W Hartford 1 35 40.6 3.5 44 Asylum Av Griswold Dr N. Quaker Lane W Hartford 2 35 40.8 4.0 45 Ella T Grasso Blvd Glenn Rd Crescent St New Haven 1 25 39.4 4.7 44 Boston Post Rd (Rt 1) Mansfield Av Sedgwick Av Darien 11.66 11.74 1 25 31.3 4.4 37 Boston Post Rd (Rt 1) Sedgwick Ave Brookside Rd Darien 11.74 11.95 1 35 35.9 3.9 40 Boston Post Rd (Rt 1) Brookside Rd Old King Hwy N Darien 11.98 12.27 1 35 36.4 3.5 40 North Av (Rt 1) James St Oak St Bridgeport 29.26 29.57 1 25 35.3 5.4 41 North Av (Rt 1) Catherine St #2 Fairmount St Bridgeport 29.67 29.85 1 25 35.4 4.3 40 Bridgeport Av (Rt 1) Kerema Av Spring St Millford 35.53 35.71 1 30 37.5 4.2 42 Columbus Av (Rt 1) Davenport Av West St New Haven 46.69 47.06 1 25 37.2 5.7 43 North Main St (Rt 1) Cherry Hill Rd Liesi Lane Branford 54.32 54.55 2 45 42.9 3.8 46 North Main St (Rt 1) Cedar St Ivy St Branford 54.81 55.02 2 45 42.4 5.1 48 North Main St (Rt 1) Ivy St Pvt Dr Branford 55.02 55.27 2 45 41.5 5.2 46 Boston Post Rd (Rt 1) River St Fair St/Cherry St Guilford 62.83 62.98 2 35 34.7 4.8 40 Boston Post Rd (Rt 1) Village Walk Dunkin Donut Exit Guilford 63.59 63.97 2 45 40.2 5.6 47 Boston Post Rd (Rt 1) (horizontal curve) Old Post Rd Madison 66.46 66.83 2 35 43.6 4.5 48 Boston Post Rd (Rt 1) Britton lane Island Av Madison 67.49 67.72 2 35 35.9 3.8 39 Boston Post Rd (Rt 1) Wall St Scotland Av Madison 68.07 68.30 2 30 32.6 3.2 36 East Main St (Rt 1) Waterside Ln Morgan Park Clinton 72.06 72.16 1 25 33.3 3.6 37 Boston Post Rd (Rt 1) 309 Boston Post Rd Springbrook Rd Old Saybrook 81.28 81.58 2 40 40.3 4.0 44 Boston Post Rd (Rt 1) After Townwoods Rd B/4 Grassy Hill Rd Old Lyme 86.57 86.70 2 45 40.0 3.9 44 Bank St (Rt 1) Backwith St Braemer Pl (De) New London 98.32 98.50 1 25 33.5 3.6 37 Boston Post Rd (Rt 1) Guilford Med Bldg Exit Op East Creek Guilford Newfield St (Rt 3) Rose Circle WB Congdon St E Middletown 0.76 1.12 2 40 40.4 5.5 46 Shunpike Rd (Rt 3) Court St Freihofers Bakery Dr Cromwell 4.78 5.05 2 45 44.5 5.2 50 Cromwell Av (Rt 3) Shunpike Business Ctr Inwood Rd Rocky Hill 5.63 5.80 2 45 43.3 4.7 47

50
Road Name (Rt #) Beginning Road (Landmark)
Ending Road (Landmark) Town
Mile-post Start
Mile-post End
Road Type
+
Pos-ted
Speed
Mean Speed
S. D. of
Speed
Speed 85th %ile
Maple St (Rt 3) Harvest Lane Westerly Terr Rocky Hill 7.66 7.88 2 40 45.2 4.0 49 Maple St (Rt 3) Sandy Dr Hang Dog Lane Rocky Hill 7.92 8.19 2 40 45.4 4.5 50 Maple St (Rt 3) Gilbert Av Two Stone Dr Wethersfield 8.41 8.96 2 40 43.0 4.5 48 Maple St (Rt 3) Griswold Rd Butler St (One way) Wethersfield 9.01 9.29 2 35 42.1 5.5 48 Maple St (Rt 3) Kimball Rd Charter Rd Wethersfield 9.44 9.69 2 35 43.1 4.8 47 Newsfield St (Rt 3) Wilderman's Way Middletown 2 40 41.6 5.0 47 Sharon Tpke (Rt 4) Bartholomew Rd (horizontal curve) Goshen 14.00 14.44 2 45 51.1 4.9 56 Sharon Tpke (Rt 4) School Hill Rd West St Goshen 16.52 16.92 2 40 47.4 5.0 52 Migeon Av (Rt 4) Gardenhurst Av Torrington 22.34 22.51 2 35 39.0 4.4 43 North Elm St (Rt 4) Migeon Av Eagle St Torrington 22.89 23.23 2 25 34.6 4.2 39 Main St Rourke Pl Elm St Farmington 38.39 38.67 2 30 40.8 4.9 46 Farmington Av W. Avon Rd (Rt 167) Beyond Walnut St Farmington 39.10 39.47 2 35 42.1 4.8 47 State St (Rt 5) Edmund St London Dr Hamden 1.76 2.04 2 45 41.4 4.9 46 State St (Rt 5) Fernwood Dr Foote St Hamden 2.23 2.62 2 45 45.3 4.6 50 State St (Rt 5) Stevens St Daniel Rd Hamden 2.71 3.08 2 45 43.7 4.7 48 S. Colony St (Rt 5) Ward St Prince St Wallingford 11.09 11.31 1 30 34.3 3.9 38 N. Colony St (Rt 5) Church St Christian St Wallingford 11.55 11.82 1 30 33.7 3.8 37 N. Colony St (Rt 5) Wallace Row North St Wallingford 11.87 12.14 1 30 36.7 4.1 41 S. Broad St (Rt 5) Green Rd Layman Av Meriden 15.60 15.90 2 40 39.4 4.3 44 S. Broad St (Rt 5) Hall Av Gale Av Meriden 16.06 16.45 1 35 40.0 4.6 45 Broad St (Rt 5) Ann St Silver St Meriden 16.47 16.70 1 35 40.1 4.5 43 Broad St (Rt 5) Atkins St Sherman Av Meriden 17.98 18.18 1 35 37.4 4.7 42 N Broad St (Rt 5) Clark St Golden St Meriden 18.55 18.77 2 35 43.9 4.2 48 King St Depot Hill Rd AT&T Entrance Enfield 48.60 48.92 2 45 47.2 5.0 52 Enfield St (Rt 5) Orbit Dr Post Office Rd Enfield 50.38 50.76 2 45 44.8 4.7 50 Enfield St (Rt 5) Enfield Terr Fairview Av Enfield 51.32 51.91 2 45 45.6 3.9 50 Fitch St (Rt 10) Crescent St. Dyer St. New Haven 3.79 3.98 1 25 38.3 4.3 42 Arch St (Rt 10) Local Wamer St Alstrum St Hamden 4.77 4.94 1 25 29.6 3.5 33 S. Main St (Rt 10) Bradford Dr Cook Hill Rd Cheshire 14.31 14.72 2 40 47.2 4.7 54 S Main St (Rt 10) Bradford Dr Mt Sanford Rd Cheshire 14.31 14.02 2 40 45.6 3.8 50 S. Main St (Rt 10) Cook Hill Rd Brentwood Dr. Cheshire 14.72 15.53 2 40 43.0 4.0 47 South Main St (Rt 10) Werking St Buckland St Southington 22.65 23.00 2 35 41.6 4.3 46 Hopmeadow St (Rt 10) Plank Hill Rd Seminary Rd Simsbury 45.30 45.66 2 35

51
Road Name (Rt #) Beginning Road (Landmark)
Ending Road (Landmark) Town
Mile-post Start
Mile-post End
Road Type
+
Pos-ted
Speed
Mean Speed
S. D. of
Speed
Speed 85th %ile
Laurel Hill Rd (Rt 12) Hillcrest Rd Ridgewood Dr Norwich 10.28 10.50 2 35 N. Main St (Rt 12) East Main St Russell St Jewett City 21.05 21.51 1 25 31.8 5.2 37 Middletown Av (Rt 17) Flint St Cross St New Haven 1.10 0.82 2 35 42.9 5.3 49 Main St (Rt 17) Old Maids Lane Great Pond Rd (Pvt) Glastonbury 30.89 31.30 2 40 46.0 5.0 51 Ellington Rd (Rt 30) Overpass (I-291) 1.64 km b/f Chapel Rd So Windsor 0.55 0.74 2 45 47.4 5.1 52 Ellington Rd (Rt 30) Chapel Rd (1.640km) Parkview Dr So Windsor 0.86 1.40 2 40 43.4 4.6 48 Ellington Rd (Rt 30) Northview Dr Lakewood Dr (Pvt) So Windsor 1.57 1.90 2 40 43.4 4.6 48 Hartford Turnpike (Rt 30) Mt. Vernon Dr South St Vernon 11.50 11.95 2 45 42.8 4.3 46
Hartford Turnpike (Rt 30) (Tolland Town Line) (Industrial Park) Vernon 12.55 12.71 2 45 43.9 4.4 48
Grove St (Rt 31) Fern St Hale St Ext. Vernon 0.36 0.65 2 30 40.5 4.7 46 Bread & Milk St (Rt 31) N. School Rd Zeya Dr Coventry 4.76 4.24 2 40 48.9 5.5 55 Main St (Rt 31) Wright Mill Rd Dunkin Donuts Coventry 7.05 7.23 2 40 42.2 4.2 46 Main St (Rt 31) Talcott Hill Rd Dexter Rd Coventry 8.38 8.14 2 40 47.1 4.4 51 Main St (Rt 31) Beverly Tr Sam Green Rd Coventry 8.87 8.62 2 35 45.9 5.0 51 Main St (Rt 31) Monument Hill Rd Mason St Coventry 11.25 11.53 2 30 38.9 4.3 44 Main St (Rt 31) Plains Rd South St Ext Coventry 13.05 13.30 2 45 47.4 4.3 51 West Thames (Rt 32) Dunham St Brown St Norwich 11.25 11.52 1 25 Washington St (Rt 2/32) Taylor Dr Chelsea Parade S Norwich 12.91 13.07 2 25 37.9 4.4 42 Windham Rd (Rt 32) Seldon St Old Plains Rd Windham 27.97 27.71 2 40 46.1 5.4 51 Pleasant St (Rt 32) John St Mountain St Windham 28.64 29.01 2 25 37.4 4.6 42 Stafford Rd (Rt 32) Jude Ln Coventry Rd Mansfield 33.18 33.86 2 40 River Rd (Rt 32) Pinney Hill Rd Willington 41.03 41.19 2
S. Main St (Rt 41) (Private Dr) Cornwall Bridge Rd (Rt 4) Sharon 4.13 4.33 2 35 41.9 5.0 5
N. Main St (Rt 41) Cornwall Bridge Rd (Rt 4) West Main St Sharon 4.36 4.56 2 30 37.9 5.7 44
Gay St (Rt 41) Calkinstown Rd Rhynus Rd Sharon 5.18 5.65 2 30 38.8 6.2 46 N. Brookvale Rd (Rt 42) Long Hill Rd King Rd Cheshire 12.86 13.15 2 25 35.9 4.4 40 Main Rd (Rt 44) Porter St Bostwick St Salisbury 3.14 3.31 2 30 39.0 5.3 45 Center St (Rt 44) Thomas Dr Adams St South Manchester 70.99 71.16 2 35 43.4 4.4 47 School St (Rt 44) May St Providence St (Rt 171) Putnam 100.12 100.38 1 30 33.7 4.3 37

52
Road Name (Rt #) Beginning Road (Landmark)
Ending Road (Landmark) Town
Mile-post Start
Mile-post End
Road Type
+
Pos-ted
Speed
Mean Speed
S. D. of
Speed
Speed 85th %ile
South St (Rt 53) Coal Pit Hill Rd Starr Rd Danbury 21.89 21.63 1 25 38.3 4.4 42 Stratfield Rd (Rt 59) Cornell Rd Brooklawn Pkwy (SB) Fairfield 1.29 1.47 2 35 38.4 5.2 44 Stratfield Rd (Rt 59) Argonne St Gate Ridge Rd Fairfield 2.17 2.45 2 35 38.7 4.8 44 Easton Tpke (Rt 59) Wellner Dr Shady Brook Rd Fairfield 3.01 3.33 2 30 34.2 4.2 38 South St (Rt 63) West St Old South Rd Litchfield 34.86 34.41 2 30 39.5 4.9 44 North St (Rt 63) West St Norfolk Rd Litchfield 35.03 35.54 2 35 45.3 5.9 50 Main St (Rt 66) Wall St (Rt 316) Savings Institute Hebron 26.07 26.47 2 35 41.6 5.2 46 Main St (Rt 66) Winter St Tingley St Windham 35.41 35.57 1 25 30.9 4.0 36 Main St (Rt 66) High St North St Windham 35.74 35.99 1 25 24.0 3.7 28 Percival Av (Rt 71) Near Kenton St Carbo Lane Berlin 10.27 10.57 2 30 38.1 5.1 43 New Britain Rd (Rt 71) Langdon Ct Newton St Berlin 11.55 12.00 2 35 38.5 4.0 43 S Main St (Rt 71) Veterans Dr South St New Britain 12.38 12.56 2 25 40.4 6.1 45 Stanley St (Rt 71) Roxbury Rd / Stanley St Stratford Rd New Britain 15.12 15.31 2 30 38.8 4.9 44 Stanley St (Rt 71) Blake Rd Drury Lane New Britain 16.00 16.27 2 30 38.8 4.2 43 East Main St (Rt 72) Horizontal Curve Lincoln Av Bristol 6.47 6.88 2 35 40.8 4.9 46 School St (Rt 72) Main St (Rt 72) Church St / N Main St Bristol 9.58 9.70 1 25 33.9 30.1 36 Park St (Rt 72) Divinity St Tulip St Bristol 9.97 10.31 1 25 39.7 48.4 40 Park St (Rt 72) Tulip St Muzzy St Bristol 10.31 10.43 1 25 35.3 4.9 40 Park St (Rt 72) Dutton St Spruce St Bristol 10.55 10.80 1 25 37.8 4.9 42 Wapping Wood Rd (Rt 74) Grant Rd Near Eva Circle #1 Ellington 3.65 3.87 2 30 40.8 4.7 45
Wapping Wood Rd (Rt 74) Hillsdale Dr Windsorville Rd Ellington 4.00 4.23 2 30 39.2 4.9 44
Union St (Rt 74) Rheel St Orchard St Vernon 6.04 6.15 1 30 37.3 4.1 42 East Main St Ann St Snipsic St Vernon 7.11 7.47 1 30 38.2 5.6 44 Tolland Av (Rt 74) Kingsbury Av Vernon 7.77 8.05 2 30 43.9 4.9 50 Poquonook Av (Rt 75) Pigeon Hill Rd Tiffany Dr Windsor 0.85 1.07 2 40 41.4 4.8 46 Poquonook Av (Rt 75) near Hansom Hill Rd near Hansom Hill Rd Windsor 2.45 2.60 2 35 43.5 4.0 48 South Main St (Rt 75) Kent Av High St Suffield 9.46 9.87 2 35 41.5 4.8 46 North Main St (Rt 75) Day Av (horizontal curve) Suffield 10.29 10.64 2 35 44.7 3.4 48 North St (Rt 75) Mapleton Av (Rt 190) Suffield 11.02 11.58 2 45 45.7 5.2 51 N Main St (Rt 75) Mapleton Av (Rt 190) Russell St Suffield 11.02 10.76 2 35 43.0 4.7 48 North St (Rt 75) Halladay Longview Dr Windsor 12.07 12.56 2 45 48.8 5.3 55

53
Road Name (Rt #) Beginning Road (Landmark)
Ending Road (Landmark) Town
Mile-post Start
Mile-post End
Road Type
+
Pos-ted
Speed
Mean Speed
S. D. of
Speed
Speed 85th %ile
Whitfield St (Rt 77) Boston St (Rt 146) Broad St Guilford 0.00 0.19 1 25 20.0 4.2 25 Church St (Rt 77) Broad St Boston Post Rd (US 1) Guilford 0.25 0.50 2 25 33.2 3.8 37 Church St (Rt 77) Boston Post Rd (US 1) End of School Prop Guilford 0.50 0.87 2 25 35.7 2.8 39 Foxon Rd (Rt 80) River Rd Circle Dr East Haven 2.75 2.99 2 45 47.4 4.6 51 Foxon Rd (Rt 80) Edward Rd Sunset Rd No Branford 4.29 3.97 2 45 46.4 4.4 50 Winthrop Rd (Rt 80) Woodbury Rd Town Park Deep River 23.55 23.91 2 40 46.9 4.1 51 Elm St (Rt 80) Union St Main St (Rt 154) Deep River 25.73 25.91 1 25 29.2 3.6 32 High St (Rt 81) Central Av John St Clinton 0.16 0.37 2 30 38.1 4.3 42 High St (Rt 81) Old Mill Rd (De) PVT Dr B/4 High St Clinton 0.47 0.63 2 40 36.8 4.8 42 Clinton Rd (Rt 81) Stevens Rd Green Hill Rd Killingworth 5.21 5.57 2 40 46.8 4.6 51 Higganum Rd (Rt 81) Old Bedford Farm Rd Tooley Rd (Rt 148) Killingworth 8.00 8.29 2 40 45.5 3.1 49 Manchester Rd (Rt 83) Chimney Sweep Hill Rd Eastbury Hill Rd Glastonbury 0.38 0.55 2 35 42.6 4.3 47 Manchester Rd (Rt 83) Shoddy Mill Rd (2.063 miles away) Glastonbury 1.85 2.05 2 30 40.6 4.4 45 Manchester Rd (Rt 83) Howe St Fairway Crossing Glastonbury 3.81 4.11 2 30 41.8 4.2 46 S. Main St (Rt 83) Fairway Crossing (Pvt) NA Manchester 4.55 4.81 2 30 42.4 4.0 46 S. Main St (Rt 83) Jct B/4 Fern St Golf Course Manchester 5.47 5.91 2 35 41.0 3.3 44 S. Main St (Rt 83) Lakewood Circle South Spring St Manchester 6.09 6.28 2 35 39.1 4.4 44 Main St (Rt 83) Delmont St (Cds) Firehouse Manchester 8.15 8.49 1 30 35.5 4.0 39 Oakland St (Rt 83) Sheldon Rd Rachel Rd Manchester 9.29 9.55 2 35 39.4 5.2 46 Oakland St (Rt 83) Tudor La (Pvt) South St Manchester 9.63 9.80 2 35 41.3 4.1 46 J Trumbull Hwy (Rt 87) Samuel Hill Rd Latham Hill Rd Columbia 11.12 11.49 2 45 47.4 5.0 52 Hebron Av (Rt 94) Wickham Rd Pinnacle Ln Glastonbury 2.24 2.47 2 35 42.6 4.0 46 Taftville Occum Rd (Rt 97) DOT Garage Hooper St Norwich 2.31 2.78 2 30 40.1 4.8 44
Main St (Rt 97) River St Brookside Av Sprague 4.89 5.30 1 25 36.4 5.9 42 Main St (Rt 99) Evergreen Rd Court St Cromwell 2.25 2.63 2 40 43.0 2.1 46 Main St (Rt 99) Court St Park Place Cromwell 2.63 2.88 2 40 42.0 3.8 46 Main St (Rt 99) Evensen Place Sunset Dr Cromwell 3.03 3.48 2 40 47.1 4.9 51 Quinnipiac Av (Rt 103) Hemingway Place Foxon Hill Rd New Haven 0.49 0.80 2 35 41.9 5.3 47 Nichols Av (Rt 108) Montrose Pl Calfornia St Stratford 0.13 0.32 2 35 40.3 4.0 45 Nichols Av (Rt 108) Marcroft St Greenfield Av Stratford 0.65 0.89 2 35 40.4 3.9 44 Branch Rd (Rt 109) NA Old Branch Rd #2 Thomaston 20.19 20.52 2 40 48.8 5.5 55 Branch Rd (Rt 109) Old Branch Rd #2 Edgewood Av Thomaston 20.52 20.88 2 40 46.7 5.0 52

54
Road Name (Rt #) Beginning Road (Landmark)
Ending Road (Landmark) Town
Mile-post Start
Mile-post End
Road Type
+
Pos-ted
Speed
Mean Speed
S. D. of
Speed
Speed 85th %ile
East Main St (Rt 110) Sunnyside Ter Wakelee Stratford 0.50 0.72 2 35 39.9 4.6 44 East Main St (Rt 110) Evergreen Dr/Diane Ter Marchant Dr Stratford 0.76 1.19 2 35 42.0 4.8 46 Interlaken Rd / Lime Rock Rd (Rt 112) Sharon Rd (Rt 41) Town Hill Rd (Pvt) Salisbury 2.05 2.45 2 40 46.0 4.4 50
Oak Bluff Av (Rt 113) Stratford Rd Roundabout Stratford 2.33 2.60 2 30 36.6 4.6 42 Prospect Dr (RT 113) Lordship Rd Ivy/Stratford Rd Stratford 2.72 3.10 2 30 38.6 5.3 44 Stratford Rd (Rt 113) Prospect Dr Short Beach Rd Stratford 3.10 3.67 2 30 42.2 4.9 47 Main St (Rt 113) Birdseye St South Av Stratford 5.11 5.33 2 35 39.3 5.0 45 Main St (Rt 115) Tremont St Bridge St Ansonia 1.62 1.71 1 25 28.0 3.1 31 Main St (Rt 115) Bridge St Maple St Ansonia 1.71 1.97 1 25 27.7 3.3 31 Slater Av (Rt 138) Lincoln Sq Ann St Jewett City 6.27 6.69 2 30 38.3 4.7 42
Elm St (Rt 140) Ash Dr Southwest Av /Woodland St Windsor Lcks 0.54 0.82 2 40 43.2 4.7 48
Elm St (Rt 140) Southwest Av South Elm St Windsor Lcks 0.82 1.21 2 40 40.1 3.9 44 Elm St (Rt 140) Briarcliff Dr (De) South Center St Windsor Lcks 1.48 1.96 2 35 38.7 4.3 43 Maple St (Rt 140) Church St School Entrance Ellington 12.84 13.35 2 35 41.1 5.4 46 South Main St (Rt 146) Eades St Montowese St Branford 0.84 1.07 1 25 33.8 4.3 38 Boston St (Rt 146) Wheaton Av Lovers Lane Guilford 11.84 12.08 2 25 32.0 5.1 37
Westchester Rd (Rt 149) Just after curve (12.10 km) Pickerel Lake Rd Colchester 6.38 6.07 2 40 48.1 5.0 53
Woodhouse Av (Rt 150) Wheatfield Dr Harrison Rd Wallingford 2.18 2.47 2 35 43.4 4.8 49 Woodhouse Av (Rt 150) Liandina Rd Harrison Av Wallingford 3.36 2.47 2 35 38.1 3.9 42 Center St (Rt 150) Pomeroy Av N Elm St Wallingford 4.44 4.65 2 30 38.4 4.0 43 Center St (Rt 150) South Orchard South Colony (Rt 5) Wallingford 4.99 5.16 1 25 29.6 3.6 33 N. Turnpike Rd (Rt 150) Stetson St Knollwood Dr Wallingford 6.45 6.69 2 35 38.5 4.2 42 Great Hammock Rd (Rt 154) Old Boston Post Rd Oyester Pl Old Saybrook 0.12 0.58 2 35 39.1 5.4 43
College St (Rt 154) Marina Point Dr Willard Av Old Saybrook 4.60 4.88 2 35 38.0 4.0 42 College St (Rt 154) Dana Dr N Cove Rd Old Saybrook 4.92 5.17 2 35 37.9 5.7 42 Main St (Rt 154) Union St Elm/River St Deep River 14.01 14.42 2 30 39.0 3.8 42 Main St (Rt 154) Elm/River St High St Deep River 14.42 14.57 1 30 28.1 4.7 31 Main St (Rt 156) Pennsylvania Av Columbus Av East Lyme 19.01 18.55 1 25 30.7 5.0 35 Palisado Av (Rt 159) North Meadow Rd Old Kennedy Rd Windsor 4.31 4.93 2 45 43.3 5.4 49
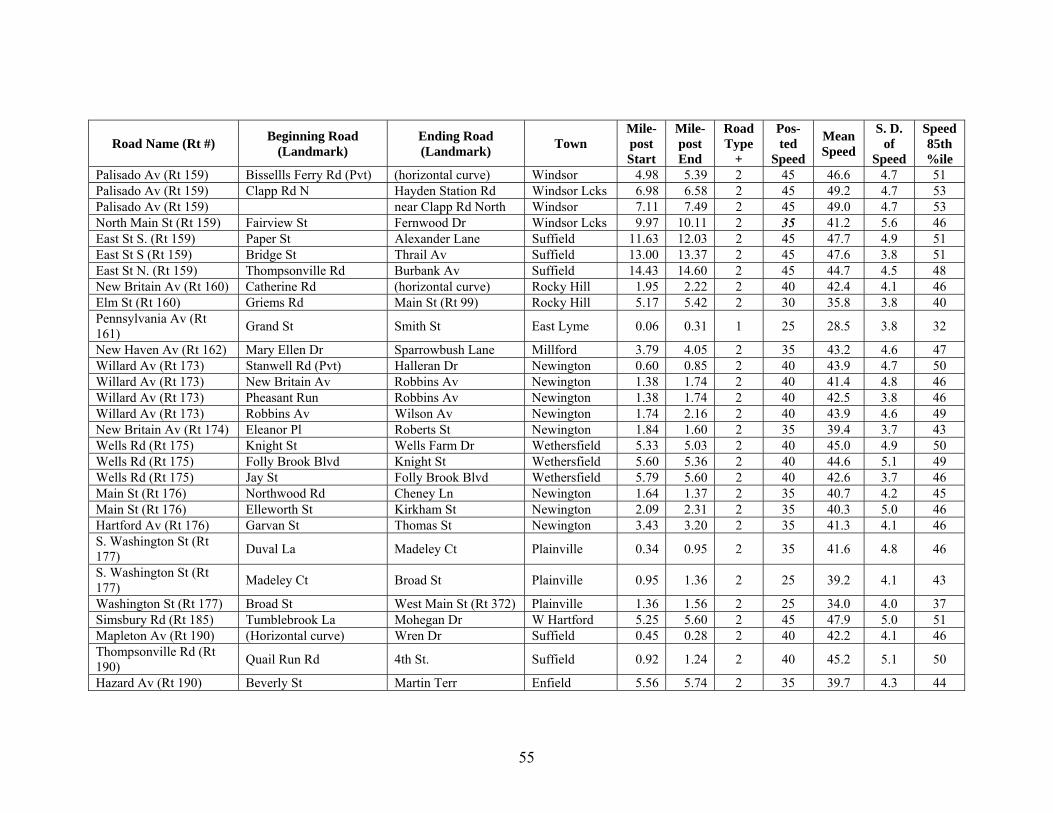
55
Road Name (Rt #) Beginning Road (Landmark)
Ending Road (Landmark) Town
Mile-post Start
Mile-post End
Road Type
+
Pos-ted
Speed
Mean Speed
S. D. of
Speed
Speed 85th %ile
Palisado Av (Rt 159) Bissellls Ferry Rd (Pvt) (horizontal curve) Windsor 4.98 5.39 2 45 46.6 4.7 51 Palisado Av (Rt 159) Clapp Rd N Hayden Station Rd Windsor Lcks 6.98 6.58 2 45 49.2 4.7 53 Palisado Av (Rt 159) near Clapp Rd North Windsor 7.11 7.49 2 45 49.0 4.7 53 North Main St (Rt 159) Fairview St Fernwood Dr Windsor Lcks 9.97 10.11 2 35 41.2 5.6 46 East St S. (Rt 159) Paper St Alexander Lane Suffield 11.63 12.03 2 45 47.7 4.9 51 East St S (Rt 159) Bridge St Thrail Av Suffield 13.00 13.37 2 45 47.6 3.8 51 East St N. (Rt 159) Thompsonville Rd Burbank Av Suffield 14.43 14.60 2 45 44.7 4.5 48 New Britain Av (Rt 160) Catherine Rd (horizontal curve) Rocky Hill 1.95 2.22 2 40 42.4 4.1 46 Elm St (Rt 160) Griems Rd Main St (Rt 99) Rocky Hill 5.17 5.42 2 30 35.8 3.8 40 Pennsylvania Av (Rt 161) Grand St Smith St East Lyme 0.06 0.31 1 25 28.5 3.8 32
New Haven Av (Rt 162) Mary Ellen Dr Sparrowbush Lane Millford 3.79 4.05 2 35 43.2 4.6 47 Willard Av (Rt 173) Stanwell Rd (Pvt) Halleran Dr Newington 0.60 0.85 2 40 43.9 4.7 50 Willard Av (Rt 173) New Britain Av Robbins Av Newington 1.38 1.74 2 40 41.4 4.8 46 Willard Av (Rt 173) Pheasant Run Robbins Av Newington 1.38 1.74 2 40 42.5 3.8 46 Willard Av (Rt 173) Robbins Av Wilson Av Newington 1.74 2.16 2 40 43.9 4.6 49 New Britain Av (Rt 174) Eleanor Pl Roberts St Newington 1.84 1.60 2 35 39.4 3.7 43 Wells Rd (Rt 175) Knight St Wells Farm Dr Wethersfield 5.33 5.03 2 40 45.0 4.9 50 Wells Rd (Rt 175) Folly Brook Blvd Knight St Wethersfield 5.60 5.36 2 40 44.6 5.1 49 Wells Rd (Rt 175) Jay St Folly Brook Blvd Wethersfield 5.79 5.60 2 40 42.6 3.7 46 Main St (Rt 176) Northwood Rd Cheney Ln Newington 1.64 1.37 2 35 40.7 4.2 45 Main St (Rt 176) Elleworth St Kirkham St Newington 2.09 2.31 2 35 40.3 5.0 46 Hartford Av (Rt 176) Garvan St Thomas St Newington 3.43 3.20 2 35 41.3 4.1 46 S. Washington St (Rt 177) Duval La Madeley Ct Plainville 0.34 0.95 2 35 41.6 4.8 46
S. Washington St (Rt 177) Madeley Ct Broad St Plainville 0.95 1.36 2 25 39.2 4.1 43
Washington St (Rt 177) Broad St West Main St (Rt 372) Plainville 1.36 1.56 2 25 34.0 4.0 37 Simsbury Rd (Rt 185) Tumblebrook La Mohegan Dr W Hartford 5.25 5.60 2 45 47.9 5.0 51 Mapleton Av (Rt 190) (Horizontal curve) Wren Dr Suffield 0.45 0.28 2 40 42.2 4.1 46 Thompsonville Rd (Rt 190) Quail Run Rd 4th St. Suffield 0.92 1.24 2 40 45.2 5.1 50
Hazard Av (Rt 190) Beverly St Martin Terr Enfield 5.56 5.74 2 35 39.7 4.3 44
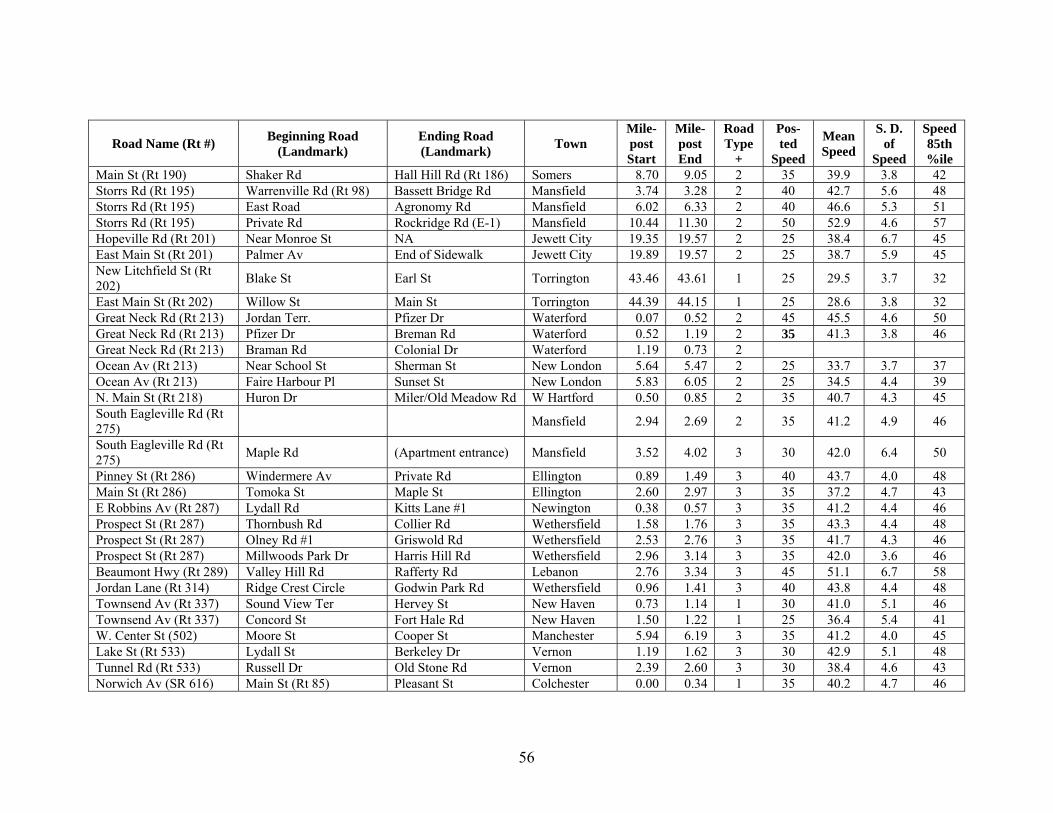
56
Road Name (Rt #) Beginning Road (Landmark)
Ending Road (Landmark) Town
Mile-post Start
Mile-post End
Road Type
+
Pos-ted
Speed
Mean Speed
S. D. of
Speed
Speed 85th %ile
Main St (Rt 190) Shaker Rd Hall Hill Rd (Rt 186) Somers 8.70 9.05 2 35 39.9 3.8 42 Storrs Rd (Rt 195) Warrenville Rd (Rt 98) Bassett Bridge Rd Mansfield 3.74 3.28 2 40 42.7 5.6 48 Storrs Rd (Rt 195) East Road Agronomy Rd Mansfield 6.02 6.33 2 40 46.6 5.3 51 Storrs Rd (Rt 195) Private Rd Rockridge Rd (E-1) Mansfield 10.44 11.30 2 50 52.9 4.6 57 Hopeville Rd (Rt 201) Near Monroe St NA Jewett City 19.35 19.57 2 25 38.4 6.7 45 East Main St (Rt 201) Palmer Av End of Sidewalk Jewett City 19.89 19.57 2 25 38.7 5.9 45 New Litchfield St (Rt 202) Blake St Earl St Torrington 43.46 43.61 1 25 29.5 3.7 32
East Main St (Rt 202) Willow St Main St Torrington 44.39 44.15 1 25 28.6 3.8 32 Great Neck Rd (Rt 213) Jordan Terr. Pfizer Dr Waterford 0.07 0.52 2 45 45.5 4.6 50 Great Neck Rd (Rt 213) Pfizer Dr Breman Rd Waterford 0.52 1.19 2 35 41.3 3.8 46 Great Neck Rd (Rt 213) Braman Rd Colonial Dr Waterford 1.19 0.73 2 Ocean Av (Rt 213) Near School St Sherman St New London 5.64 5.47 2 25 33.7 3.7 37 Ocean Av (Rt 213) Faire Harbour Pl Sunset St New London 5.83 6.05 2 25 34.5 4.4 39 N. Main St (Rt 218) Huron Dr Miler/Old Meadow Rd W Hartford 0.50 0.85 2 35 40.7 4.3 45 South Eagleville Rd (Rt 275) Mansfield 2.94 2.69 2 35 41.2 4.9 46
South Eagleville Rd (Rt 275) Maple Rd (Apartment entrance) Mansfield 3.52 4.02 3 30 42.0 6.4 50
Pinney St (Rt 286) Windermere Av Private Rd Ellington 0.89 1.49 3 40 43.7 4.0 48 Main St (Rt 286) Tomoka St Maple St Ellington 2.60 2.97 3 35 37.2 4.7 43 E Robbins Av (Rt 287) Lydall Rd Kitts Lane #1 Newington 0.38 0.57 3 35 41.2 4.4 46 Prospect St (Rt 287) Thornbush Rd Collier Rd Wethersfield 1.58 1.76 3 35 43.3 4.4 48 Prospect St (Rt 287) Olney Rd #1 Griswold Rd Wethersfield 2.53 2.76 3 35 41.7 4.3 46 Prospect St (Rt 287) Millwoods Park Dr Harris Hill Rd Wethersfield 2.96 3.14 3 35 42.0 3.6 46 Beaumont Hwy (Rt 289) Valley Hill Rd Rafferty Rd Lebanon 2.76 3.34 3 45 51.1 6.7 58 Jordan Lane (Rt 314) Ridge Crest Circle Godwin Park Rd Wethersfield 0.96 1.41 3 40 43.8 4.4 48 Townsend Av (Rt 337) Sound View Ter Hervey St New Haven 0.73 1.14 1 30 41.0 5.1 46 Townsend Av (Rt 337) Concord St Fort Hale Rd New Haven 1.50 1.22 1 25 36.4 5.4 41 W. Center St (502) Moore St Cooper St Manchester 5.94 6.19 3 35 41.2 4.0 45 Lake St (Rt 533) Lydall St Berkeley Dr Vernon 1.19 1.62 3 30 42.9 5.1 48 Tunnel Rd (Rt 533) Russell Dr Old Stone Rd Vernon 2.39 2.60 3 30 38.4 4.6 43 Norwich Av (SR 616) Main St (Rt 85) Pleasant St Colchester 0.00 0.34 1 35 40.2 4.7 46

57
Road Name (Rt #) Beginning Road (Landmark)
Ending Road (Landmark) Town
Mile-post Start
Mile-post End
Road Type
+
Pos-ted
Speed
Mean Speed
S. D. of
Speed
Speed 85th %ile
Main St (Rt 800) King St Scoville St Torrington 1.67 1.87 3 25 29.2 3.2 32 Main St (Rt 800) Linden St East Albert St Torrington 2.10 2.28 1 25 29.2 2.9 32 Thomaston Av (Rt 847) Plaza Driveway W. Main St Waterbury 4.25 3.96 3 35 38.5 5.1 44 Thomaston Av (Rt 847) Shefield St Boyden St Waterbury 6.22 6.10 1 25 33.3 4.8 38 Thomaston Av (Rt 847) Driggs St Shefield St Waterbury 6.32 6.22 1 25 36.4 4.4 41 Thomaston Av (Rt 847) Plaza driveway Huntingdon Av Waterbury 3

58
Table A-2. Roadway Characteristics
Road Name (Rt #) Beginning Road (Landmark)
Ending Road (Landmark) Town
Mile-post Start
Mile-post End
Roadwidth
(ft)
Lane width
(ft)
Shoul-der
Bike Lane
Park-ing
Jackson St Ash St Summit St Windham 31.0 15.5 0 None 0 Boulevard Mountain Rd Ridgewood Rd W Hartford 40.0 20.0 0 None 0 Boulevard Ridgewood Rd Woodrow St W Hartford 40.0 20.0 0 None 0 Mountain Rd Hedwig Court Farmington Av W Hartford 28.0 14.0 0 None 0 Mountain Rd Flagg Rd Mountain Farm Rd W Hartford 28.0 14.0 0 None 0 Mountain Rd Richmond Ln Fairfield Rd W Hartford 28.0 14.0 0 None 0 Flagg Rd Coolidge Rd Blue Ridge Ln W Hartford 20.0 10.0 0 None 0 Asylum Av Lincoln Av Trout Brook Dr W Hartford 40.0 11.0 3 None 0 Farmington Av Trout Brook Dr Ardmore Rd W Hartford 48.0 24.0 0 no 2 Farmington Av N. Quaker Ln Whiting Ln W Hartford 48.0 24.0 0 None 3 Farmington Av Whiting Ln Highland St W Hartford 48.0 24.0 0 None 2 Prospect Av Cone St Farmington Av Hartford 40.0 20.0 0 None 3 Prospect Av Asylum Av Fern St Hartford 40.0 20.0 0 None 0 Prospect Av Asylum Av Albany Av Hartford 22.0 11.0 0 None 0 Prospect Av Farmington Av West Boulevard Hartford 40.0 20.0 0 None 3 Fern St Concord St Steele Rd W Hartford 36.0 12.0 2 None 0 Fern St N. Quaker Ln Trout Brook Dr W Hartford None 0 Fern St Clifton Av Cobbs Rd W Hartford 30.0 15.0 0 None 0 Fern St Fernbel Lane Cobbs Rd W Hartford None 0 Lake St Montauk Dr Phoenix St Vernon 0 Washington St Phoenix St Brookview St Vernon 0 Central Av Hickory St 13th St Norwich 40.0 20.0 0 None 3 Spring Hill Rd Storrs Rd Mansfield 0 Colony St Brooks St Church St Meriden 46.0 15.0 0 None 3 Oakwood Av Park Rd W Hartford 30.0 18.0 0 None 0 White St (Driveway b/f garage) Bates Pl Danbury 36.0 18.0 0 None 0 Deer Hill Rd Wilson St Wooster Rd Danbury 36.0 18.0 0 None 1 Main St Newberry St Pleasant Rd So Windsor 34.0 17.0 0 None 0 Broadway Broad St Chelsea Parade S Norwich 34.0 17.0 0 None 0

59
Road Name (Rt #) Beginning Road (Landmark)
Ending Road (Landmark) Town
Mile-post Start
Mile-post End
Roadwidth
(ft)
Lane width
(ft)
Shoul-der
Bike Lane
Park-ing
Fairfield Av Ansonia St Fairfield Rd Spur Hartford 38.0 19.0 0 None 1 Fairfield Av Freeman St Maple Av Hartford 38.0 19.0 0 None 1 Flatbush Av Oakwood Av S. Quaker Ln W Hartford 44.0 22.0 0 None 0 Grand St State St Field St Waterbury 46.0 25.0 0 None 3 Main St Montowese St Harrison Av Branford 26.0 13.0 0 None 3 Park Rd S. Quaker Ln Washington Cir W Hartford 29.0 14.5 0 None 3 Quaker Ln Farmington Av Boulevard W Hartford 40.0 20.0 0 None 2 South Quaker Ln Flatbush Av Wilfred St W Hartford 40.0 20.0 0 None 1 Asylum Av Griswold Dr N. Quaker Lane W Hartford 40.0 12.0 3 None 1 Ella T Grasso Blvd Glenn Rd Crescent St New Haven 31.0 10.5 2 Both 1 Boston Post Rd (Rt 1) Mansfield Av Sedgwick Av Darien 11.66 11.74 46.0 23.0 0 None 2 Boston Post Rd (Rt 1) Sedgwick Ave Brookside Rd Darien 11.74 11.95 44.0 22.0 0 None 0 Boston Post Rd (Rt 1) Brookside Rd Old King Hwy N Darien 11.98 12.27 42.0 21.0 0 None 0 North Av (Rt 1) James St Oak St Bridgeport 29.26 29.57 38.0 13.0 0 None 2 North Av (Rt 1) Catherine St #2 Fairmount St Bridgeport 29.67 29.85 34.0 13.0 0 None 2 Bridgeport Av (Rt 1) Kerema Av Spring St Millford 35.53 35.71 44.0 22.0 0 None 0 Columbus Av (Rt 1) Davenport Av West St New Haven 46.69 47.06 36.0 14.0 0 None 3 North Main St (Rt 1) Cherry Hill Rd Liesi Lane Branford 54.32 54.55 37.0 12.0 3 None 0 North Main St (Rt 1) Cedar St Ivy St Branford 54.81 55.02 40.5 12.0 3 None 0 North Main St (Rt 1) Ivy St Pvt Dr Branford 55.02 55.27 36.0 12.0 2 None 0 Boston Post Rd (Rt 1) River St Fair St/Cherry St Guilford 62.83 62.98 35.0 13.0 2 None 0 Boston Post Rd (Rt 1) Village Walk Dunkin Donut Exit Guilford 63.59 63.97 43.0 13.0 3 None 0 Boston Post Rd (Rt 1) (horizontal curve) Old Post Rd Madison 66.46 66.83 40.0 12.0 3 None 0 Boston Post Rd (Rt 1) Britton lane Island Av Madison 67.49 67.72 None 0 Boston Post Rd (Rt 1) Wall St Scotland Av Madison 68.07 68.30 29.0 12.0 1 None 0 East Main St (Rt 1) Waterside Ln Morgan Park Clinton 72.06 72.16 40.0 20.0 0 None 0 Boston Post Rd (Rt 1) 309 Boston Post Rd Springbrook Rd Old Saybrook 81.28 81.58 33.0 13.0 2 None 0 Boston Post Rd (Rt 1) After Townwoods Rd B/4 Grassy Hill Rd Old Lyme 86.57 86.70 30.0 12.0 2 None 0 Bank St (Rt 1) Backwith St Braemer Pl (De) New London 98.32 98.50 45.0 22.5 0 None 0 Boston Post Rd (Rt 1) Guilford Med Bldg Exit Op East Creek Guilford Newfield St (Rt 3) Rose Circle WB Congdon St E Middletown 0.76 1.12 29.0 13.0 1 None 0 Shunpike Rd (Rt 3) Court St Freihofers Bakery Dr Cromwell 4.78 5.05 34.8 12.0 2 None 0 Cromwell Av (Rt 3) Shunpike Business Ctr Inwood Rd Rocky Hill 5.63 5.80 28.0 12.0 1 None 0

60
Road Name (Rt #) Beginning Road (Landmark)
Ending Road (Landmark) Town
Mile-post Start
Mile-post End
Roadwidth
(ft)
Lane width
(ft)
Shoul-der
Bike Lane
Park-ing
Maple St (Rt 3) Harvest Lane Westerly Terr Rocky Hill 7.66 7.88 35.5 13.0 2 None 0 Maple St (Rt 3) Sandy Dr Hang Dog Lane Rocky Hill 7.92 8.19 35.0 12.0 2 None 0 Maple St (Rt 3) Gilbert Av Two Stone Dr Wethersfield 8.41 8.96 28.4 12.0 1 None 0 Maple St (Rt 3) Griswold Rd Butler St (One way) Wethersfield 9.01 9.29 32.5 12.0 2 None 0 Maple St (Rt 3) Kimball Rd Charter Rd Wethersfield 9.44 9.69 31.5 11.5 2 None 0 Newsfield St (Rt 3) Wilderman's Way Middletown 30.0 12.0 2 None 0 Sharon Tpke (Rt 4) Bartholomew Rd (horizontal curve) Goshen 14.00 14.44 35.5 12.0 2 None 0 Sharon Tpke (Rt 4) School Hill Rd West St Goshen 16.52 16.92 36.0 12.5 2 None 0 Migeon Av (Rt 4) Gardenhurst Av Torrington 22.34 22.51 36.0 12.0 2 None 0 North Elm St (Rt 4) Migeon Av Eagle St Torrington 22.89 23.23 31.0 11.0 2 None 0 Main St Rourke Pl Elm St Farmington 38.39 38.67 28.0 12.0 1 None 0 Farmington Av W. Avon Rd (Rt 167) Beyond Walnut St Farmington 39.10 39.47 30.0 12.0 2 None 0 State St (Rt 5) Edmund St London Dr Hamden 1.76 2.04 40.0 14.5 2 None 0 State St (Rt 5) Fernwood Dr Foote St Hamden 2.23 2.62 41.0 14.0 3 None 0 State St (Rt 5) Stevens St Daniel Rd Hamden 2.71 3.08 40.0 15.0 2 None 0 S. Colony St (Rt 5) Ward St Prince St Wallingford 11.09 11.31 38.0 19.0 0 None 1 N. Colony St (Rt 5) Church St Christian St Wallingford 11.55 11.82 39.0 19.5 0 None 0 N. Colony St (Rt 5) Wallace Row North St Wallingford 11.87 12.14 38.5 19.0 0 None 0 S. Broad St (Rt 5) Green Rd Layman Av Meriden 15.60 15.90 42.5 14.5 3 None 0 S. Broad St (Rt 5) Hall Av Gale Av Meriden 16.06 16.45 40.0 20.0 0 None 1 Broad St (Rt 5) Ann St Silver St Meriden 16.47 16.70 40.0 20.0 0 None 1 Broad St (Rt 5) Atkins St Sherman Av Meriden 17.98 18.18 40.0 20.0 0 None 1 N Broad St (Rt 5) Clark St Golden St Meriden 18.55 18.77 44.5 13.0 3 None 0 King St Depot Hill Rd AT&T Entrance Enfield 48.60 48.92 40.0 15.0 2 None 0 Enfield St (Rt 5) Orbit Dr Post Office Rd Enfield 50.38 50.76 40.0 12.0 3 None 0 Enfield St (Rt 5) Enfield Terr Fairview Av Enfield 51.32 51.91 39.0 12.5 3 None 0 Fitch St (Rt 10) Crescent St. Dyer St. New Haven 3.79 3.98 36.0 18.0 0 None 0 Arch St (Rt 10) Local Wamer St Alstrum St Hamden 4.77 4.94 23.0 11.5 0 None 0 S. Main St (Rt 10) Bradford Dr Cook Hill Rd Cheshire 14.31 14.72 40.0 14.0 3 None 0 S Main St (Rt 10) Bradford Dr Mt Sanford Rd Cheshire 14.31 14.02 42.0 14.0 3 None 0 S. Main St (Rt 10) Cook Hill Rd Brentwood Dr. Cheshire 14.72 15.53 47.0 14.0 3 None 0 South Main St (Rt 10) Werking St Buckland St Southington 22.65 23.00 32.5 13.0 2 None 0 Hopmeadow St (Rt 10) Plank Hill Rd Seminary Rd Simsbury 45.30 45.66

61
Road Name (Rt #) Beginning Road (Landmark)
Ending Road (Landmark) Town
Mile-post Start
Mile-post End
Roadwidth
(ft)
Lane width
(ft)
Shoul-der
Bike Lane
Park-ing
Laurel Hill Rd (Rt 12) Hillcrest Rd Ridgewood Dr Norwich 10.28 10.50 N. Main St (Rt 12) East Main St Russell St Jewett City 21.05 21.51 36.0 18.0 0 None 3 Middletown Av (Rt 17) Flint St Cross St New Haven 1.10 0.82 38.5 11.5 3 Both 0 Main St (Rt 17) Old Maids Lane Great Pond Rd (Pvt) Glastonbury 30.89 31.30 28.0 12.0 1 None 0 Ellington Rd (Rt 30) Overpass (I-291) 1.64 km b/f Chapel Rd So Windsor 0.55 0.74 28.0 12.0 1 None 0 Ellington Rd (Rt 30) Chapel Rd (1.640km) Parkview Dr So Windsor 0.86 1.40 Ellington Rd (Rt 30) Northview Dr Lakewood Dr (Pvt) So Windsor 1.57 1.90 Hartford Turnpike (Rt 30) Mt. Vernon Dr South St Vernon 11.50 11.95 32.0 12.0 2 None 0
Hartford Turnpike (Rt 30) (Tolland Town Line) (Industrial Park) Vernon 12.55 12.71 32.5 12.5 2 None 0
Grove St (Rt 31) Fern St Hale St Ext. Vernon 0.36 0.65 38.0 14.0 2 None 0 Bread & Milk St (Rt 31) N. School Rd Zeya Dr Coventry 4.76 4.24 30.0 11.0 2 None 0 Main St (Rt 31) Wright Mill Rd Dunkin Donuts Coventry 7.05 7.23 29.0 12.0 2 None 0 Main St (Rt 31) Talcott Hill Rd Dexter Rd Coventry 8.38 8.14 31.0 12.0 2 None 0 Main St (Rt 31) Beverly Tr Sam Green Rd Coventry 8.87 8.62 30.8 12.0 2 None 0 Main St (Rt 31) Monument Hill Rd Mason St Coventry 11.25 11.53 28.0 12.0 1 None 0 Main St (Rt 31) Plains Rd South St Ext Coventry 13.05 13.30 31.5 12.0 2 None 0 West Thames (Rt 32) Dunham St Brown St Norwich 11.25 11.52 None Washington St (Rt 2/32) Taylor Dr Chelsea Parade S Norwich 12.91 13.07 33.0 11.5 2 None 0 Windham Rd (Rt 32) Seldon St Old Plains Rd Windham 27.97 27.71 33.2 12.4 2 None 0 Pleasant St (Rt 32) John St Mountain St Windham 28.64 29.01 36.5 12.0 3 None 0 Stafford Rd (Rt 32) Jude Ln Coventry Rd Mansfield 33.18 33.86 River Rd (Rt 32) Pinney Hill Rd Willington 41.03 41.19 None
S. Main St (Rt 41) (Private Dr) Cornwall Bridge Rd (Rt 4) Sharon 4.13 4.33 30.0 12.0 2 None 0
N. Main St (Rt 41) Cornwall Bridge Rd (Rt 4) West Main St Sharon 4.36 4.56 35.0 10.5 3 None 0
Gay St (Rt 41) Calkinstown Rd Rhynus Rd Sharon 5.18 5.65 30.0 12.0 2 None 0 N. Brookvale Rd (Rt 42) Long Hill Rd King Rd Cheshire 12.86 13.15 26.0 11.0 2 None 0 Main Rd (Rt 44) Porter St Bostwick St Salisbury 3.14 3.31 36.0 12.0 2 None 0 Center St (Rt 44) Thomas Dr Adams St South Manchester 70.99 71.16 ? 3 None 0

62
Road Name (Rt #) Beginning Road (Landmark)
Ending Road (Landmark) Town
Mile-post Start
Mile-post End
Roadwidth
(ft)
Lane width
(ft)
Shoul-der
Bike Lane
Park-ing
School St (Rt 44) May St Providence St (Rt 171) Putnam 100.12
100.38 28.0 14.0 0 None 0
South St (Rt 53) Coal Pit Hill Rd Starr Rd Danbury 21.89 21.63 36.0 18.0 0 None 0 Stratfield Rd (Rt 59) Cornell Rd Brooklawn Pkwy (SB) Fairfield 1.29 1.47 37.0 12.0 3 None 0 Stratfield Rd (Rt 59) Argonne St Gate Ridge Rd Fairfield 2.17 2.45 38.0 13.0 3 None 0 Easton Tpke (Rt 59) Wellner Dr Shady Brook Rd Fairfield 3.01 3.33 35.0 13.0 2 None 0 South St (Rt 63) West St Old South Rd Litchfield 34.86 34.41 39.0 17.5 3 None 1 North St (Rt 63) West St Norfolk Rd Litchfield 35.03 35.54 None 0 Main St (Rt 66) Wall St (Rt 316) Savings Institute Hebron 26.07 26.47 None 0 Main St (Rt 66) Winter St Tingley St Windham 35.41 35.57 40.0 20.0 0 None 0 Main St (Rt 66) High St North St Windham 35.74 35.99 46.0 23.0 0 None 3 Percival Av (Rt 71) Near Kenton St Carbo Lane Berlin 10.27 10.57 26.5 11.5 1 None 0 New Britain Rd (Rt 71) Langdon Ct Newton St Berlin 11.55 12.00 28.5 12.0 1 None 0 S Main St (Rt 71) Veterans Dr South St New Britain 12.38 12.56 33.5 12.0 2 None 0 Stanley St (Rt 71) Roxbury Rd / Stanley St Stratford Rd New Britain 15.12 15.31 29.5 11.5 2 None 0 Stanley St (Rt 71) Blake Rd Drury Lane New Britain 16.00 16.27 33.0 11.5 2 None 0 East Main St (Rt 72) Horizontal Curve Lincoln Av Bristol 6.47 6.88 30.0 12.0 2 None 0 School St (Rt 72) Main St (Rt 72) Church St / N Main St Bristol 9.58 9.70 32.0 16.0 0 None 0 Park St (Rt 72) Divinity St Tulip St Bristol 9.97 10.31 28.0 14.0 0 None 0 Park St (Rt 72) Tulip St Muzzy St Bristol 10.31 10.43 28.0 14.0 0 None 0 Park St (Rt 72) Dutton St Spruce St Bristol 10.55 10.80 28.0 14.0 0 None 0 Wapping Wood Rd (Rt 74) Grant Rd Near Eva Circle #1 Ellington 3.65 3.87 22.0 10.0 1 None 0
Wapping Wood Rd (Rt 74) Hillsdale Dr Windsorville Rd Ellington 4.00 4.23 25.0 10.5 1 None 0
Union St (Rt 74) Rheel St Orchard St Vernon 6.04 6.15 34.5 17.0 0 None 0 East Main St Ann St Snipsic St Vernon 7.11 7.47 26.0 13.0 0 None 0 Tolland Av (Rt 74) Kingsbury Av Vernon 7.77 8.05 27.0 11.5 1 None 0 Poquonook Av (Rt 75) Pigeon Hill Rd Tiffany Dr Windsor 0.85 1.07 27.0 11.5 1 None 0 Poquonook Av (Rt 75) near Hansom Hill Rd near Hansom Hill Rd Windsor 2.45 2.60 29.5 11.5 2 None 0 South Main St (Rt 75) Kent Av High St Suffield 9.46 9.87 32.0 13.0 2 None 0 North Main St (Rt 75) Day Av (horizontal curve) Suffield 10.29 10.64 37.5 12.0 3 None 0 North St (Rt 75) Mapleton Av (Rt 190) Suffield 11.02 11.58

63
Road Name (Rt #) Beginning Road (Landmark)
Ending Road (Landmark) Town
Mile-post Start
Mile-post End
Roadwidth
(ft)
Lane width
(ft)
Shoul-der
Bike Lane
Park-ing
N Main St (Rt 75) Mapleton Av (Rt 190) Russell St Suffield 11.02 10.76 30.0 12.0 2 None 0 North St (Rt 75) Halladay Longview Dr Windsor 12.07 12.56 34.0 11.5 2 None 0 Whitfield St (Rt 77) Boston St (Rt 146) Broad St Guilford 0.00 0.19 34.0 12.0 2 None 0 Church St (Rt 77) Broad St Boston Post Rd (US 1) Guilford 0.25 0.50 Church St (Rt 77) Boston Post Rd (US 1) End of School Prop Guilford 0.50 0.87 41.0 14.0 0 None 3 Foxon Rd (Rt 80) River Rd Circle Dr East Haven 2.75 2.99 28.0 12.0 1 None 0 Foxon Rd (Rt 80) Edward Rd Sunset Rd No Branford 4.29 3.97 28.0 12.0 1 None 0 Winthrop Rd (Rt 80) Woodbury Rd Town Park Deep River 23.55 23.91 38.0 12.0 3 None 0 Elm St (Rt 80) Union St Main St (Rt 154) Deep River 25.73 25.91 33.0 12.0 2 None 0 High St (Rt 81) Central Av John St Clinton 0.16 0.37 40.0 12.0 3 None 0 High St (Rt 81) Old Mill Rd (De) PVT Dr B/4 High St Clinton 0.47 0.63 23.0 12.0 0 None 0 Clinton Rd (Rt 81) Stevens Rd Green Hill Rd Killingworth 5.21 5.57 26.0 11.5 1 None 0 Higganum Rd (Rt 81) Old Bedford Farm Rd Tooley Rd (Rt 148) Killingworth 8.00 8.29 26.0 11.5 1 None 0 Manchester Rd (Rt 83) Chimney Sweep Hill Rd Eastbury Hill Rd Glastonbury 0.38 0.55 27.0 11.5 1 None 0 Manchester Rd (Rt 83) Shoddy Mill Rd (2.063 miles away) Glastonbury 1.85 2.05 30.0 12.0 2 None 0 Manchester Rd (Rt 83) Howe St Fairway Crossing Glastonbury 3.81 4.11 29.0 12.0 1 None 0 S. Main St (Rt 83) Fairway Crossing (Pvt) NA Manchester 4.55 4.81 21.0 10.0 1 None 0 S. Main St (Rt 83) Jct B/4 Fern St Golf Course Manchester 5.47 5.91 21.0 10.0 1 None 0 S. Main St (Rt 83) Lakewood Circle South Spring St Manchester 6.09 6.28 Main St (Rt 83) Delmont St (Cds) Firehouse Manchester 8.15 8.49 28.5 12.0 2 None 0 Oakland St (Rt 83) Sheldon Rd Rachel Rd Manchester 9.29 9.55 30.0 12.0 2 None 0 Oakland St (Rt 83) Tudor La (Pvt) South St Manchester 9.63 9.80 35.0 17.5 0 None 0 J Trumbull Hwy (Rt 87) Samuel Hill Rd Latham Hill Rd Columbia 11.12 11.49 30.0 12.0 2 None 0 Hebron Av (Rt 94) Wickham Rd Pinnacle Ln Glastonbury 2.24 2.47 37.0 12.0 3 None 0 Taftville Occum Rd (Rt 97) DOT Garage Hooper St Norwich 2.31 2.78 26.0 11.0 1 None 0
Main St (Rt 97) River St Brookside Av Sprague 4.89 5.30 Main St (Rt 99) Evergreen Rd Court St Cromwell 2.25 2.63 40.0 13.0 3 None 0 Main St (Rt 99) Court St Park Place Cromwell 2.63 2.88 Main St (Rt 99) Evensen Place Sunset Dr Cromwell 3.03 3.48 Quinnipiac Av (Rt 103) Hemingway Place Foxon Hill Rd New Haven 0.49 0.80 39.0 12.5 3 None 0 Nichols Av (Rt 108) Montrose Pl Calfornia St Stratford 0.13 0.32 40.0 13.0 3 None 0 Nichols Av (Rt 108) Marcroft St Greenfield Av Stratford 0.65 0.89 39.0 12.5 3 None 0

64
Road Name (Rt #) Beginning Road (Landmark)
Ending Road (Landmark) Town
Mile-post Start
Mile-post End
Roadwidth
(ft)
Lane width
(ft)
Shoul-der
Bike Lane
Park-ing
Branch Rd (Rt 109) NA Old Branch Rd #2 Thomaston 20.19 20.52 35.0 12.0 2 None 0 Branch Rd (Rt 109) Old Branch Rd #2 Edgewood Av Thomaston 20.52 20.88 39.0 11.5 3 None 2 East Main St (Rt 110) Sunnyside Ter Wakelee Stratford 0.50 0.72 39.5 12.0 3 None 1 East Main St (Rt 110) Evergreen Dr/Diane Ter Marchant Dr Stratford 0.76 1.19 41.0 13.0 3 None 0 Interlaken Rd / Lime Rock Rd (Rt 112) Sharon Rd (Rt 41) Town Hill Rd (Pvt) Salisbury 2.05 2.45 33.0 13.0 2 None 0
Oak Bluff Av (Rt 113) Stratford Rd Roundabout Stratford 2.33 2.60 37.0 12.0 3 None 0 Prospect Dr (RT 113) Lordship Rd Ivy/Stratford Rd Stratford 2.72 3.10 28.5 11.5 2 None 0 Stratford Rd (Rt 113) Prospect Dr Short Beach Rd Stratford 3.10 3.67 30.0 12.0 2 None 0 Main St (Rt 113) Birdseye St South Av Stratford 5.11 5.33 28.0 11.0 2 None 0 Main St (Rt 115) Tremont St Bridge St Ansonia 1.62 1.71 31.0 11.5 2 None 0 Main St (Rt 115) Bridge St Maple St Ansonia 1.71 1.97 30.5 11.5 2 None 0 Slater Av (Rt 138) Lincoln Sq Ann St Jewett City 6.27 6.69 38.0 12.5 2 None 0
Elm St (Rt 140) Ash Dr Southwest Av /Woodland St Windsor Lcks 0.54 0.82 40.0 12.0 0 None 3
Elm St (Rt 140) Southwest Av South Elm St Windsor Lcks 0.82 1.21 40.0 12.0 0 None 3 Elm St (Rt 140) Briarcliff Dr (De) South Center St Windsor Lcks 1.48 1.96 30.5 12.0 2 None 0 Maple St (Rt 140) Church St School Entrance Ellington 12.84 13.35 34.0 12.0 2 None 0 South Main St (Rt 146) Eades St Montowese St Branford 0.84 1.07 34.0 12.0 2 None 0 Boston St (Rt 146) Wheaton Av Lovers Lane Guilford 11.84 12.08 28.0 12.0 1 None 0
Westchester Rd (Rt 149) Just after curve (12.10 km) Pickerel Lake Rd Colchester 6.38 6.07 30.5 12.0 2 None 0
Woodhouse Av (Rt 150) Wheatfield Dr Harrison Rd Wallingford 2.18 2.47 27.0 13.5 0 None 0 Woodhouse Av (Rt 150) Liandina Rd Harrison Av Wallingford 3.36 2.47 28.5 10.0 2 Both 1 Center St (Rt 150) Pomeroy Av N Elm St Wallingford 4.44 4.65 21.5 10.0 1 None 0 Center St (Rt 150) South Orchard South Colony (Rt 5) Wallingford 4.99 5.16 32.0 11.5 2 None 0 N. Turnpike Rd (Rt 150) Stetson St Knollwood Dr Wallingford 6.45 6.69 23.5 10.5 1 None 0 Great Hammock Rd (Rt 154) Old Boston Post Rd Oyester Pl Old Saybrook 0.12 0.58 35.0 11.0 3 None 0
College St (Rt 154) Marina Point Dr Willard Av Old Saybrook 4.60 4.88 46.0 23.0 0 None 3 College St (Rt 154) Dana Dr N Cove Rd Old Saybrook 4.92 5.17 32.5 13.0 2 None 0 Main St (Rt 154) Union St Elm/River St Deep River 14.01 14.42 29.5 11.0 2 None 0 Main St (Rt 154) Elm/River St High St Deep River 14.42 14.57 31.0 11.5 2 None 0

65
Road Name (Rt #) Beginning Road (Landmark)
Ending Road (Landmark) Town
Mile-post Start
Mile-post End
Roadwidth
(ft)
Lane width
(ft)
Shoul-der
Bike Lane
Park-ing
Main St (Rt 156) Pennsylvania Av Columbus Av East Lyme 19.01 18.55 26.0 11.0 1 None 0 Palisado Av (Rt 159) North Meadow Rd Old Kennedy Rd Windsor 4.31 4.93 31.5 12.0 2 None 0 Palisado Av (Rt 159) Bissellls Ferry Rd (Pvt) (horizontal curve) Windsor 4.98 5.39 37.0 18.5 0 None 2 Palisado Av (Rt 159) Clapp Rd N Hayden Station Rd Windsor Lcks 6.98 6.58 41.0 20.5 0 None 2 Palisado Av (Rt 159) near Clapp Rd North Windsor 7.11 7.49 31.5 12.0 2 None 0 North Main St (Rt 159) Fairview St Fernwood Dr Windsor Lcks 9.97 10.11 33.5 12.0 2 None 0 East St S. (Rt 159) Paper St Alexander Lane Suffield 11.63 12.03 30.0 12.0 2 None 0 East St S (Rt 159) Bridge St Thrail Av Suffield 13.00 13.37 32.0 12.0 2 None 0 East St N. (Rt 159) Thompsonville Rd Burbank Av Suffield 14.43 14.60 34.0 14.0 2 None 0 New Britain Av (Rt 160) Catherine Rd (horizontal curve) Rocky Hill 1.95 2.22 32.5 12.0 2 None 0 Elm St (Rt 160) Griems Rd Main St (Rt 99) Rocky Hill 5.17 5.42 34.0 12.0 2 None 0 Pennsylvania Av (Rt 161) Grand St Smith St East Lyme 0.06 0.31 33.0 11.0 2 None 0
New Haven Av (Rt 162) Mary Ellen Dr Sparrowbush Lane Millford 3.79 4.05 27.0 11.5 1 None 0 Willard Av (Rt 173) Stanwell Rd (Pvt) Halleran Dr Newington 0.60 0.85 22.0 9.5 1 None 0 Willard Av (Rt 173) New Britain Av Robbins Av Newington 1.38 1.74 33.0 16.5 0 None 0 Willard Av (Rt 173) Pheasant Run Robbins Av Newington 1.38 1.74 38.0 11.5 3 None 0 Willard Av (Rt 173) Robbins Av Wilson Av Newington 1.74 2.16 28.5 11.5 2 None 0 New Britain Av (Rt 174) Eleanor Pl Roberts St Newington 1.84 1.60 31.0 12.5 2 None 0 Wells Rd (Rt 175) Knight St Wells Farm Dr Wethersfield 5.33 5.03 30.0 12.0 2 None 0 Wells Rd (Rt 175) Folly Brook Blvd Knight St Wethersfield 5.60 5.36 29.5 12.0 2 None 0 Wells Rd (Rt 175) Jay St Folly Brook Blvd Wethersfield 5.79 5.60 35.5 12.0 2 None 0 Main St (Rt 176) Northwood Rd Cheney Ln Newington 1.64 1.37 29.0 11.5 2 None 0 Main St (Rt 176) Elleworth St Kirkham St Newington 2.09 2.31 28.0 12.0 1 None 0 Hartford Av (Rt 176) Garvan St Thomas St Newington 3.43 3.20 29.0 12.0 2 None 0 S. Washington St (Rt 177) Duval La Madeley Ct Plainville 0.34 0.95 31.0 12.0 2 None 0
S. Washington St (Rt 177) Madeley Ct Broad St Plainville 0.95 1.36 None 0
Washington St (Rt 177) Broad St West Main St (Rt 372) Plainville 1.36 1.56 None 0 Simsbury Rd (Rt 185) Tumblebrook La Mohegan Dr W Hartford 5.25 5.60 30.0 12.0 2 None 0 Mapleton Av (Rt 190) (Horizontal curve) Wren Dr Suffield 0.45 0.28 33.5 11.5 2 None 0

66
Road Name (Rt #) Beginning Road (Landmark)
Ending Road (Landmark) Town
Mile-post Start
Mile-post End
Roadwidth
(ft)
Lane width
(ft)
Shoul-der
Bike Lane
Park-ing
Thompsonville Rd (Rt 190) Quail Run Rd 4th St. Suffield 0.92 1.24 33.0 12.5 2 None 0
Hazard Av (Rt 190) Beverly St Martin Terr Enfield 5.56 5.74 33.5 13.0 2 None 0 Main St (Rt 190) Shaker Rd Hall Hill Rd (Rt 186) Somers 8.70 9.05 29.5 12.5 2 None 0 Storrs Rd (Rt 195) Warrenville Rd (Rt 98) Bassett Bridge Rd Mansfield 3.74 3.28 32.0 12.0 2 None 0 Storrs Rd (Rt 195) East Road Agronomy Rd Mansfield 6.02 6.33 37.0 13.5 2 None 0 Storrs Rd (Rt 195) Private Rd Rockridge Rd (E-1) Mansfield 10.44 11.30 33.0 13.5 2 None 0 Hopeville Rd (Rt 201) Near Monroe St NA Jewett City 19.35 19.57 East Main St (Rt 201) Palmer Av End of Sidewalk Jewett City 19.89 19.57 New Litchfield St (Rt 202) Blake St Earl St Torrington 43.46 43.61 40.0 12.0 3 None 0
East Main St (Rt 202) Willow St Main St Torrington 44.39 44.15 Great Neck Rd (Rt 213) Jordan Terr. Pfizer Dr Waterford 0.07 0.52 29.0 11.0 2 None 0 Great Neck Rd (Rt 213) Pfizer Dr Breman Rd Waterford 0.52 1.19 30.0 1 None 0 Great Neck Rd (Rt 213) Braman Rd Colonial Dr Waterford 1.19 0.73 34.0 17.0 0 None 3 Ocean Av (Rt 213) Near School St Sherman St New London 5.64 5.47 42.5 13.0 3 None 0 Ocean Av (Rt 213) Faire Harbour Pl Sunset St New London 5.83 6.05 34.0 12.0 2 None 0 N. Main St (Rt 218) Huron Dr Miler/Old Meadow Rd W Hartford 0.50 0.85 South Eagleville Rd (Rt 275) Mansfield 2.94 2.69 41.0 12.0 3 None
South Eagleville Rd (Rt 275) Maple Rd (Apartment entrance) Mansfield 3.52 4.02 None 1
Pinney St (Rt 286) Windermere Av Private Rd Ellington 0.89 1.49 30.0 13.0 1 None 0 Main St (Rt 286) Tomoka St Maple St Ellington 2.60 2.97 E Robbins Av (Rt 287) Lydall Rd Kitts Lane #1 Newington 0.38 0.57 Prospect St (Rt 287) Thornbush Rd Collier Rd Wethersfield 1.58 1.76 28.5 12.0 1 None 0 Prospect St (Rt 287) Olney Rd #1 Griswold Rd Wethersfield 2.53 2.76 28.0 12.0 1 None 0 Prospect St (Rt 287) Millwoods Park Dr Harris Hill Rd Wethersfield 2.96 3.14 27.5 11.5 1 None 0 Beaumont Hwy (Rt 289) Valley Hill Rd Rafferty Rd Lebanon 2.76 3.34 31.0 12.0 2 None 0 Jordan Lane (Rt 314) Ridge Crest Circle Godwin Park Rd Wethersfield 0.96 1.41 27.0 11.5 1 None 0 Townsend Av (Rt 337) Sound View Ter Hervey St New Haven 0.73 1.14 30.0 12.0 2 None 0 Townsend Av (Rt 337) Concord St Fort Hale Rd New Haven 1.50 1.22 26.0 12.0 1 None 0 W. Center St (502) Moore St Cooper St Manchester 5.94 6.19 38.0 14.0 2 None 0

67
Road Name (Rt #) Beginning Road (Landmark)
Ending Road (Landmark) Town
Mile-post Start
Mile-post End
Roadwidth
(ft)
Lane width
(ft)
Shoul-der
Bike Lane
Park-ing
Lake St (Rt 533) Lydall St Berkeley Dr Vernon 1.19 1.62 36.0 18.0 0 None Tunnel Rd (Rt 533) Russell Dr Old Stone Rd Vernon 2.39 2.60 36.0 18.0 0 None Norwich Av (SR 616) Main St (Rt 85) Pleasant St Colchester 0.00 0.34 43.0 11.5 3 None 0 Main St (Rt 800) King St Scoville St Torrington 1.67 1.87 Main St (Rt 800) Linden St East Albert St Torrington 2.10 2.28 Thomaston Av (Rt 847) Plaza Driveway W. Main St Waterbury 4.25 3.96 37.0 18.0 0 None 0 Thomaston Av (Rt 847) Shefield St Boyden St Waterbury 6.22 6.10 33.0 12.0 2 None 0 Thomaston Av (Rt 847) Driggs St Shefield St Waterbury 6.32 6.22 32.0 16.0 0 None 0 Thomaston Av (Rt 847) Plaza driveway Huntingdon Av Waterbury 35.5 11.5 2 None 0

68
Table A-3. Roadside Characteristics
Road Name (Rt #) Beginning Road (Landmark)
Ending Road (Landmark) Town
Mile-post Start
Mile-post End
Curb Plant Strip
Side-walk
Set-back
Land Use
Jackson St Ash St Summit St Windham Both None Both 1 GU Boulevard Mountain Rd Ridgewood Rd W Hartford Both Both Both 2 UR Boulevard Ridgewood Rd Woodrow St W Hartford Both Both Both 2 UR Mountain Rd Hedwig Court Farmington Av W Hartford Both Both Both 2 UR Mountain Rd Flagg Rd Mountain Farm Rd W Hartford Both 1-side 1-side 3 SR Mountain Rd Richmond Ln Fairfield Rd W Hartford Both 1-side 1-side 2 SR Flagg Rd Coolidge Rd Blue Ridge Ln W Hartford None 1-side 1-side 2 SR Asylum Av Lincoln Av Trout Brook Dr W Hartford Both 1-side 1-side 3 GU Farmington Av Trout Brook Dr Ardmore Rd W Hartford Both Both Both 2 GU Farmington Av N. Quaker Ln Whiting Ln W Hartford Both Both Both 2 GU Farmington Av Whiting Ln Highland St W Hartford Both Both Both 2 GU Prospect Av Cone St Farmington Av Hartford Both Both Both 2 GU Prospect Av Asylum Av Fern St Hartford Both Both Both 2 UR Prospect Av Asylum Av Albany Av Hartford None Both Both 2 UR Prospect Av Farmington Av West Boulevard Hartford Both Both Both 2 GU Fern St Concord St Steele Rd W Hartford Both Both 1-side 2 GU Fern St N. Quaker Ln Trout Brook Dr W Hartford Both Both Both 2 GU Fern St Clifton Av Cobbs Rd W Hartford Both Both Both 2 GU Fern St Fernbel Lane Cobbs Rd W Hartford Both Both 2 GU Lake St Montauk Dr Phoenix St Vernon SR Washington St Phoenix St Brookview St Vernon SR Central Av Hickory St 13th St Norwich Both 1-side Both 1 DT Spring Hill Rd Storrs Rd Mansfield SR Colony St Brooks St Church St Meriden Both Both 3 DT Oakwood Av Park Rd W Hartford Both Both GU White St (Driveway b/f garage) Bates Pl Danbury Both Both GU Deer Hill Rd Wilson St Wooster Rd Danbury 1-side Both 2 UR Main St Newberry St Pleasant Rd So Windsor None None 3 SR Broadway Broad St Chelsea Parade S Norwich 1-side Both 3 GU

69
Road Name (Rt #) Beginning Road (Landmark)
Ending Road (Landmark) Town
Mile-post Start
Mile-post End
Curb Plant Strip
Side-walk
Set-back
Land Use
Fairfield Av Ansonia St Fairfield Rd Spur Hartford 1-side 3 GU Fairfield Av Freeman St Maple Av Hartford Both Both 2 GU Flatbush Av Oakwood Av S. Quaker Ln W Hartford 1-side 1-side GU Grand St State St Field St Waterbury None Both DT Main St Montowese St Harrison Av Branford Both Both 3 DT Park Rd S. Quaker Ln Washington Cir W Hartford None Both 2 GU Quaker Ln Farmington Av Boulevard W Hartford Both Both 1 GU South Quaker Ln Flatbush Av Wilfred St W Hartford Both Both 2 UR Asylum Av Griswold Dr N. Quaker Lane W Hartford Both 1-side 1-side GU Ella T Grasso Blvd Glenn Rd Crescent St New Haven Both Both 2 UR Boston Post Rd (Rt 1) Mansfield Av Sedgwick Av Darien 11.66 11.74 Both None Both 1 DT Boston Post Rd (Rt 1) Sedgwick Ave Brookside Rd Darien 11.74 11.95 Both Both Both 2 GU Boston Post Rd (Rt 1) Brookside Rd Old King Hwy N Darien 11.98 12.27 Both Both Both 2 UC North Av (Rt 1) James St Oak St Bridgeport 29.26 29.57 Both Both Both 1 GU North Av (Rt 1) Catherine St #2 Fairmount St Bridgeport 29.67 29.85 Both Both Both 1 GU Bridgeport Av (Rt 1) Kerema Av Spring St Millford 35.53 35.71 Both None Both 1 GU Columbus Av (Rt 1) Davenport Av West St New Haven 46.69 47.06 Both Both Both 1 GU North Main St (Rt 1) Cherry Hill Rd Liesi Lane Branford 54.32 54.55 1-side None None 3 SC North Main St (Rt 1) Cedar St Ivy St Branford 54.81 55.02 Both None None 2 SC North Main St (Rt 1) Ivy St Pvt Dr Branford 55.02 55.27 Both Both 2 SC Boston Post Rd (Rt 1) River St Fair St/Cherry St Guilford 62.83 62.98 Both Both Both 2 UC Boston Post Rd (Rt 1) Village Walk Dunkin Donut Exit Guilford 63.59 63.97 Both Both Both 3 UC Boston Post Rd (Rt 1) (horizontal curve) Old Post Rd Madison 66.46 66.83 1-side None None 2 SR Boston Post Rd (Rt 1) Britton lane Island Av Madison 67.49 67.72 SR Boston Post Rd (Rt 1) Wall St Scotland Av Madison 68.07 68.30 Both 1-side 1-side SC East Main St (Rt 1) Waterside Ln Morgan Park Clinton 72.06 72.16 Both Both Both 1 GU Boston Post Rd (Rt 1) 309 Boston Post Rd Springbrook Rd Old Saybrook 81.28 81.58 None None None 2 SC Boston Post Rd (Rt 1) After Townwoods Rd B/4 Grassy Hill Rd Old Lyme 86.57 86.70 1-side None None 2 SR Bank St (Rt 1) Backwith St Braemer Pl (De) New London 98.32 98.50 Both 1-side Both 1 GU Boston Post Rd (Rt 1) Guilford Med Bldg Exit Op East Creek Guilford Newfield St (Rt 3) Rose Circle WB Congdon St E Middletown 0.76 1.12 Both 1-side 1-side 2 SR Shunpike Rd (Rt 3) Court St Freihofers Bakery Dr Cromwell 4.78 5.05 1-side None None 3 SR Cromwell Av (Rt 3) Shunpike Business Ctr Inwood Rd Rocky Hill 5.63 5.80 Both 1-side 1-side SC

70
Road Name (Rt #) Beginning Road (Landmark)
Ending Road (Landmark) Town
Mile-post Start
Mile-post End
Curb Plant Strip
Side-walk
Set-back
Land Use
Maple St (Rt 3) Harvest Lane Westerly Terr Rocky Hill 7.66 7.88 Both 1-side 1-side 3 SR Maple St (Rt 3) Sandy Dr Hang Dog Lane Rocky Hill 7.92 8.19 Both 1-side 1-side 3 SR Maple St (Rt 3) Gilbert Av Two Stone Dr Wethersfield 8.41 8.96 Both 1-side 1-side 3 SR Maple St (Rt 3) Griswold Rd Butler St (One way) Wethersfield 9.01 9.29 Both Both Both 3 UR Maple St (Rt 3) Kimball Rd Charter Rd Wethersfield 9.44 9.69 Both Both Both 2 SR Newsfield St (Rt 3) Wilderman's Way Middletown Both 1-side 1-side 3 SC Sharon Tpke (Rt 4) Bartholomew Rd (horizontal curve) Goshen 14.00 14.44 None None None 2 RU Sharon Tpke (Rt 4) School Hill Rd West St Goshen 16.52 16.92 None None None 3 RU Migeon Av (Rt 4) Gardenhurst Av Torrington 22.34 22.51 None None None 2 GU North Elm St (Rt 4) Migeon Av Eagle St Torrington 22.89 23.23 Both None Both 2 GU Main St Rourke Pl Elm St Farmington 38.39 38.67 Both Both Both 2 GU Farmington Av W. Avon Rd (Rt 167) Beyond Walnut St Farmington 39.10 39.47 Both Both Both 2 SR State St (Rt 5) Edmund St London Dr Hamden 1.76 2.04 None Both Both 2 SC State St (Rt 5) Fernwood Dr Foote St Hamden 2.23 2.62 1-side 1-side 1-side 3 SC State St (Rt 5) Stevens St Daniel Rd Hamden 2.71 3.08 1-side None None 2 SC S. Colony St (Rt 5) Ward St Prince St Wallingford 11.09 11.31 Both None Both 1 GU N. Colony St (Rt 5) Church St Christian St Wallingford 11.55 11.82 Both 1-side Both 1 UC N. Colony St (Rt 5) Wallace Row North St Wallingford 11.87 12.14 Both 1-side Both 1 UC S. Broad St (Rt 5) Green Rd Layman Av Meriden 15.60 15.90 Both Both Both 2 SC S. Broad St (Rt 5) Hall Av Gale Av Meriden 16.06 16.45 Both Both Both 2 GU Broad St (Rt 5) Ann St Silver St Meriden 16.47 16.70 Both Both Both 2 GU Broad St (Rt 5) Atkins St Sherman Av Meriden 17.98 18.18 1-side 1-side Both 1 UC N Broad St (Rt 5) Clark St Golden St Meriden 18.55 18.77 Both Both Both 2 SR King St Depot Hill Rd AT&T Entrance Enfield 48.60 48.92 None None None 3 SR Enfield St (Rt 5) Orbit Dr Post Office Rd Enfield 50.38 50.76 Both 1-side 1-side 3 SR Enfield St (Rt 5) Enfield Terr Fairview Av Enfield 51.32 51.91 None 1-side 1-side 3 UR Fitch St (Rt 10) Crescent St. Dyer St. New Haven 3.79 3.98 Both Both Both 1 GU Arch St (Rt 10) Local Wamer St Alstrum St Hamden 4.77 4.94 Both Both Both 1 GU S. Main St (Rt 10) Bradford Dr Cook Hill Rd Cheshire 14.31 14.72 1-side None None 3 SR S Main St (Rt 10) Bradford Dr Mt Sanford Rd Cheshire 14.31 14.02 1-side None None 3 SR S. Main St (Rt 10) Cook Hill Rd Brentwood Dr. Cheshire 14.72 15.53 None 1-side 1-side 3 SC South Main St (Rt 10) Werking St Buckland St Southington 22.65 23.00 1-side Both Both 2 SR Hopmeadow St (Rt 10) Plank Hill Rd Seminary Rd Simsbury 45.30 45.66 SC

71
Road Name (Rt #) Beginning Road (Landmark)
Ending Road (Landmark) Town
Mile-post Start
Mile-post End
Curb Plant Strip
Side-walk
Set-back
Land Use
Laurel Hill Rd (Rt 12) Hillcrest Rd Ridgewood Dr Norwich 10.28 10.50 SR N. Main St (Rt 12) East Main St Russell St Jewett City 21.05 21.51 Both None Both 1 GU Middletown Av (Rt 17) Flint St Cross St New Haven 1.10 0.82 Both 1-side 1-side 2 GU Main St (Rt 17) Old Maids Lane Great Pond Rd (Pvt) Glastonbury 30.89 31.30 Both 1-side 1-side 3 SR Ellington Rd (Rt 30) Overpass (I-291) 1.64 km b/f Chapel Rd So Windsor 0.55 0.74 None None None 3 RU Ellington Rd (Rt 30) Chapel Rd (1.640km) Parkview Dr So Windsor 0.86 1.40 SR Ellington Rd (Rt 30) Northview Dr Lakewood Dr (Pvt) So Windsor 1.57 1.90 SR Hartford Turnpike (Rt 30) Mt. Vernon Dr South St Vernon 11.50 11.95 1-side None None 2 SC
Hartford Turnpike (Rt 30) (Tolland Town Line) (Industrial Park) Vernon 12.55 12.71 1-side None None 2 SC
Grove St (Rt 31) Fern St Hale St Ext. Vernon 0.36 0.65 1-side None 1-side 1 UR Bread & Milk St (Rt 31) N. School Rd Zeya Dr Coventry 4.76 4.24 1-side None None 3 RU Main St (Rt 31) Wright Mill Rd Dunkin Donuts Coventry 7.05 7.23 1-side None None 3 SC Main St (Rt 31) Talcott Hill Rd Dexter Rd Coventry 8.38 8.14 None None None 3 SR Main St (Rt 31) Beverly Tr Sam Green Rd Coventry 8.87 8.62 1-side None None 2 SR Main St (Rt 31) Monument Hill Rd Mason St Coventry 11.25 11.53 1-side None 1-side 2 GU Main St (Rt 31) Plains Rd South St Ext Coventry 13.05 13.30 None None None 3 RU West Thames (Rt 32) Dunham St Brown St Norwich 11.25 11.52 UR Washington St (Rt 2/32) Taylor Dr Chelsea Parade S Norwich 12.91 13.07 Both None Both 2 UR Windham Rd (Rt 32) Seldon St Old Plains Rd Windham 27.97 27.71 None None None 2 SR Pleasant St (Rt 32) John St Mountain St Windham 28.64 29.01 Both Both Both 2 UR Stafford Rd (Rt 32) Jude Ln Coventry Rd Mansfield 33.18 33.86 SR River Rd (Rt 32) Pinney Hill Rd Willington 41.03 41.19 SR
S. Main St (Rt 41) (Private Dr) Cornwall Bridge Rd (Rt 4) Sharon 4.13 4.33 1-side None None 3 SR
N. Main St (Rt 41) Cornwall Bridge Rd (Rt 4) West Main St Sharon 4.36 4.56 None None GU
Gay St (Rt 41) Calkinstown Rd Rhynus Rd Sharon 5.18 5.65 None None None 2 SR N. Brookvale Rd (Rt 42) Long Hill Rd King Rd Cheshire 12.86 13.15 Both Both 2 SR Main Rd (Rt 44) Porter St Bostwick St Salisbury 3.14 3.31 Both Both 2 SC Center St (Rt 44) Thomas Dr Adams St South Manchester 70.99 71.16 Both Both 2 GU

72
Road Name (Rt #) Beginning Road (Landmark)
Ending Road (Landmark) Town
Mile-post Start
Mile-post End
Curb Plant Strip
Side-walk
Set-back
Land Use
School St (Rt 44) May St Providence St (Rt 171) Putnam 100.12
100.38 Both None Both 1 GU
South St (Rt 53) Coal Pit Hill Rd Starr Rd Danbury 21.89 21.63 Both Both Both 2 GU Stratfield Rd (Rt 59) Cornell Rd Brooklawn Pkwy (SB) Fairfield 1.29 1.47 Both Both Both 2 SR Stratfield Rd (Rt 59) Argonne St Gate Ridge Rd Fairfield 2.17 2.45 Both 1-side 1-side 1 SR Easton Tpke (Rt 59) Wellner Dr Shady Brook Rd Fairfield 3.01 3.33 1-side None None 2 SR South St (Rt 63) West St Old South Rd Litchfield 34.86 34.41 Both Both 3 SR North St (Rt 63) West St Norfolk Rd Litchfield 35.03 35.54 None Both Both 3 SR Main St (Rt 66) Wall St (Rt 316) Savings Institute Hebron 26.07 26.47 None None 3 SC Main St (Rt 66) Winter St Tingley St Windham 35.41 35.57 Both None Both 1 GU Main St (Rt 66) High St North St Windham 35.74 35.99 Both None Both 1 DT Percival Av (Rt 71) Near Kenton St Carbo Lane Berlin 10.27 10.57 1-side None None 2 SR New Britain Rd (Rt 71) Langdon Ct Newton St Berlin 11.55 12.00 Both 1-side 1-side 2 SC S Main St (Rt 71) Veterans Dr South St New Britain 12.38 12.56 1-side Both Both 2 GU Stanley St (Rt 71) Roxbury Rd / Stanley St Stratford Rd New Britain 15.12 15.31 Both Both Both 2 SR Stanley St (Rt 71) Blake Rd Drury Lane New Britain 16.00 16.27 Both Both Both 2 SR East Main St (Rt 72) Horizontal Curve Lincoln Av Bristol 6.47 6.88 Both Both Both 2 SC School St (Rt 72) Main St (Rt 72) Church St / N Main St Bristol 9.58 9.70 Both None Both 2 Park St (Rt 72) Divinity St Tulip St Bristol 9.97 10.31 Both Both Both 1 GU Park St (Rt 72) Tulip St Muzzy St Bristol 10.31 10.43 Both Both Both 1 GU Park St (Rt 72) Dutton St Spruce St Bristol 10.55 10.80 Both Both Both 1 GU Wapping Wood Rd (Rt 74) Grant Rd Near Eva Circle #1 Ellington 3.65 3.87 Both 1-side 1-side 3 SR
Wapping Wood Rd (Rt 74) Hillsdale Dr Windsorville Rd Ellington 4.00 4.23 Both None None 2 SR
Union St (Rt 74) Rheel St Orchard St Vernon 6.04 6.15 Both None Both 1 GU East Main St Ann St Snipsic St Vernon 7.11 7.47 None 1 SR Tolland Av (Rt 74) Kingsbury Av Vernon 7.77 8.05 None None None 2 SR Poquonook Av (Rt 75) Pigeon Hill Rd Tiffany Dr Windsor 0.85 1.07 None None None 2 SR Poquonook Av (Rt 75) near Hansom Hill Rd near Hansom Hill Rd Windsor 2.45 2.60 Both None None 3 SR South Main St (Rt 75) Kent Av High St Suffield 9.46 9.87 None Both Both 3 SR North Main St (Rt 75) Day Av (horizontal curve) Suffield 10.29 10.64 None Both Both 3 SR North St (Rt 75) Mapleton Av (Rt 190) Suffield 11.02 11.58

73
Road Name (Rt #) Beginning Road (Landmark)
Ending Road (Landmark) Town
Mile-post Start
Mile-post End
Curb Plant Strip
Side-walk
Set-back
Land Use
N Main St (Rt 75) Mapleton Av (Rt 190) Russell St Suffield 11.02 10.76 1-side None None 3 SR North St (Rt 75) Halladay Longview Dr Windsor 12.07 12.56 Both Both Both 3 SR Whitfield St (Rt 77) Boston St (Rt 146) Broad St Guilford 0.00 0.19 1-side None None 3 SR Church St (Rt 77) Broad St Boston Post Rd (US 1) Guilford 0.25 0.50 Church St (Rt 77) Boston Post Rd (US 1) End of School Prop Guilford 0.50 0.87 Both 1-side 1-side 1 DT Foxon Rd (Rt 80) River Rd Circle Dr East Haven 2.75 2.99 Both Both Both 2 GU Foxon Rd (Rt 80) Edward Rd Sunset Rd No Branford 4.29 3.97 1-side Both Both 1 GU Winthrop Rd (Rt 80) Woodbury Rd Town Park Deep River 23.55 23.91 Both Both Both 2 GU Elm St (Rt 80) Union St Main St (Rt 154) Deep River 25.73 25.91 1-side None None 3 SR High St (Rt 81) Central Av John St Clinton 0.16 0.37 None None None 3 RU High St (Rt 81) Old Mill Rd (De) PVT Dr B/4 High St Clinton 0.47 0.63 Both Both Both 1 UR Clinton Rd (Rt 81) Stevens Rd Green Hill Rd Killingworth 5.21 5.57 Both 1-side 1-side 1 SR Higganum Rd (Rt 81) Old Bedford Farm Rd Tooley Rd (Rt 148) Killingworth 8.00 8.29 Both 1-side 1-side 2 SR Manchester Rd (Rt 83) Chimney Sweep Hill Rd Eastbury Hill Rd Glastonbury 0.38 0.55 None None None 3 SC Manchester Rd (Rt 83) Shoddy Mill Rd (2.063 miles away) Glastonbury 1.85 2.05 None None None 3 SR Manchester Rd (Rt 83) Howe St Fairway Crossing Glastonbury 3.81 4.11 Both Both Both 3 SR S. Main St (Rt 83) Fairway Crossing (Pvt) NA Manchester 4.55 4.81 Both 1-side 1-side 3 SR S. Main St (Rt 83) Jct B/4 Fern St Golf Course Manchester 5.47 5.91 Both None None 2 SR S. Main St (Rt 83) Lakewood Circle South Spring St Manchester 6.09 6.28 None None 3 SR Main St (Rt 83) Delmont St (Cds) Firehouse Manchester 8.15 8.49 None None None 3 SR Oakland St (Rt 83) Sheldon Rd Rachel Rd Manchester 9.29 9.55 1-side None 1-side 2 SR Oakland St (Rt 83) Tudor La (Pvt) South St Manchester 9.63 9.80 Both Both Both 2 GU J Trumbull Hwy (Rt 87) Samuel Hill Rd Latham Hill Rd Columbia 11.12 11.49 Both Both Both 2 GU Hebron Av (Rt 94) Wickham Rd Pinnacle Ln Glastonbury 2.24 2.47 Both Both Both 2 GU Taftville Occum Rd (Rt 97) DOT Garage Hooper St Norwich 2.31 2.78 None None None 3 SR
Main St (Rt 97) River St Brookside Av Sprague 4.89 5.30 Main St (Rt 99) Evergreen Rd Court St Cromwell 2.25 2.63 1-side 1-side 3 SR Main St (Rt 99) Court St Park Place Cromwell 2.63 2.88 1 GU Main St (Rt 99) Evensen Place Sunset Dr Cromwell 3.03 3.48 1 UR Quinnipiac Av (Rt 103) Hemingway Place Foxon Hill Rd New Haven 0.49 0.80 1-side 1-side 1-side 3 SC Nichols Av (Rt 108) Montrose Pl Calfornia St Stratford 0.13 0.32 Both 1-side 1-side 2 SC Nichols Av (Rt 108) Marcroft St Greenfield Av Stratford 0.65 0.89 1-side None 1-side 2 SR

74
Road Name (Rt #) Beginning Road (Landmark)
Ending Road (Landmark) Town
Mile-post Start
Mile-post End
Curb Plant Strip
Side-walk
Set-back
Land Use
Branch Rd (Rt 109) NA Old Branch Rd #2 Thomaston 20.19 20.52 Both 1-side 1-side 1 GU Branch Rd (Rt 109) Old Branch Rd #2 Edgewood Av Thomaston 20.52 20.88 Both Both Both 1 UR East Main St (Rt 110) Sunnyside Ter Wakelee Stratford 0.50 0.72 Both Both Both 2 UR East Main St (Rt 110) Evergreen Dr/Diane Ter Marchant Dr Stratford 0.76 1.19 Both None None 3 RU Interlaken Rd / Lime Rock Rd (Rt 112) Sharon Rd (Rt 41) Town Hill Rd (Pvt) Salisbury 2.05 2.45 1-side 1-side 1-side 3 SR
Oak Bluff Av (Rt 113) Stratford Rd Roundabout Stratford 2.33 2.60 Both Both Both 1 SR Prospect Dr (RT 113) Lordship Rd Ivy/Stratford Rd Stratford 2.72 3.10 Both Both Both 2 SR Stratford Rd (Rt 113) Prospect Dr Short Beach Rd Stratford 3.10 3.67 None None None 3 RU Main St (Rt 113) Birdseye St South Av Stratford 5.11 5.33 1-side None None 2 SR Main St (Rt 115) Tremont St Bridge St Ansonia 1.62 1.71 1-side None None 2 SR Main St (Rt 115) Bridge St Maple St Ansonia 1.71 1.97 1-side 1-side 2 SR Slater Av (Rt 138) Lincoln Sq Ann St Jewett City 6.27 6.69 None Both Both 2 GU
Elm St (Rt 140) Ash Dr Southwest Av /Woodland St Windsor Lcks 0.54 0.82 Both None Both 1 DT
Elm St (Rt 140) Southwest Av South Elm St Windsor Lcks 0.82 1.21 Both None Both 1 DT Elm St (Rt 140) Briarcliff Dr (De) South Center St Windsor Lcks 1.48 1.96 Both None Both 1 UR Maple St (Rt 140) Church St School Entrance Ellington 12.84 13.35 Both 1-side 1-side 2 SR South Main St (Rt 146) Eades St Montowese St Branford 0.84 1.07 1-side 1-side 1-side 2 SR Boston St (Rt 146) Wheaton Av Lovers Lane Guilford 11.84 12.08 Both None 1-side 2 SR
Westchester Rd (Rt 149) Just after curve (12.10 km) Pickerel Lake Rd Colchester 6.38 6.07 None 1-side 1-side 2 SR
Woodhouse Av (Rt 150) Wheatfield Dr Harrison Rd Wallingford 2.18 2.47 Both 1-side 1-side 2 GU Woodhouse Av (Rt 150) Liandina Rd Harrison Av Wallingford 3.36 2.47 Both 1-side Both 1 GU Center St (Rt 150) Pomeroy Av N Elm St Wallingford 4.44 4.65 None None None 3 SR Center St (Rt 150) South Orchard South Colony (Rt 5) Wallingford 4.99 5.16 1-side 1-side 1-side 3 SR N. Turnpike Rd (Rt 150) Stetson St Knollwood Dr Wallingford 6.45 6.69 Both None None 2 SR Great Hammock Rd (Rt 154) Old Boston Post Rd Oyester Pl Old Saybrook 0.12 0.58 Both Both Both 1 GU
College St (Rt 154) Marina Point Dr Willard Av Old Saybrook 4.60 4.88 Both None Both 1 DT College St (Rt 154) Dana Dr N Cove Rd Old Saybrook 4.92 5.17 Both Both Both 2 SC Main St (Rt 154) Union St Elm/River St Deep River 14.01 14.42 Both 1-side 1-side 2 SR Main St (Rt 154) Elm/River St High St Deep River 14.42 14.57 None 1-side 1-side 3 SR

75
Road Name (Rt #) Beginning Road (Landmark)
Ending Road (Landmark) Town
Mile-post Start
Mile-post End
Curb Plant Strip
Side-walk
Set-back
Land Use
Main St (Rt 156) Pennsylvania Av Columbus Av East Lyme 19.01 18.55 None 1-side 1-side 2 SR Palisado Av (Rt 159) North Meadow Rd Old Kennedy Rd Windsor 4.31 4.93 Both None 1-side 2 SC Palisado Av (Rt 159) Bissellls Ferry Rd (Pvt) (horizontal curve) Windsor 4.98 5.39 Both 1-side Both 1 DT Palisado Av (Rt 159) Clapp Rd N Hayden Station Rd Windsor Lcks 6.98 6.58 Both Both Both 1 DT Palisado Av (Rt 159) near Clapp Rd North Windsor 7.11 7.49 None None None 3 SR North Main St (Rt 159) Fairview St Fernwood Dr Windsor Lcks 9.97 10.11 None None None 2 SR East St S. (Rt 159) Paper St Alexander Lane Suffield 11.63 12.03 None None None 3 RU East St S (Rt 159) Bridge St Thrail Av Suffield 13.00 13.37 None None None 2 SR East St N. (Rt 159) Thompsonville Rd Burbank Av Suffield 14.43 14.60 Both Both Both 2 SR New Britain Av (Rt 160) Catherine Rd (horizontal curve) Rocky Hill 1.95 2.22 None None None 3 SR Elm St (Rt 160) Griems Rd Main St (Rt 99) Rocky Hill 5.17 5.42 None None None 3 SR Pennsylvania Av (Rt 161) Grand St Smith St East Lyme 0.06 0.31 None None None 1 SR
New Haven Av (Rt 162) Mary Ellen Dr Sparrowbush Lane Millford 3.79 4.05 None None 3 SR Willard Av (Rt 173) Stanwell Rd (Pvt) Halleran Dr Newington 0.60 0.85 1-side 1-side 1-side 2 SR Willard Av (Rt 173) New Britain Av Robbins Av Newington 1.38 1.74 1-side 1-side Both 2 UC Willard Av (Rt 173) Pheasant Run Robbins Av Newington 1.38 1.74 Both Both 2 SR Willard Av (Rt 173) Robbins Av Wilson Av Newington 1.74 2.16 Both 1-side 1-side 2 SR New Britain Av (Rt 174) Eleanor Pl Roberts St Newington 1.84 1.60 Both 1-side 1-side 2 SR Wells Rd (Rt 175) Knight St Wells Farm Dr Wethersfield 5.33 5.03 Both 1-side 1-side 2 SR Wells Rd (Rt 175) Folly Brook Blvd Knight St Wethersfield 5.60 5.36 Both 1-side 1-side 2 SR Wells Rd (Rt 175) Jay St Folly Brook Blvd Wethersfield 5.79 5.60 Both 1-side 1-side 2 SR Main St (Rt 176) Northwood Rd Cheney Ln Newington 1.64 1.37 Both Both Both 2 SR Main St (Rt 176) Elleworth St Kirkham St Newington 2.09 2.31 Both Both Both 2 SR Hartford Av (Rt 176) Garvan St Thomas St Newington 3.43 3.20 Both Both 2 SR S. Washington St (Rt 177) Duval La Madeley Ct Plainville 0.34 0.95 Both Both Both 2 SR
S. Washington St (Rt 177) Madeley Ct Broad St Plainville 0.95 1.36 Both Both Both 2 SR
Washington St (Rt 177) Broad St West Main St (Rt 372) Plainville 1.36 1.56 1-side 1-side 2 SR Simsbury Rd (Rt 185) Tumblebrook La Mohegan Dr W Hartford 5.25 5.60 None None 2 SC Mapleton Av (Rt 190) (Horizontal curve) Wren Dr Suffield 0.45 0.28 1-side 1-side 2 SR

76
Road Name (Rt #) Beginning Road (Landmark)
Ending Road (Landmark) Town
Mile-post Start
Mile-post End
Curb Plant Strip
Side-walk
Set-back
Land Use
Thompsonville Rd (Rt 190) Quail Run Rd 4th St. Suffield 0.92 1.24 Both Both 2 SR
Hazard Av (Rt 190) Beverly St Martin Terr Enfield 5.56 5.74 None 1-side 1-side 2 SR Main St (Rt 190) Shaker Rd Hall Hill Rd (Rt 186) Somers 8.70 9.05 None None None 2 SR Storrs Rd (Rt 195) Warrenville Rd (Rt 98) Bassett Bridge Rd Mansfield 3.74 3.28 None None None 3 SR Storrs Rd (Rt 195) East Road Agronomy Rd Mansfield 6.02 6.33 None None None 1 SR Storrs Rd (Rt 195) Private Rd Rockridge Rd (E-1) Mansfield 10.44 11.30 1-side 1-side 2 SC Hopeville Rd (Rt 201) Near Monroe St NA Jewett City 19.35 19.57 SC East Main St (Rt 201) Palmer Av End of Sidewalk Jewett City 19.89 19.57 SR New Litchfield St (Rt 202) Blake St Earl St Torrington 43.46 43.61 None None RU
East Main St (Rt 202) Willow St Main St Torrington 44.39 44.15 SR Great Neck Rd (Rt 213) Jordan Terr. Pfizer Dr Waterford 0.07 0.52 None Both 2 UR Great Neck Rd (Rt 213) Pfizer Dr Breman Rd Waterford 0.52 1.19 None Both 2 UR Great Neck Rd (Rt 213) Braman Rd Colonial Dr Waterford 1.19 0.73 Both None Both 1 DT Ocean Av (Rt 213) Near School St Sherman St New London 5.64 5.47 1-side 1-side 2 SR Ocean Av (Rt 213) Faire Harbour Pl Sunset St New London 5.83 6.05 None 1-side 1-side 1 SR N. Main St (Rt 218) Huron Dr Miler/Old Meadow Rd W Hartford 0.50 0.85 SR South Eagleville Rd (Rt 275) Mansfield 2.94 2.69 Both 1 GU
South Eagleville Rd (Rt 275) Maple Rd (Apartment entrance) Mansfield 3.52 4.02 GU
Pinney St (Rt 286) Windermere Av Private Rd Ellington 0.89 1.49 None 1-side 1-side 2 SR Main St (Rt 286) Tomoka St Maple St Ellington 2.60 2.97 RU E Robbins Av (Rt 287) Lydall Rd Kitts Lane #1 Newington 0.38 0.57 SR Prospect St (Rt 287) Thornbush Rd Collier Rd Wethersfield 1.58 1.76 None None None 3 RU Prospect St (Rt 287) Olney Rd #1 Griswold Rd Wethersfield 2.53 2.76 1-side 1-side 2 SR Prospect St (Rt 287) Millwoods Park Dr Harris Hill Rd Wethersfield 2.96 3.14 1-side 1-side 2 SR Beaumont Hwy (Rt 289) Valley Hill Rd Rafferty Rd Lebanon 2.76 3.34 1-side 1-side 2 SR Jordan Lane (Rt 314) Ridge Crest Circle Godwin Park Rd Wethersfield 0.96 1.41 1-side 1-side 2 SR Townsend Av (Rt 337) Sound View Ter Hervey St New Haven 0.73 1.14 Both Both 2 SR Townsend Av (Rt 337) Concord St Fort Hale Rd New Haven 1.50 1.22 None 2 SR W. Center St (502) Moore St Cooper St Manchester 5.94 6.19 None 1-side 2 SR

77
Road Name (Rt #) Beginning Road (Landmark)
Ending Road (Landmark) Town
Mile-post Start
Mile-post End
Curb Plant Strip
Side-walk
Set-back
Land Use
Lake St (Rt 533) Lydall St Berkeley Dr Vernon 1.19 1.62 1-side 1-side 3 SR Tunnel Rd (Rt 533) Russell Dr Old Stone Rd Vernon 2.39 2.60 Both Both 2 GU Norwich Av (SR 616) Main St (Rt 85) Pleasant St Colchester 0.00 0.34 Both Both 2 GU Main St (Rt 800) King St Scoville St Torrington 1.67 1.87 SR Main St (Rt 800) Linden St East Albert St Torrington 2.10 2.28 SR Thomaston Av (Rt 847) Plaza Driveway W. Main St Waterbury 4.25 3.96 Both Both 2 GU Thomaston Av (Rt 847) Shefield St Boyden St Waterbury 6.22 6.10 1-side None Both 2 GU Thomaston Av (Rt 847) Driggs St Shefield St Waterbury 6.32 6.22 Both None Both 2 GU Thomaston Av (Rt 847) Plaza driveway Huntingdon Av Waterbury None 1-side 2 UC

78
Table A-4. AADT by Year, 1996 to 2000
Road Name (Rt #) Beginning Road (Landmark)
Ending Road (Landmark) Town
Mile-post Start
Mile-post End
1996 1997 1998 1999 2000
Jackson St Ash St Summit St Windham Boulevard Mountain Rd Ridgewood Rd W Hartford Boulevard Ridgewood Rd Woodrow St W Hartford Mountain Rd Hedwig Court Farmington Av W Hartford Mountain Rd Flagg Rd Mountain Farm Rd W Hartford Mountain Rd Richmond Ln Fairfield Rd W Hartford Flagg Rd Coolidge Rd Blue Ridge Ln W Hartford Asylum Av Lincoln Av Trout Brook Dr W Hartford Farmington Av Trout Brook Dr Ardmore Rd W Hartford Farmington Av N. Quaker Ln Whiting Ln W Hartford Farmington Av Whiting Ln Highland St W Hartford Prospect Av Cone St Farmington Av Hartford Prospect Av Asylum Av Fern St Hartford Prospect Av Asylum Av Albany Av Hartford Prospect Av Farmington Av West Boulevard Hartford Fern St Concord St Steele Rd W Hartford Fern St N. Quaker Ln Trout Brook Dr W Hartford Fern St Clifton Av Cobbs Rd W Hartford Fern St Fernbel Lane Cobbs Rd W Hartford Lake St Montauk Dr Phoenix St Vernon Washington St Phoenix St Brookview St Vernon Central Av Hickory St 13th St Norwich Spring Hill Rd Storrs Rd Mansfield Colony St Brooks St Church St Meriden Oakwood Av Park Rd W Hartford White St (Driveway b/f garage) Bates Pl Danbury Deer Hill Rd Wilson St Wooster Rd Danbury Main St Newberry St Pleasant Rd So Windsor Broadway Broad St Chelsea Parade S Norwich
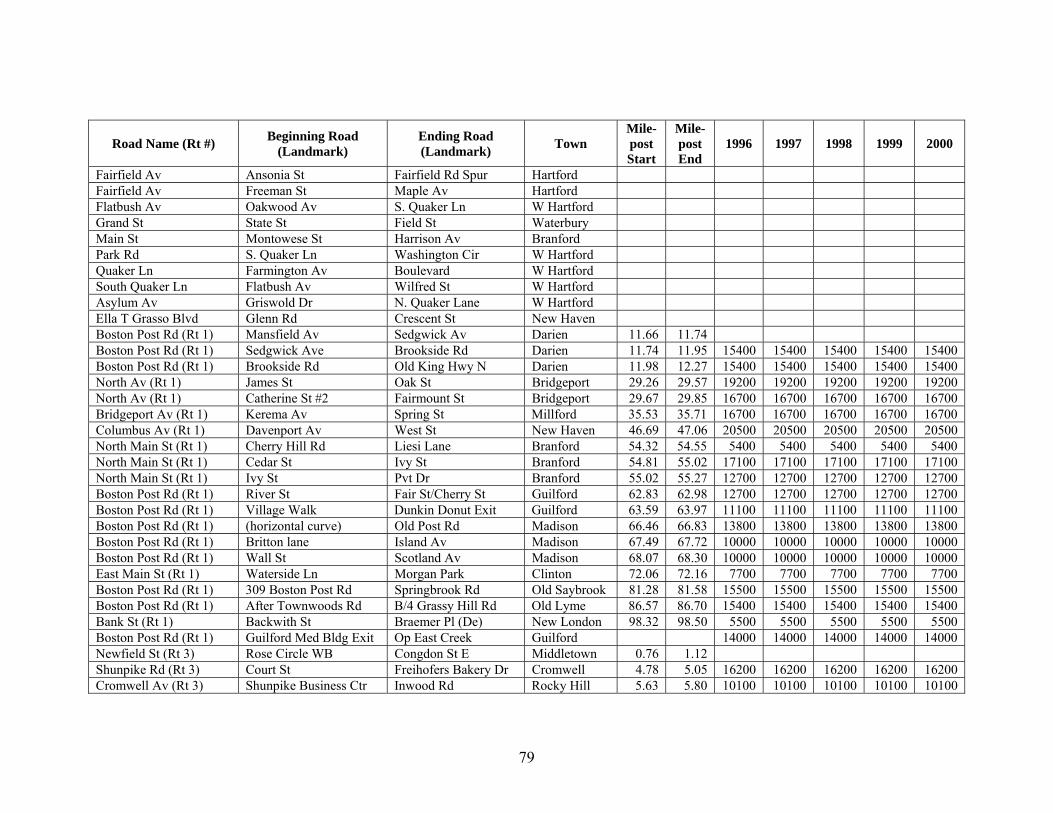
79
Road Name (Rt #) Beginning Road (Landmark)
Ending Road (Landmark) Town
Mile-post Start
Mile-post End
1996 1997 1998 1999 2000
Fairfield Av Ansonia St Fairfield Rd Spur Hartford Fairfield Av Freeman St Maple Av Hartford Flatbush Av Oakwood Av S. Quaker Ln W Hartford Grand St State St Field St Waterbury Main St Montowese St Harrison Av Branford Park Rd S. Quaker Ln Washington Cir W Hartford Quaker Ln Farmington Av Boulevard W Hartford South Quaker Ln Flatbush Av Wilfred St W Hartford Asylum Av Griswold Dr N. Quaker Lane W Hartford Ella T Grasso Blvd Glenn Rd Crescent St New Haven Boston Post Rd (Rt 1) Mansfield Av Sedgwick Av Darien 11.66 11.74 Boston Post Rd (Rt 1) Sedgwick Ave Brookside Rd Darien 11.74 11.95 15400 15400 15400 15400 15400 Boston Post Rd (Rt 1) Brookside Rd Old King Hwy N Darien 11.98 12.27 15400 15400 15400 15400 15400 North Av (Rt 1) James St Oak St Bridgeport 29.26 29.57 19200 19200 19200 19200 19200 North Av (Rt 1) Catherine St #2 Fairmount St Bridgeport 29.67 29.85 16700 16700 16700 16700 16700 Bridgeport Av (Rt 1) Kerema Av Spring St Millford 35.53 35.71 16700 16700 16700 16700 16700 Columbus Av (Rt 1) Davenport Av West St New Haven 46.69 47.06 20500 20500 20500 20500 20500 North Main St (Rt 1) Cherry Hill Rd Liesi Lane Branford 54.32 54.55 5400 5400 5400 5400 5400 North Main St (Rt 1) Cedar St Ivy St Branford 54.81 55.02 17100 17100 17100 17100 17100 North Main St (Rt 1) Ivy St Pvt Dr Branford 55.02 55.27 12700 12700 12700 12700 12700 Boston Post Rd (Rt 1) River St Fair St/Cherry St Guilford 62.83 62.98 12700 12700 12700 12700 12700 Boston Post Rd (Rt 1) Village Walk Dunkin Donut Exit Guilford 63.59 63.97 11100 11100 11100 11100 11100 Boston Post Rd (Rt 1) (horizontal curve) Old Post Rd Madison 66.46 66.83 13800 13800 13800 13800 13800 Boston Post Rd (Rt 1) Britton lane Island Av Madison 67.49 67.72 10000 10000 10000 10000 10000 Boston Post Rd (Rt 1) Wall St Scotland Av Madison 68.07 68.30 10000 10000 10000 10000 10000 East Main St (Rt 1) Waterside Ln Morgan Park Clinton 72.06 72.16 7700 7700 7700 7700 7700 Boston Post Rd (Rt 1) 309 Boston Post Rd Springbrook Rd Old Saybrook 81.28 81.58 15500 15500 15500 15500 15500 Boston Post Rd (Rt 1) After Townwoods Rd B/4 Grassy Hill Rd Old Lyme 86.57 86.70 15400 15400 15400 15400 15400 Bank St (Rt 1) Backwith St Braemer Pl (De) New London 98.32 98.50 5500 5500 5500 5500 5500 Boston Post Rd (Rt 1) Guilford Med Bldg Exit Op East Creek Guilford 14000 14000 14000 14000 14000 Newfield St (Rt 3) Rose Circle WB Congdon St E Middletown 0.76 1.12 Shunpike Rd (Rt 3) Court St Freihofers Bakery Dr Cromwell 4.78 5.05 16200 16200 16200 16200 16200 Cromwell Av (Rt 3) Shunpike Business Ctr Inwood Rd Rocky Hill 5.63 5.80 10100 10100 10100 10100 10100

80
Road Name (Rt #) Beginning Road (Landmark)
Ending Road (Landmark) Town
Mile-post Start
Mile-post End
1996 1997 1998 1999 2000
Maple St (Rt 3) Harvest Lane Westerly Terr Rocky Hill 7.66 7.88 10100 10100 10100 10100 10100 Maple St (Rt 3) Sandy Dr Hang Dog Lane Rocky Hill 7.92 8.19 9600 9600 9600 9600 9600 Maple St (Rt 3) Gilbert Av Two Stone Dr Wethersfield 8.41 8.96 9600 9600 9600 9600 9600 Maple St (Rt 3) Griswold Rd Butler St (One way) Wethersfield 9.01 9.29 9600 9600 9600 9600 9600 Maple St (Rt 3) Kimball Rd Charter Rd Wethersfield 9.44 9.69 8400 8400 8400 8400 8400 Newsfield St (Rt 3) Wilderman's Way Middletown 8400 8400 8400 8400 8400 Sharon Tpke (Rt 4) Bartholomew Rd (horizontal curve) Goshen 14.00 14.44 Sharon Tpke (Rt 4) School Hill Rd West St Goshen 16.52 16.92 2700 2700 2700 2700 2700 Migeon Av (Rt 4) Gardenhurst Av Torrington 22.34 22.51 5400 5400 5400 5400 5400 North Elm St (Rt 4) Migeon Av Eagle St Torrington 22.89 23.23 11800 11800 11800 11800 11800 Main St Rourke Pl Elm St Farmington 38.39 38.67 10500 10500 10500 10500 10500 Farmington Av W. Avon Rd (Rt 167) Beyond Walnut St Farmington 39.10 39.47 12400 12400 12400 12400 12400 State St (Rt 5) Edmund St London Dr Hamden 1.76 2.04 18000 18000 18000 18000 18000 State St (Rt 5) Fernwood Dr Foote St Hamden 2.23 2.62 8800 8800 8800 8800 8800 State St (Rt 5) Stevens St Daniel Rd Hamden 2.71 3.08 8800 8800 8800 8800 8800 S. Colony St (Rt 5) Ward St Prince St Wallingford 11.09 11.31 8800 8800 8800 8800 8800 N. Colony St (Rt 5) Church St Christian St Wallingford 11.55 11.82 10600 10600 10600 10600 10600 N. Colony St (Rt 5) Wallace Row North St Wallingford 11.87 12.14 16500 16500 16500 16500 16500 S. Broad St (Rt 5) Green Rd Layman Av Meriden 15.60 15.90 16500 16500 16500 16500 16500 S. Broad St (Rt 5) Hall Av Gale Av Meriden 16.06 16.45 14700 14700 14700 14700 14700 Broad St (Rt 5) Ann St Silver St Meriden 16.47 16.70 12600 12600 12600 12600 12600 Broad St (Rt 5) Atkins St Sherman Av Meriden 17.98 18.18 12600 12600 12600 12600 12600 N Broad St (Rt 5) Clark St Golden St Meriden 18.55 18.77 17500 17500 17500 17500 17500 King St Depot Hill Rd AT&T Entrance Enfield 48.60 48.92 10900 10900 10900 10900 10900 Enfield St (Rt 5) Orbit Dr Post Office Rd Enfield 50.38 50.76 9100 9100 9100 9100 9100 Enfield St (Rt 5) Enfield Terr Fairview Av Enfield 51.32 51.91 14300 14300 14300 14300 14300 Fitch St (Rt 10) Crescent St. Dyer St. New Haven 3.79 3.98 14300 14300 14300 14300 14300 Arch St (Rt 10) Local Wamer St Alstrum St Hamden 4.77 4.94 13200 13200 13200 13200 13200 S. Main St (Rt 10) Bradford Dr Cook Hill Rd Cheshire 14.31 14.72 S Main St (Rt 10) Bradford Dr Mt Sanford Rd Cheshire 14.31 14.02 S. Main St (Rt 10) Cook Hill Rd Brentwood Dr. Cheshire 14.72 15.53 South Main St (Rt 10) Werking St Buckland St Southington 22.65 23.00 21400 21400 21400 21400 21400 Hopmeadow St (Rt 10) Plank Hill Rd Seminary Rd Simsbury 45.30 45.66 6200 6200 6200 6200 6200

81
Road Name (Rt #) Beginning Road (Landmark)
Ending Road (Landmark) Town
Mile-post Start
Mile-post End
1996 1997 1998 1999 2000
Laurel Hill Rd (Rt 12) Hillcrest Rd Ridgewood Dr Norwich 10.28 10.50 N. Main St (Rt 12) East Main St Russell St Jewett City 21.05 21.51 8000 8000 8000 8000 8000 Middletown Av (Rt 17) Flint St Cross St New Haven 1.10 0.82 7100 7100 7100 7100 7100 Main St (Rt 17) Old Maids Lane Great Pond Rd (Pvt) Glastonbury 30.89 31.30 10000 10000 10000 10000 10000 Ellington Rd (Rt 30) Overpass (I-291) 1.64 km b/f Chapel Rd So Windsor 0.55 0.74 8500 8500 8500 8500 8500 Ellington Rd (Rt 30) Chapel Rd (1.640km) Parkview Dr So Windsor 0.86 1.40 5500 5500 5500 5500 5500 Ellington Rd (Rt 30) Northview Dr Lakewood Dr (Pvt) So Windsor 1.57 1.90 Hartford Turnpike (Rt 30) Mt. Vernon Dr South St Vernon 11.50 11.95
Hartford Turnpike (Rt 30) (Tolland Town Line) (Industrial Park) Vernon 12.55 12.71 6800 6800 6800 6800 6800
Grove St (Rt 31) Fern St Hale St Ext. Vernon 0.36 0.65 13300 13300 13300 13300 13300 Bread & Milk St (Rt 31) N. School Rd Zeya Dr Coventry 4.76 4.24 8800 8800 8800 8800 8800 Main St (Rt 31) Wright Mill Rd Dunkin Donuts Coventry 7.05 7.23 4000 4000 4000 4000 4000 Main St (Rt 31) Talcott Hill Rd Dexter Rd Coventry 8.38 8.14 9100 9100 9100 9100 9100 Main St (Rt 31) Beverly Tr Sam Green Rd Coventry 8.87 8.62 9100 9100 9100 9100 9100 Main St (Rt 31) Monument Hill Rd Mason St Coventry 11.25 11.53 9100 9100 9100 9100 9100 Main St (Rt 31) Plains Rd South St Ext Coventry 13.05 13.30 700 700 700 700 700 West Thames (Rt 32) Dunham St Brown St Norwich 11.25 11.52 5100 5100 5100 5100 5100 Washington St (Rt 2/32) Taylor Dr Chelsea Parade S Norwich 12.91 13.07 Windham Rd (Rt 32) Seldon St Old Plains Rd Windham 27.97 27.71 Pleasant St (Rt 32) John St Mountain St Windham 28.64 29.01 14700 14700 14700 14700 14700 Stafford Rd (Rt 32) Jude Ln Coventry Rd Mansfield 33.18 33.86 9200 9200 9200 9200 9200 River Rd (Rt 32) Pinney Hill Rd Willington 41.03 41.19
S. Main St (Rt 41) (Private Dr) Cornwall Bridge Rd (Rt 4) Sharon 4.13 4.33
N. Main St (Rt 41) Cornwall Bridge Rd (Rt 4) West Main St Sharon 4.36 4.56 2100 2100 2100 2100 2100
Gay St (Rt 41) Calkinstown Rd Rhynus Rd Sharon 5.18 5.65 5400 5400 5400 5400 5400 N. Brookvale Rd (Rt 42) Long Hill Rd King Rd Cheshire 12.86 13.15 4200 4200 4200 4200 4200 Main Rd (Rt 44) Porter St Bostwick St Salisbury 3.14 3.31 Center St (Rt 44) Thomas Dr Adams St South Manchester 70.99 71.16 8300 8300 8300 8300 8300

82
Road Name (Rt #) Beginning Road (Landmark)
Ending Road (Landmark) Town
Mile-post Start
Mile-post End
1996 1997 1998 1999 2000
School St (Rt 44) May St Providence St (Rt 171) Putnam 100.12
100.38 7800 7800 7800 7800 7800
South St (Rt 53) Coal Pit Hill Rd Starr Rd Danbury 21.89 21.63 7100 7100 7100 7100 7100 Stratfield Rd (Rt 59) Cornell Rd Brooklawn Pkwy (SB) Fairfield 1.29 1.47 13000 13000 13000 13000 13000 Stratfield Rd (Rt 59) Argonne St Gate Ridge Rd Fairfield 2.17 2.45 10000 10000 10000 10000 10000 Easton Tpke (Rt 59) Wellner Dr Shady Brook Rd Fairfield 3.01 3.33 13100 13100 13100 13100 13100 South St (Rt 63) West St Old South Rd Litchfield 34.86 34.41 13100 13100 13100 13100 13100 North St (Rt 63) West St Norfolk Rd Litchfield 35.03 35.54 5100 5100 5100 5100 5100 Main St (Rt 66) Wall St (Rt 316) Savings Institute Hebron 26.07 26.47 Main St (Rt 66) Winter St Tingley St Windham 35.41 35.57 Main St (Rt 66) High St North St Windham 35.74 35.99 Percival Av (Rt 71) Near Kenton St Carbo Lane Berlin 10.27 10.57 New Britain Rd (Rt 71) Langdon Ct Newton St Berlin 11.55 12.00 2900 2900 2900 2900 2900 S Main St (Rt 71) Veterans Dr South St New Britain 12.38 12.56 10100 10100 10100 10100 10100 Stanley St (Rt 71) Roxbury Rd / Stanley St Stratford Rd New Britain 15.12 15.31 7900 7900 7900 7900 7900 Stanley St (Rt 71) Blake Rd Drury Lane New Britain 16.00 16.27 7600 7600 7600 7600 7600 East Main St (Rt 72) Horizontal Curve Lincoln Av Bristol 6.47 6.88 11700 11700 11700 11700 11700 School St (Rt 72) Main St (Rt 72) Church St / N Main St Bristol 9.58 9.70 16100 16100 16100 16100 16100 Park St (Rt 72) Divinity St Tulip St Bristol 9.97 10.31 11800 11800 11800 11800 11800 Park St (Rt 72) Tulip St Muzzy St Bristol 10.31 10.43 9400 9400 9400 9400 9400 Park St (Rt 72) Dutton St Spruce St Bristol 10.55 10.80 9400 9400 9400 9400 9400 Wapping Wood Rd (Rt 74) Grant Rd Near Eva Circle #1 Ellington 3.65 3.87 9400 9400 9400 9400 9400
Wapping Wood Rd (Rt 74) Hillsdale Dr Windsorville Rd Ellington 4.00 4.23 4200 4200 4200 4200 4200
Union St (Rt 74) Rheel St Orchard St Vernon 6.04 6.15 4200 4200 4200 4200 4200 East Main St Ann St Snipsic St Vernon 7.11 7.47 13300 13300 13300 13300 13300 Tolland Av (Rt 74) Kingsbury Av Vernon 7.77 8.05 4100 4100 4100 4100 4100 Poquonook Av (Rt 75) Pigeon Hill Rd Tiffany Dr Windsor 0.85 1.07 4100 4100 4100 4100 4100 Poquonook Av (Rt 75) near Hansom Hill Rd near Hansom Hill Rd Windsor 2.45 2.60 6600 6600 6600 6600 6600 South Main St (Rt 75) Kent Av High St Suffield 9.46 9.87 8800 8800 8800 8800 8800 North Main St (Rt 75) Day Av (horizontal curve) Suffield 10.29 10.64 12800 12800 12800 12800 12800 North St (Rt 75) Mapleton Av (Rt 190) Suffield 11.02 11.58

83
Road Name (Rt #) Beginning Road (Landmark)
Ending Road (Landmark) Town
Mile-post Start
Mile-post End
1996 1997 1998 1999 2000
N Main St (Rt 75) Mapleton Av (Rt 190) Russell St Suffield 11.02 10.76 North St (Rt 75) Halladay Longview Dr Windsor 12.07 12.56 6600 6600 6600 6600 6600 Whitfield St (Rt 77) Boston St (Rt 146) Broad St Guilford 0.00 0.19 10700 10700 10700 10700 10700 Church St (Rt 77) Broad St Boston Post Rd (US 1) Guilford 0.25 0.50 6600 6600 6600 6600 6600 Church St (Rt 77) Boston Post Rd (US 1) End of School Prop Guilford 0.50 0.87 Foxon Rd (Rt 80) River Rd Circle Dr East Haven 2.75 2.99 6900 6900 6900 6900 6900 Foxon Rd (Rt 80) Edward Rd Sunset Rd No Branford 4.29 3.97 5600 5600 5600 5600 5600 Winthrop Rd (Rt 80) Woodbury Rd Town Park Deep River 23.55 23.91 11000 11000 11000 11000 11000 Elm St (Rt 80) Union St Main St (Rt 154) Deep River 25.73 25.91 14000 14000 14000 14000 14000 High St (Rt 81) Central Av John St Clinton 0.16 0.37 14300 14300 14300 14300 14300 High St (Rt 81) Old Mill Rd (De) PVT Dr B/4 High St Clinton 0.47 0.63 5100 5100 5100 5100 5100 Clinton Rd (Rt 81) Stevens Rd Green Hill Rd Killingworth 5.21 5.57 Higganum Rd (Rt 81) Old Bedford Farm Rd Tooley Rd (Rt 148) Killingworth 8.00 8.29 8800 8800 8800 8800 8800 Manchester Rd (Rt 83) Chimney Sweep Hill Rd Eastbury Hill Rd Glastonbury 0.38 0.55 8800 8800 8800 8800 8800 Manchester Rd (Rt 83) Shoddy Mill Rd (2.063 miles away) Glastonbury 1.85 2.05 5900 5900 5900 5900 5900 Manchester Rd (Rt 83) Howe St Fairway Crossing Glastonbury 3.81 4.11 8100 8100 8100 8100 8100 S. Main St (Rt 83) Fairway Crossing (Pvt) NA Manchester 4.55 4.81 5400 5400 5400 5400 5400 S. Main St (Rt 83) Jct B/4 Fern St Golf Course Manchester 5.47 5.91 5400 5400 5400 5400 5400 S. Main St (Rt 83) Lakewood Circle South Spring St Manchester 6.09 6.28 6300 6300 6300 6300 6300 Main St (Rt 83) Delmont St (Cds) Firehouse Manchester 8.15 8.49 6300 6300 6300 6300 6300 Oakland St (Rt 83) Sheldon Rd Rachel Rd Manchester 9.29 9.55 6300 6300 6300 6300 6300 Oakland St (Rt 83) Tudor La (Pvt) South St Manchester 9.63 9.80 7600 7600 7600 7600 7600 J Trumbull Hwy (Rt 87) Samuel Hill Rd Latham Hill Rd Columbia 11.12 11.49 13300 13300 13300 13300 13300 Hebron Av (Rt 94) Wickham Rd Pinnacle Ln Glastonbury 2.24 2.47 16200 16200 16200 16200 16200 Taftville Occum Rd (Rt 97) DOT Garage Hooper St Norwich 2.31 2.78 16200 16200 16200 16200 16200
Main St (Rt 97) River St Brookside Av Sprague 4.89 5.30 3000 3000 3000 3000 3000 Main St (Rt 99) Evergreen Rd Court St Cromwell 2.25 2.63 Main St (Rt 99) Court St Park Place Cromwell 2.63 2.88 14900 14900 14900 14900 14900 Main St (Rt 99) Evensen Place Sunset Dr Cromwell 3.03 3.48 Quinnipiac Av (Rt 103) Hemingway Place Foxon Hill Rd New Haven 0.49 0.80 Nichols Av (Rt 108) Montrose Pl Calfornia St Stratford 0.13 0.32 9900 9900 9900 9900 9900 Nichols Av (Rt 108) Marcroft St Greenfield Av Stratford 0.65 0.89 7100 7100 7100 7100 7100
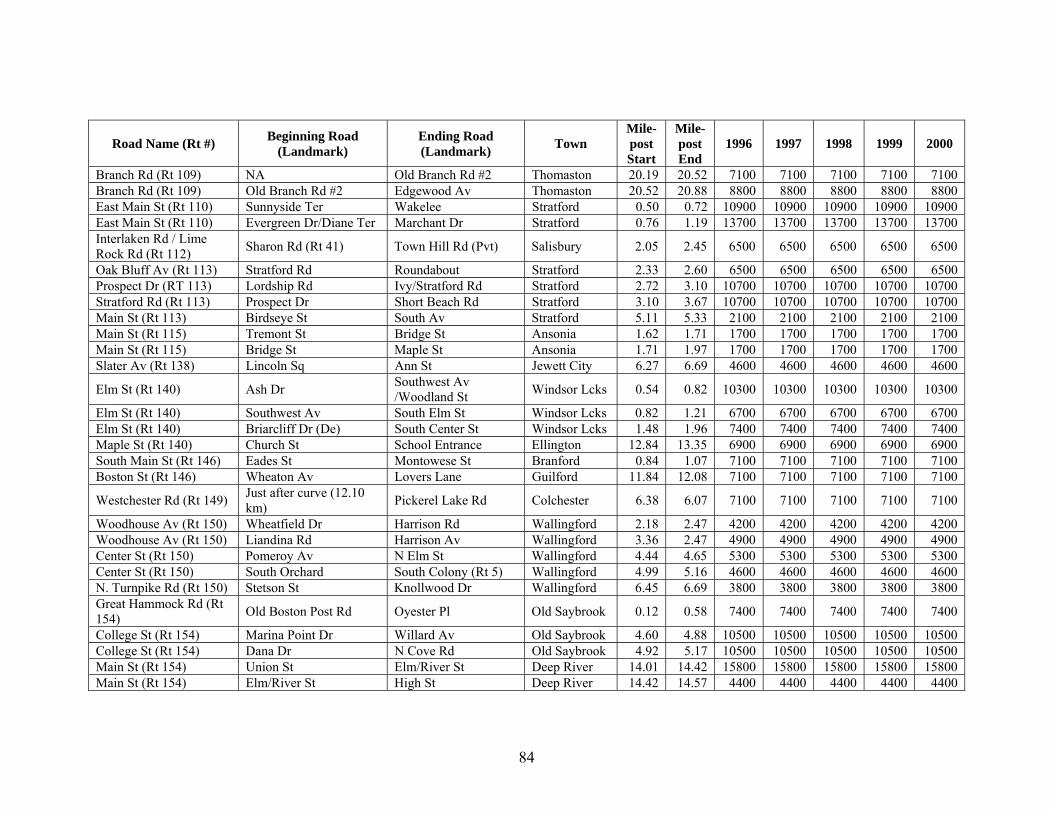
84
Road Name (Rt #) Beginning Road (Landmark)
Ending Road (Landmark) Town
Mile-post Start
Mile-post End
1996 1997 1998 1999 2000
Branch Rd (Rt 109) NA Old Branch Rd #2 Thomaston 20.19 20.52 7100 7100 7100 7100 7100 Branch Rd (Rt 109) Old Branch Rd #2 Edgewood Av Thomaston 20.52 20.88 8800 8800 8800 8800 8800 East Main St (Rt 110) Sunnyside Ter Wakelee Stratford 0.50 0.72 10900 10900 10900 10900 10900 East Main St (Rt 110) Evergreen Dr/Diane Ter Marchant Dr Stratford 0.76 1.19 13700 13700 13700 13700 13700 Interlaken Rd / Lime Rock Rd (Rt 112) Sharon Rd (Rt 41) Town Hill Rd (Pvt) Salisbury 2.05 2.45 6500 6500 6500 6500 6500
Oak Bluff Av (Rt 113) Stratford Rd Roundabout Stratford 2.33 2.60 6500 6500 6500 6500 6500 Prospect Dr (RT 113) Lordship Rd Ivy/Stratford Rd Stratford 2.72 3.10 10700 10700 10700 10700 10700 Stratford Rd (Rt 113) Prospect Dr Short Beach Rd Stratford 3.10 3.67 10700 10700 10700 10700 10700 Main St (Rt 113) Birdseye St South Av Stratford 5.11 5.33 2100 2100 2100 2100 2100 Main St (Rt 115) Tremont St Bridge St Ansonia 1.62 1.71 1700 1700 1700 1700 1700 Main St (Rt 115) Bridge St Maple St Ansonia 1.71 1.97 1700 1700 1700 1700 1700 Slater Av (Rt 138) Lincoln Sq Ann St Jewett City 6.27 6.69 4600 4600 4600 4600 4600
Elm St (Rt 140) Ash Dr Southwest Av /Woodland St Windsor Lcks 0.54 0.82 10300 10300 10300 10300 10300
Elm St (Rt 140) Southwest Av South Elm St Windsor Lcks 0.82 1.21 6700 6700 6700 6700 6700 Elm St (Rt 140) Briarcliff Dr (De) South Center St Windsor Lcks 1.48 1.96 7400 7400 7400 7400 7400 Maple St (Rt 140) Church St School Entrance Ellington 12.84 13.35 6900 6900 6900 6900 6900 South Main St (Rt 146) Eades St Montowese St Branford 0.84 1.07 7100 7100 7100 7100 7100 Boston St (Rt 146) Wheaton Av Lovers Lane Guilford 11.84 12.08 7100 7100 7100 7100 7100
Westchester Rd (Rt 149) Just after curve (12.10 km) Pickerel Lake Rd Colchester 6.38 6.07 7100 7100 7100 7100 7100
Woodhouse Av (Rt 150) Wheatfield Dr Harrison Rd Wallingford 2.18 2.47 4200 4200 4200 4200 4200 Woodhouse Av (Rt 150) Liandina Rd Harrison Av Wallingford 3.36 2.47 4900 4900 4900 4900 4900 Center St (Rt 150) Pomeroy Av N Elm St Wallingford 4.44 4.65 5300 5300 5300 5300 5300 Center St (Rt 150) South Orchard South Colony (Rt 5) Wallingford 4.99 5.16 4600 4600 4600 4600 4600 N. Turnpike Rd (Rt 150) Stetson St Knollwood Dr Wallingford 6.45 6.69 3800 3800 3800 3800 3800 Great Hammock Rd (Rt 154) Old Boston Post Rd Oyester Pl Old Saybrook 0.12 0.58 7400 7400 7400 7400 7400
College St (Rt 154) Marina Point Dr Willard Av Old Saybrook 4.60 4.88 10500 10500 10500 10500 10500 College St (Rt 154) Dana Dr N Cove Rd Old Saybrook 4.92 5.17 10500 10500 10500 10500 10500 Main St (Rt 154) Union St Elm/River St Deep River 14.01 14.42 15800 15800 15800 15800 15800 Main St (Rt 154) Elm/River St High St Deep River 14.42 14.57 4400 4400 4400 4400 4400

85
Road Name (Rt #) Beginning Road (Landmark)
Ending Road (Landmark) Town
Mile-post Start
Mile-post End
1996 1997 1998 1999 2000
Main St (Rt 156) Pennsylvania Av Columbus Av East Lyme 19.01 18.55 5300 5300 5300 5300 5300 Palisado Av (Rt 159) North Meadow Rd Old Kennedy Rd Windsor 4.31 4.93 5300 5300 5300 5300 5300 Palisado Av (Rt 159) Bissellls Ferry Rd (Pvt) (horizontal curve) Windsor 4.98 5.39 6400 6400 6400 6400 6400 Palisado Av (Rt 159) Clapp Rd N Hayden Station Rd Windsor Lcks 6.98 6.58 7200 7200 7200 7200 7200 Palisado Av (Rt 159) near Clapp Rd North Windsor 7.11 7.49 10100 10100 10100 10100 10100 North Main St (Rt 159) Fairview St Fernwood Dr Windsor Lcks 9.97 10.11 4400 4400 4400 4400 4400 East St S. (Rt 159) Paper St Alexander Lane Suffield 11.63 12.03 4400 4400 4400 4400 4400 East St S (Rt 159) Bridge St Thrail Av Suffield 13.00 13.37 3200 3200 3200 3200 3200 East St N. (Rt 159) Thompsonville Rd Burbank Av Suffield 14.43 14.60 3200 3200 3200 3200 3200 New Britain Av (Rt 160) Catherine Rd (horizontal curve) Rocky Hill 1.95 2.22 8200 8200 8200 8200 8200 Elm St (Rt 160) Griems Rd Main St (Rt 99) Rocky Hill 5.17 5.42 8200 8200 8200 8200 8200 Pennsylvania Av (Rt 161) Grand St Smith St East Lyme 0.06 0.31 8200 8200 8200 8200 8200
New Haven Av (Rt 162) Mary Ellen Dr Sparrowbush Lane Millford 3.79 4.05 6300 6300 6300 6300 6300 Willard Av (Rt 173) Stanwell Rd (Pvt) Halleran Dr Newington 0.60 0.85 8400 8400 8400 8400 8400 Willard Av (Rt 173) New Britain Av Robbins Av Newington 1.38 1.74 6800 6800 6800 6800 6800 Willard Av (Rt 173) Pheasant Run Robbins Av Newington 1.38 1.74 9700 9700 9700 9700 9700 Willard Av (Rt 173) Robbins Av Wilson Av Newington 1.74 2.16 9300 9300 9300 9300 9300 New Britain Av (Rt 174) Eleanor Pl Roberts St Newington 1.84 1.60 10500 10500 10500 10500 10500 Wells Rd (Rt 175) Knight St Wells Farm Dr Wethersfield 5.33 5.03 11000 11000 11000 11000 11000 Wells Rd (Rt 175) Folly Brook Blvd Knight St Wethersfield 5.60 5.36 11000 11000 11000 11000 11000 Wells Rd (Rt 175) Jay St Folly Brook Blvd Wethersfield 5.79 5.60 11000 11000 11000 11000 11000 Main St (Rt 176) Northwood Rd Cheney Ln Newington 1.64 1.37 12600 12600 12600 12600 12600 Main St (Rt 176) Elleworth St Kirkham St Newington 2.09 2.31 11100 11100 11100 11100 11100 Hartford Av (Rt 176) Garvan St Thomas St Newington 3.43 3.20 11100 11100 11100 11100 11100 S. Washington St (Rt 177) Duval La Madeley Ct Plainville 0.34 0.95 11100 11100 11100 11100 11100
S. Washington St (Rt 177) Madeley Ct Broad St Plainville 0.95 1.36 12900 12900 12900 12900 12900
Washington St (Rt 177) Broad St West Main St (Rt 372) Plainville 1.36 1.56 14300 14300 14300 14300 14300 Simsbury Rd (Rt 185) Tumblebrook La Mohegan Dr W Hartford 5.25 5.60 8200 8200 8200 8200 8200 Mapleton Av (Rt 190) (Horizontal curve) Wren Dr Suffield 0.45 0.28 5000 5000 5000 5000 5000

86
Road Name (Rt #) Beginning Road (Landmark)
Ending Road (Landmark) Town
Mile-post Start
Mile-post End
1996 1997 1998 1999 2000
Thompsonville Rd (Rt 190) Quail Run Rd 4th St. Suffield 0.92 1.24 5000 5000 5000 5000 5000
Hazard Av (Rt 190) Beverly St Martin Terr Enfield 5.56 5.74 7100 7100 7100 7100 7100 Main St (Rt 190) Shaker Rd Hall Hill Rd (Rt 186) Somers 8.70 9.05 8100 8100 8100 8100 8100 Storrs Rd (Rt 195) Warrenville Rd (Rt 98) Bassett Bridge Rd Mansfield 3.74 3.28 4400 4400 4400 4400 4400 Storrs Rd (Rt 195) East Road Agronomy Rd Mansfield 6.02 6.33 4400 4400 4400 4400 4400 Storrs Rd (Rt 195) Private Rd Rockridge Rd (E-1) Mansfield 10.44 11.30 21100 21100 21100 21100 21100 Hopeville Rd (Rt 201) Near Monroe St NA Jewett City 19.35 19.57 13300 13300 13300 13300 13300 East Main St (Rt 201) Palmer Av End of Sidewalk Jewett City 19.89 19.57 12500 12500 12500 12500 12500 New Litchfield St (Rt 202) Blake St Earl St Torrington 43.46 43.61 12300 12300 12300 12300 12300
East Main St (Rt 202) Willow St Main St Torrington 44.39 44.15 11100 11100 11100 11100 11100 Great Neck Rd (Rt 213) Jordan Terr. Pfizer Dr Waterford 0.07 0.52 2900 2900 2900 2900 2900 Great Neck Rd (Rt 213) Pfizer Dr Breman Rd Waterford 0.52 1.19 2900 2900 2900 2900 2900 Great Neck Rd (Rt 213) Braman Rd Colonial Dr Waterford 1.19 0.73 6800 6800 6800 6800 6800 Ocean Av (Rt 213) Near School St Sherman St New London 5.64 5.47 17900 17900 17900 17900 17900 Ocean Av (Rt 213) Faire Harbour Pl Sunset St New London 5.83 6.05 8000 8000 8000 8000 8000 N. Main St (Rt 218) Huron Dr Miler/Old Meadow Rd W Hartford 0.50 0.85 8000 8000 8000 8000 8000 South Eagleville Rd (Rt 275) Mansfield 2.94 2.69
South Eagleville Rd (Rt 275) Maple Rd (Apartment entrance) Mansfield 3.52 4.02 11500 11500 11500 11500 11500
Pinney St (Rt 286) Windermere Av Private Rd Ellington 0.89 1.49 15600 15600 15600 15600 15600 Main St (Rt 286) Tomoka St Maple St Ellington 2.60 2.97 14700 14700 14700 14700 14700 E Robbins Av (Rt 287) Lydall Rd Kitts Lane #1 Newington 0.38 0.57 Prospect St (Rt 287) Thornbush Rd Collier Rd Wethersfield 1.58 1.76 5200 5200 5200 5200 5200 Prospect St (Rt 287) Olney Rd #1 Griswold Rd Wethersfield 2.53 2.76 6700 6700 6700 6700 6700 Prospect St (Rt 287) Millwoods Park Dr Harris Hill Rd Wethersfield 2.96 3.14 3500 3500 3500 3500 3500 Beaumont Hwy (Rt 289) Valley Hill Rd Rafferty Rd Lebanon 2.76 3.34 13700 13700 13700 13700 13700 Jordan Lane (Rt 314) Ridge Crest Circle Godwin Park Rd Wethersfield 0.96 1.41 12000 12000 12000 12000 12000 Townsend Av (Rt 337) Sound View Ter Hervey St New Haven 0.73 1.14 12000 12000 12000 12000 12000 Townsend Av (Rt 337) Concord St Fort Hale Rd New Haven 1.50 1.22 13200 13200 13200 13200 13200 W. Center St (502) Moore St Cooper St Manchester 5.94 6.19 4000 4000 4000 4000 4000

87
Road Name (Rt #) Beginning Road (Landmark)
Ending Road (Landmark) Town
Mile-post Start
Mile-post End
1996 1997 1998 1999 2000
Lake St (Rt 533) Lydall St Berkeley Dr Vernon 1.19 1.62 8800 8800 8800 8800 8800 Tunnel Rd (Rt 533) Russell Dr Old Stone Rd Vernon 2.39 2.60 8900 8900 8900 8900 8900 Norwich Av (SR 616) Main St (Rt 85) Pleasant St Colchester 0.00 0.34 8900 8900 8900 8900 8900 Main St (Rt 800) King St Scoville St Torrington 1.67 1.87 Main St (Rt 800) Linden St East Albert St Torrington 2.10 2.28 Thomaston Av (Rt 847) Plaza Driveway W. Main St Waterbury 4.25 3.96 Thomaston Av (Rt 847) Shefield St Boyden St Waterbury 6.22 6.10 6100 6100 6100 6100 6100 Thomaston Av (Rt 847) Driggs St Shefield St Waterbury 6.32 6.22 7200 7200 7200 7200 7200 Thomaston Av (Rt 847) Plaza driveway Huntingdon Av Waterbury 9200 9200 9200 9200 9200

88
Table A-5. AADT by Year, 2001 to 2004 and Average
Road Name (Rt #) Beginning Road (Landmark)
Ending Road (Landmark) Town
Mile-post Start
Mile-post End
2001 2002 2003 2004 Ave.
Jackson St Ash St Summit St Windham Boulevard Mountain Rd Ridgewood Rd W Hartford Boulevard Ridgewood Rd Woodrow St W Hartford Mountain Rd Hedwig Court Farmington Av W Hartford Mountain Rd Flagg Rd Mountain Farm Rd W Hartford Mountain Rd Richmond Ln Fairfield Rd W Hartford Flagg Rd Coolidge Rd Blue Ridge Ln W Hartford Asylum Av Lincoln Av Trout Brook Dr W Hartford Farmington Av Trout Brook Dr Ardmore Rd W Hartford Farmington Av N. Quaker Ln Whiting Ln W Hartford Farmington Av Whiting Ln Highland St W Hartford Prospect Av Cone St Farmington Av Hartford Prospect Av Asylum Av Fern St Hartford Prospect Av Asylum Av Albany Av Hartford Prospect Av Farmington Av West Boulevard Hartford Fern St Concord St Steele Rd W Hartford Fern St N. Quaker Ln Trout Brook Dr W Hartford Fern St Clifton Av Cobbs Rd W Hartford Fern St Fernbel Lane Cobbs Rd W Hartford Lake St Montauk Dr Phoenix St Vernon Washington St Phoenix St Brookview St Vernon Central Av Hickory St 13th St Norwich Spring Hill Rd Storrs Rd Mansfield Colony St Brooks St Church St Meriden Oakwood Av Park Rd W Hartford White St (Driveway b/f garage) Bates Pl Danbury Deer Hill Rd Wilson St Wooster Rd Danbury Main St Newberry St Pleasant Rd So Windsor Broadway Broad St Chelsea Parade S Norwich

89
Road Name (Rt #) Beginning Road (Landmark)
Ending Road (Landmark) Town
Mile-post Start
Mile-post End
2001 2002 2003 2004 Ave.
Fairfield Av Ansonia St Fairfield Rd Spur Hartford Fairfield Av Freeman St Maple Av Hartford Flatbush Av Oakwood Av S. Quaker Ln W Hartford Grand St State St Field St Waterbury Main St Montowese St Harrison Av Branford Park Rd S. Quaker Ln Washington Cir W Hartford Quaker Ln Farmington Av Boulevard W Hartford South Quaker Ln Flatbush Av Wilfred St W Hartford Asylum Av Griswold Dr N. Quaker Lane W Hartford Ella T Grasso Blvd Glenn Rd Crescent St New Haven Boston Post Rd (Rt 1) Mansfield Av Sedgwick Av Darien 11.66 11.74 15700 15000 15100 15000 15513 Boston Post Rd (Rt 1) Sedgwick Ave Brookside Rd Darien 11.74 11.95 15700 15000 15100 15000 15513 Boston Post Rd (Rt 1) Brookside Rd Old King Hwy N Darien 11.98 12.27 19500 18600 18800 18600 18625 North Av (Rt 1) James St Oak St Bridgeport 29.26 29.57 15900 16000 16200 16900 16225 North Av (Rt 1) Catherine St #2 Fairmount St Bridgeport 29.67 29.85 15900 16000 16200 16900 16225 Bridgeport Av (Rt 1) Kerema Av Spring St Millford 35.53 35.71 20800 20900 22300 22300 21850 Columbus Av (Rt 1) Davenport Av West St New Haven 46.69 47.06 5500 5500 5900 5900 5175 North Main St (Rt 1) Cherry Hill Rd Liesi Lane Branford 54.32 54.55 17700 17900 18100 19200 17188 North Main St (Rt 1) Cedar St Ivy St Branford 54.81 55.02 14900 15000 15200 14100 13263 North Main St (Rt 1) Ivy St Pvt Dr Branford 55.02 55.27 14900 15000 15200 14100 13263 Boston Post Rd (Rt 1) River St Fair St/Cherry St Guilford 62.83 62.98 10300 10400 10500 10300 10513 Boston Post Rd (Rt 1) Village Walk Dunkin Donut Exit Guilford 63.59 63.97 13000 13100 13200 15800 13538 Boston Post Rd (Rt 1) (horizontal curve) Old Post Rd Madison 66.46 66.83 10300 10400 10500 11000 10188 Boston Post Rd (Rt 1) Britton lane Island Av Madison 67.49 67.72 10300 10400 10500 11000 10188 Boston Post Rd (Rt 1) Wall St Scotland Av Madison 68.07 68.30 6900 7000 7100 9900 7888 East Main St (Rt 1) Waterside Ln Morgan Park Clinton 72.06 72.16 13800 14000 14100 13700 14463 Boston Post Rd (Rt 1) 309 Boston Post Rd Springbrook Rd Old Saybrook 81.28 81.58 14600 14700 14800 13600 14150 Boston Post Rd (Rt 1) After Townwoods Rd B/4 Grassy Hill Rd Old Lyme 86.57 86.70 5500 5600 6500 6400 5375 Bank St (Rt 1) Backwith St Braemer Pl (De) New London 98.32 98.50 14200 14500 14600 14400 14575 Boston Post Rd (Rt 1) Guilford Med Bldg Exit Op East Creek Guilford Newfield St (Rt 3) Rose Circle WB Congdon St E Middletown 0.76 1.12 16700 16800 17800 14300 15800 Shunpike Rd (Rt 3) Court St Freihofers Bakery Dr Cromwell 4.78 5.05 10200 10200 11000 11000 11225 Cromwell Av (Rt 3) Shunpike Business Ctr Inwood Rd Rocky Hill 5.63 5.80 10200 10200 11000 11000 11225

90
Road Name (Rt #) Beginning Road (Landmark)
Ending Road (Landmark) Town
Mile-post Start
Mile-post End
2001 2002 2003 2004 Ave.
Maple St (Rt 3) Harvest Lane Westerly Terr Rocky Hill 7.66 7.88 9700 9800 10100 10100 9550 Maple St (Rt 3) Sandy Dr Hang Dog Lane Rocky Hill 7.92 8.19 9700 9800 10100 10100 9550 Maple St (Rt 3) Gilbert Av Two Stone Dr Wethersfield 8.41 8.96 9700 9800 10700 10700 9700 Maple St (Rt 3) Griswold Rd Butler St (One way) Wethersfield 9.01 9.29 8500 8600 8400 8300 8325 Maple St (Rt 3) Kimball Rd Charter Rd Wethersfield 9.44 9.69 8500 8600 8400 8300 8325 Newsfield St (Rt 3) Wilderman's Way Middletown Sharon Tpke (Rt 4) Bartholomew Rd (horizontal curve) Goshen 14.00 14.44 2700 2700 3100 3100 2900 Sharon Tpke (Rt 4) School Hill Rd West St Goshen 16.52 16.92 5500 5500 6500 6500 5613 Migeon Av (Rt 4) Gardenhurst Av Torrington 22.34 22.51 12000 12000 12700 12700 11938 North Elm St (Rt 4) Migeon Av Eagle St Torrington 22.89 23.23 10600 10600 12100 12100 10563 Main St Rourke Pl Elm St Farmington 38.39 38.67 12500 12700 13000 13000 13050 Farmington Av W. Avon Rd (Rt 167) Beyond Walnut St Farmington 39.10 39.47 18200 18300 18000 18000 18325 State St (Rt 5) Edmund St London Dr Hamden 1.76 2.04 8900 9000 9000 9000 8900 State St (Rt 5) Fernwood Dr Foote St Hamden 2.23 2.62 8900 9000 9000 9000 8900 State St (Rt 5) Stevens St Daniel Rd Hamden 2.71 3.08 8900 9000 9000 9000 8900 S. Colony St (Rt 5) Ward St Prince St Wallingford 11.09 11.31 12100 12200 12300 12500 10988 N. Colony St (Rt 5) Church St Christian St Wallingford 11.55 11.82 16900 17000 17200 14300 15788 N. Colony St (Rt 5) Wallace Row North St Wallingford 11.87 12.14 16900 17000 17200 14300 15788 S. Broad St (Rt 5) Green Rd Layman Av Meriden 15.60 15.90 13700 13800 14000 15400 14938 S. Broad St (Rt 5) Hall Av Gale Av Meriden 16.06 16.45 12400 12500 12600 12800 12350 Broad St (Rt 5) Ann St Silver St Meriden 16.47 16.70 12400 12500 12600 12800 12350 Broad St (Rt 5) Atkins St Sherman Av Meriden 17.98 18.18 17000 17200 17300 19000 17113 N Broad St (Rt 5) Clark St Golden St Meriden 18.55 18.77 10300 10400 10500 10100 10300 King St Depot Hill Rd AT&T Entrance Enfield 48.60 48.92 11100 11200 11300 9500 9300 Enfield St (Rt 5) Orbit Dr Post Office Rd Enfield 50.38 50.76 17800 17900 18100 13100 14638 Enfield St (Rt 5) Enfield Terr Fairview Av Enfield 51.32 51.91 13400 13500 13600 12500 13450 Fitch St (Rt 10) Crescent St. Dyer St. New Haven 3.79 3.98 13400 13400 15200 15100 13538 Arch St (Rt 10) Local Wamer St Alstrum St Hamden 4.77 4.94 S. Main St (Rt 10) Bradford Dr Cook Hill Rd Cheshire 14.31 14.72 S Main St (Rt 10) Bradford Dr Mt Sanford Rd Cheshire 14.31 14.02 S. Main St (Rt 10) Cook Hill Rd Brentwood Dr. Cheshire 14.72 15.53 21600 21800 22000 21200 20875 South Main St (Rt 10) Werking St Buckland St Southington 22.65 23.00 6300 6300 6200 6200 5713 Hopmeadow St (Rt 10) Plank Hill Rd Seminary Rd Simsbury 45.30 45.66

91
Road Name (Rt #) Beginning Road (Landmark)
Ending Road (Landmark) Town
Mile-post Start
Mile-post End
2001 2002 2003 2004 Ave.
Laurel Hill Rd (Rt 12) Hillcrest Rd Ridgewood Dr Norwich 10.28 10.50 8100 8400 8400 8300 8200 N. Main St (Rt 12) East Main St Russell St Jewett City 21.05 21.51 7200 6400 6500 7200 7013 Middletown Av (Rt 17) Flint St Cross St New Haven 1.10 0.82 10100 10200 9200 9200 11238 Main St (Rt 17) Old Maids Lane Great Pond Rd (Pvt) Glastonbury 30.89 31.30 8600 8600 6400 6400 7275 Ellington Rd (Rt 30) Overpass (I-291) 1.64 km b/f Chapel Rd So Windsor 0.55 0.74 5200 5200 5300 6900 5538 Ellington Rd (Rt 30) Chapel Rd (1.640km) Parkview Dr So Windsor 0.86 1.40 Ellington Rd (Rt 30) Northview Dr Lakewood Dr (Pvt) So Windsor 1.57 1.90 Hartford Turnpike (Rt 30) Mt. Vernon Dr South St Vernon 11.50 11.95 6900 6800 6900 6800 6763
Hartford Turnpike (Rt 30) (Tolland Town Line) (Industrial Park) Vernon 12.55 12.71 13500 13400 13500 13300 12850
Grove St (Rt 31) Fern St Hale St Ext. Vernon 0.36 0.65 9000 8900 9000 8900 8263 Bread & Milk St (Rt 31) N. School Rd Zeya Dr Coventry 4.76 4.24 4000 4900 4900 4800 3963 Main St (Rt 31) Wright Mill Rd Dunkin Donuts Coventry 7.05 7.23 9200 9500 9600 9400 9138 Main St (Rt 31) Talcott Hill Rd Dexter Rd Coventry 8.38 8.14 9200 9500 9600 9400 9138 Main St (Rt 31) Beverly Tr Sam Green Rd Coventry 8.87 8.62 9200 9500 9600 9400 9138 Main St (Rt 31) Monument Hill Rd Mason St Coventry 11.25 11.53 7100 6900 7000 6900 6063 Main St (Rt 31) Plains Rd South St Ext Coventry 13.05 13.30 5100 5800 5800 5800 5375 West Thames (Rt 32) Dunham St Brown St Norwich 11.25 11.52 Washington St (Rt 2/32) Taylor Dr Chelsea Parade S Norwich 12.91 13.07 Windham Rd (Rt 32) Seldon St Old Plains Rd Windham 27.97 27.71 13600 13700 13800 13600 14038 Pleasant St (Rt 32) John St Mountain St Windham 28.64 29.01 8500 8500 8600 9600 8788 Stafford Rd (Rt 32) Jude Ln Coventry Rd Mansfield 33.18 33.86 River Rd (Rt 32) Pinney Hill Rd Willington 41.03 41.19
S. Main St (Rt 41) (Private Dr) Cornwall Bridge Rd (Rt 4) Sharon 4.13 4.33 2100 2100 2100 2100 2038
N. Main St (Rt 41) Cornwall Bridge Rd (Rt 4) West Main St Sharon 4.36 4.56 5500 5500 5300 5300 5075
Gay St (Rt 41) Calkinstown Rd Rhynus Rd Sharon 5.18 5.65 4200 4200 4100 4100 3988 N. Brookvale Rd (Rt 42) Long Hill Rd King Rd Cheshire 12.86 13.15 Main Rd (Rt 44) Porter St Bostwick St Salisbury 3.14 3.31 8500 8500 9900 9900 9125 Center St (Rt 44) Thomas Dr Adams St South Manchester 70.99 71.16 7900 9100 9100 9000 8525

92
Road Name (Rt #) Beginning Road (Landmark)
Ending Road (Landmark) Town
Mile-post Start
Mile-post End
2001 2002 2003 2004 Ave.
School St (Rt 44) May St Providence St (Rt 171) Putnam 100.12
100.38 7100 7200 7300 7800 7063
South St (Rt 53) Coal Pit Hill Rd Starr Rd Danbury 21.89 21.63 11900 12000 12100 1400 11275 Stratfield Rd (Rt 59) Cornell Rd Brooklawn Pkwy (SB) Fairfield 1.29 1.47 10700 10800 10900 10900 10538 Stratfield Rd (Rt 59) Argonne St Gate Ridge Rd Fairfield 2.17 2.45 13400 13600 13700 13000 12613 Easton Tpke (Rt 59) Wellner Dr Shady Brook Rd Fairfield 3.01 3.33 13400 13600 13700 13000 12613 South St (Rt 63) West St Old South Rd Litchfield 34.86 34.41 5200 6300 6300 6200 5488 North St (Rt 63) West St Norfolk Rd Litchfield 35.03 35.54 Main St (Rt 66) Wall St (Rt 316) Savings Institute Hebron 26.07 26.47 Main St (Rt 66) Winter St Tingley St Windham 35.41 35.57 Main St (Rt 66) High St North St Windham 35.74 35.99 Percival Av (Rt 71) Near Kenton St Carbo Lane Berlin 10.27 10.57 3000 3000 3100 3100 3000 New Britain Rd (Rt 71) Langdon Ct Newton St Berlin 11.55 12.00 10200 10300 7300 7300 9525 S Main St (Rt 71) Veterans Dr South St New Britain 12.38 12.56 8000 8000 7400 7400 8288 Stanley St (Rt 71) Roxbury Rd / Stanley St Stratford Rd New Britain 15.12 15.31 7700 7700 9400 9400 8788 Stanley St (Rt 71) Blake Rd Drury Lane New Britain 16.00 16.27 11900 11900 11500 11500 11313 East Main St (Rt 72) Horizontal Curve Lincoln Av Bristol 6.47 6.88 16300 16400 16000 16000 16125 School St (Rt 72) Main St (Rt 72) Church St / N Main St Bristol 9.58 9.70 11900 12000 11900 11900 11913 Park St (Rt 72) Divinity St Tulip St Bristol 9.97 10.31 9600 9600 9700 9700 9950 Park St (Rt 72) Tulip St Muzzy St Bristol 10.31 10.43 9600 9600 9700 9700 9950 Park St (Rt 72) Dutton St Spruce St Bristol 10.55 10.80 9600 9600 9700 9700 9950 Wapping Wood Rd (Rt 74) Grant Rd Near Eva Circle #1 Ellington 3.65 3.87 4600 4600 4700 4800 4275
Wapping Wood Rd (Rt 74) Hillsdale Dr Windsorville Rd Ellington 4.00 4.23 4600 4600 4700 4800 4275
Union St (Rt 74) Rheel St Orchard St Vernon 6.04 6.15 13500 12600 12800 12600 12725 East Main St Ann St Snipsic St Vernon 7.11 7.47 4100 4000 4000 4000 4275 Tolland Av (Rt 74) Kingsbury Av Vernon 7.77 8.05 4100 4000 4000 4000 3775 Poquonook Av (Rt 75) Pigeon Hill Rd Tiffany Dr Windsor 0.85 1.07 7500 7500 7600 6100 6788 Poquonook Av (Rt 75) near Hansom Hill Rd near Hansom Hill Rd Windsor 2.45 2.60 9200 9300 9400 9500 9188 South Main St (Rt 75) Kent Av High St Suffield 9.46 9.87 12600 12700 12800 11900 12338 North Main St (Rt 75) Day Av (horizontal curve) Suffield 10.29 10.64 North St (Rt 75) Mapleton Av (Rt 190) Suffield 11.02 11.58

93
Road Name (Rt #) Beginning Road (Landmark)
Ending Road (Landmark) Town
Mile-post Start
Mile-post End
2001 2002 2003 2004 Ave.
N Main St (Rt 75) Mapleton Av (Rt 190) Russell St Suffield 11.02 10.76 7100 7200 7200 7400 6900 North St (Rt 75) Halladay Longview Dr Windsor 12.07 12.56 10500 10600 10700 11300 10675 Whitfield St (Rt 77) Boston St (Rt 146) Broad St Guilford 0.00 0.19 7100 7200 7200 7400 6900 Church St (Rt 77) Broad St Boston Post Rd (US 1) Guilford 0.25 0.50 Church St (Rt 77) Boston Post Rd (US 1) End of School Prop Guilford 0.50 0.87 7000 7000 7100 6700 6900 Foxon Rd (Rt 80) River Rd Circle Dr East Haven 2.75 2.99 5600 5700 5700 5800 5588 Foxon Rd (Rt 80) Edward Rd Sunset Rd No Branford 4.29 3.97 10600 10700 10800 10800 10588 Winthrop Rd (Rt 80) Woodbury Rd Town Park Deep River 23.55 23.91 13800 13900 18500 18400 15725 Elm St (Rt 80) Union St Main St (Rt 154) Deep River 25.73 25.91 13800 13900 14100 17200 14300 High St (Rt 81) Central Av John St Clinton 0.16 0.37 5100 5100 5200 5000 4875 High St (Rt 81) Old Mill Rd (De) PVT Dr B/4 High St Clinton 0.47 0.63 Clinton Rd (Rt 81) Stevens Rd Green Hill Rd Killingworth 5.21 5.57 8100 8200 8200 8500 8350 Higganum Rd (Rt 81) Old Bedford Farm Rd Tooley Rd (Rt 148) Killingworth 8.00 8.29 8100 8200 8200 8500 8350 Manchester Rd (Rt 83) Chimney Sweep Hill Rd Eastbury Hill Rd Glastonbury 0.38 0.55 6300 6400 6400 6700 6063 Manchester Rd (Rt 83) Shoddy Mill Rd (2.063 miles away) Glastonbury 1.85 2.05 8200 8300 8400 7900 7788 Manchester Rd (Rt 83) Howe St Fairway Crossing Glastonbury 3.81 4.11 5500 5500 5500 5500 5488 S. Main St (Rt 83) Fairway Crossing (Pvt) NA Manchester 4.55 4.81 5500 5500 5500 5500 5488 S. Main St (Rt 83) Jct B/4 Fern St Golf Course Manchester 5.47 5.91 6300 6400 7100 7100 6563 S. Main St (Rt 83) Lakewood Circle South Spring St Manchester 6.09 6.28 6300 6400 7100 7100 6563 Main St (Rt 83) Delmont St (Cds) Firehouse Manchester 8.15 8.49 6300 6400 6700 6700 6463 Oakland St (Rt 83) Sheldon Rd Rachel Rd Manchester 9.29 9.55 7700 7700 8700 8700 7988 Oakland St (Rt 83) Tudor La (Pvt) South St Manchester 9.63 9.80 13500 13600 12800 12800 13100 J Trumbull Hwy (Rt 87) Samuel Hill Rd Latham Hill Rd Columbia 11.12 11.49 16500 16500 16800 16800 16213 Hebron Av (Rt 94) Wickham Rd Pinnacle Ln Glastonbury 2.24 2.47 16500 16500 16800 16800 16213 Taftville Occum Rd (Rt 97) DOT Garage Hooper St Norwich 2.31 2.78 3100 3100 2800 2800 2825
Main St (Rt 97) River St Brookside Av Sprague 4.89 5.30 Main St (Rt 99) Evergreen Rd Court St Cromwell 2.25 2.63 15100 15200 16200 16200 14900 Main St (Rt 99) Court St Park Place Cromwell 2.63 2.88 Main St (Rt 99) Evensen Place Sunset Dr Cromwell 3.03 3.48 Quinnipiac Av (Rt 103) Hemingway Place Foxon Hill Rd New Haven 0.49 0.80 10100 10100 9400 9400 8650 Nichols Av (Rt 108) Montrose Pl Calfornia St Stratford 0.13 0.32 7200 7200 8000 8000 7588 Nichols Av (Rt 108) Marcroft St Greenfield Av Stratford 0.65 0.89 7200 7200 6700 6700 7263

94
Road Name (Rt #) Beginning Road (Landmark)
Ending Road (Landmark) Town
Mile-post Start
Mile-post End
2001 2002 2003 2004 Ave.
Branch Rd (Rt 109) NA Old Branch Rd #2 Thomaston 20.19 20.52 8900 8900 9800 9800 9014 Branch Rd (Rt 109) Old Branch Rd #2 Edgewood Av Thomaston 20.52 20.88 10000 10100 10200 10700 10525 East Main St (Rt 110) Sunnyside Ter Wakelee Stratford 0.50 0.72 12400 12500 12600 13400 13188 East Main St (Rt 110) Evergreen Dr/Diane Ter Marchant Dr Stratford 0.76 1.19 6600 5000 5100 5000 5638 Interlaken Rd / Lime Rock Rd (Rt 112) Sharon Rd (Rt 41) Town Hill Rd (Pvt) Salisbury 2.05 2.45 6600 6000 6100 6000 5888
Oak Bluff Av (Rt 113) Stratford Rd Roundabout Stratford 2.33 2.60 10900 11000 11100 12500 11150 Prospect Dr (RT 113) Lordship Rd Ivy/Stratford Rd Stratford 2.72 3.10 10900 11000 11100 11000 10963 Stratford Rd (Rt 113) Prospect Dr Short Beach Rd Stratford 3.10 3.67 2100 2100 2300 2300 2138 Main St (Rt 113) Birdseye St South Av Stratford 5.11 5.33 1700 1800 1800 1300 1638 Main St (Rt 115) Tremont St Bridge St Ansonia 1.62 1.71 1700 1800 1800 1300 1638 Main St (Rt 115) Bridge St Maple St Ansonia 1.71 1.97 4300 4300 4400 4200 4588 Slater Av (Rt 138) Lincoln Sq Ann St Jewett City 6.27 6.69 10700 10800 10900 10600 10388
Elm St (Rt 140) Ash Dr Southwest Av /Woodland St Windsor Lcks 0.54 0.82 6800 6800 6600 6600 6263
Elm St (Rt 140) Southwest Av South Elm St Windsor Lcks 0.82 1.21 7500 7500 7800 7800 7163 Elm St (Rt 140) Briarcliff Dr (De) South Center St Windsor Lcks 1.48 1.96 6900 6100 6200 5900 6613 Maple St (Rt 140) Church St School Entrance Ellington 12.84 13.35 6200 6300 6300 4400 6563 South Main St (Rt 146) Eades St Montowese St Branford 0.84 1.07 6200 6300 6300 6400 6813 Boston St (Rt 146) Wheaton Av Lovers Lane Guilford 11.84 12.08 6200 6300 6300 6400 6813
Westchester Rd (Rt 149) Just after curve (12.10 km) Pickerel Lake Rd Colchester 6.38 6.07 4200 4500 4500 4400 4275
Woodhouse Av (Rt 150) Wheatfield Dr Harrison Rd Wallingford 2.18 2.47 5200 5300 5300 6200 5300 Woodhouse Av (Rt 150) Liandina Rd Harrison Av Wallingford 3.36 2.47 6000 6100 6100 5200 5500 Center St (Rt 150) Pomeroy Av N Elm St Wallingford 4.44 4.65 4700 4700 4500 4500 4288 Center St (Rt 150) South Orchard South Colony (Rt 5) Wallingford 4.99 5.16 3700 5700 3800 5600 3888 N. Turnpike Rd (Rt 150) Stetson St Knollwood Dr Wallingford 6.45 6.69 7600 8900 7700 8800 7463 Great Hammock Rd (Rt 154) Old Boston Post Rd Oyester Pl Old Saybrook 0.12 0.58 10800 11100 10200 10500
College St (Rt 154) Marina Point Dr Willard Av Old Saybrook 4.60 4.88 10800 11100 11400 10825 College St (Rt 154) Dana Dr N Cove Rd Old Saybrook 4.92 5.17 16500 11600 16800 15500 15825 Main St (Rt 154) Union St Elm/River St Deep River 14.01 14.42 4000 2500 4100 3600 3788 Main St (Rt 154) Elm/River St High St Deep River 14.42 14.57 4900 6400 4900 3700 4338

95
Road Name (Rt #) Beginning Road (Landmark)
Ending Road (Landmark) Town
Mile-post Start
Mile-post End
2001 2002 2003 2004 Ave.
Main St (Rt 156) Pennsylvania Av Columbus Av East Lyme 19.01 18.55 4900 6400 4900 3700 4338 Palisado Av (Rt 159) North Meadow Rd Old Kennedy Rd Windsor 4.31 4.93 6300 7500 6400 6400 6413 Palisado Av (Rt 159) Bissellls Ferry Rd (Pvt) (horizontal curve) Windsor 4.98 5.39 7500 6400 7600 7700 7088 Palisado Av (Rt 159) Clapp Rd N Hayden Station Rd Windsor Lcks 6.98 6.58 10300 9700 9000 9000 10025 Palisado Av (Rt 159) near Clapp Rd North Windsor 7.11 7.49 5500 4300 5600 5500 4800 North Main St (Rt 159) Fairview St Fernwood Dr Windsor Lcks 9.97 10.11 4200 3400 4300 4300 4325 East St S. (Rt 159) Paper St Alexander Lane Suffield 11.63 12.03 3300 3400 3400 3500 3238 East St S (Rt 159) Bridge St Thrail Av Suffield 13.00 13.37 3300 3400 3400 3300 3213 East St N. (Rt 159) Thompsonville Rd Burbank Av Suffield 14.43 14.60 8100 8100 8200 8500 8313 New Britain Av (Rt 160) Catherine Rd (horizontal curve) Rocky Hill 1.95 2.22 8100 15400 8200 7300 8163 Elm St (Rt 160) Griems Rd Main St (Rt 99) Rocky Hill 5.17 5.42 8100 15400 8200 7300 8163 Pennsylvania Av (Rt 161) Grand St Smith St East Lyme 0.06 0.31 5700 5800 6800 6125
New Haven Av (Rt 162) Mary Ellen Dr Sparrowbush Lane Millford 3.79 4.05 8600 8900 9400 9400 8913 Willard Av (Rt 173) Stanwell Rd (Pvt) Halleran Dr Newington 0.60 0.85 6900 2100 5400 5400 6550 Willard Av (Rt 173) New Britain Av Robbins Av Newington 1.38 1.74 9900 14800 9900 9900 9613 Willard Av (Rt 173) Pheasant Run Robbins Av Newington 1.38 1.74 9500 7300 10300 10300 9613 Willard Av (Rt 173) Robbins Av Wilson Av Newington 1.74 2.16 10600 12100 12300 12200 10975 New Britain Av (Rt 174) Eleanor Pl Roberts St Newington 1.84 1.60 11200 14800 12000 12000 11300 Wells Rd (Rt 175) Knight St Wells Farm Dr Wethersfield 5.33 5.03 11200 14800 12000 12000 11300 Wells Rd (Rt 175) Folly Brook Blvd Knight St Wethersfield 5.60 5.36 11200 14800 11200 11200 11100 Wells Rd (Rt 175) Jay St Folly Brook Blvd Wethersfield 5.79 5.60 12700 8800 13900 13900 12225 Main St (Rt 176) Northwood Rd Cheney Ln Newington 1.64 1.37 11300 10600 10500 10463 Main St (Rt 176) Elleworth St Kirkham St Newington 2.09 2.31 11300 10600 10500 10463 Hartford Av (Rt 176) Garvan St Thomas St Newington 3.43 3.20 11300 10600 10500 10463 S. Washington St (Rt 177) Duval La Madeley Ct Plainville 0.34 0.95 13000 14600 12700 12700 12925
S. Washington St (Rt 177) Madeley Ct Broad St Plainville 0.95 1.36 14500 12500 14700 14700 14950
Washington St (Rt 177) Broad St West Main St (Rt 372) Plainville 1.36 1.56 8400 5600 8900 8900 8888 Simsbury Rd (Rt 185) Tumblebrook La Mohegan Dr W Hartford 5.25 5.60 5100 7300 4900 4900 5013 Mapleton Av (Rt 190) (Horizontal curve) Wren Dr Suffield 0.45 0.28 5100 7300 4900 4900 5013

96
Road Name (Rt #) Beginning Road (Landmark)
Ending Road (Landmark) Town
Mile-post Start
Mile-post End
2001 2002 2003 2004 Ave.
Thompsonville Rd (Rt 190) Quail Run Rd 4th St. Suffield 0.92 1.24 7200 13300 7500 7500 7350
Hazard Av (Rt 190) Beverly St Martin Terr Enfield 5.56 5.74 8300 7400 7400 7600 Main St (Rt 190) Shaker Rd Hall Hill Rd (Rt 186) Somers 8.70 9.05 4500 4600 4600 5200 4613 Storrs Rd (Rt 195) Warrenville Rd (Rt 98) Bassett Bridge Rd Mansfield 3.74 3.28 4500 4600 5300 4475 Storrs Rd (Rt 195) East Road Agronomy Rd Mansfield 6.02 6.33 20600 23900 21000 23000 20588 Storrs Rd (Rt 195) Private Rd Rockridge Rd (E-1) Mansfield 10.44 11.30 13500 12700 13600 13000 13638 Hopeville Rd (Rt 201) Near Monroe St NA Jewett City 19.35 19.57 12700 12500 13600 13500 12750 East Main St (Rt 201) Palmer Av End of Sidewalk Jewett City 19.89 19.57 12500 13500 12600 12400 12950 New Litchfield St (Rt 202) Blake St Earl St Torrington 43.46 43.61 11300 15100 12600 12400 11488
East Main St (Rt 202) Willow St Main St Torrington 44.39 44.15 2900 2700 2500 2813 Great Neck Rd (Rt 213) Jordan Terr. Pfizer Dr Waterford 0.07 0.52 2900 2700 2500 2813 Great Neck Rd (Rt 213) Pfizer Dr Breman Rd Waterford 0.52 1.19 6900 10100 6400 6400 6813 Great Neck Rd (Rt 213) Braman Rd Colonial Dr Waterford 1.19 0.73 18200 17900 17000 17000 16763 Ocean Av (Rt 213) Near School St Sherman St New London 5.64 5.47 8100 4100 9300 9200 8525 Ocean Av (Rt 213) Faire Harbour Pl Sunset St New London 5.83 6.05 8100 4100 7600 7500 8100 N. Main St (Rt 218) Huron Dr Miler/Old Meadow Rd W Hartford 0.50 0.85 South Eagleville Rd (Rt 275) Mansfield 2.94 2.69 11600 14200 12500 12400 12250
South Eagleville Rd (Rt 275) Maple Rd (Apartment entrance) Mansfield 3.52 4.02 15800 8700 14400 14200 15000
Pinney St (Rt 286) Windermere Av Private Rd Ellington 0.89 1.49 15000 20300 11400 11400 13400 Main St (Rt 286) Tomoka St Maple St Ellington 2.60 2.97 E Robbins Av (Rt 287) Lydall Rd Kitts Lane #1 Newington 0.38 0.57 5300 6000 5900 5375 Prospect St (Rt 287) Thornbush Rd Collier Rd Wethersfield 1.58 1.76 6800 3700 6900 6800 6913 Prospect St (Rt 287) Olney Rd #1 Griswold Rd Wethersfield 2.53 2.76 3600 6800 3700 3700 3650 Prospect St (Rt 287) Millwoods Park Dr Harris Hill Rd Wethersfield 2.96 3.14 13900 11700 14800 14800 14125 Beaumont Hwy (Rt 289) Valley Hill Rd Rafferty Rd Lebanon 2.76 3.34 12100 13500 11800 11800 12050 Jordan Lane (Rt 314) Ridge Crest Circle Godwin Park Rd Wethersfield 0.96 1.41 12100 13500 11800 11800 12413 Townsend Av (Rt 337) Sound View Ter Hervey St New Haven 0.73 1.14 13400 12100 12100 12838 Townsend Av (Rt 337) Concord St Fort Hale Rd New Haven 1.50 1.22 4100 4100 3900 4100 3838 W. Center St (502) Moore St Cooper St Manchester 5.94 6.19 8900 11300 9500 9500 9488

97
Road Name (Rt #) Beginning Road (Landmark)
Ending Road (Landmark) Town
Mile-post Start
Mile-post End
2001 2002 2003 2004 Ave.
Lake St (Rt 533) Lydall St Berkeley Dr Vernon 1.19 1.62 9000 5300 4600 4600 7425 Tunnel Rd (Rt 533) Russell Dr Old Stone Rd Vernon 2.39 2.60 9000 5300 4600 4600 7425 Norwich Av (SR 616) Main St (Rt 85) Pleasant St Colchester 0.00 0.34 Main St (Rt 800) King St Scoville St Torrington 1.67 1.87 Main St (Rt 800) Linden St East Albert St Torrington 2.10 2.28 Thomaston Av (Rt 847) Plaza Driveway W. Main St Waterbury 4.25 3.96 6200 5200 7900 7900 6825 Thomaston Av (Rt 847) Shefield St Boyden St Waterbury 6.22 6.10 7300 8400 5900 5900 6788 Thomaston Av (Rt 847) Driggs St Shefield St Waterbury 6.32 6.22 9300 8600 8600 8913 Thomaston Av (Rt 847) Plaza driveway Huntingdon Av Waterbury 15300 7700 12200 12100 14075

98
Table A-6. Crash Data
Road Name (Rt #) Beginning Road (Landmark)
Ending Road (Landmark) Town
Mile-post Start
Mile-post End
Fatal Se-
vere injury
Mi-nor
injury PDO Total
Jackson St Ash St Summit St Windham 0 4 42 50 96 Boulevard Mountain Rd Ridgewood Rd W Hartford 0 1 9 16 26 Boulevard Ridgewood Rd Woodrow St W Hartford 0 0 9 13 22 Mountain Rd Hedwig Court Farmington Av W Hartford 0 0 1 16 17 Mountain Rd Flagg Rd Mountain Farm Rd W Hartford 0 0 0 2 2 Mountain Rd Richmond Ln Fairfield Rd W Hartford 0 0 4 4 8 Flagg Rd Coolidge Rd Blue Ridge Ln W Hartford 1 0 13 22 36 Asylum Av Lincoln Av Trout Brook Dr W Hartford 0 1 17 43 61 Farmington Av Trout Brook Dr Ardmore Rd W Hartford 0 0 7 14 21 Farmington Av N. Quaker Ln Whiting Ln W Hartford 0 0 23 24 47 Farmington Av Whiting Ln Highland St W Hartford 0 0 16 30 46 Prospect Av Cone St Farmington Av Hartford 0 0 1 6 7 Prospect Av Asylum Av Fern St Hartford 0 1 1 0 2 Prospect Av Asylum Av Albany Av Hartford 0 0 5 15 20 Prospect Av Farmington Av West Boulevard Hartford 0 0 5 10 15 Fern St Concord St Steele Rd W Hartford 0 1 11 29 41 Fern St N. Quaker Ln Trout Brook Dr W Hartford 0 Fern St Clifton Av Cobbs Rd W Hartford 0 1 6 26 33 Fern St Fernbel Lane Cobbs Rd W Hartford 0 0 15 29 44 Lake St Montauk Dr Phoenix St Vernon 0 6 10 106 122 Washington St Phoenix St Brookview St Vernon 0 3 7 50 60 Central Av Hickory St 13th St Norwich 0 15 35 68 118 Spring Hill Rd Storrs Rd Mansfield 0 19 44 134 197 Colony St Brooks St Church St Meriden 0 18 67 154 239 Oakwood Av Park Rd W Hartford 0 9 15 22 46 White St (Driveway b/f garage) Bates Pl Danbury 0 13 20 42 75 Deer Hill Rd Wilson St Wooster Rd Danbury 0 20 32 64 116 Main St Newberry St Pleasant Rd So Windsor 1 15 42 139 197 Broadway Broad St Chelsea Parade S Norwich 0 1 16 31 48

99
Road Name (Rt #) Beginning Road (Landmark)
Ending Road (Landmark) Town
Mile-post Start
Mile-post End
Fatal Se-
vere injury
Mi-nor
injury PDO Total
Fairfield Av Ansonia St Fairfield Rd Spur Hartford 0 9 6 38 53 Fairfield Av Freeman St Maple Av Hartford 0 5 14 26 45 Flatbush Av Oakwood Av S. Quaker Ln W Hartford 0 1 2 11 14 Grand St State St Field St Waterbury 0 0 2 13 15 Main St Montowese St Harrison Av Branford 0 0 4 26 30 Park Rd S. Quaker Ln Washington Cir W Hartford 0 6 0 0 6 Quaker Ln Farmington Av Boulevard W Hartford 0 6 4 13 23 South Quaker Ln Flatbush Av Wilfred St W Hartford 0 0 0 5 5 Asylum Av Griswold Dr N. Quaker Lane W Hartford 0 8 9 47 64 Ella T Grasso Blvd Glenn Rd Crescent St New Haven 0 5 21 2 28 Boston Post Rd (Rt 1) Mansfield Av Sedgwick Av Darien 11.66 11.74 0 2 13 3 18 Boston Post Rd (Rt 1) Sedgwick Ave Brookside Rd Darien 11.74 11.95 0 4 9 27 40 Boston Post Rd (Rt 1) Brookside Rd Old King Hwy N Darien 11.98 12.27 0 2 6 4 12 North Av (Rt 1) James St Oak St Bridgeport 29.26 29.57 0 1 2 3 6 North Av (Rt 1) Catherine St #2 Fairmount St Bridgeport 29.67 29.85 0 2 2 7 11 Bridgeport Av (Rt 1) Kerema Av Spring St Millford 35.53 35.71 1 12 8 21 42 Columbus Av (Rt 1) Davenport Av West St New Haven 46.69 47.06 0 0 3 8 11 North Main St (Rt 1) Cherry Hill Rd Liesi Lane Branford 54.32 54.55 0 2 2 11 15 North Main St (Rt 1) Cedar St Ivy St Branford 54.81 55.02 0 0 0 0 0 North Main St (Rt 1) Ivy St Pvt Dr Branford 55.02 55.27 1 1 1 2 5 Boston Post Rd (Rt 1) River St Fair St/Cherry St Guilford 62.83 62.98 0 0 0 4 4 Boston Post Rd (Rt 1) Village Walk Dunkin Donut Exit Guilford 63.59 63.97 0 3 8 43 54 Boston Post Rd (Rt 1) (horizontal curve) Old Post Rd Madison 66.46 66.83 0 3 4 22 29 Boston Post Rd (Rt 1) Britton lane Island Av Madison 67.49 67.72 0 7 13 59 79 Boston Post Rd (Rt 1) Wall St Scotland Av Madison 68.07 68.30 1 3 5 17 26 East Main St (Rt 1) Waterside Ln Morgan Park Clinton 72.06 72.16 0 2 4 12 18 Boston Post Rd (Rt 1) 309 Boston Post Rd Springbrook Rd Old Saybrook 81.28 81.58 0 3 3 13 19 Boston Post Rd (Rt 1) After Townwoods Rd B/4 Grassy Hill Rd Old Lyme 86.57 86.70 0 9 20 60 89 Bank St (Rt 1) Backwith St Braemer Pl (De) New London 98.32 98.50 0 8 27 86 121 Boston Post Rd (Rt 1) Guilford Med Bldg Exit Op East Creek Guilford 0 1 9 39 49 Newfield St (Rt 3) Rose Circle WB Congdon St E Middletown 0.76 1.12 0 3 11 26 40 Shunpike Rd (Rt 3) Court St Freihofers Bakery Dr Cromwell 4.78 5.05 0 7 17 78 102 Cromwell Av (Rt 3) Shunpike Business Ctr Inwood Rd Rocky Hill 5.63 5.80 0 13 13 41 67

100
Road Name (Rt #) Beginning Road (Landmark)
Ending Road (Landmark) Town
Mile-post Start
Mile-post End
Fatal Se-
vere injury
Mi-nor
injury PDO Total
Maple St (Rt 3) Harvest Lane Westerly Terr Rocky Hill 7.66 7.88 0 5 23 53 81 Maple St (Rt 3) Sandy Dr Hang Dog Lane Rocky Hill 7.92 8.19 0 3 3 10 16 Maple St (Rt 3) Gilbert Av Two Stone Dr Wethersfield 8.41 8.96 0 2 2 7 11 Maple St (Rt 3) Griswold Rd Butler St (One way) Wethersfield 9.01 9.29 1 8 5 31 45 Maple St (Rt 3) Kimball Rd Charter Rd Wethersfield 9.44 9.69 1 3 8 31 43 Newsfield St (Rt 3) Wilderman's Way Middletown 1 3 8 19 31 Sharon Tpke (Rt 4) Bartholomew Rd (horizontal curve) Goshen 14.00 14.44 0 10 15 57 82 Sharon Tpke (Rt 4) School Hill Rd West St Goshen 16.52 16.92 0 3 4 20 27 Migeon Av (Rt 4) Gardenhurst Av Torrington 22.34 22.51 0 9 20 45 74 North Elm St (Rt 4) Migeon Av Eagle St Torrington 22.89 23.23 0 7 3 16 26 Main St Rourke Pl Elm St Farmington 38.39 38.67 0 1 3 10 14 Farmington Av W. Avon Rd (Rt 167) Beyond Walnut St Farmington 39.10 39.47 0 7 15 30 52 State St (Rt 5) Edmund St London Dr Hamden 1.76 2.04 0 0 3 8 11 State St (Rt 5) Fernwood Dr Foote St Hamden 2.23 2.62 0 2 3 42 47 State St (Rt 5) Stevens St Daniel Rd Hamden 2.71 3.08 0 12 13 49 74 S. Colony St (Rt 5) Ward St Prince St Wallingford 11.09 11.31 0 1 3 9 13 N. Colony St (Rt 5) Church St Christian St Wallingford 11.55 11.82 0 1 1 1 3 N. Colony St (Rt 5) Wallace Row North St Wallingford 11.87 12.14 0 1 4 14 19 S. Broad St (Rt 5) Green Rd Layman Av Meriden 15.60 15.90 1 5 8 22 36 S. Broad St (Rt 5) Hall Av Gale Av Meriden 16.06 16.45 0 1 4 11 16 Broad St (Rt 5) Ann St Silver St Meriden 16.47 16.70 0 0 0 1 1 Broad St (Rt 5) Atkins St Sherman Av Meriden 17.98 18.18 0 5 2 6 13 N Broad St (Rt 5) Clark St Golden St Meriden 18.55 18.77 0 3 1 7 11 King St Depot Hill Rd AT&T Entrance Enfield 48.60 48.92 0 0 2 7 9 Enfield St (Rt 5) Orbit Dr Post Office Rd Enfield 50.38 50.76 0 0 2 4 6 Enfield St (Rt 5) Enfield Terr Fairview Av Enfield 51.32 51.91 0 6 3 10 19 Fitch St (Rt 10) Crescent St. Dyer St. New Haven 3.79 3.98 0 2 5 9 16 Arch St (Rt 10) Local Wamer St Alstrum St Hamden 4.77 4.94 1 0 1 4 6 S. Main St (Rt 10) Bradford Dr Cook Hill Rd Cheshire 14.31 14.72 0 5 12 30 47 S Main St (Rt 10) Bradford Dr Mt Sanford Rd Cheshire 14.31 14.02 0 0 0 0 0 S. Main St (Rt 10) Cook Hill Rd Brentwood Dr. Cheshire 14.72 15.53 0 2 6 11 19 South Main St (Rt 10) Werking St Buckland St Southington 22.65 23.00 0 8 8 37 53 Hopmeadow St (Rt 10) Plank Hill Rd Seminary Rd Simsbury 45.30 45.66 1 2 6 14 23

101
Road Name (Rt #) Beginning Road (Landmark)
Ending Road (Landmark) Town
Mile-post Start
Mile-post End
Fatal Se-
vere injury
Mi-nor
injury PDO Total
Laurel Hill Rd (Rt 12) Hillcrest Rd Ridgewood Dr Norwich 10.28 10.50 0 0 1 4 5 N. Main St (Rt 12) East Main St Russell St Jewett City 21.05 21.51 0 0 2 3 5 Middletown Av (Rt 17) Flint St Cross St New Haven 1.10 0.82 0 0 1 6 7 Main St (Rt 17) Old Maids Lane Great Pond Rd (Pvt) Glastonbury 30.89 31.30 0 1 1 5 7 Ellington Rd (Rt 30) Overpass (I-291) 1.64 km b/f Chapel Rd So Windsor 0.55 0.74 0 1 2 5 8 Ellington Rd (Rt 30) Chapel Rd (1.640km) Parkview Dr So Windsor 0.86 1.40 0 1 6 15 22 Ellington Rd (Rt 30) Northview Dr Lakewood Dr (Pvt) So Windsor 1.57 1.90 0 1 0 2 3 Hartford Turnpike (Rt 30) Mt. Vernon Dr South St Vernon 11.50 11.95 0 4 2 14 20
Hartford Turnpike (Rt 30) (Tolland Town Line) (Industrial Park) Vernon 12.55 12.71 0 4 17 46 67
Grove St (Rt 31) Fern St Hale St Ext. Vernon 0.36 0.65 0 0 7 6 13 Bread & Milk St (Rt 31) N. School Rd Zeya Dr Coventry 4.76 4.24 0 4 2 9 15 Main St (Rt 31) Wright Mill Rd Dunkin Donuts Coventry 7.05 7.23 0 2 2 4 8 Main St (Rt 31) Talcott Hill Rd Dexter Rd Coventry 8.38 8.14 0 0 5 8 13 Main St (Rt 31) Beverly Tr Sam Green Rd Coventry 8.87 8.62 0 2 1 8 11 Main St (Rt 31) Monument Hill Rd Mason St Coventry 11.25 11.53 0 6 12 21 39 Main St (Rt 31) Plains Rd South St Ext Coventry 13.05 13.30 0 4 9 54 67 West Thames (Rt 32) Dunham St Brown St Norwich 11.25 11.52 0 5 36 144 185 Washington St (Rt 2/32) Taylor Dr Chelsea Parade S Norwich 12.91 13.07 0 2 0 1 3 Windham Rd (Rt 32) Seldon St Old Plains Rd Windham 27.97 27.71 0 13 13 40 66 Pleasant St (Rt 32) John St Mountain St Windham 28.64 29.01 1 11 9 16 37 Stafford Rd (Rt 32) Jude Ln Coventry Rd Mansfield 33.18 33.86 0 2 6 9 17 River Rd (Rt 32) Pinney Hill Rd Willington 41.03 41.19 0 14 17 28 59
S. Main St (Rt 41) (Private Dr) Cornwall Bridge Rd (Rt 4) Sharon 4.13 4.33 0 5 16 41 62
N. Main St (Rt 41) Cornwall Bridge Rd (Rt 4) West Main St Sharon 4.36 4.56 0 10 25 90 125
Gay St (Rt 41) Calkinstown Rd Rhynus Rd Sharon 5.18 5.65 0 10 13 27 50 N. Brookvale Rd (Rt 42) Long Hill Rd King Rd Cheshire 12.86 13.15 0 7 6 18 31 Main Rd (Rt 44) Porter St Bostwick St Salisbury 3.14 3.31 0 3 7 17 27 Center St (Rt 44) Thomas Dr Adams St South Manchester 70.99 71.16 0 0 0 2 2

102
Road Name (Rt #) Beginning Road (Landmark)
Ending Road (Landmark) Town
Mile-post Start
Mile-post End
Fatal Se-
vere injury
Mi-nor
injury PDO Total
School St (Rt 44) May St Providence St (Rt 171) Putnam 100.12
100.38 0 1 6 16 23
South St (Rt 53) Coal Pit Hill Rd Starr Rd Danbury 21.89 21.63 0 3 7 28 38 Stratfield Rd (Rt 59) Cornell Rd Brooklawn Pkwy (SB) Fairfield 1.29 1.47 0 2 3 15 20 Stratfield Rd (Rt 59) Argonne St Gate Ridge Rd Fairfield 2.17 2.45 0 0 0 1 1 Easton Tpke (Rt 59) Wellner Dr Shady Brook Rd Fairfield 3.01 3.33 1 1 4 13 19 South St (Rt 63) West St Old South Rd Litchfield 34.86 34.41 0 3 4 1 8 North St (Rt 63) West St Norfolk Rd Litchfield 35.03 35.54 0 2 11 20 33 Main St (Rt 66) Wall St (Rt 316) Savings Institute Hebron 26.07 26.47 0 1 0 3 4 Main St (Rt 66) Winter St Tingley St Windham 35.41 35.57 0 2 0 11 13 Main St (Rt 66) High St North St Windham 35.74 35.99 1 4 3 9 17 Percival Av (Rt 71) Near Kenton St Carbo Lane Berlin 10.27 10.57 0 5 6 17 28 New Britain Rd (Rt 71) Langdon Ct Newton St Berlin 11.55 12.00 0 0 3 41 44 S Main St (Rt 71) Veterans Dr South St New Britain 12.38 12.56 0 4 2 15 21 Stanley St (Rt 71) Roxbury Rd / Stanley St Stratford Rd New Britain 15.12 15.31 0 8 4 34 46 Stanley St (Rt 71) Blake Rd Drury Lane New Britain 16.00 16.27 0 3 8 9 20 East Main St (Rt 72) Horizontal Curve Lincoln Av Bristol 6.47 6.88 0 3 6 18 27 School St (Rt 72) Main St (Rt 72) Church St / N Main St Bristol 9.58 9.70 0 1 0 3 4 Park St (Rt 72) Divinity St Tulip St Bristol 9.97 10.31 0 1 0 3 4 Park St (Rt 72) Tulip St Muzzy St Bristol 10.31 10.43 0 1 7 1 9 Park St (Rt 72) Dutton St Spruce St Bristol 10.55 10.80 0 0 1 0 1 Wapping Wood Rd (Rt 74) Grant Rd Near Eva Circle #1 Ellington 3.65 3.87 0 2 6 18 26
Wapping Wood Rd (Rt 74) Hillsdale Dr Windsorville Rd Ellington 4.00 4.23 0 3 0 9 12
Union St (Rt 74) Rheel St Orchard St Vernon 6.04 6.15 0 0 1 6 7 East Main St Ann St Snipsic St Vernon 7.11 7.47 0 2 3 11 16 Tolland Av (Rt 74) Kingsbury Av Vernon 7.77 8.05 0 4 5 17 26 Poquonook Av (Rt 75) Pigeon Hill Rd Tiffany Dr Windsor 0.85 1.07 0 2 0 9 11 Poquonook Av (Rt 75) near Hansom Hill Rd near Hansom Hill Rd Windsor 2.45 2.60 0 3 3 4 10 South Main St (Rt 75) Kent Av High St Suffield 9.46 9.87 0 5 5 4 14 North Main St (Rt 75) Day Av (horizontal curve) Suffield 10.29 10.64 0 8 9 53 70 North St (Rt 75) Mapleton Av (Rt 190) Suffield 11.02 11.58 0 5 14 37 56
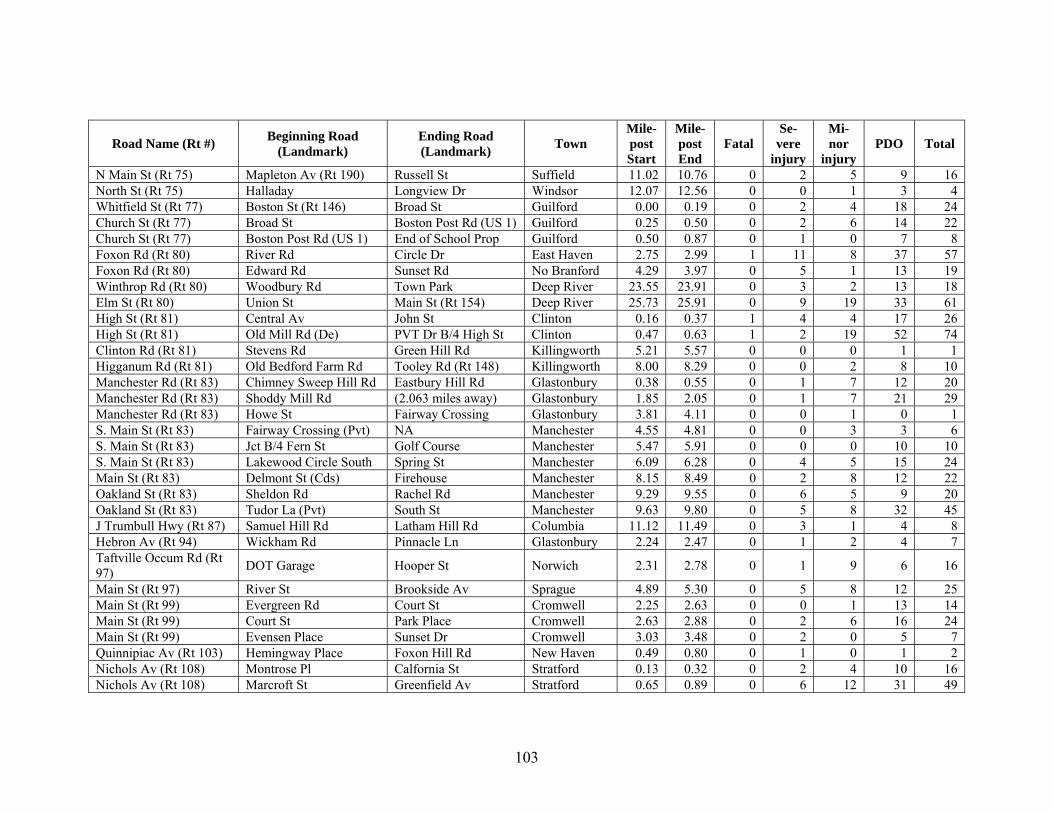
103
Road Name (Rt #) Beginning Road (Landmark)
Ending Road (Landmark) Town
Mile-post Start
Mile-post End
Fatal Se-
vere injury
Mi-nor
injury PDO Total
N Main St (Rt 75) Mapleton Av (Rt 190) Russell St Suffield 11.02 10.76 0 2 5 9 16 North St (Rt 75) Halladay Longview Dr Windsor 12.07 12.56 0 0 1 3 4 Whitfield St (Rt 77) Boston St (Rt 146) Broad St Guilford 0.00 0.19 0 2 4 18 24 Church St (Rt 77) Broad St Boston Post Rd (US 1) Guilford 0.25 0.50 0 2 6 14 22 Church St (Rt 77) Boston Post Rd (US 1) End of School Prop Guilford 0.50 0.87 0 1 0 7 8 Foxon Rd (Rt 80) River Rd Circle Dr East Haven 2.75 2.99 1 11 8 37 57 Foxon Rd (Rt 80) Edward Rd Sunset Rd No Branford 4.29 3.97 0 5 1 13 19 Winthrop Rd (Rt 80) Woodbury Rd Town Park Deep River 23.55 23.91 0 3 2 13 18 Elm St (Rt 80) Union St Main St (Rt 154) Deep River 25.73 25.91 0 9 19 33 61 High St (Rt 81) Central Av John St Clinton 0.16 0.37 1 4 4 17 26 High St (Rt 81) Old Mill Rd (De) PVT Dr B/4 High St Clinton 0.47 0.63 1 2 19 52 74 Clinton Rd (Rt 81) Stevens Rd Green Hill Rd Killingworth 5.21 5.57 0 0 0 1 1 Higganum Rd (Rt 81) Old Bedford Farm Rd Tooley Rd (Rt 148) Killingworth 8.00 8.29 0 0 2 8 10 Manchester Rd (Rt 83) Chimney Sweep Hill Rd Eastbury Hill Rd Glastonbury 0.38 0.55 0 1 7 12 20 Manchester Rd (Rt 83) Shoddy Mill Rd (2.063 miles away) Glastonbury 1.85 2.05 0 1 7 21 29 Manchester Rd (Rt 83) Howe St Fairway Crossing Glastonbury 3.81 4.11 0 0 1 0 1 S. Main St (Rt 83) Fairway Crossing (Pvt) NA Manchester 4.55 4.81 0 0 3 3 6 S. Main St (Rt 83) Jct B/4 Fern St Golf Course Manchester 5.47 5.91 0 0 0 10 10 S. Main St (Rt 83) Lakewood Circle South Spring St Manchester 6.09 6.28 0 4 5 15 24 Main St (Rt 83) Delmont St (Cds) Firehouse Manchester 8.15 8.49 0 2 8 12 22 Oakland St (Rt 83) Sheldon Rd Rachel Rd Manchester 9.29 9.55 0 6 5 9 20 Oakland St (Rt 83) Tudor La (Pvt) South St Manchester 9.63 9.80 0 5 8 32 45 J Trumbull Hwy (Rt 87) Samuel Hill Rd Latham Hill Rd Columbia 11.12 11.49 0 3 1 4 8 Hebron Av (Rt 94) Wickham Rd Pinnacle Ln Glastonbury 2.24 2.47 0 1 2 4 7 Taftville Occum Rd (Rt 97) DOT Garage Hooper St Norwich 2.31 2.78 0 1 9 6 16
Main St (Rt 97) River St Brookside Av Sprague 4.89 5.30 0 5 8 12 25 Main St (Rt 99) Evergreen Rd Court St Cromwell 2.25 2.63 0 0 1 13 14 Main St (Rt 99) Court St Park Place Cromwell 2.63 2.88 0 2 6 16 24 Main St (Rt 99) Evensen Place Sunset Dr Cromwell 3.03 3.48 0 2 0 5 7 Quinnipiac Av (Rt 103) Hemingway Place Foxon Hill Rd New Haven 0.49 0.80 0 1 0 1 2 Nichols Av (Rt 108) Montrose Pl Calfornia St Stratford 0.13 0.32 0 2 4 10 16 Nichols Av (Rt 108) Marcroft St Greenfield Av Stratford 0.65 0.89 0 6 12 31 49

104
Road Name (Rt #) Beginning Road (Landmark)
Ending Road (Landmark) Town
Mile-post Start
Mile-post End
Fatal Se-
vere injury
Mi-nor
injury PDO Total
Branch Rd (Rt 109) NA Old Branch Rd #2 Thomaston 20.19 20.52 1 9 17 39 66 Branch Rd (Rt 109) Old Branch Rd #2 Edgewood Av Thomaston 20.52 20.88 0 3 12 58 73 East Main St (Rt 110) Sunnyside Ter Wakelee Stratford 0.50 0.72 0 1 10 25 36 East Main St (Rt 110) Evergreen Dr/Diane Ter Marchant Dr Stratford 0.76 1.19 0 0 1 3 4 Interlaken Rd / Lime Rock Rd (Rt 112) Sharon Rd (Rt 41) Town Hill Rd (Pvt) Salisbury 2.05 2.45 0 0 0 1 1
Oak Bluff Av (Rt 113) Stratford Rd Roundabout Stratford 2.33 2.60 0 0 0 0 0 Prospect Dr (RT 113) Lordship Rd Ivy/Stratford Rd Stratford 2.72 3.10 0 2 1 21 24 Stratford Rd (Rt 113) Prospect Dr Short Beach Rd Stratford 3.10 3.67 0 0 2 19 21 Main St (Rt 113) Birdseye St South Av Stratford 5.11 5.33 0 2 11 54 67 Main St (Rt 115) Tremont St Bridge St Ansonia 1.62 1.71 0 3 4 9 16 Main St (Rt 115) Bridge St Maple St Ansonia 1.71 1.97 0 0 1 5 6 Slater Av (Rt 138) Lincoln Sq Ann St Jewett City 6.27 6.69 0 1 1 2 4
Elm St (Rt 140) Ash Dr Southwest Av /Woodland St Windsor Lcks 0.54 0.82 0 0 0 0 0
Elm St (Rt 140) Southwest Av South Elm St Windsor Lcks 0.82 1.21 0 2 6 1 9 Elm St (Rt 140) Briarcliff Dr (De) South Center St Windsor Lcks 1.48 1.96 0 4 1 6 11 Maple St (Rt 140) Church St School Entrance Ellington 12.84 13.35 0 2 5 32 39 South Main St (Rt 146) Eades St Montowese St Branford 0.84 1.07 0 6 15 22 43 Boston St (Rt 146) Wheaton Av Lovers Lane Guilford 11.84 12.08 0 2 4 7 13
Westchester Rd (Rt 149) Just after curve (12.10 km) Pickerel Lake Rd Colchester 6.38 6.07 0 3 3 8 14
Woodhouse Av (Rt 150) Wheatfield Dr Harrison Rd Wallingford 2.18 2.47 0 2 4 28 34 Woodhouse Av (Rt 150) Liandina Rd Harrison Av Wallingford 3.36 2.47 0 1 7 12 20 Center St (Rt 150) Pomeroy Av N Elm St Wallingford 4.44 4.65 0 7 8 20 35 Center St (Rt 150) South Orchard South Colony (Rt 5) Wallingford 4.99 5.16 0 9 15 18 42 N. Turnpike Rd (Rt 150) Stetson St Knollwood Dr Wallingford 6.45 6.69 0 0 0 0 0 Great Hammock Rd (Rt 154) Old Boston Post Rd Oyester Pl Old Saybrook 0.12 0.58 0 9 7 28 44
College St (Rt 154) Marina Point Dr Willard Av Old Saybrook 4.60 4.88 0 5 6 16 27 College St (Rt 154) Dana Dr N Cove Rd Old Saybrook 4.92 5.17 0 1 4 22 27 Main St (Rt 154) Union St Elm/River St Deep River 14.01 14.42 0 2 2 9 13 Main St (Rt 154) Elm/River St High St Deep River 14.42 14.57 0 2 2 10 14

105
Road Name (Rt #) Beginning Road (Landmark)
Ending Road (Landmark) Town
Mile-post Start
Mile-post End
Fatal Se-
vere injury
Mi-nor
injury PDO Total
Main St (Rt 156) Pennsylvania Av Columbus Av East Lyme 19.01 18.55 0 5 9 22 36 Palisado Av (Rt 159) North Meadow Rd Old Kennedy Rd Windsor 4.31 4.93 0 3 6 17 26 Palisado Av (Rt 159) Bissellls Ferry Rd (Pvt) (horizontal curve) Windsor 4.98 5.39 0 1 0 7 8 Palisado Av (Rt 159) Clapp Rd N Hayden Station Rd Windsor Lcks 6.98 6.58 0 5 5 2 12 Palisado Av (Rt 159) near Clapp Rd North Windsor 7.11 7.49 0 6 12 22 40 North Main St (Rt 159) Fairview St Fernwood Dr Windsor Lcks 9.97 10.11 0 5 7 27 39 East St S. (Rt 159) Paper St Alexander Lane Suffield 11.63 12.03 0 4 0 1 5 East St S (Rt 159) Bridge St Thrail Av Suffield 13.00 13.37 0 1 1 8 10 East St N. (Rt 159) Thompsonville Rd Burbank Av Suffield 14.43 14.60 0 2 4 15 21 New Britain Av (Rt 160) Catherine Rd (horizontal curve) Rocky Hill 1.95 2.22 0 10 10 48 68 Elm St (Rt 160) Griems Rd Main St (Rt 99) Rocky Hill 5.17 5.42 0 3 20 79 102 Pennsylvania Av (Rt 161) Grand St Smith St East Lyme 0.06 0.31 0 0 4 12 16
New Haven Av (Rt 162) Mary Ellen Dr Sparrowbush Lane Millford 3.79 4.05 1 4 5 16 26 Willard Av (Rt 173) Stanwell Rd (Pvt) Halleran Dr Newington 0.60 0.85 0 1 2 2 5 Willard Av (Rt 173) New Britain Av Robbins Av Newington 1.38 1.74 0 0 3 3 6 Willard Av (Rt 173) Pheasant Run Robbins Av Newington 1.38 1.74 0 2 2 3 7 Willard Av (Rt 173) Robbins Av Wilson Av Newington 1.74 2.16 0 3 22 116 141 New Britain Av (Rt 174) Eleanor Pl Roberts St Newington 1.84 1.60 0 2 1 11 14 Wells Rd (Rt 175) Knight St Wells Farm Dr Wethersfield 5.33 5.03 0 1 0 15 16 Wells Rd (Rt 175) Folly Brook Blvd Knight St Wethersfield 5.60 5.36 0 8 2 34 44 Wells Rd (Rt 175) Jay St Folly Brook Blvd Wethersfield 5.79 5.60 0 3 6 25 34 Main St (Rt 176) Northwood Rd Cheney Ln Newington 1.64 1.37 0 3 5 26 34 Main St (Rt 176) Elleworth St Kirkham St Newington 2.09 2.31 0 1 20 42 63 Hartford Av (Rt 176) Garvan St Thomas St Newington 3.43 3.20 0 1 1 2 4 S. Washington St (Rt 177) Duval La Madeley Ct Plainville 0.34 0.95 0 1 3 16 20
S. Washington St (Rt 177) Madeley Ct Broad St Plainville 0.95 1.36 0 2 4 12 18
Washington St (Rt 177) Broad St West Main St (Rt 372) Plainville 1.36 1.56 0 2 3 6 11 Simsbury Rd (Rt 185) Tumblebrook La Mohegan Dr W Hartford 5.25 5.60 0 2 5 7 14 Mapleton Av (Rt 190) (Horizontal curve) Wren Dr Suffield 0.45 0.28 0 3 8 29 40

106
Road Name (Rt #) Beginning Road (Landmark)
Ending Road (Landmark) Town
Mile-post Start
Mile-post End
Fatal Se-
vere injury
Mi-nor
injury PDO Total
Thompsonville Rd (Rt 190) Quail Run Rd 4th St. Suffield 0.92 1.24 0 5 8 15 28
Hazard Av (Rt 190) Beverly St Martin Terr Enfield 5.56 5.74 0 5 5 15 25 Main St (Rt 190) Shaker Rd Hall Hill Rd (Rt 186) Somers 8.70 9.05 0 1 1 6 8 Storrs Rd (Rt 195) Warrenville Rd (Rt 98) Bassett Bridge Rd Mansfield 3.74 3.28 0 5 5 17 27 Storrs Rd (Rt 195) East Road Agronomy Rd Mansfield 6.02 6.33 0 8 4 16 28 Storrs Rd (Rt 195) Private Rd Rockridge Rd (E-1) Mansfield 10.44 11.30 0 8 11 22 41 Hopeville Rd (Rt 201) Near Monroe St NA Jewett City 19.35 19.57 0 9 14 35 58 East Main St (Rt 201) Palmer Av End of Sidewalk Jewett City 19.89 19.57 0 4 1 7 12 New Litchfield St (Rt 202) Blake St Earl St Torrington 43.46 43.61 0 1 2 8 11
East Main St (Rt 202) Willow St Main St Torrington 44.39 44.15 0 5 2 28 35 Great Neck Rd (Rt 213) Jordan Terr. Pfizer Dr Waterford 0.07 0.52 0 2 0 15 17 Great Neck Rd (Rt 213) Pfizer Dr Breman Rd Waterford 0.52 1.19 0 3 6 29 38 Great Neck Rd (Rt 213) Braman Rd Colonial Dr Waterford 1.19 0.73 0 0 0 0 0 Ocean Av (Rt 213) Near School St Sherman St New London 5.64 5.47 3 14 25 68 110 Ocean Av (Rt 213) Faire Harbour Pl Sunset St New London 5.83 6.05 0 6 9 26 41 N. Main St (Rt 218) Huron Dr Miler/Old Meadow Rd W Hartford 0.50 0.85 0 3 4 4 11 South Eagleville Rd (Rt 275) Mansfield 2.94 2.69 0 0 0 0 0
South Eagleville Rd (Rt 275) Maple Rd (Apartment entrance) Mansfield 3.52 4.02 K
Severe
Minor PDO
Crash_T
Pinney St (Rt 286) Windermere Av Private Rd Ellington 0.89 1.49 0 4 42 50 96 Main St (Rt 286) Tomoka St Maple St Ellington 2.60 2.97 0 1 9 16 26 E Robbins Av (Rt 287) Lydall Rd Kitts Lane #1 Newington 0.38 0.57 0 0 9 13 22 Prospect St (Rt 287) Thornbush Rd Collier Rd Wethersfield 1.58 1.76 0 0 1 16 17 Prospect St (Rt 287) Olney Rd #1 Griswold Rd Wethersfield 2.53 2.76 0 0 0 2 2 Prospect St (Rt 287) Millwoods Park Dr Harris Hill Rd Wethersfield 2.96 3.14 0 0 4 4 8 Beaumont Hwy (Rt 289) Valley Hill Rd Rafferty Rd Lebanon 2.76 3.34 1 0 13 22 36 Jordan Lane (Rt 314) Ridge Crest Circle Godwin Park Rd Wethersfield 0.96 1.41 0 1 17 43 61 Townsend Av (Rt 337) Sound View Ter Hervey St New Haven 0.73 1.14 0 0 7 14 21 Townsend Av (Rt 337) Concord St Fort Hale Rd New Haven 1.50 1.22 0 0 23 24 47 W. Center St (502) Moore St Cooper St Manchester 5.94 6.19 0 0 16 30 46

107
Road Name (Rt #) Beginning Road (Landmark)
Ending Road (Landmark) Town
Mile-post Start
Mile-post End
Fatal Se-
vere injury
Mi-nor
injury PDO Total
Lake St (Rt 533) Lydall St Berkeley Dr Vernon 1.19 1.62 0 0 1 6 7 Tunnel Rd (Rt 533) Russell Dr Old Stone Rd Vernon 2.39 2.60 0 1 1 0 2 Norwich Av (SR 616) Main St (Rt 85) Pleasant St Colchester 0.00 0.34 0 0 5 15 20 Main St (Rt 800) King St Scoville St Torrington 1.67 1.87 0 0 5 10 15 Main St (Rt 800) Linden St East Albert St Torrington 2.10 2.28 0 1 11 29 41 Thomaston Av (Rt 847) Plaza Driveway W. Main St Waterbury 4.25 3.96 0 Thomaston Av (Rt 847) Shefield St Boyden St Waterbury 6.22 6.10 0 1 6 26 33 Thomaston Av (Rt 847) Driggs St Shefield St Waterbury 6.32 6.22 0 0 15 29 44 Thomaston Av (Rt 847) Plaza driveway Huntingdon Av Waterbury 0 6 10 106 122