design of a microfluidic device for the magnetic
TRANSCRIPT
Bioengineering.
Bioengineering
Individual Investigative Project
Design of a Microfluidic Device for the
Magnetic Extraction of DNA
Saylee Jangam
May 2018
Dr Cécile M Perrault
Dissertation submitted to the University of Sheffield in partial
fulfilment of the requirements for the degree of
Bachelor of Engineering

Abstract
DNA extraction is an important first step in the detection of pathogenic DNA for the
diagnosis of infectious diseases such HIV, Ebola, Chikungunya and Dengue Virus. While
traditional DNA extraction methods require several centrifugation steps and are time-
consuming, extraction carried out using magnetic nanoparticles offers a faster and more
specific approach without the need for extensive laboratory equipment. The aim of this
study was to test the feasibility of scaling down a magnetic nanoparticle-based DNA
extraction method from the bench-top onto a lab-on-a-chip using MagSi-DNA beads
(MagnaMedics Diagnostics BV). A novel six-chambered microfluidic device was
designed that utilised 40X less reagent than on the bench-top, achieving extraction
efficiencies of 9.7% for spiked solutions and 0.54% for the MG-63 cell model. DNA in
an MG-63 cell was quantified using an approximation method (6.513 pg) and PicoGreen
assay (7.350 pg) to calculate extraction efficiency (percentage throughput) from
spectrophotometry results. Additionally, a limit of detection of 100 ng/µL was achieved
using the MagSi-DNA beads on the bench-top.
Contents
Nomenclature 1
1. INTRODUCTION 3
1.1 DNA Extraction in Diagnostic Platforms 3
1.2 Aims and Objectives 4
2. LITERATURE REVIEW 5
2.1 Extraction Methods 5
2.2 Detection Methods 10
2.3 Microfluidic Design 12
2.4 Current Dengue Virus Diagnostics 16
3. MATERIALS AND METHODS 17
3.1 Cell Culture and Suspension 17
3.2 Bench-top DNA Extraction Method 17
3.3 Spectrophotometric Analysis on the Nanodrop-1000 18
3.4 Microfluidic Chip Fabrication 19
3.5 PDMS Blister Fabrication 21
3.6 DNA Quantification per MG-63 Cell 22
3.6.1 Approximation of DNA per MG-63 Cell 22
3.6.2 PicoGreen Assay 23
3.7 On-chip DNA Extraction 24
4. RESULTS 27
4.1 Bench-top Method 27
4.2 On-chip Method 31
4.3 Microfluidic Chip Design 32
4.4 PicoGreen DNA Quantification 35
4.5 Summary of Results 37
5. DISCUSSION 38
5.1 Optimisation of Bench-top Method 38
5.2 Feasibility of Replication on a Microfluidic Chip 42
5.3 DNA Quantification 44
5.4 Summary of Key Findings 45
5.5 Limitations and Future Development 46
6. CONCLUSION 47
7. REFERENCES 48

Appendix 1 55
1
Nomenclature
POC Point-of-care
LOC Lab-on-a-chip
DNA Deoxyribonucleic Acid
RNA Ribonucleic Acid
dsDNA Double stranded DNA
PDMS Polydimethylsiloxane
DENV Dengue Virus
MNP Magnetic Nanoparticle
PBS Phosphate Buffer Solution
FCS Fetal Calf Serum
MG-63 Osteosarcoma cell line
PCR Polymerase Chain Reaction
BSA Bovine Serum Albumin
PEG Polyethylene glycol
SD Standard Deviation (σ)
SE Standard Error
A260 Absorbance at 260 nm
A230 Absorbance at 230 nm
A280 Absorbance at 280 nm
A260/280 Ratio of absorbance at 260 and 280 nm

2
A260/230 Ratio of absorbance at 260 and 230 nm
3
1. INTRODUCTION
1.1 DNA Extraction in Diagnostic Platforms
The detection of pathogenic DNA (Deoxyribonucleic Acid) offers a specific and accurate
way to diagnose infectious diseases such as HIV (Human Immunodeficiency Virus),
Ebola, Chikungunya and Dengue Virus [1]. The first step in DNA detection is its
extraction from bacterial or viral infection in human blood. As a result, DNA extraction
forms an integral part of many diagnostic platforms that aim to directly detect pathogenic
DNA, offering a highly specific and accurate diagnosis for a wide range of diseases.
As a first point of application, this study will focus on the Dengue Virus (DENV) which
is endemic in subtropical regions of the world like Vietnam. DENV is spread through a
vector – the Aedes aegypti mosquito – which thrives in heavy rain and high temperature
conditions. The main challenge with DENV is that 80% of all patients are asymptomatic
or show common flu-like symptoms and are therefore, under the risk of an incorrect
diagnosis [2]. Patients are often mistreated with antibiotics, increasing the risk of disease
progression and antibiotic resistance [3]. It is crucial to be able to detect DENV in its
early stage of infection where it can still be prevented from developing into its more
severe form, the Dengue Haemorrhagic Fever (DHF). Detection methods in clinical use
for DENV require laboratory intervention which is time consuming and expensive [4].
There is therefore a need for a rapid, low-cost and accurate way of diagnosing DENV at
its early stage and at the point-of-care.
Microfluidics is a technology that is utilised in point-of-care diagnostic solutions for the
controlled delivery and manipulation of fluids at the micro-scale (µ-scale). It allows
standard bench-top methods to be scaled down and replicated on lab-on-a-chip (LOC)
devices, significantly reducing assay times, reagent volumes, and overall costs. This
makes microfluidic technology an attractive platform to use in developing countries
where laboratory resources are scarce. Subsequently, magnetic nanoparticles (MNPs)
have recently gained popularity through commercially available DNA extraction kits [5]
[6] [7]. Microfluidic devices focusing on the extraction of DNA using MNPs have
previously been studied [8], however, no clinically accepted diagnostic tool for this exists
yet. While Hansen et. al have used MagSi-DNA MNPs (MagnaMedics Diagnostics BV,
The Netherlands) for DNA extraction from bacterial cells in whole blood, these particles
4
have not been tested on a microfluidic platform for on-chip extraction of DNA as a point-
of-care solution.
1.2 Aims & Objectives
This study aims to create a prototype of a microfluidic device for the extraction of DNA
using MagSi-DNA mf magnetic nanoparticles. The purpose of this prototype will be to
establish a working DNA extraction method on-a-chip for further development into a
point-of-care diagnostic platform for the Dengue Virus.
The objectives of this study are to:
• Optimize a bench-top DNA extraction method using magnetic nanoparticles
• Design and fabricate novel microfluidic chips for DNA extraction
• Test the feasibility of scaling down the bench-top DNA extraction method onto a
microfluidic chip
• Assess the limit of detection
5
2. LITERATURE REVIEW
2.1 Extraction Methods
DNA extraction is an important process for many downstream applications such as
genome sequencing, polymerase chain reaction (PCR) and the detection of pathogens.
Broadly, the process of DNA extraction consists of four main stages, which include cell
membrane lysis, DNA isolation, purification and amplification. DNA was first isolated
by Miescher in 1869, where acid was used to precipitate DNA from a solution of lysed
leukocyte cells [9]. Since then, many alternative methods of DNA isolation have been
developed to facilitate laboratory experiments.
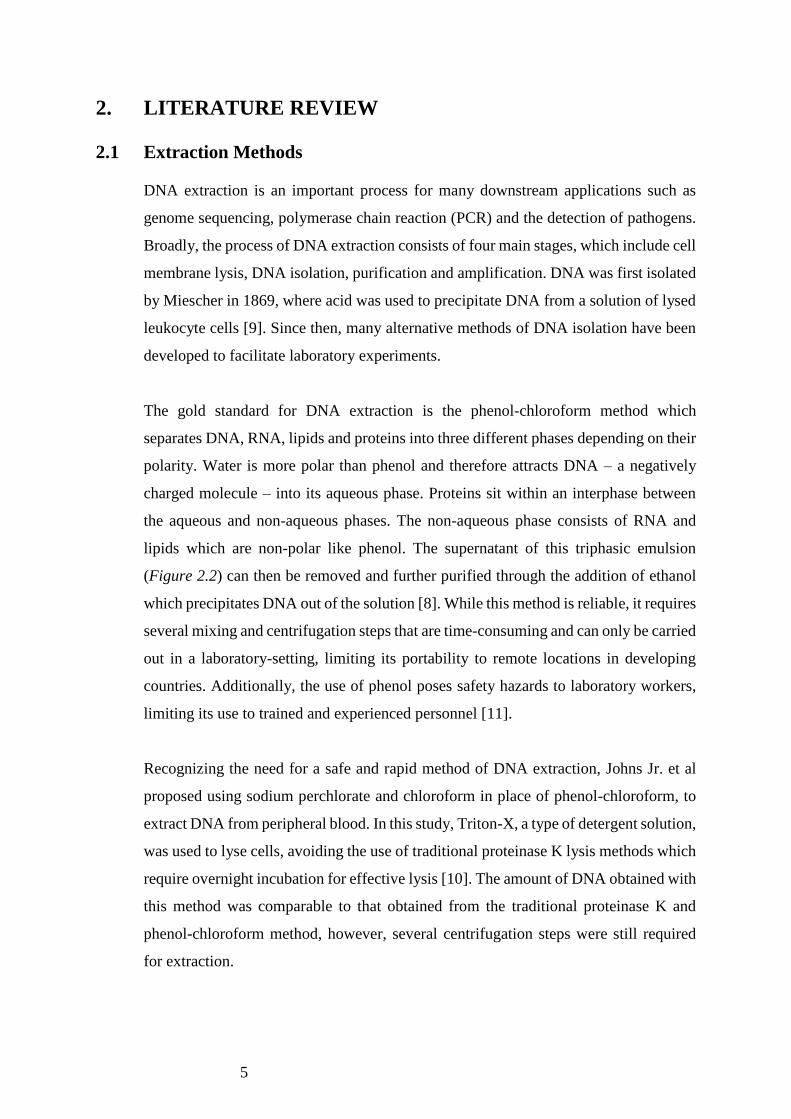
The gold standard for DNA extraction is the phenol-chloroform method which
separates DNA, RNA, lipids and proteins into three different phases depending on their
polarity. Water is more polar than phenol and therefore attracts DNA – a negatively
charged molecule – into its aqueous phase. Proteins sit within an interphase between
the aqueous and non-aqueous phases. The non-aqueous phase consists of RNA and
lipids which are non-polar like phenol. The supernatant of this triphasic emulsion
(Figure 2.2) can then be removed and further purified through the addition of ethanol
which precipitates DNA out of the solution [8]. While this method is reliable, it requires
several mixing and centrifugation steps that are time-consuming and can only be carried
out in a laboratory-setting, limiting its portability to remote locations in developing
countries. Additionally, the use of phenol poses safety hazards to laboratory workers,
limiting its use to trained and experienced personnel [11].
Recognizing the need for a safe and rapid method of DNA extraction, Johns Jr. et al
proposed using sodium perchlorate and chloroform in place of phenol-chloroform, to
extract DNA from peripheral blood. In this study, Triton-X, a type of detergent solution,
was used to lyse cells, avoiding the use of traditional proteinase K lysis methods which
require overnight incubation for effective lysis [10]. The amount of DNA obtained with
this method was comparable to that obtained from the traditional proteinase K and
phenol-chloroform method, however, several centrifugation steps were still required
for extraction.
6
Figure 2.1.1 Tri-phasic emulsion in phenol-chloroform DNA
extraction from mouse tail (L) and mouse liver (R) tissues [11].
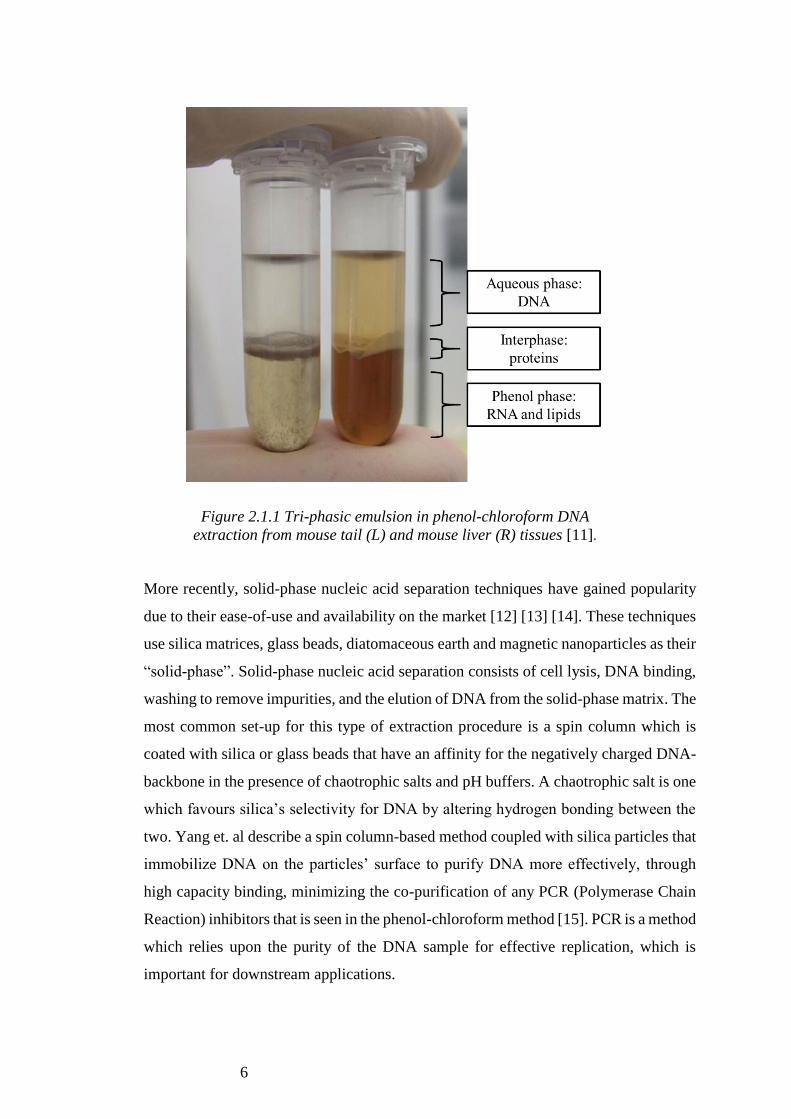
More recently, solid-phase nucleic acid separation techniques have gained popularity
due to their ease-of-use and availability on the market [12] [13] [14]. These techniques
use silica matrices, glass beads, diatomaceous earth and magnetic nanoparticles as their
“solid-phase”. Solid-phase nucleic acid separation consists of cell lysis, DNA binding,
washing to remove impurities, and the elution of DNA from the solid-phase matrix. The
most common set-up for this type of extraction procedure is a spin column which is
coated with silica or glass beads that have an affinity for the negatively charged DNA-
backbone in the presence of chaotrophic salts and pH buffers. A chaotrophic salt is one
which favours silica’s selectivity for DNA by altering hydrogen bonding between the
two. Yang et. al describe a spin column-based method coupled with silica particles that
immobilize DNA on the particles’ surface to purify DNA more effectively, through
high capacity binding, minimizing the co-purification of any PCR (Polymerase Chain
Reaction) inhibitors that is seen in the phenol-chloroform method [15]. PCR is a method
which relies upon the purity of the DNA sample for effective replication, which is
important for downstream applications.
7
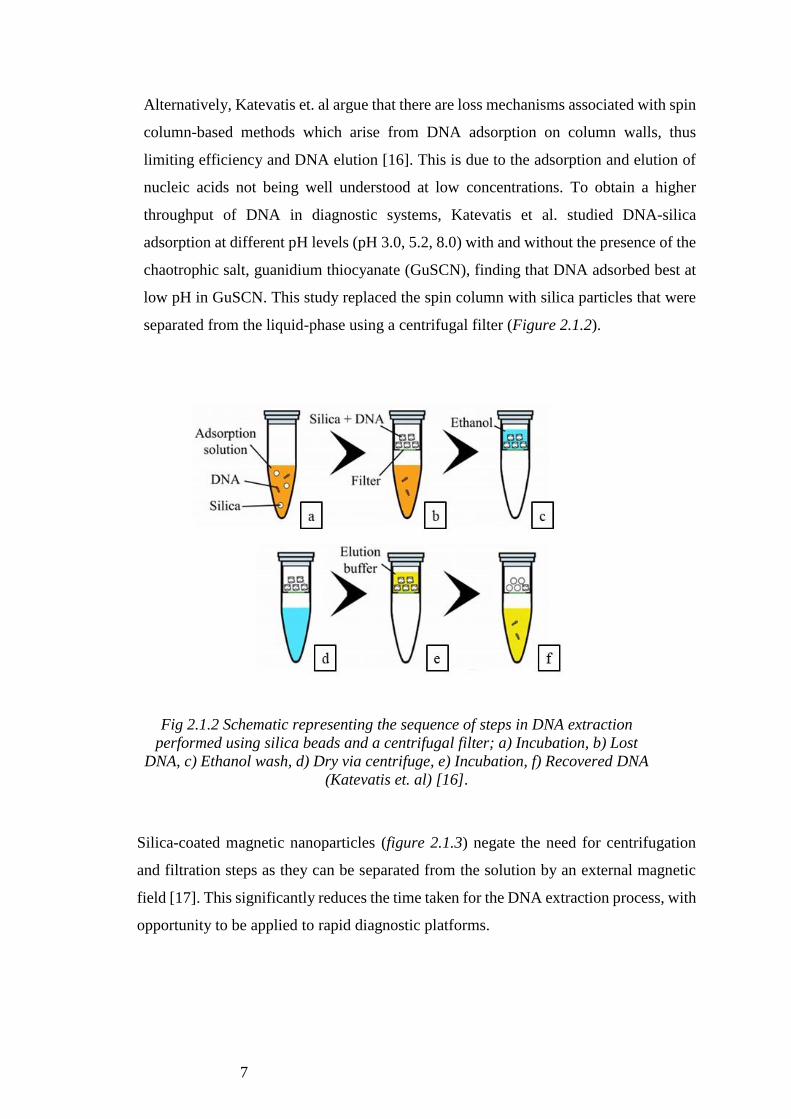
Alternatively, Katevatis et. al argue that there are loss mechanisms associated with spin
column-based methods which arise from DNA adsorption on column walls, thus
limiting efficiency and DNA elution [16]. This is due to the adsorption and elution of
nucleic acids not being well understood at low concentrations. To obtain a higher
throughput of DNA in diagnostic systems, Katevatis et al. studied DNA-silica
adsorption at different pH levels (pH 3.0, 5.2, 8.0) with and without the presence of the
chaotrophic salt, guanidium thiocyanate (GuSCN), finding that DNA adsorbed best at
low pH in GuSCN. This study replaced the spin column with silica particles that were
separated from the liquid-phase using a centrifugal filter (Figure 2.1.2).
Fig 2.1.2 Schematic representing the sequence of steps in DNA extraction
performed using silica beads and a centrifugal filter; a) Incubation, b) Lost
DNA, c) Ethanol wash, d) Dry via centrifuge, e) Incubation, f) Recovered DNA
(Katevatis et. al) [16].
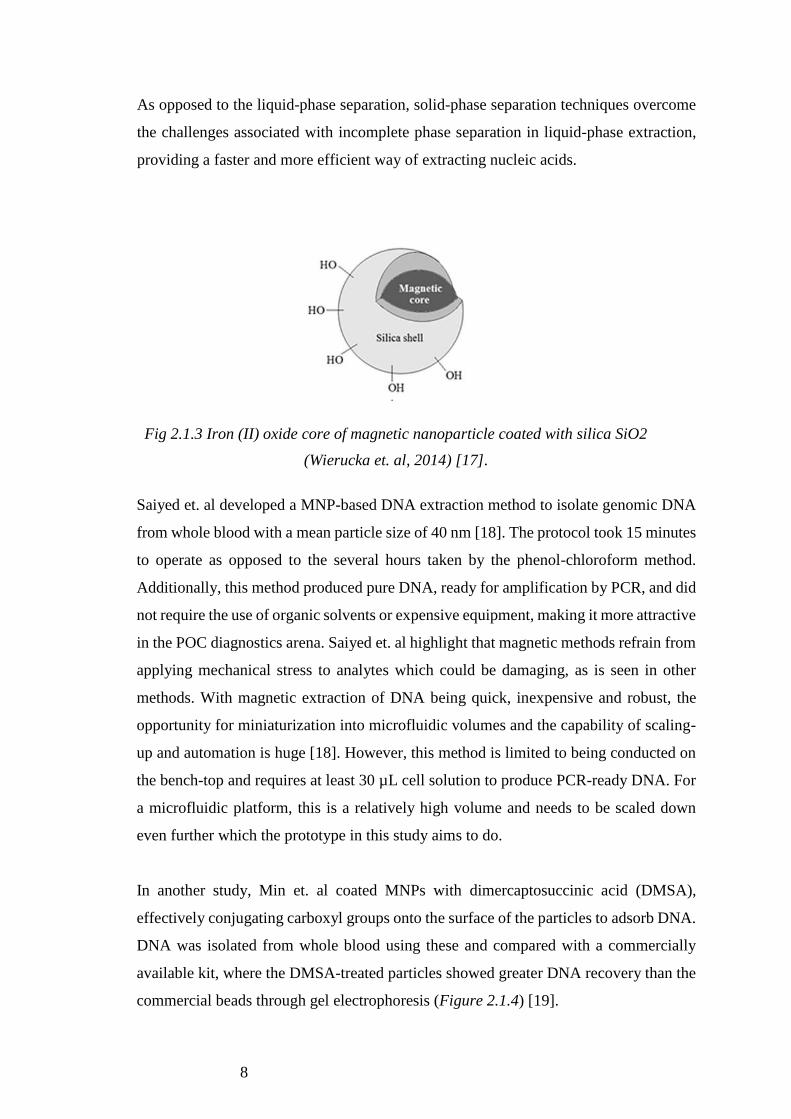
Silica-coated magnetic nanoparticles (figure 2.1.3) negate the need for centrifugation
and filtration steps as they can be separated from the solution by an external magnetic
field [17]. This significantly reduces the time taken for the DNA extraction process, with
opportunity to be applied to rapid diagnostic platforms.
8
As opposed to the liquid-phase separation, solid-phase separation techniques overcome
the challenges associated with incomplete phase separation in liquid-phase extraction,
providing a faster and more efficient way of extracting nucleic acids.
Fig 2.1.3 Iron (II) oxide core of magnetic nanoparticle coated with silica SiO2
(Wierucka et. al, 2014) [17].
Saiyed et. al developed a MNP-based DNA extraction method to isolate genomic DNA
from whole blood with a mean particle size of 40 nm [18]. The protocol took 15 minutes
to operate as opposed to the several hours taken by the phenol-chloroform method.
Additionally, this method produced pure DNA, ready for amplification by PCR, and did
not require the use of organic solvents or expensive equipment, making it more attractive
in the POC diagnostics arena. Saiyed et. al highlight that magnetic methods refrain from
applying mechanical stress to analytes which could be damaging, as is seen in other
methods. With magnetic extraction of DNA being quick, inexpensive and robust, the
opportunity for miniaturization into microfluidic volumes and the capability of scaling-
up and automation is huge [18]. However, this method is limited to being conducted on
the bench-top and requires at least 30 µL cell solution to produce PCR-ready DNA. For
a microfluidic platform, this is a relatively high volume and needs to be scaled down
even further which the prototype in this study aims to do.
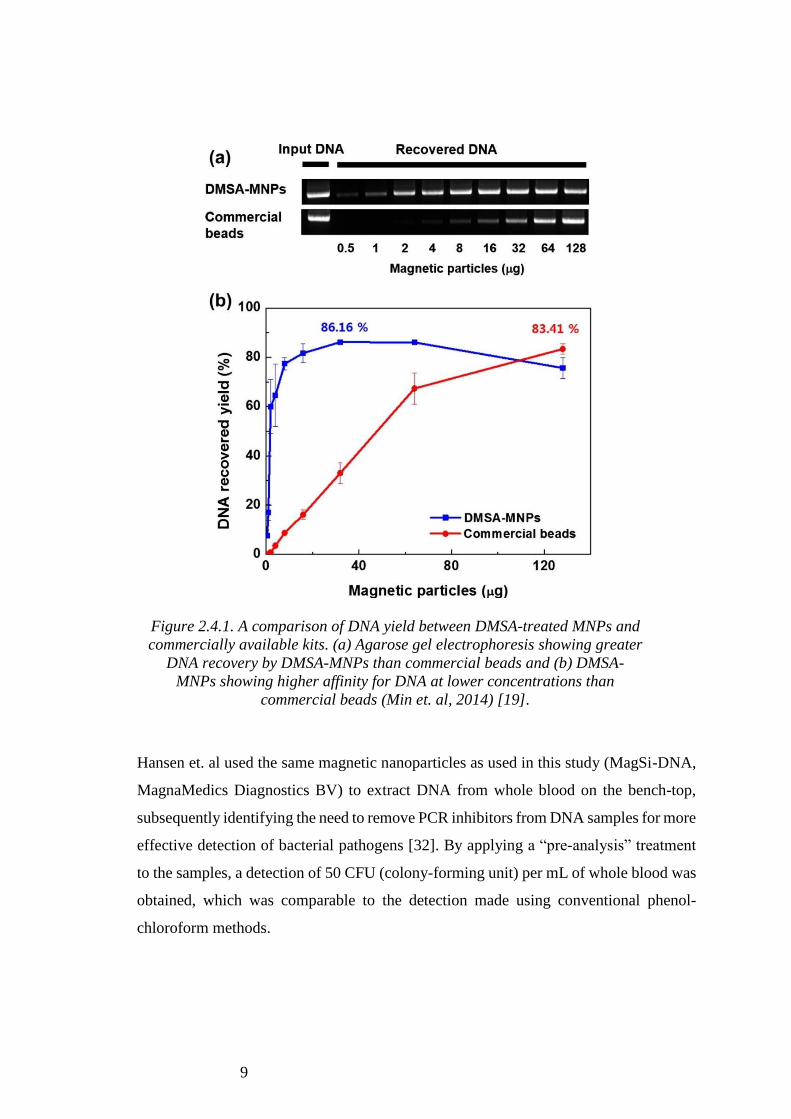
In another study, Min et. al coated MNPs with dimercaptosuccinic acid (DMSA),
effectively conjugating carboxyl groups onto the surface of the particles to adsorb DNA.
DNA was isolated from whole blood using these and compared with a commercially
available kit, where the DMSA-treated particles showed greater DNA recovery than the
commercial beads through gel electrophoresis (Figure 2.1.4) [19].
9
Hansen et. al used the same magnetic nanoparticles as used in this study (MagSi-DNA,
MagnaMedics Diagnostics BV) to extract DNA from whole blood on the bench-top,
subsequently identifying the need to remove PCR inhibitors from DNA samples for more
effective detection of bacterial pathogens [32]. By applying a “pre-analysis” treatment
to the samples, a detection of 50 CFU (colony-forming unit) per mL of whole blood was
obtained, which was comparable to the detection made using conventional phenol-
chloroform methods.
Figure 2.4.1. A comparison of DNA yield between DMSA-treated MNPs and
commercially available kits. (a) Agarose gel electrophoresis showing greater
DNA recovery by DMSA-MNPs than commercial beads and (b) DMSA-
MNPs showing higher affinity for DNA at lower concentrations than
commercial beads (Min et. al, 2014) [19].
10
2.2 Detection Methods
A variety of detection methods can be used in DNA extraction, right from UV
spectrophotometry and gel electrophoresis, to mass spectrometry and fluorescent
tagging of nucleic acids. In studies conducted by Saiyed et. al and Min et. al, agarose
gel electrophoresis and UV spectrophotometry methods were used complimentarily to
confirm the presence of DNA and the purity of the yield [18] [19]. Gel electrophoresis
is visual technique that separates DNA fragments based on size and charge. An electric
current is passed through the gel which separates the negatively charged DNA-
fragments into separate bands across the length of the gel. DNA can be collected from
the gel and further purified for more specific downstream analysis. Additionally, the
lack of smears in the gel is used to confirm the absence of any RNA or protein
contamination in the sample [19].
On the other hand, UV spectrophotometry provides a quantitative method to detect
DNA, albeit non-specific. Using the Beer-Lambert Law, a spectrophotometer can relate
a sample’s optical density to its concentration. Nucleic acids absorb intensely at specific
wavelengths, with DNA and RNA both absorbing highest at 260 nm. By manipulating
the Beer-Lambert Law (Equation 2.1), the concentration of a DNA sample can be
calculated if the absorbance value (A) at 260 nm (A260), the pathlength of the
spectrophotometer (b), and the extinction coefficient (E) are known. For dsDNA
(double stranded DNA) at 260 nm, the extinction coefficient is 50 ng/µL at a pathlength
of 1 cm [20].
2.2 c = A
E×b
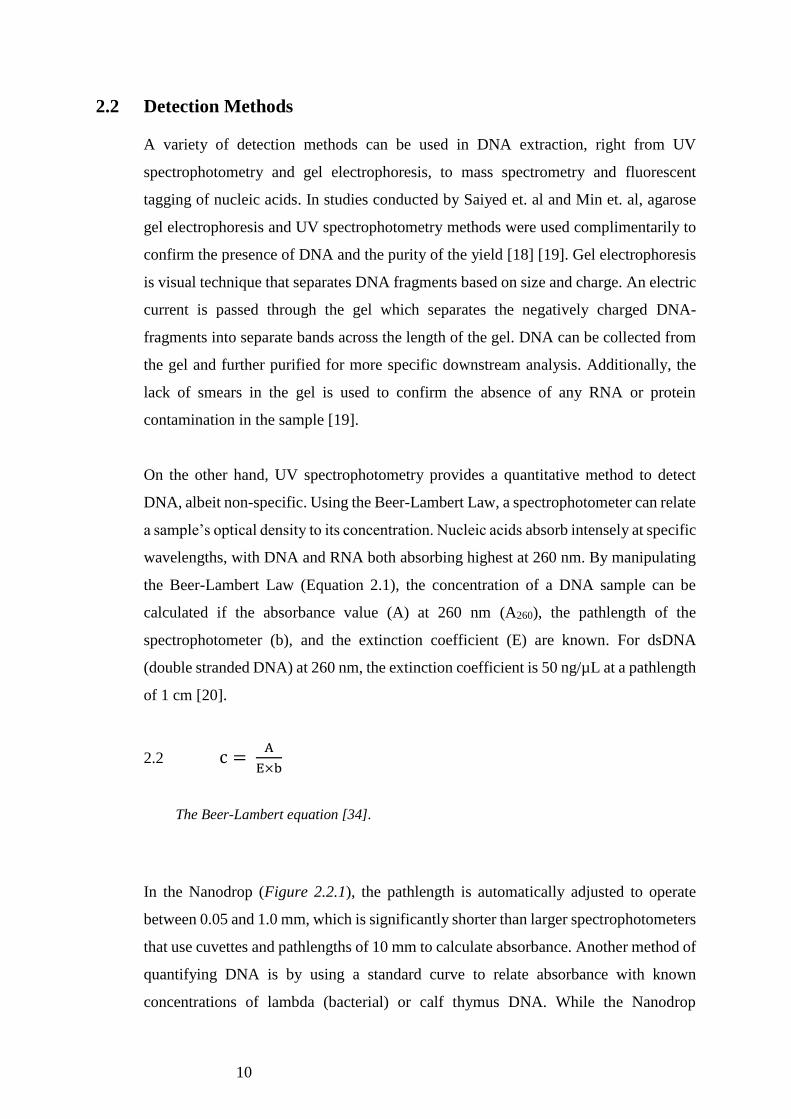
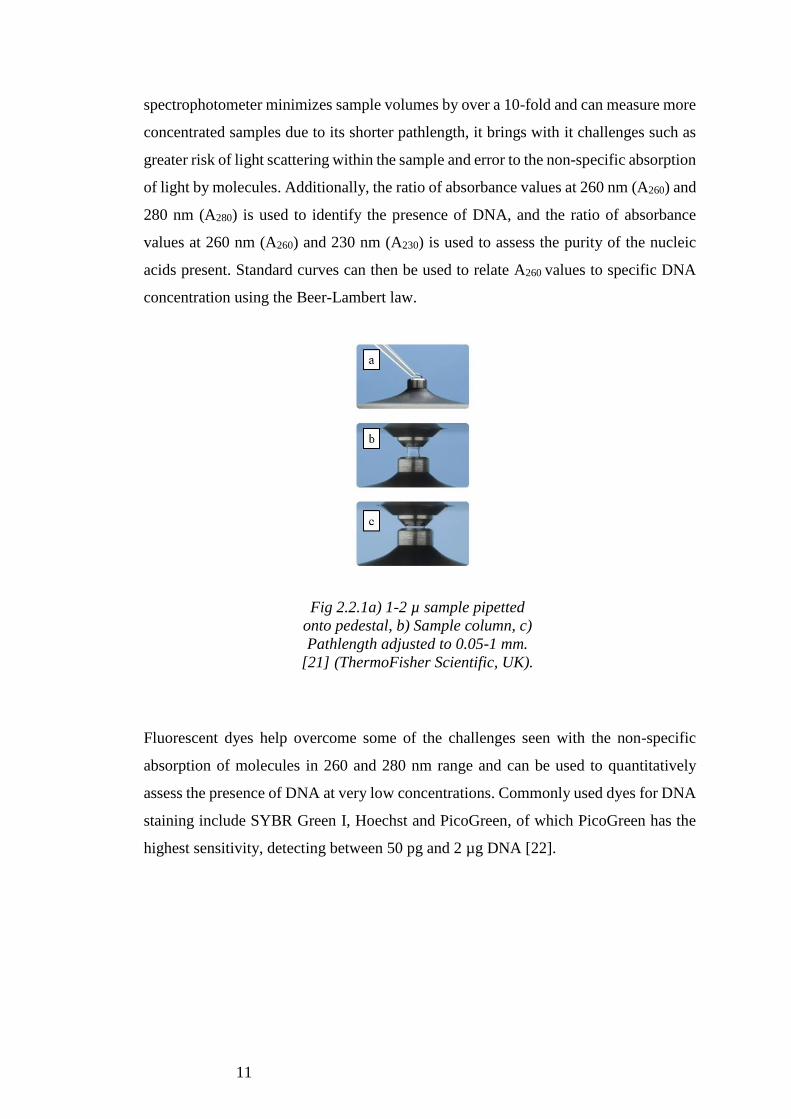
In the Nanodrop (Figure 2.2.1), the pathlength is automatically adjusted to operate
between 0.05 and 1.0 mm, which is significantly shorter than larger spectrophotometers
that use cuvettes and pathlengths of 10 mm to calculate absorbance. Another method of
quantifying DNA is by using a standard curve to relate absorbance with known
concentrations of lambda (bacterial) or calf thymus DNA. While the Nanodrop
The Beer-Lambert equation [34].
11
spectrophotometer minimizes sample volumes by over a 10-fold and can measure more
concentrated samples due to its shorter pathlength, it brings with it challenges such as
greater risk of light scattering within the sample and error to the non-specific absorption
of light by molecules. Additionally, the ratio of absorbance values at 260 nm (A260) and
280 nm (A280) is used to identify the presence of DNA, and the ratio of absorbance
values at 260 nm (A260) and 230 nm (A230) is used to assess the purity of the nucleic
acids present. Standard curves can then be used to relate A260 values to specific DNA
concentration using the Beer-Lambert law.
Fluorescent dyes help overcome some of the challenges seen with the non-specific
absorption of molecules in 260 and 280 nm range and can be used to quantitatively
assess the presence of DNA at very low concentrations. Commonly used dyes for DNA
staining include SYBR Green I, Hoechst and PicoGreen, of which PicoGreen has the
highest sensitivity, detecting between 50 pg and 2 µg DNA [22].
Fig 2.2.1a) 1-2 µ sample pipetted
onto pedestal, b) Sample column, c)
Pathlength adjusted to 0.05-1 mm.
[21] (ThermoFisher Scientific, UK).
12
2.3 Microfluidic Design
Lab-on-a-chip (LOC) devices use microfluidics to scale-down reagent volumes,
increase assay times and reduce costs. LOCs aim to mimic standard bench-top methods
on microfabricated chips for precise and controlled liquid delivery. Many biosensors
now use this technology to provide point-of-care diagnostic solutions in the clinic. This
is particularly useful in the developing world where expensive laboratory settings are
difficult to source.
Chand et. al report a microfluidic chip that electrochemically detects noroviruses using
pulse voltammetric analysis which delivers a potential difference to the analytes and
records the current generated. In this study, specific detection was obtained by
functionalizing the gold nanoparticles with capsid-specific aptamers [23]. The time
taken for detection of norovirus in spiked blood was less than 35 minutes and the limit
of detection was 100 pM. Using CMOS (Complementary Metal-Cxide Semiconductor)
technology, Toumazou et. al developed a label-free, non-optical and real-time method
for detecting and quantifying target sequences of DNA by monitoring pH changes
caused by the release of hydrogen ions during nucleotide base-pairing [24]. On the same
chip, amplification of target sequences was achieved through incorporation of ISFET
(Ion Sensitive Field Effect Transistor) arrays, embedded heaters and temperature
sensors, thereby eliminating the need for external thermocycling equipment [24].
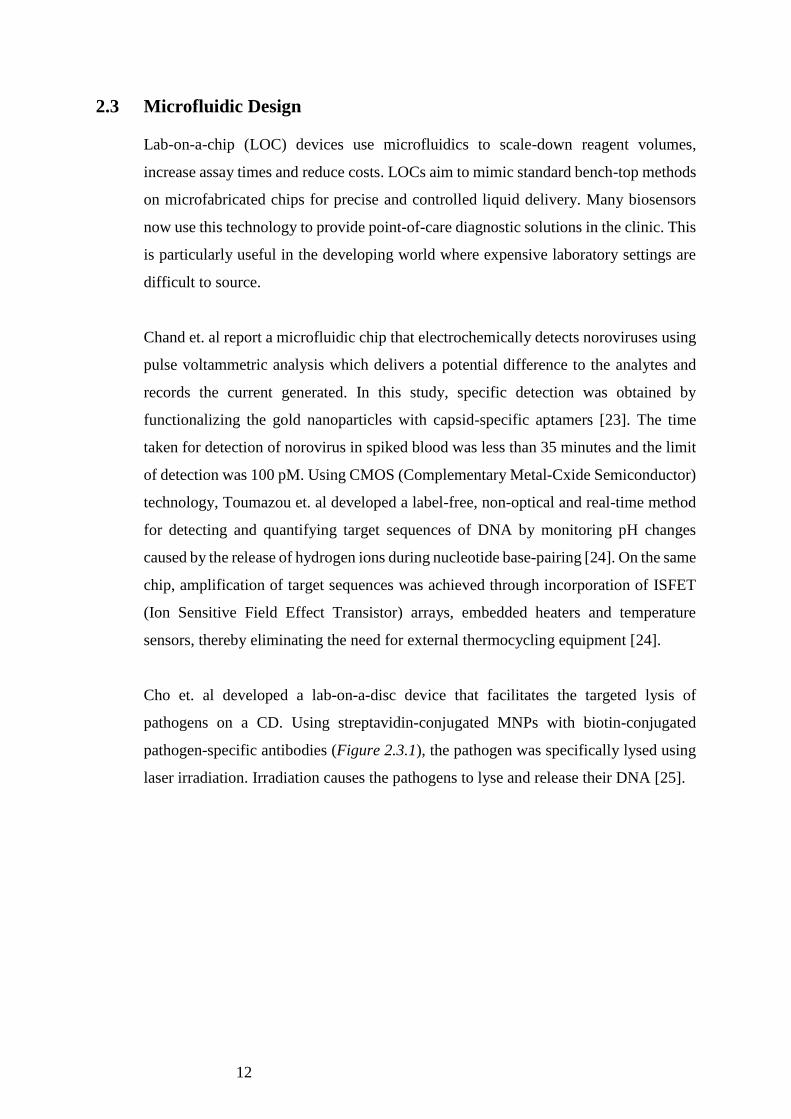
Cho et. al developed a lab-on-a-disc device that facilitates the targeted lysis of
pathogens on a CD. Using streptavidin-conjugated MNPs with biotin-conjugated
pathogen-specific antibodies (Figure 2.3.1), the pathogen was specifically lysed using
laser irradiation. Irradiation causes the pathogens to lyse and release their DNA [25].

13
Fig 2.3.1 A lab-on-a-disc platform capable of (a) DNA extraction using antibody-
conjugated MNPs and laser irradiation (808 nm, 1.5 W) and (b) the portable device
with a laser-irradiated magnetic bead system (LIMBS) and a single laser diode
operating ferro-wax microvalves by Cho et. al [25].
As opposed to this, Hong et. al developed a traditional PDMS microfluidic chip for the
detection of mRNA and DNA using multilayer soft lithography. The use of this method
allowed the fabrication of more robust micromechanical valves, preventing the risk of
cross contamination and leakage between the different chambers of the device [26].
Iranmanesh et. al introduce a novel microvortexing method that can be conducted on a
microfluidic chip [27]. This study has shown the importance of effective mixing in assay
successfulness, which is easily overlooked on the smaller scale of a microfluidic chip
where reaction times are much faster. While it is possible to mix using a pipette or a
14
vortexing machine on the lab bench, it is not feasible to do so with the chip because this
can disturb flow, causing backflow or even leakage from chambers due to aggressive
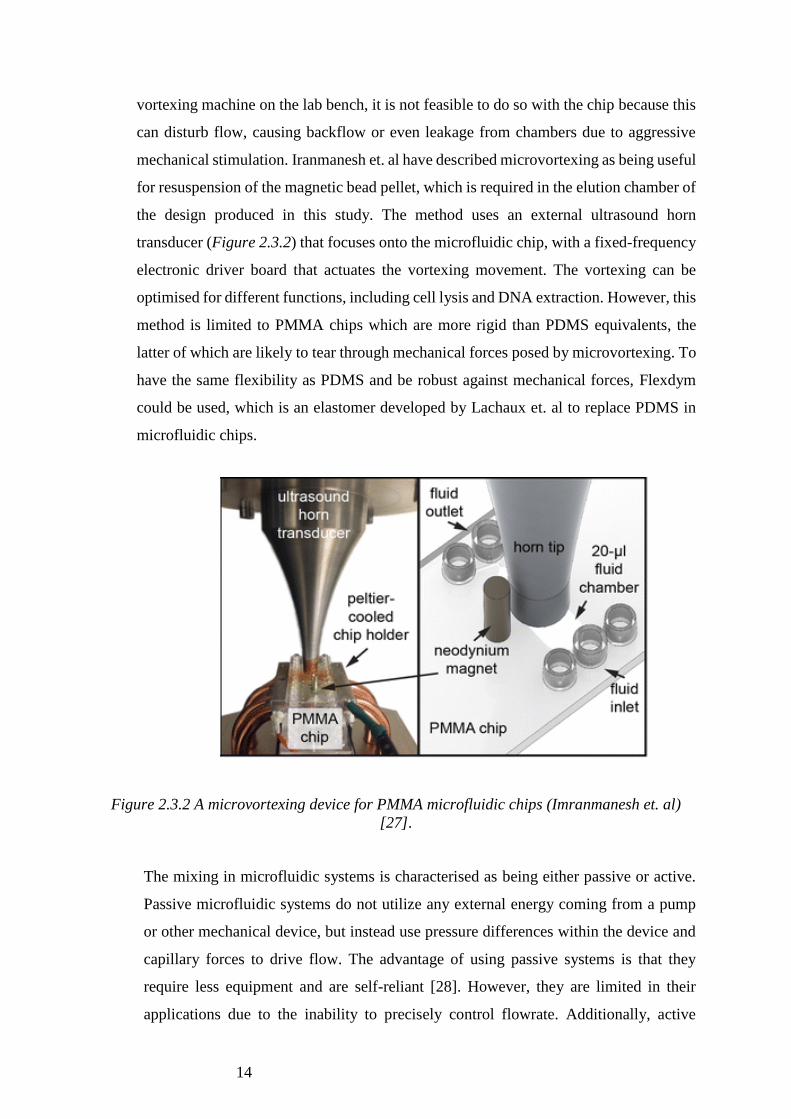
mechanical stimulation. Iranmanesh et. al have described microvortexing as being useful
for resuspension of the magnetic bead pellet, which is required in the elution chamber of
the design produced in this study. The method uses an external ultrasound horn
transducer (Figure 2.3.2) that focuses onto the microfluidic chip, with a fixed-frequency
electronic driver board that actuates the vortexing movement. The vortexing can be
optimised for different functions, including cell lysis and DNA extraction. However, this
method is limited to PMMA chips which are more rigid than PDMS equivalents, the
latter of which are likely to tear through mechanical forces posed by microvortexing. To
have the same flexibility as PDMS and be robust against mechanical forces, Flexdym
could be used, which is an elastomer developed by Lachaux et. al to replace PDMS in
microfluidic chips.
Figure 2.3.2 A microvortexing device for PMMA microfluidic chips (Imranmanesh et. al)
[27].
The mixing in microfluidic systems is characterised as being either passive or active.
Passive microfluidic systems do not utilize any external energy coming from a pump
or other mechanical device, but instead use pressure differences within the device and
capillary forces to drive flow. The advantage of using passive systems is that they
require less equipment and are self-reliant [28]. However, they are limited in their
applications due to the inability to precisely control flowrate. Additionally, active
15
microfluidic systems, such as the one developed by Schilling et. al, can remain
relatively uncomplex depending on the equipment used [29]. Two pumps controlling
inlet and outlet flows were used in this study to separate DNA and protein from cell
lysate based on their size differences. However, the application of active systems in a
diagnostic platform such as the prototype developed in this study, is more difficult to
incorporate due to the multiple inlet/outlet chambers.
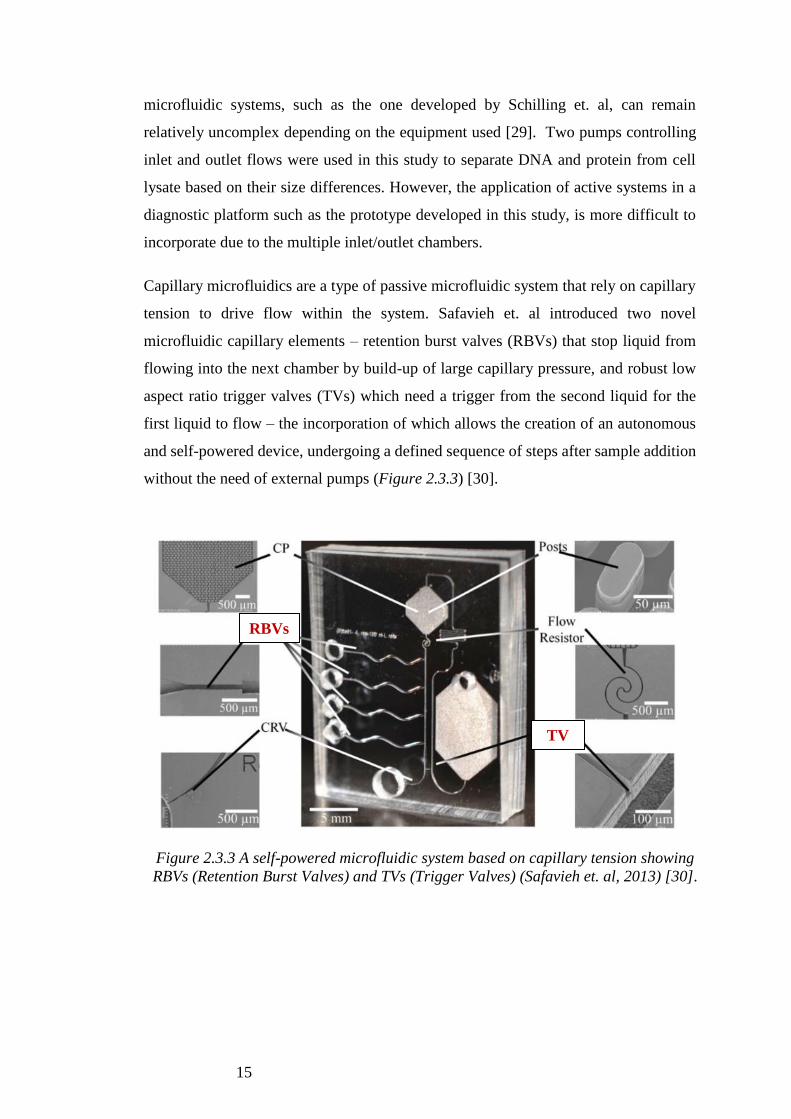
Capillary microfluidics are a type of passive microfluidic system that rely on capillary
tension to drive flow within the system. Safavieh et. al introduced two novel
microfluidic capillary elements – retention burst valves (RBVs) that stop liquid from
flowing into the next chamber by build-up of large capillary pressure, and robust low
aspect ratio trigger valves (TVs) which need a trigger from the second liquid for the
first liquid to flow – the incorporation of which allows the creation of an autonomous
and self-powered device, undergoing a defined sequence of steps after sample addition
without the need of external pumps (Figure 2.3.3) [30].
Figure 2.3.3 A self-powered microfluidic system based on capillary tension showing
RBVs (Retention Burst Valves) and TVs (Trigger Valves) (Safavieh et. al, 2013) [30].
RBVs
TV

16
2.4 Current Dengue Virus Diagnostics
Dengue virus levels (viremia) levels in blood differ significantly from patient to patient,
with primary infections resulting in higher viremia levels than secondary infections,
and the type of dengue virus (DENV1-4) influencing this too. The general range
observed in a study conducted in Mexico was 0.32–267,516 PFU eq/mL (Plaque-
forming unit) for DENV-1 infections and 0.30–124,097 PFUeq/mL for DENV-2
infections [31]. The lower end of these ranges is difficult to detect using fluorescence
or spectrophotometry and point to the need for an amplification system within the lab-
on-a-chip device.
Point-of-care dengue diagnostics currently available on the market detect levels of NS1
(non-structural 1) antigen as well as IgG and IgM antibodies [32] [33] [34] [35].
Although being far from microfluidics, these rapid diagnostic tests (RDTs) have shown
a large range of sensitivites (48.5 – 92.9%) and specificities (46.3 – 99.4%), however,
they do not directly detect the presence of the viral pathogen, DENV [36]. Figure 2.4.1
is an image of the Panbio Dengue Duo Cassette which measures the levels of both NS1
antigen and IgM antibodies. In comparison between all RDTs in the study by Blacksell
et. Al , a clear advantage was seen in combining antigenic and antibody detection in the
Panbio Cassette, demonstrating better accuracy [36].
Figure 2.4.1 Panbio Dengue Duo Cassette (Inverness, Australia) [20].
17
3. METHODS AND MATERIALS
3.1 Cell culture and suspension
All cells used in this study were taken from the MG-63 cell line at Passage-30 (see
Appendix 1 for more information). Cells were cultured in Lonza Alpha-MEM
(Minimum Essential Medium) with 10% FCS (Fetal Calf Serum) and Pen-Strep
antibiotic. They were cultured in 75 mL flasks and incubated overnight at 37°C and 5%
CO2. Following overnight incubation, all media was removed from the flasks and the
cells washed twice with 8 mL PBS (Phosphate Buffer Solution). 2.5 mL trypsin was
then added to the cells to detach them from the flask, and the flask incubated for 5
minutes. Next, 5 mL media was added to the flask to stop trypsinization. The floating
cells were counted on a haemocytometer to create the stock solution, which required
concentrating the cells to 150 cells/µL for method 1, and 15,000 cells/µL for methods
2 and 3.
3.2 Bench-top DNA Extraction
All buffers and magnetic nanoparticles (MNPs) used in this protocol were part of the
MagSi-DNA Pathogen Kit sourced from MagnaMedics Diagnostics BV (The
Netherlands).
200 µL stock solution (cells) was transferred into three separate Eppendorf tubes to
create Sample 1 (S1), Sample 2 (S2) and Sample 3 (S3). 150 µL lysis buffer was added
to each tube and mixed using a pipette. MNPs were homogenised using an ultrasonic
bath (Ultrasound Cleaning Bath, VWR Collection) for 5 minutes. 20 µL beads were
added to each tube, followed by 440 µL binding buffer. The sample was then mixed
using a pipette and incubated at room temperature for 10 minutes. The beads were then
collected using a neodymium magnet (Amazon, UK) and the supernatants removed as
efficiently as possible, using a pipette. 200 µL wash buffer-I was added and mixed. The
beads were then collected using a neodymium magnet and the supernatant wash buffer
removed as efficiently as possible, using a pipette. The washing step was repeated using
200 µL wash buffer-II and the supernatants removed. Following this, the tubes were
dried with opened lids for 10-15 minutes. The volume of elution buffer used, and the
temperature of elution depend on the version of the method followed during
18
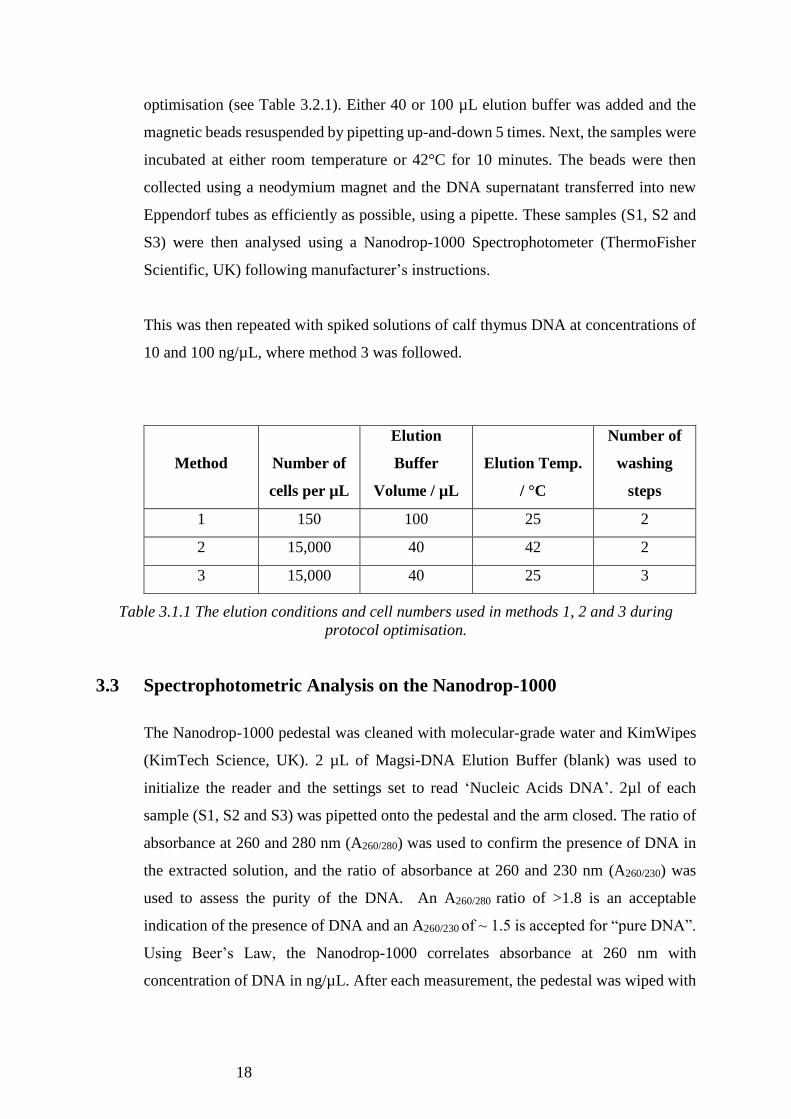
optimisation (see Table 3.2.1). Either 40 or 100 µL elution buffer was added and the
magnetic beads resuspended by pipetting up-and-down 5 times. Next, the samples were
incubated at either room temperature or 42°C for 10 minutes. The beads were then
collected using a neodymium magnet and the DNA supernatant transferred into new
Eppendorf tubes as efficiently as possible, using a pipette. These samples (S1, S2 and
S3) were then analysed using a Nanodrop-1000 Spectrophotometer (ThermoFisher
Scientific, UK) following manufacturer’s instructions.
This was then repeated with spiked solutions of calf thymus DNA at concentrations of
10 and 100 ng/µL, where method 3 was followed.
Method
Number of
cells per µL
Elution
Buffer
Volume / µL
Elution Temp.
/ °C
Number of
washing
steps
1 150 100 25 2
2 15,000 40 42 2
3 15,000 40 25 3
Table 3.1.1 The elution conditions and cell numbers used in methods 1, 2 and 3 during
protocol optimisation.
3.3 Spectrophotometric Analysis on the Nanodrop-1000
The Nanodrop-1000 pedestal was cleaned with molecular-grade water and KimWipes
(KimTech Science, UK). 2 µL of Magsi-DNA Elution Buffer (blank) was used to
initialize the reader and the settings set to read ‘Nucleic Acids DNA’. 2µl of each
sample (S1, S2 and S3) was pipetted onto the pedestal and the arm closed. The ratio of
absorbance at 260 and 280 nm (A260/280) was used to confirm the presence of DNA in
the extracted solution, and the ratio of absorbance at 260 and 230 nm (A260/230) was
used to assess the purity of the DNA. An A260/280 ratio of >1.8 is an acceptable
indication of the presence of DNA and an A260/230 of ~ 1.5 is accepted for “pure DNA”.
Using Beer’s Law, the Nanodrop-1000 correlates absorbance at 260 nm with
concentration of DNA in ng/µL. After each measurement, the pedestal was wiped with
19
a clean, dry KimWipe. The output of DNA was compared to the theoretical input and
an average of percentage throughput was calculated for each sample (S1, S2 and S3).
3.4 Microfluidic Chip Fabrication
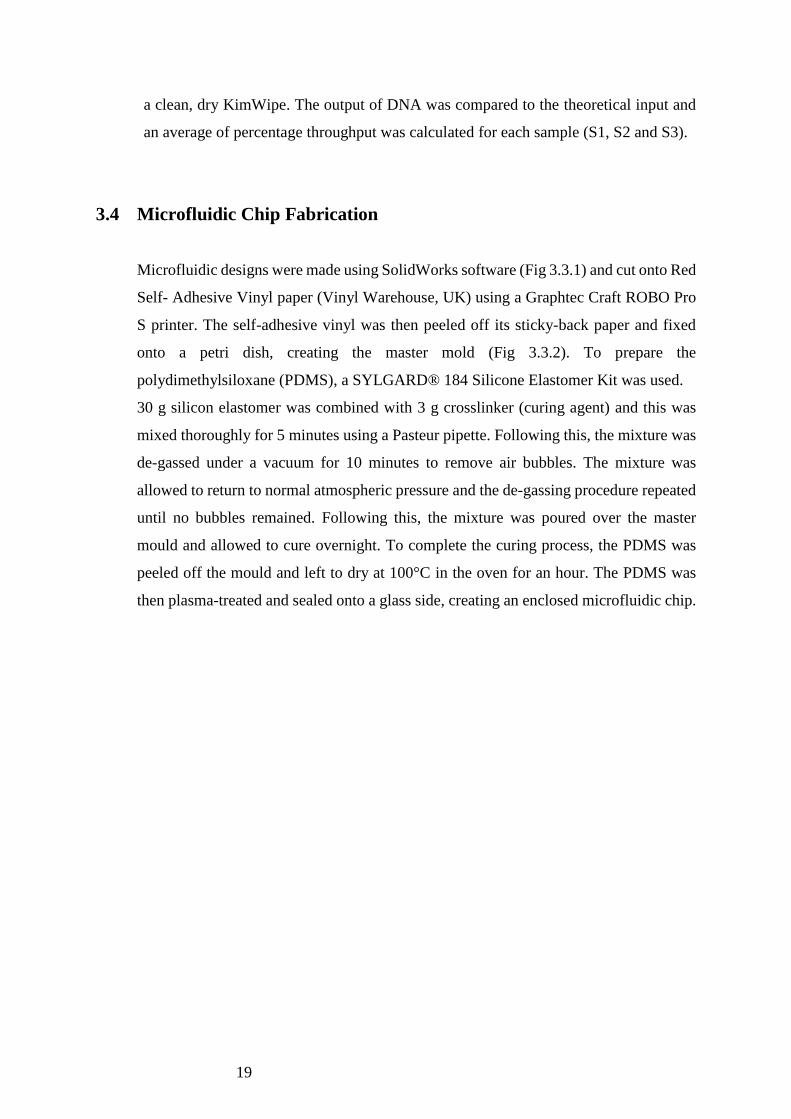
Microfluidic designs were made using SolidWorks software (Fig 3.3.1) and cut onto Red
Self- Adhesive Vinyl paper (Vinyl Warehouse, UK) using a Graphtec Craft ROBO Pro
S printer. The self-adhesive vinyl was then peeled off its sticky-back paper and fixed
onto a petri dish, creating the master mold (Fig 3.3.2). To prepare the
polydimethylsiloxane (PDMS), a SYLGARD® 184 Silicone Elastomer Kit was used.
30 g silicon elastomer was combined with 3 g crosslinker (curing agent) and this was
mixed thoroughly for 5 minutes using a Pasteur pipette. Following this, the mixture was
de-gassed under a vacuum for 10 minutes to remove air bubbles. The mixture was
allowed to return to normal atmospheric pressure and the de-gassing procedure repeated
until no bubbles remained. Following this, the mixture was poured over the master
mould and allowed to cure overnight. To complete the curing process, the PDMS was
peeled off the mould and left to dry at 100°C in the oven for an hour. The PDMS was
then plasma-treated and sealed onto a glass side, creating an enclosed microfluidic chip.
20
Fig 3.3.1 Microfluidic chip blueprint created on SolidWorks. All
measurements shown are in mm.
21
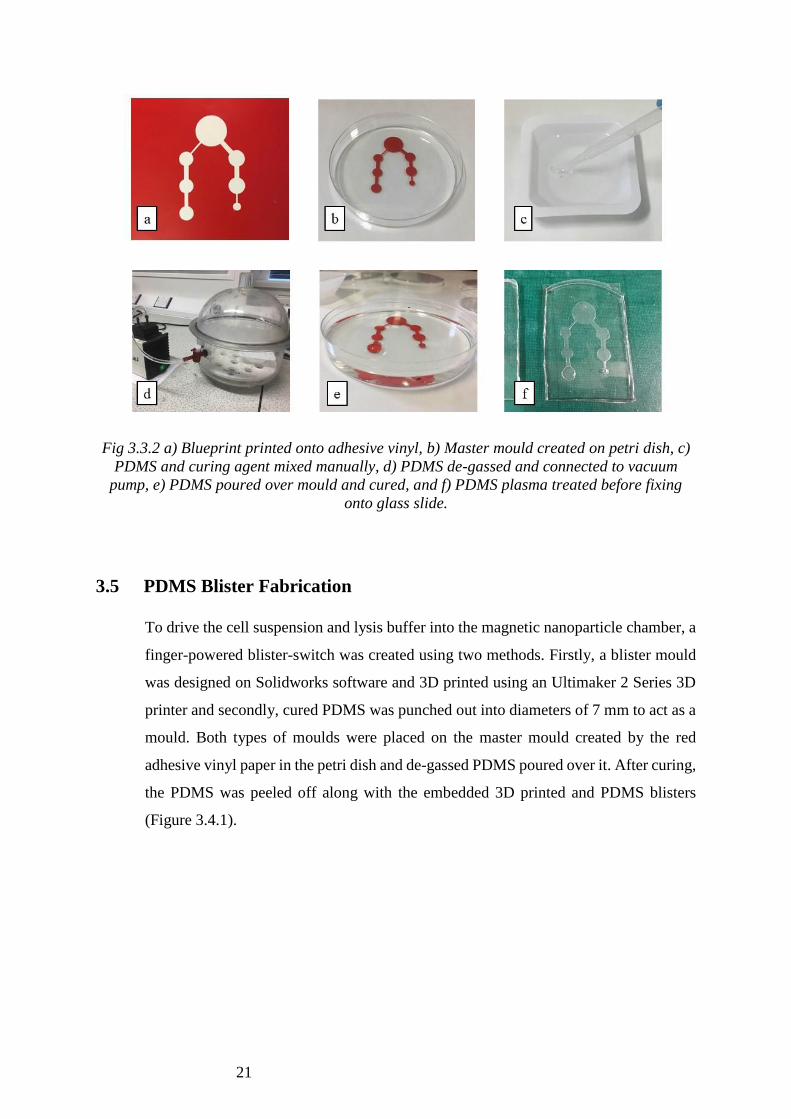
Fig 3.3.2 a) Blueprint printed onto adhesive vinyl, b) Master mould created on petri dish, c)
PDMS and curing agent mixed manually, d) PDMS de-gassed and connected to vacuum
pump, e) PDMS poured over mould and cured, and f) PDMS plasma treated before fixing
onto glass slide.
3.5 PDMS Blister Fabrication
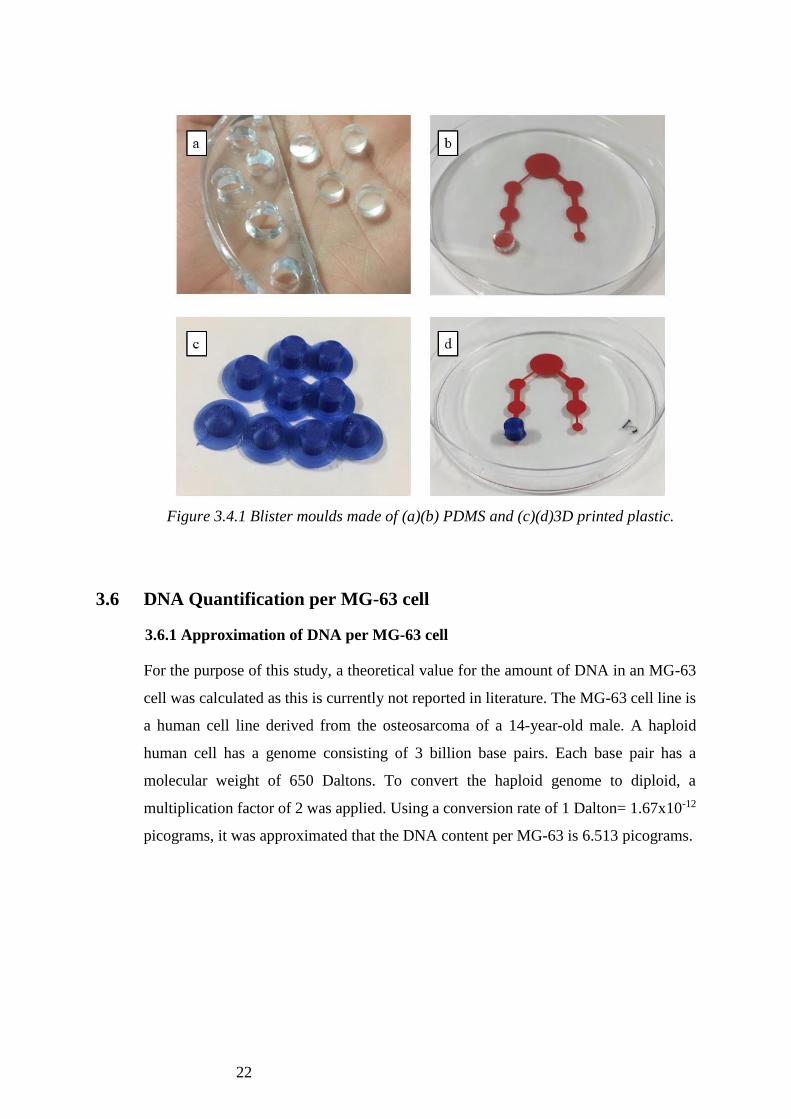
To drive the cell suspension and lysis buffer into the magnetic nanoparticle chamber, a
finger-powered blister-switch was created using two methods. Firstly, a blister mould
was designed on Solidworks software and 3D printed using an Ultimaker 2 Series 3D
printer and secondly, cured PDMS was punched out into diameters of 7 mm to act as a
mould. Both types of moulds were placed on the master mould created by the red
adhesive vinyl paper in the petri dish and de-gassed PDMS poured over it. After curing,
the PDMS was peeled off along with the embedded 3D printed and PDMS blisters
(Figure 3.4.1).
22
Figure 3.4.1 Blister moulds made of (a)(b) PDMS and (c)(d)3D printed plastic.
3.6 DNA Quantification per MG-63 cell
3.6.1 Approximation of DNA per MG-63 cell
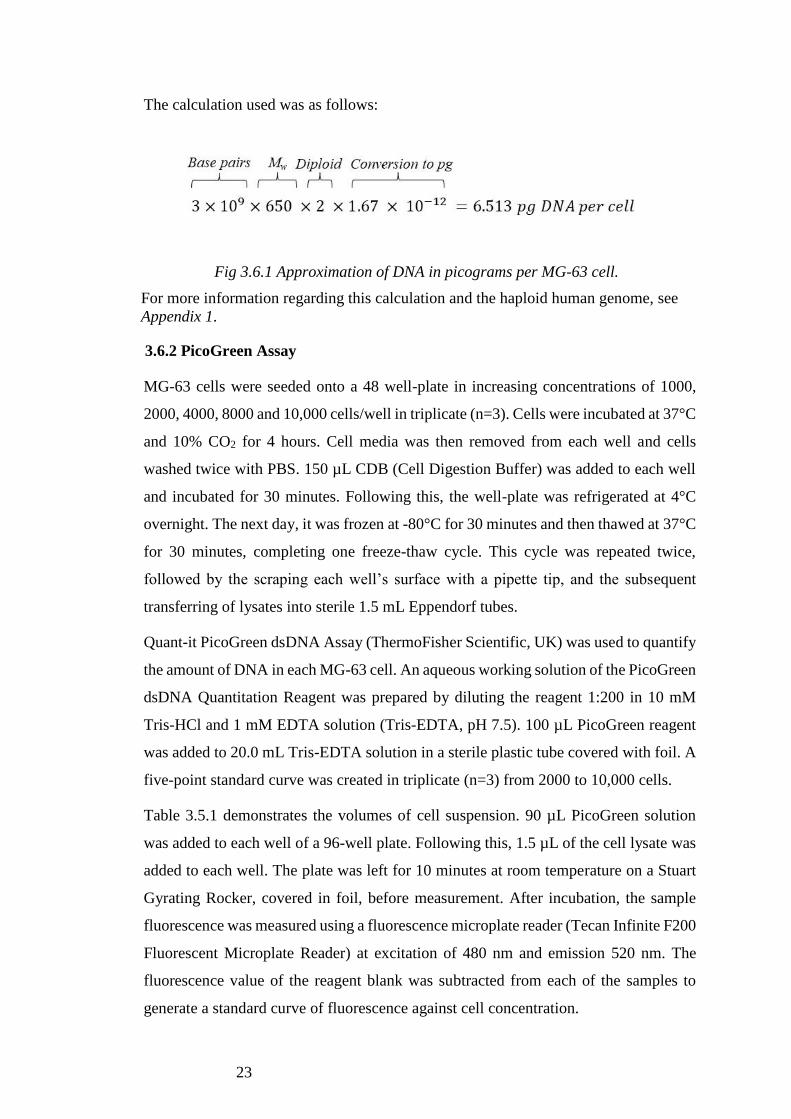
For the purpose of this study, a theoretical value for the amount of DNA in an MG-63
cell was calculated as this is currently not reported in literature. The MG-63 cell line is
a human cell line derived from the osteosarcoma of a 14-year-old male. A haploid
human cell has a genome consisting of 3 billion base pairs. Each base pair has a
molecular weight of 650 Daltons. To convert the haploid genome to diploid, a
multiplication factor of 2 was applied. Using a conversion rate of 1 Dalton= 1.67x10⁻¹²
picograms, it was approximated that the DNA content per MG-63 is 6.513 picograms.
23
The calculation used was as follows:
Fig 3.6.1 Approximation of DNA in picograms per MG-63 cell.
For more information regarding this calculation and the haploid human genome, see
Appendix 1.
3.6.2 PicoGreen Assay
MG-63 cells were seeded onto a 48 well-plate in increasing concentrations of 1000,
2000, 4000, 8000 and 10,000 cells/well in triplicate (n=3). Cells were incubated at 37°C
and 10% CO2 for 4 hours. Cell media was then removed from each well and cells
washed twice with PBS. 150 µL CDB (Cell Digestion Buffer) was added to each well
and incubated for 30 minutes. Following this, the well-plate was refrigerated at 4°C
overnight. The next day, it was frozen at -80°C for 30 minutes and then thawed at 37°C
for 30 minutes, completing one freeze-thaw cycle. This cycle was repeated twice,
followed by the scraping each well’s surface with a pipette tip, and the subsequent
transferring of lysates into sterile 1.5 mL Eppendorf tubes.
Quant-it PicoGreen dsDNA Assay (ThermoFisher Scientific, UK) was used to quantify
the amount of DNA in each MG-63 cell. An aqueous working solution of the PicoGreen
dsDNA Quantitation Reagent was prepared by diluting the reagent 1:200 in 10 mM
Tris-HCl and 1 mM EDTA solution (Tris-EDTA, pH 7.5). 100 µL PicoGreen reagent
was added to 20.0 mL Tris-EDTA solution in a sterile plastic tube covered with foil. A
five-point standard curve was created in triplicate (n=3) from 2000 to 10,000 cells.
Table 3.5.1 demonstrates the volumes of cell suspension. 90 µL PicoGreen solution
was added to each well of a 96-well plate. Following this, 1.5 µL of the cell lysate was
added to each well. The plate was left for 10 minutes at room temperature on a Stuart
Gyrating Rocker, covered in foil, before measurement. After incubation, the sample
fluorescence was measured using a fluorescence microplate reader (Tecan Infinite F200
Fluorescent Microplate Reader) at excitation of 480 nm and emission 520 nm. The
fluorescence value of the reagent blank was subtracted from each of the samples to
generate a standard curve of fluorescence against cell concentration.
24
3.7 On-Chip DNA Extraction
All solutions were scaled down from the bench-top
method by a factor of 40 based on the maximum
volume of each chamber (Table 3.7.1).
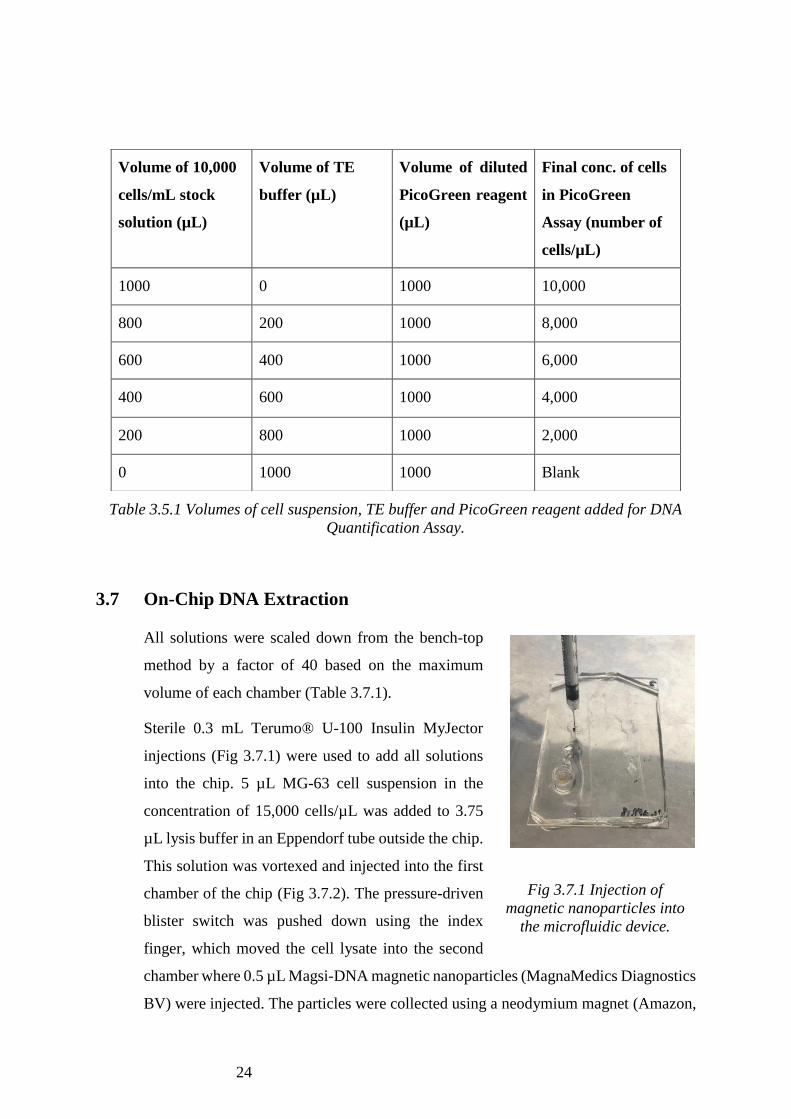
Sterile 0.3 mL Terumo® U-100 Insulin MyJector
injections (Fig 3.7.1) were used to add all solutions
into the chip. 5 µL MG-63 cell suspension in the
concentration of 15,000 cells/µL was added to 3.75
µL lysis buffer in an Eppendorf tube outside the chip.
This solution was vortexed and injected into the first
chamber of the chip (Fig 3.7.2). The pressure-driven
blister switch was pushed down using the index
finger, which moved the cell lysate into the second
chamber where 0.5 µL Magsi-DNA magnetic nanoparticles (MagnaMedics Diagnostics
BV) were injected. The particles were collected using a neodymium magnet (Amazon,
Volume of 10,000
cells/mL stock
solution (µL)
Volume of TE
buffer (µL)
Volume of diluted
PicoGreen reagent
(µL)
Final conc. of cells
in PicoGreen
Assay (number of
cells/µL)
1000 0 1000 10,000
800 200 1000 8,000
600 400 1000 6,000
400 600 1000 4,000
200 800 1000 2,000
0 1000 1000 Blank
Table 3.5.1 Volumes of cell suspension, TE buffer and PicoGreen reagent added for DNA
Quantification Assay.
Fig 3.7.1 Injection of
magnetic nanoparticles into
the microfluidic device.
25
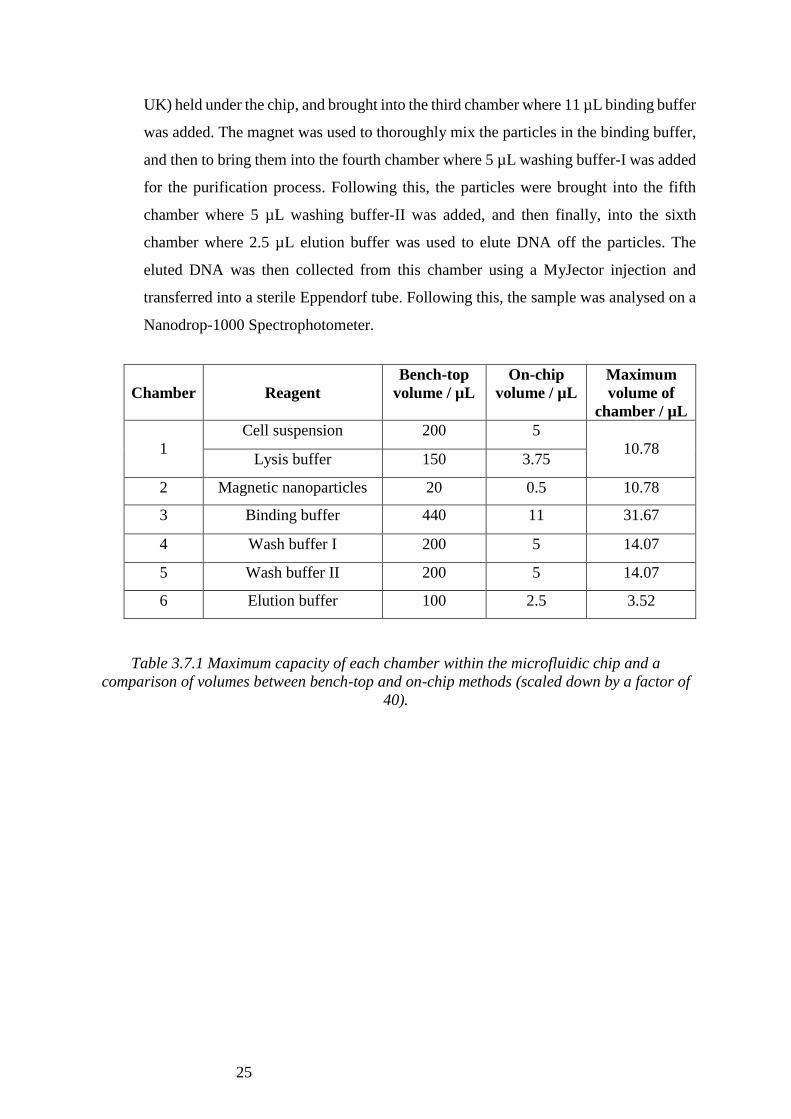
UK) held under the chip, and brought into the third chamber where 11 µL binding buffer
was added. The magnet was used to thoroughly mix the particles in the binding buffer,
and then to bring them into the fourth chamber where 5 µL washing buffer-I was added
for the purification process. Following this, the particles were brought into the fifth
chamber where 5 µL washing buffer-II was added, and then finally, into the sixth
chamber where 2.5 µL elution buffer was used to elute DNA off the particles. The
eluted DNA was then collected from this chamber using a MyJector injection and
transferred into a sterile Eppendorf tube. Following this, the sample was analysed on a
Nanodrop-1000 Spectrophotometer.
Table 3.7.1 Maximum capacity of each chamber within the microfluidic chip and a
comparison of volumes between bench-top and on-chip methods (scaled down by a factor of
40).
Chamber
Reagent
Bench-top
volume / µL
On-chip
volume / µL
Maximum
volume of
chamber / µL
1
Cell suspension 200 5
10.78 Lysis buffer 150 3.75
2 Magnetic nanoparticles 20 0.5 10.78
3 Binding buffer 440 11 31.67
4 Wash buffer I 200 5 14.07
5 Wash buffer II 200 5 14.07
6 Elution buffer 100 2.5 3.52
26
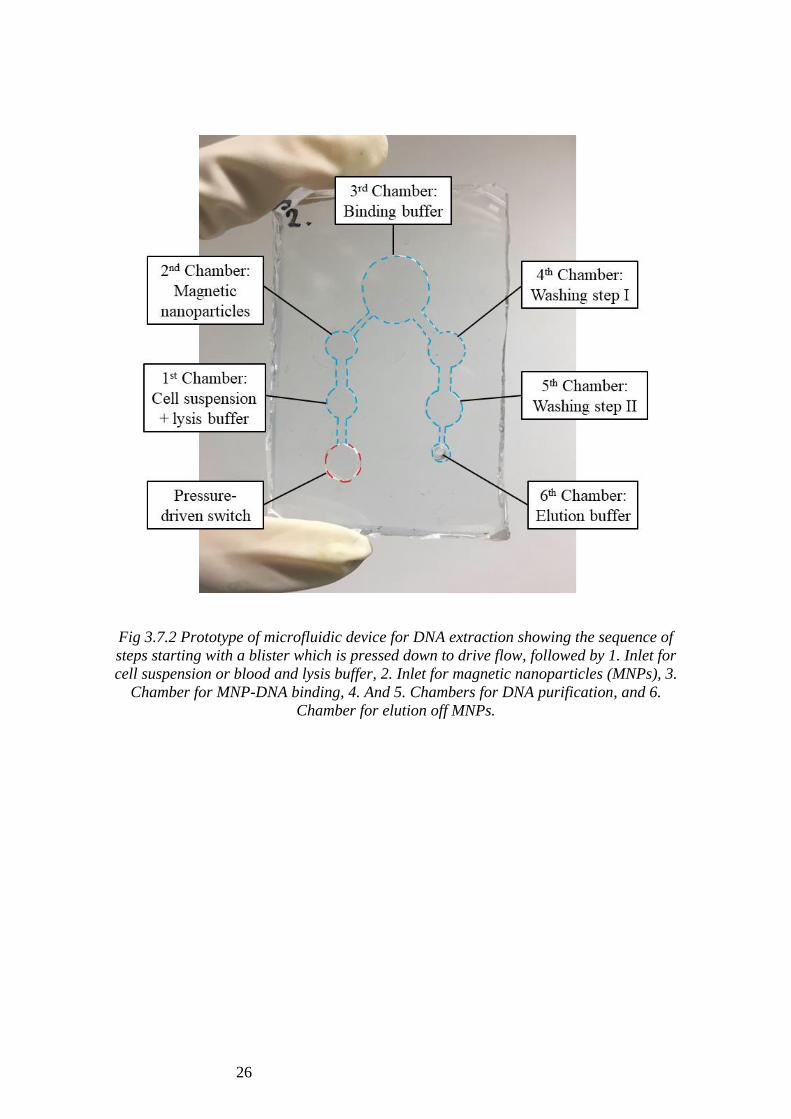
Fig 3.7.2 Prototype of microfluidic device for DNA extraction showing the sequence of
steps starting with a blister which is pressed down to drive flow, followed by 1. Inlet for
cell suspension or blood and lysis buffer, 2. Inlet for magnetic nanoparticles (MNPs), 3.
Chamber for MNP-DNA binding, 4. And 5. Chambers for DNA purification, and 6.
Chamber for elution off MNPs.
27
4. RESULTS
4.1 Bench-top Method
Percentage throughput was calculated to normalise the data obtained from methods 1,
2 and 3 (see Table 3.1.1) which, depending on the method, used different inputs of
DNA (150 cells/µL for method 1 and 15,000 cells/µL for methods 2 and 3).
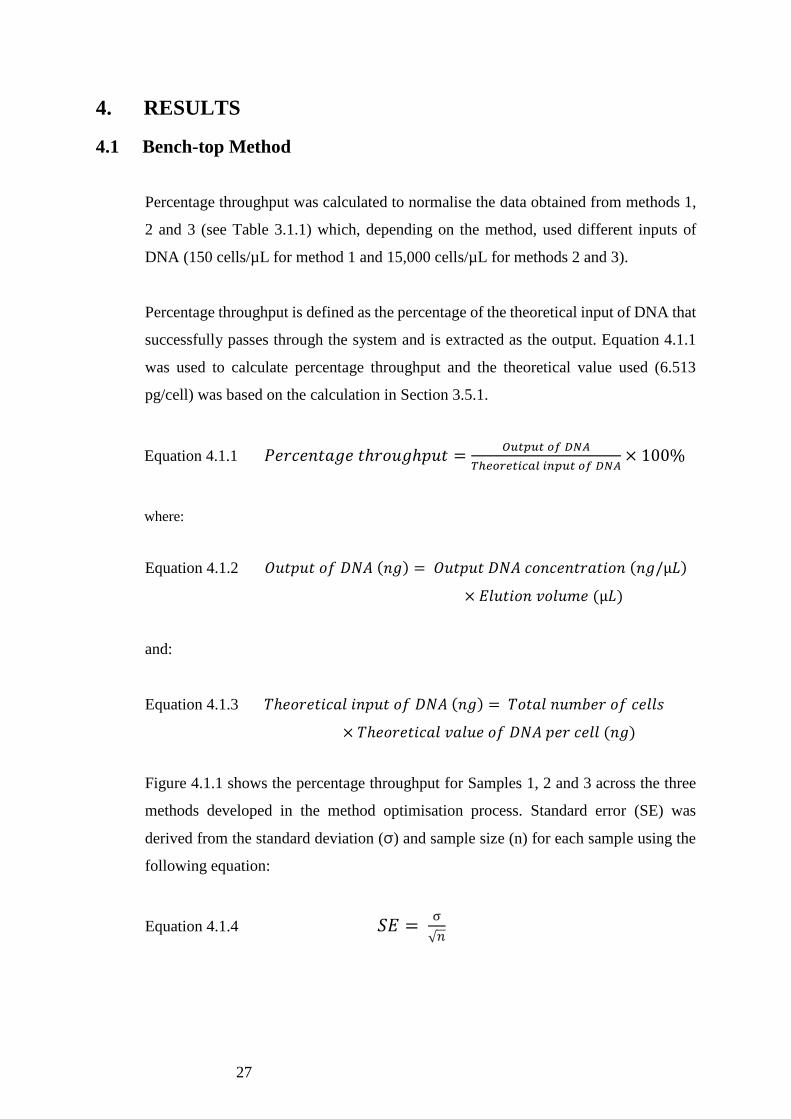
Percentage throughput is defined as the percentage of the theoretical input of DNA that
successfully passes through the system and is extracted as the output. Equation 4.1.1
was used to calculate percentage throughput and the theoretical value used (6.513
pg/cell) was based on the calculation in Section 3.5.1.
Equation 4.1.1 𝑃𝑒𝑟𝑐𝑒𝑛𝑡𝑎𝑔𝑒 𝑡ℎ𝑟𝑜𝑢𝑔ℎ𝑝𝑢𝑡 =𝑂𝑢𝑡𝑝𝑢𝑡 𝑜𝑓 𝐷𝑁𝐴
𝑇ℎ𝑒𝑜𝑟𝑒𝑡𝑖𝑐𝑎𝑙 𝑖𝑛𝑝𝑢𝑡 𝑜𝑓 𝐷𝑁𝐴× 100%
where:
Equation 4.1.2 𝑂𝑢𝑡𝑝𝑢𝑡 𝑜𝑓 𝐷𝑁𝐴 (𝑛𝑔) = 𝑂𝑢𝑡𝑝𝑢𝑡 𝐷𝑁𝐴 𝑐𝑜𝑛𝑐𝑒𝑛𝑡𝑟𝑎𝑡𝑖𝑜𝑛 (𝑛𝑔/µ𝐿)
× 𝐸𝑙𝑢𝑡𝑖𝑜𝑛 𝑣𝑜𝑙𝑢𝑚𝑒 (µ𝐿)
and:
Equation 4.1.3 𝑇ℎ𝑒𝑜𝑟𝑒𝑡𝑖𝑐𝑎𝑙 𝑖𝑛𝑝𝑢𝑡 𝑜𝑓 𝐷𝑁𝐴 (𝑛𝑔) = 𝑇𝑜𝑡𝑎𝑙 𝑛𝑢𝑚𝑏𝑒𝑟 𝑜𝑓 𝑐𝑒𝑙𝑙𝑠
× 𝑇ℎ𝑒𝑜𝑟𝑒𝑡𝑖𝑐𝑎𝑙 𝑣𝑎𝑙𝑢𝑒 𝑜𝑓 𝐷𝑁𝐴 𝑝𝑒𝑟 𝑐𝑒𝑙𝑙 (𝑛𝑔)
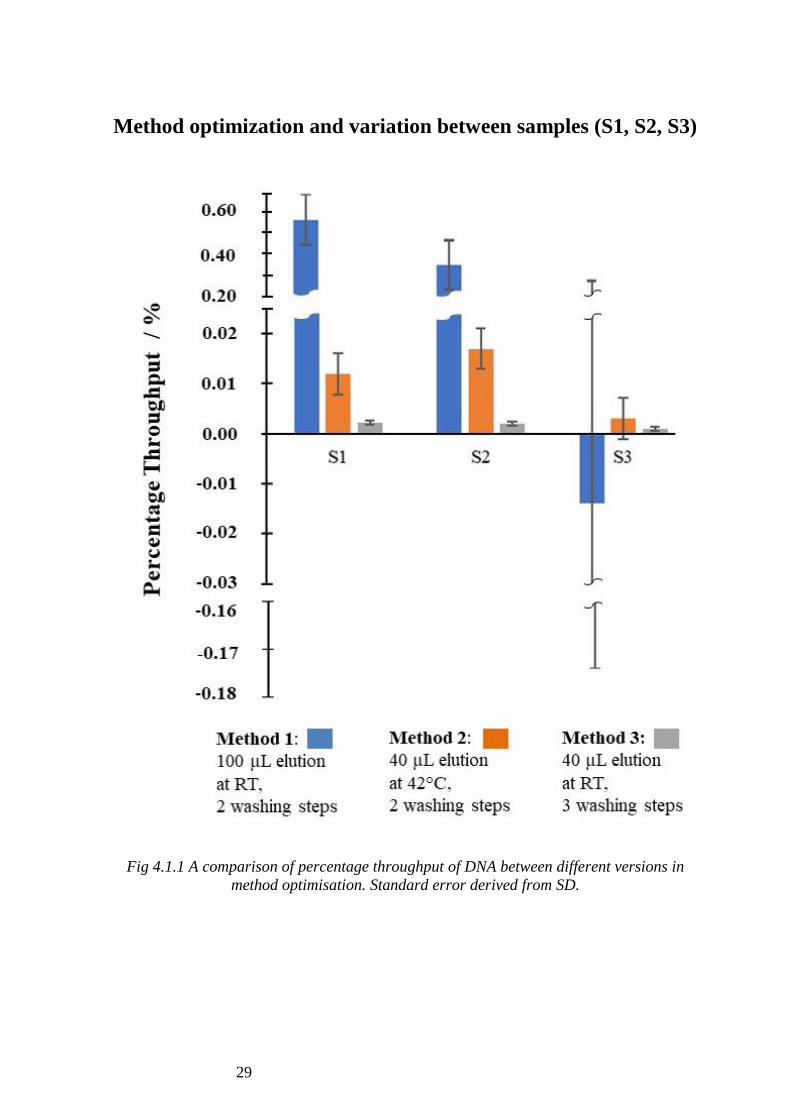
Figure 4.1.1 shows the percentage throughput for Samples 1, 2 and 3 across the three
methods developed in the method optimisation process. Standard error (SE) was
derived from the standard deviation (σ) and sample size (n) for each sample using the
following equation:
Equation 4.1.4 𝑆𝐸 = σ
√𝑛
28
It can be seen that for Method 1, Samples 2 and 3 showed a significantly high
percentage throughput (0.54% and 0.25%), whereas for Sample 3, a negative value is
obtained (-0.014%). The large standard error seen in Sample 3 (0.475%) is derived
from the variance seen across samples in Method 1.
For Method 2, Samples 1 and 2 (0.012% and 0.017%) are again significantly higher
than Sample 3 (0.003%). For the same method, the standard error seen across Samples
1, 2 and 3 is relatively constant at 0.008%.
As for Method 3, it can be seen that Samples 1 and 2 have relatively similar percentage
throughput (0.0022% and 0.0020%) whereas Sample 3 is slightly lower (0.001%). The
standard error (0.0005%) seen across samples (S1, S2 and S3) in Method 3 stays
relatively constant.
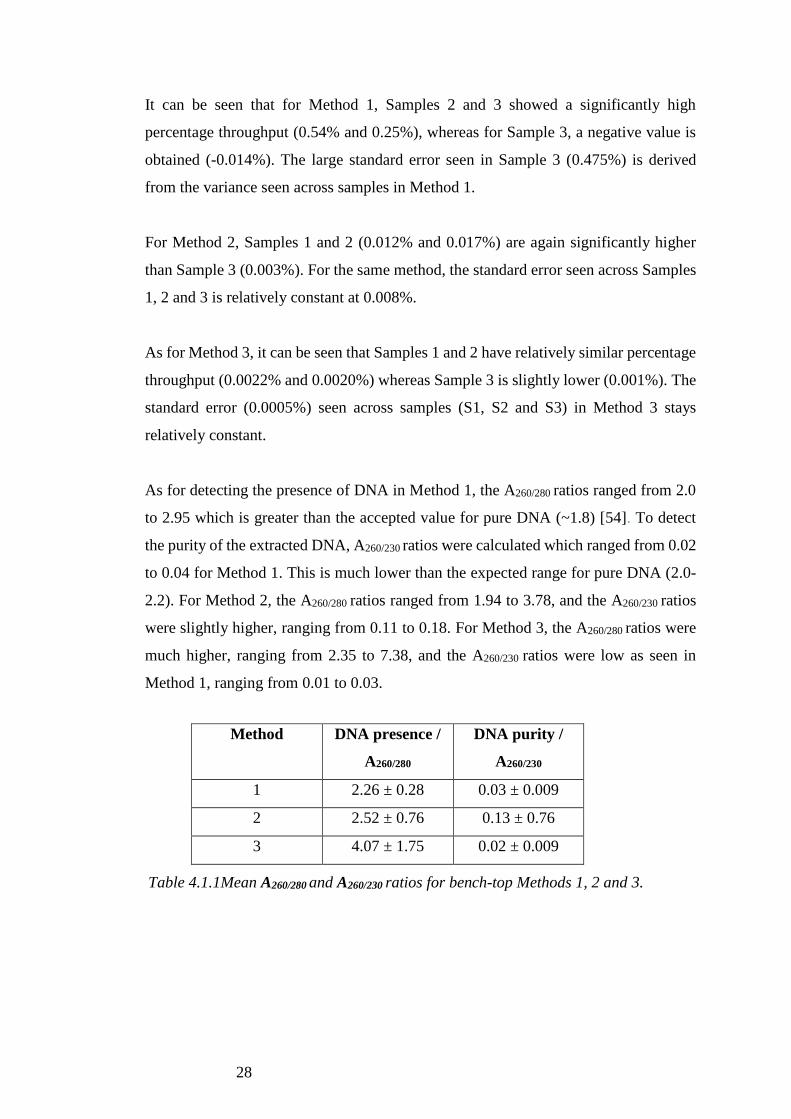
As for detecting the presence of DNA in Method 1, the A260/280 ratios ranged from 2.0
to 2.95 which is greater than the accepted value for pure DNA (~1.8) [54]. To detect
the purity of the extracted DNA, A260/230 ratios were calculated which ranged from 0.02
to 0.04 for Method 1. This is much lower than the expected range for pure DNA (2.0-
2.2). For Method 2, the A260/280 ratios ranged from 1.94 to 3.78, and the A260/230 ratios
were slightly higher, ranging from 0.11 to 0.18. For Method 3, the A260/280 ratios were
much higher, ranging from 2.35 to 7.38, and the A260/230 ratios were low as seen in
Method 1, ranging from 0.01 to 0.03.
Method DNA presence /
A260/280
DNA purity /
A260/230
1 2.26 ± 0.28 0.03 ± 0.009
2 2.52 ± 0.76 0.13 ± 0.76
3 4.07 ± 1.75 0.02 ± 0.009
Table 4.1.1Mean A260/280 and A260/230 ratios for bench-top Methods 1, 2 and 3.
29
Method optimization and variation between samples (S1, S2, S3)
Fig 4.1.1 A comparison of percentage throughput of DNA between different versions in
method optimisation. Standard error derived from SD.
30
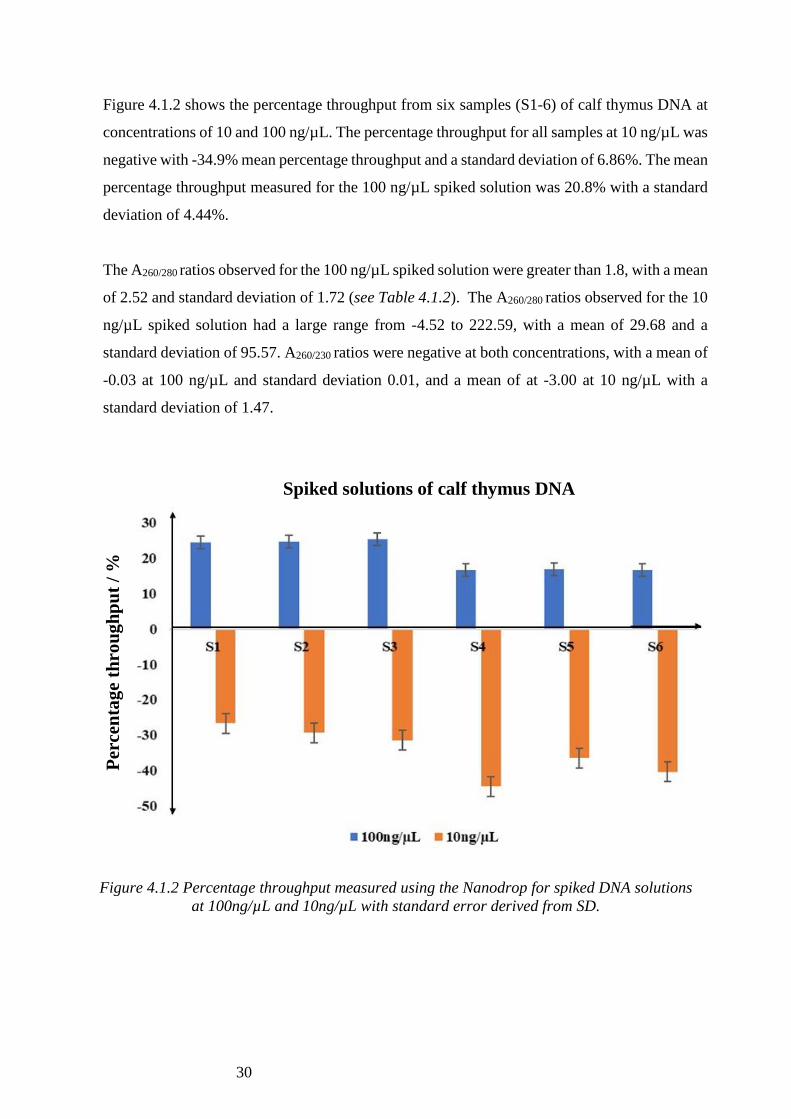
Figure 4.1.2 shows the percentage throughput from six samples (S1-6) of calf thymus DNA at
concentrations of 10 and 100 ng/µL. The percentage throughput for all samples at 10 ng/µL was
negative with -34.9% mean percentage throughput and a standard deviation of 6.86%. The mean
percentage throughput measured for the 100 ng/µL spiked solution was 20.8% with a standard
deviation of 4.44%.
The A260/280 ratios observed for the 100 ng/µL spiked solution were greater than 1.8, with a mean
of 2.52 and standard deviation of 1.72 (see Table 4.1.2). The A260/280 ratios observed for the 10
ng/µL spiked solution had a large range from -4.52 to 222.59, with a mean of 29.68 and a
standard deviation of 95.57. A260/230 ratios were negative at both concentrations, with a mean of
-0.03 at 100 ng/µL and standard deviation 0.01, and a mean of at -3.00 at 10 ng/µL with a
standard deviation of 1.47.
Figure 4.1.2 Percentage throughput measured using the Nanodrop for spiked DNA solutions
at 100ng/µL and 10ng/µL with standard error derived from SD.
Spiked solutions of calf thymus DNA
Per
cen
tag
e th
rou
gh
pu
t /
%
31
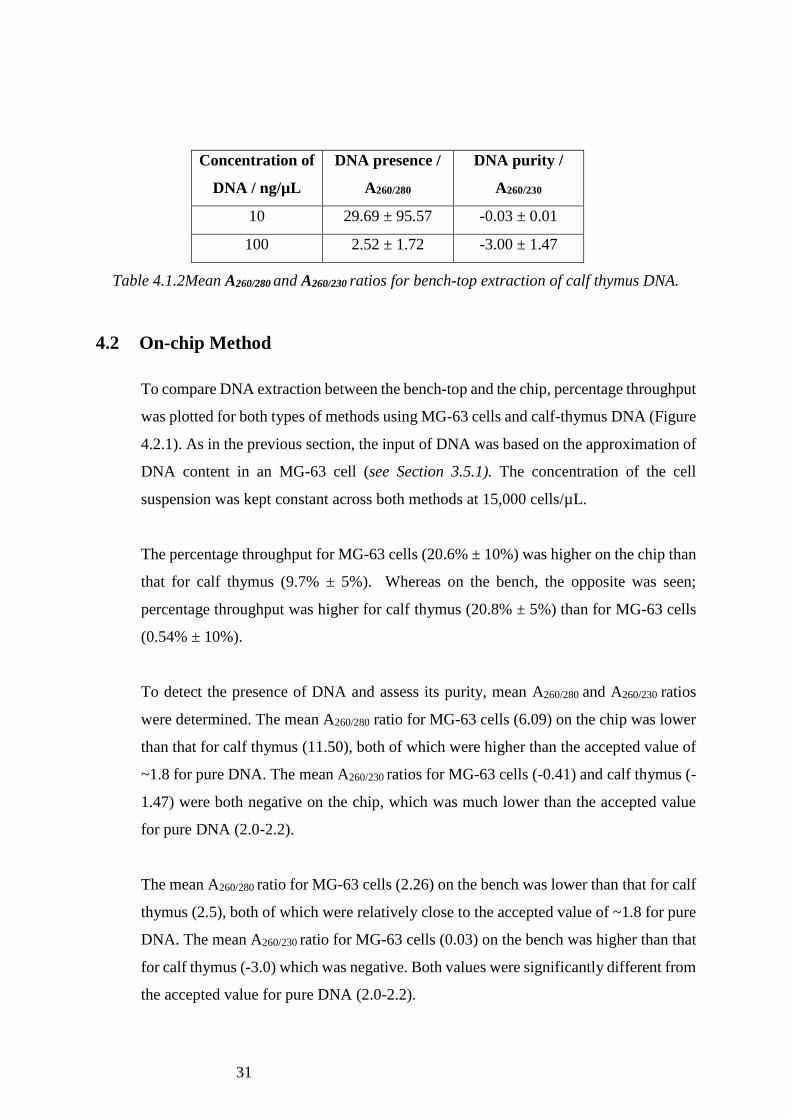
Concentration of
DNA / ng/µL
DNA presence /
A260/280
DNA purity /
A260/230
10 29.69 ± 95.57 -0.03 ± 0.01
100 2.52 ± 1.72 -3.00 ± 1.47
Table 4.1.2Mean A260/280 and A260/230 ratios for bench-top extraction of calf thymus DNA.
4.2 On-chip Method
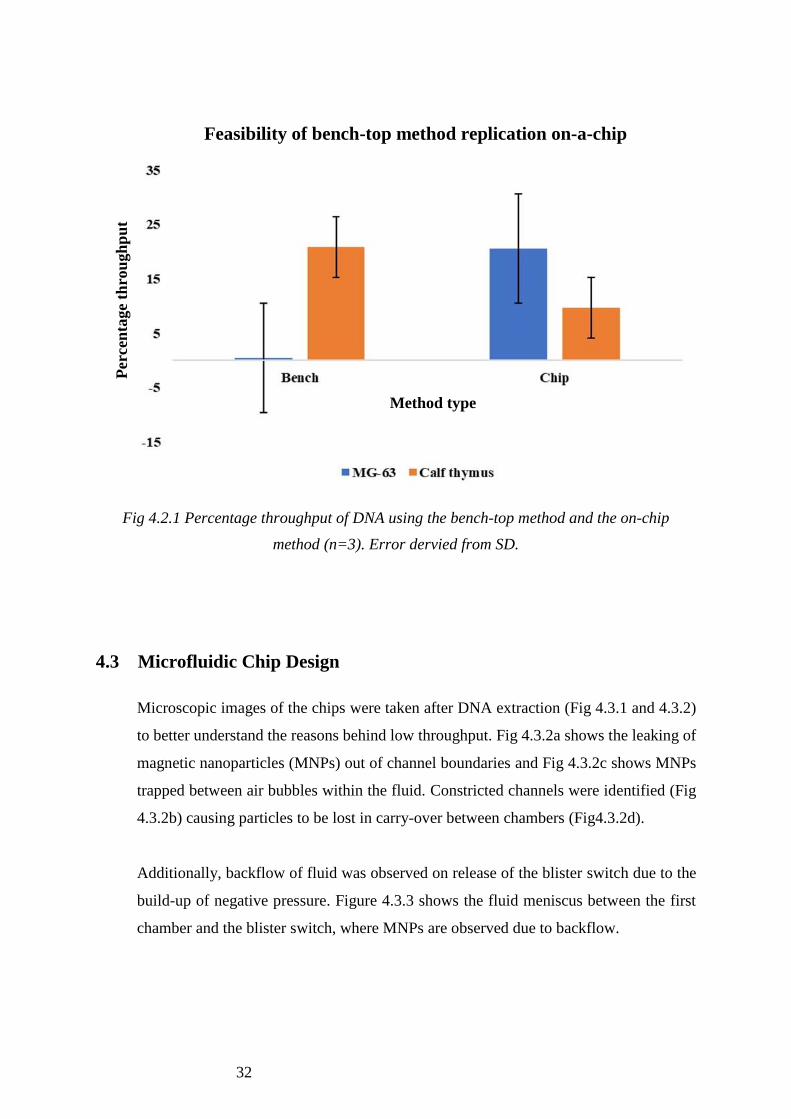
To compare DNA extraction between the bench-top and the chip, percentage throughput
was plotted for both types of methods using MG-63 cells and calf-thymus DNA (Figure
4.2.1). As in the previous section, the input of DNA was based on the approximation of
DNA content in an MG-63 cell (see Section 3.5.1). The concentration of the cell
suspension was kept constant across both methods at 15,000 cells/µL.
The percentage throughput for MG-63 cells (20.6% ± 10%) was higher on the chip than
that for calf thymus (9.7% ± 5%). Whereas on the bench, the opposite was seen;
percentage throughput was higher for calf thymus (20.8% ± 5%) than for MG-63 cells
(0.54% ± 10%).
To detect the presence of DNA and assess its purity, mean A260/280 and A260/230 ratios
were determined. The mean A260/280 ratio for MG-63 cells (6.09) on the chip was lower
than that for calf thymus (11.50), both of which were higher than the accepted value of
~1.8 for pure DNA. The mean A260/230 ratios for MG-63 cells (-0.41) and calf thymus (-
1.47) were both negative on the chip, which was much lower than the accepted value
for pure DNA (2.0-2.2).
The mean A260/280 ratio for MG-63 cells (2.26) on the bench was lower than that for calf
thymus (2.5), both of which were relatively close to the accepted value of ~1.8 for pure
DNA. The mean A260/230 ratio for MG-63 cells (0.03) on the bench was higher than that
for calf thymus (-3.0) which was negative. Both values were significantly different from
the accepted value for pure DNA (2.0-2.2).
32
Fig 4.2.1 Percentage throughput of DNA using the bench-top method and the on-chip
method (n=3). Error dervied from SD.
4.3 Microfluidic Chip Design
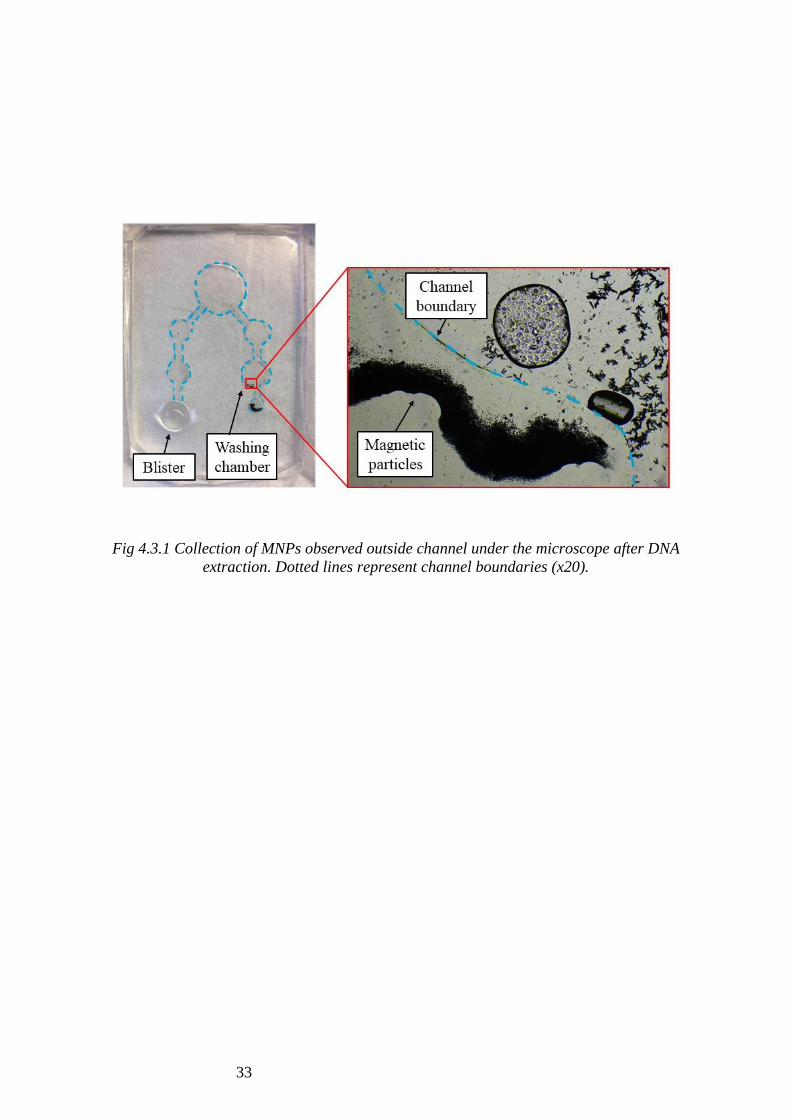
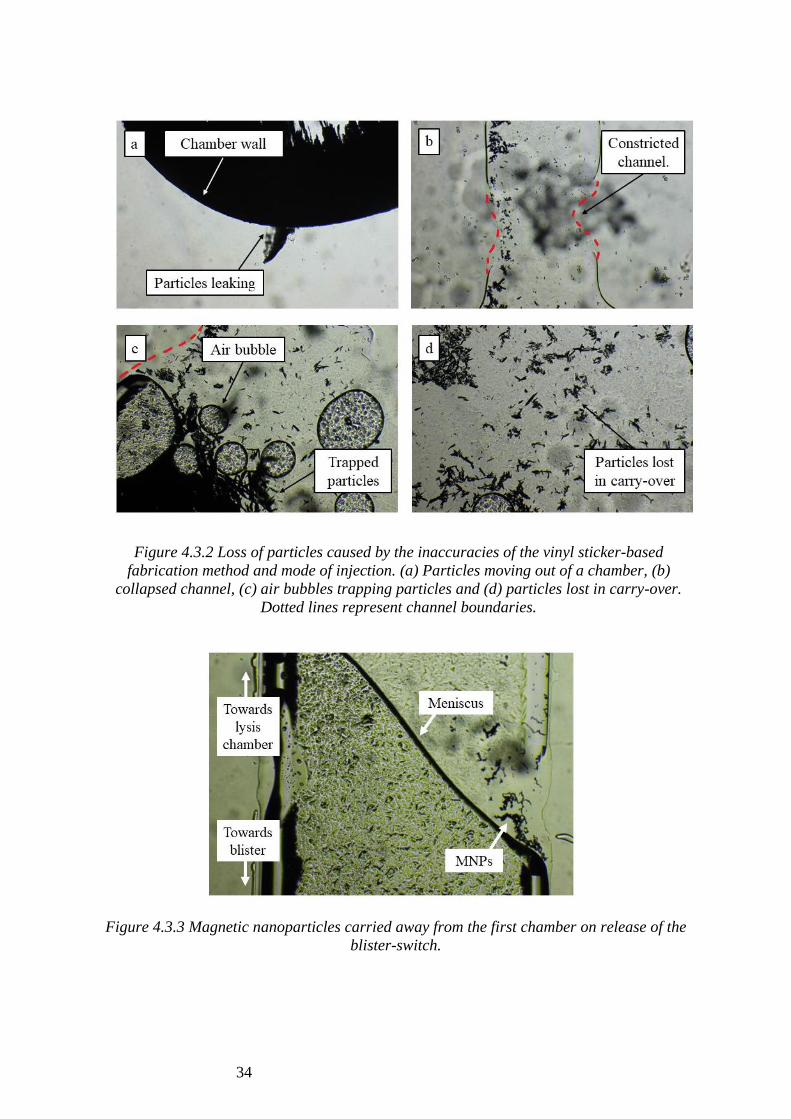
Microscopic images of the chips were taken after DNA extraction (Fig 4.3.1 and 4.3.2)
to better understand the reasons behind low throughput. Fig 4.3.2a shows the leaking of
magnetic nanoparticles (MNPs) out of channel boundaries and Fig 4.3.2c shows MNPs
trapped between air bubbles within the fluid. Constricted channels were identified (Fig
4.3.2b) causing particles to be lost in carry-over between chambers (Fig4.3.2d).
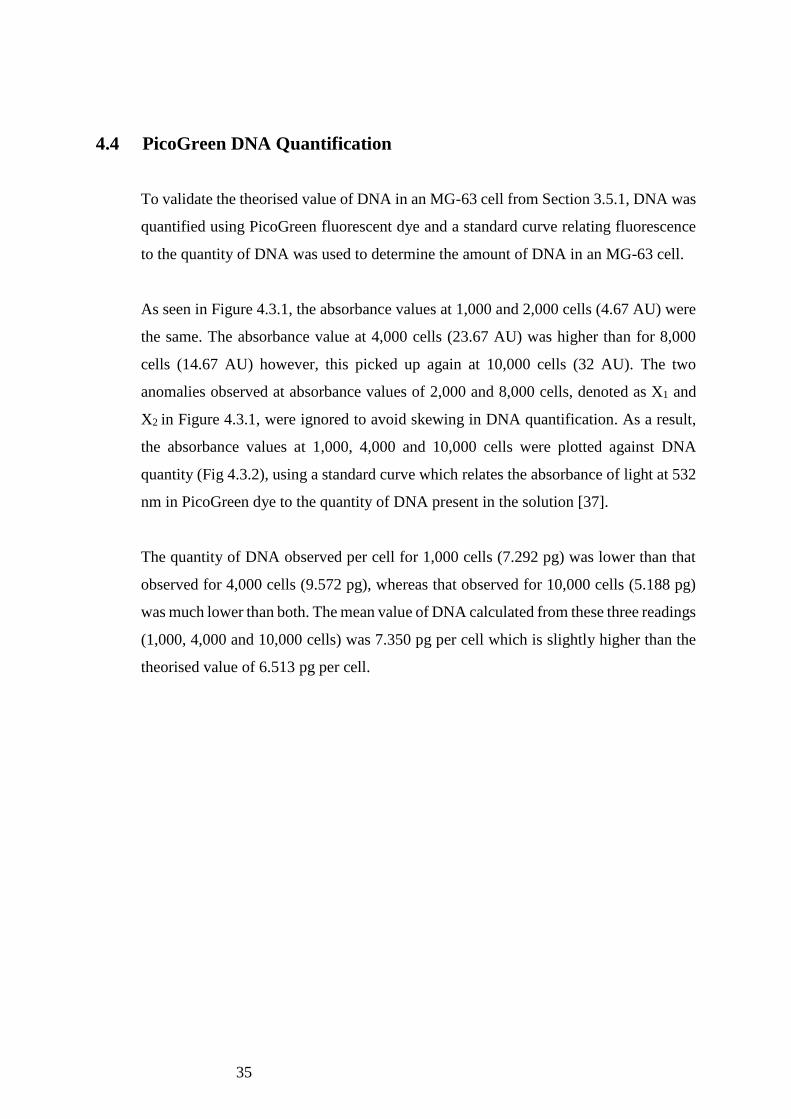
Additionally, backflow of fluid was observed on release of the blister switch due to the
build-up of negative pressure. Figure 4.3.3 shows the fluid meniscus between the first
chamber and the blister switch, where MNPs are observed due to backflow.
Feasibility of bench-top method replication on-a-chip P
erc
enta
ge
thro
ugh
pu
t
Method type
33
Fig 4.3.1 Collection of MNPs observed outside channel under the microscope after DNA
extraction. Dotted lines represent channel boundaries (x20).
34
Figure 4.3.3 Magnetic nanoparticles carried away from the first chamber on release of the
blister-switch.
Figure 4.3.2 Loss of particles caused by the inaccuracies of the vinyl sticker-based
fabrication method and mode of injection. (a) Particles moving out of a chamber, (b)
collapsed channel, (c) air bubbles trapping particles and (d) particles lost in carry-over.
Dotted lines represent channel boundaries.
35
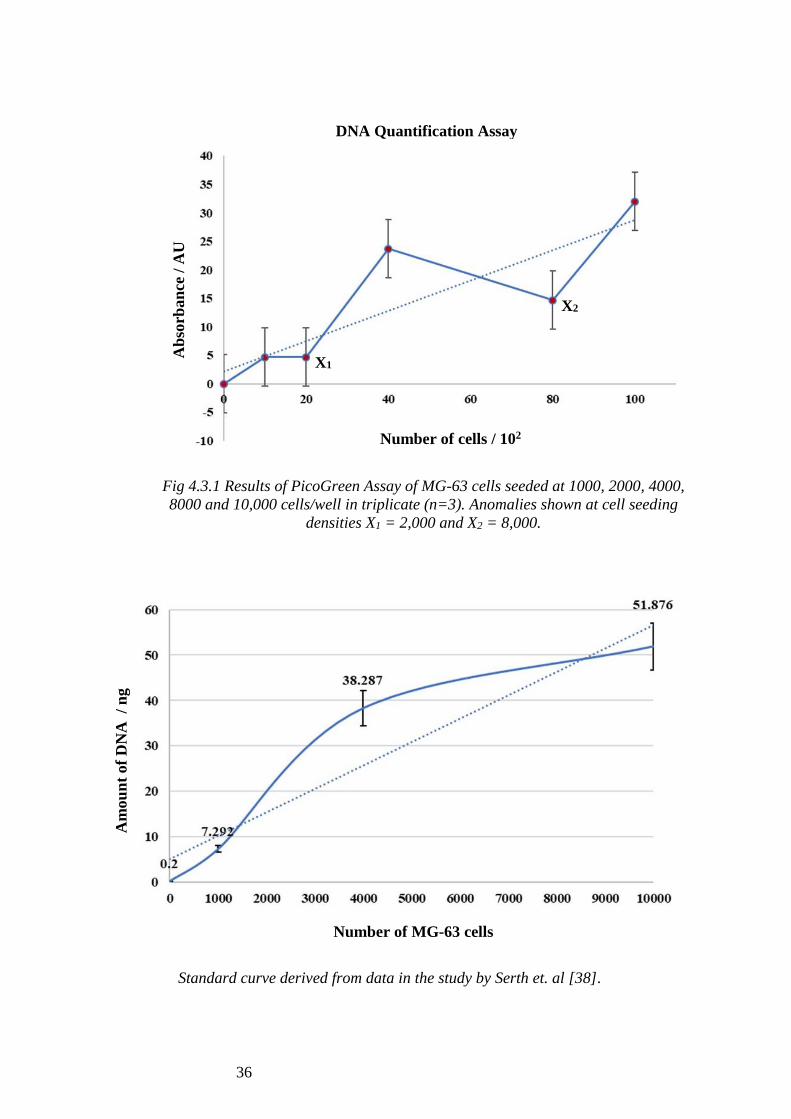
4.4 PicoGreen DNA Quantification
To validate the theorised value of DNA in an MG-63 cell from Section 3.5.1, DNA was
quantified using PicoGreen fluorescent dye and a standard curve relating fluorescence
to the quantity of DNA was used to determine the amount of DNA in an MG-63 cell.
As seen in Figure 4.3.1, the absorbance values at 1,000 and 2,000 cells (4.67 AU) were
the same. The absorbance value at 4,000 cells (23.67 AU) was higher than for 8,000
cells (14.67 AU) however, this picked up again at 10,000 cells (32 AU). The two
anomalies observed at absorbance values of 2,000 and 8,000 cells, denoted as X1 and
X2 in Figure 4.3.1, were ignored to avoid skewing in DNA quantification. As a result,
the absorbance values at 1,000, 4,000 and 10,000 cells were plotted against DNA
quantity (Fig 4.3.2), using a standard curve which relates the absorbance of light at 532
nm in PicoGreen dye to the quantity of DNA present in the solution [37].
The quantity of DNA observed per cell for 1,000 cells (7.292 pg) was lower than that
observed for 4,000 cells (9.572 pg), whereas that observed for 10,000 cells (5.188 pg)
was much lower than both. The mean value of DNA calculated from these three readings
(1,000, 4,000 and 10,000 cells) was 7.350 pg per cell which is slightly higher than the
theorised value of 6.513 pg per cell.
36
Fig 4.3.1 Results of PicoGreen Assay of MG-63 cells seeded at 1000, 2000, 4000,
8000 and 10,000 cells/well in triplicate (n=3). Anomalies shown at cell seeding
densities X1 = 2,000 and X2 = 8,000.
Standard curve derived from data in the study by Serth et. al [38].
DNA Quantification Assay A
mou
nt
of
DN
A /
ng
X1
X2
Number of cells / 102
Number of MG-63 cells
Ab
sorb
an
ce /
AU
37
4.5 Summary of Results
DNA was extracted from MG-63 cells at a low throughput of 0.54% on the bench.
Bench-top DNA extraction resulted in a higher yield of DNA (9.7%) for the spiked
solution, however, MG-63 cells showed a higher throughput on the chip (20.6%). DNA
extraction was replicated on a microfluidic chip with six chambers for lysis, mixing with
MNPs, binding, washing off impurities and elution. A blister-driven switch was added
to the chip to push the cell lysate into the MNP chamber. From here on, a magnet was
used to drive flow. A theoretical value of 6.513 pg DNA was calculated per MG-63 cell,
and this was validated against a standard curve (O’Neill et. al) to give 7.350 pg per cell.
Out of these, method 1 had the highest percentage throughput at 0.54% whereas
methods 2 and 3 were lower at 0.017% and 0.0022% respectively.
Despite multiple efforts to optimise the DNA extraction protocol on the bench –
through increasing cell concentration and elution temperature, reducing elution volume
and spiking the solution with calf thymus DNA – optimisation was not successfully
achieved; however, higher reliability of results was obtained.

38
5. DISCUSSION
5.1 Optimisation of Bench-top Method
The large variance observed between samples of Method 1 (Fig 4.1.1) and the negative
result of Sample 3 (-0.014%) can be attributed to the non-homogenous mixing of the
cell solution prior to aliquoting cells. As anything in suspension of higher molecular
weight sinks to the bottom of the tube, non-homogenous mixtures are easily developed
in procedures with several steps such as DNA extraction. Bienvenue et. al studied
different mixing techniques in homogenizing solutions of sperm cells before DNA
extraction for forensic analysis [55]. This study observed that manual agitation and
inversion techniques led to large deviations (average = 111 ± 53 cells/mL) between
aliquoted cell solutions, whereas high-speed vortexing every 10-15s led to significantly
more homogenous aliquots (average = 90 ± 3 cells/mL) [39]. Mixing via pipette is a
form of manual agitation which may not have effectively homogenised cell solutions
in this study, leading to large variances between samples across Method 1 (0.475%
standard error). Additionally, vigorous mixing by pipette can instil air bubbles, creating
froth within the solution which has shown to trap cells and DNA within the liquid
menisci of bubbles [40] [41]. This is an even greater problem when working with
volumes at the µ-scale as froth can take up a significant volume of the solution, as
shown in Fig 5.1.1.
Figure 5.1.1 Froth developed through vigorous mixing using a pipette.
39
Because of non-homogenous mixing and the loss of DNA through bubbles, there may
not have been sufficient DNA to detect in Sample 3 of Method 1, such that the DNA
concentration may have been lower than the detection limit of the Nanodrop (2 ng/µL),
thus giving an unreliable result of -0.014%.
Additionally, the relatively high percentage throughput seen in samples 1 and 2 of
Method 1 (0.54% and 0.25%) in comparison, could have been overestimated due to the
presence of other molecules that absorb at 260 nm, such as RNA from cell lysate [37].
The Nanodrop spectrophotometer uses Beer’s Law (Equation 2.2) to quantify DNA
concentration from the level of absorbance seen at 260 nm (A260) [57]. As a non-specific
method, spectrophotometric analysis will pick up any molecule that absorbs light at this
wavelength and mask RNA as DNA. An overestimated A260 value will lead to high
A260/280 ratios, as seen for all samples (S1, S2 and S3) across all methods (1, 2 and 3).
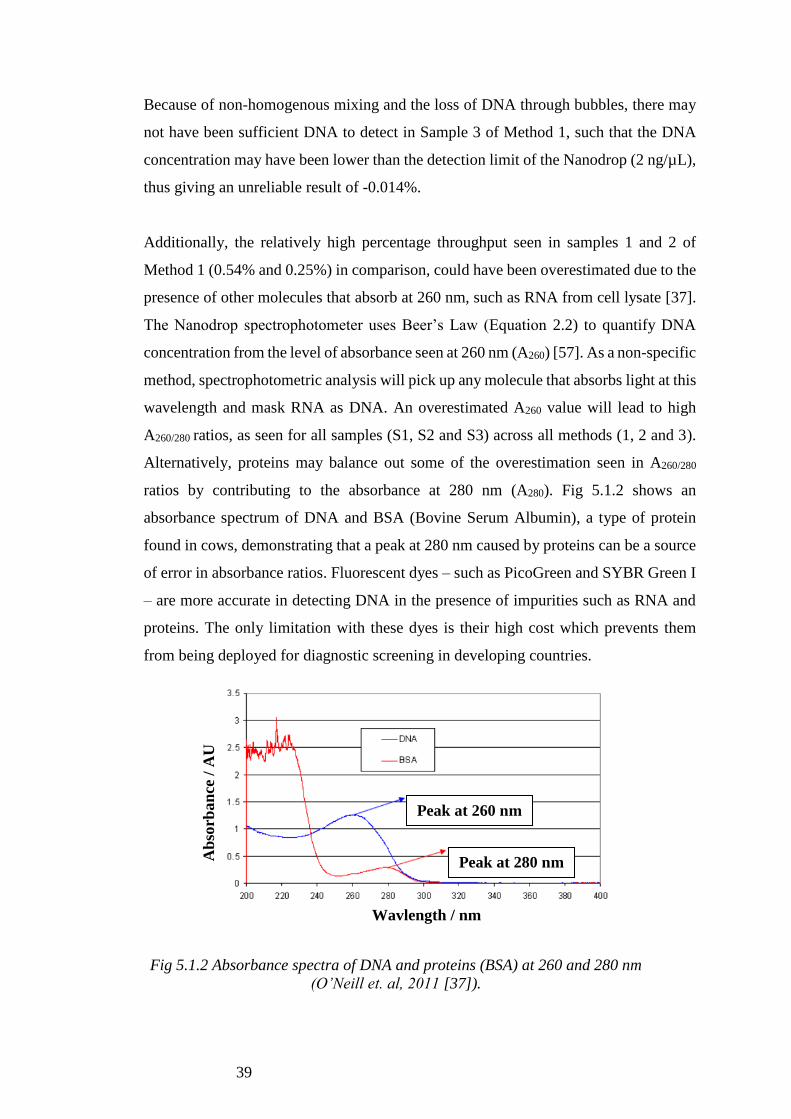
Alternatively, proteins may balance out some of the overestimation seen in A260/280
ratios by contributing to the absorbance at 280 nm (A280). Fig 5.1.2 shows an
absorbance spectrum of DNA and BSA (Bovine Serum Albumin), a type of protein
found in cows, demonstrating that a peak at 280 nm caused by proteins can be a source
of error in absorbance ratios. Fluorescent dyes – such as PicoGreen and SYBR Green I
– are more accurate in detecting DNA in the presence of impurities such as RNA and
proteins. The only limitation with these dyes is their high cost which prevents them
from being deployed for diagnostic screening in developing countries.
Fig 5.1.2 Absorbance spectra of DNA and proteins (BSA) at 260 and 280 nm
(O’Neill et. al, 2011 [37]).
Peak at 260 nm
Peak at 280 nm
Wavlength / nm
Ab
sorb
an
ce /
AU
40
As the percentage throughput decreased quite significantly from Method 1 to 3 (0.54%
to 0.0022%), the objective of optimising the DNA extraction method on the bench top
was not met. However, standard error was reduced from 0.475% in Method 1 to
0.0008% in Method 3, resulting in an increase of the reliability of the method. As DNA
extraction relies quite heavily on laboratory skills, standard error may have seen a
decrease due to practice with the method over time.
Additionally, the concentration of cells was increased by a factor of 100 (see Table
3.1.1) when moving from Method 1 (150 cells/µL) to Method 2 (15,000 cells/µL). To
portray the concentration of white blood cells in whole blood (4,000-10,000 cells/µL)
and neglect the effects of non-homogenous mixing [42], a concentration of 15,000
cells/µL was chosen. However, through the results obtained, it is observed that an
increase in cell concentration did not result in a proportional increase in DNA extraction
which indicates that cells were not completely lysed. In a study testing the efficiency
of bacterial cell lysis of M. smegmatis [43], efficiency was calculated based on the
release of total DNA content. An extraction efficiency of 4.0% was observed when
bacteria were exposed to water at 100°C for 10 mins and 6.6% on heating with Triton-
X. On addition of guanidine hydrochloride to the Triton-X solution, a chaotropic salt
used in commercial lysis buffers such as MagnaMedic’s, extraction efficiency increased
to 7.0%. In comparison to this study, extraction efficiency (also defined as percentage
throughput) observed for MG-63 cells (0.54%) was much lower than expected. It is
also worth noting that procedural errors may have occurred from the manual counting
of cells where studies in the past have shown technicians performing duplicate cell
counts, which means that the actual concentration of cells in solution is less than
expected [44].
Non-specific absorbance is observed at 230 nm by buffer salts left-over from lysis,
binding, washing and elution buffers, which could be a reason behind the low A260/230
ratios observed for samples across all methods [37]. To overcome this, Method 3
incorporated an additional washing step with wash buffer-I to further purify DNA.
However, since Method 3 had the lowest A260/230 ratio (0.02% ± 0.009%) as compared
to Method 1 (0.02% ± 0.009%) and 2 (0.13% ± 0.76%), it was concluded that the
washing step was not effective in removing impurities as desired. Since the magnetic
extraction protocol relies heavily on good pipetting technique, and the complete
41
removal of supernatants containing salts, some error may have been induced due to the
challenges seen with complete removal of supernatants without disturbing the magnetic
beads, especially at volumes of less than 100 µL.
While the effects of reducing elution buffer volume from Method 1 (100 µL) to Method
2 (40 µL) – in an attempt to concentrate the extracted DNA by a factor of 5 from 200
µL cell suspension – did not increase throughput, Method 2 showed less variance
(0.017% ± 0.008%) between samples S1, S2 and S3, as compared to Method 1 (0.54%
± 0.475%). The low percentage throughput of S3 from Method 2 may have come from
the incomplete incubation of the sample at 42°C. Although time was kept using a
stopwatch, there may have been small discrepancies between the incubation times of
the samples due to the limitation of only being able to treat one sample at a time.
The negative percentage throughput (-34.9%) obtained for the 10 ng/µL spiked solution
is not surprising because of the lower detection limit of the Nanodrop-1000
Spectrophotometer (2 ng/µL). If coupled with the standard error (± 6.86 %) caused by
the non-homogenous mixing of DNA prior to aliquoting, it could mean that the actual
concentration of the 10 ng/µL solution is less than 2 ng/µL. This is confirmed by the
positive percentage throughput (20.8%) seen for all samples (S1-6) of the 100 ng/µL
spiked solution. Additionally, the negative A260/230 ratios observed at both
concentrations (10 and 100 ng/µL) may have been caused by the contamination of the
blank solution used to initialise the Nanodrop. If the blank measurement has a higher
absorbance reading at 230 nm than the spiked samples, then this will cause negative
A230 ratios to develop once the blank is subtracted from sample readings. As discussed
previously, the contamination at 230 nm comes from guanidine-derived chaotropic salts
found in the buffers of commercial DNA extraction kits, which contribute to a peak
near 230 nm [45]. Since spiked solutions were pure calf thymus DNA, it is unlikely that
RNA which absorbs at 260 nm, would be present in the sample from the external
environment. Additionally, the A260/280 ratios are positive at both concentrations which
eliminates the risk of contamination coming from proteins at 280 nm. In conclusion, it
can be confirmed that the contamination occurred at 230 nm, creating higher A230 values
for the blank measurement and inherently resulting in negative A260/230 ratios at both
concentrations.
42
The spiked solution of calf thymus indicates an inherent variability between A260/280
ratios and that this is greater than 1.8 for pure DNA, validating the other absorbance
results produced in this study.
5.2 Feasibility of Replication on a Microfluidic Chip
MG-63 cells had a higher percentage throughput on the chips (20.8%) as compared to
on the bench (0.54%). While this was unexpected, it is worth noting that chip-based
results in this study are associated with greater error and the likelihood of
overestimation since a blank reading was not subtracted from absorbance
measurements at 260 nm. While subtracting a blank reading is good practice, it could
not be carried out due to the nature of the chips being one-time-use only. Calf thymus
DNA showed more realistic results where throughput on the bench (20.6%) was more
than double that on the chip (9.7%), however, percentage throughput on the chip is also
associated with error due to the lack of blank reading subtraction.
While both MG-63 and calf thymus results show that it is feasible to replicate the bench-
top DNA extraction method on a chip, it highlights the need for the further optimisation
to achieve better percentage throughput and more reliable results.
Surprisingly, the throughput of MG-63 cells (20.8% ± 10%) achieved on the chip is
higher than that achieved by calf thymus DNA (9.7% ± 5%). Typically, pure DNA
without impurities from the cell lysate, produces greater throughput in extraction
systems as there is less interference from circulating proteins and RNA molecules.
Therefore, RNA would have contributed to the overestimated throughput in MG-63
DNA extraction on the chip where volumes were scaled down by a factor of 40 to fit
within the maximum capacity of each chamber (see Table 3.7.1). The accuracy and
reproducibility of volume addition to the chip were limited by the 0.3 mL insulin
injections (Figure 3.7.1). It was particularly challenging to prevent air bubbles when
ejecting volumes due to the large injection forces exerted. This caused some solutions
to overflow or be forced out of chamber walls, particularly during the addition of the
0.5 µL magnetic nanoparticles (Figure 4.3.2c). Additionally, it was found that a
minimum of 30 µL elution buffer is required for the efficient elution of DNA from the

43
MNPs (based on manufacturer’s instructions, MagnaMedics Diagnostics BV),
however, the maximum capacity of the elution chamber in the current device is only
3.52 µL (See Table 3.7.1) of which 2.5 µL was added to prevent overflow. This may
have been a limitation in achieving a better throughput on the chip and points to the
need for larger chambers or microfluidic reservoirs. Despite the benefits of scaling
down reaction volumes in microfluidics, such as greater sensitivity, less risk of
contamination, lower cost and greater throughput [24], a disadvantage that is often
overlooked at the µ-scale is the faster reaction time, as a result of which reactions may
not achieve completion which would explain why a lower percentage throughput was
observed for calf thymus DNA on the chip than on the bench.
Another contributing factor to lower throughput on the chip was the particle retention
observed between chambers (see Figures 4.3.1, 4.3.2 and 4.3.3) which suggests that
the positively charged silica-coated MNPs are attracted to the negatively charged
PDMS [46], causing DNA-bound to the particles to be lost in transit. While oxygen
plasma treatment – as conducted to bond the PDMS onto the glass slide in Section 3.4.1
– attaches silanol (SiOH) groups to the surface of PDMS, these groups are short-lived
and the surface soon reverts to its native state within 2 hours [47]. Alternatively, PDMS
can be coated with PEG (polyethylene glycol) brushes that help increase the
hydrophilicity of the surface and overcome particle retention [47] [48].
However, there are some limitations in increasing throughput such as the low
manufacturing reproducibility of the microfluidic chips, which points to the need for
more sophisticated methods of microfabrication and an embedded amplification system
such as RT-LAMP (Reverse Transcriptase Loop-mediated Isothermal Amplification).
Additionally, backflow of liquid was created on release of the blister due to negative
pressure build-up which caused loss of particles (Figure 4.3.3). However, this was
overcome by punching a hole in the PDMS between the blister and the first chamber
which was then used to relieve negative pressure and successfully prevent backflow.
44
5.3 DNA Quantification
The C-value is defined as the amount of DNA in picograms present within a haploid
human nucleus. The C-value is dependent on a variety of factors such as polymorphism
and the number of base pairs (bp) within the haploid genome. Each of the four base pairs
– adenine, guanine, cytosine and thymine – have a slightly different weight due to the
variable regions found on the bp. Serth et. al reported a value of 6.57 pg for the diploid
genome after conducting DNA extraction from renal cancer and prostate hyperplasia
cells and quantitating them with PicoGreen [38]. Morton et. al reported a similar C-value
of 3.5 pg for the haploid nucleus, doubling which gives us 7.0 pg per diploid cell [49].
These values are extremely close to the theoretical value achieved in this study (6.513
pg) where the C-value would equal half that approximated, i.e. 3.315 pg.
Additionally, Serth et. al concluded that PicoGreen was an accurate method of DNA
quantitation with the lowest threshold for DNA detection at 120 diploid cells [38]. This
is far from the lowest threshold offered by spectrophotometry, which was 30,000 diploid
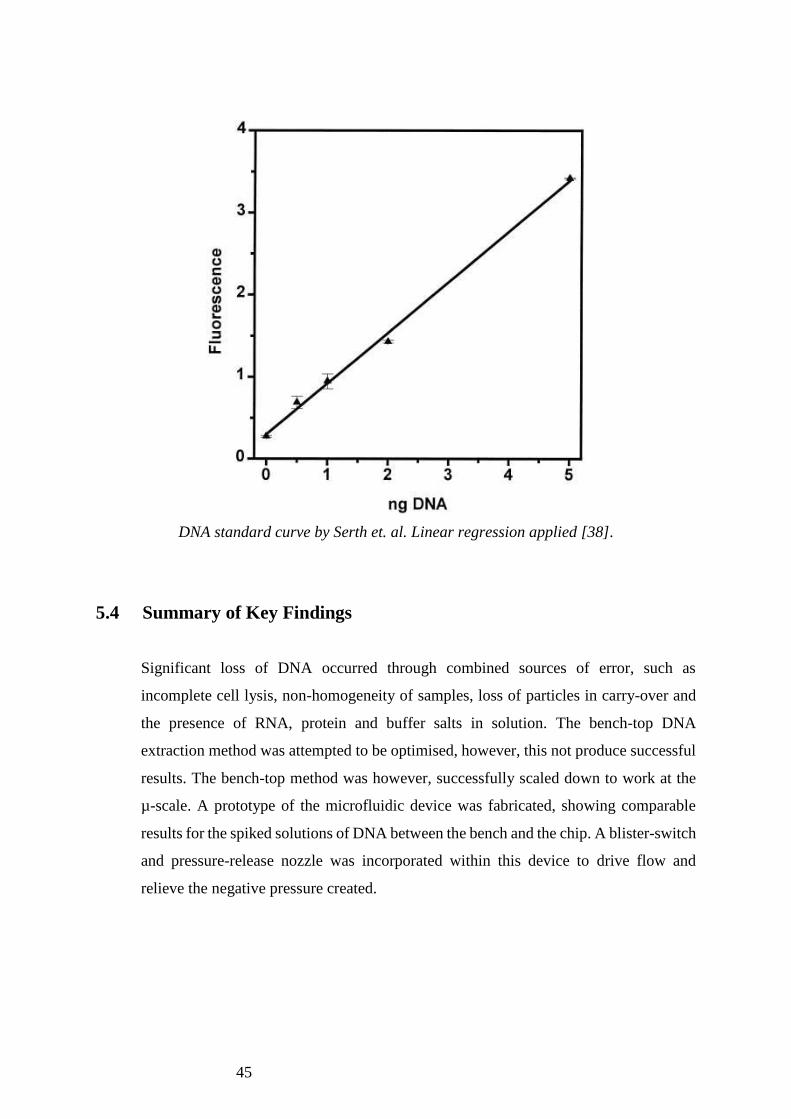
cells in this study. Fig 5.4.1 shows a standard curve relating absorbance to DNA quantity
in ng, derived using PicoGreen analysis in the study by Serth et. al [38]. This curve was
used to quantitate DNA from absorbance readings produced in Section 3.4.1, and to
validate the hypothesis that there is approximately 6.513 pg DNA in an MG-63 cell. The
value of DNA calculated from this standard curve was 7.350 ± 1.27 pg per cell. The
small difference seen between these two values suggests that the theoretical DNA input
used for the calculation of percentage throughput values is relatively reliable.
45
DNA standard curve by Serth et. al. Linear regression applied [38].
5.4 Summary of Key Findings
Significant loss of DNA occurred through combined sources of error, such as
incomplete cell lysis, non-homogeneity of samples, loss of particles in carry-over and
the presence of RNA, protein and buffer salts in solution. The bench-top DNA
extraction method was attempted to be optimised, however, this not produce successful
results. The bench-top method was however, successfully scaled down to work at the
µ-scale. A prototype of the microfluidic device was fabricated, showing comparable
results for the spiked solutions of DNA between the bench and the chip. A blister-switch
and pressure-release nozzle was incorporated within this device to drive flow and
relieve the negative pressure created.
46
5.5 Limitations and Future Development
All percentage throughput values are limited by the theoretical value of DNA in MG-
63 cells that is based on the number of base pairs in the haploid human genome. Despite
having conducted the PicoGreen assay and validated this against a standard curve
created by Serth et. al, there is still some degree of error associated with using a standard
curve made under different laboratory conditions. For more reliable results, a standard
curve should be created alongside test readings to ensure reproducibility. Additionally,
all chip-based measurements of percentage throughput are overestimated due to the lack
of a blank. The reliability of these results is therefore limited and this needs to be re-
conducted with a blank chip to validate obtained results.
While the MG-63 cell line formed a good DNA model for the creation of a prototype
in this study, a more representative model of white blood cells should be used in the
future for the intended diagnostic application. The K-562 or the RS4;11 cell lines could
be used for future development, both of which are both lymphoblast cell lines derived
from leukemia in the bone marrow, or the CA46 cell line, which is a B-lymphocyte
derived from Burkitt’s lymphoma [50] [51] [52]. Using cell morphology as similar in
representation to white blood cells (WBCs) will allow the DNA extraction method to
be optimised for extraction of DENV (Dengue Virus) from WBCs.
As for developing the microfluidic design, there is a need for a more autonomous
system as opposed to a chip that requires subsequent injection of each buffer, especially
as difficulty was faced when injecting samples into chambers. To overcome this, future
versions of the chip could look at incorporating retention burst valves (RBVs) and
trigger valves (TVs) as presented by Safavieh et. al [30]. While a future development
of this device could explore the conjugation of polyethylene glycol (PEG) brushes onto
the PDMS surface to prevent particle retention, another development could be to
replace PDMS with the Flexdym elastomer [53]. Flexdym offers advanced
hydrophilization and bonding performance in microfluidic devices with a faster
microfabrication process, that has not yet been achieved through other materials such
as micro-milling, 3D printing or paper-based microfluidic technologies.
47
Since it was found that non-specific absorption in spectrophotometry induces
inaccuracies in output measurements, particularly for impure DNA, future development
of this method should explore other low-cost read-out methods such as PCR
(Polymerase Chain Reaction).
In the long-term, DENV-specific aptamers could be used to increase the sensitivity of
the device and RT-LAMP could be used to amplify the RNA. Moreover, the
development of this assay should move into the expected concentration range seen for
the Dengue Virus (DENV) in patients (0.32–267,516 PFU eq/mL for DENV-1
infections and 0.30–124,097 PFU eq/mL for DENV-2 infections) so that the required
sensitivity is achieved through optimisation [31].
6. CONCLUSION
This study reports a prototype of a microfluidic device for the magnetic extraction of
DNA from MG-63 cells. Silica-coated magnetic nanoparticles (MNPs) were used to
separate DNA from cell lysate in the presence of chaotropic salts. Optimisation was
attempted for the bench-top extraction method, however, was unsuccessful in
increasing percentage throughput. The bench-top method was scaled down onto a lab-
on-a-chip device, utilising 40X times less reagent than on the bench. The microfluidic
device performed the functions of cell lysis, MNP mixing, binding, washing and eluting
DNA. A theoretical value of DNA content in MG-63 cells (6.513 pg) was proposed
which was validated against results obtained from the PicoGreen assay (7.350 pg).
Percentage throughput of MG-63 cells on the bench was 0.54% and on the chip was
20.6%, both with significant error of ± 10%. The limit of detection observed in this
study was 100 ng/µL DNA on the bench. Future development of this device should
include testing DNA extraction with a more representative model of white blood cells
such as the K-562, RS4;11 or the CA46 cell lines, and coating the PDMS surface of the
chip with PEG (polyethylene glycol) to reduce particle absorption.
48
7. REFERENCES
[1] R. W. Peeling et al., “Evaluation of diagnostic tests: Dengue,” Nat. Rev. Microbiol., vol.
8, no. 12, pp. S30–S38, 2010.
[2] J. M. Heilman, J. De Wolff, G. M. Beards, and B. J. Basden, “Dengue fever: A Wikipedia
clinical review,” Open Med., vol. 8, no. 4, pp. e105–e115, 2014.
[3] E. Widajanti, H. Garna, A. Chairulfatah, and D. Hudaya, “Paediatrica Indonesiana,”
Paediatr. Indones., vol. 49, no. 6, pp. 158–161, 2003.
[4] P. Yager, G. J. Domingo, and J. Gerdes, “Point-of-Care Diagnostics for Global Health,”
Annu. Rev. Biomed. Eng., vol. 10, no. 1, pp. 107–144, 2008.
[5] Iron Oxide Nanoparticles - Nanomaterials,” Sigma-Aldrich. [Online]. Available:
https://www.sigmaaldrich.com/materials-science/material-science-
products.html?TablePage=119470654. [Accessed: 25-Apr-2018].
[6] L. de Bruin, “MagSi-DNA,” MagnaMedics. [Online]. Available:
http://www.magnamedics.com/index.php/magsi-dna. [Accessed: 25-Apr-2018].
[7] Kapelan Media, “SiMAG - affinity,” SIMAG Affinity : Magnetic nano and micro
particles by chemicell, 06-Jan-2007. [Online]. Available:
http://www.chemicell.com/products/microparticles/simag-affinity/index.html.
[Accessed: 25-Apr-2018].
[8] S. C. Tan and B. C. Yiap, “DNA, RNA, and protein extraction: The past and the present,”
J. Biomed. Biotechnol., vol. 2009, 2009.
[9] R. Dahm, “Discovering DNA: Friedrich Miescher and the early years of nucleic acid
research,” Hum. Genet., vol. 122, no. 6, pp. 565–581, 2008.
49
[10] M. B. Johns and J. E. Paulus-Thomas, “Purification of human genomic DNA from
whole blood using sodium perchlorate in place of phenol.,” Anal. Biochem., vol. 180,
no. 2, pp. 276–8, 1989.
[11] “Phenol/chloroform extraction,” Phenol/chloroform extraction - OpenWetWare.
[Online]. Available: https://openwetware.org/wiki/Phenol/chloroform_extraction.
[Accessed: 29-Apr-2018].
[12] “Dynabeads™ MyOne™ Silane,” Dynabeads MyOne Silane - Thermo Fisher
Scientific. [Online]. Available:
https://www.thermofisher.com/order/catalog/product/37002D?SID=srch-srp-37002D.
[Accessed: 29-Apr-2018].
[13] L. de Bruin, “MagSi-DNA,” MagnaMedics. [Online]. Available:
http://www.magnamedics.com/index.php/magsi-dna. [Accessed: 29-Apr-2018].
[14] Kapelan Media, “SiMAG-DNA,” SIMAG MPDNA : Magnetic nano and micro
particles, 06-Apr-2007. [Online]. Available:
http://www.chemicell.com/products/microparticles/simag-mpdna/index.html.
[Accessed: 29-Apr-2018].
[15] Yang D.Y, Waye J.S, Dudar J.C, and Saunders S.R, “Technical note : improved DNA
extraction from ancient bone using silica-based spin columns.,” Am J Phys Anthr.,
vol. 105, no. 4, pp. 539–543, 1998.
[16] C. Katevatis, A. Fan, and C. M. Klapperich, “Low concentration DNA extraction and
recovery using a silica solid phase,” PLoS One, vol. 12, no. 5, pp. 1–14, 2017.
[17] M. Wierucka and M. Biziuk, “Application of Magnetic Nanoparticles for Magnetic
Solid-Phase Extraction in Preparing Biological, Environmental and Food
Samples,” ChemInform, vol. 46, no. 2, 2014.

50
[18] Z. M. Saiyed, C. N. Ramchand, and S. D. Telang, “Isolation of genomic DNA using
magnetic nanoparticles as a solid-phase support,” J. Phys. Condens. Matter, vol. 20,
no. 20, 2008.
[19] J. H. Min et al., “Isolation of DNA using magnetic nanoparticles coated with
dimercaptosuccinic acid,” Anal. Biochem., vol. 447, no. 1, pp. 114–118, 2014.
[20] Promega, “Calculating Nucleic Acid or Protein Concentration Using the GloMax®
Multi+ Microplate Instrument,” Promega, pp. 1–6, 2009.
[21] “NanoDrop: How It Works,” NanoDrop: How it works | Thermo Fisher Scientific.
[Online]. Available:
https://www.thermofisher.com/us/en/home/industrial/spectroscopy-elemental-isotope-
analysis/molecular-spectroscopy/ultraviolet-visible-visible-spectrophotometry-uv-vis-
vis/uv-vis-vis-instruments/nanodrop-microvolume-spectrophotometers/nanodrop-
products-guide/nanodrop-how-it-works.html. [Accessed: 30-Apr-2018].
[22] “Quant-iT PicoGreen dsDNA Assay Kit,” Thermo Fisher Scientific. [Online].
Available: https://www.thermofisher.com/order/catalog/product/P7589. [Accessed:
08-May-2018].
[23] R. Chand and S. Neethirajan, “Microfluidic platform integrated with graphene-gold
nano-composite aptasensor for one-step detection of norovirus,” Biosens.
Bioelectron., vol. 98, no. May, pp. 47–53, 2017.
[24] C. Toumazou et al., “Simultaneous DNA amplification and detection using a pH-
sensing semiconductor system,” Nat. Methods, vol. 10, no. 7, pp. 641–646, 2013.
[25] Y. Cho, J. Lee, J. Park, B. Lee, Y. Lee, and C. Ko, “One-step pathogen specific DNA
extraction from whole blood on acentrifugal microfluidic device,” Lab Chip, vol. 7, p.
565, 2007.
51
[26] J. W. Hong, V. Studer, G. Hang, W. F. Anderson, and S. R. Quake, “A nanoliter-scale
nucleic acid processor with parallel architecture,” Nat. Biotechnol., vol. 22, no. 4, pp.
435–439, 2004.
[27] I. Iranmanesh, M. Ohlin, H. Ramachandraiah, S. Ye, A. Russom, and M. Wiklund,
“Acoustic micro-vortexing of fluids, particles and cells in disposable microfluidic
chips,” Biomed. Microdevices, vol. 18, no. 4, pp. 1–7, 2016.
[28] M. Rodrigues et al., “Characterization of Passive and Active Microfluidic Devices
Manufactured in LTCC Technology,” Techniques, pp. 27–29, 2006.
[29] E. A. Schilling, A. E. Kamholz, and P. Yager, “Cell lysis and protein extraction in a
microfluidic device with detection by a fluorogenic enzyme assay,” Anal. Chem., vol.
74, no. 8, pp. 1798–1804, 2002.
[30] R. Safavieh and D. Juncker, “Capillarics: pre-programmed, self-powered microfluidic
circuits built from capillary elements,” Lab Chip, vol. 13, no. 21, p. 4180, 2013.
[31] S. I. De La Cruz-Hernández et al., “Determination of viremia and concentration of
circulating nonstructural protein 1 in patients infected with dengue virus in Mexico,”
Am. J. Trop. Med. Hyg., vol. 88, no. 3, pp. 446–454, 2013.
[32] “LABORATORIES | HOSPITALS – Virology,” Biosynex. [Online]. Available:
https://www.biosynex.com/en/laboratories-hospitals-virology/. [Accessed: 25-Apr-
2018].
[33] “SD Dengue IgG Capture ELISA,” SD BIOLINE Dengue IgG capture ELISA - Alere is
now Abbott. [Online]. Available: https://www.alere.com/en/home/product-details/sd-
bioline-dengue-IgG-capture-elisa.html. [Accessed: 25-Apr-2018].
[34] “Dengue NS1 Ag Strip #70700,” Dengue NS1 Ag Strip #70700 | Clinical Diagnostics
Bio-Rad. [Online]. Available: http://www.bio-rad.com/en-uk/sku/70700-dengue-ns1-
ag-strip?ID=70700. [Accessed: 25-Apr-2018].
52
[35] R. A. Martinez-Vega, F. A. Diaz-Quijano, C. Coronel-Ruiz, S. Yebrail Gomez, and L.
A. Villar-Centeno, “[Evaluation of PANBIO rapid immunochromatographic cassette
for dengue diagnosis in a Colombian endemic area],” Biomedica, vol. 29, no.
December, pp. 616–624, 2009.
[36] S. D. Blacksell et al., “Evaluation of six commercial point-of-care tests for diagnosis
of acute dengue infections: The need for combining NS1 antigen and IgM/IgG antibody
detection to achieve acceptable levels of accuracy,” Clin. Vaccine Immunol., vol. 18,
no. 12, pp. 2095–2101, 2011.
[37] M. O’Neill, J. McPartlin, K. Arthure, S. Riedel, and N. D. McMillan, “Comparison of
the TLDA with the nanodrop and the reference qubit system,” J. Phys. Conf. Ser., vol.
307, no. 1, 2011.
[38] J. Serth, M. A. Kuczyk, U. Paeslack, R. Lichtinghagen, and U. Jonas, “Quantitation of
DNA extracted after micropreparation of cells from frozen and formalin-fixed tissue
sections,” Am. J. Pathol., vol. 156, no. 4, pp. 1189–1196, 2000.
[39] D. N. Miller, J. E. Bryant, E. L. Madsen, and M. E. T. Al, “Evaluation and Optimization
of DNA Extraction and Purification Procedures for Soil and Sediment Samples,” vol.
65, no. 11, pp. 4715–4724, 1999.
[40] “Extracting DNA from living things | Nuffield Foundation,” The truth behind SEN
statements in mainstream primary schools | Nuffield Foundation. [Online]. Available:
http://www.nuffieldfoundation.org/practical-biology/extracting-dna-living-things.
[Accessed: 07-May-2018].
[41] “DNA Extraction from Serum,” Thermo Fisher Scientific. [Online]. Available:
https://www.thermofisher.com/us/en/home/references/protocols/nucleic-acid-
purification-and-analysis/dna-extraction-protocols/dna-extraction-from-serum.html.
[Accessed: 07-May-2018].
[42] M. Blumenreich, “The white blood cell and differential count,” Clin. Methods Hist.
Phys. Lab. Exam. 3rd Ed., pp. 724–727, 1990.

53
[43] O. M. De Bruin and H. C. Birnboim, “A method for assessing efficiency of bacterial
cell disruption and DNA release,” BMC Microbiol., vol. 16, no. 1, pp. 1–10, 2016.
[44] B. Freund, M., & Carol, “Factors affecting haemocytometer counts of sperm
concentration in human semen. Journal of reproduction and fertility,” J. Reprod. Fertil.,
vol. 8, no. 2, pp. 149–155, 1964.
[45] P. Desjardins and D. Conklin, “NanoDrop Microvolume Quantitation of Nucleic Acids
2 . High-Sensitivity Microvolume Nucleic Acid Quantitation Using the NanoDrop
3300,” Jove, no. November, pp. 1–4, 2010.
[46] A. R. Wheeler and R. N. Zare, “Short communication Electroosmotic flow in a
poly(dimethylsiloxane),” pp. 1120–1124, 2004.
[47] H. P. Long, C. C. Lai, and C. K. Chung, “Polyethylene glycol coating for hydrophilicity
enhancement of polydimethylsiloxane self-driven microfluidic chip,” Surf. Coatings
Technol., vol. 320, pp. 315–319, 2017.
[48] I. Wong and C. M. Ho, “Surface molecular property modifications for
poly(dimethylsiloxane) (PDMS) based microfluidic devices,” Microfluid.
Nanofluidics, vol. 7, no. 3, pp. 291–306, 2009.
[49] N. E. Morton, “Parameters of the human genome.,” Proc. Natl. Acad. Sci. U. S. A., vol.
88, no. 17, pp. 7474–7476, 1991.
[50] “CA46 (ATCC® CRL-1648™),” CA46 ATCC ® CRL-1648™ Homo sapiens Burkitt's
lymphoma. [Online]. Available: https://www.lgcstandards-atcc.org/Products/All/CRL-
1648.aspx?geo_country=gb#generalinformation. [Accessed: 04-May-2018].
[51] “K-562 (ATCC® CCL-243™),” CA46 ATCC ® CRL-1648™ Homo sapiens Burkitt's
lymphoma. [Online]. Available: https://www.lgcstandards-atcc.org/products/all/CCL-
243.aspx?geo_country=gb#generalinformation. [Accessed: 04-May-2018].
54
[52] “RS4;11 (ATCC® CRL-1873™),” CA46 ATCC ® CRL-1648™ Homo sapiens
Burkitt's lymphoma. [Online]. Available: https://www.lgcstandards-
atcc.org/Products/All/CRL-1873.aspx?geo_country=gb. [Accessed: 04-May-2018].
[53] J. Lachaux et al., “Thermoplastic elastomer with advanced hydrophilization and
bonding performances for rapid (30 s) and easy molding of microfluidic devices,” Lab
Chip, vol. 17, no. 15, pp. 2581–2594, 2017.
[54] R. Geuther, “A. L. LEHNINGER, Biochemistry. The Molecular Basis of Cell Structure
and Function (2nd Edition). 1104 S., zahlr. Abb., zahlr. Tab. New York 1975. Worth
Publ. Inc. $ 17.50,” Z. Allg. Mikrobiol., vol. 17, no. 1, pp. 86–87, 2007.
[55] J. M. Bienvenue, N. Duncalf, D. Marchiarullo, J. P. Ferrance, and J. P. Landers,
“Microchip-based cell lysis and DNA extraction from sperm cells for application to
forensic analysis,” J. Forensic Sci., vol. 51, no. 2, pp. 266–273, 2006.
[56] P. Saxena, P. K. Dash, S. R. Santhosh, A. Shrivastava, M. Parida, and P. L. Rao,
“Development and evaluation of one step single tube multiplex RT-PCR for rapid
detection and typing of dengue viruses.,” Virol. J., vol. 5, p. 20, 2008.
[57] Jim Clark, “the Beer-Lambert Law,” vol. 39, no. 7, pp. 333–335, 2016.
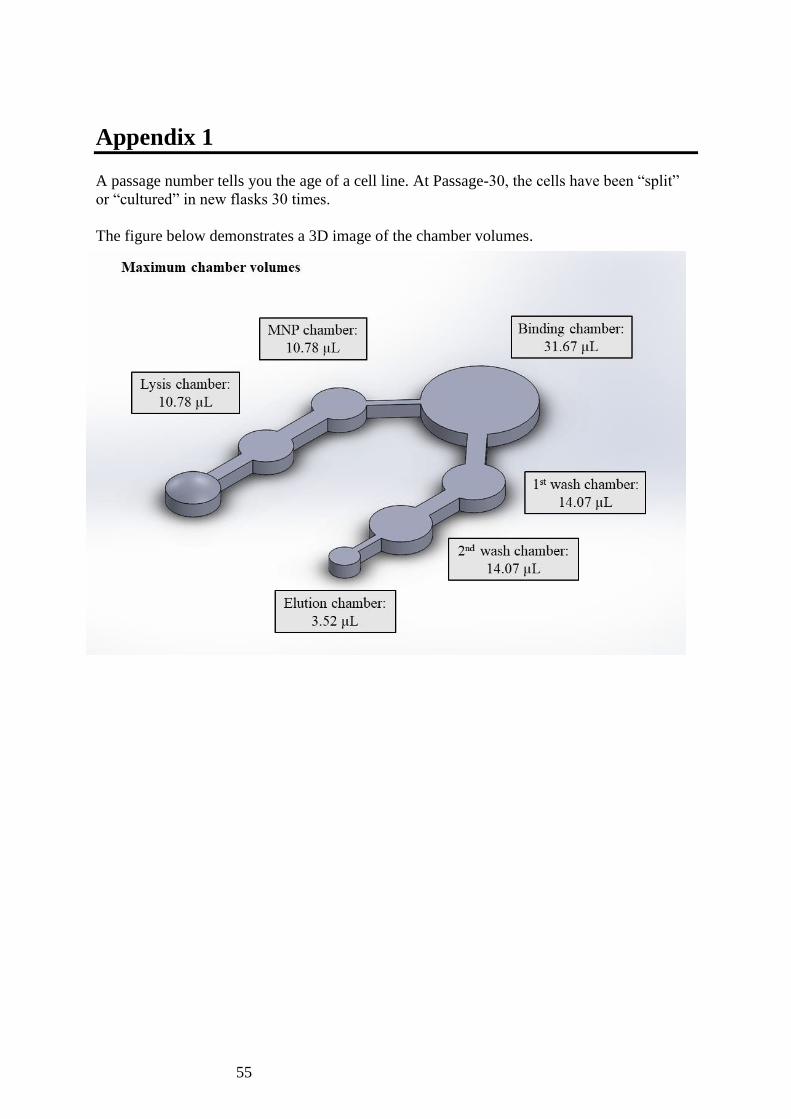
55
Appendix 1
A passage number tells you the age of a cell line. At Passage-30, the cells have been “split”
or “cultured” in new flasks 30 times.
The figure below demonstrates a 3D image of the chamber volumes.