deq.utah.gov · middle bear river and cutler reservoir final tmdls february 2010 i utah department...
TRANSCRIPT
February 2010

Middle Bear River and Cutler Reservoir Final TMDLs February 2010
i
Utah Department of Environmental Quality
Division of Water Quality TMDL Section
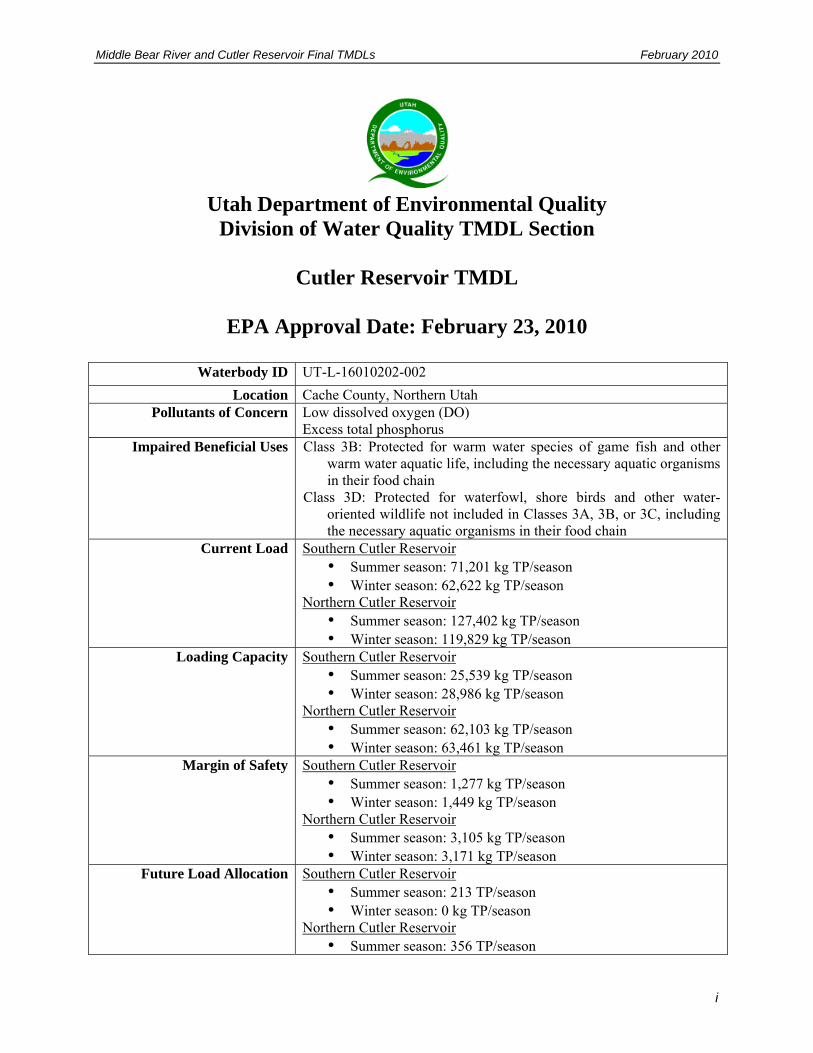
Cutler Reservoir TMDL
EPA Approval Date: February 23, 2010
Waterbody ID UT-L-16010202-002
Location Cache County, Northern UtahPollutants of Concern Low dissolved oxygen (DO)
Excess total phosphorusImpaired Beneficial Uses Class 3B: Protected for warm water species of game fish and other
warm water aquatic life, including the necessary aquatic organisms in their food chain
Class 3D: Protected for waterfowl, shore birds and other water-oriented wildlife not included in Classes 3A, 3B, or 3C, including the necessary aquatic organisms in their food chain
Current Load Southern Cutler Reservoir• Summer season: 71,201 kg TP/season • Winter season: 62,622 kg TP/season
Northern Cutler Reservoir • Summer season: 127,402 kg TP/season • Winter season: 119,829 kg TP/season
Loading Capacity Southern Cutler Reservoir• Summer season: 25,539 kg TP/season • Winter season: 28,986 kg TP/season
Northern Cutler Reservoir • Summer season: 62,103 kg TP/season • Winter season: 63,461 kg TP/season
Margin of Safety Southern Cutler Reservoir• Summer season: 1,277 kg TP/season • Winter season: 1,449 kg TP/season
Northern Cutler Reservoir • Summer season: 3,105 kg TP/season • Winter season: 3,171 kg TP/season
Future Load Allocation Southern Cutler Reservoir• Summer season: 213 TP/season • Winter season: 0 kg TP/season
Northern Cutler Reservoir • Summer season: 356 TP/season

Middle Bear River and Cutler Reservoir Final TMDLs February 2010
ii
• Winter season: 0 kg TP/season Load Allocations (WLAs +
LAs) Carried over from Existing TMDLs
Southern Cutler Reservoir• Summer season: 3,121 kg TP/season • Winter season: 2,877 kg TP/season
Northern Cutler Reservoir • Summer season: 23,603 kg TP/season • Winter season: 21,426 kg TP/season
New WLA Identified for Cutler Reservoir TMDL
Southern Cutler Reservoir• Summer season: 4,807 kg TP/season • Winter season: 12,569 kg TP/season
Northern Cutler Reservoir • Summer season: 5,063 kg TP/season • Winter season: 13,151 kg TP/season
New Load Allocation (LA) Identified for Cutler Reservoir
TMDL
Southern Cutler Reservoir• Summer season: 16,121 kg TP/season • Winter season: 12,091 kg TP/season
Northern Cutler Reservoir • Summer season: 29,976 kg TP/season • Winter season: 25,713 kg TP/season
Defined Targets/Endpoints Dissolved Oxygen (DO) • 1-day min DO of 3.0 mg/L throughout the water column • 7-day average DO to be maintained above 4.0 mg/L • 30-day average DO to be maintained above 5.5 mg/L
Total Phosphorus • Total phosphorus concentration of no more than 0.075 mg/L at
Cutler Dam outfall throughout the year • Mean seasonal (May–October) total phosphorus concentration
of less than 0.07 mg/L in the Northern Reservoir • Mean seasonal (May–October) total phosphorus concentration
of less than 0.09 mg/L in the Southern Reservoir Watershed Nonpoint Sources Canal discharge and return flow from lands irrigated with municipal
WWTP effluent Stormwater runoff On-site wastewater treatment systems (septic systems) Animal feeding operations and confined animal feeding operations Runoff from agricultural and pasture lands Cattle in streams, riparian areas, and reservoir shoreline Runoff from forested lands Runoff form rangelands Seasonal internal reservoir sources Pipes discharging into Cutler Reservoir and tributaries Stream erosion and reservoir shoreline erosion Natural background sources
Regulated Point Sources Newly Addressed in Cutler
Reservoir TMDL
Logan Regional Wastewater Treatment PlantFisheries Experiment Station
Middle Bear River and Cutler Reservoir Final TMDLs February 2010
iii
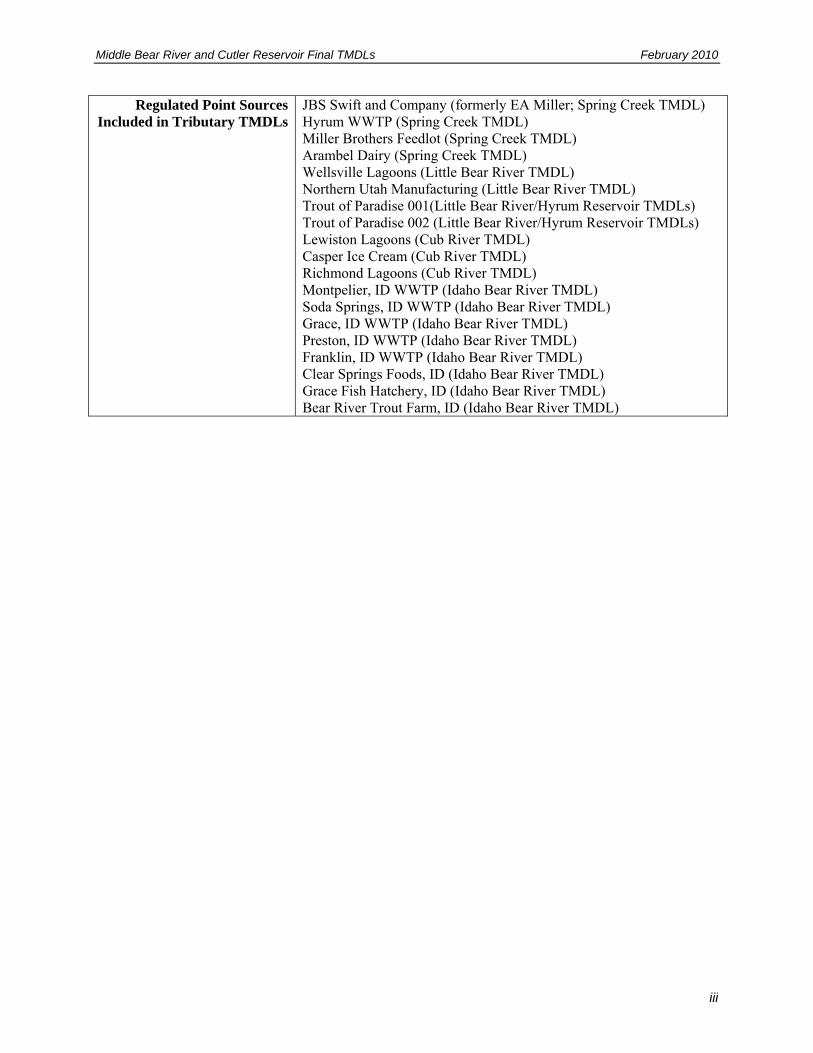
Regulated Point Sources Included in Tributary TMDLs
JBS Swift and Company (formerly EA Miller; Spring Creek TMDL)Hyrum WWTP (Spring Creek TMDL) Miller Brothers Feedlot (Spring Creek TMDL) Arambel Dairy (Spring Creek TMDL) Wellsville Lagoons (Little Bear River TMDL) Northern Utah Manufacturing (Little Bear River TMDL) Trout of Paradise 001(Little Bear River/Hyrum Reservoir TMDLs) Trout of Paradise 002 (Little Bear River/Hyrum Reservoir TMDLs) Lewiston Lagoons (Cub River TMDL) Casper Ice Cream (Cub River TMDL) Richmond Lagoons (Cub River TMDL) Montpelier, ID WWTP (Idaho Bear River TMDL) Soda Springs, ID WWTP (Idaho Bear River TMDL) Grace, ID WWTP (Idaho Bear River TMDL) Preston, ID WWTP (Idaho Bear River TMDL) Franklin, ID WWTP (Idaho Bear River TMDL) Clear Springs Foods, ID (Idaho Bear River TMDL) Grace Fish Hatchery, ID (Idaho Bear River TMDL) Bear River Trout Farm, ID (Idaho Bear River TMDL)

Middle Bear River and Cutler Reservoir Final TMDLs February 2010
iv
This page intentionally blank.
Middle Bear River and Cutler Reservoir Final TMDLs February 2010
v
Utah Department of Environmental Quality
Division of Water Quality TMDL Section
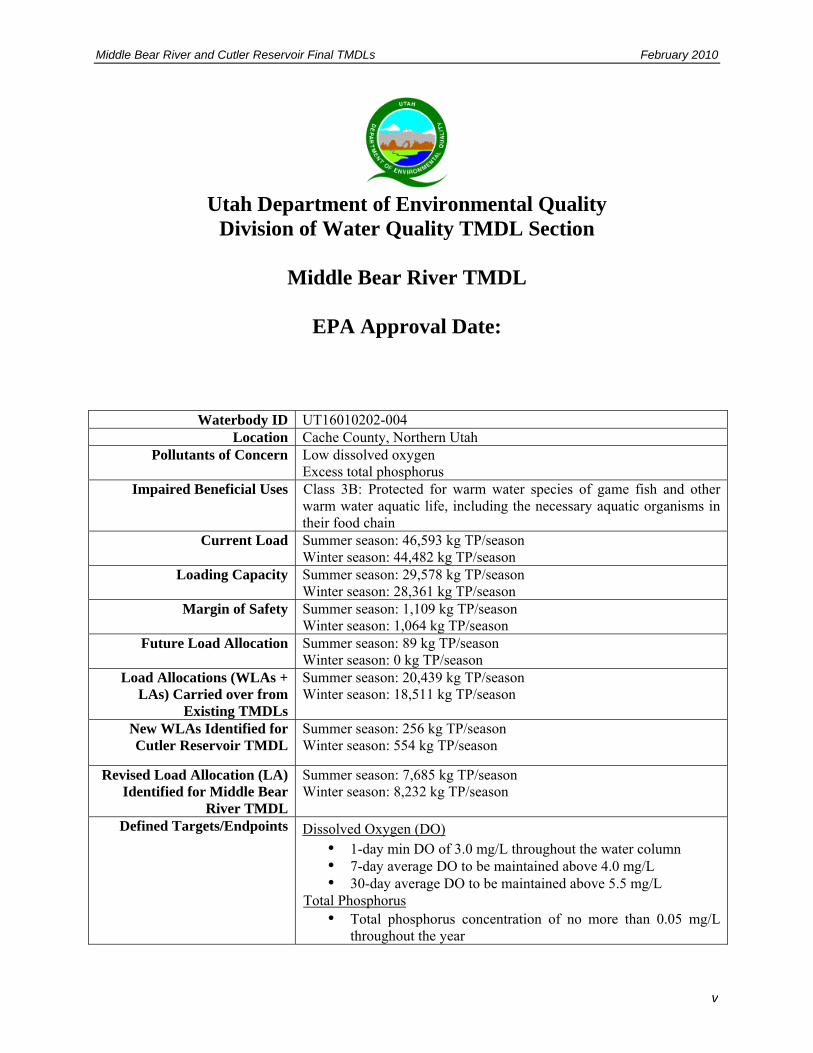
Middle Bear River TMDL
EPA Approval Date:
Waterbody ID UT16010202-004Location Cache County, Northern Utah
Pollutants of Concern Low dissolved oxygenExcess total phosphorus
Impaired Beneficial Uses Class 3B: Protected for warm water species of game fish and other warm water aquatic life, including the necessary aquatic organisms in their food chain
Current Load Summer season: 46,593 kg TP/seasonWinter season: 44,482 kg TP/season
Loading Capacity Summer season: 29,578 kg TP/seasonWinter season: 28,361 kg TP/season
Margin of Safety Summer season: 1,109 kg TP/seasonWinter season: 1,064 kg TP/season
Future Load Allocation Summer season: 89 kg TP/seasonWinter season: 0 kg TP/season
Load Allocations (WLAs + LAs) Carried over from
Existing TMDLs
Summer season: 20,439 kg TP/seasonWinter season: 18,511 kg TP/season
New WLAs Identified for Cutler Reservoir TMDL
Summer season: 256 kg TP/seasonWinter season: 554 kg TP/season
Revised Load Allocation (LA) Identified for Middle Bear
River TMDL
Summer season: 7,685 kg TP/seasonWinter season: 8,232 kg TP/season
Defined Targets/Endpoints Dissolved Oxygen (DO) • 1-day min DO of 3.0 mg/L throughout the water column • 7-day average DO to be maintained above 4.0 mg/L • 30-day average DO to be maintained above 5.5 mg/L
Total Phosphorus • Total phosphorus concentration of no more than 0.05 mg/L
throughout the year
Middle Bear River and Cutler Reservoir Final TMDLs February 2010
vi
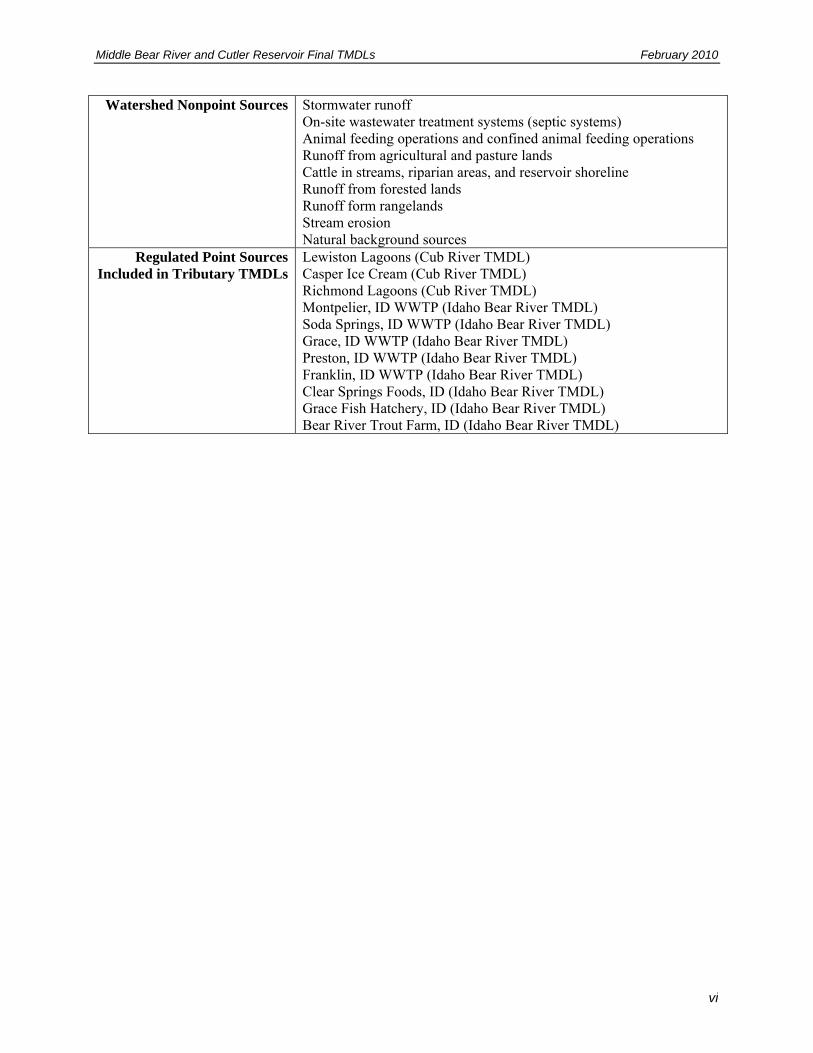
Watershed Nonpoint Sources Stormwater runoffOn-site wastewater treatment systems (septic systems) Animal feeding operations and confined animal feeding operations Runoff from agricultural and pasture lands Cattle in streams, riparian areas, and reservoir shoreline Runoff from forested lands Runoff form rangelands Stream erosion Natural background sources
Regulated Point Sources Included in Tributary TMDLs
Lewiston Lagoons (Cub River TMDL)Casper Ice Cream (Cub River TMDL) Richmond Lagoons (Cub River TMDL) Montpelier, ID WWTP (Idaho Bear River TMDL) Soda Springs, ID WWTP (Idaho Bear River TMDL) Grace, ID WWTP (Idaho Bear River TMDL) Preston, ID WWTP (Idaho Bear River TMDL) Franklin, ID WWTP (Idaho Bear River TMDL) Clear Springs Foods, ID (Idaho Bear River TMDL) Grace Fish Hatchery, ID (Idaho Bear River TMDL) Bear River Trout Farm, ID (Idaho Bear River TMDL)
Middle Bear River and Cutler Reservoir Final TMDLs February 2010
vii
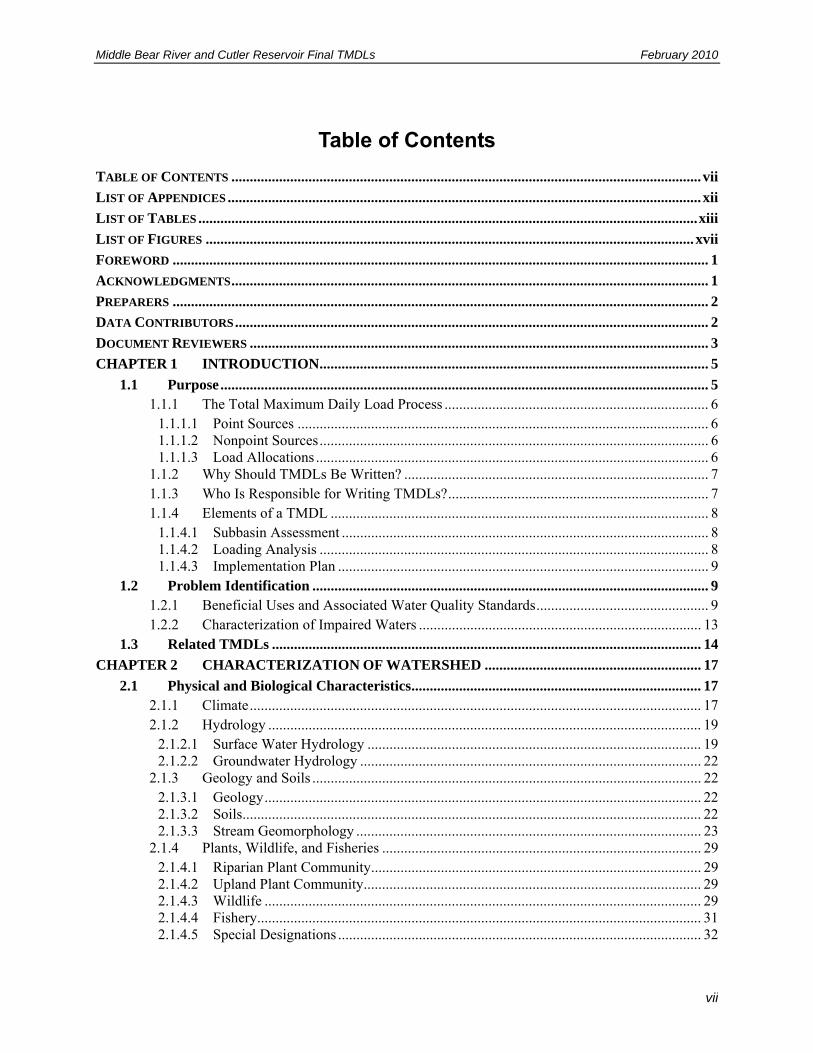
Table of Contents
TABLE OF CONTENTS ................................................................................................................................ vii
LIST OF APPENDICES ................................................................................................................................. xii
LIST OF TABLES ........................................................................................................................................ xiii
LIST OF FIGURES ..................................................................................................................................... xvii
FOREWORD .................................................................................................................................................. 1
ACKNOWLEDGMENTS .................................................................................................................................. 1
PREPARERS .................................................................................................................................................. 2
DATA CONTRIBUTORS ................................................................................................................................. 2
DOCUMENT REVIEWERS ............................................................................................................................. 3
CHAPTER 1 INTRODUCTION .......................................................................................................... 5
1.1 Purpose ..................................................................................................................................... 5 1.1.1 The Total Maximum Daily Load Process ........................................................................ 6
1.1.1.1 Point Sources ................................................................................................................ 6 1.1.1.2 Nonpoint Sources .......................................................................................................... 6 1.1.1.3 Load Allocations ........................................................................................................... 6
1.1.2 Why Should TMDLs Be Written? ................................................................................... 7 1.1.3 Who Is Responsible for Writing TMDLs? ....................................................................... 7 1.1.4 Elements of a TMDL ....................................................................................................... 8
1.1.4.1 Subbasin Assessment .................................................................................................... 8 1.1.4.2 Loading Analysis .......................................................................................................... 8 1.1.4.3 Implementation Plan ..................................................................................................... 9
1.2 Problem Identification ............................................................................................................ 9 1.2.1 Beneficial Uses and Associated Water Quality Standards ............................................... 9 1.2.2 Characterization of Impaired Waters ............................................................................. 13
1.3 Related TMDLs ..................................................................................................................... 14
CHAPTER 2 CHARACTERIZATION OF WATERSHED ........................................................... 17
2.1 Physical and Biological Characteristics ............................................................................... 17 2.1.1 Climate ........................................................................................................................... 17 2.1.2 Hydrology ...................................................................................................................... 19
2.1.2.1 Surface Water Hydrology ........................................................................................... 19 2.1.2.2 Groundwater Hydrology ............................................................................................. 22
2.1.3 Geology and Soils .......................................................................................................... 22 2.1.3.1 Geology ....................................................................................................................... 22 2.1.3.2 Soils ............................................................................................................................. 22 2.1.3.3 Stream Geomorphology .............................................................................................. 23
2.1.4 Plants, Wildlife, and Fisheries ....................................................................................... 29 2.1.4.1 Riparian Plant Community .......................................................................................... 29 2.1.4.2 Upland Plant Community ............................................................................................ 29 2.1.4.3 Wildlife ....................................................................................................................... 29 2.1.4.4 Fishery ......................................................................................................................... 31 2.1.4.5 Special Designations ................................................................................................... 32

Middle Bear River and Cutler Reservoir Final TMDLs February 2010
viii
2.2 Cultural Characteristics ....................................................................................................... 33 2.2.1 Land Use and Ownership ............................................................................................... 33 2.2.2 Population ...................................................................................................................... 34 2.2.3 History and Economics .................................................................................................. 35 2.2.4 Public Involvement ........................................................................................................ 36
CHAPTER 3 DATA SUMMARY AND SUPPORT FOR IMPAIRMENT STATUS .................... 37
3.1 Data Extent and Coverage .................................................................................................... 37 3.1.1 Spatial Extent and Coverage .......................................................................................... 37 3.1.2 Temporal Extent and Coverage ...................................................................................... 40 3.1.3 Limnological Characteristics of Cutler Reservoir .......................................................... 45
3.2 Summary of Current Conditions ......................................................................................... 45 3.2.1 Water Quality Analytical Methods ................................................................................ 47
3.2.1.1 APHA Methods ........................................................................................................... 47 3.2.1.2 EPA Methods .............................................................................................................. 47 3.2.1.3 UDWQ Generic Methods ............................................................................................ 47 3.2.1.4 UDWQ Field Measures ............................................................................................... 47
3.2.2 Quality Assurance and Quality Control ......................................................................... 47 3.2.2.1 Treatment of Nondetects ............................................................................................. 48 3.2.2.2 Treatment of Errors ..................................................................................................... 49 3.2.2.3 Treatment of Outliers .................................................................................................. 50 3.2.2.4 Treatment of Duplicate Measures ............................................................................... 51
3.2.3 Water Quality Statistical Overview ............................................................................... 51 3.2.4 Hydrologic Summary ..................................................................................................... 52 3.2.5 Identified Data Gaps and Supplemental Study Methodology ........................................ 56
3.2.5.1 Flow ............................................................................................................................ 59 3.2.5.2 Outflow Monitoring .................................................................................................... 60 3.2.5.3 Dissolved Oxygen (DO) .............................................................................................. 60 3.2.5.4 Temperature ................................................................................................................ 64 3.2.5.5 Chlorophyll a .............................................................................................................. 64 3.2.5.6 Wetland Functional Status .......................................................................................... 64 3.2.5.7 Fisheries Data .............................................................................................................. 64 3.2.5.8 Secondary Contact Recreational Use Support Status .................................................. 65 3.2.5.9 Avian Food Chain Review .......................................................................................... 65
3.2.6 Summary ........................................................................................................................ 65 3.3 Beneficial Use Support Assessment for Cutler Reservoir and Middle Bear River ......... 66
3.3.1 Direct Exceedance of Numeric Criteria or Thresholds .................................................. 66 3.3.1.1 Ammonia (3B and 3D) ................................................................................................ 66 3.3.1.2 Bacteria (2B) ............................................................................................................... 66 3.3.1.3 Nuisance Algal Growth ............................................................................................... 67 3.3.1.4 Dissolved Oxygen (3B and 3D) .................................................................................. 71 3.3.1.5 Nitrate (2B, 3B, and 3D) ............................................................................................. 81 3.3.1.6 pH (2B, 3B, and 3D) ................................................................................................... 81 3.3.1.7 Temperature (3B and 3D) ........................................................................................... 83 3.3.1.8 Total Dissolved Solids (4) ........................................................................................... 86 3.3.1.9 Total Phosphorus (2B and 3B) .................................................................................... 87
3.3.2 Assessment of Eutrophication ........................................................................................ 91 3.3.2.1 Secchi Depth ............................................................................................................... 91
Middle Bear River and Cutler Reservoir Final TMDLs February 2010
ix
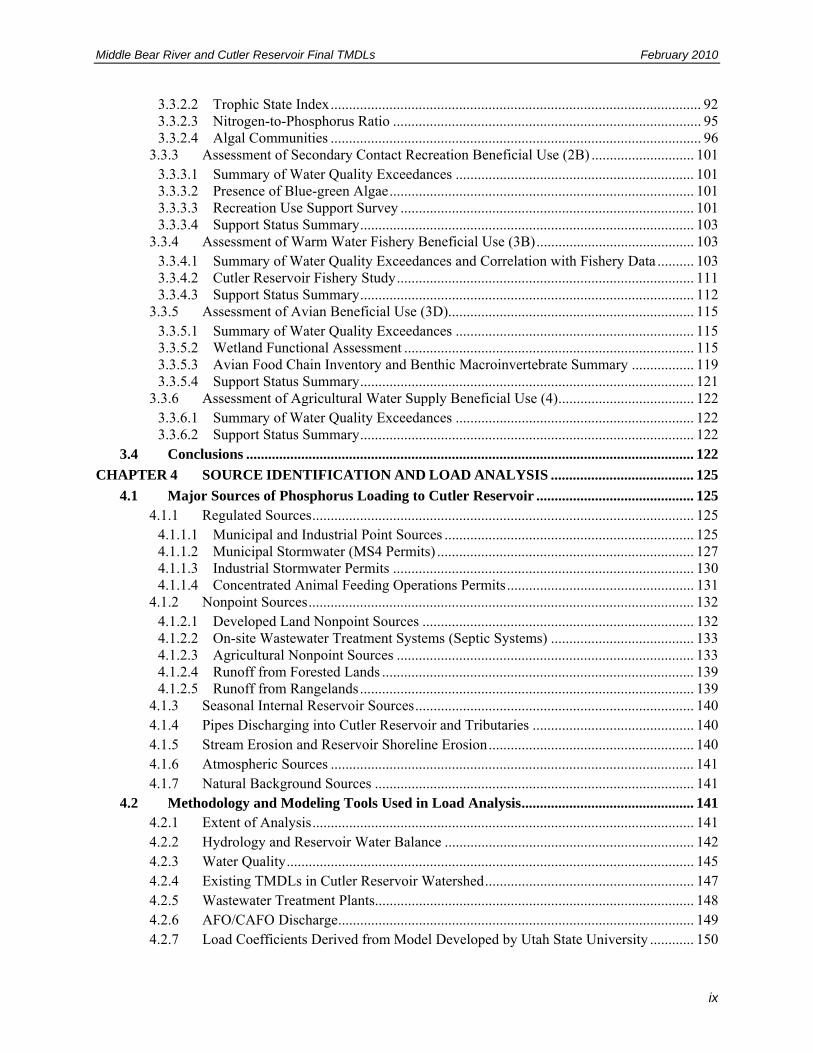
3.3.2.2 Trophic State Index ..................................................................................................... 92 3.3.2.3 Nitrogen-to-Phosphorus Ratio .................................................................................... 95 3.3.2.4 Algal Communities ..................................................................................................... 96
3.3.3 Assessment of Secondary Contact Recreation Beneficial Use (2B) ............................ 101 3.3.3.1 Summary of Water Quality Exceedances ................................................................. 101 3.3.3.2 Presence of Blue-green Algae ................................................................................... 101 3.3.3.3 Recreation Use Support Survey ................................................................................ 101 3.3.3.4 Support Status Summary ........................................................................................... 103
3.3.4 Assessment of Warm Water Fishery Beneficial Use (3B) ........................................... 103 3.3.4.1 Summary of Water Quality Exceedances and Correlation with Fishery Data .......... 103 3.3.4.2 Cutler Reservoir Fishery Study ................................................................................. 111 3.3.4.3 Support Status Summary ........................................................................................... 112
3.3.5 Assessment of Avian Beneficial Use (3D)................................................................... 115 3.3.5.1 Summary of Water Quality Exceedances ................................................................. 115 3.3.5.2 Wetland Functional Assessment ............................................................................... 115 3.3.5.3 Avian Food Chain Inventory and Benthic Macroinvertebrate Summary ................. 119 3.3.5.4 Support Status Summary ........................................................................................... 121
3.3.6 Assessment of Agricultural Water Supply Beneficial Use (4) ..................................... 122 3.3.6.1 Summary of Water Quality Exceedances ................................................................. 122 3.3.6.2 Support Status Summary ........................................................................................... 122
3.4 Conclusions .......................................................................................................................... 122
CHAPTER 4 SOURCE IDENTIFICATION AND LOAD ANALYSIS ....................................... 125
4.1 Major Sources of Phosphorus Loading to Cutler Reservoir ........................................... 125 4.1.1 Regulated Sources ........................................................................................................ 125
4.1.1.1 Municipal and Industrial Point Sources .................................................................... 125 4.1.1.2 Municipal Stormwater (MS4 Permits) ...................................................................... 127 4.1.1.3 Industrial Stormwater Permits .................................................................................. 130 4.1.1.4 Concentrated Animal Feeding Operations Permits ................................................... 131
4.1.2 Nonpoint Sources ......................................................................................................... 132 4.1.2.1 Developed Land Nonpoint Sources .......................................................................... 132 4.1.2.2 On-site Wastewater Treatment Systems (Septic Systems) ....................................... 133 4.1.2.3 Agricultural Nonpoint Sources ................................................................................. 133 4.1.2.4 Runoff from Forested Lands ..................................................................................... 139 4.1.2.5 Runoff from Rangelands ........................................................................................... 139
4.1.3 Seasonal Internal Reservoir Sources ............................................................................ 140 4.1.4 Pipes Discharging into Cutler Reservoir and Tributaries ............................................ 140 4.1.5 Stream Erosion and Reservoir Shoreline Erosion ........................................................ 140 4.1.6 Atmospheric Sources ................................................................................................... 141 4.1.7 Natural Background Sources ....................................................................................... 141
4.2 Methodology and Modeling Tools Used in Load Analysis ............................................... 141 4.2.1 Extent of Analysis ........................................................................................................ 141 4.2.2 Hydrology and Reservoir Water Balance .................................................................... 142 4.2.3 Water Quality ............................................................................................................... 145 4.2.4 Existing TMDLs in Cutler Reservoir Watershed ......................................................... 147 4.2.5 Wastewater Treatment Plants ....................................................................................... 148 4.2.6 AFO/CAFO Discharge ................................................................................................. 149 4.2.7 Load Coefficients Derived from Model Developed by Utah State University ............ 150
Middle Bear River and Cutler Reservoir Final TMDLs February 2010
x
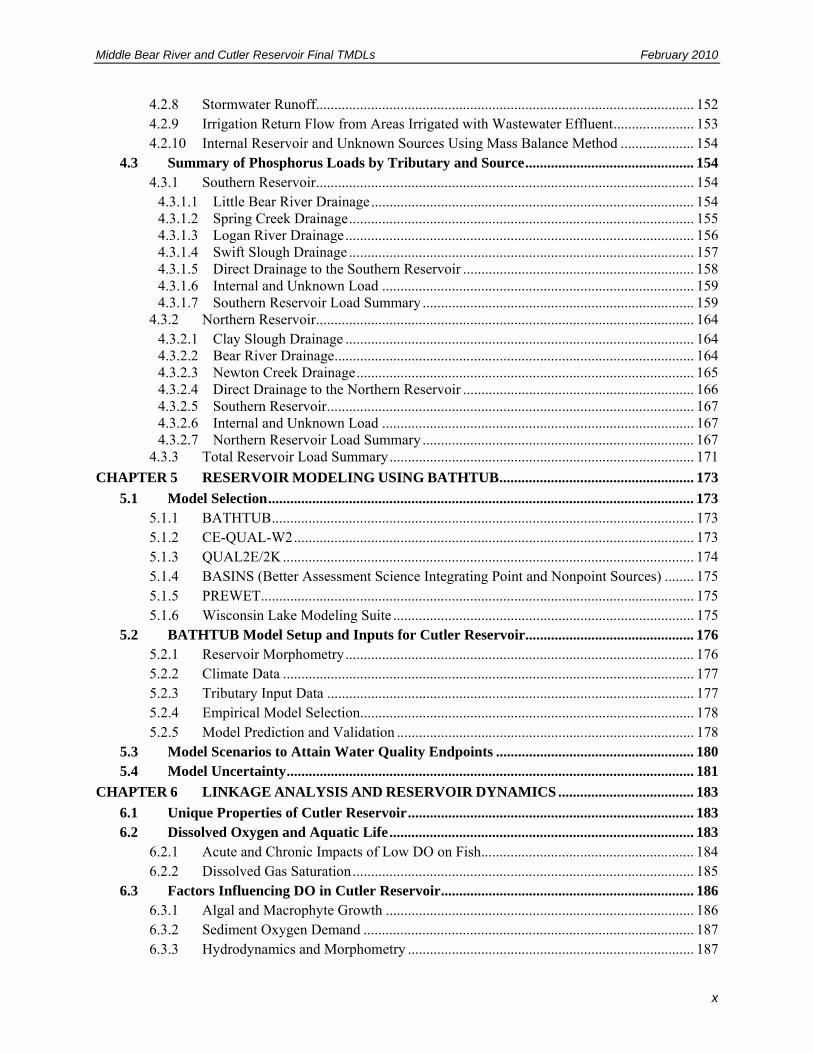
4.2.8 Stormwater Runoff ....................................................................................................... 152 4.2.9 Irrigation Return Flow from Areas Irrigated with Wastewater Effluent ...................... 153 4.2.10 Internal Reservoir and Unknown Sources Using Mass Balance Method .................... 154
4.3 Summary of Phosphorus Loads by Tributary and Source .............................................. 154 4.3.1 Southern Reservoir ....................................................................................................... 154
4.3.1.1 Little Bear River Drainage ........................................................................................ 154 4.3.1.2 Spring Creek Drainage .............................................................................................. 155 4.3.1.3 Logan River Drainage ............................................................................................... 156 4.3.1.4 Swift Slough Drainage .............................................................................................. 157 4.3.1.5 Direct Drainage to the Southern Reservoir ............................................................... 158 4.3.1.6 Internal and Unknown Load ..................................................................................... 159 4.3.1.7 Southern Reservoir Load Summary .......................................................................... 159
4.3.2 Northern Reservoir ....................................................................................................... 164 4.3.2.1 Clay Slough Drainage ............................................................................................... 164 4.3.2.2 Bear River Drainage .................................................................................................. 164 4.3.2.3 Newton Creek Drainage ............................................................................................ 165 4.3.2.4 Direct Drainage to the Northern Reservoir ............................................................... 166 4.3.2.5 Southern Reservoir .................................................................................................... 167 4.3.2.6 Internal and Unknown Load ..................................................................................... 167 4.3.2.7 Northern Reservoir Load Summary .......................................................................... 167
4.3.3 Total Reservoir Load Summary ................................................................................... 171
CHAPTER 5 RESERVOIR MODELING USING BATHTUB ..................................................... 173
5.1 Model Selection .................................................................................................................... 173 5.1.1 BATHTUB ................................................................................................................... 173 5.1.2 CE-QUAL-W2 ............................................................................................................. 173 5.1.3 QUAL2E/2K ................................................................................................................ 174 5.1.4 BASINS (Better Assessment Science Integrating Point and Nonpoint Sources) ........ 175 5.1.5 PREWET...................................................................................................................... 175 5.1.6 Wisconsin Lake Modeling Suite .................................................................................. 175
5.2 BATHTUB Model Setup and Inputs for Cutler Reservoir .............................................. 176 5.2.1 Reservoir Morphometry ............................................................................................... 176 5.2.2 Climate Data ................................................................................................................ 177 5.2.3 Tributary Input Data .................................................................................................... 177 5.2.4 Empirical Model Selection........................................................................................... 178 5.2.5 Model Prediction and Validation ................................................................................. 178
5.3 Model Scenarios to Attain Water Quality Endpoints ...................................................... 180 5.4 Model Uncertainty ............................................................................................................... 181
CHAPTER 6 LINKAGE ANALYSIS AND RESERVOIR DYNAMICS ..................................... 183
6.1 Unique Properties of Cutler Reservoir .............................................................................. 183 6.2 Dissolved Oxygen and Aquatic Life ................................................................................... 183
6.2.1 Acute and Chronic Impacts of Low DO on Fish.......................................................... 184 6.2.2 Dissolved Gas Saturation ............................................................................................. 185
6.3 Factors Influencing DO in Cutler Reservoir ..................................................................... 186 6.3.1 Algal and Macrophyte Growth .................................................................................... 186 6.3.2 Sediment Oxygen Demand .......................................................................................... 187 6.3.3 Hydrodynamics and Morphometry .............................................................................. 187

Middle Bear River and Cutler Reservoir Final TMDLs February 2010
xi
6.3.4 Turbidity ...................................................................................................................... 188 6.3.5 Climate ......................................................................................................................... 188 6.3.6 Water Temperature ...................................................................................................... 188
6.4 Eutrophication Dynamics ................................................................................................... 190 6.4.1 Nutrients and Other Drivers of Eutrophication ............................................................ 190 6.4.2 Limiting Nutrients and Algal Speciation ..................................................................... 190 6.4.3 Internal Nutrient Cycling ............................................................................................. 191 6.4.4 Nutrient Availability .................................................................................................... 191
6.5 Linkage Between Nutrients and Cutler Reservoir Beneficial Uses ................................. 192 6.5.1 Secondary Contact Recreation (2B) ............................................................................. 192 6.5.2 Warm-water Fishery (3B) ............................................................................................ 194 6.5.3 Avian and Other Wildlife (3D) .................................................................................... 195 6.5.4 Agricultural Water Supply (4) ..................................................................................... 195
CHAPTER 7 TOTAL MAXIMUM DAILY LOAD ANALYSIS .................................................. 197
7.1 Phased TMDL Approach and Justification for Cutler Reservoir .................................. 197 7.2 Water Quality Endpoints .................................................................................................... 198
7.2.1 Dissolved Oxygen Endpoints ....................................................................................... 198 7.2.2 Total Phosphorus Endpoints for Cutler Reservoir ....................................................... 199
7.2.2.1 Phosphorus Thresholds Associated with Aquatic Life ............................................. 199 7.2.2.2 Historical Data Analysis ........................................................................................... 199 7.2.2.3 Ecoregional Data ....................................................................................................... 200 7.2.2.4 Phosphorus Limitation and Algal Dominance .......................................................... 201 7.2.2.5 Phosphorus TMDL and Nutrient Criteria Precedents ............................................... 202 7.2.2.6 Impacts on Downstream Waters ............................................................................... 202 7.2.2.7 EPA Nutrient Criteria Guidance ............................................................................... 202 7.2.2.8 Summary of Total Phosphorus Endpoints for Cutler Reservoir ............................... 202
7.2.3 Total Phosphorus Endpoint for Middle Bear River ..................................................... 203 7.3 Loading Capacity: Total Maximum Daily and Seasonal Loads ...................................... 203 7.4 Load Allocation.................................................................................................................... 204
7.4.1 Load Allocations and Reductions Identified in Existing TMDLs................................ 209 7.4.2 New WLAs .................................................................................................................. 210 7.4.3 New Nonpoint Source LAs .......................................................................................... 210
7.4.3.1 AFO/CAFOs ............................................................................................................. 210 7.4.3.2 Background Sources ................................................................................................. 211 7.4.3.3 Agricultural Sources ................................................................................................. 211 7.4.3.4 Irrigation Ditches and Return Flow........................................................................... 211 7.4.3.5 Developed Sources .................................................................................................... 212 7.4.3.6 Other Nonpoint Sources ............................................................................................ 212 7.4.3.7 Internal and Unknown Sources ................................................................................. 212
7.4.4 Margin of Safety .......................................................................................................... 212 7.4.5 Future Growth .............................................................................................................. 213
7.5 Seasonality ............................................................................................................................ 214 7.6 Reasonable Assurance ......................................................................................................... 214 7.7 Summary .............................................................................................................................. 214
REFERENCES ............................................................................................................................................ 217
LIST OF ABBREVIATIONS ........................................................................................................................ 233
Middle Bear River and Cutler Reservoir Final TMDLs February 2010
xii
List of Appendices
Appendix A. Technical Advisory Committee
Appendix B. Cutler Reservoir and Middle Bear River Data Summary Table
Appendix C. Diurnal Data Collected in Cutler Reservoir (2005–2007)
Appendix D. Cutler Reservoir Recreation Use Survey
Appendix E. Wetland Functional Assessment Model
Appendix F. Maps and System Diagrams
Appendix G. USU Fishery Report for Cutler Reservoir (Budy et al. 2007)
Appendix H. Cutler Reservoir Monitoring Plan
Appendix I. Adaptive Management Implementation Plan
Appendix J. Public Comments and Responses
Middle Bear River and Cutler Reservoir Final TMDLs February 2010
xiii
List of Tables
Table 1.1. Summary of Use Designations for Waters of the State of Utah ...................................9
Table 1.2. Water Quality Criteria Specific to Middle Bear River and Cutler Reservoir TMDLs .................................................................................................................................11
Table 2.1. Cutler Dam (PacifiCorp) Utah Air Temperature Data Summary ...............................18
Table 2.2. Cutler Dam (PacifiCorp) Utah Precipitation Data Summary .....................................19
Table 2.3. Average Annual Discharge of Bear River, Tributaries, and Cutler Dam ...................21
Table 2.4. Common Soil Textures in the Cutler Reservoir Watershed .......................................23
Table 2.5. SVAP Scores of Stream Condition .............................................................................24
Table 2.6. SVAP Scores for Clarkston Creek and Newton Creek (Fall 2002) ............................25
Table 2.7. Spring Creek SVAP Results .......................................................................................27
Table 2.8. Bird Species Observed Around Cutler Reservoir .......................................................30
Table 2.9. Sensitive Species in Cache County .............................................................................32
Table 2.10. Land Use and Land Cover in the Cutler Reservoir Watershed .................................33
Table 2.11. Land Ownership in the Cutler Reservoir Watershed ................................................34
Table 2.12. Population Projections for the Cutler Reservoir Watershed .....................................34
Table 3.1. Monitoring Stations and Data Sources .......................................................................38
Table 3.2. Sampling Time Periods for Monitoring Stations ........................................................43
Table 3.3. Water Quality Constituents for the Middle Bear River and Cutler Reservoir TMDLs .......46
Table 3.4. Detection Limits of Methods Found in the STORET Database .................................48
Table 3.5. Standard Deviations Used in Outlier Analysis ...........................................................51
Table 3.6. Statistical Water Quality Information Summarized for the Five Primary Sections of the Cutler Reservoir and Middle Bear River System (1995–2006) ..................52
Table 3.7. Annual Flow Volumes and Quantitative Comparisons Relative to the 30-year Average for the Bear River at USGS Gage #10092700 ......................................................55
Table 3.8. Data Gaps Identified in the Cutler Reservoir Watershed TMDL Process ..................57
Table 3.9. Diurnal Data Collection Field Notes ..........................................................................61
Table 3.10. Comparison of Chlorophyll a Concentrations (µg/l) Corrected and Uncorrected for Pheophytin .................................................................................................68
Table 3.11. Summary of Chlorophyll a (µg/l) Data in Bear River and Cutler Reservoir (1995–2006) during the Summer Season (May–October) ...................................................69
Table 3.12. Seasonal Summary of Chlorophyll a (µg/l) Data in Middle Bear River and Cutler Reservoir (1995–2006) .............................................................................................70
Table 3.13. Exceedance of 1-day DO Criteria (minimum 3.0 mg/l and 5.0 mg/l) for Warm Water Fish Beneficial Use in the Cutler Reservoir System .................................................73
Middle Bear River and Cutler Reservoir Final TMDLs February 2010
xiv
Table 3.14. Exceedance of 1-Day DO Criteria for Warm Water Fish Beneficial Use in Middle Bear River ................................................................................................................77
Table 3.15. Exceedance of 6 mg/L over Sampling Period (3-to 7-day average) in the Cutler Reservoir and Middle Bear River .............................................................................79
Table 3.16. Diurnal DO Fluctuations Observed during Several Sampling Periods in Cutler Reservoir ...................................................................................................................80
Table 3.17. pH Exceedances Identified (1995–2006) during Summer (May–October) ..............81
Table 3.18. Mean pH Values Recorded during Diurnal Sampling ..............................................82
Table 3.19. Water Temperature Criteria Exceedance and Diurnal Water Temperature Fluctuation Observed during Two Sampling Events* .........................................................83
Table 3.20. Temperature Exceedance of the Warm Water Fishery Numeric Criteria (<27° C) during Diurnal Sampling Events (2003–2007) in Cutler Reservoir .....................84
Table 3.21. Mean and Maximum Temperature (°C) Recorded during Diurnal Sampling Events (2003–2007) in Cutler Reservoir .............................................................................85
Table 3.22. Exceedances of Dissolved Solids Criteria (<1,200 mg/L) in Middle Bear River, Cutler Reservoir, and Tributaries ..............................................................................87
Table 3.23. Exceedance of TP Threshold Concentration in Cutler Reservoir (<0.025 mg/L), Tributaries to Cutler Reservoir (<0.05 mg/L), and Middle Bear River (<0.05 mg/L) during the Current Period of Record (1995–2006) ...................................................88
Table 3.24. Summer Season (May–October) Total Phosphorus Summary Statistics during the Current Period of Record (1995–2006) .........................................................................89
Table 3.25. Summer Season (May–October) Summary Dissolved Phosphorus (mg/L) Statistics during the Current Period of Record (1995–2006) ...............................................90
Table 3.26. Summer Season (May–October) Dissolved Phosphorus (DP) and Orthophosphate (Ortho-P) in mg/L Summary Statistics during the Current Period of Record (1995–2006)* ..........................................................................................................91
Table 3.27. Summer Season (May–October) Summary Statistics for Secchi Depth (meters) during the Current Period of Record (1995–2006) ................................................92
Table 3.28. TSI Values and Status Indicators ..............................................................................93
Table 3.29. Relationships Between TSI Values ...........................................................................93
Table 3.30. Average (mean) TSI Values Calculated for Cutler Reservoir and Middle Bear River .....................................................................................................................................94
Table 3.31. Mean Monthly Dissolved Nitrogen-to-Phosphorus Ratios in Cutler Reservoir .......95
Table 3.32. Phytoplankton Abundance in Cutler Reservoir (Station ID #5900970) in 2004 and 2005 (Data source: STORET) .......................................................................................96
Table 3.33. Algal Taxa Present in a Total Plankton Sample from Cutler Reservoir collected on 8/25/2004 (Rushforth and Rushforth 2005) ....................................................97
Table 3.34. Periphyton Abundance in Middle Bear River Above Cutler Reservoir (Station ID #4903260) in 2004 and 2005 (Data source: STORET) ..................................................98

Middle Bear River and Cutler Reservoir Final TMDLs February 2010
xv
Table 3.35. Summary of DO Criteria Exceedances in Cutler Reservoir and Middle Bear River ...................................................................................................................................104
Table 3.36. Temperature Requirements, Spawning Season, and Habitat for Fish Species Found in Cutler Reservoir ..................................................................................................107
Table 3.37. Summary of Evidence Indicating Nonsupport of the Warm Water Fishery in Cutler Reservoir .................................................................................................................113
Table 3.38. Wetland Functional Capacity Index Scores ............................................................116
Table 3.39. Bird Species Summary ............................................................................................118
Table 3.40. Feeding Habitat Guilds ...........................................................................................118
Table 3.41. Summary of Birds Observed in Cutler Reservoir that Depend on Various Macroinvertebrate Taxa as a Component of Their Diet ....................................................120
Table 4.1. Summary of Regulated Point Source Dischargers in the Cutler Reservoir Watershed ..........................................................................................................................126
Table 4.2. Select Major Stormwater Canals in Cache Valley ....................................................128
Table 4.3. MS4 Stormwater Permits in the Cutler Reservoir Watershed (Cache County) ........129
Table 4.4. Industrial Stormwater Permits in the Cutler Reservoir Watershed (Cache County) ..............................................................................................................................131
Table 4.5. Summary of CAFO Permits in Cutler Reservoir Watershed (Cache County) .........132
Table 4.6. Potential Pollutant Loading from Agricultural Management Practices ....................134
Table 4.7. Identified Land Uses on Private Lands (Cache County) ..........................................135
Table 4.8. Land Application Permits in Cutler Reservoir Watershed (Cache County) .............135
Table 4.9. Summary of Average Tributary Discharge to Cutler Reservoir Used in Load Calculations ........................................................................................................................142
Table 4.10. Summary of Percent Seasonal Flow and Uncertainty (CV) Associated with Discharge Values Used in the Cutler Reservoir TMDL ....................................................143
Table 4.11. Water Balance for the Cutler Reservoir System .....................................................144
Table 4.12. Summary of Daily Flow Values Used in the Cutler Reservoir TMDL ..................144
Table 4.13. Summary of Median Water Quality Data Collected during the Summer Season (May–October) during the Current Period of Record and Uncertainty (CV) ........145
Table 4.14. Summary Median Water Quality Data Collected during the Winter Season (November–April) during the Current Period of Record and Uncertainty (CV) ...............146
Table 4.15. Summary of Loads Identified in Other TMDLs .....................................................147
Table 4.16. Summary of Logan Regional WWTP Parameters and Assumptions at Monitoring Outfall 002 ......................................................................................................149
Table 4.17. Summary of AFO/CAFO Diffuse Runoff Phosphorus Loads Prior to Improvement in Recent Years............................................................................................150
Table 4.18. Proportion of Total Nonpoint Source Phosphorus Load from each Land Use in the Little Bear River Drainage .......................................................................................151
Middle Bear River and Cutler Reservoir Final TMDLs February 2010
xvi
Table 4.19. Phosphorus Load Coefficients (kg/ha) for Subwatershed 2 in the Little Bear River Drainage ...................................................................................................................151
Table 4.20. Summary of Phosphorus Load for the Little Bear River Drainage ........................155
Table 4.21. Summary of Phosphorus Load for Spring Creek Drainage ....................................155
Table 4.22. Summary of Phosphorus Load for Logan River Drainage .....................................156
Table 4.23. Summary of Phosphorus Load for Swift Slough Drainage ....................................157
Table 4.24. Summary of Phosphorus Load for Direct Drainage to Southern Reservoir ...........158
Table 4.25. Internal and Unknown Phosphorus Load Estimate for Southern Reservoir ...........159
Table 4.26. Summary of Phosphorus Load for Clay Slough .....................................................164
Table 4.27. Summary of Phosphorus Load for the Bear River Drainage ..................................165
Table 4.28. Summary of Phosphorus Load for Newton Creek Drainage ..................................166
Table 4.29. Summary of Phosphorus Load for Direct Drainage to Northern Reservoir ...........166
Table 4.30. Internal and Unknown Phosphorus Load Estimate for Northern Reservoir ...........167
Table 4.31. Phosphorus Load Summary by Tributary and Drainage ........................................172
Table 5.1. Reservoir Morphometry Inputs to Cutler Reservoir BATHTUB Model ..................176
Table 5.2. Climatic Data Inputs for Cutler Reservoir BATHTUB Model.................................177
Table 5.3. Empirical Models Selected for Cutler Reservoir BATHTUB Model .......................178
Table 5.4. Predicted Nutrient Concentrations in Cutler Reservoir ............................................179
Table 5.5. Predicted Reservoir Response to Target Phosphorus Load Reduction in Summer Season ..................................................................................................................181
Table 6.1. 24-hour Lethal DO Concentrations for Fish .............................................................184
Table 6.2. Summary of Literature Relating Chlorophyll a Concentration to Support of Aesthetics and Swimming Beneficial Uses .......................................................................193
Table 7.1. Summary of Total Phosphorus Data (mg/L) in Cutler Reservoir during All Seasons for the Entire Period of Record (1975–2007) ......................................................199
Table 7.2. Ecoregions and Subecoregions Similar to the Cutler Reservoir Watershed .............200
Table 7.3. Summary of Total Phosphorus Load Reductions Required to Meet Water Quality Endpoints for Cutler Reservoir .............................................................................204
Table 7.4. Summary of Phosphorus LAs (kg TP/season) for Southern Reservoir TMDL ........205
Table 7.5. Summary of Phosphorus LAs (kg TP/season) for Middle Bear River TMDL .........206
Table 7.6. Summary of Phosphorus LAs (kg TP/season) for Northern Reservoir TMDL ........207
Table 7.7. Summary of Total Phosphorus Load Reductions (kg TP/season) Associated with AFO/CAFO Improvement .........................................................................................211
Middle Bear River and Cutler Reservoir Final TMDLs February 2010
xvii
List of Figures
Figure 2.1. Summary of climatic data for Cutler Reservoir. .......................................................19
Figure 3.1. Distribution across time of the total phosphorus samples for the Cutler Reservoir and Bear River system available to the TMDL process from all sources. ..........41
Figure 3.2. Available flow data by water year as measured at USGS Gage #10092700 near the Utah–Idaho state line (30-year average, 1975–2003). ...........................................53
Figure 3.3. Available flow data by water year ranking as measured at USGS Gage #10092700 near the Utah–Idaho state line (30-year average, 1975–2005). ........................54
Figure 3.4. Available flow data by water year ranking as measured at USGS Gage #10109000 on the Logan River (30-year average, 1975–2005). .........................................54
Figure 3.5. Example of diurnal data collected in Cutler Reservoir to examine daily fluctuations of DO, temperature, and pH................................................................................71
Figure 3.6. Summary of PacifiCorp recreation survey results on whether water quality is perceived to be a problem in Cutler Reservoir by visitors. ................................................102
Figure 3.7. Minimum daily DO values from diurnal sampling plotted against fish spawning period. * Indicates STORET data collected during the afternoon. ....................108
Figure 3.8. Optimum water temperature (°C) for selected adult species compared to observed temperature maxima in Cutler Reservoir............................................................109
Figure 3.9. Spawning temperature range and observed maximum temperatures (for March 8-9, 2007 sampling dates) during spawning period for walleye in Cutler Reservoir. .......110
Figure 3.10. Spawning temperature range and observed maximum temperatures (by sampling date) during spawning period for largemouth bass and smallmouth bass in Cutler Reservoir. ................................................................................................................110
Figure 3.11. Spawning temperature range and observed maximum temperatures (by sampling date) during spawning period for green sunfish in Cutler Reservoir. ................111
Figure 3.12. Functional capacity indices for wetlands around Cutler Reservoir. ......................117
Figure 3.13. Avian species distribution by feeding area in wetlands around Cutler Reservoir. ...........................................................................................................................119
Figure 4.1. Proportional phosphorus load from drainages to the Southern Reservoir during the summer season. .................................................................................................160
Figure 4.2. Proportional phosphorus load summary from drainages to the Southern Reservoir during the winter season. ...................................................................................161
Figure 4.3. Proportional phosphorus load summary from sources to the Southern Reservoir during the summer season. Nonpoint Source = nonpoint source. .....................162
Figure 4.4. Proportional phosphorus load summary from sources to the Southern Reservoir during the winter season. Nonpoint Source = nonpoint source. ........................163
Figure 4.5. Proportional phosphorus load summary from drainages to Northern Reservoir during the summer season. .................................................................................................168
Middle Bear River and Cutler Reservoir Final TMDLs February 2010
xviii
Figure 4.6. Proportional phosphorus load summary from drainages to Northern Reservoir during the winter season. ...................................................................................................169
Figure 4.7. Proportional phosphorus load summary from sources to the Northern Reservoir during the summer season. ................................................................................170
Figure 4.8. Proportional phosphorus load summary from sources to Northern Reservoir during the winter season. ...................................................................................................171
Figure 5.1. Box plot of summer reservoir water quality data and model output (dashed line) for baseline conditions. ..............................................................................................179
Figure 5.2. Box plot of winter reservoir water quality data and model output (dashed line) for baseline conditions. ......................................................................................................180
Figure 6.1. Dissolved oxygen concentrations that represent 100% saturation at 4,409 feet elevation at Cutler Reservoir..............................................................................................189
Figure 6.2. Linkage between nutrients and recreation beneficial uses. .....................................193
Figure 6.3. Linkages between nutrients and other water quality parameters and the warm water fishery in Cutler Reservoir and Middle Bear River (solid arrows indicate an increasing relationship; dashed arrows indicate a decreasing relationship). .............................................194
Figure 6.4. Linkage between nutrients and waterfowl beneficial use. .......................................195
Figure 6.5. Linkage between nutrients and agricultural beneficial use. ....................................196
Figure 7.1. Summary of applicable ecoregion total phosphorus statistics compared to Cutler Reservoir water quality endpoints. Error bars represent the range in median values found in the ecoregion. ...........................................................................................201
Middle Bear River and Cutler Reservoir Final TMDLs February 2010
1
Foreword
This document represents the total maximum daily load (TMDL) study for Cutler Reservoir and the Middle Bear River from the Idaho-Utah state line to Cutler Reservoir, in fulfillment of requirements by the Clean Water Act. The overall goal of the TMDL process is to restore and maintain water quality in Cutler Reservoir and the Middle Bear River to a level that protects and supports the designated beneficial uses (DBUs) for these waters, including secondary contact recreation, agricultural water supply, warm water game fish, and waterfowl habitat.
Chapter 1 of this study describes the TMDL purpose and identifies the water quality problems for Cutler Reservoir and the Middle Bear River. The Watershed Characterization (Chapter 2) summarizes the physical, biological, and cultural characteristics of the Cutler Reservoir and Middle Bear River watershed. The beneficial use assessment examines available data and data sources, indicators of impairment, and an impairment assessment specific to the reservoir's designated uses (Chapter 3). The load analysis quantifies current and projected load to the reservoir (Chapter 4) from all sources in the watershed and is consistent with other TMDLs already approved for the watershed. The reservoir modeling component of the TMDL process describes the development and use of a reservoir model to predict reservoir response under current and projected nutrient loads (Chapters 5 and 6). Linkage Analysis (Chapter 6) provides a qualitative analysis of the linkages between phosphorus and low dissolved oxygen (DO) as well as other drivers of low DO in the system. It also describes other linkages between nutrients and water quality impairments. The Total Maximum Daily Load chapter identifies water quality objectives for the reservoir and negotiated load allocations (LAs) and reductions required to meet water quality endpoints (Chapter 7). It is important to note that improvements in water quality will require a long-term commitment. Implementation of a successful water quality management plan will require a coordinated effort of planning and establishment of best management practices; this effort will involve government agencies and land owners in the watershed over the next several years. A monitoring plan and adaptive management implementation plan are included as Appendices to this TMDL.
This TMDL was developed by SWCA Environmental Consultants under the direction of the Utah Department of Environmental Quality, Division of Water Quality. It is consistent with Utah Code Title 19, Chapter 5, Water Quality Act, 19-5-104 (powers and duties of board), which identifies the requirement for the development and implementation of TMDLs and/or equivalent processes.
Acknowledgments
The staff at SWCA and UDEQ gratefully acknowledges the time and effort that so many individuals and organizations have dedicated to assist with this project; their help has been indispensable to the success of this project.
We would like to specifically acknowledge the efforts of the U.S. Forest Service for the Wasatch–Cache National Forest, Bear River Canal Company, Utah Division of Water Quality, Utah Division of Wildlife Resources, Utah Department of Agriculture, Utah Division of Water Resources, Utah Division of Water Rights, Utah Geological Survey, U.S. Geological Survey, U.S. Department of Agriculture, Natural Resources Conservation Service, PacifiCorp, Bridgerland Audubon Society, JBS Swift and Company (formerly E.A. Miller), Utah Association of Conservation Districts, Cache County, and Logan City for contributions of important background information, data, and review.

Middle Bear River and Cutler Reservoir Final TMDLs February 2010
2
Preparers
Erica Gaddis, SWCA, Project Management and Principal Scientist Michael Allred, UDWQ, Project Management Carl Adams, UDWQ, Review Linda Burfitt, SWCA, Technical Editing Kari Chalker, SWCA, Technical Editing John Pecorelli, SWCA, Technical Editing John Christensen, SWCA, Technical Review Doug Davidson, SWCA, Review Tonya Dombrowski, SWCA, Project Management J. Hope Hornbeck, SWCA, Linkage Analysis and Technical Writing Greg Larson, SWCA, Data Analysis and Geomorphology Spencer Martin, SWCA, Ecology Review Brian Nicholson, SWCA, Wetland Functional Assessment David Reinhart, SWCA, GIS Tyson Schriener, SWCA, GIS Jan Summerhays, SWCA, Technical Writing Laura Vernon, SWCA, Land Use and Land Cover, Population Growth
Data Contributors
Matthew Baker, USU, Little Bear River model results Connely Baldwin, PacifiCorp, Hydrology Kent Brady, Cache County, Population data Phaedra Budy, USU, Cutler Reservoir Fishery Assessment Kirk Dahle, USU, Cutler Reservoir Fishery Assessment Nathan Daugs, UACD, Load Analysis (AFO/CAFO and irrigation return flow) Eve Davies, PacifiCorp, Identification of Pipes Discharging to Cutler Reservoir Eric Dodson, Logan City, Logan Regional WWTP and Swift Slough data Bryan Dixon, Bridgerland Audubon, Avian Assessment Issa Hamud, Logan City, Logan Regional WWTP data Jim Harps, Logan City, Logan Regional WWTP effluent data Jeff Horsburgh, USU, Little Bear River model methodology Lance Houser, Logan City, Stormwater Nancy Mesner, USU, Bear River historic data Bethany Nielson, USU, Little Bear River model results Craig Schaugaard, Utah Division of Wildlife Resources, Fish and wildlife information David Stevens, USU, Little Bear River model results Don Summit, JBS Swift and Company, Data Review Bill Young, Logan City, Stormwater Wayne Wurtsbaugh, USU, Water quality and macroinvertebrate data
Middle Bear River and Cutler Reservoir Final TMDLs February 2010
3
Document Reviewers
Connely Baldwin, PacifiCorp Eve Davies, PacifiCorp Bryan Dixon, Bridgerland Audubon Bob Fotheringham, Cache County Water Department Issa Hamud, Logan City Environment Department Lance Houser, Logan City Public Works Bruce Karren, North Cache Soil Conservation District Peter Kung, CUWUA Jeff Kunzler, Utah Farm Bureau Richard Mueller, Bridgerland Audubon Jack Nixon, Developer Ann Peralta, Cache County Water Board Mark Petersen, Utah Farm Bureau Greg Rowley, Gossner Foods Craig Schaugaard, Utah Division of Wildlife Resources Fred Selman, Northern Utah Soil Conservation District Don Summit, JBS Swift and Company Doug Stipes, JBS Swift and Company Jim Watterson, Muddy Road Outfitters (water recreation) Jon White, Blacksmith Fork Soil Conservation District Bill Young, Logan City Public Works

Middle Bear River and Cutler Reservoir Final TMDLs February 2010
4
This page intentionally blank.

Middle Bear River and Cutler Reservoir Final TMDLs February 2010
5
CHAPTER 1 INTRODUCTION
1.1 PURPOSE
This document presents the total maximum daily load (TMDL) study for the Middle Bear River and Cutler Reservoir in fulfillment of the requirements of the Clean Water Act (CWA).
A TMDL study describes the amount of an identified pollutant that a specific stream, lake, river, or other waterbody can contain while preserving its beneficial uses and maintaining state water quality standards. Once a state has identified pollutant the pollutant load discharged from both point and nonpoint sources, controls can be implemented to reduce the daily load of pollutants until the water body is brought back into compliance with water quality standards. Once developed, TMDLs are submitted to the Environmental Protection Agency (EPA) for approval.
The Federal Water Pollution Control Act (FWPCA) is the primary federal legislation that protects surface waters such as lakes and rivers. This legislation, originally enacted in 1948, was further expanded and enhanced in 1972; at this time it became known as the CWA. This act has been and continues to be subject to change as new information and a more complete understanding of natural systems and human impact on natural resources (both positive and negative) are identified. A more thorough discussion of the CWA can be found in The Clean Water Act: An Owner’s Manual (Elder et al. 1999). The main purpose of the CWA is to improve and protect water quality through restoration and maintenance of the physical, chemical, and biological integrity of the nation’s waterways. The CWA provides a mechanism for evaluating the nation’s waters, establishing designated beneficial uses (DBU) and defining water quality criteria to protect those uses in specific waterbodies.
In addition, Section 303(d) of the CWA requires each state to submit a list identifying waters that fail state water quality standards to the U. S. Environmental Protection Agency (EPA) every two years. The waters identified on the 303(d) list are known as impaired waters. For each impaired segment, the CWA requires a TMDL study for each pollutant responsible for the impairment of its beneficial uses. Once the state has identified the pollutant load discharged from both point and nonpoint sources, controls can be implemented to reduce the daily load of pollutants until the waterbody is brought back into compliance with water quality standards. Once developed, TMDLs are submitted to the EPA for approval. The Utah Department of Environmental Quality (UDEQ) is directed by Utah Code Title 19, Chapter 5, Water Quality Act, 19-5-104 (powers and duties of board), to develop TMDLs.
The State of Utah under Utah State Code R317-2-13.13 has identified beneficial uses for Cutler Reservoir and Middle Bear River: secondary contact recreation (2B), warm water game fish and their associated food chain (3B), waterfowl, shorebirds, other aquatic organisms and their associated food chains (3D), and agricultural water supply (4). The warm water game fish designated use (3B) was identified as partially supported on Utah’s 2004 303(d) list for both Cutler Reservoir and the Middle Bear River. Secondary contact recreation (2B), avian and other aquatic organisms (3D), and agricultural water supply (4) beneficial uses were deemed fully supporting for both the reservoir and the river. Pollutants of concern listed for Cutler Reservoir were total phosphorus with associated low DO as a consequence of nutrient loading. Pollutants of concern listed for the Middle Bear River were total phosphorus (TP) and total suspended solids (TSS).

Middle Bear River and Cutler Reservoir Final TMDLs February 2010
6
1.1.1 THE TOTAL MAXIMUM DAILY LOAD PROCESS
TMDLs completed by the State of Utah include watershed-based plans for restoring beneficial uses of impaired waterbodies. These plans identify the causes of impairment and determine the reduction in pollutant loads necessary to meet water quality standards and to restore beneficial uses. Water quality criteria are specific to each beneficial use. The water quality criteria of particular importance to the beneficial uses in the Middle Bear River and Cutler Reservoir are DO, bacteria, temperature, pH, total dissolved solids (TDS), phosphorus, and nitrogen.
The TMDL process involves the evaluation of available data from listed waterbodies to determine the maximum allowable load from point and nonpoint sources of pollution. Pollutant load refers to the quantity of pollution contributed to a waterbody from a single point (e.g., point sources such as a permitted industrial facility or a wastewater treatment plant) or from a group of diffuse sources (e.g., nonpoint sources such as urban development, agricultural fields, or upland erosion).
A TMDL study outlines a watershed- or basin-wide pollution budget for a waterbody. The budget is determined by the amount of pollutants that can be added without causing exceedances of water quality standards; this amount is referred to as the waterbody’s loading capacity. Calculations for pollutant loading capacity take into account seasonal variations, natural and background sources of loading, and a margin of safety (MOS) to allow for uncertainty in the analysis. Once the loading capacity is determined, sources of the pollutants are considered.
1.1.1.1 Point Sources
Point sources of pollution are characterized by specific points of discharge (e.g. pipes) that convey wastewater into a waterbody. According to 40 CFR 122.2 of the Code of Federal Regulations, a point source is “any discernable, confined, and discrete conveyance, including but not limited to any pipe, ditch, channel, tunnel, conduit, well, discrete fissure, container, rolling stock, concentrated animal feeding operation, landfill leachate collection system, vessel, or other floating craft from which pollutants are or may be discharged. This term does not include return flows from irrigated agriculture or agricultural storm-water runoff.”
1.1.1.2 Nonpoint Sources
Nonpoint sources (namely, landowners) contribute pollution diffusely, primarily through runoff. Examples include irrigation return flows from pastures and cropland, runoff from residential landscapes, and malfunctioning septic systems.
1.1.1.3 Load Allocations
Once all point and nonpoint sources are accounted for, pollutants are allocated among the sources in a manner that will describe the maximum amount of each pollutant (the total maximum load) that can be discharged into a waterbody over a specified amount of time while maintaining water quality standards for a particular beneficial use. The LAs distributed among the sources indicate the maximum amount of a pollutant that can be discharged. Ultimately the responsibility for improving water quality belongs to everyone who lives, works, or recreates in the watershed. The TMDL study does not mandate how load reductions must be attained, but it provides recommendations, particularly for nonpoint sources.

Middle Bear River and Cutler Reservoir Final TMDLs February 2010
7
Nonpoint sources are grouped into LAs and point sources are grouped into waste-load allocations (WLAs). By federal regulation, the total loading capacity “budget” must also include a MOS to allow for uncertainty in the loading analysis. The loading capacity, or TMDL, is summarized as a mathematical expression:
Loading capacity = TMDL = WLAs + LAs + MOS
The point source WLA is implemented through an existing regulatory program under the CWA called the National Pollutant Discharge Elimination System (NPDES) permit program (CWA Section 402). The EPA has delegated authority to Utah to administer the program referred to as the Utah Pollutant Discharge Elimination System (UPDES). These UPDES permits set effluent quality limits and require implementation of best available technologies designated by the EPA through regulation.
In most cases, a robust set of pollutant load data already exist for most permitted point sources through the UPDES permitting process, yet the data are seldom available for nonpoint sources. Therefore, the TMDL process must develop load calculations for nonpoint sources of pollution and for natural and legacy sources of pollution. In many circumstances, nonpoint source contributions will be broken down into additional categories such as agriculture, development, forestry, or mining.
Because identifying specific nonpoint sources of pollution is difficult, data likely will not be collected on individual nonpoint sources along a waterbody. Instead, most TMDLs focus on estimating the cumulative or combined contribution of all nonpoint sources along a waterbody.
1.1.2 WHY SHOULD TMDLS BE WRITTEN?
TMDL studies are intended to provide accurate estimates of the contribution of point and nonpoint sources to total pollution loads. Utah engages in an ongoing process of identifying waterbodies for TMDL development, developing the proper methods to calculate loads from all pollution sources, and implementing programs to reduce loads to meet water quality goals. Although the entire process takes years to complete for all waterbodies requiring a TMDL, some are completed more quickly than others (based on the cause of impairment and the effectiveness of water quality standards in bringing the waterbody into compliance).
Over the past 25 years, pollution control under the CWA has focused on point sources of pollution through the NPDES permitting process. Although water quality has improved in many instances, a number of waterbodies do not meet CWA goals, largely because (as data from the EPA [1998] suggests) nonpoint sources comprise the largest source of pollution in streams and lakes today.
Completion of TMDLs helps identify and more clearly illustrate the relationship between pollutant sources, pollutant loads, and beneficial use impairments. The data collected as part of this process will help focus local, state, and federal efforts on improving water quality to restore beneficial uses and meet water quality standards.
1.1.3 WHO IS RESPONSIBLE FOR WRITING TMDLS?
In Section 303(d) of the CWA, states are given the first opportunity to conduct TMDLs; if a state chooses not to establish TMDLs, the EPA must assume that responsibility for the state. In Utah, UDEQ leads TMDL research and submits the TMDLs to the EPA, Region XIII, for approval.
Both federal and state statutes grant the public the right to participate in the TMDL process. Participants may include permitted facilities (point sources), affected landowners (nonpoint

Middle Bear River and Cutler Reservoir Final TMDLs February 2010
8
sources), regulatory and management agencies, water managers, local governments, public interest groups, and concerned citizens. Watershed associations and similar local organizations are encouraged to foster communication, planning, and consensus among all of these stakeholders.
1.1.4 ELEMENTS OF A TMDL
Generally, TMDLs consist of three major sections:
1) Watershed characterization, data summary, and impairment assessment 2) Loading analysis 3) Implementation plan(s)
These sections are described in detail below.
1.1.4.1 Subbasin Assessment
A subbasin assessment (SBA) is conducted at the watershed scale and describes the affected area and associated water quality concerns, the beneficial use impairment status of individual waterbodies, the nature and location of pollution sources, and a summary of past and ongoing pollution control activities.
1.1.4.2 Loading Analysis
A loading analysis provides an estimate of a waterbody’s pollutant load capacity, MOS, and allocations of pollutant loads to sources defined as the TMDL in EPA regulations (40 CFR 130.2). Allocations are required for each permitted point source (as WLAs) and for all categories of nonpoint sources (as LAs); the sum of these allocations must not exceed load capacity.
A loading analysis is required for each pollutant of concern, but some listed impairments (e.g., low DO) result from other pollutants (e.g., nutrients) that cause excess algal growth. In these cases a list of impairments will be addressed by the loading analysis of its associated pollutant.
Although loading analyses can provide a quantitative assessment of pollutant loads, EPA regulations (40 CFR 130.2[i]) state that “loads may be expressed as mass per unit time, toxicity, or other appropriate measures,” though the EPA (40 CFR 130.2[g]) also acknowledges that “load allocations are best estimates of the loading, which may vary from reasonably accurate estimates to gross allotments.” In this context, load allocations refers both to LAs and to WLAs.
In 2006, EPA issued guidance regarding the expression of “daily” loads for all TMDLs. It is recommended that all TMDLs now be expressed in terms of daily load specific to appropriate conditions such as seasonal daily loads, event daily loads, or flow specific daily loads. In addition, TMDL documents may also include non-daily pollutant load expressions such as seasonal or annual loading time frame, depending on the pollutant of concern in aquatic systems. In light of this decision, this TMDL document uses annual, seasonal, and daily time increments to express the loads to Cutler Reservoir and Middle Bear River and to describe the required load reductions to meet allocations.
A complete loading analysis lays out a general pollution control strategy and an expected time frame for when water quality standards will be met. For pollution indicators such as sediment and nutrients, the measure of attainment is full support of beneficial uses. Long recovery periods (greater than five years) are expected for TMDLs dealing with nonpoint sources. Interim water quality targets are recommended in these instances. Along with the load reductions, these interim targets set the sideboards that define the specific actions that are scheduled in the subsequent implementation plan.

Middle Bear River and Cutler Reservoir Final TMDLs February 2010
9
1.1.4.3 Implementation Plan
The implementation plan is guided by the TMDL process and provides an action plan for achieving load reductions, a schedule of those actions, and follow-up monitoring to document progress. The plan specifies actions necessary for achieving full-support status of beneficial uses. Important elements of the implementation plan are:
A schedule of load reduction implementation activities; A schedule for meeting quality standards, including interim goals or milestones, as
appropriate; Identification of those responsible for each planned action; A description of the tracking process for documenting progress toward each goal; and A monitoring system for refining the TMDLs and/or documenting attainment of water
quality standards.
Determining the most appropriate load for nonpoint source pollutants is very complex. Therefore, a phased implementation approach is necessary to identify interim load reduction milestones for nonpoint sources (LAs), also to facilitate further monitoring to gauge the success of load reduction actions, and to evaluate the effect of load reductions on the status of beneficial use support for the impaired waterbody.
1.2 PROBLEM IDENTIFICATION
1.2.1 BENEFICIAL USES AND ASSOCIATED WATER QUALITY STANDARDS
The main purpose of the CWA is the improvement and protection of water quality through restoration and maintenance of the physical, chemical, and biological integrity of the nation’s waters. Protection of waters under the CWA consists of designating beneficial uses, establishing water quality criteria to protect those uses, and upholding antidegradation policies and procedures. Under Section 303(d) of the CWA, each state must submit a list to the EPA identifying waters throughout the state that are not achieving water quality standards in spite of the application of technology-based controls in NPDES permits. The waters identified on the 303(d) list are known as impaired waters.
The State of Utah designates beneficial uses to all surface waters in the state according to the classes outlined in Table 1.1. Recreational DBUs are for waterbodies that are suitable or are intended to be made suitable for primary and secondary contact recreation.
Table 1.1. Summary of Use Designations for Waters of the State of Utah
Class Designated Beneficial Use
1 Protected for use as a raw water source for domestic water systems.
1C Protected for domestic purposes with prior treatment by treatment processes as required by the Utah Division of Drinking Water.
2 Protected for recreational use and aesthetics.
2A Protected for primary contact recreation such as swimming.
2B Protected for secondary contact recreation such as boating, wading, or similar uses.
3 Protected for use by aquatic wildlife.
3A Protected for cold water species of game fish and other cold water aquatic life, including the necessary aquatic organisms in their food chain.
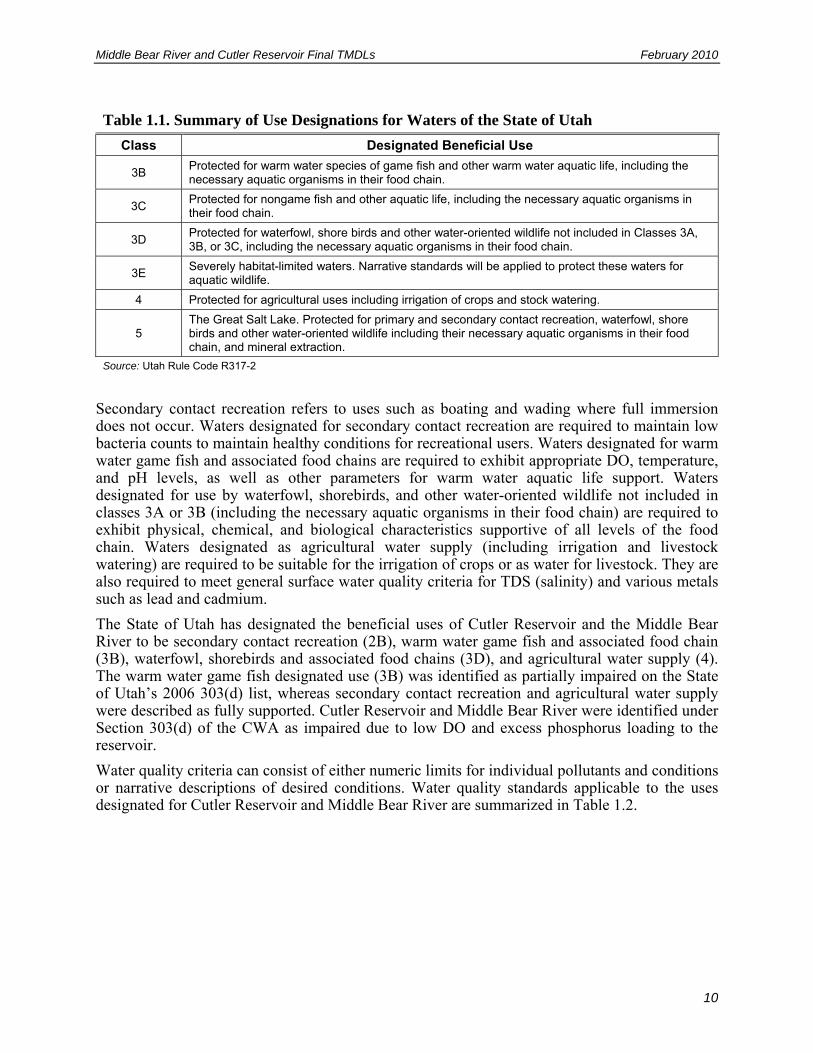
Middle Bear River and Cutler Reservoir Final TMDLs February 2010
10
Table 1.1. Summary of Use Designations for Waters of the State of Utah
Class Designated Beneficial Use
3B Protected for warm water species of game fish and other warm water aquatic life, including the necessary aquatic organisms in their food chain.
3C Protected for nongame fish and other aquatic life, including the necessary aquatic organisms in their food chain.
3D Protected for waterfowl, shore birds and other water-oriented wildlife not included in Classes 3A, 3B, or 3C, including the necessary aquatic organisms in their food chain.
3E Severely habitat-limited waters. Narrative standards will be applied to protect these waters for aquatic wildlife.
4 Protected for agricultural uses including irrigation of crops and stock watering.
5 The Great Salt Lake. Protected for primary and secondary contact recreation, waterfowl, shore birds and other water-oriented wildlife including their necessary aquatic organisms in their food chain, and mineral extraction.
Source: Utah Rule Code R317-2
Secondary contact recreation refers to uses such as boating and wading where full immersion does not occur. Waters designated for secondary contact recreation are required to maintain low bacteria counts to maintain healthy conditions for recreational users. Waters designated for warm water game fish and associated food chains are required to exhibit appropriate DO, temperature, and pH levels, as well as other parameters for warm water aquatic life support. Waters designated for use by waterfowl, shorebirds, and other water-oriented wildlife not included in classes 3A or 3B (including the necessary aquatic organisms in their food chain) are required to exhibit physical, chemical, and biological characteristics supportive of all levels of the food chain. Waters designated as agricultural water supply (including irrigation and livestock watering) are required to be suitable for the irrigation of crops or as water for livestock. They are also required to meet general surface water quality criteria for TDS (salinity) and various metals such as lead and cadmium.
The State of Utah has designated the beneficial uses of Cutler Reservoir and the Middle Bear River to be secondary contact recreation (2B), warm water game fish and associated food chain (3B), waterfowl, shorebirds and associated food chains (3D), and agricultural water supply (4). The warm water game fish designated use (3B) was identified as partially impaired on the State of Utah’s 2006 303(d) list, whereas secondary contact recreation and agricultural water supply were described as fully supported. Cutler Reservoir and Middle Bear River were identified under Section 303(d) of the CWA as impaired due to low DO and excess phosphorus loading to the reservoir.
Water quality criteria can consist of either numeric limits for individual pollutants and conditions or narrative descriptions of desired conditions. Water quality standards applicable to the uses designated for Cutler Reservoir and Middle Bear River are summarized in Table 1.2.

Middle Bear River and Cutler Reservoir Final TMDLs February 2010
11
Table 1.2. Water Quality Criteria Specific to Middle Bear River and Cutler Reservoir TMDLs
Parameter and DBU
Criterion Comments
Bacteria
2B Less than 206 E. coli organisms per 100 ml as a 30-day geometric mean; AND less than 940 E. coli organisms per 100 ml as a maximum
Footnote #7: Where the criteria are exceeded and there is a reasonable basis for concluding that the indicator bacteria are primarily from natural sources (wildlife), e.g., in National Wildlife Refuges and State Waterfowl Management Areas, the criteria may be considered attained. Exceedances of bacteriological numeric criteria from nonhuman nonpoint sources will generally be addressed through appropriate Federal, State, and local nonpoint source programs.
DO
3B No less than 5.5 mg/L (30-day average), 6.0 early life stage; 4.0 all life stages (7-day average), 5.0 early life stages; 3.0 all life stages (1-day minimum)
Footnote #2: These limits are not applicable to lower water levels in deep impoundments.
3D No less than 5.0 mg/L (30-day average), 3.0 (1-day minimum)
Biological Oxygen Demand
2B, 3B, 3D, 4 No greater than 5 mg/L Footnote #5: Investigations shall be conducted to develop more information where these pollution indicator levels are exceeded.
Narrative Standard
All uses
It shall be unlawful, and a violation of these regulations, for any person to discharge or place any waste or other substance in such a way as will be or may become offensive such as unnatural deposits, floating debris, oil, scum or other nuisances such as color, odor or taste; or cause conditions that produce undesirable aquatic life or that produce objectionable tastes in edible aquatic organisms; or result in concentrations or combinations of substances that produce undesirable physiological responses in desirable resident fish, or other desirable aquatic life, or undesirable human health effects, as determined by bioassay or other tests performed in accordance with standard procedures.
Footnote #5: Investigations shall be conducted to develop more information where these pollution indicator levels are exceeded.
Nutrients: Ammonia as N
3B 3D
The 30-day average concentration of total ammonia nitrogen (in mg/L as N) does not exceed, more than once every three years on the average, the chronic criterion calculated using the following equations. Fish Early Life Stages Are Present: mg/L as N (Chronic)= ((0.0577/1+10 E7.688-pH) + (2.487/1+10 EpH-7.688)) * MIN (2.85, 1.45*10 E0.028*(25-T)). Fish Early Life Stages Are Absent: mg/L as N (Chronic) = ((0.0577/1+10 E7.688-pH) + (2.487/1+10 EpH-7.688)) * 1.45*10 E0.028* (25-MAX(T-7))). The 1-hour average concentration of total ammonia nitrogen (in mg/L as N) does not exceed, more than once every three years on the average, the acute criterion calculated using the following equation:
mg/L as N (Acute) = 0.411/(1+10 E7.204-pH)) + (58.4/(1+10 EpH-7.204))
Early life stages include the prehatch embryonic stage, the posthatch free embryo or yolk-sac fry stage, and the larval stage for the species of fish expected to occur at the site. In addition, the highest 4-day average within the 30-day period should not exceed 2.5 times the chronic criterion. The Fish Early Life Stages Are Present 30-day average total ammonia criterion will be applied by default unless it is determined by the Division, on a site-specific basis, that it is appropriate to apply the Fish Early Life Stages Are Absent 30-day average criterion for all or some portion of the year. At a minimum, the Fish Early Life Stages Are Present criterion will apply from the beginning of spawning through the end of the early life stages. The Division will consult with UDWiR in making such determinations. The Division will maintain information regarding the waterbodies and time periods where application of the Early Life Stages Are Absent criterion is determined to be appropriate.
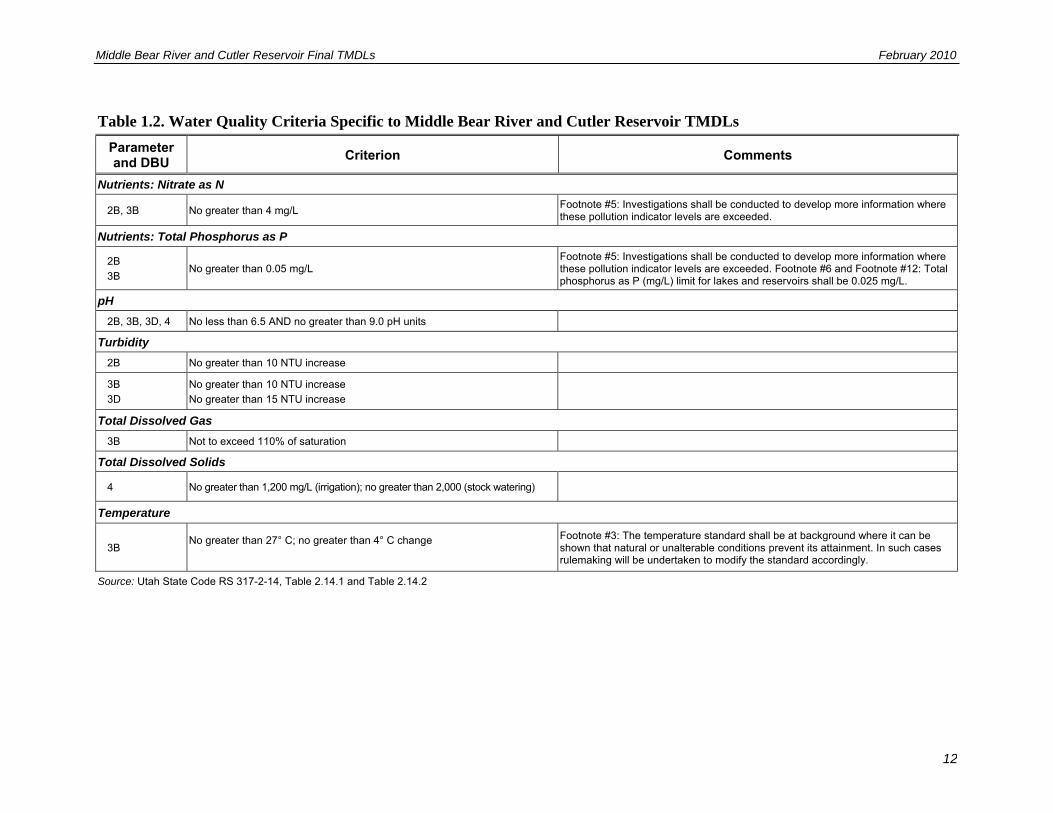
Middle Bear River and Cutler Reservoir Final TMDLs February 2010
12
Table 1.2. Water Quality Criteria Specific to Middle Bear River and Cutler Reservoir TMDLs
Parameter and DBU
Criterion Comments
Nutrients: Nitrate as N
2B, 3B No greater than 4 mg/L Footnote #5: Investigations shall be conducted to develop more information where these pollution indicator levels are exceeded.
Nutrients: Total Phosphorus as P
2B
3B No greater than 0.05 mg/L
Footnote #5: Investigations shall be conducted to develop more information where these pollution indicator levels are exceeded. Footnote #6 and Footnote #12: Total phosphorus as P (mg/L) limit for lakes and reservoirs shall be 0.025 mg/L.
pH 2B, 3B, 3D, 4 No less than 6.5 AND no greater than 9.0 pH units
Turbidity 2B No greater than 10 NTU increase
3B
3D
No greater than 10 NTU increase
No greater than 15 NTU increase
Total Dissolved Gas 3B Not to exceed 110% of saturation
Total Dissolved Solids
4 No greater than 1,200 mg/L (irrigation); no greater than 2,000 (stock watering)
Temperature
3B No greater than 27° C; no greater than 4° C change
Footnote #3: The temperature standard shall be at background where it can be shown that natural or unalterable conditions prevent its attainment. In such cases rulemaking will be undertaken to modify the standard accordingly.
Source: Utah State Code RS 317-2-14, Table 2.14.1 and Table 2.14.2

Middle Bear River and Cutler Reservoir Final TMDLs February 2010
13
1.2.2 CHARACTERIZATION OF IMPAIRED WATERS
The Middle Bear River and Cutler Reservoir are located in Cache County in northeastern Utah. Cutler Reservoir is located six miles west of Logan, Utah. The Cutler Dam impounds water from the Bear River, Logan River, Little Bear River, and Spring Creek. Cutler Reservoir (Assessment Unit UT-L-16010202-002) covers approximately 10,000 acres at its average storage capacity. The southern portion of the reservoir is shallow (0.55 m mean depth) with limited flow-through, which likely results in reservoir sediments exerting a greater influence on water quality than in the faster flowing and deeper northern portion of the reservoir (1.1 m mean depth). The reservoir has a very short hydraulic retention time (2.42 days on average for the year). The Bear River makes up almost half the flow to the reservoir, the majority of which short circuits through the northern section of the reservoir. Thus, flow through the open water portions of the reservoir, along the thalwegs of the Bear River, and along other tributaries is faster. Littoral areas around the edge of the reservoir often result in stagnant conditions, especially during low-flow periods.
The Middle Bear River segment stretches from the Utah-Idaho state line to Cutler Reservoir, and directly drains 1,280 miles of streams and 276 miles of canals within the Cutler Reservoir watershed. In 1911, a canal was constructed to connect the Bear River to Bear Lake, which had been hydrologically disconnected for approximately 11,000 years. Water released from Bear Lake during hot summer months supplements the flow of the Bear River during low-flow periods. During winter, water from the Bear River is diverted into Bear Lake. Water is diverted beginning mid-October through winter and spring into early summer. Most water enters Bear Lake during high runoff flows from mid-April to early June. Additional diversions and hydrologic modifications occur to supply water to municipalities, individual families, agricultural lands, waterfowl refuges, industries, and others. Often, more than half of the Middle Bear River’s natural flow is diverted for agricultural uses in Cache Valley, a substantial portion of which returns to the river, reservoir, and tributaries as return flow and subsurface recharge throughout the year, further complicating the water balance within the watershed.
Both the reservoir and river experience periodic low DO conditions that impair the warm water fishery use (3B) as well as nuisance algal growth in exceedance of literature thresholds identified for recreation uses (Raschke 1994). Phosphorus has been identified as the primary contributor to water quality exceedances within the Cutler Reservoir system. Under Section 303(d) of the CWA, Cutler Reservoir and the Middle Bear River have been identified as water quality limited due to low DO associated with total phosphorus. Cutler Reservoir was first listed as impaired on the 2004 303(d) list and was also included in the 2006 303(d) list. Impairments to water quality in the Middle Bear River were identified in the 1979 Water Quality Management Plan (Bear River Association of Governments 1982 Progress Report) for coliform bacteria, and elevated biochemical oxygen demand and phosphorus concentrations. The Middle Bear River was first listed on the 1992 303(d) list of impaired waters. A total phosphorus TMDL was approved by the EPA in 1996 on 27.84 miles of the river from Cutler Reservoir to the Idaho state line. The river was listed on the 2006 305(b) report in category 4a (existing TMDL) as partially supporting the warm-water fishery beneficial use. This TMDL represents a revision of the original 1996 TMDL for the Middle Bear River.
The 6,900-square mile Cutler Reservoir watershed, including the Middle Bear River, is part of the Bear River basin that encompasses northeastern Utah, southeastern Idaho, and southwestern Wyoming. There are approximately 2,022 linear miles of streams within the watershed, of which 16% are ditches or canals. The watershed is predominantly forest and shrubland cover in the mountains, with agricultural land uses in the lower elevations, primarily in the Cache Valley (see further discussion of land use and ownership in Chapter 2). A portion of Cache Valley is densely
Middle Bear River and Cutler Reservoir Final TMDL February 2010
14
populated and developed for residential and commercial land uses. Both Cutler Reservoir and Bear River experience frequent exceedances (100% and 59% of available data, respectively) of the TP indicators established for reservoirs and rivers (0.025 mg/L and 0.05 mg/L, respectively). Exceedances of DO standards have also been recorded in these systems, primarily related to algal and macrophyte respiration at night. Agricultural nonpoint sources are a large contributor to nutrient loads to the watershed. Regulated point sources for phosphorus, both within and outside the Cutler Reservoir watershed, include municipal and on-site wastewater treatment systems and industrial activities. Nonpoint sources for phosphorus within and outside the watershed include stormwater runoff from developed areas, runoff from agricultural lands and activities, other human activities and natural processes related to agriculture and forestry, urban and suburban land uses, and natural sources.
1.3 RELATED TMDLS
In the Cutler Reservoir watershed, the following tributaries have approved TMDLs for phosphorus: Spring Creek (Spring Creek TMDL 2002), Little Bear River (Little Bear River TMDL 2000), Newton Creek (Newton Creek TMDL 2004), and the Idaho portion of the Bear River (IDEQ 2006). A revision to the Cub River TMDL is currently in progress (personal communication between Erica Gaddis, SWCA, and Mike Allred, UDWQ, September 2007). In addition, a TMDL was completed for the Lower Bear River in 2002.
The Middle Bear River Water Quality Management Plan a (ERI and BRRCD 1995) was produced as a result of water quality concerns and loss of beneficial uses due to high bacterial concentrations, low DO concentrations, and phosphorus concentrations in exceedance of pollution indicator levels. Dissolved total phosphorus loads were in exceedance of water quality criteria in the Middle Bear River, Cub River, and Spring Creek during the 1993 monitoring period.
The 2002 TMDL for Spring Creek in Cache County, Utah, established a target total phosphorus TMDL of 0.05 mg/L at the drainage outlet and endpoints for DO, ammonia, and fecal coliforms to address impairments of the cold water fisheries (3A) and secondary contact recreation (2B) beneficial uses. The implementation strategy proposed reductions in point source phosphorus and ammonia, and implementation of nonpoint source BMPs.
The 2000 TMDL for the Little Bear River Watershed in Cache County, Utah, established a TMDL for total phosphorus in the stream of 0.05 mg/L and additional targets to reduce cropland runoff by 25%, restore 10 miles of streambank, and install BMPs on 7,500 acres to address impairments of the cold water fishery beneficial use (3A). The implementation strategy proposed BMPs to address animal waste storage and runoff, range/pasture runoff, irrigation runoff, riparian and streambank rehabilitation, and other point and nonpoint sources of nutrient loading.
The 2004 Clarkston Creek, Newton Reservoir, and Newton Creek TMDL Study in Cache County, Utah, established an instream/inflow total phosphorus TMDL of 0.05 mg/L for the three waterbodies, and 0.025 mg/L for the reservoir to address impairments of the cold water fishery beneficial use (3A). Load reduction targets were also included for Newton Creek and Newton Reservoir, and an endpoint of 4.0 mg/L in greater than 50% of the water column in Newton Reservoir were also included. The implementation strategies proposed the elimination of all
a This document is titled the Lower Bear River Management Plan, but it covers the area that the UDWQ now considers the Middle Bear River (i.e., the state line to Cutler Reservoir).
Middle Bear River and Cutler Reservoir Final TMDL February 2010
15
animal access to the waterbodies, adherence to recommended manure application schedules, conservation easements for all non-residential lands adjacent to the waterbodies and perennial tributaries of Clarkston Creek, and monitoring and maintenance of CNMPs on all AFOs in Clarkston and Newton Creeks.
The 2006 Bear River/Malad Subbasin Assessment and TMDL Plan in southeastern Idaho established total phosphorus TMDLs of 0.075 mg/L for streams and 0.05 mg/L for lakes and reservoirs, and TSS targets of 80 mg/L during runoff periods and 60 mg/L at base flow for streams, and 60 mg/L during runoff and 35 mg/L at base flow for lakes and reservoirs. Nutrients, sediment, and flow alteration were the reasons given for the 303(d) listing of the river, the Oneida Reservoir, and tributaries in the Middle Bear River subbasin above the Utah-Idaho border. Any implementation plan would concentrate on reducing suspended sediment and phosphorus.
The 82,367-acre Cub River Watershed straddles the Utah-Idaho border and is in large part agricultural land. The Cub River was listed on the Utah 2006 305(b) report in category 4a (existing TMDL) as partially supporting the warm-water fishery beneficial use. The Cub River Watershed Agricultural TMDL Implementation Plan (IDEQ 2006) identifies sediment and nutrients as the primary pollutants of concern for Cub River, with sediment and nutrient loading lowering water quality within the watershed and accelerating eutrophication of Cutler Reservoir. Nutrient and sediment sources include stream bank erosion from both natural and human sources, confined animal feeding operations, and pasture overutilization. Erosion is of particular concern during lower basin and upper basin spring runoff periods, which appear to contribute pollutants from different sources. Proposed implementation alternatives would focus on crop and rangeland BMPs, riparian and stream channel improvements, and animal facility waste management. The State of Utah is in the process of revising the TMDL for the Cub River for the watershed area within Utah.

Middle Bear River and Cutler Reservoir Final TMDL February 2010
16
This page intentionally blank.

Middle Bear River and Cutler Reservoir Final TMDLs February 2010
17
CHAPTER 2 CHARACTERIZATION OF WATERSHED
The Cutler Reservoir watershed lies within the larger Bear River basin that drains portions of northeastern Utah, southwestern Wyoming, and southeastern Idaho. The entire Cutler Reservoir watershed is over 6,900 square miles. The headwaters for the Bear River begin in Utah’s Uinta Mountain range and travel 500 miles before discharging into the Great Salt Lake. Cutler Reservoir is located six miles west of Logan, Utah, at an elevation of 4,407 feet. Cutler Reservoir impounds the waters of the Bear, Logan, and Little Bear Rivers and other small drainages. Cutler Dam, built in 1927 is operated by PacifiCorp Energy. Cutler Reservoir is used to provide water for agricultural use and for power generation.
The Middle Bear River and Cutler Reservoir TMDLs include the Utah portion of the hydrologic unit code (HUC) 16010202 and HUC 16010203, as well as 1 monitoring station (immediately downstream of Cutler Dam) in HUC 16010204. The project area includes the watershed that drains the Bear River as it enters Utah from Idaho at river mile 96.6 to its confluence with Cutler Reservoir and the subwatersheds that drain other streams and rivers discharging into the reservoir. Subwatersheds within the study area include the Utah portion of the Cub River, Logan River, Spring Creek, Little Bear River, Blacksmith Fork, and other small canals and streams in Cache Valley including Clay Slough, Swift Slough, and the area draining directly to Cutler Reservoir (see Appendix F: Figure F-1).
2.1 PHYSICAL AND BIOLOGICAL CHARACTERISTICS
The Utah portion of the Cutler Reservoir watershed (the study area for this TMDL) covers an area of 2,201 square miles and consists of a stream network that extends 2,022 linear miles, 16% of which consist of ditches or canals. The majority of the streams (1,280 miles) and canals (276 miles) are found in the direct drainage to the Middle Bear River. The Bear River system flows through old lake bottom sediments and consists of a complex channel with many oxbows, backwaters, eddies, and side channels. These features encourage sediment deposition and algal production that can impact water quality.
Steep terrain (with slopes as high as 85 degrees) characterize the mountains surrounding the relatively flat Cache Valley, where soils consist of alluvium and ancient lacustrine sediments. The watershed ranges in elevation from 4,395 feet at Cutler Dam to a high of 9,979 feet at Naomi Peak in the Bear River Mountain Range in the eastern part of the watershed.
2.1.1 CLIMATE
The Cutler Reservoir watershed lies within the semiarid climate of northeastern Utah. Much of the flow into Cutler Reservoir originates as snowmelt runoff in the higher elevations of the watershed. Climate data were obtained from the Western Regional Climate Center (WRCC) for stations throughout Cache Valley, including Lewiston (Station ID 425082), Trenton (Station ID 428828), Richmond (Station ID 427271), Logan Utah State University (USU) Experimental Station (Station ID 425190), Logan Radio KVNU (Station ID 425182), Logan USU (Station ID 425186), and Cutler Dam (Station ID 421918). In addition, high elevation meteorological data were obtained for the Tony Grove Lake SNOTEL station (Station ID 823) located in the northeastern section of the watershed in the headwaters of the Logan River. The SNOTEL station elevation is approximately 8,474 feet and is assumed to be characteristic of climate conditions in the higher elevations within the drainage area.
Average annual precipitation in northeastern Utah is 16.4 inches, though the annual average for the entire Bear River basin, including sections in Idaho and Wyoming, is 22 inches. Average
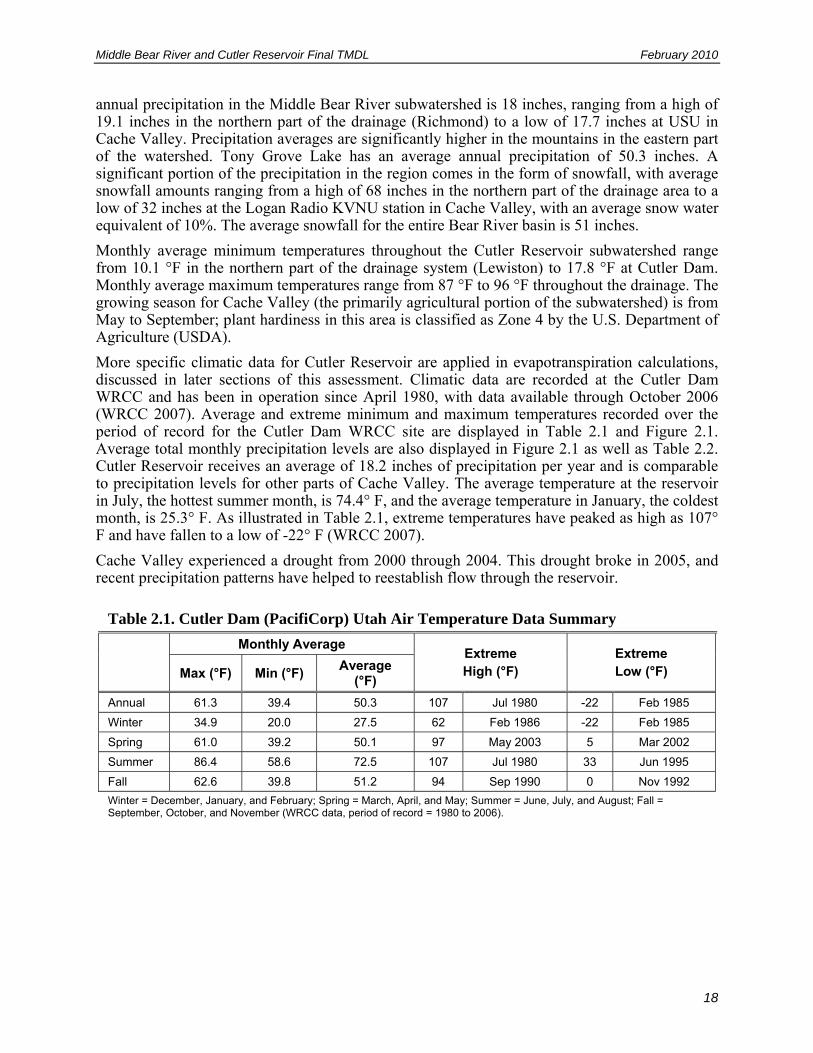
Middle Bear River and Cutler Reservoir Final TMDL February 2010
18
annual precipitation in the Middle Bear River subwatershed is 18 inches, ranging from a high of 19.1 inches in the northern part of the drainage (Richmond) to a low of 17.7 inches at USU in Cache Valley. Precipitation averages are significantly higher in the mountains in the eastern part of the watershed. Tony Grove Lake has an average annual precipitation of 50.3 inches. A significant portion of the precipitation in the region comes in the form of snowfall, with average snowfall amounts ranging from a high of 68 inches in the northern part of the drainage area to a low of 32 inches at the Logan Radio KVNU station in Cache Valley, with an average snow water equivalent of 10%. The average snowfall for the entire Bear River basin is 51 inches.
Monthly average minimum temperatures throughout the Cutler Reservoir subwatershed range from 10.1 °F in the northern part of the drainage system (Lewiston) to 17.8 °F at Cutler Dam. Monthly average maximum temperatures range from 87 °F to 96 °F throughout the drainage. The growing season for Cache Valley (the primarily agricultural portion of the subwatershed) is from May to September; plant hardiness in this area is classified as Zone 4 by the U.S. Department of Agriculture (USDA).
More specific climatic data for Cutler Reservoir are applied in evapotranspiration calculations, discussed in later sections of this assessment. Climatic data are recorded at the Cutler Dam WRCC and has been in operation since April 1980, with data available through October 2006 (WRCC 2007). Average and extreme minimum and maximum temperatures recorded over the period of record for the Cutler Dam WRCC site are displayed in Table 2.1 and Figure 2.1. Average total monthly precipitation levels are also displayed in Figure 2.1 as well as Table 2.2. Cutler Reservoir receives an average of 18.2 inches of precipitation per year and is comparable to precipitation levels for other parts of Cache Valley. The average temperature at the reservoir in July, the hottest summer month, is 74.4° F, and the average temperature in January, the coldest month, is 25.3° F. As illustrated in Table 2.1, extreme temperatures have peaked as high as 107° F and have fallen to a low of -22° F (WRCC 2007).
Cache Valley experienced a drought from 2000 through 2004. This drought broke in 2005, and recent precipitation patterns have helped to reestablish flow through the reservoir.
Table 2.1. Cutler Dam (PacifiCorp) Utah Air Temperature Data Summary
Monthly Average
Extreme High (°F)
Extreme Low (°F) Max (°F) Min (°F)
Average (°F)
Annual 61.3 39.4 50.3 107 Jul 1980 -22 Feb 1985
Winter 34.9 20.0 27.5 62 Feb 1986 -22 Feb 1985
Spring 61.0 39.2 50.1 97 May 2003 5 Mar 2002
Summer 86.4 58.6 72.5 107 Jul 1980 33 Jun 1995
Fall 62.6 39.8 51.2 94 Sep 1990 0 Nov 1992
Winter = December, January, and February; Spring = March, April, and May; Summer = June, July, and August; Fall = September, October, and November (WRCC data, period of record = 1980 to 2006).
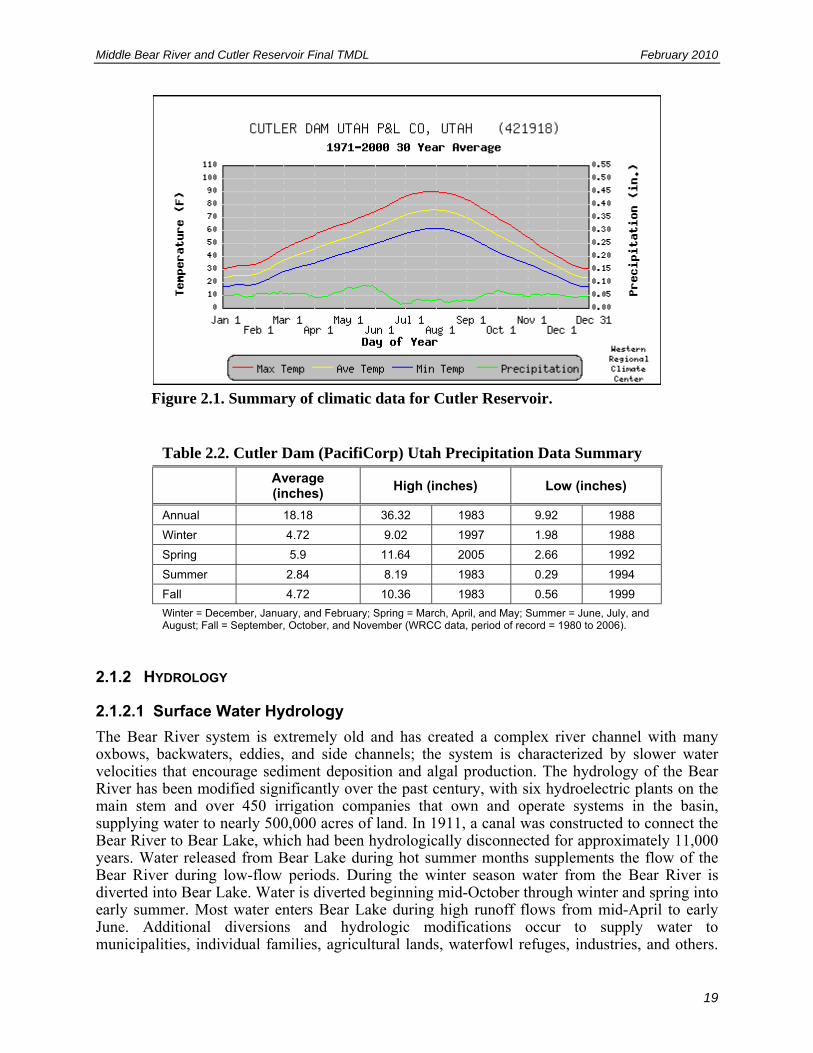
Middle Bear River and Cutler Reservoir Final TMDL February 2010
19
Figure 2.1. Summary of climatic data for Cutler Reservoir.
Table 2.2. Cutler Dam (PacifiCorp) Utah Precipitation Data Summary
Average (inches)
High (inches) Low (inches)
Annual 18.18 36.32 1983 9.92 1988
Winter 4.72 9.02 1997 1.98 1988
Spring 5.9 11.64 2005 2.66 1992
Summer 2.84 8.19 1983 0.29 1994
Fall 4.72 10.36 1983 0.56 1999
Winter = December, January, and February; Spring = March, April, and May; Summer = June, July, and August; Fall = September, October, and November (WRCC data, period of record = 1980 to 2006).
2.1.2 HYDROLOGY
2.1.2.1 Surface Water Hydrology
The Bear River system is extremely old and has created a complex river channel with many oxbows, backwaters, eddies, and side channels; the system is characterized by slower water velocities that encourage sediment deposition and algal production. The hydrology of the Bear River has been modified significantly over the past century, with six hydroelectric plants on the main stem and over 450 irrigation companies that own and operate systems in the basin, supplying water to nearly 500,000 acres of land. In 1911, a canal was constructed to connect the Bear River to Bear Lake, which had been hydrologically disconnected for approximately 11,000 years. Water released from Bear Lake during hot summer months supplements the flow of the Bear River during low-flow periods. During the winter season water from the Bear River is diverted into Bear Lake. Water is diverted beginning mid-October through winter and spring into early summer. Most water enters Bear Lake during high runoff flows from mid-April to early June. Additional diversions and hydrologic modifications occur to supply water to municipalities, individual families, agricultural lands, waterfowl refuges, industries, and others.

Middle Bear River and Cutler Reservoir Final TMDL February 2010
20
The hydrology of the Middle Bear River as it approaches Cutler Reservoir, as well as the numerous direct tributaries leading to the reservoir, have been altered from their natural flow paths by a network of canals and irrigation ditches that transect the watershed. Often, greater than half of the natural flow of the Middle Bear River is diverted for agricultural uses in Cache Valley, a substantial portion of which returns to the river, reservoir, and tributaries as return flow and subsurface recharge throughout the year, further complicating the water balance within the watershed. Hydrologic modifications to the Bear River watershed may continue in the future. For example, the Utah State Legislature directed the Utah Division of Water Resources (UDWaR) in 1991 to begin planning for the development of 220,000 acre-feet of Bear River water for municipal and industrial use along the Wasatch Front.
Cutler Dam impounds water from the main stem of the Bear River, including the Cub River, the Logan River, including Blacksmith Fork, Little Bear, Spring Creek, and several canals and sloughs in Cache Valley such as Clay Slough, Swift Slough, and the area draining directly to the reservoir (see Appendix F: Figure F-1). The dam was constructed in 1927 by Utah Power and Light, now know as PacifiCorp. The dam is currently operated by PacifiCorp Energy to provide water for agricultural use and power generation. The Federal Energy Regulatory Commission (FERC) license for Cutler Dam as a hydropower facility was renewed in 1999 and amended with a supplement in 2002. It included the establishment of an operational elevation range at which the reservoir would be maintained to support fish and wildlife in the reservoir. This operational elevation range is listed in the FERC 1999 license as between 4,406.5 and 4,407.5 feet for most of the year. The operation plan allows for the reservoir to be drawn down to 4,406 feet between December 2 and February 28.
Cutler Reservoir has a maximum storage capacity of 23,800 acre-feet of water at an elevation of 4,410 (practical quantified maximum) with a large surface area and shallow depth. When the dam is maintained at 4,407 feet, the average condition for the reservoir, the reservoir volume is 8,181 acre-feet, resulting in approximately 10,000 acres of open water and associated wetlands. Although the dam is 110 feet tall, sedimentation in the reservoir has reduced the maximum total storage capacity behind the dam (elevation 4,410 feet) from 38,000 to 23,800 acre-feet (personal communication between Erica Gaddis, SWCA, and Connely Baldwin, PacifiCorp, March 4, 2008). Currently, the hydraulic retention time of the reservoir is 2.42 days on average for the year. The retention time is slightly higher in the southern end of the reservoir (averaging 3.97 days) than the northern end of the reservoir (averaging 1.47 days). This is because the Bear River makes up almost half the flow to the reservoir, the majority of which short circuits through the northern section of the reservoir. Thus the retention time along the thalweg of the Bear River and other tributaries to Cutler Reservoir is likely to be much shorter, whereas areas around the edge of the reservoir have much longer retention time, often leading to stagnant conditions during low-flow periods. In addition, retention times vary by season. The average retention time in the spring is the shortest at 1.96 days and the longest is in the summer and fall, at 2.8 days. The average retention time in the winter is 2.6 days. Cutler Reservoir’s outlets include the lower Bear River, West Side Canal, and Hammond Main Canal.
The Cutler Reservoir watershed includes the Utah portion of HUC 16010202 and HUC 16010203, as well as a small area (immediately downstream of Cutler Dam) in HUC 16010204. The majority of the water in the Cutler Reservoir watershed originates as snowmelt in the mountains found throughout the Bear River Basin. Diversions in the watershed occur along each of the major tributaries. The largest tributary to the Bear River along this segment, Cub River also drains portions of Idaho before converging with the Bear River in Utah. The Bear River Mountain Range includes the drainage of the Logan River subwatershed, which discharges directly into Cutler Reservoir. The Logan River is impounded three times as it travels down Logan Canyon at Third
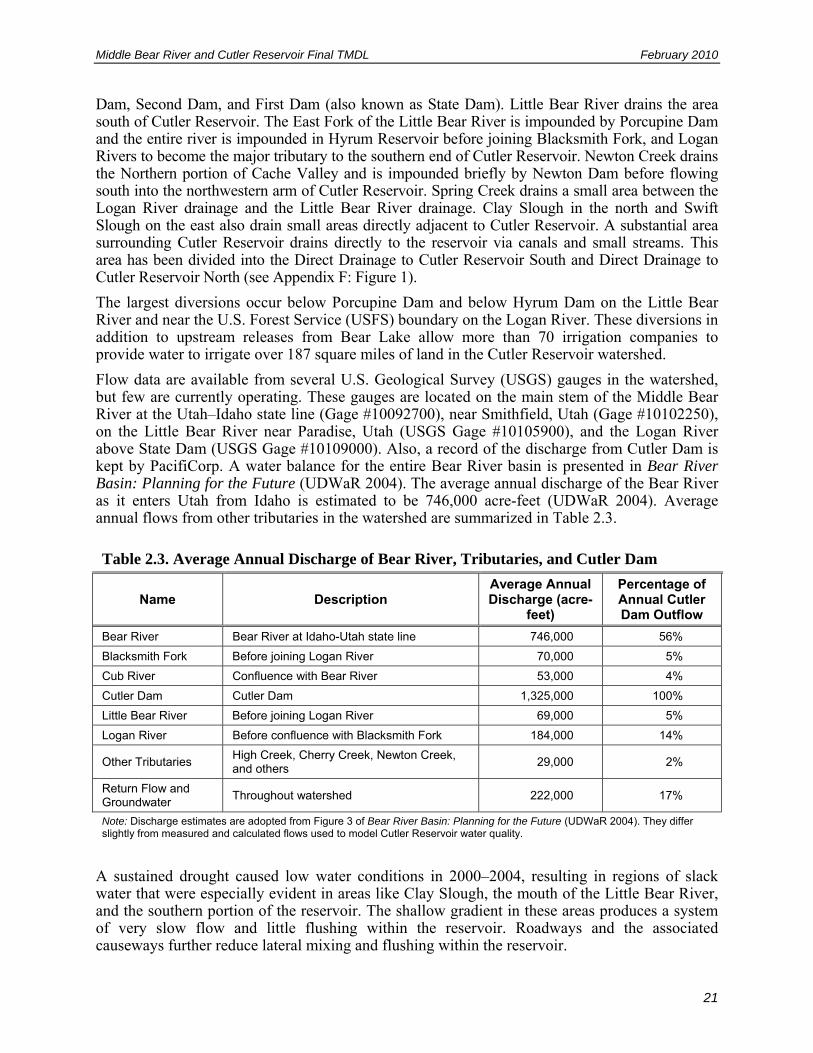
Middle Bear River and Cutler Reservoir Final TMDL February 2010
21
Dam, Second Dam, and First Dam (also known as State Dam). Little Bear River drains the area south of Cutler Reservoir. The East Fork of the Little Bear River is impounded by Porcupine Dam and the entire river is impounded in Hyrum Reservoir before joining Blacksmith Fork, and Logan Rivers to become the major tributary to the southern end of Cutler Reservoir. Newton Creek drains the Northern portion of Cache Valley and is impounded briefly by Newton Dam before flowing south into the northwestern arm of Cutler Reservoir. Spring Creek drains a small area between the Logan River drainage and the Little Bear River drainage. Clay Slough in the north and Swift Slough on the east also drain small areas directly adjacent to Cutler Reservoir. A substantial area surrounding Cutler Reservoir drains directly to the reservoir via canals and small streams. This area has been divided into the Direct Drainage to Cutler Reservoir South and Direct Drainage to Cutler Reservoir North (see Appendix F: Figure 1).
The largest diversions occur below Porcupine Dam and below Hyrum Dam on the Little Bear River and near the U.S. Forest Service (USFS) boundary on the Logan River. These diversions in addition to upstream releases from Bear Lake allow more than 70 irrigation companies to provide water to irrigate over 187 square miles of land in the Cutler Reservoir watershed.
Flow data are available from several U.S. Geological Survey (USGS) gauges in the watershed, but few are currently operating. These gauges are located on the main stem of the Middle Bear River at the Utah–Idaho state line (Gage #10092700), near Smithfield, Utah (Gage #10102250), on the Little Bear River near Paradise, Utah (USGS Gage #10105900), and the Logan River above State Dam (USGS Gage #10109000). Also, a record of the discharge from Cutler Dam is kept by PacifiCorp. A water balance for the entire Bear River basin is presented in Bear River Basin: Planning for the Future (UDWaR 2004). The average annual discharge of the Bear River as it enters Utah from Idaho is estimated to be 746,000 acre-feet (UDWaR 2004). Average annual flows from other tributaries in the watershed are summarized in Table 2.3.
Table 2.3. Average Annual Discharge of Bear River, Tributaries, and Cutler Dam
Name Description Average Annual Discharge (acre-
feet)
Percentage of Annual Cutler Dam Outflow
Bear River Bear River at Idaho-Utah state line 746,000 56%
Blacksmith Fork Before joining Logan River 70,000 5%
Cub River Confluence with Bear River 53,000 4%
Cutler Dam Cutler Dam 1,325,000 100%
Little Bear River Before joining Logan River 69,000 5%
Logan River Before confluence with Blacksmith Fork 184,000 14%
Other Tributaries High Creek, Cherry Creek, Newton Creek, and others
29,000 2%
Return Flow and Groundwater
Throughout watershed 222,000 17%
Note: Discharge estimates are adopted from Figure 3 of Bear River Basin: Planning for the Future (UDWaR 2004). They differ slightly from measured and calculated flows used to model Cutler Reservoir water quality.
A sustained drought caused low water conditions in 2000–2004, resulting in regions of slack water that were especially evident in areas like Clay Slough, the mouth of the Little Bear River, and the southern portion of the reservoir. The shallow gradient in these areas produces a system of very slow flow and little flushing within the reservoir. Roadways and the associated causeways further reduce lateral mixing and flushing within the reservoir.
Middle Bear River and Cutler Reservoir Final TMDL February 2010
22
2.1.2.2 Groundwater Hydrology
Groundwater resources throughout the Cutler Reservoir watershed include artesian, perched, confined, and unconfined aquifers, with confinement being most notable in the central portions of Cache Valley. The groundwater resources of Cache Valley are intricately connected to surface waters; consequently, further development of groundwater resources in the valley is subject to the State Engineer’s office Groundwater Management Plan to manage ground and surface waters.
A water balance of the Cache Valley groundwater resources was conducted by the USGS and estimates the average annual recharge of groundwater to be 223,000 acre-feet. Groundwater seepage to streams (70,000 acre-feet) and spring discharge (58,000 acre-feet) is expected to be reduced if groundwater withdrawals, currently totaling 28,000 acre-feet, are increased (Herbert and Thomas 1992).
2.1.3 GEOLOGY AND SOILS
2.1.3.1 Geology
The Cutler Reservoir watershed intersects the Middle Rocky Mountain Physiographic Province to the east and the Basin and Range Physiographic Province beginning at the base of the Bear River Mountain Range and extending west. The Bear River Mountain Range to the east of Cache Valley is characterized by sedimentary and metamorphic geologic formations of Precambrian to Permian ages. The Wellsville Mountains and Clarkston Mountains to the southwest and northwest of Cache Valley, respectively, have a similar geologic makeup. Dominant rock types in these mountains include dolomite, limestone, and quartzite. The foothills surrounding Cache Valley consist of Mississippian and Ordovician–Silurian–Devonian sedimentary deposits (see Appendix F: Figure F-2).
Most of the valleys in the mountains of the Cutler Reservoir watershed are incised by streams to form V-shaped fluvial canyons. Streams in fluvial canyons are typically defined by steep stream grade and valley slopes, with stream bottoms composed primarily of boulders and cobble. Some U-shaped glacial valleys also occur, especially in the Bear River Mountain Range. Alluvial deltas remain from the period of Lake Bonneville and are now carved by streams to form alluvial canyons with moderate stream grade and gravel bottoms. Cache Valley bedrock and soils are composed of alluvial and lake deposits of varying thicknesses; these are remnants of Lake Bonneville sediments and deposits from the surrounding mountains.
2.1.3.2 Soils
Soil data for the Cutler Reservoir watershed were collected by the USDA Natural Resources Conservation Service (NRCS) and the State Soil Geographic Database (STATSGO). Soil locations and extents are detailed in Appendix F: Figure F-3. Over 200 soil types have been classified in the Cutler Reservoir watershed. The most common soil textures in the Cutler Reservoir watershed are detailed in Table 2.4. Silty and loamy soils account for 20% and 9% of the watershed area, respectively. The western part of the watershed is dominated by loamy and silty soils, with cobbly loam and cobbly silty clay soils found in the Wellsville Mountains in the southwestern part of the watershed. The valley floor is dominated by silty clay loam, silty loam, and silty clay soils, which support agricultural land uses in Cache Valley. Silty loam soils predominate in the southern end of the watershed, with large pockets of cobbly and gravelly loam soils. A variety of soil types are found in the drainage of Spring Creek and Little Bear River, although no soil data are available for substantial portions of the Logan River drainage. Some of this area, high in the Bear River Mountain Range, consists of bedrock parent
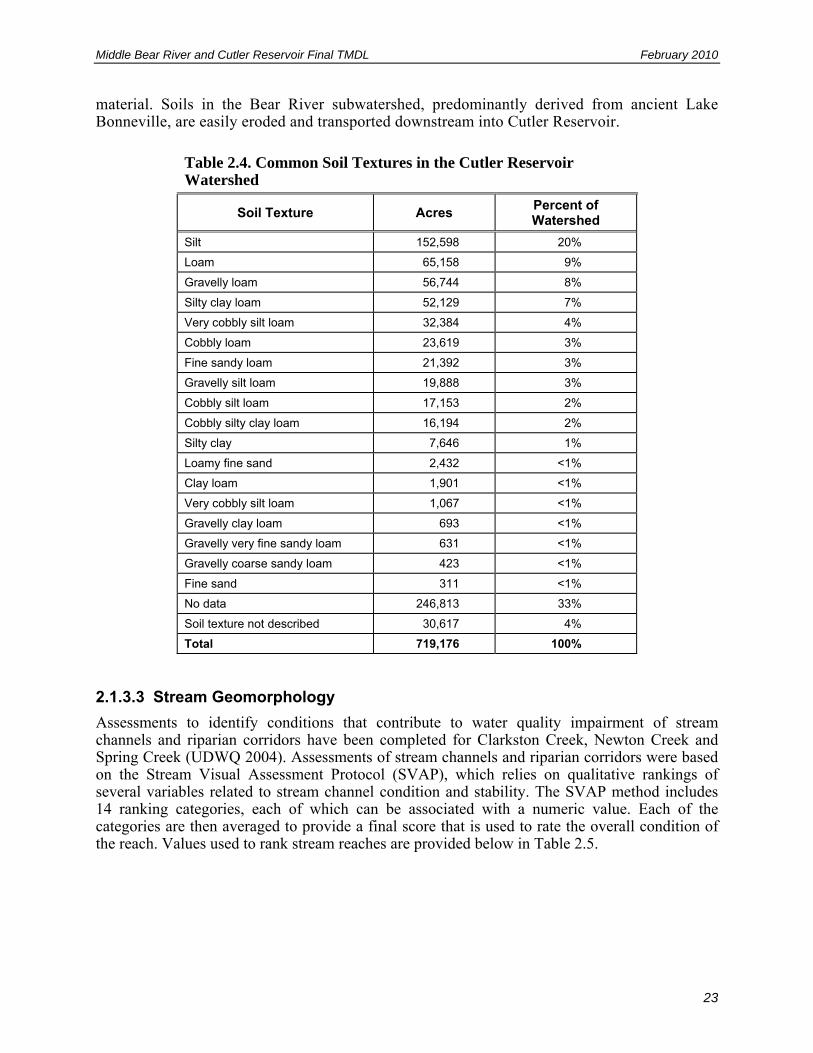
Middle Bear River and Cutler Reservoir Final TMDL February 2010
23
material. Soils in the Bear River subwatershed, predominantly derived from ancient Lake Bonneville, are easily eroded and transported downstream into Cutler Reservoir.
Table 2.4. Common Soil Textures in the Cutler Reservoir Watershed
Soil Texture Acres Percent of Watershed
Silt 152,598 20%
Loam 65,158 9%
Gravelly loam 56,744 8%
Silty clay loam 52,129 7%
Very cobbly silt loam 32,384 4%
Cobbly loam 23,619 3%
Fine sandy loam 21,392 3%
Gravelly silt loam 19,888 3%
Cobbly silt loam 17,153 2%
Cobbly silty clay loam 16,194 2%
Silty clay 7,646 1%
Loamy fine sand 2,432 <1%
Clay loam 1,901 <1%
Very cobbly silt loam 1,067 <1%
Gravelly clay loam 693 <1%
Gravelly very fine sandy loam 631 <1%
Gravelly coarse sandy loam 423 <1%
Fine sand 311 <1%
No data 246,813 33%
Soil texture not described 30,617 4%
Total 719,176 100%
2.1.3.3 Stream Geomorphology
Assessments to identify conditions that contribute to water quality impairment of stream channels and riparian corridors have been completed for Clarkston Creek, Newton Creek and Spring Creek (UDWQ 2004). Assessments of stream channels and riparian corridors were based on the Stream Visual Assessment Protocol (SVAP), which relies on qualitative rankings of several variables related to stream channel condition and stability. The SVAP method includes 14 ranking categories, each of which can be associated with a numeric value. Each of the categories are then averaged to provide a final score that is used to rate the overall condition of the reach. Values used to rank stream reaches are provided below in Table 2.5.
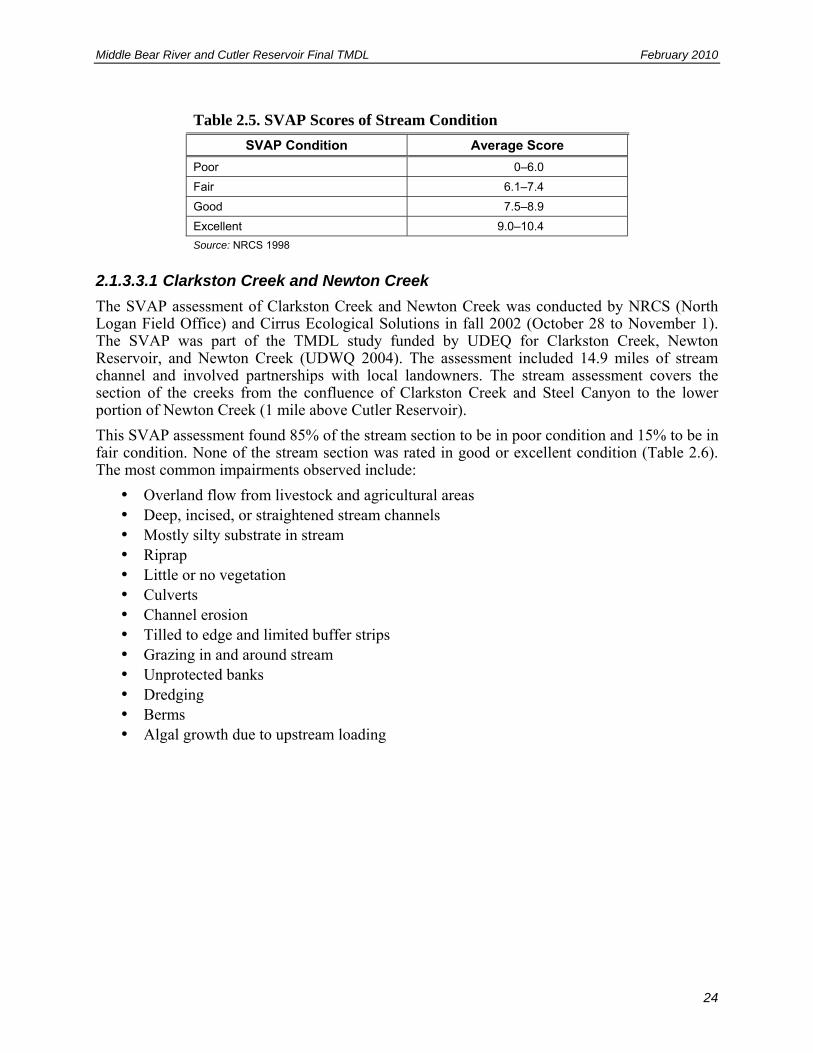
Middle Bear River and Cutler Reservoir Final TMDL February 2010
24
Table 2.5. SVAP Scores of Stream Condition
SVAP Condition Average Score
Poor 0–6.0
Fair 6.1–7.4
Good 7.5–8.9
Excellent 9.0–10.4
Source: NRCS 1998
2.1.3.3.1 Clarkston Creek and Newton Creek The SVAP assessment of Clarkston Creek and Newton Creek was conducted by NRCS (North Logan Field Office) and Cirrus Ecological Solutions in fall 2002 (October 28 to November 1). The SVAP was part of the TMDL study funded by UDEQ for Clarkston Creek, Newton Reservoir, and Newton Creek (UDWQ 2004). The assessment included 14.9 miles of stream channel and involved partnerships with local landowners. The stream assessment covers the section of the creeks from the confluence of Clarkston Creek and Steel Canyon to the lower portion of Newton Creek (1 mile above Cutler Reservoir).
This SVAP assessment found 85% of the stream section to be in poor condition and 15% to be in fair condition. None of the stream section was rated in good or excellent condition (Table 2.6). The most common impairments observed include:
• Overland flow from livestock and agricultural areas • Deep, incised, or straightened stream channels • Mostly silty substrate in stream • Riprap • Little or no vegetation • Culverts • Channel erosion • Tilled to edge and limited buffer strips • Grazing in and around stream • Unprotected banks • Dredging • Berms • Algal growth due to upstream loading
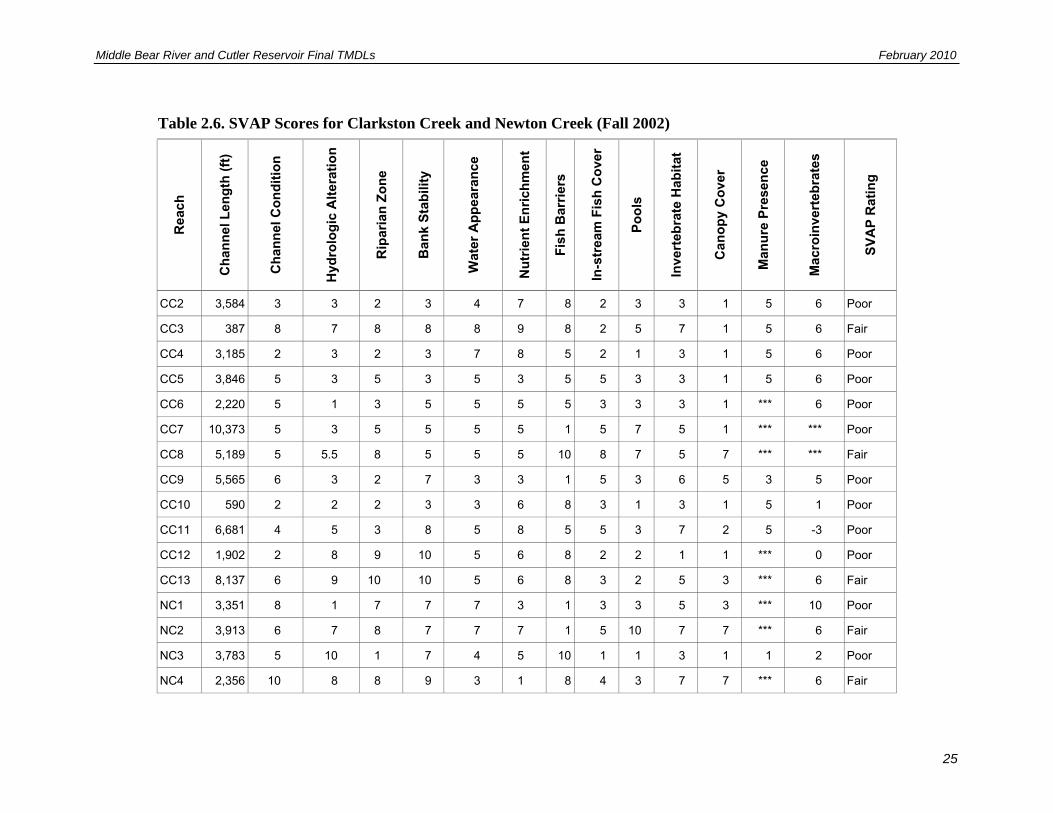
Middle Bear River and Cutler Reservoir Final TMDLs February 2010
25
Table 2.6. SVAP Scores for Clarkston Creek and Newton Creek (Fall 2002)
Rea
ch
Ch
ann
el L
eng
th (
ft)
Ch
ann
el C
on
dit
ion
Hyd
rolo
gic
Alt
erat
ion
Rip
aria
n Z
on
e
Ban
k S
tab
ility
Wat
er A
pp
eara
nce
Nu
trie
nt
En
rich
men
t
Fis
h B
arri
ers
In-s
trea
m F
ish
Co
ver
Po
ols
Inve
rteb
rate
Hab
itat
Can
op
y C
ove
r
Man
ure
Pre
sen
ce
Mac
roin
vert
ebra
tes
SV
AP
Rat
ing
CC2 3,584 3 3 2 3 4 7 8 2 3 3 1 5 6 Poor
CC3 387 8 7 8 8 8 9 8 2 5 7 1 5 6 Fair
CC4 3,185 2 3 2 3 7 8 5 2 1 3 1 5 6 Poor
CC5 3,846 5 3 5 3 5 3 5 5 3 3 1 5 6 Poor
CC6 2,220 5 1 3 5 5 5 5 3 3 3 1 *** 6 Poor
CC7 10,373 5 3 5 5 5 5 1 5 7 5 1 *** *** Poor
CC8 5,189 5 5.5 8 5 5 5 10 8 7 5 7 *** *** Fair
CC9 5,565 6 3 2 7 3 3 1 5 3 6 5 3 5 Poor
CC10 590 2 2 2 3 3 6 8 3 1 3 1 5 1 Poor
CC11 6,681 4 5 3 8 5 8 5 5 3 7 2 5 -3 Poor
CC12 1,902 2 8 9 10 5 6 8 2 2 1 1 *** 0 Poor
CC13 8,137 6 9 10 10 5 6 8 3 2 5 3 *** 6 Fair
NC1 3,351 8 1 7 7 7 3 1 3 3 5 3 *** 10 Poor
NC2 3,913 6 7 8 7 7 7 1 5 10 7 7 *** 6 Fair
NC3 3,783 5 10 1 7 4 5 10 1 1 3 1 1 2 Poor
NC4 2,356 10 8 8 9 3 1 8 4 3 7 7 *** 6 Fair
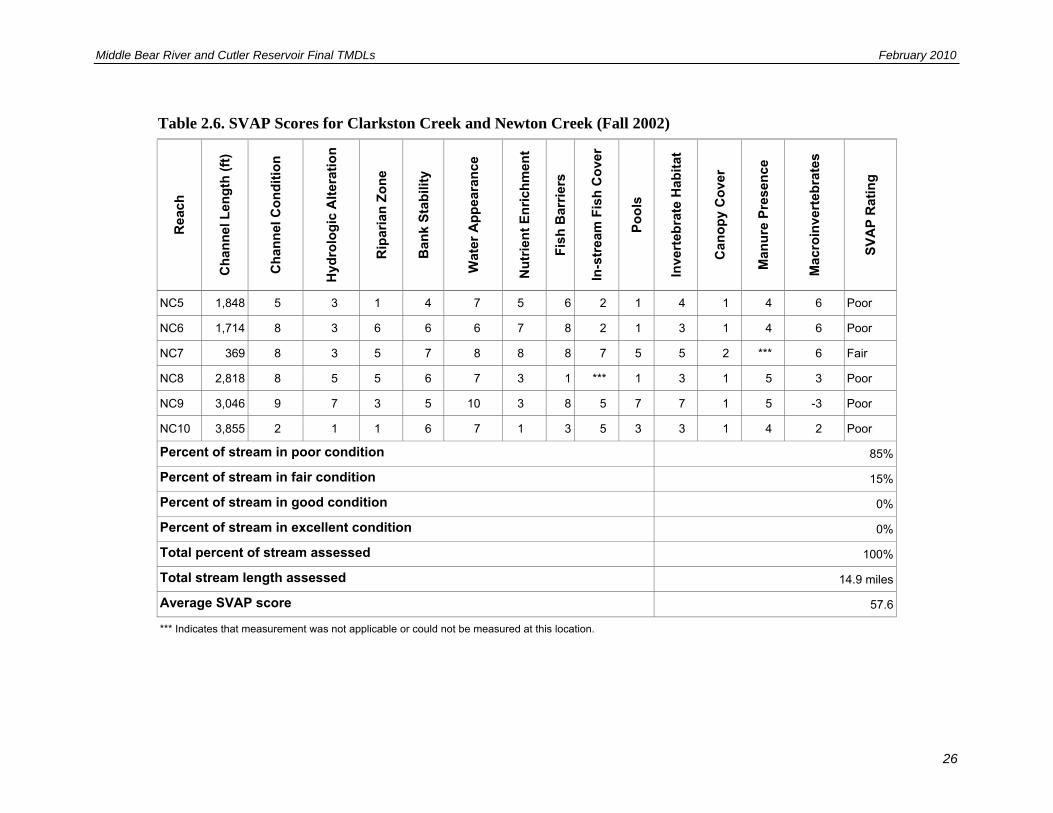
Middle Bear River and Cutler Reservoir Final TMDLs February 2010
26
Table 2.6. SVAP Scores for Clarkston Creek and Newton Creek (Fall 2002)
Rea
ch
Ch
ann
el L
eng
th (
ft)
Ch
ann
el C
on
dit
ion
Hyd
rolo
gic
Alt
erat
ion
Rip
aria
n Z
on
e
Ban
k S
tab
ility
Wat
er A
pp
eara
nce
Nu
trie
nt
En
rich
men
t
Fis
h B
arri
ers
In-s
trea
m F
ish
Co
ver
Po
ols
Inve
rteb
rate
Hab
itat
Can
op
y C
ove
r
Man
ure
Pre
sen
ce
Mac
roin
vert
ebra
tes
SV
AP
Rat
ing
NC5 1,848 5 3 1 4 7 5 6 2 1 4 1 4 6 Poor
NC6 1,714 8 3 6 6 6 7 8 2 1 3 1 4 6 Poor
NC7 369 8 3 5 7 8 8 8 7 5 5 2 *** 6 Fair
NC8 2,818 8 5 5 6 7 3 1 *** 1 3 1 5 3 Poor
NC9 3,046 9 7 3 5 10 3 8 5 7 7 1 5 -3 Poor
NC10 3,855 2 1 1 6 7 1 3 5 3 3 1 4 2 Poor
Percent of stream in poor condition 85%
Percent of stream in fair condition 15%
Percent of stream in good condition 0%
Percent of stream in excellent condition 0%
Total percent of stream assessed 100%
Total stream length assessed 14.9 miles
Average SVAP score 57.6
*** Indicates that measurement was not applicable or could not be measured at this location.
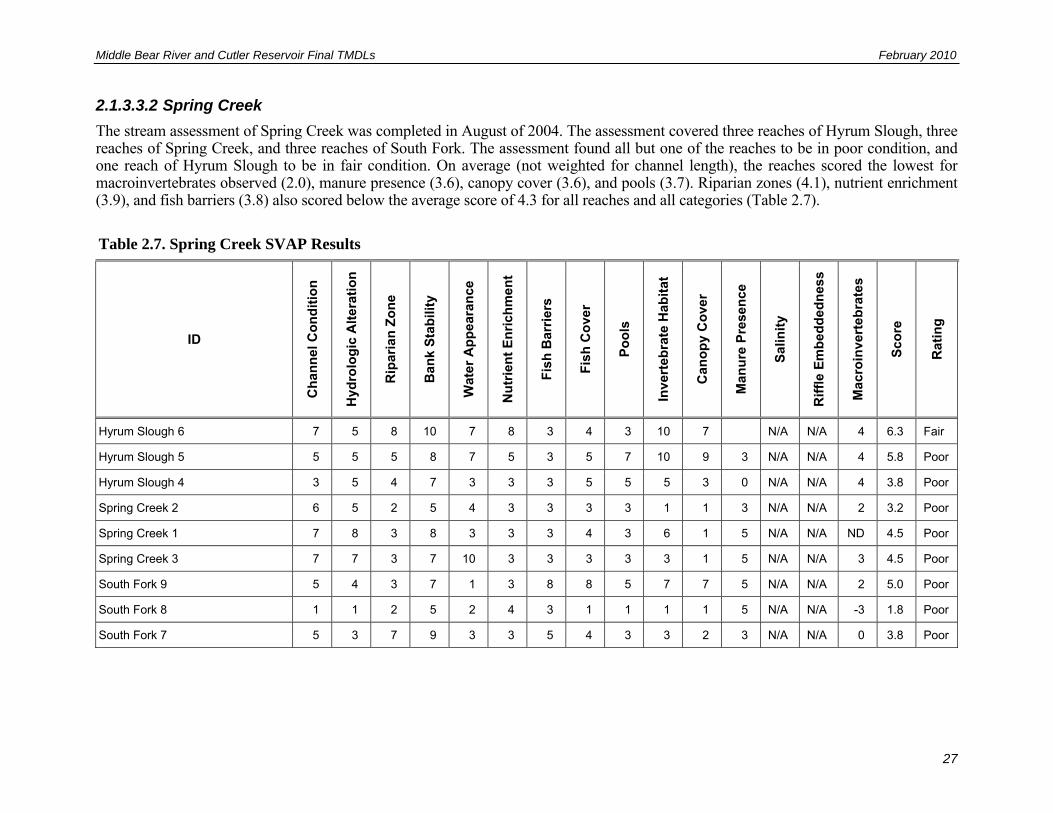
Middle Bear River and Cutler Reservoir Final TMDLs February 2010
27
2.1.3.3.2 Spring Creek The stream assessment of Spring Creek was completed in August of 2004. The assessment covered three reaches of Hyrum Slough, three reaches of Spring Creek, and three reaches of South Fork. The assessment found all but one of the reaches to be in poor condition, and one reach of Hyrum Slough to be in fair condition. On average (not weighted for channel length), the reaches scored the lowest for macroinvertebrates observed (2.0), manure presence (3.6), canopy cover (3.6), and pools (3.7). Riparian zones (4.1), nutrient enrichment (3.9), and fish barriers (3.8) also scored below the average score of 4.3 for all reaches and all categories (Table 2.7).
Table 2.7. Spring Creek SVAP Results
ID
Ch
ann
el C
on
dit
ion
Hyd
rolo
gic
Alt
erat
ion
Rip
aria
n Z
on
e
Ban
k S
tab
ility
Wat
er A
pp
eara
nce
Nu
trie
nt
En
rich
men
t
Fis
h B
arri
ers
Fis
h C
ove
r
Po
ols
Inve
rteb
rate
Hab
itat
Can
op
y C
ove
r
Man
ure
Pre
sen
ce
Sal
init
y
Rif
fle
Em
bed
ded
nes
s
Mac
roin
vert
ebra
tes
Sco
re
Rat
ing
Hyrum Slough 6 7 5 8 10 7 8 3 4 3 10 7 N/A N/A 4 6.3 Fair
Hyrum Slough 5 5 5 5 8 7 5 3 5 7 10 9 3 N/A N/A 4 5.8 Poor
Hyrum Slough 4 3 5 4 7 3 3 3 5 5 5 3 0 N/A N/A 4 3.8 Poor
Spring Creek 2 6 5 2 5 4 3 3 3 3 1 1 3 N/A N/A 2 3.2 Poor
Spring Creek 1 7 8 3 8 3 3 3 4 3 6 1 5 N/A N/A ND 4.5 Poor
Spring Creek 3 7 7 3 7 10 3 3 3 3 3 1 5 N/A N/A 3 4.5 Poor
South Fork 9 5 4 3 7 1 3 8 8 5 7 7 5 N/A N/A 2 5.0 Poor
South Fork 8 1 1 2 5 2 4 3 1 1 1 1 5 N/A N/A -3 1.8 Poor
South Fork 7 5 3 7 9 3 3 5 4 3 3 2 3 N/A N/A 0 3.8 Poor

Middle Bear River and Cutler Reservoir Final TMDLs February 2010
28
This page intentionally blank.
Middle Bear River and Cutler Reservoir Final TMDLs February 2010
29
2.1.4 PLANTS, WILDLIFE, AND FISHERIES
2.1.4.1 Riparian Plant Community
Riparian areas are ecologically important in terms of plant diversity, wildlife habitat, and erosion control along waterways. They can also be a factor in filtering overland flow of sediment and nutrients that may return to the stream. Riparian communities exist along many rivers and stream channels in Cache Valley and are characterized by cottonwood (Populus fremontii and P. angustifolia), box elder (Acer negundo), redtwig dogwood (Cornus sericea) and willow species (Salix exigua). Invasive species such as salt cedar (Tamarix sp.) and Russian olive (Elaeagnus angustifolia) are present in some riparian areas.
The wetlands in the southern end of Cutler Reservoir provide habitat for waterfowl and other water birds. The wetland vegetation is a mixture of emergent marsh dominated by cattail (Typha latifolia) and common reed (Phragmites australis), freshwater wet meadows are dominated by hardstem bulrush (Schoenoplectus acutus) and Baltic rush (Juncus balticus), and saline wet meadows are dominated by saltgrass (Distichlis spicata).
Invasive species comprise a large percentage of plants in the wetland surrounding Cutler Reservoir. Emergent marsh species reed canary grass (Phalaris arundinacea), common reed, and broadleaf cattail, include both native and non-native phenotypes, many of which are invasive. Altered hydrology exacerbates the invasiveness of these species (Warren et al. 2001, Galatowitsch et al. 1999).
2.1.4.2 Upland Plant Community
High elevation forested habitat in the mountains surrounding Cache Valley is dominated by deciduous and coniferous forests. Gambel oak (Quercus gambelii) and bigtooth maple (Acer grandidtentatum) woodlands are found mostly at lower elevations and on west- and south-facing slopes. At higher elevations, aspen (Populus tremuloides) stands are common. Forests populated with white fir (Abies concolor), Douglas fir (Pseudotsuga menziesii), Engelmann’s spruce (Picea engelmannii), and lodgepole pine (Pinus contorta) are found mainly on north-facing slopes at higher elevations. Subalpine fir (Abies lasiocarpa) are common above 8,000 feet in these forests. Utah juniper (Juniperus osteosperma) communities are also found on the mountain slopes and within the canyons.
Mountain valley slopes are dominated by sagebrush (Artemisia tridentata) and grasslands. Within these grasslands, cheatgrass (Bromus tectorum) and wheat grasses (Thinopyrum and Agropyron spp.) are common. Native grasses such as sand dropseed (Sporobolus cryptandrus) and Indian ricegrass (Achnatherum hymenoides) can also be found on hillsides where land disturbance has been minimal.
2.1.4.3 Wildlife
The topographical variation within Cache Valley and the Bear River watershed creates a wide range of habitat types for wildlife. The mountain ranges, such as the Bear River Mountains maintained by the USFS Wasatch–Cache National Forest, are habitat for deer, elk, and moose, as well as for a variety of upland birds and small mammals.
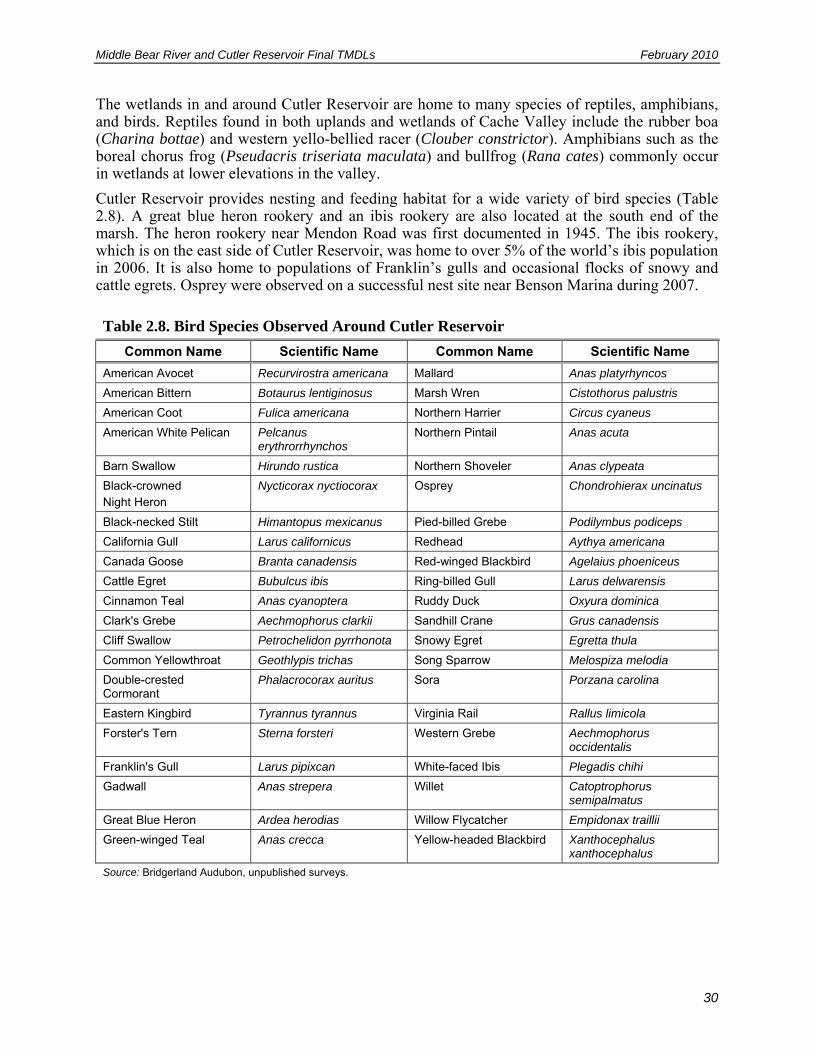
Middle Bear River and Cutler Reservoir Final TMDLs February 2010
30
The wetlands in and around Cutler Reservoir are home to many species of reptiles, amphibians, and birds. Reptiles found in both uplands and wetlands of Cache Valley include the rubber boa (Charina bottae) and western yello-bellied racer (Clouber constrictor). Amphibians such as the boreal chorus frog (Pseudacris triseriata maculata) and bullfrog (Rana cates) commonly occur in wetlands at lower elevations in the valley.
Cutler Reservoir provides nesting and feeding habitat for a wide variety of bird species (Table 2.8). A great blue heron rookery and an ibis rookery are also located at the south end of the marsh. The heron rookery near Mendon Road was first documented in 1945. The ibis rookery, which is on the east side of Cutler Reservoir, was home to over 5% of the world’s ibis population in 2006. It is also home to populations of Franklin’s gulls and occasional flocks of snowy and cattle egrets. Osprey were observed on a successful nest site near Benson Marina during 2007.
Table 2.8. Bird Species Observed Around Cutler Reservoir
Common Name Scientific Name Common Name Scientific Name
American Avocet Recurvirostra americana Mallard Anas platyrhyncos
American Bittern Botaurus lentiginosus Marsh Wren Cistothorus palustris
American Coot Fulica americana Northern Harrier Circus cyaneus
American White Pelican Pelcanus erythrorrhynchos
Northern Pintail Anas acuta
Barn Swallow Hirundo rustica Northern Shoveler Anas clypeata
Black-crowned Night Heron
Nycticorax nyctiocorax Osprey Chondrohierax uncinatus
Black-necked Stilt Himantopus mexicanus Pied-billed Grebe Podilymbus podiceps
California Gull Larus californicus Redhead Aythya americana
Canada Goose Branta canadensis Red-winged Blackbird Agelaius phoeniceus
Cattle Egret Bubulcus ibis Ring-billed Gull Larus delwarensis
Cinnamon Teal Anas cyanoptera Ruddy Duck Oxyura dominica
Clark's Grebe Aechmophorus clarkii Sandhill Crane Grus canadensis
Cliff Swallow Petrochelidon pyrrhonota Snowy Egret Egretta thula
Common Yellowthroat Geothlypis trichas Song Sparrow Melospiza melodia
Double-crested Cormorant
Phalacrocorax auritus Sora Porzana carolina
Eastern Kingbird Tyrannus tyrannus Virginia Rail Rallus limicola
Forster's Tern Sterna forsteri Western Grebe Aechmophorus occidentalis
Franklin's Gull Larus pipixcan White-faced Ibis Plegadis chihi
Gadwall Anas strepera Willet Catoptrophorus semipalmatus
Great Blue Heron Ardea herodias Willow Flycatcher Empidonax traillii
Green-winged Teal Anas crecca Yellow-headed Blackbird Xanthocephalus xanthocephalus
Source: Bridgerland Audubon, unpublished surveys.

Middle Bear River and Cutler Reservoir Final TMDLs February 2010
31
Because of its use by the American white pelican, a state listed sensitive species, as well as the American avocets and black-necked stilts, which are Partners in Flight Priority Species, Cutler Reservoir has been designated as an important bird area (IBA) by the Utah Audubon Society. It is also qualified to be an IBA by its use as a gathering site for wading birds (Utah Audubon Society 2004).
In addition to Cutler Reservoir being designated as an IBA by the Audubon Society, PacifiCorp has designated the south end of the marsh, commonly known as the Wetlands Maze, for use by wildlife. As part of the relicensing agreement for Cutler Dam, PacifiCorp is engaging in an active recreation and habitat improvement program, especially around the wetlands of Cutler Reservoir.
2.1.4.4 Fishery
Staff at the Utah Division of Wildlife Resources (UDWiR) have identified the aquatic environment of Middle Bear River and Cutler Reservoir as highly altered, with few native fisheries remaining in most areas. Existing fish populations include Utah chubs, Utah suckers, crappie and channel catfish, and an overpopulation of carp. Historic populations (late 1800s and early 1900s) in the Middle Bear River included Bonneville cutthroat and redside shiners, but these species are no longer found today. Water quality is identified as the primary reason for the population shift identified in the fishery (personal communication between Tonya Dombrowski, SWCA, and Tom Pettengill, UDWiR, 2003). Changes in flow, sedimentation, and diversion associated with historic agricultural activities are considered the most probable causes of the decline in native fisheries, and the disturbance of bottom sediments by carp in the reservoir and portions of the river exacerbate the problem.
Recent fish sampling in the Middle Bear River and Cutler Reservoir updates our knowledge of fish populations and their health. In 2005 and 2006, 14 species of game and non-game species were sampled in Cutler Reservoir and the Middle Bear River, including largemouth bass, smallmouth bass, common carp, bluegill sunfish, green sunfish, brown trout, rainbow trout, Utah sucker, fathead minnow, channel catfish, walleye, suckers, black crappie, black bullheads, and fathead minnows (Budy et al. 2007). Overall, the abundance and diversity of fish species was high throughout Cutler Reservoir. Carp comprised almost 70% of the total fish biomass, and other dominant species include walleye and catfish.
Fish found in the Little Bear River include rainbow trout, brown trout, redside shiner, speckled dace, Utah sucker, mottled sculpin, and Utah chub. In addition, there are historic records of leatherside chub in the Little Bear River but UDWiR does not believe that they persist (personal communication between Erica Gaddis, SWCA, and Craig Schaugaard, UDWiR, December 12, 2008). Kokanee salmon occur in Porcupine Reservoir and migrate upstream to spawn in the river. Hatched fish return to the reservoir. Mountain whitefish has also been documented above Hyrum Reservoir. In lower reaches near Cutler Reservoir, black bullhead, carp, black crappie, and walleye have been found.
The Cub River has populations of brown trout, black bullhead, carp, Utah chub, Utah sucker, largemouth bass, green sunfish, yellow perch, and mountain whitefish.
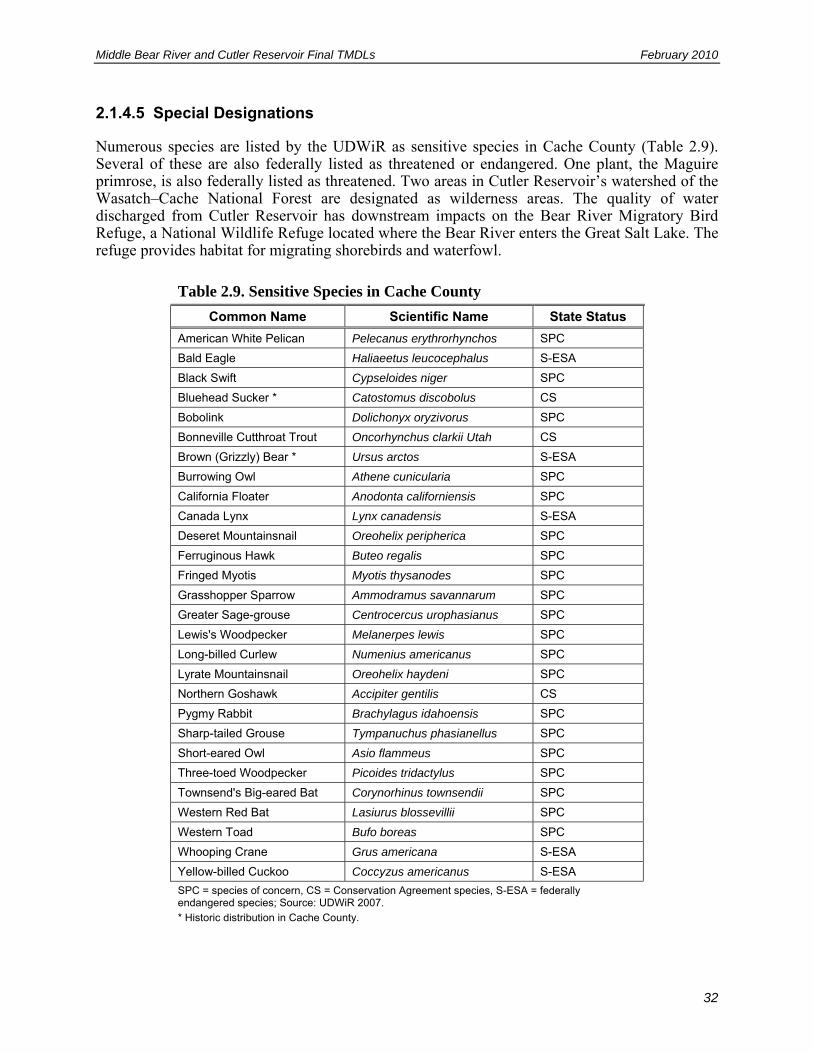
Middle Bear River and Cutler Reservoir Final TMDLs February 2010
32
2.1.4.5 Special Designations
Numerous species are listed by the UDWiR as sensitive species in Cache County (Table 2.9). Several of these are also federally listed as threatened or endangered. One plant, the Maguire primrose, is also federally listed as threatened. Two areas in Cutler Reservoir’s watershed of the Wasatch–Cache National Forest are designated as wilderness areas. The quality of water discharged from Cutler Reservoir has downstream impacts on the Bear River Migratory Bird Refuge, a National Wildlife Refuge located where the Bear River enters the Great Salt Lake. The refuge provides habitat for migrating shorebirds and waterfowl.
Table 2.9. Sensitive Species in Cache County
Common Name Scientific Name State Status
American White Pelican Pelecanus erythrorhynchos SPC
Bald Eagle Haliaeetus leucocephalus S-ESA
Black Swift Cypseloides niger SPC
Bluehead Sucker * Catostomus discobolus CS
Bobolink Dolichonyx oryzivorus SPC
Bonneville Cutthroat Trout Oncorhynchus clarkii Utah CS
Brown (Grizzly) Bear * Ursus arctos S-ESA
Burrowing Owl Athene cunicularia SPC
California Floater Anodonta californiensis SPC
Canada Lynx Lynx canadensis S-ESA
Deseret Mountainsnail Oreohelix peripherica SPC
Ferruginous Hawk Buteo regalis SPC
Fringed Myotis Myotis thysanodes SPC
Grasshopper Sparrow Ammodramus savannarum SPC
Greater Sage-grouse Centrocercus urophasianus SPC
Lewis's Woodpecker Melanerpes lewis SPC
Long-billed Curlew Numenius americanus SPC
Lyrate Mountainsnail Oreohelix haydeni SPC
Northern Goshawk Accipiter gentilis CS
Pygmy Rabbit Brachylagus idahoensis SPC
Sharp-tailed Grouse Tympanuchus phasianellus SPC
Short-eared Owl Asio flammeus SPC
Three-toed Woodpecker Picoides tridactylus SPC
Townsend's Big-eared Bat Corynorhinus townsendii SPC
Western Red Bat Lasiurus blossevillii SPC
Western Toad Bufo boreas SPC
Whooping Crane Grus americana S-ESA
Yellow-billed Cuckoo Coccyzus americanus S-ESA
SPC = species of concern, CS = Conservation Agreement species, S-ESA = federally endangered species; Source: UDWiR 2007.
* Historic distribution in Cache County.

Middle Bear River and Cutler Reservoir Final TMDLs February 2010
33
2.2 CULTURAL CHARACTERISTICS
2.2.1 LAND USE AND OWNERSHIP
The dominant land uses in the Cutler Reservoir watershed are forest and shrubland in the mountains and agriculture land in the valley (see Appendix F: Figure F-5 and Table 2.10). In addition, developed land uses occupy a portion of Cache Valley, primarily along the corridors of Highway 89 through Logan City, State Highways 91 through Smithfield and Richmond, and State Highway 165 through Millville, Nibley, Hyrum, and Paradise. The majority of agricultural land uses occur in lower elevations of the watershed, primarily Cache Valley. The most common crops include irrigated pasture, hay, alfalfa, and corn; all used locally to feed livestock. Dryland farming is also a significant portion of valley agriculture. From its point of entry in Utah, the Bear River flows entirely through agricultural lands.
Table 2.10. Land Use and Land Cover in the Cutler Reservoir Watershed
Land Use/Land Cover Type Acres Percent of total
Barren Land (Rock/Sand/Clay) 1,811 0.2%
Cultivated Crops 78,958 10.5%
Deciduous Forest 190,426 25.4%
Developed, High Intensity 1,143 0.2%
Developed, Low Intensity 11,775 1.6%
Developed, Medium Intensity 3,091 0.4%
Developed, Open Space 16,486 2.2%
Emergent Herbaceous Wetlands 9,341 1.2%
Evergreen Forest 129,445 17.3%
Grassland/Herbaceous 7,943 1.1%
Mixed Forest 9,173 1.2%
Open Water 4,581 0.6%
Pasture/Hay 91,972 12.3%
Shrub/Scrub 188,955 25.2%
Woody Wetlands 4,692 0.6%
Total 749,792
The majority of the land in Cache Valley is under private ownership and is primarily used for agriculture as well as residential and commercial uses. Most of the land in the Bear River Mountain Range in the eastern part of the watershed is managed by USFS, with small sections owned and managed by the State of Utah (see Appendix F: Figure F-6 and Table 2.11).
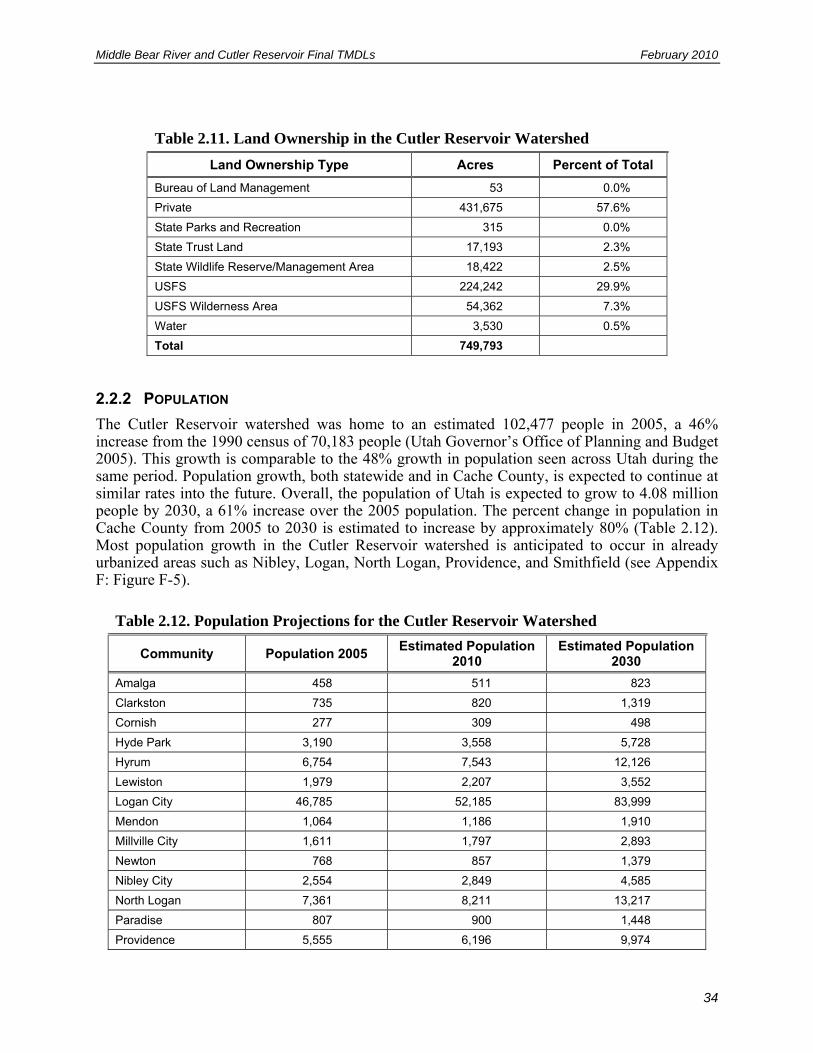
Middle Bear River and Cutler Reservoir Final TMDLs February 2010
34
Table 2.11. Land Ownership in the Cutler Reservoir Watershed
Land Ownership Type Acres Percent of Total
Bureau of Land Management 53 0.0%
Private 431,675 57.6%
State Parks and Recreation 315 0.0%
State Trust Land 17,193 2.3%
State Wildlife Reserve/Management Area 18,422 2.5%
USFS 224,242 29.9%
USFS Wilderness Area 54,362 7.3%
Water 3,530 0.5%
Total 749,793
2.2.2 POPULATION
The Cutler Reservoir watershed was home to an estimated 102,477 people in 2005, a 46% increase from the 1990 census of 70,183 people (Utah Governor’s Office of Planning and Budget 2005). This growth is comparable to the 48% growth in population seen across Utah during the same period. Population growth, both statewide and in Cache County, is expected to continue at similar rates into the future. Overall, the population of Utah is expected to grow to 4.08 million people by 2030, a 61% increase over the 2005 population. The percent change in population in Cache County from 2005 to 2030 is estimated to increase by approximately 80% (Table 2.12). Most population growth in the Cutler Reservoir watershed is anticipated to occur in already urbanized areas such as Nibley, Logan, North Logan, Providence, and Smithfield (see Appendix F: Figure F-5).
Table 2.12. Population Projections for the Cutler Reservoir Watershed
Community Population 2005 Estimated Population
2010 Estimated Population
2030
Amalga 458 511 823
Clarkston 735 820 1,319
Cornish 277 309 498
Hyde Park 3,190 3,558 5,728
Hyrum 6,754 7,543 12,126
Lewiston 1,979 2,207 3,552
Logan City 46,785 52,185 83,999
Mendon 1,064 1,186 1,910
Millville City 1,611 1,797 2,893
Newton 768 857 1,379
Nibley City 2,554 2,849 4,585
North Logan 7,361 8,211 13,217
Paradise 807 900 1,448
Providence 5,555 6,196 9,974
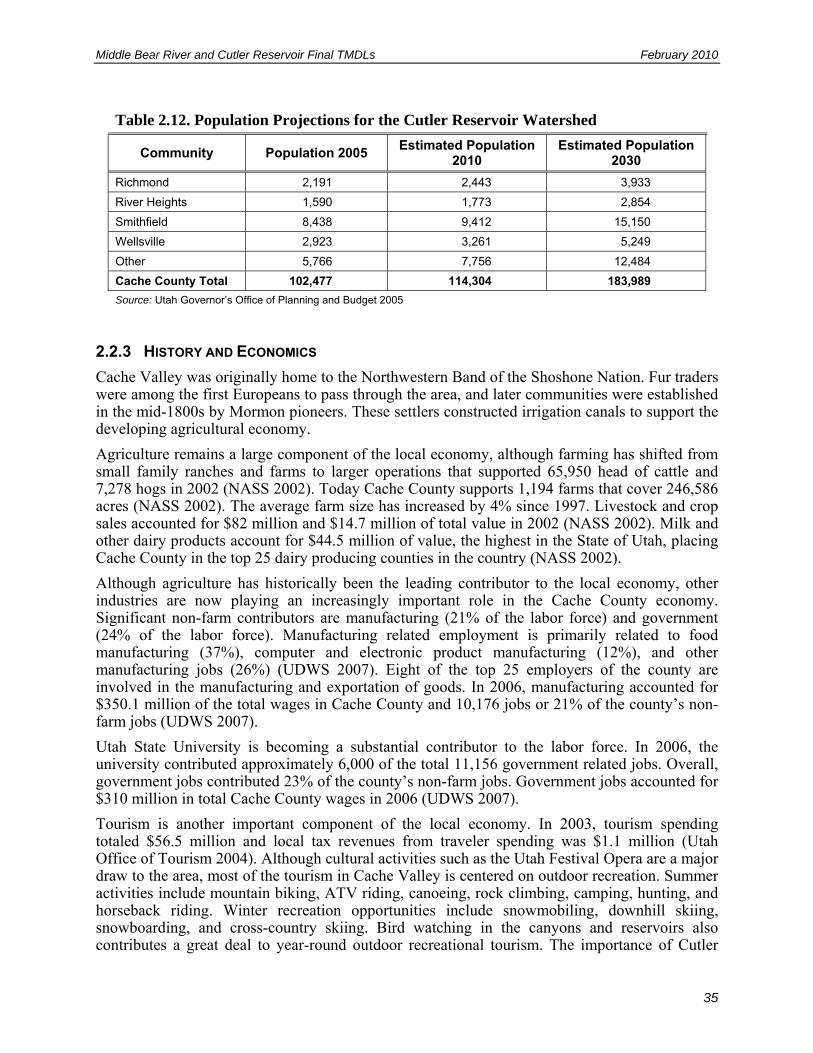
Middle Bear River and Cutler Reservoir Final TMDLs February 2010
35
Table 2.12. Population Projections for the Cutler Reservoir Watershed
Community Population 2005 Estimated Population
2010 Estimated Population
2030
Richmond 2,191 2,443 3,933
River Heights 1,590 1,773 2,854
Smithfield 8,438 9,412 15,150
Wellsville 2,923 3,261 5,249
Other 5,766 7,756 12,484
Cache County Total 102,477 114,304 183,989
Source: Utah Governor’s Office of Planning and Budget 2005
2.2.3 HISTORY AND ECONOMICS
Cache Valley was originally home to the Northwestern Band of the Shoshone Nation. Fur traders were among the first Europeans to pass through the area, and later communities were established in the mid-1800s by Mormon pioneers. These settlers constructed irrigation canals to support the developing agricultural economy.
Agriculture remains a large component of the local economy, although farming has shifted from small family ranches and farms to larger operations that supported 65,950 head of cattle and 7,278 hogs in 2002 (NASS 2002). Today Cache County supports 1,194 farms that cover 246,586 acres (NASS 2002). The average farm size has increased by 4% since 1997. Livestock and crop sales accounted for $82 million and $14.7 million of total value in 2002 (NASS 2002). Milk and other dairy products account for $44.5 million of value, the highest in the State of Utah, placing Cache County in the top 25 dairy producing counties in the country (NASS 2002).
Although agriculture has historically been the leading contributor to the local economy, other industries are now playing an increasingly important role in the Cache County economy. Significant non-farm contributors are manufacturing (21% of the labor force) and government (24% of the labor force). Manufacturing related employment is primarily related to food manufacturing (37%), computer and electronic product manufacturing (12%), and other manufacturing jobs (26%) (UDWS 2007). Eight of the top 25 employers of the county are involved in the manufacturing and exportation of goods. In 2006, manufacturing accounted for $350.1 million of the total wages in Cache County and 10,176 jobs or 21% of the county’s non-farm jobs (UDWS 2007).
Utah State University is becoming a substantial contributor to the labor force. In 2006, the university contributed approximately 6,000 of the total 11,156 government related jobs. Overall, government jobs contributed 23% of the county’s non-farm jobs. Government jobs accounted for $310 million in total Cache County wages in 2006 (UDWS 2007).
Tourism is another important component of the local economy. In 2003, tourism spending totaled $56.5 million and local tax revenues from traveler spending was $1.1 million (Utah Office of Tourism 2004). Although cultural activities such as the Utah Festival Opera are a major draw to the area, most of the tourism in Cache Valley is centered on outdoor recreation. Summer activities include mountain biking, ATV riding, canoeing, rock climbing, camping, hunting, and horseback riding. Winter recreation opportunities include snowmobiling, downhill skiing, snowboarding, and cross-country skiing. Bird watching in the canyons and reservoirs also contributes a great deal to year-round outdoor recreational tourism. The importance of Cutler

Middle Bear River and Cutler Reservoir Final TMDLs February 2010
36
Reservoir and the associated watershed on the tourism economy of the area cannot be overstated; water related activities in the rivers and reservoirs are major draws for tourism (personal communication between Jan Summerhays, SWCA, and Cache Valley Visitor’s Bureau representative, September 21, 2007).
2.2.4 PUBLIC INVOLVEMENT
The Bear River and Cutler Reservoir Technical Advisory Committee (TAC) has been instrumental in providing and reviewing information used in this assessment and offering constructive input through several drafts of this document. The TAC has been meeting monthly since August 2004 and has informed the TMDL process by contributing data, providing knowledge of physical and social processes in the watershed and identifying feasible projects to help reduce pollution
Throughout the TMDL process, local experience and participation will be, and has been, invaluable in the identification of water quality issues and appropriate reduction strategies. Because of the potential impact of the Cutler Reservoir TMDL on the local community and the dependence of implementation on local participation, public involvement is critical to the entire TMDL process.
The TAC membership (Appendix A) includes local representatives from all the major sectors of the local community as follows:
• Agricultural interests • Citizens at large • Environmental concerns • Sporting and recreational interests • PacifiCorp • Municipalities • Irrigation districts • Soil conservation • Wildlife, fish, and waterfowl protection • Cache County • Industry
It is anticipated that TAC members will continue to work directly with their respective interest groups to provide direction to Utah Division of Water Quality (UDWQ) in developing and implementing a watershed management plan. They will also be helpful in identifying funding needs and sources of support for specific projects that may be implemented. The TAC will assist with management plan implementation by setting priorities for restoration and BMP implementation projects and by periodically reviewing progress toward water quality improvement goals. A memorandum of understanding between the UDWQ and stakeholders in the watershed is in progress to establish a Cutler Reservoir Commission aimed at securing funding to improve water quality in the reservoir and for additional studies required to better assess beneficial use support in the reservoir.

Middle Bear River and Cutler Reservoir Final TMDLs February 2010
37
CHAPTER 3 DATA SUMMARY AND SUPPORT FOR IMPAIRMENT STATUS
3.1 DATA EXTENT AND COVERAGE
The available dataset covers a wide range of watershed locations and a variety of physical and chemical water quality constituents. Available data were collected in two primary categories: water quality (chemical/physical) data, and hydrologic data. Supplemental biological and habitat data are also available for some locations in the reservoir and are summarized in this chapter as support for impairment determinations made based on water quality conditions. Identified water quality concerns in the Middle Bear River and Cutler Reservoir systems were used as the primary basis for data collection and delineation and is the focus of this report.
3.1.1 SPATIAL EXTENT AND COVERAGE
Cutler Reservoir was divided into a Northern and Southern section based on water quality, morphometry, and habitat characteristics. The southern section of the reservoir (south of Benson Marina), hereafter referred to as the Southern Reservoir, generally consists of slow moving, shallow water (0.55 m mean depth) with substantial acreages of wetlands that provide habitat for waterfowl and water birds. The northern section of the reservoir, hereafter referred to as the Northern Reservoir, is deeper, narrower, and faster moving (1.3 m mean depth). Flow between the Southern Reservoir and Northern Reservoir is restricted by Benson Road and the relatively small area available for exchange under Benson Bridge. The elevation of water in the Southern Reservoir is often higher than the elevation of the reservoir at the dam (Northern Reservoir), due to the constriction point at Benson Bridge. Therefore, analysis of water quality in the reservoir is specific to these two areas.
Surface water quality data are available from the Middle Bear River at 7 locations upstream, 4 Cutler Reservoir in-lake locations, and one location downstream of Cutler Dam. Additional data are available from 13 inflow and in-stream locations of tributaries to both the main stem of the river and the reservoir, from 3 point source discharge locations and from 3 irrigation/stormwater drains. Groundwater data are available from a number of recent publications and from a well site in the local area. All monitoring stations are listed in Table 3.1. Cumulatively, these monitoring stations represent adequate spatial coverage throughout the watershed.
Monitoring stations available to the TMDL process are plotted on maps in Appendix F: Figures F-7 through F-9. Figure F-7 identifies surface water monitoring stations for which recent data are available (1982 or later). Figure F-8 shows the locations of point source discharges for which data are available (1982 and later). Figure F-9 identifies those monitoring stations that delineate critical locations in the determination of loading, transport, and processing within the Middle Bear River–Cutler Reservoir system. These critical locations are discussed in greater detail in later sections of this summary.
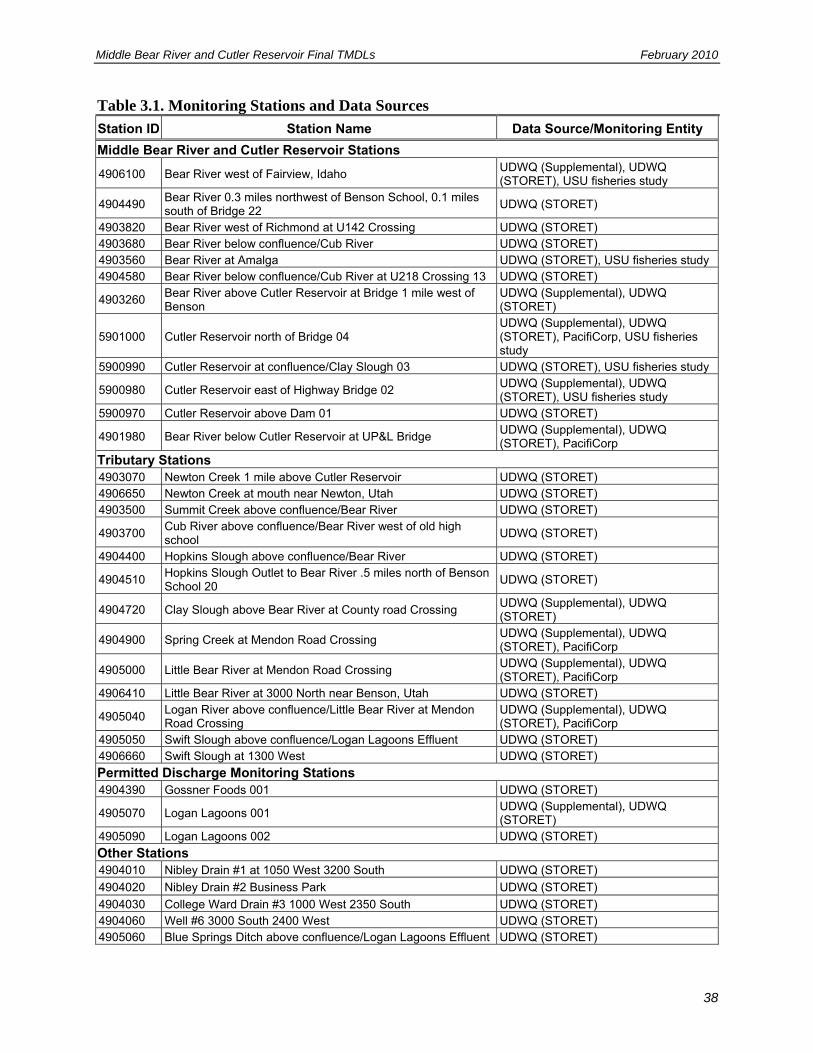
Middle Bear River and Cutler Reservoir Final TMDLs February 2010
38
Table 3.1. Monitoring Stations and Data Sources
Station ID Station Name Data Source/Monitoring Entity
Middle Bear River and Cutler Reservoir Stations
4906100 Bear River west of Fairview, Idaho UDWQ (Supplemental), UDWQ (STORET), USU fisheries study
4904490 Bear River 0.3 miles northwest of Benson School, 0.1 miles south of Bridge 22
UDWQ (STORET)
4903820 Bear River west of Richmond at U142 Crossing UDWQ (STORET) 4903680 Bear River below confluence/Cub River UDWQ (STORET) 4903560 Bear River at Amalga UDWQ (STORET), USU fisheries study 4904580 Bear River below confluence/Cub River at U218 Crossing 13 UDWQ (STORET)
4903260 Bear River above Cutler Reservoir at Bridge 1 mile west of Benson
UDWQ (Supplemental), UDWQ (STORET)
5901000 Cutler Reservoir north of Bridge 04 UDWQ (Supplemental), UDWQ (STORET), PacifiCorp, USU fisheries study
5900990 Cutler Reservoir at confluence/Clay Slough 03 UDWQ (STORET), USU fisheries study
5900980 Cutler Reservoir east of Highway Bridge 02 UDWQ (Supplemental), UDWQ (STORET), USU fisheries study
5900970 Cutler Reservoir above Dam 01 UDWQ (STORET)
4901980 Bear River below Cutler Reservoir at UP&L Bridge UDWQ (Supplemental), UDWQ (STORET), PacifiCorp
Tributary Stations 4903070 Newton Creek 1 mile above Cutler Reservoir UDWQ (STORET) 4906650 Newton Creek at mouth near Newton, Utah UDWQ (STORET) 4903500 Summit Creek above confluence/Bear River UDWQ (STORET)
4903700 Cub River above confluence/Bear River west of old high school
UDWQ (STORET)
4904400 Hopkins Slough above confluence/Bear River UDWQ (STORET)
4904510 Hopkins Slough Outlet to Bear River .5 miles north of Benson School 20
UDWQ (STORET)
4904720 Clay Slough above Bear River at County road Crossing UDWQ (Supplemental), UDWQ (STORET)
4904900 Spring Creek at Mendon Road Crossing UDWQ (Supplemental), UDWQ (STORET), PacifiCorp
4905000 Little Bear River at Mendon Road Crossing UDWQ (Supplemental), UDWQ (STORET), PacifiCorp
4906410 Little Bear River at 3000 North near Benson, Utah UDWQ (STORET)
4905040 Logan River above confluence/Little Bear River at Mendon Road Crossing
UDWQ (Supplemental), UDWQ (STORET), PacifiCorp
4905050 Swift Slough above confluence/Logan Lagoons Effluent UDWQ (STORET) 4906660 Swift Slough at 1300 West UDWQ (STORET)
Permitted Discharge Monitoring Stations 4904390 Gossner Foods 001 UDWQ (STORET)
4905070 Logan Lagoons 001 UDWQ (Supplemental), UDWQ (STORET)
4905090 Logan Lagoons 002 UDWQ (STORET)
Other Stations 4904010 Nibley Drain #1 at 1050 West 3200 South UDWQ (STORET)
4904020 Nibley Drain #2 Business Park UDWQ (STORET)
4904030 College Ward Drain #3 1000 West 2350 South UDWQ (STORET) 4904060 Well #6 3000 South 2400 West UDWQ (STORET) 4905060 Blue Springs Ditch above confluence/Logan Lagoons Effluent UDWQ (STORET)

Middle Bear River and Cutler Reservoir Final TMDLs February 2010
39
Of the stations available to the TMDL process, 12 were defined as critical to the water quality assessment of Middle Bear River and Cutler Reservoir.
• #4906100 Bear River west of Fairview, Idaho. This station represents the “inflow” site for the main stem of the Bear River entering Utah from Idaho and is used in conjunction with the Bear River TMDL from Idaho Department of Environmental Quality (IDEQ 2006) to help characterize pollutant transport, processing and loading from the Idaho segment of the Bear River.
• #4903260 Bear River above Cutler Reservoir at the Benson Bridge (4000 West). This station is used to help characterize total pollutant transport, processing, and loading from the main stem of the Bear River to Cutler Reservoir.
• #5901000 Cutler Reservoir north of the Benson Marina Bridge. This station represents water quality in the reservoir at the division between the southern end of the reservoir and the northern portions of the reservoir. It is used to characterize water quality in the southern end of Cutler Reservoir.
• #5900990 Cutler Reservoir at the confluence of Clay Slough. This station represents the most robust dataset available for water quality in Cutler Reservoir. This station may experience some bias from pollutant loading from Clay Slough, as the reservoir does not appear to undergo strong mixing at this location. Therefore, all other available, appropriate in-reservoir data are assessed in coordination with this dataset.
• #5900970 Cutler Reservoir above the dam. This station represents water quality in the northernmost segment of the reservoir.
• #4901980 Cutler Reservoir below Cutler Dam at the UP&L bridge. This station represents the outflow from the reservoir and the water quality inflowing to the downstream segments of the main stem of the Bear River. A combination of water quality data from this station and the canal is used to characterize reservoir outflow water quality on an annual basis.
• #4904250 Cub River at Highway 142. This station represents the most robust dataset available for the inflowing Cub River, but is located well above the mouth of the river. Therefore, existing pollutant transport, processing, and loading for the Cub River is characterized using available data from this station and that collected during the Cub River TMDL process. Future pollutant transport, processing, and loading for the Cub River will be generated from the Cub River TMDL process and additional data/guidance from the UDWQ as appropriate.
• #4904900 Spring Creek at Mendon Road. Data from this station were used in conjunction with data collected as part of the Spring Creek TMDL process to help characterize existing pollutant transport, processing and loading from Spring Creek to Cutler Reservoir. Future pollutant transport, processing and loading for Spring Creek was generated from the Spring Creek TMDL process and additional data/guidance from the UDWQ as appropriate.
• #4905000 Little Bear River at Mendon Road. Data from this station were used in conjunction with data collected as part of the Little Bear River TMDL process to help characterize existing pollutant transport, processing, and loading from Little Bear River to Cutler Reservoir. Future pollutant transport, processing, and loading for Little Bear River were generated from the Little Bear River TMDL process and additional data/guidance from the UDWQ as appropriate.
• #4905040 Logan River at Mendon Road. Data from this station were used with data/guidance from the UDWQ as appropriate to help characterize total pollutant transport, processing and loading from Logan River to Cutler Reservoir.
Middle Bear River and Cutler Reservoir Final TMDLs February 2010
40
• #4905070 Logan Lagoons outfalls 001 and 002. The dataset from station 001 represents the most robust dataset available for the effluent from the Logan Regional Wastewater Treatment Plant (WWTP), but is not located at the actual discharge point of the current wetlands treatment system (site 002). Therefore, pollutant loading information from this station was used in conjunction with current data from the wetlands outfall site and additional data/guidance from the UDWQ as appropriate to characterize total loading from the WWTP.
3.1.2 TEMPORAL EXTENT AND COVERAGE
Monitoring data are available from the late 1950s through late 2004, but data used for the TMDL process were gathered from 1982 to 2006. As detailed in Table 3.2, some monitoring locations have consistent data throughout this time period, although others have experienced only intermittent or single-year or single-event data collection. The most samples are available in recent years with samples being relatively well distributed across seasons (Figure 3.1).
Data collected prior to 1982 were excluded from the water quality assessment database, as they are not representative of current conditions in the watershed. These data may have inherent liabilities associated with outdated sampling or analysis methods that cannot facilitate relevant direct comparisons between old and current measurements. Additionally, flow and storage management in the watershed have changed considerably since the early 1980s and transport and delivery relationships derived from early data are not likely to be representative of current conditions.
The current period of record defined for this TMDL is 1995–2006. Data from the current period of record were the primary source of information used to develop pollutant loading calculations and coefficients, determine the support level of beneficial uses, and define appropriate endpoints or thresholds for the Middle Bear River and Cutler Reservoir systems.
This period of study is representative of wet and dry climate conditions. Dry conditions, defined as 50% of the 30-year average, occurred during 3 of the 11 years used in the period of study for the TMDL. Overall, the combined average flow for the years used in the period of study was 82% of the 30-year average, with a maximum of 163% flow in 1998. Because the water quality concerns identified for Cutler Reservoir would be exacerbated by drought conditions, it is prudent to include drought-condition data in the analysis. This will ensure that the TMDL objectives will protect water quality were drought conditions to reoccur during the lifetime of this phase of the TMDL.
Where possible and practicable, data summaries are presented in two seasons: May–October, hereafter known as the summer season and November–April, hereafter known as the winter season. These seasons roughly represent the irrigation vs. non-irrigation season as well as the algal growth vs. non-algal growth season in the reservoir.
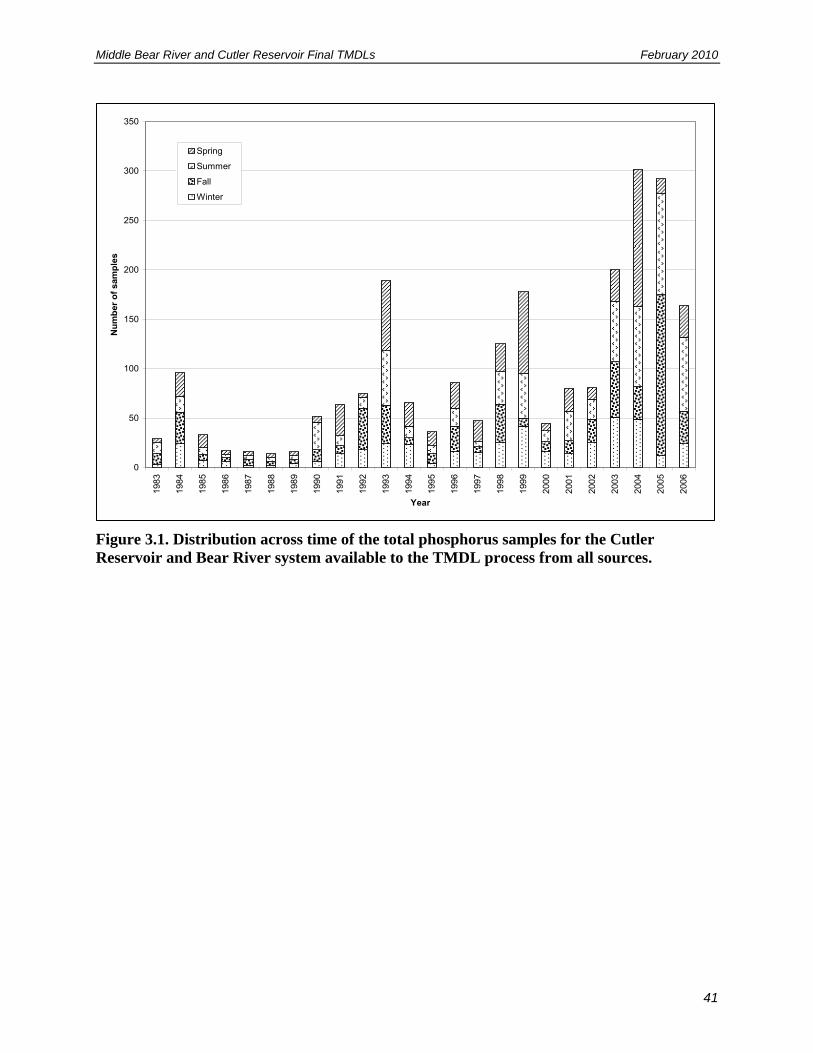
Middle Bear River and Cutler Reservoir Final TMDLs February 2010
41
Figure 3.1. Distribution across time of the total phosphorus samples for the Cutler Reservoir and Bear River system available to the TMDL process from all sources.
0
50
100
150
200
250
300
350
1983
1984
1985
1986
1987
1988
1989
1990
1991
1992
1993
1994
1995
1996
1997
1998
1999
2000
2001
2002
2003
2004
2005
2006
Year
Nu
mb
er o
f sa
mp
les
Spring
Summer
Fall
Winter

Middle Bear River and Cutler Reservoir Final TMDLs February 2010
42
This page intentionally blank.
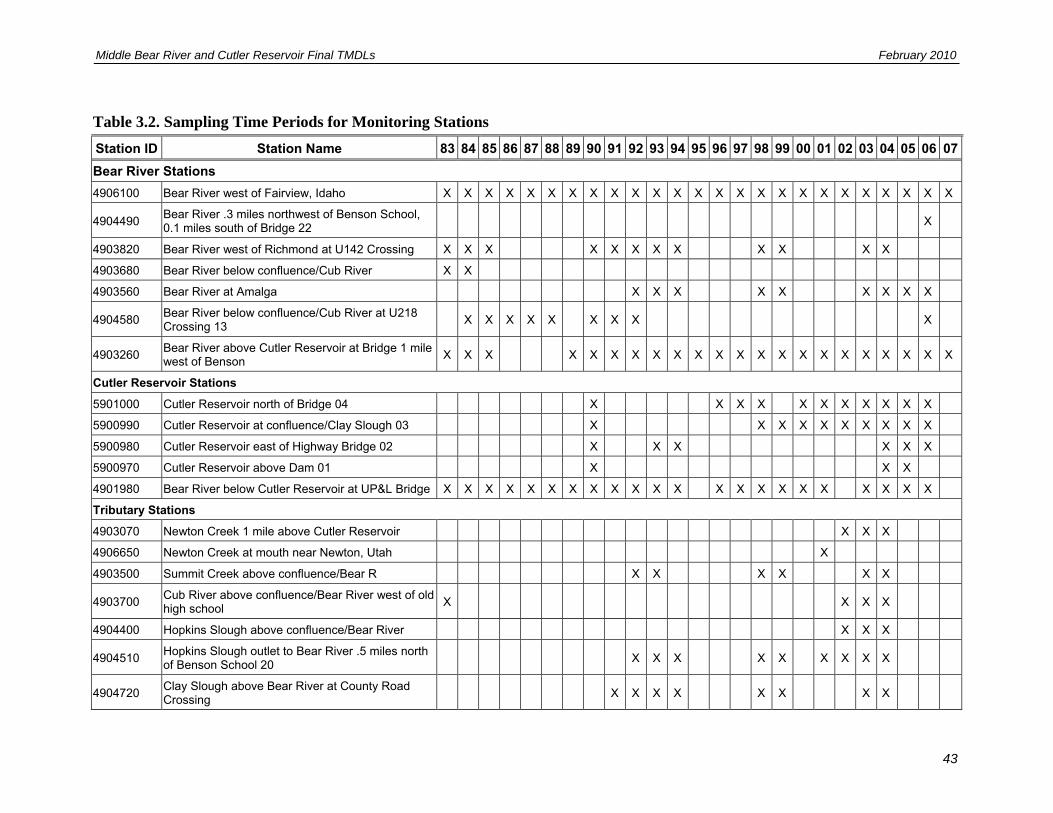
Middle Bear River and Cutler Reservoir Final TMDLs February 2010
43
Table 3.2. Sampling Time Periods for Monitoring Stations
Station ID Station Name 83 84 85 86 87 88 89 90 91 92 93 94 95 96 97 98 99 00 01 02 03 04 05 06 07
Bear River Stations
4906100 Bear River west of Fairview, Idaho X X X X X X X X X X X X X X X X X X X X X X X X X
4904490 Bear River .3 miles northwest of Benson School, 0.1 miles south of Bridge 22
X
4903820 Bear River west of Richmond at U142 Crossing X X X X X X X X X X X X
4903680 Bear River below confluence/Cub River X X
4903560 Bear River at Amalga X X X X X X X X X
4904580 Bear River below confluence/Cub River at U218 Crossing 13
X X X X X X X X X
4903260 Bear River above Cutler Reservoir at Bridge 1 mile west of Benson
X X X X X X X X X X X X X X X X X X X X X X
Cutler Reservoir Stations
5901000 Cutler Reservoir north of Bridge 04 X X X X X X X X X X X
5900990 Cutler Reservoir at confluence/Clay Slough 03 X X X X X X X X X X
5900980 Cutler Reservoir east of Highway Bridge 02 X X X X X X
5900970 Cutler Reservoir above Dam 01 X X X
4901980 Bear River below Cutler Reservoir at UP&L Bridge X X X X X X X X X X X X X X X X X X X X X X
Tributary Stations
4903070 Newton Creek 1 mile above Cutler Reservoir X X X
4906650 Newton Creek at mouth near Newton, Utah X
4903500 Summit Creek above confluence/Bear R X X X X X X
4903700 Cub River above confluence/Bear River west of old high school
X X X X
4904400 Hopkins Slough above confluence/Bear River X X X
4904510 Hopkins Slough outlet to Bear River .5 miles north of Benson School 20
X X X X X X X X X
4904720 Clay Slough above Bear River at County Road Crossing
X X X X X X X X
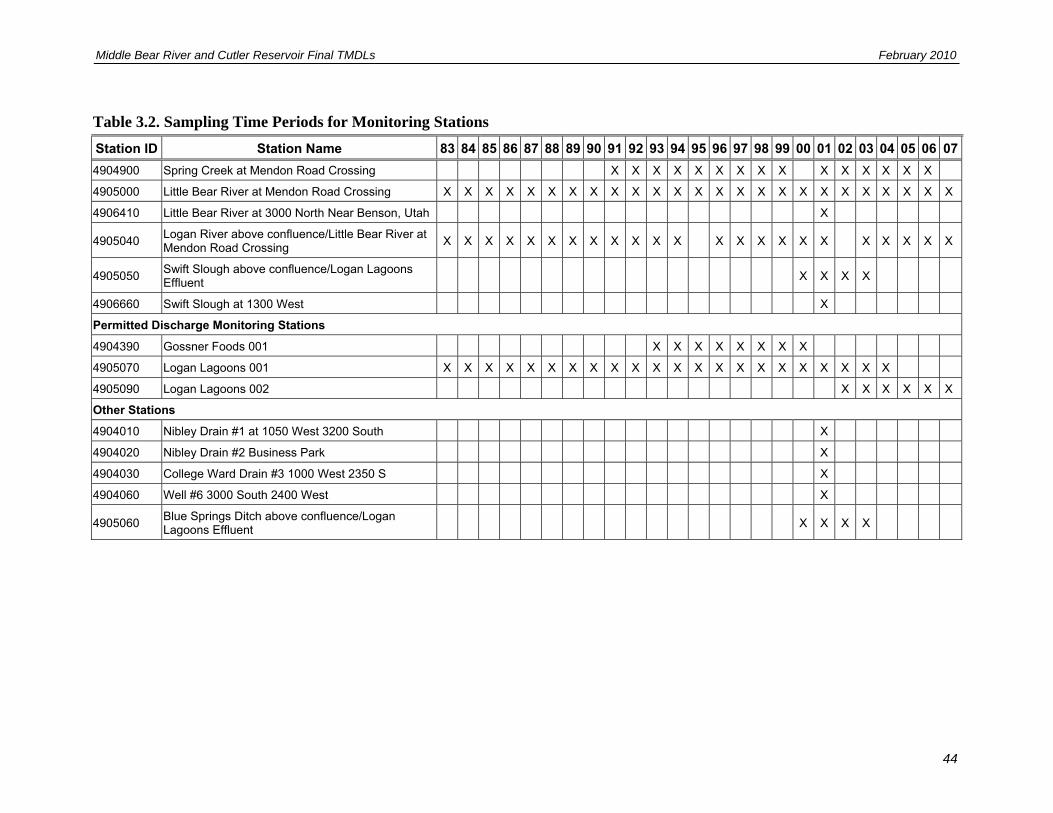
Middle Bear River and Cutler Reservoir Final TMDLs February 2010
44
Table 3.2. Sampling Time Periods for Monitoring Stations
Station ID Station Name 83 84 85 86 87 88 89 90 91 92 93 94 95 96 97 98 99 00 01 02 03 04 05 06 07
4904900 Spring Creek at Mendon Road Crossing X X X X X X X X X X X X X X X
4905000 Little Bear River at Mendon Road Crossing X X X X X X X X X X X X X X X X X X X X X X X X X
4906410 Little Bear River at 3000 North Near Benson, Utah X
4905040 Logan River above confluence/Little Bear River at Mendon Road Crossing
X X X X X X X X X X X X X X X X X X X X X X X
4905050 Swift Slough above confluence/Logan Lagoons Effluent
X X X X
4906660 Swift Slough at 1300 West X
Permitted Discharge Monitoring Stations
4904390 Gossner Foods 001 X X X X X X X X
4905070 Logan Lagoons 001 X X X X X X X X X X X X X X X X X X X X X X
4905090 Logan Lagoons 002 X X X X X X
Other Stations
4904010 Nibley Drain #1 at 1050 West 3200 South X
4904020 Nibley Drain #2 Business Park X
4904030 College Ward Drain #3 1000 West 2350 S X
4904060 Well #6 3000 South 2400 West X
4905060 Blue Springs Ditch above confluence/Logan Lagoons Effluent
X X X X
Middle Bear River and Cutler Reservoir Final TMDLs February 2010
45
3.1.3 LIMNOLOGICAL CHARACTERISTICS OF CUTLER RESERVOIR
Cutler Reservoir is a unique and heterogeneous reservoir. Some parts resemble a slow-moving shallow river whereas others are best defined as wetland habitat. The Southern Reservoir is generally shallow, wide, and slow moving, with extensive areas of wetland and marsh habitat. The Northern Reservoir is deeper, faster moving, and narrower due to the flow from the Bear River, which enters the reservoir north of Benson Marina and flows directly toward Cutler Canyon and the dam. Several oxbows and sloughs exist throughout the reservoir, and are characterized by slow-moving, often stagnant areas of water. Such conditions are found in Clay Slough, the oxbow formed by the old Bear River channel in the Northern Reservoir, and Swift Slough in the Southern Reservoir. There are many other unnamed sloughs and stagnant areas around the edge of Cutler Reservoir. As a result, water chemistry, vegetation, and flow conditions vary widely throughout the reservoir. Therefore, averaging of data from multiple locations must be done with attention to the hydrologic and habitat differences through the reservoir. Water quality in these stagnant littoral areas of the reservoir is generally worse than water quality conditions in the open free-flowing portions of the reservoir.
In order to better represent the open water (lacustrine), portions of the reservoir, those data collected in the littoral areas are distinguished from data collected in the open water sections of the reservoir. Data summaries throughout this section include a limnological classification as either riverine (tributaries to Cutler Reservoir), lacustrine (open water), or littoral (stagnant areas). Most water quality data collected by the UDWQ (Stations 5900970, 5900980, 5900990, and 5901000) in Cutler Reservoir itself is in open water sections and not representative of littoral areas. The lack of data collected in the reservoir’s littoral areas necessarily biases the analysis toward open water areas of the reservoir with better water quality.
3.2 SUMMARY OF CURRENT CONDITIONS
Primary information sources for water quality data include the UDWQ, the EPA STORET database (STORET; EPA 2007), PacifiCorp, the UDWaR, the Utah Geological Survey (UGS), the Utah Department of Natural Resources (UDNR), the USGS, and some limited data from the USFS, the USDA NRCS, and local irrigation companies. Utah State University has also provided data and information for this effort, as have local soil and water conservation districts and others.
Groundwater flow and volume information are available in a general format for the majority of the valley, with more detailed information for the lower valley. Groundwater quality data and summaries have been published by the UGS and the USGS (Lowe et al. 2003). Additional information from county studies and reports is also available in a more piecemeal fashion. Climate information was obtained from WRCC and SNOTEL sites.
The UDWQ, USGS, EPA, and others have been monitoring water quality at a number of sites in the Cutler Reservoir watershed since the early 1970s. Water quality data are gathered from monitoring stations in the reservoir and from major tributary streams, permitted discharges, and data from groundwater wells.
Monitoring locations available to the TMDL effort include: 11 locations on Cutler Reservoir and the Middle Bear River; a monitoring location immediately downstream of Cutler Dam; 13 monitoring locations on tributary streams; 3 permitted discharge locations (not including permitted sites covered in tributary TMDLs); 3 irrigation/stormwater drain locations; and groundwater data from UGS, USGS, and a local well site. A listing of all pertinent sites, locations, data sources, and measured parameters and a summary of the time periods for which data are available is presented in Table 3.3, Table 3.4, and Table 3.5.
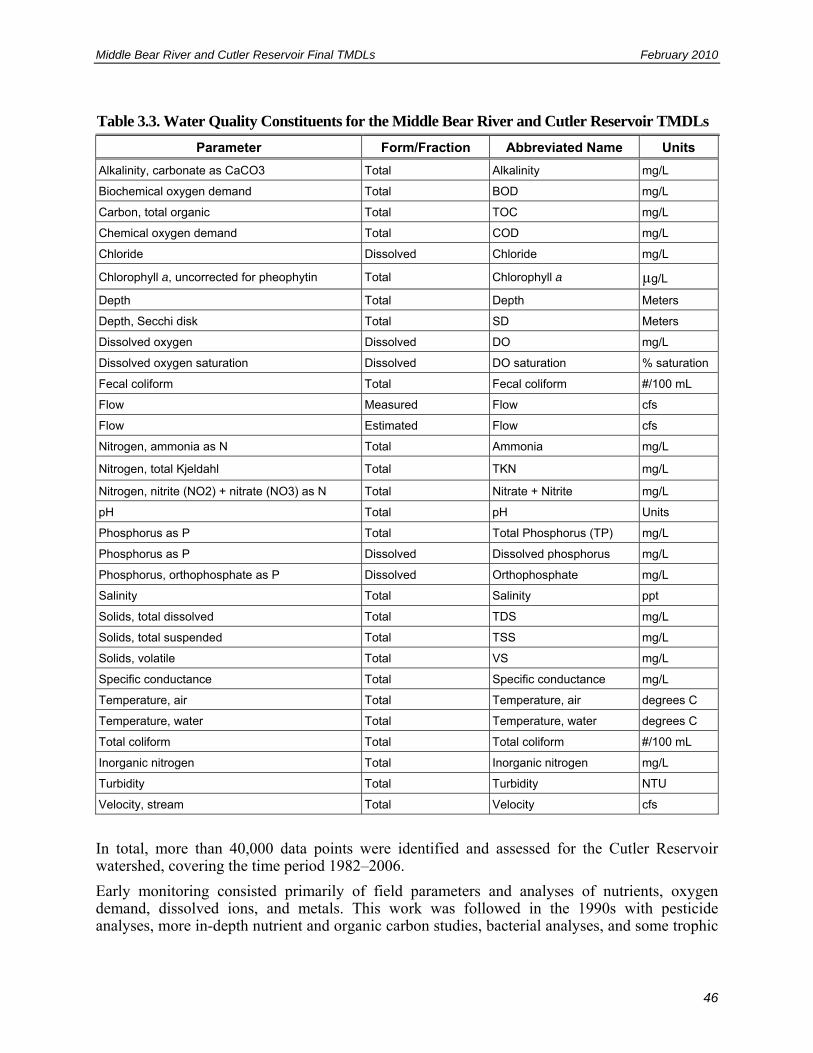
Middle Bear River and Cutler Reservoir Final TMDLs February 2010
46
Table 3.3. Water Quality Constituents for the Middle Bear River and Cutler Reservoir TMDLs
Parameter Form/Fraction Abbreviated Name Units
Alkalinity, carbonate as CaCO3 Total Alkalinity mg/L
Biochemical oxygen demand Total BOD mg/L
Carbon, total organic Total TOC mg/L
Chemical oxygen demand Total COD mg/L
Chloride Dissolved Chloride mg/L
Chlorophyll a, uncorrected for pheophytin Total Chlorophyll a µg/L
Depth Total Depth Meters
Depth, Secchi disk Total SD Meters
Dissolved oxygen Dissolved DO mg/L
Dissolved oxygen saturation Dissolved DO saturation % saturation
Fecal coliform Total Fecal coliform #/100 mL
Flow Measured Flow cfs
Flow Estimated Flow cfs
Nitrogen, ammonia as N Total Ammonia mg/L
Nitrogen, total Kjeldahl Total TKN mg/L
Nitrogen, nitrite (NO2) + nitrate (NO3) as N Total Nitrate + Nitrite mg/L
pH Total pH Units
Phosphorus as P Total Total Phosphorus (TP) mg/L
Phosphorus as P Dissolved Dissolved phosphorus mg/L
Phosphorus, orthophosphate as P Dissolved Orthophosphate mg/L
Salinity Total Salinity ppt
Solids, total dissolved Total TDS mg/L
Solids, total suspended Total TSS mg/L
Solids, volatile Total VS mg/L
Specific conductance Total Specific conductance mg/L
Temperature, air Total Temperature, air degrees C
Temperature, water Total Temperature, water degrees C
Total coliform Total Total coliform #/100 mL
Inorganic nitrogen Total Inorganic nitrogen mg/L
Turbidity Total Turbidity NTU
Velocity, stream Total Velocity cfs
In total, more than 40,000 data points were identified and assessed for the Cutler Reservoir watershed, covering the time period 1982–2006.
Early monitoring consisted primarily of field parameters and analyses of nutrients, oxygen demand, dissolved ions, and metals. This work was followed in the 1990s with pesticide analyses, more in-depth nutrient and organic carbon studies, bacterial analyses, and some trophic

Middle Bear River and Cutler Reservoir Final TMDLs February 2010
47
status-related parameters. Current data (1995–2006) contain a variety of field parameters and analyses of nutrients, sediments, dissolved ions, and metals.
Available biological data include periphyton, fish, and benthic macroinvertebrates in Middle Bear River and phytoplankton, zooplankton, and fish in Cutler Reservoir with a very small dataset of macroinvertebrate identification (STORET, Rushforth and Rushforth 2005, Budy et al. 2007, Wurtsbaugh 2008).
3.2.1 WATER QUALITY ANALYTICAL METHODS
Water quality data collected and assessed for the Cutler Reservoir TMDLs consists of samples evaluated by four primary categories of analytical methodology: American Public Health Association (APHA), EPA, UDWQ generic, and UDWQ field methods.
3.2.1.1 APHA Methods
These methods refer to the APHA (APHA 1992). APHA-approved methods specific to the available database for Cutler Reservoir TMDL include analytical procedures for measuring alkalinity, chemical oxygen demand, chloride, chlorophyll, dissolved solids, fecal coliform bacteria, fecal streptococcus group bacteria, fixed solids, pH, total coliform bacteria, total organic carbon, TSS, volatile solids, and others not pertinent to this TMDL effort.
3.2.1.2 EPA Methods
These methods refer to methods approved by the EPA (1983). EPA-approved methods specific to the available database for Cutler Reservoir TMDL include analytical procedures for measuring ammonia, BOD, chloride, nitrate + nitrite, phosphorus, specific conductance, TSS, turbidity, volatile solids, and others not pertinent to this TMDL effort.
3.2.1.3 UDWQ Generic Methods
These refer to UDWQ methods entered in the STORET database.
UDWQ generic methods (generic method and generic method 2) specific to the available database for the Cutler Reservoir and Middle Bear River TMDLs include measurements of alkalinity, ammonia, BOD, chemical oxygen demand, chloride, chlorophyll a, nitrate, nitrate + nitrite, pH, orthophosphate, phosphorus, specific conductance, total Kjeldahl nitrogen (TKN), total organic carbon turbidity, and others not pertinent to this TMDL effort.
Due to the fact that the data in this analysis category were collected, reviewed, and submitted to the STORET database by UDWQ, it was assumed that all sampling protocols and analytical methods employed were carried out in a fashion approved by UDWQ and contained and attained a UDWQ-approved level of quality assurance and quality control.
3.2.1.4 UDWQ Field Measures
UDWQ field measures approved methods specific to the available database for these TMDL include analytical procedures for measuring chlorine, DO, flow, pH, salinity, SD, specific conductance, and temperature (air and water).
3.2.2 QUALITY ASSURANCE AND QUALITY CONTROL
The data were assessed to ensure that all data points included in the TMDL process met an appropriate level of quality. Basic statistical analyses were used to characterize the range and
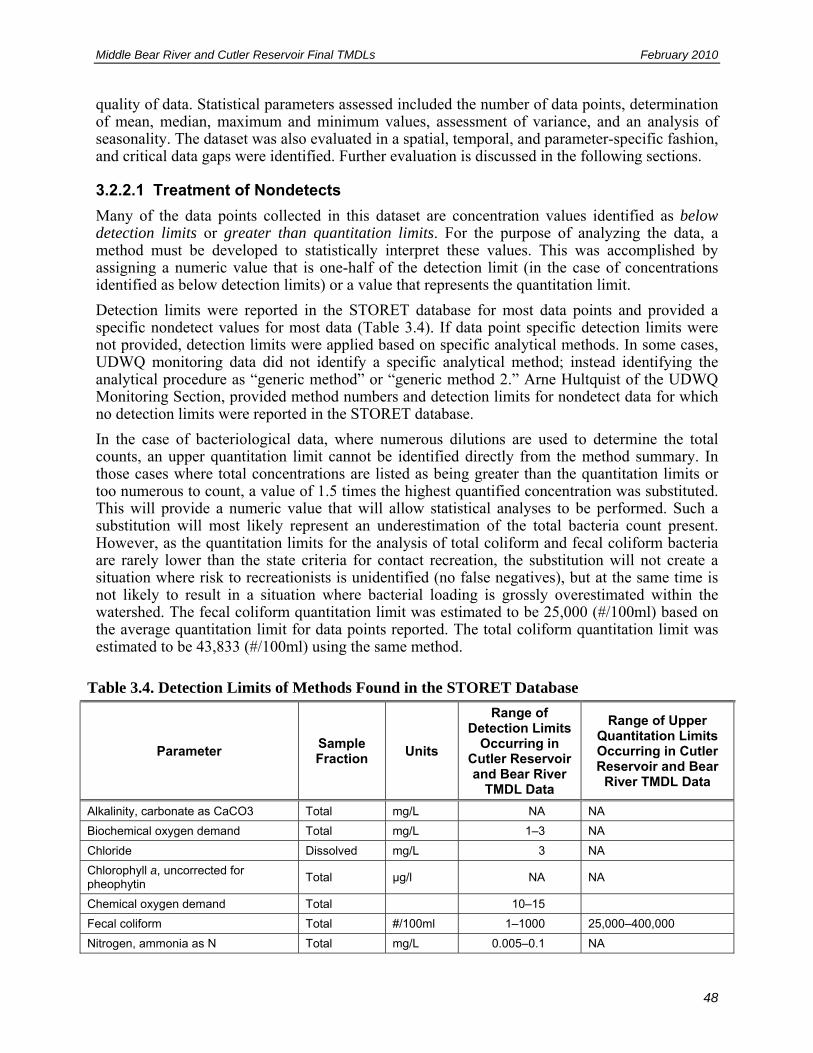
Middle Bear River and Cutler Reservoir Final TMDLs February 2010
48
quality of data. Statistical parameters assessed included the number of data points, determination of mean, median, maximum and minimum values, assessment of variance, and an analysis of seasonality. The dataset was also evaluated in a spatial, temporal, and parameter-specific fashion, and critical data gaps were identified. Further evaluation is discussed in the following sections.
3.2.2.1 Treatment of Nondetects
Many of the data points collected in this dataset are concentration values identified as below detection limits or greater than quantitation limits. For the purpose of analyzing the data, a method must be developed to statistically interpret these values. This was accomplished by assigning a numeric value that is one-half of the detection limit (in the case of concentrations identified as below detection limits) or a value that represents the quantitation limit.
Detection limits were reported in the STORET database for most data points and provided a specific nondetect values for most data (Table 3.4). If data point specific detection limits were not provided, detection limits were applied based on specific analytical methods. In some cases, UDWQ monitoring data did not identify a specific analytical method; instead identifying the analytical procedure as “generic method” or “generic method 2.” Arne Hultquist of the UDWQ Monitoring Section, provided method numbers and detection limits for nondetect data for which no detection limits were reported in the STORET database.
In the case of bacteriological data, where numerous dilutions are used to determine the total counts, an upper quantitation limit cannot be identified directly from the method summary. In those cases where total concentrations are listed as being greater than the quantitation limits or too numerous to count, a value of 1.5 times the highest quantified concentration was substituted. This will provide a numeric value that will allow statistical analyses to be performed. Such a substitution will most likely represent an underestimation of the total bacteria count present. However, as the quantitation limits for the analysis of total coliform and fecal coliform bacteria are rarely lower than the state criteria for contact recreation, the substitution will not create a situation where risk to recreationists is unidentified (no false negatives), but at the same time is not likely to result in a situation where bacterial loading is grossly overestimated within the watershed. The fecal coliform quantitation limit was estimated to be 25,000 (#/100ml) based on the average quantitation limit for data points reported. The total coliform quantitation limit was estimated to be 43,833 (#/100ml) using the same method.
Table 3.4. Detection Limits of Methods Found in the STORET Database
Parameter Sample Fraction
Units
Range of Detection Limits
Occurring in Cutler Reservoir and Bear River
TMDL Data
Range of Upper Quantitation Limits Occurring in Cutler Reservoir and Bear
River TMDL Data
Alkalinity, carbonate as CaCO3 Total mg/L NA NA
Biochemical oxygen demand Total mg/L 1–3 NA
Chloride Dissolved mg/L 3 NA
Chlorophyll a, uncorrected for pheophytin
Total µg/l NA NA
Chemical oxygen demand Total 10–15
Fecal coliform Total #/100ml 1–1000 25,000–400,000
Nitrogen, ammonia as N Total mg/L 0.005–0.1 NA
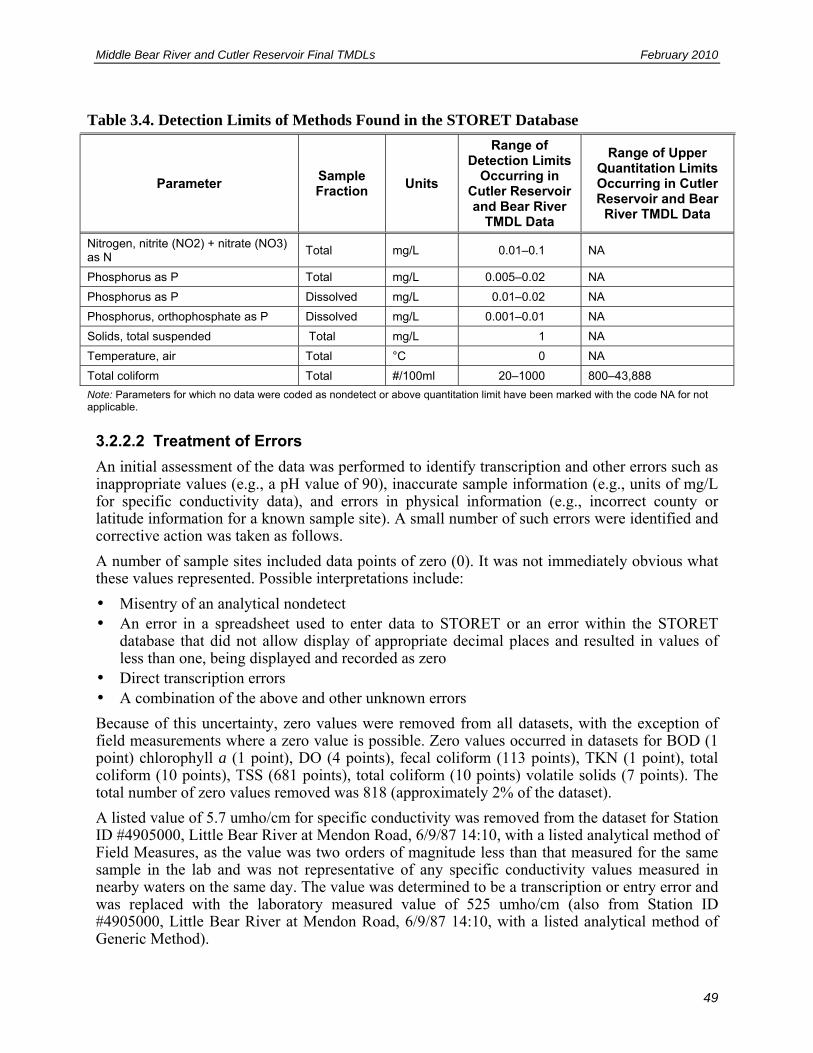
Middle Bear River and Cutler Reservoir Final TMDLs February 2010
49
Table 3.4. Detection Limits of Methods Found in the STORET Database
Parameter Sample Fraction
Units
Range of Detection Limits
Occurring in Cutler Reservoir and Bear River
TMDL Data
Range of Upper Quantitation Limits Occurring in Cutler Reservoir and Bear
River TMDL Data
Nitrogen, nitrite (NO2) + nitrate (NO3) as N
Total mg/L 0.01–0.1 NA
Phosphorus as P Total mg/L 0.005–0.02 NA
Phosphorus as P Dissolved mg/L 0.01–0.02 NA
Phosphorus, orthophosphate as P Dissolved mg/L 0.001–0.01 NA
Solids, total suspended Total mg/L 1 NA
Temperature, air Total °C 0 NA
Total coliform Total #/100ml 20–1000 800–43,888
Note: Parameters for which no data were coded as nondetect or above quantitation limit have been marked with the code NA for not applicable.
3.2.2.2 Treatment of Errors
An initial assessment of the data was performed to identify transcription and other errors such as inappropriate values (e.g., a pH value of 90), inaccurate sample information (e.g., units of mg/L for specific conductivity data), and errors in physical information (e.g., incorrect county or latitude information for a known sample site). A small number of such errors were identified and corrective action was taken as follows.
A number of sample sites included data points of zero (0). It was not immediately obvious what these values represented. Possible interpretations include:
• Misentry of an analytical nondetect • An error in a spreadsheet used to enter data to STORET or an error within the STORET
database that did not allow display of appropriate decimal places and resulted in values of less than one, being displayed and recorded as zero
• Direct transcription errors • A combination of the above and other unknown errors
Because of this uncertainty, zero values were removed from all datasets, with the exception of field measurements where a zero value is possible. Zero values occurred in datasets for BOD (1 point) chlorophyll a (1 point), DO (4 points), fecal coliform (113 points), TKN (1 point), total coliform (10 points), TSS (681 points), total coliform (10 points) volatile solids (7 points). The total number of zero values removed was 818 (approximately 2% of the dataset).
A listed value of 5.7 umho/cm for specific conductivity was removed from the dataset for Station ID #4905000, Little Bear River at Mendon Road, 6/9/87 14:10, with a listed analytical method of Field Measures, as the value was two orders of magnitude less than that measured for the same sample in the lab and was not representative of any specific conductivity values measured in nearby waters on the same day. The value was determined to be a transcription or entry error and was replaced with the laboratory measured value of 525 umho/cm (also from Station ID #4905000, Little Bear River at Mendon Road, 6/9/87 14:10, with a listed analytical method of Generic Method).
Middle Bear River and Cutler Reservoir Final TMDLs February 2010
50
A listed quantitation limit of 12,500 mg/L for a BOD value collected on 11/14/1991 in Spring Creek was assumed to be erroneous and was removed from the dataset.
Several datasets for Station ID #4903560, Bear River at Amalga, were erroneously identified as being located in Carbon County. Station numbers and latitude-longitude information was checked and found to be accurate so all listings of Carbon County were changed to Cache County for this station.
Data marked as chlorophyll a, uncorrected for pheophytin, method number APHA 10200H with units of mg/m2, were flagged as potential errors. This parameter is otherwise measured in µg/l. Arne Hultquist of the UDWQ monitoring section determined that these data were in fact periphyton data rather than chlorophyll a. These data were excluded from the chlorophyll a dataset and added to the periphyton dataset.
3.2.2.3 Treatment of Outliers
To identify a final dataset that is representative of water quality conditions within the Middle Bear River and Cutler Reservoir, a threshold of plus or minus three standard deviations from the mean was applied to the available datasets (Table 3.5). This resulted in the removal of approximately 475 data points (approximately 1% of the dataset). In some cases, the standard deviation of the parameter is larger than the mean which is indicative of a highly variable system. High variability is common in biological data such as chlorophyll a as populations change widely with varying physical and climatic conditions. In some cases, potentially erroneous data are included in the mean and standard deviation (i.e. a value of 126 mg/L of nitrate in the Bear River) but are filtered out as nonrepresentative or erroneous using this method of outlier detection. The outlier analysis resulted in the removal of 349 data points or 1% of the data including 26 alkalinity data points, 12 BOD data points, 26 chloride data points, 2 chlorophyll a data points, 15 TP data points, 12 orthophosphate data points, 20 TDS data points, 32 TSS data points, 49 specific conductivity data points, and 5 total coliform data points.
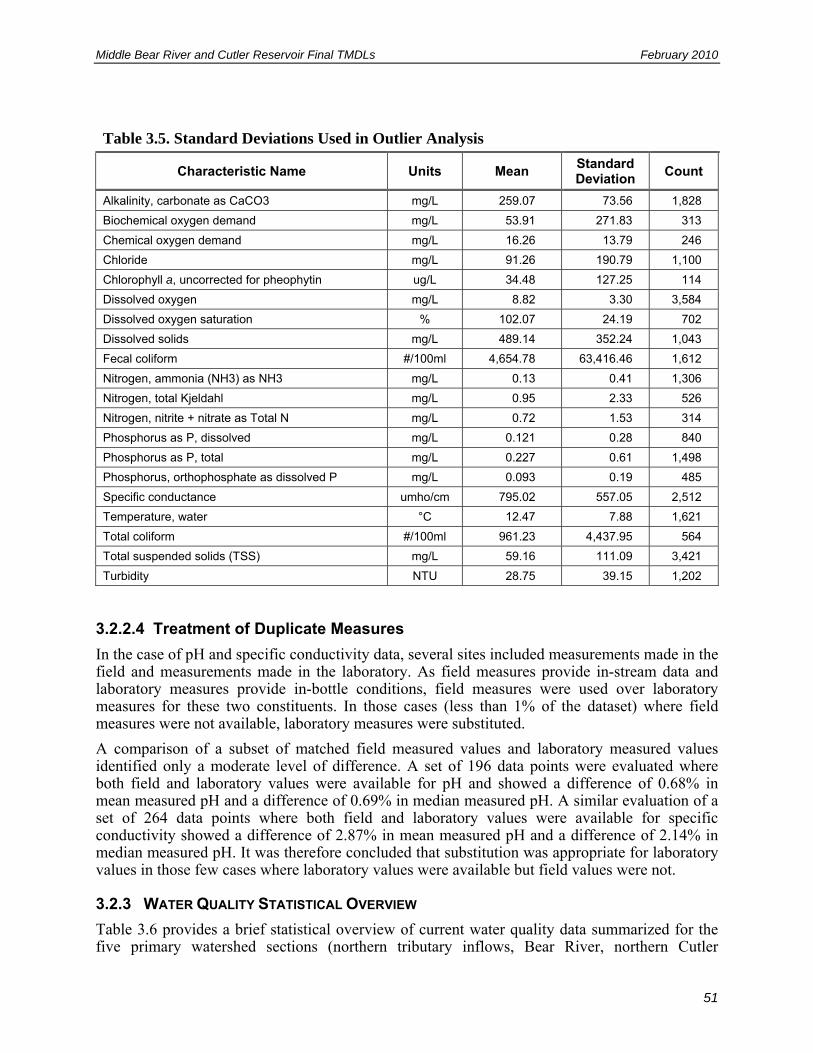
Middle Bear River and Cutler Reservoir Final TMDLs February 2010
51
Table 3.5. Standard Deviations Used in Outlier Analysis
Characteristic Name Units Mean Standard Deviation
Count
Alkalinity, carbonate as CaCO3 mg/L 259.07 73.56 1,828
Biochemical oxygen demand mg/L 53.91 271.83 313
Chemical oxygen demand mg/L 16.26 13.79 246
Chloride mg/L 91.26 190.79 1,100
Chlorophyll a, uncorrected for pheophytin ug/L 34.48 127.25 114
Dissolved oxygen mg/L 8.82 3.30 3,584
Dissolved oxygen saturation % 102.07 24.19 702
Dissolved solids mg/L 489.14 352.24 1,043
Fecal coliform #/100ml 4,654.78 63,416.46 1,612
Nitrogen, ammonia (NH3) as NH3 mg/L 0.13 0.41 1,306
Nitrogen, total Kjeldahl mg/L 0.95 2.33 526
Nitrogen, nitrite + nitrate as Total N mg/L 0.72 1.53 314
Phosphorus as P, dissolved mg/L 0.121 0.28 840
Phosphorus as P, total mg/L 0.227 0.61 1,498
Phosphorus, orthophosphate as dissolved P mg/L 0.093 0.19 485
Specific conductance umho/cm 795.02 557.05 2,512
Temperature, water °C 12.47 7.88 1,621
Total coliform #/100ml 961.23 4,437.95 564
Total suspended solids (TSS) mg/L 59.16 111.09 3,421
Turbidity NTU 28.75 39.15 1,202
3.2.2.4 Treatment of Duplicate Measures
In the case of pH and specific conductivity data, several sites included measurements made in the field and measurements made in the laboratory. As field measures provide in-stream data and laboratory measures provide in-bottle conditions, field measures were used over laboratory measures for these two constituents. In those cases (less than 1% of the dataset) where field measures were not available, laboratory measures were substituted.
A comparison of a subset of matched field measured values and laboratory measured values identified only a moderate level of difference. A set of 196 data points were evaluated where both field and laboratory values were available for pH and showed a difference of 0.68% in mean measured pH and a difference of 0.69% in median measured pH. A similar evaluation of a set of 264 data points where both field and laboratory values were available for specific conductivity showed a difference of 2.87% in mean measured pH and a difference of 2.14% in median measured pH. It was therefore concluded that substitution was appropriate for laboratory values in those few cases where laboratory values were available but field values were not.
3.2.3 WATER QUALITY STATISTICAL OVERVIEW
Table 3.6 provides a brief statistical overview of current water quality data summarized for the five primary watershed sections (northern tributary inflows, Bear River, northern Cutler
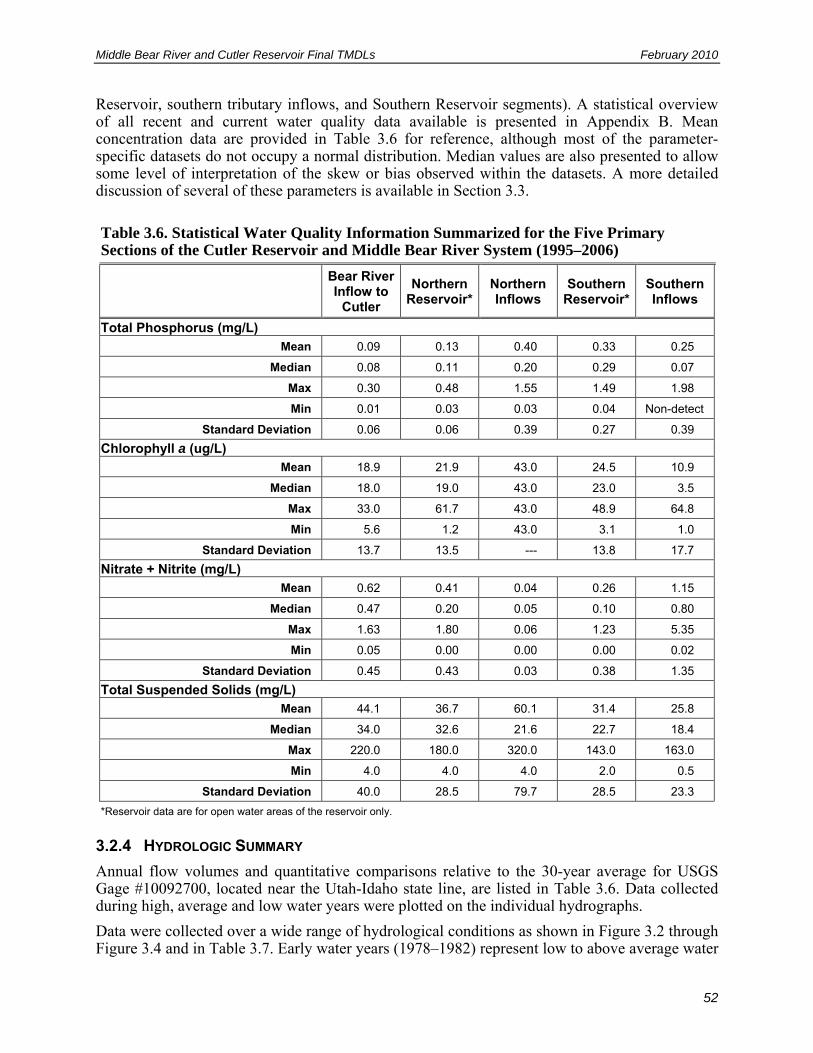
Middle Bear River and Cutler Reservoir Final TMDLs February 2010
52
Reservoir, southern tributary inflows, and Southern Reservoir segments). A statistical overview of all recent and current water quality data available is presented in Appendix B. Mean concentration data are provided in Table 3.6 for reference, although most of the parameter-specific datasets do not occupy a normal distribution. Median values are also presented to allow some level of interpretation of the skew or bias observed within the datasets. A more detailed discussion of several of these parameters is available in Section 3.3.
Table 3.6. Statistical Water Quality Information Summarized for the Five Primary Sections of the Cutler Reservoir and Middle Bear River System (1995–2006)
Bear River Inflow to
Cutler
Northern Reservoir*
Northern Inflows
Southern Reservoir*
Southern Inflows
Total Phosphorus (mg/L) Mean 0.09 0.13 0.40 0.33 0.25
Median 0.08 0.11 0.20 0.29 0.07
Max 0.30 0.48 1.55 1.49 1.98
Min 0.01 0.03 0.03 0.04 Non-detect
Standard Deviation 0.06 0.06 0.39 0.27 0.39
Chlorophyll a (ug/L) Mean 18.9 21.9 43.0 24.5 10.9
Median 18.0 19.0 43.0 23.0 3.5
Max 33.0 61.7 43.0 48.9 64.8
Min 5.6 1.2 43.0 3.1 1.0
Standard Deviation 13.7 13.5 --- 13.8 17.7
Nitrate + Nitrite (mg/L) Mean 0.62 0.41 0.04 0.26 1.15
Median 0.47 0.20 0.05 0.10 0.80
Max 1.63 1.80 0.06 1.23 5.35
Min 0.05 0.00 0.00 0.00 0.02
Standard Deviation 0.45 0.43 0.03 0.38 1.35
Total Suspended Solids (mg/L) Mean 44.1 36.7 60.1 31.4 25.8
Median 34.0 32.6 21.6 22.7 18.4
Max 220.0 180.0 320.0 143.0 163.0
Min 4.0 4.0 4.0 2.0 0.5
Standard Deviation 40.0 28.5 79.7 28.5 23.3
*Reservoir data are for open water areas of the reservoir only.
3.2.4 HYDROLOGIC SUMMARY
Annual flow volumes and quantitative comparisons relative to the 30-year average for USGS Gage #10092700, located near the Utah-Idaho state line, are listed in Table 3.6. Data collected during high, average and low water years were plotted on the individual hydrographs.
Data were collected over a wide range of hydrological conditions as shown in Figure 3.2 through Figure 3.4 and in Table 3.7. Early water years (1978–1982) represent low to above average water

Middle Bear River and Cutler Reservoir Final TMDLs February 2010
53
years (range=70%–114% of the 30-year average), as measured at the USGS Gage #10092700 located near the Utah–Idaho state line. The 1980s saw very high water years in the Bear River system, with 1983–1987 flows ranging 126%–278% of the 30-year average (mean=211%). More recent water years (1988–1996) represent below average water years (range=52%–68% of the 30-year average). Current water years show slightly above average total measured flows in 1997–2000 (range=95%–163%), whereas very recent water years are representative of drought conditions (range=37%–74%).
The Bear River system is highly modified, with six hydroelectric plants on the main stem and over 450 irrigation organizations that own and operate systems in the basin, supplying water to nearly 500,000 acres of land. The flow patterns observed in the Bear River are influenced to a substantial degree by impoundments and diversions upstream of Cutler Reservoir. These structures reshape the hydrograph, decreasing the intensity and increasing the duration of spring runoff flows, while extending summer flows to a greater degree than was most likely observed in pre-settlement conditions. Although the Middle Bear River represents the majority of the water inflowing to Cutler Reservoir, a number of other tributaries flow into the reservoir that are not managed to the same degree as the Bear River, and therefore experience a more natural flow regime and also contribute significant quantities of water. Flows measured in the Logan River above First Dam, at USGS Gage #10109000, are assumed to reflect the natural runoff patterns of tributaries.
1971
1972 19
7319
7419
7519
7619
7719
7819
7919
8019
8119
8219
8319
8419
8519
8619
8719
8819
8919
9019
91 1992
1993 19
94 1995
1996
1997
1998
1999
2000
2001
2002
2003
2004 2005
2006
0
500
1,000
1,500
2,000
2,500
3,000
1975 1980 1985 1990 1995 2000 2005
An
nu
al f
low
(c
fs)
Average water year Low water year High water year
Figure 3.2. Available flow data by water year as measured at USGS Gage #10092700 near the Utah–Idaho state line (30-year average, 1975–2003).
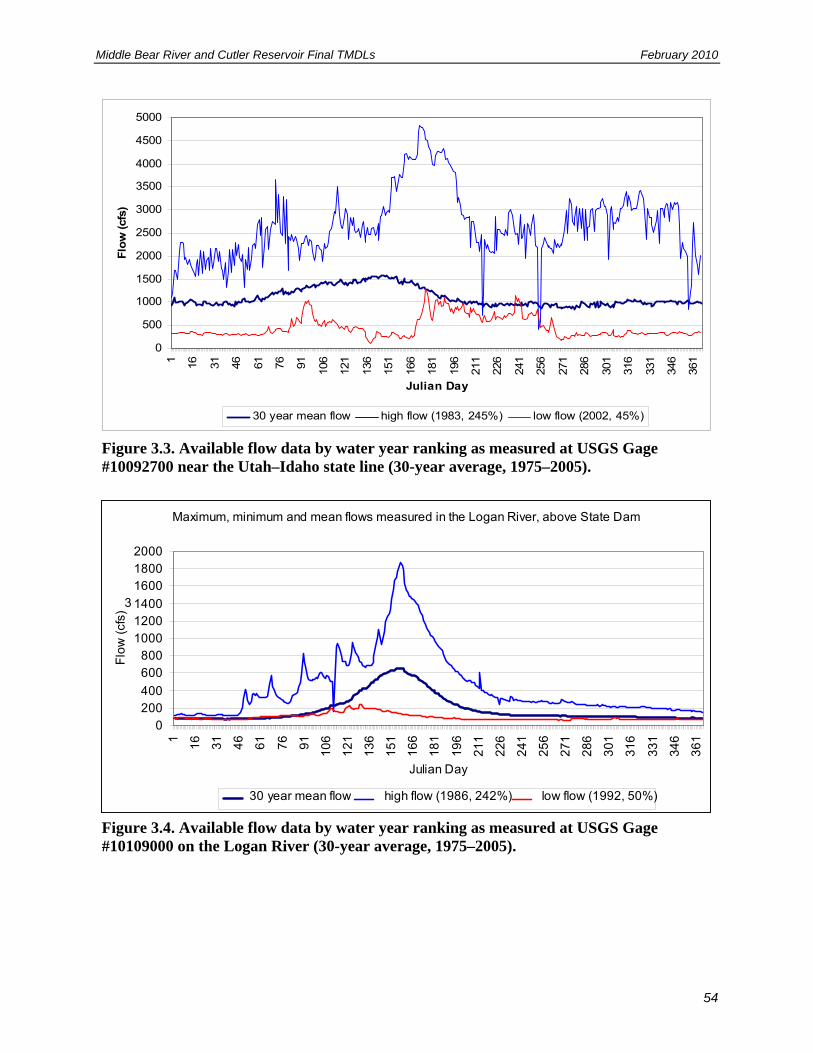
Middle Bear River and Cutler Reservoir Final TMDLs February 2010
54
0
500
1000
1500
2000
2500
3000
3500
4000
4500
5000
1 16 31 46 61 76 91 106
121
136
151
166
181
196
211
226
241
256
271
286
301
316
331
346
361
Julian Day
Flo
w (
cfs)
30 year mean flow high flow (1983, 245%) low flow (2002, 45%)
Figure 3.3. Available flow data by water year ranking as measured at USGS Gage #10092700 near the Utah–Idaho state line (30-year average, 1975–2005).
Maximum, minimum and mean flows measured in the Logan River, above State Dam
0200400
600800
100012001400
160018002000
1
16
31
46
61
76
91
10
6
12
1
13
6
15
1
16
6
18
1
19
6
21
1
22
6
24
1
25
6
27
1
28
6
30
1
31
6
33
1
34
6
36
1
Julian Day
Flo
w (
cfs)
3
30 year mean flow high flow (1986, 242%) low flow (1992, 50%)
Figure 3.4. Available flow data by water year ranking as measured at USGS Gage #10109000 on the Logan River (30-year average, 1975–2005).

Middle Bear River and Cutler Reservoir Final TMDLs February 2010
55
Table 3.7. Annual Flow Volumes and Quantitative Comparisons Relative to the 30-year Average for the Bear River at USGS Gage #10092700
Water Year
Flow (cfs) Percent of 30-year
Average Flow
1978 797 81%
1979 687 70%
1980 1,122 114%
1981 874 89%
1982 918 94%
1983 2,485 253%
1984 2,728 278%
1985 1,772 181%
1986 2,490 254%
1987 1,231 126%
1988 566 58%
1989 573 58%
1990 532 54%
1991 547 56%
1992 505 52%
1993 668 68%
1994 525 54%
1995 604 62%
1996 734 75%
1997 1,348 137%
1998 1,597 163%
1999 1,445 147%
2000 932 95%
2001 528 54%
2002 458 47%
2003 414 42%
2004 358 37%
2005 657 67%
2006 724 74%
2007 594 61%
30-year Average
974 100%
Middle Bear River and Cutler Reservoir Final TMDLs February 2010
56
3.2.5 IDENTIFIED DATA GAPS AND SUPPLEMENTAL STUDY METHODOLOGY
This assessment identifies those areas in which additional data are required to finalize the TMDL process and those areas in which additional data would be helpful to assess the current support status of beneficial uses. Identified data gaps, grouped into general and specific categories are listed by pollutant category in Table 3.8. Methodologies employed for filling identified data gaps is also included in the following sections. In addition, a diagram of data availability and uncertainty associated with individual components of the Cutler Reservoir hydrologic and ecological system is available in Appendix F: Figure F-17.

Middle Bear River and Cutler Reservoir Final TMDLs February 2010
57
Table 3.8. Data Gaps Identified in the Cutler Reservoir Watershed TMDL Process
Data Gap Description Proposed Mechanism to Address/Accommodate Gap
Lack of measured flow data
Flow data are lacking for tributaries and reservoir canal outflow.
A combination of surface flow information identified by the UDWR in the Bear River Basin Water Plan (January 2004), measured flow data from tributary and reservoir systems (UDEQ and PacifiCorp), and estimates of groundwater infiltration (UGS and USGS) have been assessed collectively and applied to calculation of annual inflow volumes and a generalized water budget for the reservoir. Outflow will be estimated through gauged dam release and irrigation records for the canal.
Lack of water quality monitoring in reservoir canal outflow
Few water quality data are available for the reservoir canal outflow, with the exception of a limited suite of samples collected during the summers of 2004–2005.
The current suite of data, along with model output for the location immediately upstream of the dam (if modeling software is approved by UDEQ), will be used to determine the canal outflow component of reservoir loading. Canal volumes available from the irrigation records will be used to populate the model boundary conditions for the summer irrigation season. Conservative assumptions will be applied in the calculation of loading to minimize error. An appropriate MOS will be applied.
Lack of diurnal DO data
Grab-samples do not represent the critical period for DO excursions.
Additional, continuous (diurnal) data for several locations in Cutler Reservoir and the inflowing tributaries better characterize DO conditions in the reservoir and support of the designated warm water game fishery (8/12–28/2003, 8/1–7/2005, 8/22–26/2005, 7/13–20/2006, 3/8–9/2007, 6/26–6/29/2007, 10/3–10/15/2007).
Lack of diurnal temperature data
Grab-samples cannot be assumed to represent the critical period for temperature excursions.
Additional, continuous (diurnal) data were collected for several locations in Cutler Reservoir and the inflowing tributaries to better characterize temperature conditions in the reservoir and support of the designated warm water game fishery (8/12–28/2003, 8/1–7/2005, 8/22–26/2005, 7/13–20/2006, 3/8–9/2007, 6/26–6/29/2007, 10/3–10/15/2007).
Lack of comprehensive fisheries data
Essentially no current or recent fisheries data exist for Cutler Reservoir or Middle Bear River. Legacy data are very sparse.
Biologists at the USU Fish Ecology Lab were contracted to provide a fisheries study for Cutler Reservoir in 2005–2006. The report summarizes species diversity, recruitment, and fishery health at several locations in the reservoir (Budy et al. 2007).
Lack of information on the perceived support status of recreation uses on Cutler Reservoir
As recreational uses are dependent on public perception of water quality and aesthetics, an assessment of public opinion was requested by the TAC for the TMDL.
A public survey of perceived existing conditions and the influence of water quality conditions on existing use levels was conducted at four stations around the reservoir and on 09/03/05 and 10/01/05. Additionally, more comprehensive recreational survey data (2002) available from PacifiCorp were identified and incorporated into the TMDL process.
Lack of information on wetland functional status
Properly functioning wetlands are critical to the support of the waterfowl, shorebirds, and associated food chains (3D) DBU. Data for in-depth evaluation of wetland functional condition were not available at the initiation of the TMDL effort and were identified as a critical data gap by the TAC for the TMDL.
Using a modified hydrogeomorphic model, SWCA will perform a functional assessment on wetlands within the project area. Functions to be evaluated include hydrology, water treatment, and wildlife habitat. Examples of variables included in this assessment include land use, vegetation, and hydrologic modification.
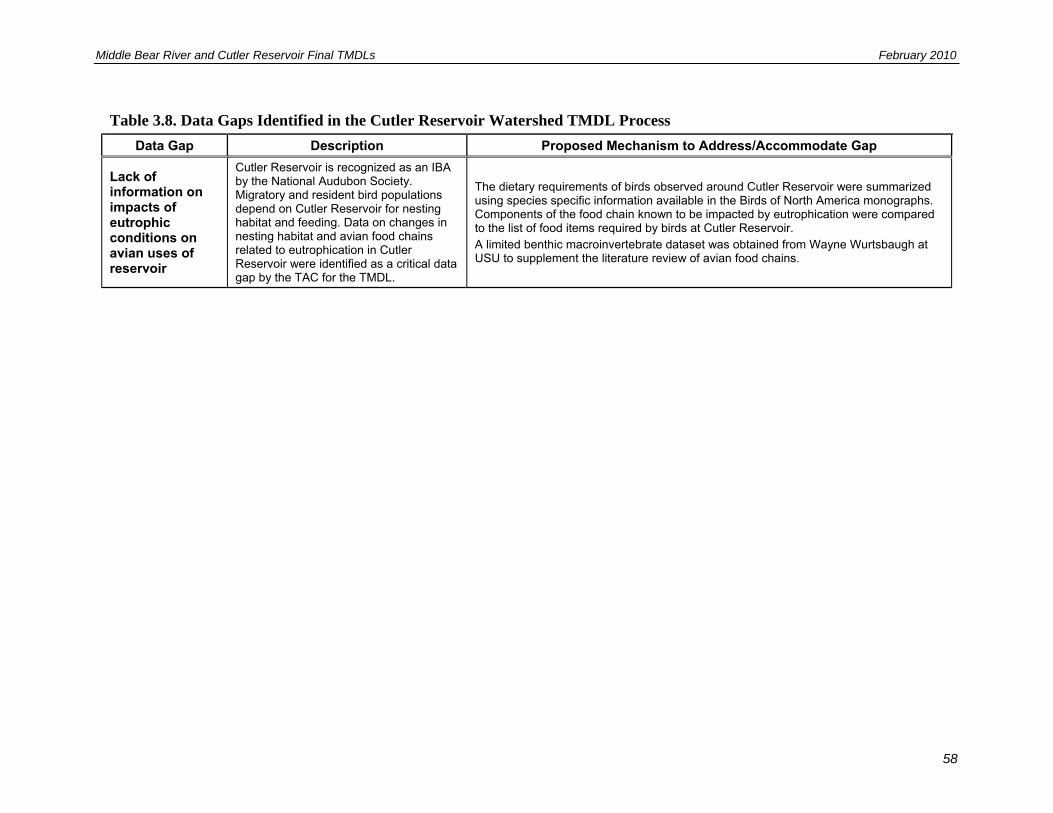
Middle Bear River and Cutler Reservoir Final TMDLs February 2010
58
Table 3.8. Data Gaps Identified in the Cutler Reservoir Watershed TMDL Process
Data Gap Description Proposed Mechanism to Address/Accommodate Gap
Lack of information on impacts of eutrophic conditions on avian uses of reservoir
Cutler Reservoir is recognized as an IBA by the National Audubon Society. Migratory and resident bird populations depend on Cutler Reservoir for nesting habitat and feeding. Data on changes in nesting habitat and avian food chains related to eutrophication in Cutler Reservoir were identified as a critical data gap by the TAC for the TMDL.
The dietary requirements of birds observed around Cutler Reservoir were summarized using species specific information available in the Birds of North America monographs. Components of the food chain known to be impacted by eutrophication were compared to the list of food items required by birds at Cutler Reservoir. A limited benthic macroinvertebrate dataset was obtained from Wayne Wurtsbaugh at USU to supplement the literature review of avian food chains.

Middle Bear River and Cutler Reservoir Final TMDLs February 2010
59
3.2.5.1 Flow
The Bear River system is highly modified, with six hydroelectric plants on the main stem and over 450 irrigation organizations that own and operate systems in the basin, supplying water to nearly 500,000 acres of land. Additional diversion and hydrologic modifications occur as a result of use and diversions to and from municipalities, individual families, waterfowl refuges, industries, and others. Often, greater than half of the natural flow of the Bear River is used to irrigate agricultural lands in Cache Valley; a portion of the water returns to the river, reservoir, and tributaries as return flow and subsurface recharge throughout the year.
Much of the water flow in the main stem and tributary systems in the Bear River watershed is not consistently gauged. Flow data are available from several USGS gauges in the watershed, but few are currently operating. Gage #10092700 is located on the Middle Bear River at the Utah–Idaho state line, that has been in operation from October of 1970 to the present. Gage #10102250 is located on the Middle Bear River near Smithfield, Utah and was in operation from April of 1964 through September of 1995.
PacifiCorp keeps a record of the discharge from Cutler Dam that is consistent but unreliable for determining water elevations on the far southern end of the reservoir due to flow restrictions within the channel.
Tributary flow is relatively ungaged as well. Gage #10102200 is located on the Cub River near Richmond, Utah and was in operation from June of 1962 to September of 2000. Gage #10105900 is located on the Little Bear River near Paradise, Utah and has been in operation from October of 1992 to the current time, but is located far upstream from Cutler Reservoir and the flow data are not representative of that at the mouth. The Logan River has several USGS gauges, including:
• Gage #10113500, located on the Blacksmith Fork of the Logan River near Hyrum, Utah, at the UP&L Dam and has been in operation from December of 1913 through the current time
• Gage #10115200, located on the Logan River below the Blacksmith Fork near Logan, Utah and was in operation between April of 1964 and October of 1980
• Gage #10109000, located on the Logan River above First Dam near Logan, Utah and has been in operation from October of 1953 though the present time.
However, these gauges are located far upstream from Cutler Reservoir that the flow data are not representative of that at the mouth of the Logan River.
Numerous canals cross the valley floor, carrying water from a variety of subwatersheds. Few are gauged, although irrigation records detail water rights, timing, and sharing protocols. Gage #10108400 is located at the head of the Logan, Hyde Park, and Smithfield Canal near Logan, Utah and has been in operation since May 1963. However, like the tributary gauges, this canal gauge is located upstream of the river and reservoir well above numerous diversions and is therefore not representative of flow throughout the canal.
Available measured data are sparse for inflow systems and downstream Bear River stations. The majority of the tributary flow data provided are estimated and the potential for error is unknown. A combination of surface flow information identified by the UDWaR in the Bear River Basin Water Plan (January 2004) measured flow data from tributary and reservoir systems (UDEQ and PacifiCorp) and estimates of groundwater infiltration (Lowe et al. 2003) have been assessed collectively. The water budget for Cutler Reservoir and tributary flow data are summarized in detail in Section 4.2.3.
Middle Bear River and Cutler Reservoir Final TMDLs February 2010
60
Seasonal inflow volumes (spring, summer, fall, and winter) for the Middle Bear River were taken directly from the USGS gauge at the state line (Gage #10092700) and represent the majority of the total inflow to the reservoir. Seasonality observed in the Logan River above First Dam (USGS Gage #10109000) was evaluated to obtain relative percent flow delivered on a seasonal basis. These percentages were assumed to be reflective of the runoff patterns of less impounded tributaries and applied to characterize seasonal flow averages and are summarized in detail in Section 4.2.3.
Conservative assumptions were applied in the calculation of representative flows to minimize margins of error, but it is acknowledged that the use of estimated or calculated flows in characterization of pollutant loading will require an appropriate MOS.
3.2.5.2 Outflow Monitoring
Although an adequate dataset exists for Station ID #4901980 (Cutler Reservoir below Cutler Dam at the UP&L bridge), the flows measured at this station are representative of the outflow from the penstock of the reservoir and the water quality flowing into the downstream segments of the Middle Bear River, but they are not representative of the total outflow of the reservoir during irrigation season. The majority of water discharged from the reservoir during the summer growing season exits via the irrigation canal (surface water withdrawal) rather than the outflow of the dam (deep water withdrawal). Therefore, these data do not necessarily provide a representative characterization of the water quality and pollutant retention characteristics (internal loading) of the reservoir during the months that water is diverted to the canal. As the canal is a surface water withdrawal, a combination of water quality data from this station and from the canal will be adequate to characterize reservoir outflow water quality on an annual basis.
Recent water quality data available to this effort consist of two limited sample suites collected from July to September of 2005 at the canal immediately downstream of the dam. Although this dataset will inform the TMDL process, it represents only a snapshot in time and cannot be applied to the wide range of conditions identified by the in-reservoir monitoring conducted over several years, and will not be representative of all conditions. Therefore, the current suite of data, along with model output for the location immediately upstream of the dam at Station ID #5900970, is assumed to be generally representative of surface water conditions and is used to determine the canal outflow component of reservoir loading. Canal volumes available from the irrigation records are used to populate the model boundary conditions for the summer season. Canal flow is minimal to nonexistent during nonirrigation seasons. Due to the small dataset available for outflow conditions, conservative assumptions were applied in the calculation of loading to minimize error.
3.2.5.3 Dissolved Oxygen (DO)
Dissolved oxygen data available at the initiation of the TMDL process were primarily instantaneous grab-samples collected in the late spring and summer months (EPA STORET Database). As such, they did not necessarily cover the time frames when exceedances are most likely to occur (night and early morning hours). As instantaneous samples, these data are not directly comparable to the state warm-water game fish criteria of no less than 5.5 mg/L (as a 30-day average), a minimum of 6.0 mg/L (as a 7-day average when early life stages are present), or a minimum of 3.0 mg/L (as a 1-day minimum when early life stages are not present).
During the course of the TMDL process, additional continuous (diurnal) data were collected by the UDWQ at several locations in Cutler Reservoir and the inflowing tributaries to better

Middle Bear River and Cutler Reservoir Final TMDLs February 2010
61
characterize DO conditions in the reservoir and support of the warm water game fishery (see Appendix F, Figure F-23). In total, data were collected at 14 stations around Cutler Reservoir on six different sampling events between 2003 and 2007. The data represent 180 days of subhourly measurements in the reservoir during three seasons (spring, summer, and fall). Some stations have more complete data coverage than others. Table 3.9 summarizes the raw field notes as well as groupings of sites used in data summaries later in this chapter. With the exception of one ditch, each site has been categorized as either lacustrine (open water), littoral (stagnant/edge waters), or riverine.
Table 3.9. Diurnal Data Collection Field Notes
Name of Station
Limno Class
Notes Start Stop
Bear River
Bear River above Cutler 1
Riverine Out of the main channel at the inflow to Cutler.
8/1/2005 18:00
8/7/2005 13:30
Bear River above Cutler 2
Riverine At the Bear River inflow to Cutler rather than old location.
6/27/2007 12:00
6/29/2007 9:30
Bear River above Cutler 2
Riverine At the Bear River inflow to Cutler rather than old location.
8/24/2007 17:00
8/26/2007 16:00
Bear River at Amalga
Riverine None. 8/24/2007
17:30 8/26/2007
16:00 Bear River at UT-ID Stateline
Riverine None. 8/23/2007
12:30 8/26/2007
16:00 Bear River below Cutler
Riverine None. 8/21/2007
10:30 8/23/2007
10:00 Northern Reservoir
Cache Junction Lacustrine On a cinder block north of the railroad (~100 yards from the bridge) sideways on rebar.
8/1/2005 18:00
8/7/2005 15:00
Cache Junction Lacustrine On a cinder block north of the railroad (~100 yards from the bridge) sideways on rebar.
8/22/2005 11:00
8/26/2005 11:00
Cache Junction Lacustrine On a cinder block north of the railroad (~100 yards from the bridge) sideways on rebar.
6/27/2007 11:38
6/29/2007 10:50
Clay Slough 1 Littoral pH cap on and data removed. Sits just out of the main Bear River channel.
8/1/2005 18:00
8/7/2005 15:30
Clay Slough 2 Littoral Moved from Clay Slough 1 to less stagnant area. Data clipped at 9:30 A.M.
8/22/2005 11:00
8/26/2005 11:00
Clay Slough 2 Littoral None 7/13/2006
0:00 7/18/2006 7:30
Clay Slough 1 and 2
Littoral Clay Slough 2 from 11:06 am 6/27/07 until 10:50 am on 6/28/2007. Moved to Clay Slough 1 at 11:15 am on 6/28/07.
6/27/2007 11:00
6/28/2007 10:50:00 AM;
11:15 on 6/29/07
East of Dam Lacustrine None 6/27/2007
12:27 6/28/2007 9:45
Southern Reservoir
Benson Marina Lacustrine North of island by marina. 8/12/2003
12:00 8/20/2003
15:00
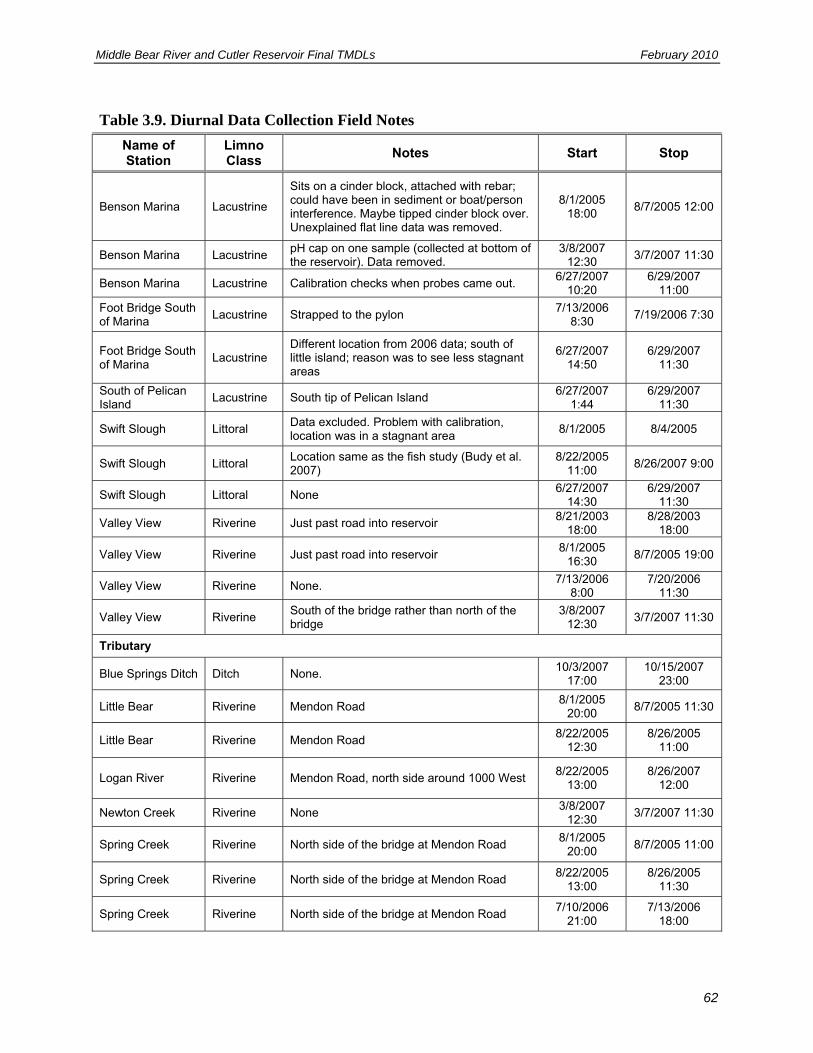
Middle Bear River and Cutler Reservoir Final TMDLs February 2010
62
Table 3.9. Diurnal Data Collection Field Notes
Name of Station
Limno Class
Notes Start Stop
Benson Marina Lacustrine
Sits on a cinder block, attached with rebar; could have been in sediment or boat/person interference. Maybe tipped cinder block over. Unexplained flat line data was removed.
8/1/2005 18:00
8/7/2005 12:00
Benson Marina Lacustrine pH cap on one sample (collected at bottom of the reservoir). Data removed.
3/8/2007 12:30
3/7/2007 11:30
Benson Marina Lacustrine Calibration checks when probes came out. 6/27/2007
10:20 6/29/2007
11:00
Foot Bridge South of Marina
Lacustrine Strapped to the pylon 7/13/2006
8:30 7/19/2006 7:30
Foot Bridge South of Marina
Lacustrine Different location from 2006 data; south of little island; reason was to see less stagnant areas
6/27/2007 14:50
6/29/2007 11:30
South of Pelican Island
Lacustrine South tip of Pelican Island 6/27/2007
1:44 6/29/2007
11:30
Swift Slough Littoral Data excluded. Problem with calibration, location was in a stagnant area
8/1/2005 8/4/2005
Swift Slough Littoral Location same as the fish study (Budy et al. 2007)
8/22/2005 11:00
8/26/2007 9:00
Swift Slough Littoral None 6/27/2007
14:30 6/29/2007
11:30
Valley View Riverine Just past road into reservoir 8/21/2003
18:00 8/28/2003
18:00
Valley View Riverine Just past road into reservoir 8/1/2005
16:30 8/7/2005 19:00
Valley View Riverine None. 7/13/2006
8:00 7/20/2006
11:30
Valley View Riverine South of the bridge rather than north of the bridge
3/8/2007 12:30
3/7/2007 11:30
Tributary
Blue Springs Ditch Ditch None. 10/3/2007
17:00 10/15/2007
23:00
Little Bear Riverine Mendon Road 8/1/2005
20:00 8/7/2005 11:30
Little Bear Riverine Mendon Road 8/22/2005
12:30 8/26/2005
11:00
Logan River Riverine Mendon Road, north side around 1000 West 8/22/2005
13:00 8/26/2007
12:00
Newton Creek Riverine None 3/8/2007
12:30 3/7/2007 11:30
Spring Creek Riverine North side of the bridge at Mendon Road 8/1/2005
20:00 8/7/2005 11:00
Spring Creek Riverine North side of the bridge at Mendon Road 8/22/2005
13:00 8/26/2005
11:30
Spring Creek Riverine North side of the bridge at Mendon Road 7/10/2006
21:00 7/13/2006
18:00
Middle Bear River and Cutler Reservoir Final TMDLs February 2010
63
Data were collected with InSitu TROLL 9000 instruments. Data collection and processing followed a standard operation procedure (SOP) for DO data collection using optical sensor technology. The SOP included collection of duplicate field samples randomly during deployment and retrieval to check accuracy. The SOP is maintained by the UDWQ and available for review. The stations and collection dates for these additional data are summarized in Table 3.9. There are several anomalous patterns in the supplemental DO datasets used in the TMDL. Data were excluded in cases where field notes indicated that the instrument had become clogged or had tipped over into the mud. Other anomalies could be related to a number of factors, including the following:
• Wind gusts and cloud bursts could explain instantaneous jumps in DO and/or temperature.
• Local disturbances related to boats, jet skis, anglers, or trains could disturb sediments and thereby increase conductivity.
• Local disturbances related to boats, jet skis, anglers, or trains could mix water and thereby increase DO and temperature during the summer.
• An algal bloom die-off event could dramatically increase sediment oxygen demand and thereby reduce DO dramatically over a short period of time.
• Equipment malfunction could explain some changes. Battery voltage was recorded and monitored but indicated no malfunctions or loss in power to equipment.
• Change in algal concentrations due to either a bloom or movement of a bloom due to wind action would result in DO changes over a short period of time.
• Dissolved oxygen concentrations could have been raised due to the mixing action of the motorized boat used during equipment deployment. This elevated DO might take several days to settle back to a lower equilibrium. This pattern has been noted on several graphs (including Valley View in August 2003).
There is no way to know which of these explanations might apply to individual sampling periods or locations. Therefore, in the absence of evidence for equipment malfunction, the anomalous patterns are assumed to be representative of the variability and complex dynamics present in Cutler Reservoir. For this reason, excursions below the DO water quality standard are assumed to be valid.
In the assessment of impairment discussed later in this chapter, available instantaneous DO data were compared with state warm-water game fish criteria of a minimum of 5.0 mg/L (as a 1-day minimum when early life stages are present) and a minimum of 3.0 mg/L (as a 1-day minimum when early life stages are not present).
Middle Bear River and Cutler Reservoir Final TMDLs February 2010
64
3.2.5.4 Temperature
Similar to the DO data discussed earlier, water temperature data available at the initiation of the TMDL process were primarily instantaneous grab-samples collected in the late spring and summer months (STORET). As instantaneous samples, they do not necessarily cover the time frame when exceedances are most likely to occur (afternoon hours), but are generally more representative of critical conditions than daytime DO measurements. As instantaneous samples, these data are not directly comparable to the state warm water game fish criteria of no greater than 27° C as a daily maximum. Instantaneous grab-samples in excess of the criteria cannot be used to characterize the magnitude of the criteria exceedance, but they do indicate that an exceedance has occurred. During the course of the TMDL process, additional, continuous (diurnal) data were collected for several locations in Cutler Reservoir and the inflowing tributaries to better characterize temperature conditions in the reservoir and support of the designated warm water game fishery (8/12–8/28/2003, 8/1–8/7/2005, 8/22–8/26/2005, 7/13–7/20/2006, 3/8–3/9/2007).
3.2.5.5 Chlorophyll a
Detailed algae and chlorophyll a data are not available at a robust level for Cutler Reservoir and the inflowing tributaries in a temporally coordinated dataset. Most of the available data are not pheophytin-corrected. Chlorophyll a data corrected for pheophytin can act as a surrogate for algal mass within the Middle Bear River and Cutler Reservoir system. Pheophytin-correction distinguishes between living algae/plant material and detritus carried in by high flows or tributary systems. Additional data were collected as supplemental monitoring to inform the TMDL process. Supplemental chlorophyll a data were collected simultaneously with nutrient and physical characteristic data and are pheophytin-corrected. However, none of the chlorophyll a data intersect with diurnal DO collection dates, so a correlation between the two parameters cannot be drawn.
3.2.5.6 Wetland Functional Status
Properly functioning wetlands are critical to the support of the waterfowl, shorebirds, and associated food chains (beneficial use 3D). Data for in-depth evaluation of wetland functional conditions were not available at the initiation of the TMDL effort and were identified as a critical data gap by the TAC for the TMDL. Through field reconnaissance and GIS applications, SWCA gathered site-specific data on three wetlands within the project area. Stations reflected different wetland types within the study area and were selected based on the availability of other datasets such as fisheries, water quality, and avian resources. The data, which describe land use cover, plant community composition, and the location and type of hydrologic modifications, were applied to a mathematical formula based on a hydrogeomorphic model developed by the UDWiR. Findings are presented in the form of capacity scores (on a scale of 0 to 1) for five functions. Functions include internal water flow, external water flow, removal of dissolved elements and compounds, particulate retention, and wildlife habitat support.
3.2.5.7 Fisheries Data
At the initiation of the TMDL process, fisheries data for the Middle Bear River and Cutler Reservoir were sparse and somewhat outdated. Information from Idaho Department of Fish and Game (IDFG) fisheries for the Bear River north of the Idaho state border were available through the Idaho Department of Environmental Quality (IDEQ) Bear River TMDL (IDEQ 2005), but research did not extend beyond the state line. Staff at UDWiR provided information from creel
Middle Bear River and Cutler Reservoir Final TMDLs February 2010
65
surveys completed 1967–1971 on the main stem of the Middle Bear River; these surveys may allow trend analysis if more current information becomes available in the future, but they weren’t appropriate for analysis of current Middle Bear River populations and did not provide information on Cutler Reservoir species or populations. During the course of the TMDL process, USU was contracted to provide a fisheries study for Cutler Reservoir in 2005 and 2006. The study, conducted by Phaedra Budy at USU, provides an update on the fish populations and their health (Budy et al. 2007).
3.2.5.8 Secondary Contact Recreational Use Support Status
The lack of data on the perception of DBU support status from a public viewpoint was discussed on several occasions in conversations with the UDWQ and in public and technical TAC meetings. A public survey of perceived existing conditions and the influence of water quality on existing use levels was conducted to fill this gap at four access points around the reservoir and over two survey days. The survey was instrumental in supplementing telephone survey data gathered by PacifiCorp regarding recreational use of Cutler Reservoir.
3.2.5.9 Avian Food Chain Review
Cutler Reservoir is protected for waterfowl, shorebirds, and other aquatic organisms and their associated food chains (beneficial use 3D). To assess this use, linkages between eutrophication and avian uses need to be identified. Although some empirical data document the presence of bird species within the project area, little has been done to qualify or quantify available food resources. In an effort to illustrate the connections between habitat, water quality, aquatic macroinvertebrate diversity, and bird productivity, SWCA conducted a brief literature review on bird diet for species observed at Cutler Reservoir as a component of this TMDL process. These findings will aid in the identification of data gaps and future research needs.
As Kaufman writes in the monograph Lives of North American Birds (1996), the act of feeding is comprised of both diet and behavior; with greater diversity and abundance of prey species and habitat niches contributing a higher abundance of bird groups potentially occupying the habitat. Impaired water quality, especially nutrient enrichment, can affect both prey and foraging habitat availability. For example, biological assemblages (e.g., type and amount of aquatic macroinvertebrates) can be negatively affected by severe diurnal variation in DO and pH (Wang et al. 2007). Similarly, the availability of foraging habitat can also be affected by water quality. For example, the number of bird groups present in a waterbody is a function of the mosaic of habitat types. As open water is converted to monocultures of cattail (Typha spp.) and common reed (Phragmites australis), or as turbidity increases due to algal growth, the feeding habitat associated with bird group behavior disappears. These relationships demonstrate that the combination of the type and quality of available habitat and the type and amount of macroinvertebrates directly affects the diversity of avian resources supported at Cutler Reservoir.
3.2.6 SUMMARY
According to CWA guidelines, states are to use the best available data in the TMDL process; in those cases where data gaps exist, states are to include an appropriate MOS to account for analytical uncertainty and environmental variability. In most cases, the Cutler Reservoir system has a complete set of available data for the evaluation of water quality impairment. Identified data gaps were filled either by additional monitoring or methods for interpolating missing data. Therefore, an appropriate MOS was incorporated.
Middle Bear River and Cutler Reservoir Final TMDLs February 2010
66
3.3 BENEFICIAL USE SUPPORT ASSESSMENT FOR CUTLER RESERVOIR AND
MIDDLE BEAR RIVER
Water quality in Middle Bear River and Cutler Reservoir was assessed based on a process consistent with the guidelines established by EPA under the CWA, and with the programs and policies established by UDEQ. The assessment process identified the beneficial uses specific to the reservoir and the water quality criteria that apply to the protection of these uses. Water quality was evaluated by comparing the available water quality data to numeric water quality criteria and calculating direct exceedances of numeric criteria. Additional lines of evidence were used to further assess impairment of Designated Beneficial Uses (DBU) as follows:
2. A wetland functional assessment (DBU 3D) 3. Nuisance algal growth assessment (DBU 2B, 3B, and 3D) 4. Algal species composition (DBU 2B, 3B, 3D, and 4) 5. Fish population diversity and health (DBU 3B) 6. Avian food inventory (DBU 3D) 7. Recreation use surveys (DBU 2B) 8. Benthic macroinvertebrate data (DBU 3B and 3D) 9. Trophic State Index (DBU 2B, 3B, and 3D)
A system diagram indicating key linkages between nutrient loading and beneficial use impairment in Cutler Reservoir is available in Appendix F: Figure F-15. Nutrients are linked to beneficial uses via algal growth, turbidity, DO, and macrophytes. These mechanisms and interacting linkages are summarized in the following sections.
3.3.1 DIRECT EXCEEDANCE OF NUMERIC CRITERIA OR THRESHOLDS
Exceedances of water quality criteria and thresholds specific to eutrophication and DBU support are evident within Cutler Reservoir and the inflowing tributary systems.
A direct assessment was completed for the watershed to describe the available data for exceedance of numeric criteria and identify pollutant thresholds. A cursory discussion of the level of exceedance observed for pertinent water quality standards and threshold values on a watershed basis is presented in the following parameter-specific sections.
3.3.1.1 Ammonia (3B and 3D)
The available data show no exceedances of the ammonia criteria in either the Middle Bear River or Cutler Reservoir.
3.3.1.2 Bacteria (2B)
Violations of the numeric criteria for bacteria in surface waters can result in health risks to individuals using the water for recreation or other activities. Such activities carry the risk of ingestion of small quantities of water. High bacteria counts can be indicators of improper animal or human waste disposal, grazing, or livestock management practices.
The State of Utah recently revised the bacteria standard to be specific to E. coli (less than 206 E. coli organisms per 100 mL as a 30-day geometric mean, and less than 940 E. coli organisms per 100 mL as a maximum). The previous standard was specific to fecal coliform and total coliform (Utah Water Quality Standards 2000); therefore, the majority of recent and historic bacteria data available to the TMDL effort are fecal coliform counts. The coliform datasets show routine
Middle Bear River and Cutler Reservoir Final TMDLs February 2010
67
exceedances of the previous criteria of 5,000 cfu/100 mL for total coliform and 200 cfu/100 mL for fecal coliform. Over 41% of the data collected since 1995 from the Middle Bear River above Cutler Reservoir (Station ID #4903260) exceed the previous fecal coliform standard, and 53% of the data exceed the total coliform standard. Exceedances in Cutler Reservoir during this same period range from less than 1% at Clay Sough (Station ID #4904720) to 8% at Benson Bridge (Station ID #5901000) for fecal coliform, and 12% at Clay Slough and 10% at Benson Bridge for total coliform. Data were collected on different days in Middle Bear River than Cutler Reservoir so a direct comparison is not possible. However, the exceedances observed in the Middle Bear River appear not to extend into Cutler Reservoir. The Middle Bear River exceedances indicate a nearby source of fecal material. The travel time between the Middle Bear River station and the Cutler Reservoir stations may provide sufficient time for coliform bacteria to be out competed naturally. Fecal coliform bacteria can survive in water for several hours to several days.
Additional E. coli data were collected at critical water quality monitoring stations during the summer and fall of 2004. Data collected were instantaneous grab-samples and as such were evaluated against the absolute maximum criteria (less than 940 E. coli organisms per 100 mL as a maximum). These data show E. coli counts in excess of the criteria at Spring Creek (Station ID #4904900, 2,419/100mL) and Little Bear River (Station ID #4905000, 1,233/100mL) on 8/4/2004 and at Spring Creek (Station ID #4904900, >2,419/100mL), and Little Bear River (Station ID #4905000, 1,986/100mL) on 8/18/2004. Data collected at the Logan River, Logan Lagoons, in-reservoir, and northern tributary stations did not show exceedances of the criteria.
3.3.1.3 Nuisance Algal Growth
A common surrogate measure of algal growth is chlorophyll a. Chlorophyll is the green pigment in plants associated with photosynthesis (the process whereby plants combine light energy, nutrients, and carbon to grow). A measure of chlorophyll provides an estimate of the amount of photosynthesizing algae that are in the water column. On average, chlorophyll a makes up approximately 1.5% of algal organic matter (Raschke 1993), and if chlorophyll a concentrations are known, the phytoplankton biomass in a waterbody can be estimated.
The State of Utah has not identified numeric water quality criteria for chlorophyll a; however, discharges or conditions leading to nuisance algal growth are addressed as narrative criteria (Utah State Code RS317-2-14).
“It shall be unlawful, and a violation of these regulations, for any person to discharge or place any waste or other substance in such a way as will be or may become offensive such as unnatural deposits, floating debris, oil, scum or other nuisances such as color, odor or taste; or cause conditions which produce undesirable aquatic life or which produce objectionable tastes in edible aquatic organisms; or result in concentrations or combinations of substances which produce undesirable physiological responses in desirable resident fish, or other desirable aquatic life, or undesirable human health effects, as determined by bioassay or other tests performed in accordance with standard procedures.”
A review of existing literature regarding nuisance thresholds and chlorophyll a was undertaken to identify generally accepted values based on current science and other regulatory processes. A review of aquatic life needs (Pilgrim et al. 2001) reported chlorophyll a concentrations of 10–15 µg/l to be protective of waters inhabited by salmonids, and 25–40 µg/l for waters inhabited by non-salmonids. A similar review of chlorophyll a targets based on public perception, recreational use, and aesthetics identified a range of maximum chlorophyll a concentrations of 15–50 µg/l from a number of U.S. states and Canada. Data on water discoloration show that a level of
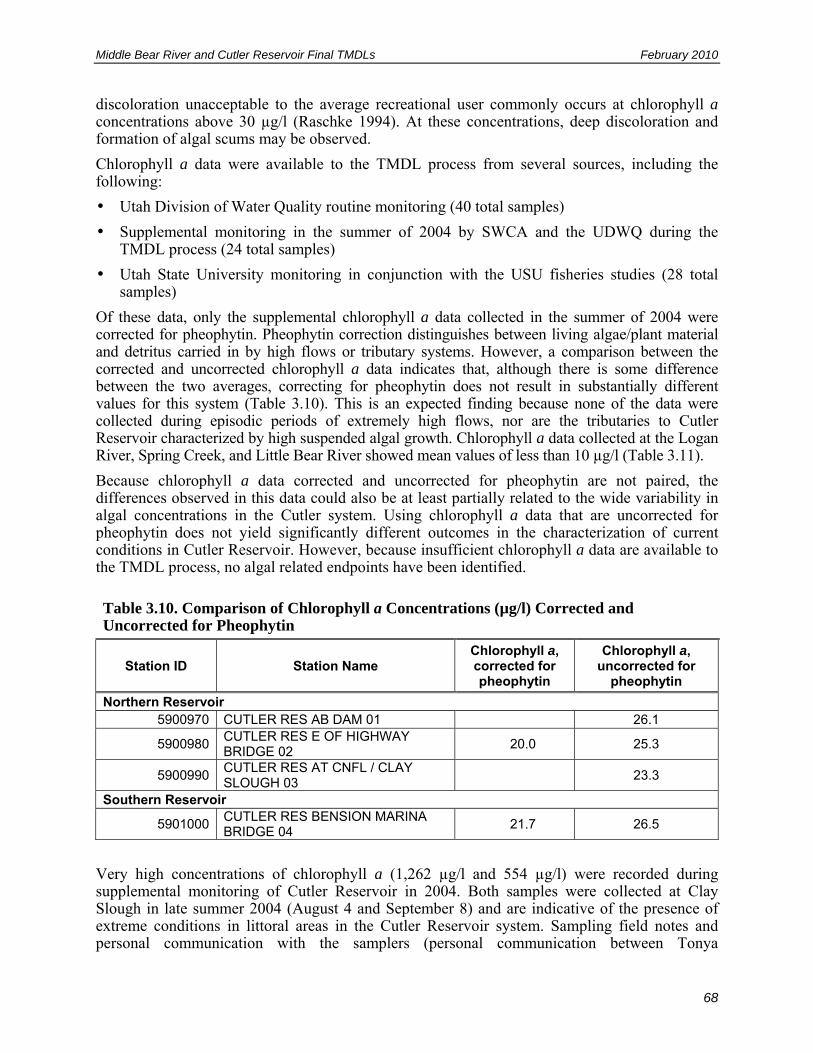
Middle Bear River and Cutler Reservoir Final TMDLs February 2010
68
discoloration unacceptable to the average recreational user commonly occurs at chlorophyll a concentrations above 30 µg/l (Raschke 1994). At these concentrations, deep discoloration and formation of algal scums may be observed.
Chlorophyll a data were available to the TMDL process from several sources, including the following:
• Utah Division of Water Quality routine monitoring (40 total samples)
• Supplemental monitoring in the summer of 2004 by SWCA and the UDWQ during the TMDL process (24 total samples)
• Utah State University monitoring in conjunction with the USU fisheries studies (28 total samples)
Of these data, only the supplemental chlorophyll a data collected in the summer of 2004 were corrected for pheophytin. Pheophytin correction distinguishes between living algae/plant material and detritus carried in by high flows or tributary systems. However, a comparison between the corrected and uncorrected chlorophyll a data indicates that, although there is some difference between the two averages, correcting for pheophytin does not result in substantially different values for this system (Table 3.10). This is an expected finding because none of the data were collected during episodic periods of extremely high flows, nor are the tributaries to Cutler Reservoir characterized by high suspended algal growth. Chlorophyll a data collected at the Logan River, Spring Creek, and Little Bear River showed mean values of less than 10 µg/l (Table 3.11).
Because chlorophyll a data corrected and uncorrected for pheophytin are not paired, the differences observed in this data could also be at least partially related to the wide variability in algal concentrations in the Cutler system. Using chlorophyll a data that are uncorrected for pheophytin does not yield significantly different outcomes in the characterization of current conditions in Cutler Reservoir. However, because insufficient chlorophyll a data are available to the TMDL process, no algal related endpoints have been identified.
Table 3.10. Comparison of Chlorophyll a Concentrations (µg/l) Corrected and Uncorrected for Pheophytin
Station ID Station Name Chlorophyll a, corrected for pheophytin
Chlorophyll a, uncorrected for
pheophytin
Northern Reservoir 5900970 CUTLER RES AB DAM 01 26.1
5900980 CUTLER RES E OF HIGHWAY BRIDGE 02
20.0 25.3
5900990 CUTLER RES AT CNFL / CLAY SLOUGH 03
23.3
Southern Reservoir
5901000 CUTLER RES BENSION MARINA BRIDGE 04
21.7 26.5
Very high concentrations of chlorophyll a (1,262 µg/l and 554 µg/l) were recorded during supplemental monitoring of Cutler Reservoir in 2004. Both samples were collected at Clay Slough in late summer 2004 (August 4 and September 8) and are indicative of the presence of extreme conditions in littoral areas in the Cutler Reservoir system. Sampling field notes and personal communication with the samplers (personal communication between Tonya
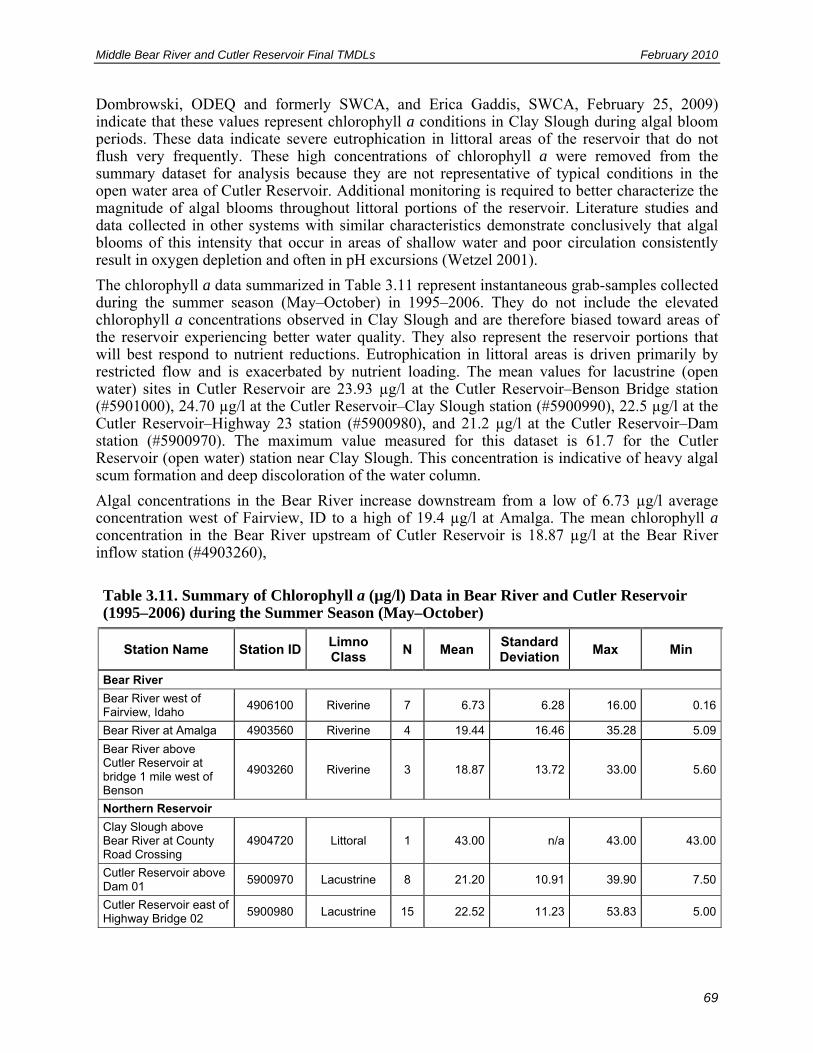
Middle Bear River and Cutler Reservoir Final TMDLs February 2010
69
Dombrowski, ODEQ and formerly SWCA, and Erica Gaddis, SWCA, February 25, 2009) indicate that these values represent chlorophyll a conditions in Clay Slough during algal bloom periods. These data indicate severe eutrophication in littoral areas of the reservoir that do not flush very frequently. These high concentrations of chlorophyll a were removed from the summary dataset for analysis because they are not representative of typical conditions in the open water area of Cutler Reservoir. Additional monitoring is required to better characterize the magnitude of algal blooms throughout littoral portions of the reservoir. Literature studies and data collected in other systems with similar characteristics demonstrate conclusively that algal blooms of this intensity that occur in areas of shallow water and poor circulation consistently result in oxygen depletion and often in pH excursions (Wetzel 2001).
The chlorophyll a data summarized in Table 3.11 represent instantaneous grab-samples collected during the summer season (May–October) in 1995–2006. They do not include the elevated chlorophyll a concentrations observed in Clay Slough and are therefore biased toward areas of the reservoir experiencing better water quality. They also represent the reservoir portions that will best respond to nutrient reductions. Eutrophication in littoral areas is driven primarily by restricted flow and is exacerbated by nutrient loading. The mean values for lacustrine (open water) sites in Cutler Reservoir are 23.93 µg/l at the Cutler Reservoir–Benson Bridge station (#5901000), 24.70 µg/l at the Cutler Reservoir–Clay Slough station (#5900990), 22.5 µg/l at the Cutler Reservoir–Highway 23 station (#5900980), and 21.2 µg/l at the Cutler Reservoir–Dam station (#5900970). The maximum value measured for this dataset is 61.7 for the Cutler Reservoir (open water) station near Clay Slough. This concentration is indicative of heavy algal scum formation and deep discoloration of the water column.
Algal concentrations in the Bear River increase downstream from a low of 6.73 µg/l average concentration west of Fairview, ID to a high of 19.4 µg/l at Amalga. The mean chlorophyll a concentration in the Bear River upstream of Cutler Reservoir is 18.87 µg/l at the Bear River inflow station (#4903260),
Table 3.11. Summary of Chlorophyll a (µg/l) Data in Bear River and Cutler Reservoir (1995–2006) during the Summer Season (May–October)
Station Name Station ID Limno Class
N Mean Standard Deviation
Max Min
Bear River
Bear River west of Fairview, Idaho
4906100 Riverine 7 6.73 6.28 16.00 0.16
Bear River at Amalga 4903560 Riverine 4 19.44 16.46 35.28 5.09
Bear River above Cutler Reservoir at bridge 1 mile west of Benson
4903260 Riverine 3 18.87 13.72 33.00 5.60
Northern Reservoir
Clay Slough above Bear River at County Road Crossing
4904720 Littoral 1 43.00 n/a 43.00 43.00
Cutler Reservoir above Dam 01
5900970 Lacustrine 8 21.20 10.91 39.90 7.50
Cutler Reservoir east of Highway Bridge 02
5900980 Lacustrine 15 22.52 11.23 53.83 5.00
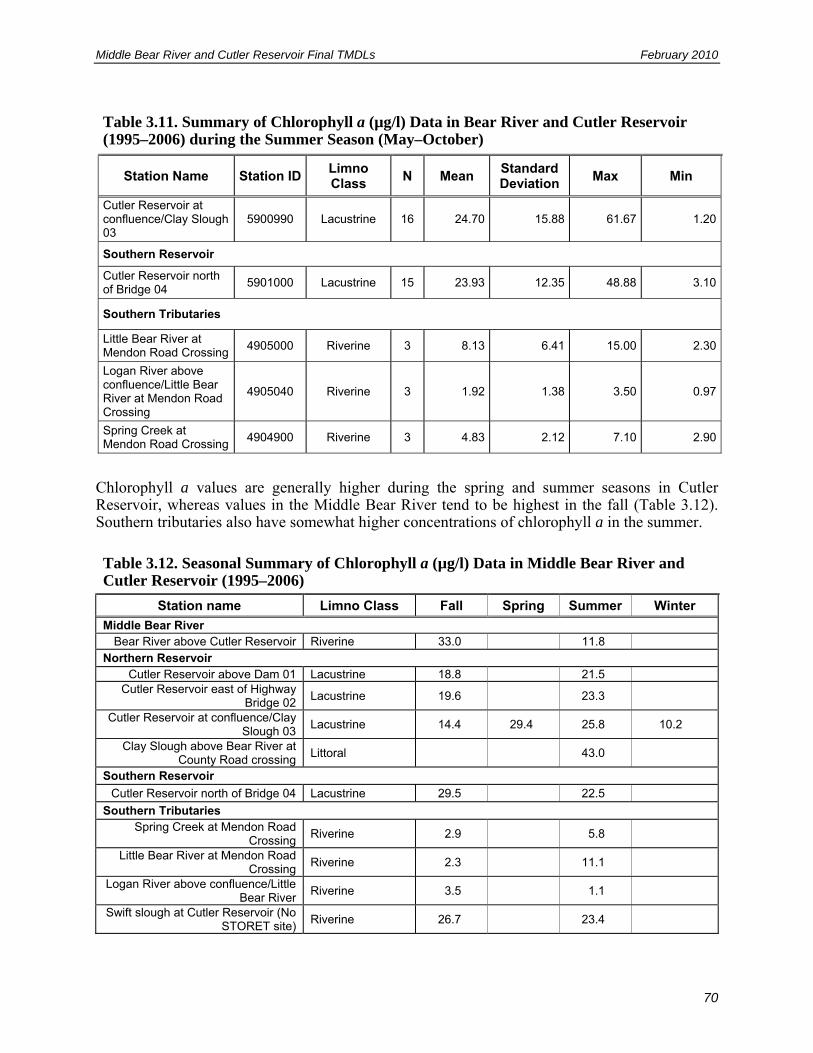
Middle Bear River and Cutler Reservoir Final TMDLs February 2010
70
Table 3.11. Summary of Chlorophyll a (µg/l) Data in Bear River and Cutler Reservoir (1995–2006) during the Summer Season (May–October)
Station Name Station ID Limno Class
N Mean Standard Deviation
Max Min
Cutler Reservoir at confluence/Clay Slough 03
5900990 Lacustrine 16 24.70 15.88 61.67 1.20
Southern Reservoir
Cutler Reservoir north of Bridge 04
5901000 Lacustrine 15 23.93 12.35 48.88 3.10
Southern Tributaries
Little Bear River at Mendon Road Crossing
4905000 Riverine 3 8.13 6.41 15.00 2.30
Logan River above confluence/Little Bear River at Mendon Road Crossing
4905040 Riverine 3 1.92 1.38 3.50 0.97
Spring Creek at Mendon Road Crossing
4904900 Riverine 3 4.83 2.12 7.10 2.90
Chlorophyll a values are generally higher during the spring and summer seasons in Cutler Reservoir, whereas values in the Middle Bear River tend to be highest in the fall (Table 3.12). Southern tributaries also have somewhat higher concentrations of chlorophyll a in the summer.
Table 3.12. Seasonal Summary of Chlorophyll a (µg/l) Data in Middle Bear River and Cutler Reservoir (1995–2006)
Station name Limno Class Fall Spring Summer Winter
Middle Bear River Bear River above Cutler Reservoir Riverine 33.0 11.8
Northern Reservoir Cutler Reservoir above Dam 01 Lacustrine 18.8 21.5
Cutler Reservoir east of Highway Bridge 02
Lacustrine 19.6 23.3
Cutler Reservoir at confluence/Clay Slough 03
Lacustrine 14.4 29.4 25.8 10.2
Clay Slough above Bear River at County Road crossing
Littoral 43.0
Southern Reservoir
Cutler Reservoir north of Bridge 04 Lacustrine 29.5 22.5
Southern Tributaries Spring Creek at Mendon Road
Crossing Riverine 2.9 5.8
Little Bear River at Mendon Road Crossing
Riverine 2.3 11.1
Logan River above confluence/Little Bear River
Riverine 3.5 1.1
Swift slough at Cutler Reservoir (No STORET site)
Riverine 26.7 23.4
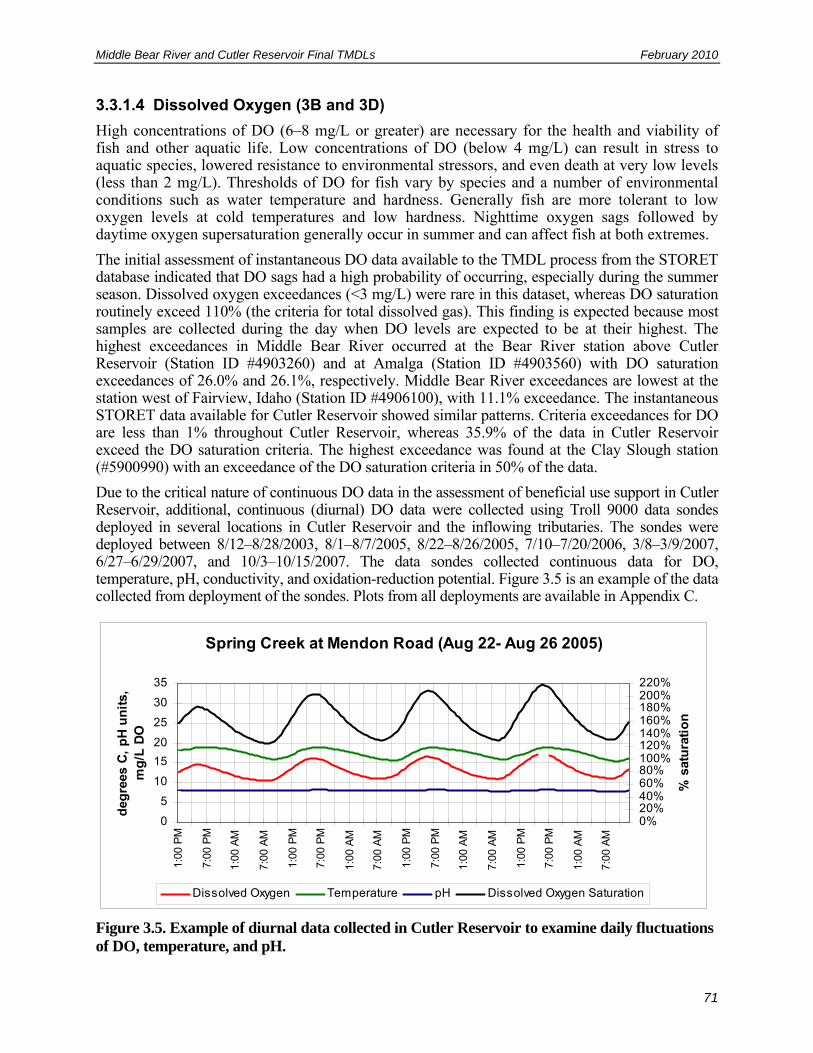
Middle Bear River and Cutler Reservoir Final TMDLs February 2010
71
3.3.1.4 Dissolved Oxygen (3B and 3D)
High concentrations of DO (6–8 mg/L or greater) are necessary for the health and viability of fish and other aquatic life. Low concentrations of DO (below 4 mg/L) can result in stress to aquatic species, lowered resistance to environmental stressors, and even death at very low levels (less than 2 mg/L). Thresholds of DO for fish vary by species and a number of environmental conditions such as water temperature and hardness. Generally fish are more tolerant to low oxygen levels at cold temperatures and low hardness. Nighttime oxygen sags followed by daytime oxygen supersaturation generally occur in summer and can affect fish at both extremes.
The initial assessment of instantaneous DO data available to the TMDL process from the STORET database indicated that DO sags had a high probability of occurring, especially during the summer season. Dissolved oxygen exceedances (<3 mg/L) were rare in this dataset, whereas DO saturation routinely exceed 110% (the criteria for total dissolved gas). This finding is expected because most samples are collected during the day when DO levels are expected to be at their highest. The highest exceedances in Middle Bear River occurred at the Bear River station above Cutler Reservoir (Station ID #4903260) and at Amalga (Station ID #4903560) with DO saturation exceedances of 26.0% and 26.1%, respectively. Middle Bear River exceedances are lowest at the station west of Fairview, Idaho (Station ID #4906100), with 11.1% exceedance. The instantaneous STORET data available for Cutler Reservoir showed similar patterns. Criteria exceedances for DO are less than 1% throughout Cutler Reservoir, whereas 35.9% of the data in Cutler Reservoir exceed the DO saturation criteria. The highest exceedance was found at the Clay Slough station (#5900990) with an exceedance of the DO saturation criteria in 50% of the data.
Due to the critical nature of continuous DO data in the assessment of beneficial use support in Cutler Reservoir, additional, continuous (diurnal) DO data were collected using Troll 9000 data sondes deployed in several locations in Cutler Reservoir and the inflowing tributaries. The sondes were deployed between 8/12–8/28/2003, 8/1–8/7/2005, 8/22–8/26/2005, 7/10–7/20/2006, 3/8–3/9/2007, 6/27–6/29/2007, and 10/3–10/15/2007. The data sondes collected continuous data for DO, temperature, pH, conductivity, and oxidation-reduction potential. Figure 3.5 is an example of the data collected from deployment of the sondes. Plots from all deployments are available in Appendix C.
Spring Creek at Mendon Road (Aug 22- Aug 26 2005)
0
5
10
15
20
25
30
35
1:00
PM
7:00
PM
1:00
AM
7:00
AM
1:00
PM
7:00
PM
1:00
AM
7:00
AM
1:00
PM
7:00
PM
1:00
AM
7:00
AM
1:00
PM
7:00
PM
1:00
AM
7:00
AM
deg
rees
C,
pH
un
its,
m
g/L
DO
0%20%40%60%80%100%120%140%160%180%200%220%
% s
atu
rati
on
Dissolved Oxygen Temperature pH Dissolved Oxygen Saturation
Figure 3.5. Example of diurnal data collected in Cutler Reservoir to examine daily fluctuations of DO, temperature, and pH.
Middle Bear River and Cutler Reservoir Final TMDLs February 2010
72
The diurnal data collected indicate that DO concentrations within Cutler Reservoir fluctuate on a daily cycle that is dependent on the daily change in temperature and photosynthesis and on the respiration of aquatic plants and wildlife. This daily (diurnal) cycle is the reason that continuous DO data are critical to an accurate understanding of reservoir conditions and illustrates why instantaneous grab-samples are not necessarily descriptive of critical conditions. These diurnal datasets were used to further assess exceedances of DO criteria (Table 3.13). These criterion include:
• The 1-day minimum criteria of DO at no less than 3 mg/L for all life stages • The early life-stage, 1-day minimum criteria of DO at no less than 5 mg/L • A 7-day average DO of no less than 6 mg/L. Very few datasets extend for an entire week, so
this assessment is intended to show general trends but not actual exceedances.
The highest percentage of DO exceedances occurs in the open water portions of the Southern Reservoir and the lowest percentage of exceedances occur in the open water portions of the Northern Reservoir. This provides further rationale for separation of these two parts of Cutler Reservoir for data analysis, load analysis, and identification of water quality endpoints. Most exceedances occur on the same days, with the majority of them in early August (2003 and 2005) and mid-July (2006).
In the Northern Reservoir, 13% and 18% of the DO data collected exceed the 1-day criteria for all life stages and early life stages, respectively (Table 3.13). The majority of these exceedances are in Clay Slough, a littoral portion of the reservoir. No exceedances of the all life stage criteria (3 mg/l) were observed in the open water portion of the Northern Reservoir, and only 12% exceeded the early life stage criteria of 5 mg/l.
In the Southern Reservoir, 16% and 32% of the DO data collected exceed the 1-day criteria for all life stages and early life stages, respectively (Table 3.13). The majority of these exceedances are near Benson Marina, an open water area. Open water areas experienced 37% and 60% exceedance of the all life stages and early life stages criteria, respectively (Table 3.13). The highest DO exceedances observed at any site in the reservoir were recorded at Benson Marina. Southern tributaries to Cutler Reservoir also experienced extended periods of time (August 1–7) when the DO was below the levels determined to be protective of warm water game fish. The extended 7-day DO criteria for early life stages is <6 mg/L during early August 2005 (Table 3.15). Although exceedances of these criteria could not be assessed because a full 7 days of data were not available, data collected over several days at sites throughout the Southern Reservoir and its tributaries indicate likely exceedances of this standard (Table 3.15).
Assessment of diurnal data collected in the Middle Bear River indicates only isolated exceedances of DO criteria. No exceedances of the all life-stage criteria (>3 mg/L) were observed at any of the stations monitored in the Middle Bear River. At the Bear River station above Cutler Reservoir minimum daily DO values exceeded the early life-stage criteria (>5 mg/L) 33% of the time. One exceedance of the early life-stage criteria was observed at the Bear River station at the Utah-Idaho state line in addition to all of the data collected from the Bear River station below Cutler Reservoir.
In summary, diurnal data collected in summer months (July and August) exhibited substantial low DO concentrations coupled with high magnitude fluctuations between daytime highs and nighttime lows (Table 3.13 and Table 3.16). Both conditions indicate impairment to aquatic life and their food chains, including warm water fish, and benthic macroinvertebrates.
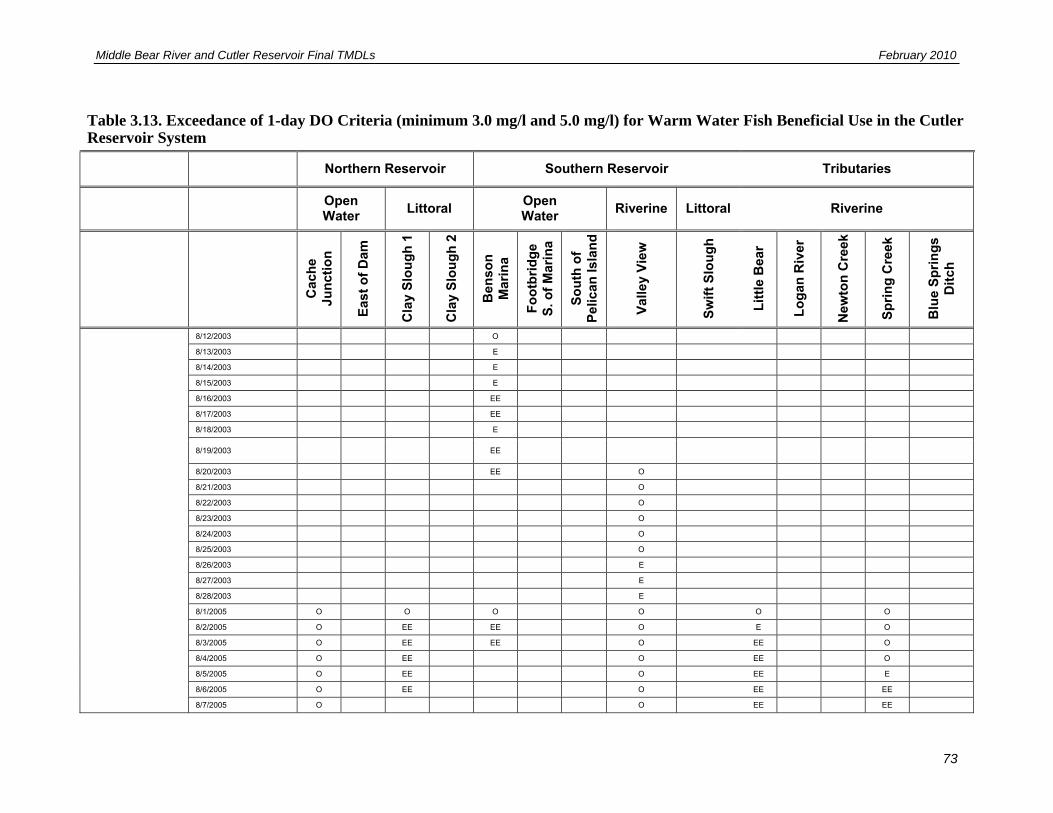
Middle Bear River and Cutler Reservoir Final TMDLs February 2010
73
Table 3.13. Exceedance of 1-day DO Criteria (minimum 3.0 mg/l and 5.0 mg/l) for Warm Water Fish Beneficial Use in the Cutler Reservoir System
Northern Reservoir Southern Reservoir Tributaries
Open Water
Littoral Open Water
Riverine Littoral Riverine
Cac
he
Jun
ctio
n
Eas
t o
f D
am
Cla
y S
lou
gh
1
Cla
y S
lou
gh
2
Ben
son
M
arin
a
Fo
otb
rid
ge
S. o
f M
arin
a
So
uth
of
Pel
ican
Isla
nd
Val
ley
Vie
w
Sw
ift
Slo
ug
h
Lit
tle
Bea
r
Lo
gan
Riv
er
New
ton
Cre
ek
Sp
rin
g C
reek
Blu
e S
pri
ng
s D
itch
8/12/2003 O
8/13/2003 E
8/14/2003 E
8/15/2003 E
8/16/2003 EE
8/17/2003 EE
8/18/2003 E
8/19/2003 EE
8/20/2003 EE O
8/21/2003 O
8/22/2003 O
8/23/2003 O
8/24/2003 O
8/25/2003 O
8/26/2003 E
8/27/2003 E
8/28/2003 E
8/1/2005 O O O O O O
8/2/2005 O EE EE O E O
8/3/2005 O EE EE O EE O
8/4/2005 O EE O EE O
8/5/2005 O EE O EE E
8/6/2005 O EE O EE EE
8/7/2005 O O EE EE

Middle Bear River and Cutler Reservoir Final TMDLs February 2010
74
Table 3.13. Exceedance of 1-day DO Criteria (minimum 3.0 mg/l and 5.0 mg/l) for Warm Water Fish Beneficial Use in the Cutler Reservoir System
Northern Reservoir Southern Reservoir Tributaries
Open Water
Littoral Open Water
Riverine Littoral Riverine
Cac
he
Jun
ctio
n
Eas
t o
f D
am
Cla
y S
lou
gh
1
Cla
y S
lou
gh
2
Ben
son
M
arin
a
Fo
otb
rid
ge
S. o
f M
arin
a
So
uth
of
Pel
ican
Isla
nd
Val
ley
Vie
w
Sw
ift
Slo
ug
h
Lit
tle
Bea
r
Lo
gan
Riv
er
New
ton
Cre
ek
Sp
rin
g C
reek
Blu
e S
pri
ng
s D
itch
8/22/2005 O O O O O O
8/23/2005 O O O O O O
8/24/2005 O O E O O O
8/25/2005 E O EE O O O
8/26/2005 E O E O O O
7/10/2006 O
7/11/2006 O
7/12/2006 O
7/13/2006 O O O O
7/14/2006 O E O
7/15/2006 O O O
7/16/2006 O EE O
7/17/2006 O EE O
7/18/2006 O EE O
7/19/2006 EE O
7/20/2006 O
3/8/2007 O O O
3/9/2007 EE O O
6/27/2007 O O O O O O O
6/28/2007 O O O O E O O O
6/29/2007 O O O E O E
10/3/2007 O O
10/4/2007 O O
10/5/2007 O O
10/6/2007 O O
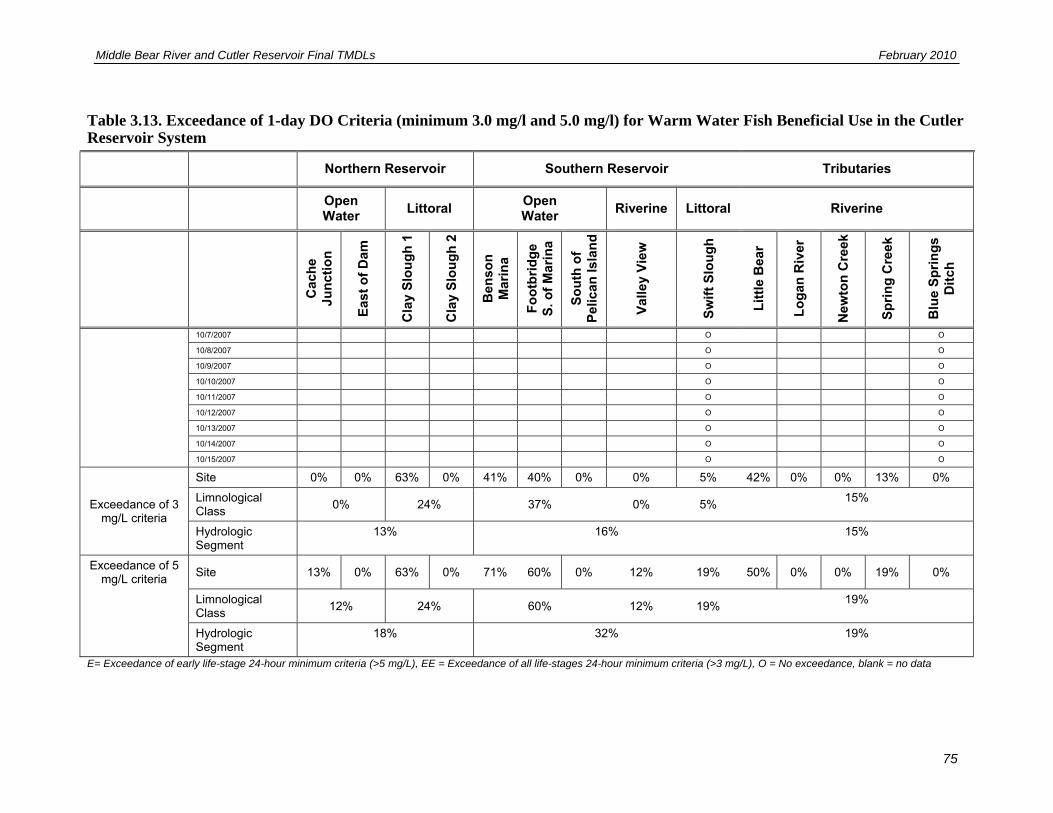
Middle Bear River and Cutler Reservoir Final TMDLs February 2010
75
Table 3.13. Exceedance of 1-day DO Criteria (minimum 3.0 mg/l and 5.0 mg/l) for Warm Water Fish Beneficial Use in the Cutler Reservoir System
Northern Reservoir Southern Reservoir Tributaries
Open Water
Littoral Open Water
Riverine Littoral Riverine
Cac
he
Jun
ctio
n
Eas
t o
f D
am
Cla
y S
lou
gh
1
Cla
y S
lou
gh
2
Ben
son
M
arin
a
Fo
otb
rid
ge
S. o
f M
arin
a
So
uth
of
Pel
ican
Isla
nd
Val
ley
Vie
w
Sw
ift
Slo
ug
h
Lit
tle
Bea
r
Lo
gan
Riv
er
New
ton
Cre
ek
Sp
rin
g C
reek
Blu
e S
pri
ng
s D
itch
10/7/2007 O O
10/8/2007 O O
10/9/2007 O O
10/10/2007 O O
10/11/2007 O O
10/12/2007 O O
10/13/2007 O O
10/14/2007 O O
10/15/2007 O O
Exceedance of 3 mg/L criteria
Site 0% 0% 63% 0% 41% 40% 0% 0% 5% 42% 0% 0% 13% 0%
Limnological Class
0% 24% 37% 0% 5% 15%
Hydrologic Segment
13%
16%
15%
Exceedance of 5 mg/L criteria
Site 13% 0% 63% 0% 71% 60% 0% 12% 19% 50% 0% 0% 19% 0%
Limnological Class
12% 24% 60% 12% 19% 19%
Hydrologic Segment
18%
32%
19%
E= Exceedance of early life-stage 24-hour minimum criteria (>5 mg/L), EE = Exceedance of all life-stages 24-hour minimum criteria (>3 mg/L), O = No exceedance, blank = no data
Middle Bear River and Cutler Reservoir Final TMDLs February 2010
76
This page intentionally blank.

Middle Bear River and Cutler Reservoir Final TMDLs February 2010
77
Table 3.14. Exceedance of 1-Day DO Criteria for Warm Water Fish Beneficial Use in Middle Bear River
Date Bear River at Utah-Idaho State Line
Bear River at Amalga
Bear River Above Cutler
Reservoir
Bear River Below Cutler
Reservoir
Exceedance of Early Life-
stage Criteria
(DO>3 mg/L)
Exceedance of all Life-stage
Criteria (DO>5 mg/L)
8/1/2005 O 0% 0%
8/2/2005 E 0% 100%
8/3/2005 E 0% 100%
8/4/2005 E 0% 100%
8/5/2005 O 0% 0%
8/6/2005 O 0% 0%
8/7/2005 E 0% 100%
6/27/2007 O 0% 0%
6/28/2007 O 0% 0%
8/21/2007 E 0% 100%
8/22/2007 E 0% 100%
8/23/2007 O E 0% 50%
8/24/2007 O O O 0% 0%
8/25/2007 O O O 0% 0%
8/26/2007 E O O 0% 33%
Exceedance of 3 mg/L criteria
0% 0% 0% 0% 0%
Exceedance of 5 mg/L criteria
25% 0% 33% 100% 36%
E = exceedance of early life-stage 24-hour minimum criteria (>5 mg/L); EE = exceedance of all life-stages 24-hour minimum criteria (>3 mg/L); O = no exceedance, blank = no data.

Middle Bear River and Cutler Reservoir Final TMDLs February 2010
78
This page intentionally blank.
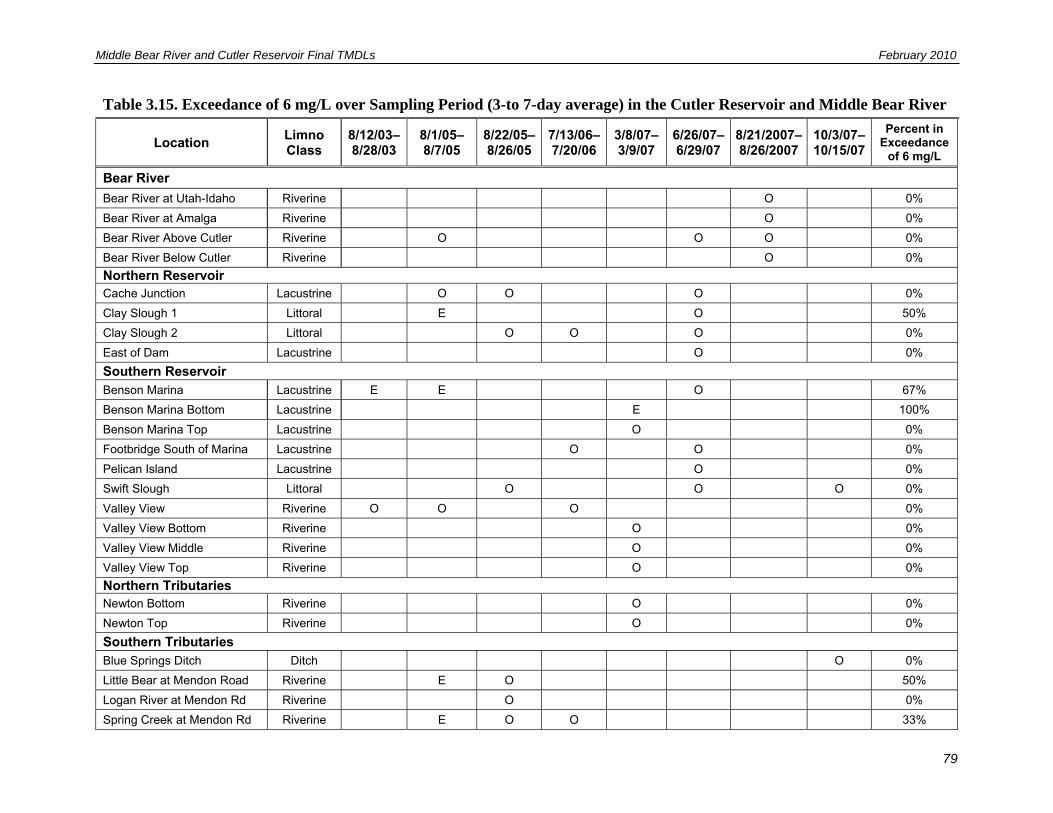
Middle Bear River and Cutler Reservoir Final TMDLs February 2010
79
Table 3.15. Exceedance of 6 mg/L over Sampling Period (3-to 7-day average) in the Cutler Reservoir and Middle Bear River
Location Limno Class
8/12/03–8/28/03
8/1/05– 8/7/05
8/22/05–8/26/05
7/13/06–7/20/06
3/8/07–3/9/07
6/26/07–6/29/07
8/21/2007– 8/26/2007
10/3/07–10/15/07
Percent in Exceedance
of 6 mg/L
Bear River
Bear River at Utah-Idaho Riverine O 0%
Bear River at Amalga Riverine O 0%
Bear River Above Cutler Riverine O O O 0%
Bear River Below Cutler Riverine O 0%
Northern Reservoir Cache Junction Lacustrine O O O 0%
Clay Slough 1 Littoral E O 50%
Clay Slough 2 Littoral O O O 0%
East of Dam Lacustrine O 0%
Southern Reservoir Benson Marina Lacustrine E E O 67%
Benson Marina Bottom Lacustrine E 100%
Benson Marina Top Lacustrine O 0%
Footbridge South of Marina Lacustrine O O 0%
Pelican Island Lacustrine O 0%
Swift Slough Littoral O O O 0%
Valley View Riverine O O O 0%
Valley View Bottom Riverine O 0%
Valley View Middle Riverine O 0%
Valley View Top Riverine O 0%
Northern Tributaries Newton Bottom Riverine O 0%
Newton Top Riverine O 0%
Southern Tributaries Blue Springs Ditch Ditch O 0%
Little Bear at Mendon Road Riverine E O 50%
Logan River at Mendon Rd Riverine O 0%
Spring Creek at Mendon Rd Riverine E O O 33%
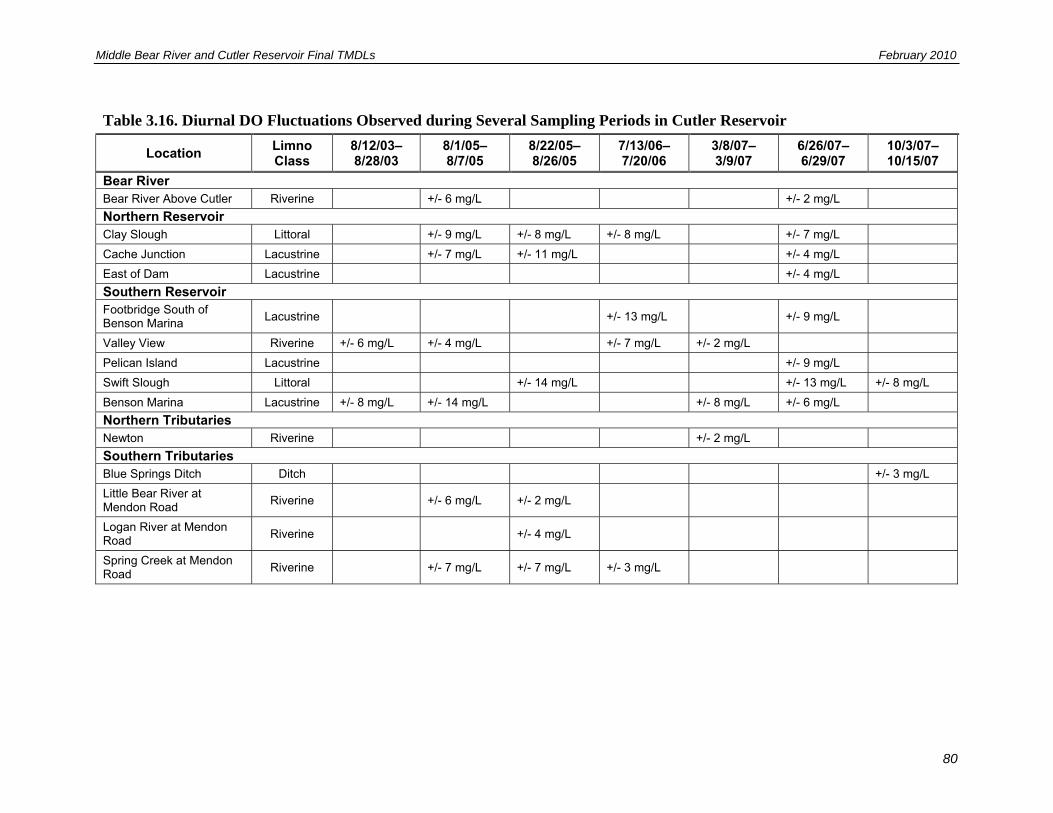
Middle Bear River and Cutler Reservoir Final TMDLs February 2010
80
Table 3.16. Diurnal DO Fluctuations Observed during Several Sampling Periods in Cutler Reservoir
Location Limno Class
8/12/03– 8/28/03
8/1/05– 8/7/05
8/22/05– 8/26/05
7/13/06– 7/20/06
3/8/07– 3/9/07
6/26/07– 6/29/07
10/3/07– 10/15/07
Bear River Bear River Above Cutler Riverine +/- 6 mg/L +/- 2 mg/L
Northern Reservoir Clay Slough Littoral +/- 9 mg/L +/- 8 mg/L +/- 8 mg/L +/- 7 mg/L
Cache Junction Lacustrine +/- 7 mg/L +/- 11 mg/L +/- 4 mg/L
East of Dam Lacustrine +/- 4 mg/L
Southern Reservoir Footbridge South of Benson Marina
Lacustrine +/- 13 mg/L +/- 9 mg/L
Valley View Riverine +/- 6 mg/L +/- 4 mg/L +/- 7 mg/L +/- 2 mg/L
Pelican Island Lacustrine +/- 9 mg/L
Swift Slough Littoral +/- 14 mg/L +/- 13 mg/L +/- 8 mg/L
Benson Marina Lacustrine +/- 8 mg/L +/- 14 mg/L +/- 8 mg/L +/- 6 mg/L
Northern Tributaries Newton Riverine +/- 2 mg/L
Southern Tributaries Blue Springs Ditch Ditch +/- 3 mg/L
Little Bear River at Mendon Road
Riverine +/- 6 mg/L +/- 2 mg/L
Logan River at Mendon Road
Riverine +/- 4 mg/L
Spring Creek at Mendon Road
Riverine +/- 7 mg/L +/- 7 mg/L +/- 3 mg/L
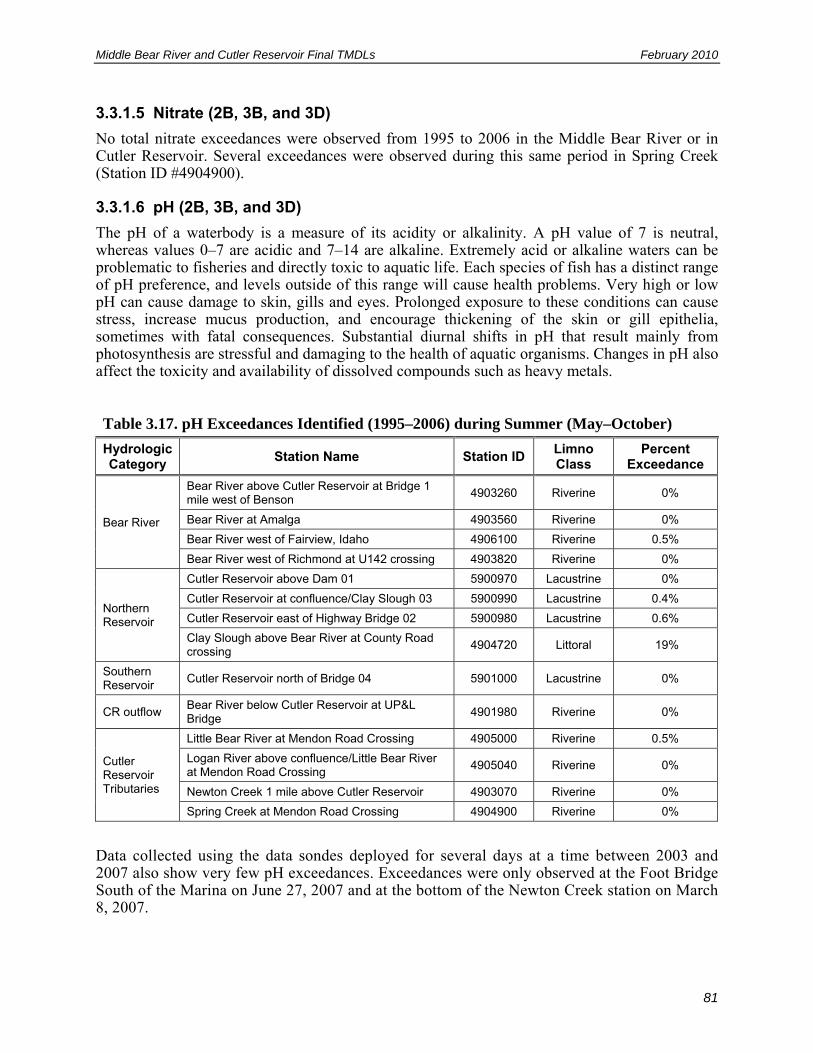
Middle Bear River and Cutler Reservoir Final TMDLs February 2010
81
3.3.1.5 Nitrate (2B, 3B, and 3D)
No total nitrate exceedances were observed from 1995 to 2006 in the Middle Bear River or in Cutler Reservoir. Several exceedances were observed during this same period in Spring Creek (Station ID #4904900).
3.3.1.6 pH (2B, 3B, and 3D)
The pH of a waterbody is a measure of its acidity or alkalinity. A pH value of 7 is neutral, whereas values 0–7 are acidic and 7–14 are alkaline. Extremely acid or alkaline waters can be problematic to fisheries and directly toxic to aquatic life. Each species of fish has a distinct range of pH preference, and levels outside of this range will cause health problems. Very high or low pH can cause damage to skin, gills and eyes. Prolonged exposure to these conditions can cause stress, increase mucus production, and encourage thickening of the skin or gill epithelia, sometimes with fatal consequences. Substantial diurnal shifts in pH that result mainly from photosynthesis are stressful and damaging to the health of aquatic organisms. Changes in pH also affect the toxicity and availability of dissolved compounds such as heavy metals.
Data collected using the data sondes deployed for several days at a time between 2003 and 2007 also show very few pH exceedances. Exceedances were only observed at the Foot Bridge South of the Marina on June 27, 2007 and at the bottom of the Newton Creek station on March 8, 2007.
Table 3.17. pH Exceedances Identified (1995–2006) during Summer (May–October)
Hydrologic Category
Station Name Station ID Limno Class
Percent Exceedance
Bear River
Bear River above Cutler Reservoir at Bridge 1 mile west of Benson
4903260 Riverine 0%
Bear River at Amalga 4903560 Riverine 0%
Bear River west of Fairview, Idaho 4906100 Riverine 0.5%
Bear River west of Richmond at U142 crossing 4903820 Riverine 0%
Northern Reservoir
Cutler Reservoir above Dam 01 5900970 Lacustrine 0%
Cutler Reservoir at confluence/Clay Slough 03 5900990 Lacustrine 0.4%
Cutler Reservoir east of Highway Bridge 02 5900980 Lacustrine 0.6%
Clay Slough above Bear River at County Road crossing
4904720 Littoral 19%
Southern Reservoir
Cutler Reservoir north of Bridge 04 5901000 Lacustrine 0%
CR outflow Bear River below Cutler Reservoir at UP&L Bridge
4901980 Riverine 0%
Cutler Reservoir Tributaries
Little Bear River at Mendon Road Crossing 4905000 Riverine 0.5%
Logan River above confluence/Little Bear River at Mendon Road Crossing
4905040 Riverine 0%
Newton Creek 1 mile above Cutler Reservoir 4903070 Riverine 0%
Spring Creek at Mendon Road Crossing 4904900 Riverine 0%

Middle Bear River and Cutler Reservoir Final TMDLs February 2010
82
On several occasions, pH values approached 9.0, including Cache Junction (Northern Reservoir) during early August 2005 and at Swift Slough and Benson Marina in late August 2005 and June 2007 (Southern Reservoir). Swift Slough and Cache Junction recorded the highest average pH values of all the stations where sondes were deployed (Table 3.18).
Table 3.18. Mean pH Values Recorded during Diurnal Sampling
Station Limno Class
8/12– 8/28/03
8/1– 8/7/05
8/22– 8/26/05
7/13– 7/20/06
3/8– 3/9/07
6/26– 6/29/07
8/21–8/26/07
10/3– 10/15/07
Bear River Bear River at Utah-Idaho State Line
Riverine 8.51
Bear River at Amalga
Riverine 8.55
Bear River Above Cutler Reservoir
Riverine 7.0 8.46 8.69
Bear River Below Cutler Reservoir
Riverine 8.35
Northern Reservoir Cache Junction Lacustrine 8.6 8.55 8.55
Clay Slough Littoral 7.08 7.97 8.53
East of Dam Lacustrine 8.58
Southern Reservoir Benson Marina Lacustrine 8.57 8.3 7.33
Benson Marina Bottom
Lacustrine
Benson Marina Top
Lacustrine 7.9
Foot Bridge South of Marina
Lacustrine 8.17 8.76
Swift Slough Littoral 8.56 8.81 8.33
Valley View Riverine 8.17 8.0 7.84
Valley View Bottom
Riverine 7.6
Valley View Middle
Riverine 6.7
Valley View Top Riverine 8.1
Northern Tributaries Newton Bottom Riverine 7.8
Newton Top Riverine 8.2
Southern Tributaries Little Bear Riverine 8.1 8.08
Logan River Riverine 7.88
South of Pelican Island
Lacustrine 8.64
Spring Creek Riverine 7.9 8.06 7.76
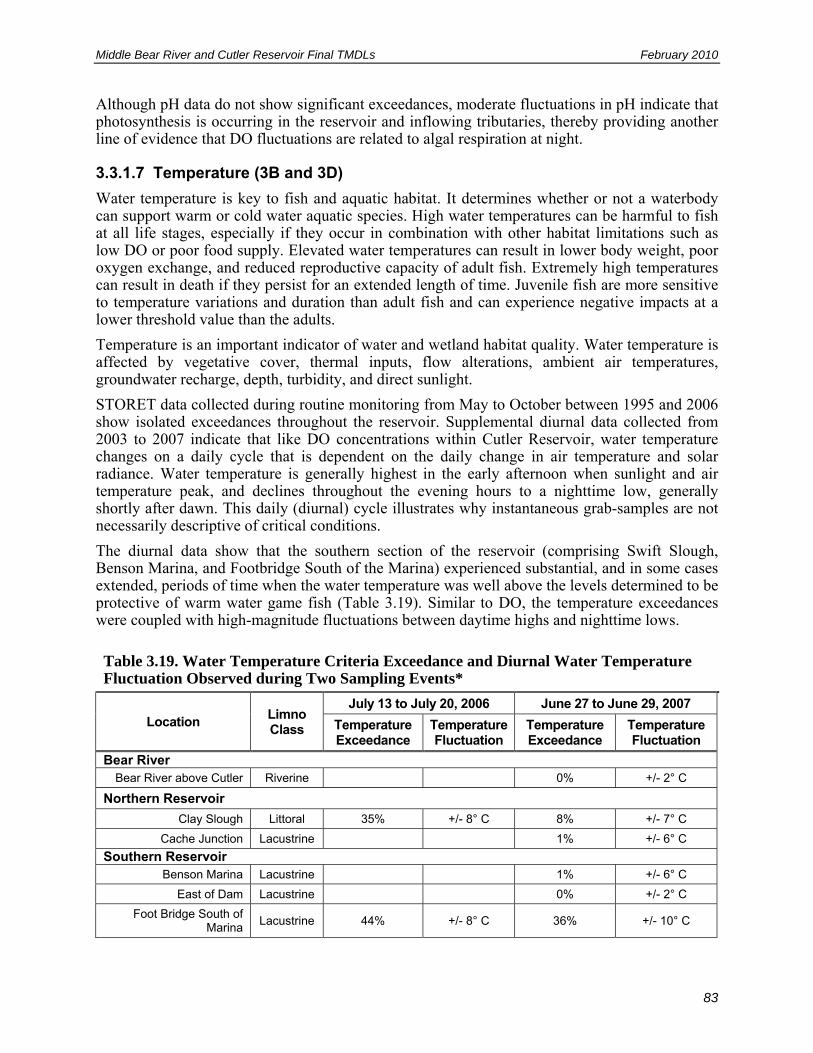
Middle Bear River and Cutler Reservoir Final TMDLs February 2010
83
Although pH data do not show significant exceedances, moderate fluctuations in pH indicate that photosynthesis is occurring in the reservoir and inflowing tributaries, thereby providing another line of evidence that DO fluctuations are related to algal respiration at night.
3.3.1.7 Temperature (3B and 3D)
Water temperature is key to fish and aquatic habitat. It determines whether or not a waterbody can support warm or cold water aquatic species. High water temperatures can be harmful to fish at all life stages, especially if they occur in combination with other habitat limitations such as low DO or poor food supply. Elevated water temperatures can result in lower body weight, poor oxygen exchange, and reduced reproductive capacity of adult fish. Extremely high temperatures can result in death if they persist for an extended length of time. Juvenile fish are more sensitive to temperature variations and duration than adult fish and can experience negative impacts at a lower threshold value than the adults.
Temperature is an important indicator of water and wetland habitat quality. Water temperature is affected by vegetative cover, thermal inputs, flow alterations, ambient air temperatures, groundwater recharge, depth, turbidity, and direct sunlight.
STORET data collected during routine monitoring from May to October between 1995 and 2006 show isolated exceedances throughout the reservoir. Supplemental diurnal data collected from 2003 to 2007 indicate that like DO concentrations within Cutler Reservoir, water temperature changes on a daily cycle that is dependent on the daily change in air temperature and solar radiance. Water temperature is generally highest in the early afternoon when sunlight and air temperature peak, and declines throughout the evening hours to a nighttime low, generally shortly after dawn. This daily (diurnal) cycle illustrates why instantaneous grab-samples are not necessarily descriptive of critical conditions.
The diurnal data show that the southern section of the reservoir (comprising Swift Slough, Benson Marina, and Footbridge South of the Marina) experienced substantial, and in some cases extended, periods of time when the water temperature was well above the levels determined to be protective of warm water game fish (Table 3.19). Similar to DO, the temperature exceedances were coupled with high-magnitude fluctuations between daytime highs and nighttime lows.
Table 3.19. Water Temperature Criteria Exceedance and Diurnal Water Temperature Fluctuation Observed during Two Sampling Events*
Location Limno Class
July 13 to July 20, 2006 June 27 to June 29, 2007
Temperature Exceedance
Temperature Fluctuation
Temperature Exceedance
Temperature Fluctuation
Bear River Bear River above Cutler Riverine 0% +/- 2° C
Northern Reservoir
Clay Slough Littoral 35% +/- 8° C 8% +/- 7° C
Cache Junction Lacustrine 1% +/- 6° C
Southern Reservoir Benson Marina Lacustrine 1% +/- 6° C
East of Dam Lacustrine 0% +/- 2° C
Foot Bridge South of Marina
Lacustrine 44% +/- 8° C 36% +/- 10° C

Middle Bear River and Cutler Reservoir Final TMDLs February 2010
84
Table 3.19. Water Temperature Criteria Exceedance and Diurnal Water Temperature Fluctuation Observed during Two Sampling Events*
South of Pelican Island Lacustrine 32% +/- 8° C
Swift Slough Littoral 42% +/- 12° C
Valley View Riverine 2% +/- 9° C
Tributaries Little Bear River at
Mendon Road Riverine
Spring Creek at Mendon Road
Riverine 0% +/- 3° C
* Complete dataset available in Appendix C.
Water temperatures exceeded the warm water criteria of no greater than 27° C frequently during summer months at Benson Marina station, Clay Slough station, and the Footbridge South of the Marina station (Table 3.20). All of these stations exhibit relatively shallow water levels (average depths are generally less than four feet). The sondes were generally deployed in the lower water column. Given this placement, the relatively shallow water conditions, the dark substrate, and the well-mixed water column, the observed water temperatures likely extend throughout the water column. A summary of mean and maximum temperatures observed during each sampling event is presented in Table 3.21.
Cutler Reservoir was not identified as impaired for temperature on the State of Utah 2006 303(d) list. The assessment of temperature exceedance in this document is specific to the determination of designated use support status for warm water game fish only.
Table 3.20. Temperature Exceedance of the Warm Water Fishery Numeric Criteria (<27° C) during Diurnal Sampling Events (2003–2007) in Cutler Reservoir
Station Limno Class
Sampling Event
8/12/03– 8/28/03
8/1/05–8/7/05
8/22/05–8/26/05
7/13/06–7/20/06
3/8/07–3/9/07
6/26/07– 6/29/07
8/21/07–8/26/07
10/3/07–10/15/07
Bear River Bear River at Utah-Idaho State Line
Riverine
2%
Bear River at Amalga
Riverine 1%
Bear River Above Cutler
Riverine 0% 0% 2%
Bear River Below Cutler
Riverine 0%
Northern Reservoir Cache Junction Lacustrine 0% 0% 1%
Clay Slough Littoral 7% 0% 35% 8%
East of Dam Lacustrine 0%
Southern Reservoir Benson Marina Lacustrine 13% 8% 0% 1%
South of Pelican Island
Lacustrine 32%
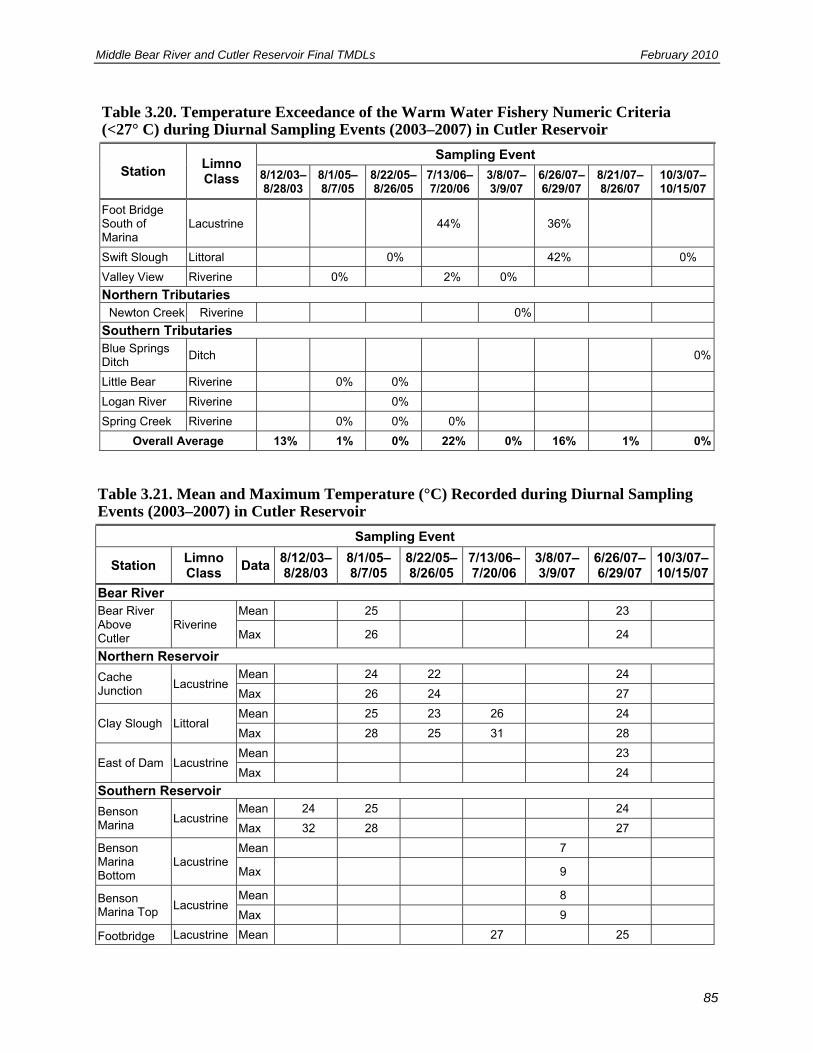
Middle Bear River and Cutler Reservoir Final TMDLs February 2010
85
Table 3.20. Temperature Exceedance of the Warm Water Fishery Numeric Criteria (<27° C) during Diurnal Sampling Events (2003–2007) in Cutler Reservoir
Station Limno Class
Sampling Event
8/12/03– 8/28/03
8/1/05–8/7/05
8/22/05–8/26/05
7/13/06–7/20/06
3/8/07–3/9/07
6/26/07– 6/29/07
8/21/07–8/26/07
10/3/07–10/15/07
Foot Bridge South of Marina
Lacustrine 44% 36%
Swift Slough Littoral 0% 42% 0%
Valley View Riverine 0% 2% 0%
Northern Tributaries Newton Creek Riverine 0%
Southern Tributaries Blue Springs Ditch
Ditch 0%
Little Bear Riverine 0% 0%
Logan River Riverine 0%
Spring Creek Riverine 0% 0% 0%
Overall Average 13% 1% 0% 22% 0% 16% 1% 0%
Table 3.21. Mean and Maximum Temperature (°C) Recorded during Diurnal Sampling Events (2003–2007) in Cutler Reservoir
Sampling Event
Station Limno Class
Data 8/12/03–8/28/03
8/1/05–8/7/05
8/22/05–8/26/05
7/13/06–7/20/06
3/8/07– 3/9/07
6/26/07– 6/29/07
10/3/07–10/15/07
Bear River Bear River Above Cutler
Riverine Mean 25 23
Max 26 24
Northern Reservoir
Cache Junction
Lacustrine Mean 24 22 24
Max 26 24 27
Clay Slough Littoral Mean 25 23 26 24
Max 28 25 31 28
East of Dam Lacustrine Mean 23
Max 24
Southern Reservoir
Benson Marina
Lacustrine Mean 24 25 24
Max 32 28 27
Benson Marina Bottom
Lacustrine Mean 7
Max 9
Benson Marina Top
Lacustrine Mean 8
Max 9
Footbridge Lacustrine Mean 27 25
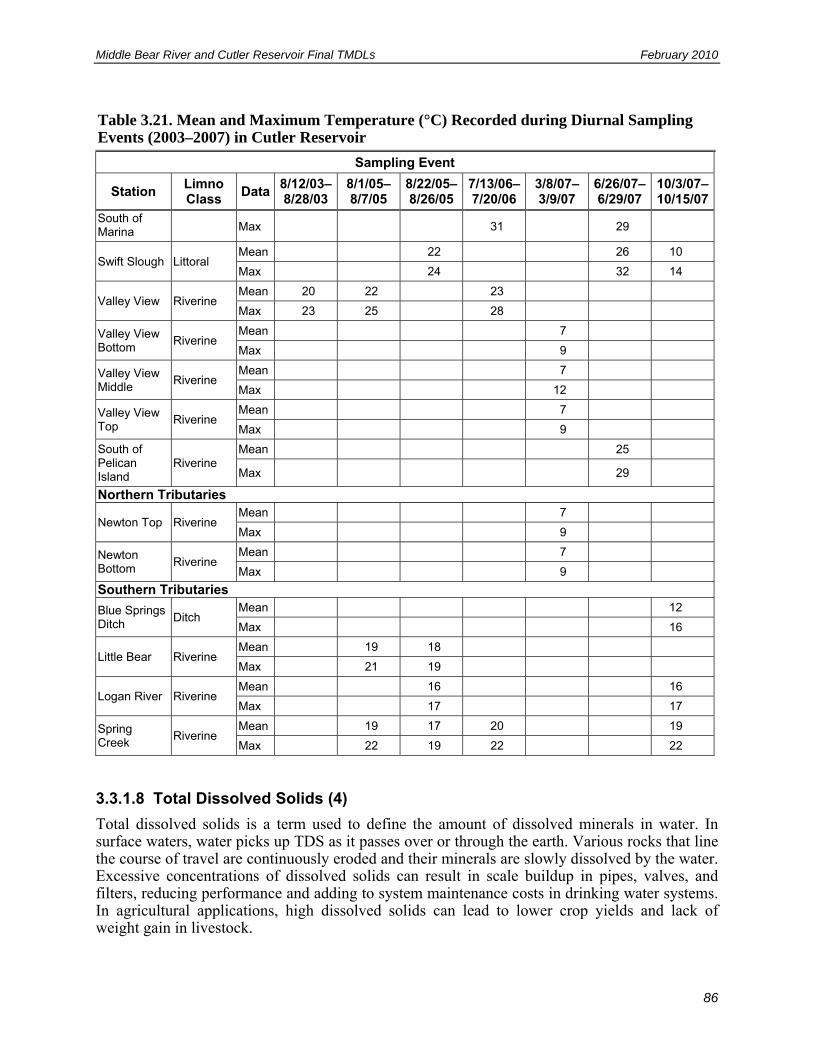
Middle Bear River and Cutler Reservoir Final TMDLs February 2010
86
Table 3.21. Mean and Maximum Temperature (°C) Recorded during Diurnal Sampling Events (2003–2007) in Cutler Reservoir
Sampling Event
Station Limno Class
Data 8/12/03–8/28/03
8/1/05–8/7/05
8/22/05–8/26/05
7/13/06–7/20/06
3/8/07– 3/9/07
6/26/07– 6/29/07
10/3/07–10/15/07
South of Marina Max 31 29
Swift Slough Littoral Mean 22 26 10
Max 24 32 14
Valley View Riverine Mean 20 22 23
Max 23 25 28
Valley View Bottom
Riverine Mean 7
Max 9
Valley View Middle
Riverine Mean 7
Max 12
Valley View Top
Riverine Mean 7
Max 9
South of Pelican Island
Riverine Mean 25
Max 29
Northern Tributaries
Newton Top Riverine Mean 7
Max 9
Newton Bottom
Riverine Mean 7
Max 9
Southern Tributaries
Blue Springs Ditch
Ditch Mean 12
Max 16
Little Bear Riverine Mean 19 18
Max 21 19
Logan River Riverine Mean 16 16
Max 17 17
Spring Creek
Riverine Mean 19 17 20 19
Max 22 19 22 22
3.3.1.8 Total Dissolved Solids (4)
Total dissolved solids is a term used to define the amount of dissolved minerals in water. In surface waters, water picks up TDS as it passes over or through the earth. Various rocks that line the course of travel are continuously eroded and their minerals are slowly dissolved by the water. Excessive concentrations of dissolved solids can result in scale buildup in pipes, valves, and filters, reducing performance and adding to system maintenance costs in drinking water systems. In agricultural applications, high dissolved solids can lead to lower crop yields and lack of weight gain in livestock.
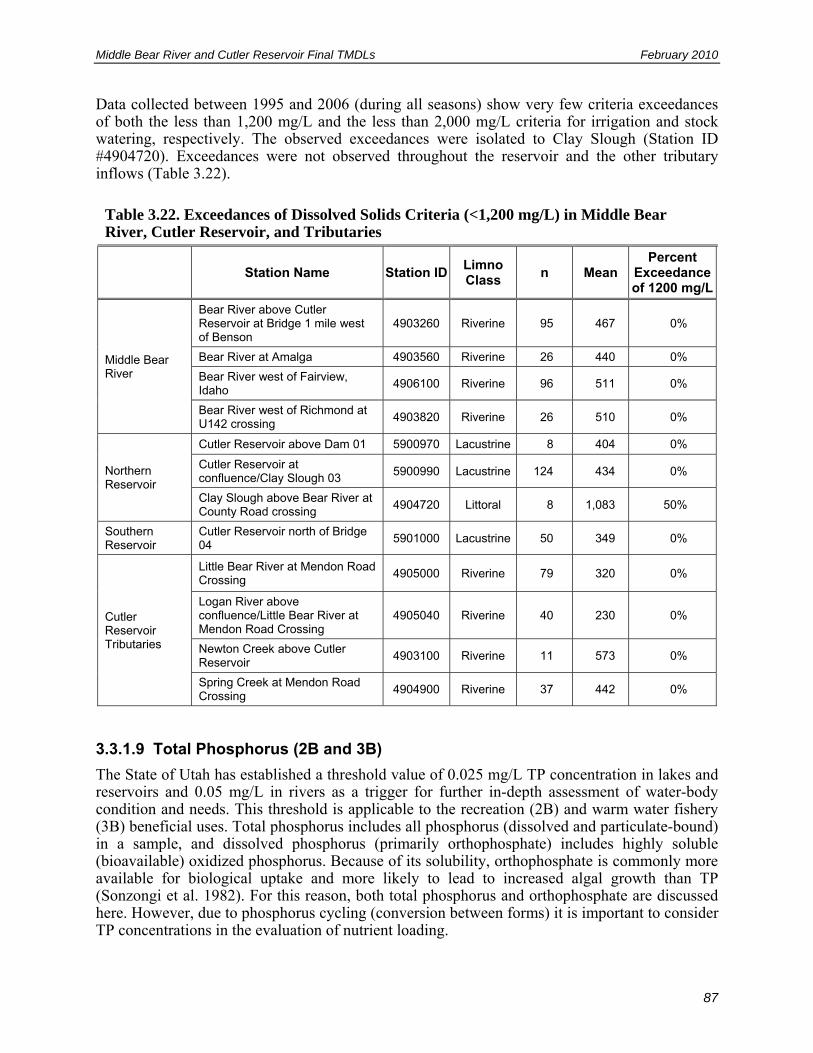
Middle Bear River and Cutler Reservoir Final TMDLs February 2010
87
Data collected between 1995 and 2006 (during all seasons) show very few criteria exceedances of both the less than 1,200 mg/L and the less than 2,000 mg/L criteria for irrigation and stock watering, respectively. The observed exceedances were isolated to Clay Slough (Station ID #4904720). Exceedances were not observed throughout the reservoir and the other tributary inflows (Table 3.22).
Table 3.22. Exceedances of Dissolved Solids Criteria (<1,200 mg/L) in Middle Bear River, Cutler Reservoir, and Tributaries
Station Name Station IDLimno Class
n Mean Percent
Exceedance of 1200 mg/L
Middle Bear River
Bear River above Cutler Reservoir at Bridge 1 mile west of Benson
4903260 Riverine 95 467 0%
Bear River at Amalga 4903560 Riverine 26 440 0%
Bear River west of Fairview, Idaho
4906100 Riverine 96 511 0%
Bear River west of Richmond at U142 crossing
4903820 Riverine 26 510 0%
Northern Reservoir
Cutler Reservoir above Dam 01 5900970 Lacustrine 8 404 0%
Cutler Reservoir at confluence/Clay Slough 03
5900990 Lacustrine 124 434 0%
Clay Slough above Bear River at County Road crossing
4904720 Littoral 8 1,083 50%
Southern Reservoir
Cutler Reservoir north of Bridge 04
5901000 Lacustrine 50 349 0%
Cutler Reservoir Tributaries
Little Bear River at Mendon Road Crossing
4905000 Riverine 79 320 0%
Logan River above confluence/Little Bear River at Mendon Road Crossing
4905040 Riverine 40 230 0%
Newton Creek above Cutler Reservoir
4903100 Riverine 11 573 0%
Spring Creek at Mendon Road Crossing
4904900 Riverine 37 442 0%
3.3.1.9 Total Phosphorus (2B and 3B)
The State of Utah has established a threshold value of 0.025 mg/L TP concentration in lakes and reservoirs and 0.05 mg/L in rivers as a trigger for further in-depth assessment of water-body condition and needs. This threshold is applicable to the recreation (2B) and warm water fishery (3B) beneficial uses. Total phosphorus includes all phosphorus (dissolved and particulate-bound) in a sample, and dissolved phosphorus (primarily orthophosphate) includes highly soluble (bioavailable) oxidized phosphorus. Because of its solubility, orthophosphate is commonly more available for biological uptake and more likely to lead to increased algal growth than TP (Sonzongi et al. 1982). For this reason, both total phosphorus and orthophosphate are discussed here. However, due to phosphorus cycling (conversion between forms) it is important to consider TP concentrations in the evaluation of nutrient loading.

Middle Bear River and Cutler Reservoir Final TMDLs February 2010
88
Concentrations of TP observed throughout the reservoir and tributaries are in excess of threshold values. All current data available for Cutler Reservoir (North and South) demonstrate greater than the 0.025 mg/L threshold value, with maximum values greater than 1.0 mg/L observed in-reservoir (Table 3.23 and Table 3.24). More than half the data available for the Middle Bear River exceed the 0.05 mg/L threshold value, and most of the data available for other Cutler Reservoir tributaries exceed the threshold, with maximum values greater than 1.5 mg/L in the Little Bear River and Spring Creek (Table 3.24). In the Northern Reservoir, the highest concentrations of total phosphorus are found in Clay Slough with concentrations averaging 0.66 mg/L in the summer. Concentrations in the open water site in the Southern Reservoir are almost twice the concentration of open water areas in the Northern Reservoir (Table 3.24). This is explained in part by the constriction of flow at Benson Marina.
Table 3.23. Exceedance of TP Threshold Concentration in Cutler Reservoir (<0.025 mg/L), Tributaries to Cutler Reservoir (<0.05 mg/L), and Middle Bear River (<0.05 mg/L) during the Current Period of Record (1995–2006)
Hydrologic Category
Station Name Limno Class
Station ID
Phosphorus as P, Total
Middle Bear River
Bear River above Cutler Reservoir at Bridge 1 mile west of Benson
Riverine 4903260 71%
Bear River at Amalga Riverine 4903560 73%
Bear River west of Fairview, Idaho Riverine 4906100 39%
Bear River west of Richmond at U142 crossing Riverine 4903820 52%
Northern Reservoir
Cutler Reservoir north of Bridge 04 Lacustrine 5901000 100%
Clay Slough above Bear River at County Road crossing
Littoral 4904720 100%
Southern Reservoir
Cutler Reservoir above Dam 01 Lacustrine 5900970 100%
Cutler Reservoir at confluence with Clay Slough 03 Littoral 5900990 100%
Cutler Reservoir east of Highway Bridge 02 Lacustrine 5900980 100%
Northern Tributaries
Newton Creek above Cutler Reservoir Riverine 4903100 86%
Newton Creek 1 mile above Cutler Res Riverine 4903070 100%
Southern Tributaries
Little Bear River at Mendon Road Crossing Riverine 4905000 43%
Logan River above confluence with the Little Bear River at Mendon Road Crossing
Riverine 4905040 7%
Spring Creek at Mendon Road Crossing Riverine 4904900 100%
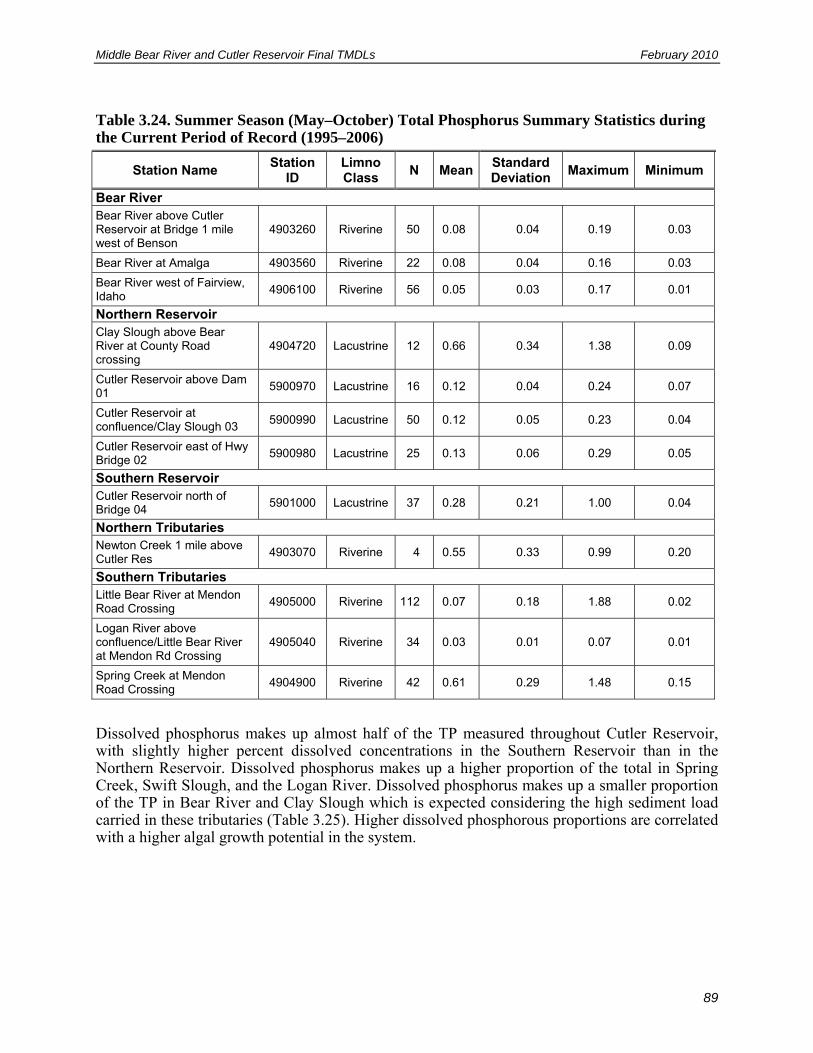
Middle Bear River and Cutler Reservoir Final TMDLs February 2010
89
Table 3.24. Summer Season (May–October) Total Phosphorus Summary Statistics during the Current Period of Record (1995–2006)
Station Name Station
ID Limno Class
N MeanStandard Deviation
Maximum Minimum
Bear River Bear River above Cutler Reservoir at Bridge 1 mile west of Benson
4903260 Riverine 50 0.08 0.04 0.19 0.03
Bear River at Amalga 4903560 Riverine 22 0.08 0.04 0.16 0.03
Bear River west of Fairview, Idaho
4906100 Riverine 56 0.05 0.03 0.17 0.01
Northern Reservoir Clay Slough above Bear River at County Road crossing
4904720 Lacustrine 12 0.66 0.34 1.38 0.09
Cutler Reservoir above Dam 01
5900970 Lacustrine 16 0.12 0.04 0.24 0.07
Cutler Reservoir at confluence/Clay Slough 03
5900990 Lacustrine 50 0.12 0.05 0.23 0.04
Cutler Reservoir east of Hwy Bridge 02
5900980 Lacustrine 25 0.13 0.06 0.29 0.05
Southern Reservoir Cutler Reservoir north of Bridge 04
5901000 Lacustrine 37 0.28 0.21 1.00 0.04
Northern Tributaries Newton Creek 1 mile above Cutler Res
4903070 Riverine 4 0.55 0.33 0.99 0.20
Southern Tributaries Little Bear River at Mendon Road Crossing
4905000 Riverine 112 0.07 0.18 1.88 0.02
Logan River above confluence/Little Bear River at Mendon Rd Crossing
4905040 Riverine 34 0.03 0.01 0.07 0.01
Spring Creek at Mendon Road Crossing
4904900 Riverine 42 0.61 0.29 1.48 0.15
Dissolved phosphorus makes up almost half of the TP measured throughout Cutler Reservoir, with slightly higher percent dissolved concentrations in the Southern Reservoir than in the Northern Reservoir. Dissolved phosphorus makes up a higher proportion of the total in Spring Creek, Swift Slough, and the Logan River. Dissolved phosphorus makes up a smaller proportion of the TP in Bear River and Clay Slough which is expected considering the high sediment load carried in these tributaries (Table 3.25). Higher dissolved phosphorous proportions are correlated with a higher algal growth potential in the system.
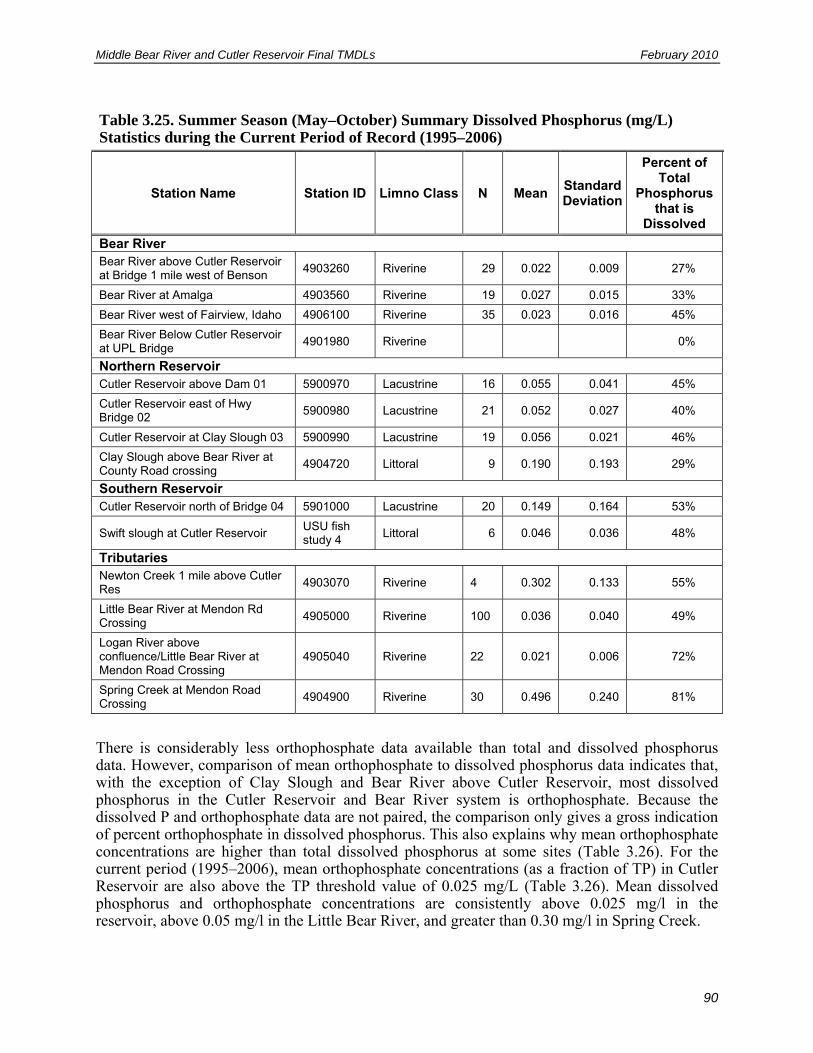
Middle Bear River and Cutler Reservoir Final TMDLs February 2010
90
Table 3.25. Summer Season (May–October) Summary Dissolved Phosphorus (mg/L) Statistics during the Current Period of Record (1995–2006)
Station Name Station ID Limno Class N Mean Standard Deviation
Percent of Total
Phosphorus that is
Dissolved
Bear River Bear River above Cutler Reservoir at Bridge 1 mile west of Benson
4903260 Riverine 29 0.022 0.009 27%
Bear River at Amalga 4903560 Riverine 19 0.027 0.015 33%
Bear River west of Fairview, Idaho 4906100 Riverine 35 0.023 0.016 45%
Bear River Below Cutler Reservoir at UPL Bridge
4901980 Riverine 0%
Northern Reservoir Cutler Reservoir above Dam 01 5900970 Lacustrine 16 0.055 0.041 45%
Cutler Reservoir east of Hwy Bridge 02
5900980 Lacustrine 21 0.052 0.027 40%
Cutler Reservoir at Clay Slough 03 5900990 Lacustrine 19 0.056 0.021 46%
Clay Slough above Bear River at County Road crossing
4904720 Littoral 9 0.190 0.193 29%
Southern Reservoir Cutler Reservoir north of Bridge 04 5901000 Lacustrine 20 0.149 0.164 53%
Swift slough at Cutler Reservoir USU fish study 4
Littoral 6 0.046 0.036 48%
Tributaries Newton Creek 1 mile above Cutler Res
4903070 Riverine 4 0.302 0.133 55%
Little Bear River at Mendon Rd Crossing
4905000 Riverine 100 0.036 0.040 49%
Logan River above confluence/Little Bear River at Mendon Road Crossing
4905040 Riverine 22 0.021 0.006 72%
Spring Creek at Mendon Road Crossing
4904900 Riverine 30 0.496 0.240 81%
There is considerably less orthophosphate data available than total and dissolved phosphorus data. However, comparison of mean orthophosphate to dissolved phosphorus data indicates that, with the exception of Clay Slough and Bear River above Cutler Reservoir, most dissolved phosphorus in the Cutler Reservoir and Bear River system is orthophosphate. Because the dissolved P and orthophosphate data are not paired, the comparison only gives a gross indication of percent orthophosphate in dissolved phosphorus. This also explains why mean orthophosphate concentrations are higher than total dissolved phosphorus at some sites (Table 3.26). For the current period (1995–2006), mean orthophosphate concentrations (as a fraction of TP) in Cutler Reservoir are also above the TP threshold value of 0.025 mg/L (Table 3.26). Mean dissolved phosphorus and orthophosphate concentrations are consistently above 0.025 mg/l in the reservoir, above 0.05 mg/l in the Little Bear River, and greater than 0.30 mg/l in Spring Creek.

Middle Bear River and Cutler Reservoir Final TMDLs February 2010
91
Table 3.26. Summer Season (May–October) Dissolved Phosphorus (DP) and Orthophosphate (Ortho-P) in mg/L Summary Statistics during the Current Period of Record (1995–2006)*
Station Name Limno Class Param N Mean Standard Deviation
Maximum Minimum
Bear River Bear River above Cutler Reservoir at Bridge 1 mile west of Benson
Riverine DP 13 0.023 0.008 0.040 0.005
Ortho-P 2 0.005 0.004 0.008 0.003
Bear River at Amalga Riverine DP 10 0.028 0.016 0.068 0.010
Ortho-P 4 0.034 0.023 0.068 0.020
Bear River west of Riverine DP 17 0.028 0.020 0.090 0.005
Ortho-P 6 0.029 0.035 0.090 0.003
Northern Reservoir
Clay Slough above Bear River at County Road crossing
Littoral DP 5 0.229 0.201 0.566 0.065
Ortho-P 2 0.009 0.003 0.011 0.007
Cutler Reservoir at Clay Slough 03
Lacustrine DP 16 0.057 0.022 0.120 0.028
Ortho-P 5 0.051 0.021 0.068 0.021
Cutler Reservoir east of Hwy Bridge 02 Station ID 5900980
Lacustrine DP 17 0.054 0.028 0.121 0.020
Ortho-P 6 0.073 0.032 0.121 0.024
Tributaries
Spring Creek at Mendon Road Crossing
Riverine DP 14 0.413 0.223 0.729 0.106
Ortho-P 3 0.382 0.179 0.586 0.249
Little Bear River at Mendon Rd Crossing
Riverine DP 20 0.080 0.073 0.350 0.010
Ortho-P 4 0.063 0.022 0.094 0.046
Logan River above confluence/Little Bear River at Mendon Rd Crossing
Riverine DP 11 0.020 0.007 0.033 0.010
Ortho-P 4 0.011 0.005 0.018 0.006
Southern Tributaries (USU study)
Riverine DP 4 0.067 0.040 0.103 0.026
Ortho-P 4 0.061 0.039 0.103 0.018
Southern Reservoir
Swift Slough at Cutler Reservoir
Littoral DP 4 0.056 0.043 0.102 0.019
Ortho-P 4 0.050 0.042 0.102 0.012
Cutler Reservoir north of Bridge 04
Lacustrine DP 16 0.158 0.182 0.811 0.038
Ortho-P 8 0.202 0.232 0.603 0.038
* Total phosphorus water quality threshold for lakes and reservoirs = 0.025 mg/l/ rivers and streams = 0.050 mg/l.
3.3.2 ASSESSMENT OF EUTROPHICATION
3.3.2.1 Secchi Depth
Turbidity is a measurement of the visible clarity of water. Turbidity can be caused by both inorganic particles and organic particles, including suspended algae. Turbidity from inorganic particles can limit algal growth due to light limitation, even if there are sufficient nutrients for algal blooms. Turbidity is often reported in nephelometric turbidity units (NTUs), which represent the degree to which light is scattered in the water. Algal densities, measured as chlorophyll a concentration, can provide one measure of turbidity.

Middle Bear River and Cutler Reservoir Final TMDLs February 2010
92
Approximate turbidity is measured by the depth of Secchi disk transparency. Secchi depths (SD) are measured using a disk with alternating black and white sections that is lowered into the water. When the disk is no longer visible, the SD is recorded. For example, a SD of three feet indicates that the disk was last visible at three feet below the surface. High SD readings indicate that the water is relatively clear and will allow sunlight to penetrate to greater depths. Low readings indicate turbid water due to algae growth, suspended sediment, or other causes; turbidity can reduce the depth to which sunlight can penetrate. Limited light at lower depths can result in decreased growth of aquatic plants.
The Secchi Depths recorded for Cutler Reservoir were all collected during the summer growing season of 2004, 2005, and 2006. All data show Secchi Depths of less than 0.5 m, indicating poor water quality and high turbidity (Table 3.27).
Table 3.27. Summer Season (May–October) Summary Statistics for Secchi Depth (meters) during the Current Period of Record (1995–2006)
Station Name Station ID Limno Class n Mean Standard Deviation
Maximum Minimum
Bear River at Amalga
4903560 Riverine 8 0.33 0.04 0.43 0.3
Cutler Reservoir above Dam 01
5900970 Lacustrine 6 0.25 0.04 0.30 0.20
Cutler Reservoir east of Highway Bridge 02
5900980 Lacustrine 18 0.27 0.02 0.30 0.23
Cutler Reservoir at confluence/Clay Slough 03
5900990 Lacustrine 19 0.28 0.04 0.40 0.25
Cutler Reservoir north of Bridge 04
5901000 Lacustrine 14 0.30 0.05 0.40 0.19
3.3.2.2 Trophic State Index
The health and support status of a waterbody can be assessed using a trophic state index (TSI), a measurement of the biological productivity or growth potential of a body of water. The basis for trophic state classification is algal biomass (estimation of how much algae is present in the waterbody). The calculation of a TSI generally includes the relationship between chlorophyll (the green pigment in algae, where chlorophyll a is used as a surrogate measure of algal biomass), transparency using SD measurements, and TP (commonly the nutrient in shortest supply for algal growth) as follows (Carlson 1977):
1. Chlorophyll a: TSI CHL = 9.81 Ln (Chl a) + 30.6 2. Secchi depth: TSI SD = 60– 14.41 Ln (SD) 3. Total Phosphorus: TSI TP = 14.42 Ln (TP) + 4.15
Table 3.28 identifies generally accepted TSI values derived from this relationship. Waterbodies with very low TSI values (less than 30) are generally transparent, have low algal population densities, and have adequate DO throughout the water column. Waterbodies with these characteristics are generally supportive of cold water fisheries and are identified as oligotrophic. Waterbodies with low to midrange TSI values (40–50) are moderately clear, and have an
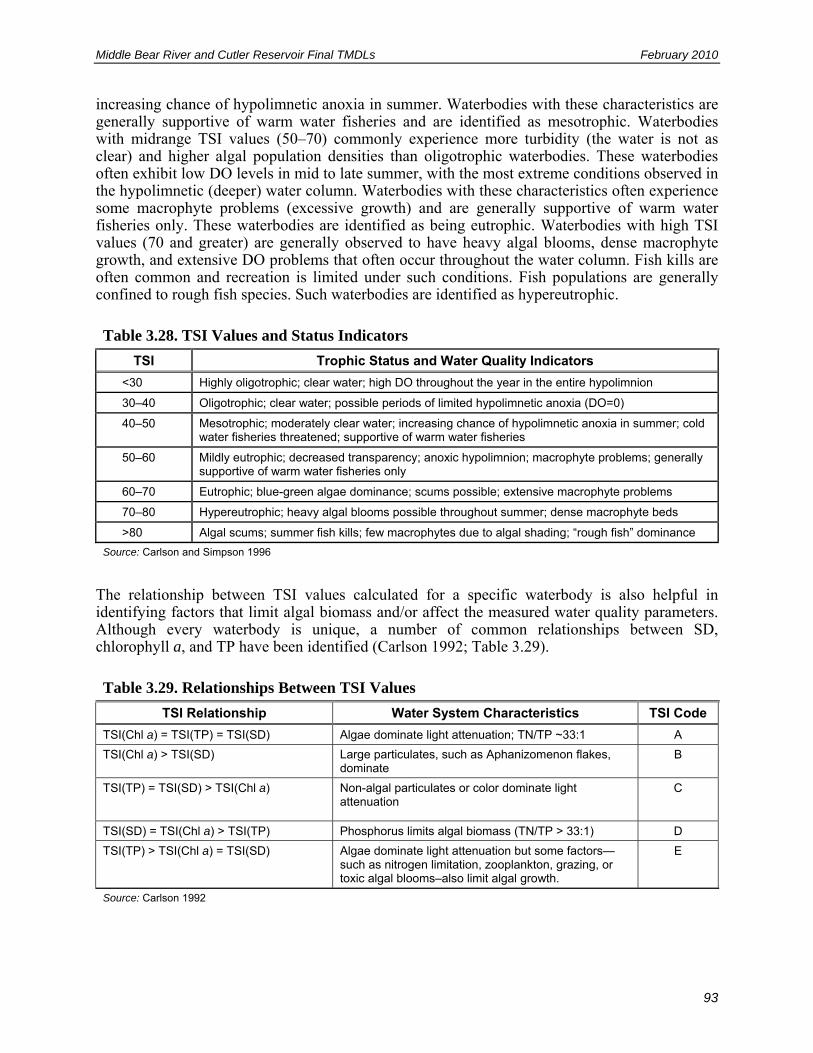
Middle Bear River and Cutler Reservoir Final TMDLs February 2010
93
increasing chance of hypolimnetic anoxia in summer. Waterbodies with these characteristics are generally supportive of warm water fisheries and are identified as mesotrophic. Waterbodies with midrange TSI values (50–70) commonly experience more turbidity (the water is not as clear) and higher algal population densities than oligotrophic waterbodies. These waterbodies often exhibit low DO levels in mid to late summer, with the most extreme conditions observed in the hypolimnetic (deeper) water column. Waterbodies with these characteristics often experience some macrophyte problems (excessive growth) and are generally supportive of warm water fisheries only. These waterbodies are identified as being eutrophic. Waterbodies with high TSI values (70 and greater) are generally observed to have heavy algal blooms, dense macrophyte growth, and extensive DO problems that often occur throughout the water column. Fish kills are often common and recreation is limited under such conditions. Fish populations are generally confined to rough fish species. Such waterbodies are identified as hypereutrophic.
Table 3.28. TSI Values and Status Indicators
TSI Trophic Status and Water Quality Indicators
<30 Highly oligotrophic; clear water; high DO throughout the year in the entire hypolimnion
30–40 Oligotrophic; clear water; possible periods of limited hypolimnetic anoxia (DO=0)
40–50 Mesotrophic; moderately clear water; increasing chance of hypolimnetic anoxia in summer; cold water fisheries threatened; supportive of warm water fisheries
50–60 Mildly eutrophic; decreased transparency; anoxic hypolimnion; macrophyte problems; generally supportive of warm water fisheries only
60–70 Eutrophic; blue-green algae dominance; scums possible; extensive macrophyte problems
70–80 Hypereutrophic; heavy algal blooms possible throughout summer; dense macrophyte beds
>80 Algal scums; summer fish kills; few macrophytes due to algal shading; “rough fish” dominance
Source: Carlson and Simpson 1996
The relationship between TSI values calculated for a specific waterbody is also helpful in identifying factors that limit algal biomass and/or affect the measured water quality parameters. Although every waterbody is unique, a number of common relationships between SD, chlorophyll a, and TP have been identified (Carlson 1992; Table 3.29).
Table 3.29. Relationships Between TSI Values
TSI Relationship Water System Characteristics TSI Code
TSI(Chl a) = TSI(TP) = TSI(SD) Algae dominate light attenuation; TN/TP ~33:1 A
TSI(Chl a) > TSI(SD) Large particulates, such as Aphanizomenon flakes, dominate
B
TSI(TP) = TSI(SD) > TSI(Chl a) Non-algal particulates or color dominate light attenuation
C
TSI(SD) = TSI(Chl a) > TSI(TP) Phosphorus limits algal biomass (TN/TP > 33:1) D
TSI(TP) > TSI(Chl a) = TSI(SD) Algae dominate light attenuation but some factors—such as nitrogen limitation, zooplankton, grazing, or toxic algal blooms–also limit algal growth.
E
Source: Carlson 1992

Middle Bear River and Cutler Reservoir Final TMDLs February 2010
94
Summer season TSI values for Cutler Reservoir (Table 3.30) were calculated using averaged data available for Secchi Depth, chlorophyll a concentrations, and TP concentrations. TSI values were calculated from all available current data (1995–2006) collected during the algal growth season of May–October. The majority of the chlorophyll a data were collected after 2001 and all of the SD data were collected between 2004 and 2006. Total phosphorus data are available at all stations for all years.
The TSI values calculated indicate that Cutler Reservoir routinely experiences eutrophic to hyper-eutrophic conditions over the summer season. Nowhere in the reservoir or its inflowing tributaries were TSI values indicative of non-eutrophic conditions.
Hyper-eutrophic conditions are more pronounced in the southern section of the reservoir. This is most likely due in part to the shallow nature of the reservoir and the limited flow-through that occurs. The limited flow-through is caused by the numerous constriction points and prevalent stands of emergent vegetation that occur throughout the southern section of the reservoir.
The calculated chlorophyll a TSIs are generally lower than the TSI values for TP and SD. Shallow depths, wind mixing, and large populations of carp result in increased sediment suspension, reducing the depth that light can penetrate the water column. Turbidity thus reduces the potential for algal growth in the reservoir. Within Cutler Reservoir, especially in the southern section, this condition may exert a somewhat protective effect on water quality. Turbidity related to fishery management or natural conditions (wind mixing) lies outside of the control of the TMDL process. A summary of the interactions between management entities and decisions on the Cutler Reservoir hydrologic and ecological system is summarized in Appendix F: Figure F-16.
Table 3.30. Average (mean) TSI Values Calculated for Cutler Reservoir and Middle Bear River
Monitoring Station Station
ID Limno Class
TSI Parameter
Chl a Secchi Depth
TP Trophic Status
TSI Code
Bear River Bear River above Cutler Reservoir at Bridge 1 mile west of Benson
4903260 Riverine 57 No data 66 Eutrophic A
Bear River at Amalga 4903560 Riverine 56 76 65 Eutrophic C
Bear River Below Cutler Reservoir at UPL Bridge
4901980 Riverine 61 No data 73 Eutrophic E
Bear River west of Fairview, Idaho 4906100 Riverine 43 64 58 Mildly eutrophic C
Northern Reservoir Clay Slough above Bear River at County Road crossing
4904720 Littoral 67 No data 95 Hypereutrophic E
Cutler Reservoir above Dam 01 5900970 Lacustrine 59 80 73 Hypereutrophic C
Cutler Reservoir at confluence/Clay Slough 03
5900990 Lacustrine 59 78 72 Hypereutrophic C
Cutler Reservoir north of Bridge 04
5901000 Lacustrine 60 78 82 Hypereutrophic C
Southern Reservoir Cutler Reservoir east of Highway Bridge 02
5900980 Lacustrine 60 79 73 Hypereutrophic C
Tributaries Little Bear River at Mendon Road Crossing
4905000 Riverine 49 No data 59 Mildly eutrophic E

Middle Bear River and Cutler Reservoir Final TMDLs February 2010
95
3.3.2.3 Nitrogen-to-Phosphorus Ratio
Freshwater systems are usually phosphorus limited, however there is a large body of literature concerning the impact of the N:P ratio in freshwater systems. Typically N:P ratios less than 10 suggest a nitrogen limited system, whereas higher ratios suggest that nitrogen and phosphorus are either co-limiting or that the system is phosphorus limited. However, the cut off for an N:P ratio below which nitrogen is likely the limiting agent ranges from 7 to 15 (EPA 2000a). Above a 10:1 to 16:1 N:P ratio, surface water systems will likely experience an algal bloom, the severity of which is most commonly in direct relation to the excess phosphorus available (Schindler 1977).
The dissolved N:P ratio in Cutler Reservoir (for current data) averages 2.06 in the Southern Reservoir and 3.25 in the Northern Reservoir. The ratios range from a low of 0.01 to a high of 14.30 (Table 3.31). The N:P data show a high degree of spatial and temporal variability, and suggest that Cutler Reservoir is generally co-limited by nitrogen and phosphorus, with a tendency toward nitrogen limitation. This is especially true during the summer months when N:P ratios are the lowest (Table 3.31). Because the N:P ratio required by algae varies greatly by species, strategies aimed to improve water quality by reducing chlorophyll a and improving DO levels should target both nutrients. Most management practices for agriculture and forestry reduce phosphorus and nitrogen simultaneously. The presence of nitrogen fixing blue-green algae in the system; however, indicates a need for phosphorus reductions to avoid cyanobacterial blooms in the future. A nutrient addition bioassay of water samples from Cutler Reservoir in September 2007 demonstrated that the addition of nitrogen and/or phosphorus resulted in algal overgrowth in this system (personal communication between Erica Gaddis, SWCA, and Wayne Wurtsbaugh, USU, October 9, 2007).
Table 3.31. Mean Monthly Dissolved Nitrogen-to-Phosphorus Ratios in Cutler Reservoir
Month N:P Northern
Reservoir N:P Southern
Reservoir
February 3.16
March 6.60
April 2.06
May 2.37
June 5.28 1.39
July 1.45 0.54
August 2.09 0.35
September 4.53 1.49
October 6.26 3.44
November 6.65
December 4.03
Average N:P 3.25 2.06
Logan River above confluence/Little Bear River at Mendon Road Crossing
4905040 Riverine 35 No data 51 Mesotrophic E
Spring Creek at Mendon Road Crossing
4904900 Riverine 45 No data 95 Eutrophic E
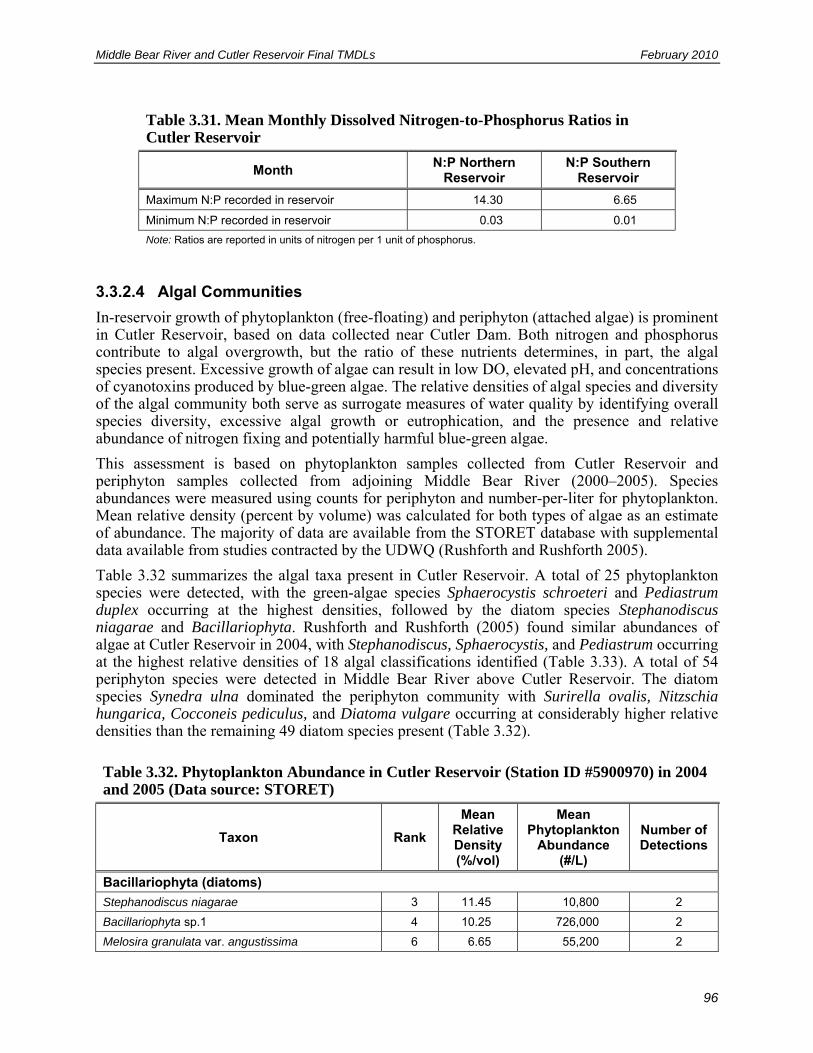
Middle Bear River and Cutler Reservoir Final TMDLs February 2010
96
Table 3.31. Mean Monthly Dissolved Nitrogen-to-Phosphorus Ratios in Cutler Reservoir
Month N:P Northern
Reservoir N:P Southern
Reservoir
Maximum N:P recorded in reservoir 14.30 6.65
Minimum N:P recorded in reservoir 0.03 0.01
Note: Ratios are reported in units of nitrogen per 1 unit of phosphorus.
3.3.2.4 Algal Communities
In-reservoir growth of phytoplankton (free-floating) and periphyton (attached algae) is prominent in Cutler Reservoir, based on data collected near Cutler Dam. Both nitrogen and phosphorus contribute to algal overgrowth, but the ratio of these nutrients determines, in part, the algal species present. Excessive growth of algae can result in low DO, elevated pH, and concentrations of cyanotoxins produced by blue-green algae. The relative densities of algal species and diversity of the algal community both serve as surrogate measures of water quality by identifying overall species diversity, excessive algal growth or eutrophication, and the presence and relative abundance of nitrogen fixing and potentially harmful blue-green algae.
This assessment is based on phytoplankton samples collected from Cutler Reservoir and periphyton samples collected from adjoining Middle Bear River (2000–2005). Species abundances were measured using counts for periphyton and number-per-liter for phytoplankton. Mean relative density (percent by volume) was calculated for both types of algae as an estimate of abundance. The majority of data are available from the STORET database with supplemental data available from studies contracted by the UDWQ (Rushforth and Rushforth 2005).
Table 3.32 summarizes the algal taxa present in Cutler Reservoir. A total of 25 phytoplankton species were detected, with the green-algae species Sphaerocystis schroeteri and Pediastrum duplex occurring at the highest densities, followed by the diatom species Stephanodiscus niagarae and Bacillariophyta. Rushforth and Rushforth (2005) found similar abundances of algae at Cutler Reservoir in 2004, with Stephanodiscus, Sphaerocystis, and Pediastrum occurring at the highest relative densities of 18 algal classifications identified (Table 3.33). A total of 54 periphyton species were detected in Middle Bear River above Cutler Reservoir. The diatom species Synedra ulna dominated the periphyton community with Surirella ovalis, Nitzschia hungarica, Cocconeis pediculus, and Diatoma vulgare occurring at considerably higher relative densities than the remaining 49 diatom species present (Table 3.32).
Table 3.32. Phytoplankton Abundance in Cutler Reservoir (Station ID #5900970) in 2004 and 2005 (Data source: STORET)
Taxon Rank
Mean Relative Density (%/vol)
Mean Phytoplankton
Abundance (#/L)
Number of Detections
Bacillariophyta (diatoms)
Stephanodiscus niagarae 3 11.45 10,800 2
Bacillariophyta sp.1 4 10.25 726,000 2
Melosira granulata var. angustissima 6 6.65 55,200 2

Middle Bear River and Cutler Reservoir Final TMDLs February 2010
97
Table 3.32. Phytoplankton Abundance in Cutler Reservoir (Station ID #5900970) in 2004 and 2005 (Data source: STORET)
Taxon Rank
Mean Relative Density (%/vol)
Mean Phytoplankton
Abundance (#/L)
Number of Detections
Bacillariophyta sp.2 8 5.25 284,400 2
Fragilaria crotonensis 10 4.35 3,600 2
Fragilaria virescens 20 0.2 2,400 1
Chlorophyta (green algae)
Sphaerocystis schroeteri 1 22.9 24,000 2
Pediastrum duplex 2 16.2 12,000 2
Pediastrum sp. 1 5 7.8 7,200 1
Oocystis sp.1 7 6.2 117,600 1
Scenedesmus sp.1 9 4.5 128,400 2
Oocystis borgei 11 3.3 45,600 1
Pteromonas 14 1.85 192,000 2
Schroederia setigera 15 1.3 7,200 1
Chlamydomonas sp. 1 16 0.95 73,200 2
Cosmarium 17 0.9 2,400 2
Chlorophyta sp. 1 18 0.35 15,600 2
Ankistrodesmus falcatus 19 0.3 16,800 2
Closteriopsis longissima tropica 20 0.2 4,800 1
Tetraedron 21 0.1 4,800 1
Crucigenia 22 0 2,400 1
Cyanobacteria (blue-green algae)
Merismopedia 20 0.2 2,400 1
Chroococcus 22 0 2,400 1
Euglenophyta (euglenoids)
Phacus 12 2.85 19,200 2
Myzozoa (dinoflagellates)
Peridinium 13 2.8 2,400 1
Table 3.33. Algal Taxa Present in a Total Plankton Sample from Cutler Reservoir collected on 8/25/2004 (Rushforth and Rushforth 2005)
Taxon Rank Relative Density
Number per Milliliter
Cell Volume (μ3/ml)
Bacillariophyta
Centric diatoms 9 4.5 184.8 129360.0
Fragilaria crotonensis 5 6.9 4.8 197760.0
Melosira granulate var. angustissima 4 8.5 52.8 242880.0
Pennate diatoms 7 4.8 172.8 138240.0
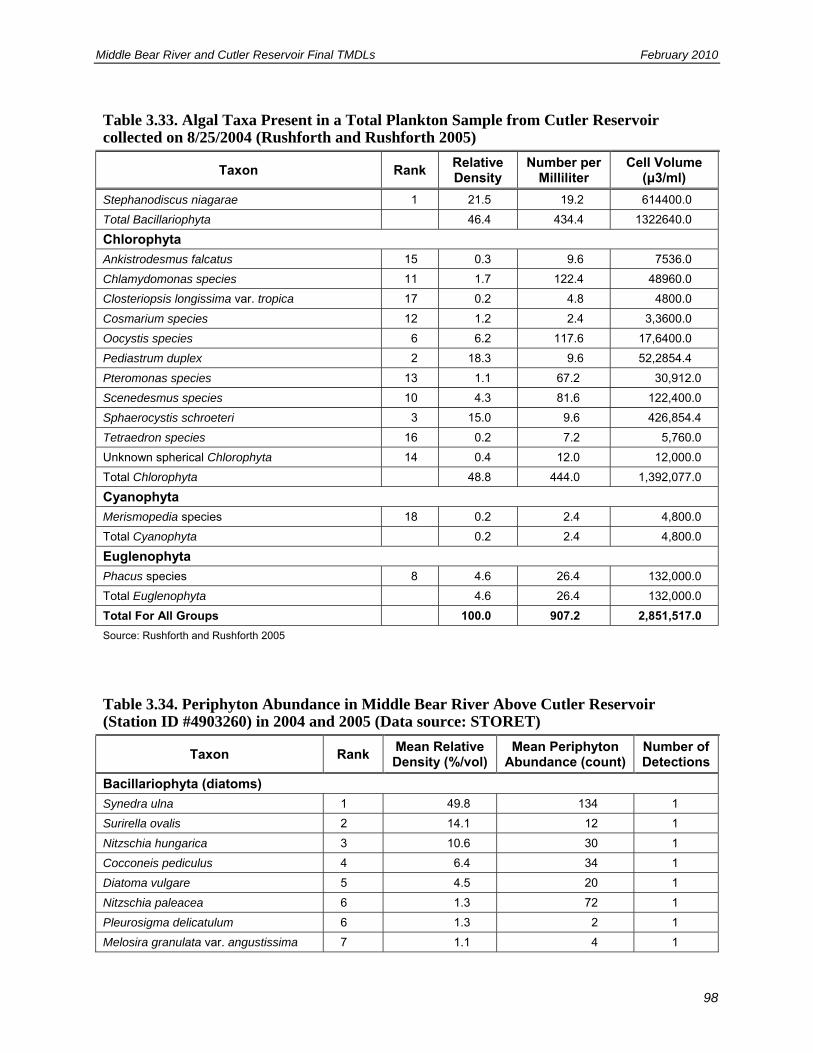
Middle Bear River and Cutler Reservoir Final TMDLs February 2010
98
Table 3.33. Algal Taxa Present in a Total Plankton Sample from Cutler Reservoir collected on 8/25/2004 (Rushforth and Rushforth 2005)
Taxon Rank Relative Density
Number per Milliliter
Cell Volume (μ3/ml)
Stephanodiscus niagarae 1 21.5 19.2 614400.0
Total Bacillariophyta 46.4 434.4 1322640.0
Chlorophyta
Ankistrodesmus falcatus 15 0.3 9.6 7536.0
Chlamydomonas species 11 1.7 122.4 48960.0
Closteriopsis longissima var. tropica 17 0.2 4.8 4800.0
Cosmarium species 12 1.2 2.4 3,3600.0
Oocystis species 6 6.2 117.6 17,6400.0
Pediastrum duplex 2 18.3 9.6 52,2854.4
Pteromonas species 13 1.1 67.2 30,912.0
Scenedesmus species 10 4.3 81.6 122,400.0
Sphaerocystis schroeteri 3 15.0 9.6 426,854.4
Tetraedron species 16 0.2 7.2 5,760.0
Unknown spherical Chlorophyta 14 0.4 12.0 12,000.0
Total Chlorophyta 48.8 444.0 1,392,077.0
Cyanophyta
Merismopedia species 18 0.2 2.4 4,800.0
Total Cyanophyta 0.2 2.4 4,800.0
Euglenophyta
Phacus species 8 4.6 26.4 132,000.0
Total Euglenophyta 4.6 26.4 132,000.0
Total For All Groups 100.0 907.2 2,851,517.0
Source: Rushforth and Rushforth 2005
Table 3.34. Periphyton Abundance in Middle Bear River Above Cutler Reservoir (Station ID #4903260) in 2004 and 2005 (Data source: STORET)
Taxon Rank Mean Relative Density (%/vol)
Mean Periphyton Abundance (count)
Number of Detections
Bacillariophyta (diatoms)
Synedra ulna 1 49.8 134 1
Surirella ovalis 2 14.1 12 1
Nitzschia hungarica 3 10.6 30 1
Cocconeis pediculus 4 6.4 34 1
Diatoma vulgare 5 4.5 20 1
Nitzschia paleacea 6 1.3 72 1
Pleurosigma delicatulum 6 1.3 2 1
Melosira granulata var. angustissima 7 1.1 4 1
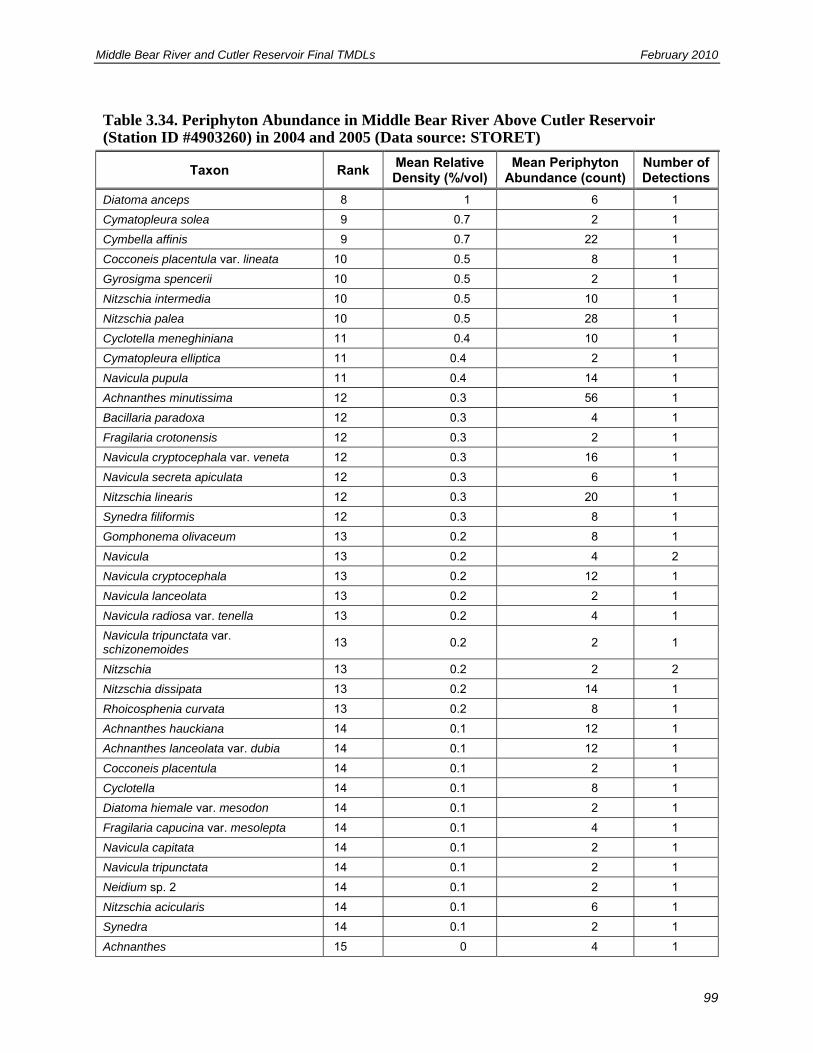
Middle Bear River and Cutler Reservoir Final TMDLs February 2010
99
Table 3.34. Periphyton Abundance in Middle Bear River Above Cutler Reservoir (Station ID #4903260) in 2004 and 2005 (Data source: STORET)
Taxon Rank Mean Relative Density (%/vol)
Mean Periphyton Abundance (count)
Number of Detections
Diatoma anceps 8 1 6 1
Cymatopleura solea 9 0.7 2 1
Cymbella affinis 9 0.7 22 1
Cocconeis placentula var. lineata 10 0.5 8 1
Gyrosigma spencerii 10 0.5 2 1
Nitzschia intermedia 10 0.5 10 1
Nitzschia palea 10 0.5 28 1
Cyclotella meneghiniana 11 0.4 10 1
Cymatopleura elliptica 11 0.4 2 1
Navicula pupula 11 0.4 14 1
Achnanthes minutissima 12 0.3 56 1
Bacillaria paradoxa 12 0.3 4 1
Fragilaria crotonensis 12 0.3 2 1
Navicula cryptocephala var. veneta 12 0.3 16 1
Navicula secreta apiculata 12 0.3 6 1
Nitzschia linearis 12 0.3 20 1
Synedra filiformis 12 0.3 8 1
Gomphonema olivaceum 13 0.2 8 1
Navicula 13 0.2 4 2
Navicula cryptocephala 13 0.2 12 1
Navicula lanceolata 13 0.2 2 1
Navicula radiosa var. tenella 13 0.2 4 1
Navicula tripunctata var. schizonemoides
13 0.2 2 1
Nitzschia 13 0.2 2 2
Nitzschia dissipata 13 0.2 14 1
Rhoicosphenia curvata 13 0.2 8 1
Achnanthes hauckiana 14 0.1 12 1
Achnanthes lanceolata var. dubia 14 0.1 12 1
Cocconeis placentula 14 0.1 2 1
Cyclotella 14 0.1 8 1
Diatoma hiemale var. mesodon 14 0.1 2 1
Fragilaria capucina var. mesolepta 14 0.1 4 1
Navicula capitata 14 0.1 2 1
Navicula tripunctata 14 0.1 2 1
Neidium sp. 2 14 0.1 2 1
Nitzschia acicularis 14 0.1 6 1
Synedra 14 0.1 2 1
Achnanthes 15 0 4 1

Middle Bear River and Cutler Reservoir Final TMDLs February 2010
100
Table 3.34. Periphyton Abundance in Middle Bear River Above Cutler Reservoir (Station ID #4903260) in 2004 and 2005 (Data source: STORET)
Taxon Rank Mean Relative Density (%/vol)
Mean Periphyton Abundance (count)
Number of Detections
Amphora coffeaeformis 15 0 2 1
Amphora perpusilla 15 0 8 1
Cymbella minuta 15 0 4 1
Fragilaria construens var. venter 15 0 2 1
Gomphonema parvulum 15 0 2 1
Nitzschia amphibia amphibia 15 0 2 1
Nitzschia frustulum 15 0 4 1
Nitzschia inconspicua 15 0 16 1
Species diversity for each station was calculated using mean relative densities for each species. Species diversity at Middle Bear River (Shannon Index or H' = 1.94; maximum H' = 3.99 for 54 species) was lower than at Cutler Reservoir (H' = 2.54; maximum H' = 3.22 for 25 species). However, because different algal communities were sampled at each station, these diversity estimates provide only a general comparison of the two stations. The Shannon Index takes into account the number of species and the evenness of species abundances. The Shannon Index at Cutler Reservoir is high due to more evenly distributed mean relative densities across species. Even though species richness was much greater at Middle Bear River (54 species) than at Cutler Reservoir (25 species), most species occurred in Middle Bear River at very low relative densities, with a few dominant species at very high relative densities. The very high relative densities of five periphyton species in Middle Bear River (totaling 85.4% by volume) suggest eutrophic overgrowth in Middle Bear River.
Cyanobacteria can dominate nitrogen-limited systems due to their ability to fix atmospheric nitrogen. As a result, cyanobacteria can increase where low nitrogen limits the growth of other algal species (Sharpley et al. 1984, 1995; Tiessen 1995). High phosphorus concentrations can increase the density of blue-green algae, as was recently demonstrated by the growth and reproduction of Anabaena in response to adding phosphorus to water samples from Logan Creek River (personal communication between Erica Gaddis, SWCA, and Wayne Wurtsbaugh, USU, October 15, 2007). Two species of blue-green algae, Merismopedia and Chroococcus, have been detected in Cutler Reservoir at very low relative densities (0.2% and 0.0% by volume, respectively). The phytoplankton community was not sampled at Middle Bear River. Six species of blue-green algae were detected in Newton Reservoir, which is hydrologically connected to Cutler Reservoir via Newton Creek, during the same survey period (2000–2005): Anabaena sp., Anabaena flosaquae, Aphanizomenon flosaquae, Microcystis incerta, and two Oscillatoria species. The planktonic genera Anabaena, Aphanizomenon, and Microcystis form surface scums, and the benthic genus Oscillatoria forms mats of high algal biomass that concentrate toxins (Codd et al. 2005).
Middle Bear River and Cutler Reservoir Final TMDLs February 2010
101
3.3.3 ASSESSMENT OF SECONDARY CONTACT RECREATION BENEFICIAL USE (2B)
3.3.3.1 Summary of Water Quality Exceedances
In recognition of the linkage between nutrients, trophic state, and recreation uses, the State of Utah has established a phosphorus indicator of 0.025 mg/L in reservoirs and 0.05 mg/L in streams and rivers. Exceedance of this indicator requires further study of the system to assess impairment. Both Cutler Reservoir and Bear River experience frequent exceedances (100% and 59% of available data respectively) of the TP indicators established for reservoirs and rivers. Chlorophyll a data indicate periods of nuisance algal growth in the reservoir (see Section 3.3.1.3).
Exceedances of the previous fecal coliform and total coliform criterion are primarily less than 10% throughout Cutler Reservoir, though the previous fecal coliform criteria is exceeded 53% of the time at the Middle Bear River station above Cutler Reservoir (#4903260). The current criteria of E. coli could not be evaluated because data are insufficient for conducting an exceedance analysis. Data collected during August 2004 indicate exceedances of the E. coli criteria at Spring Creek and Little Bear River. Future E. coli sampling will occur in conjunction with UDWQ statewide monitoring strategy.
3.3.3.2 Presence of Blue-green Algae
Although no reports of toxic cyanobacteria blooms in Cutler Reservoir have emerged, the potential for such blooms is demonstrated by the presence of blue-green species in the reservoir. One toxic species of blue-green algae, Anabaena sp., was cultured from samples collected throughout Cutler Reservoir (personal communication between Erica Gaddis, SWCA, and Wayne Wurtsbaugh, USU, October 15, 2007). Two additional species of blue-green algae, Merismopedia and Chroococcus, were detected in Cutler Reservoir at very low relative densities (0.2% and 0.0% by volume, respectively) and recorded in the STORET database. In addition, six species of blue-green algae were detected in Newton Reservoir, which is hydrologically connected to Cutler Reservoir via Newton Creek, during the same survey period (2000–2005): Anabaena sp., Anabaena flosaquae, Aphanizomenon flosaquae, Microcystis incerta, and two Oscillatoria species. Once a reservoir system becomes dominated by blue-green algae species, phosphorus reductions alone will be required to shift the population back to green algal dominance because blue-green species are capable of fixing atmospheric nitrogen (Codd et al. 2005). Blue-green algal blooms can be harmful to recreational users as well as local populations of wild and domesticated animals.
3.3.3.3 Recreation Use Support Survey
To ascertain whether visitors feel that the secondary contact recreation beneficial use is being supported in Cutler Reservoir, SWCA conducted a user survey in the fall of 2005. The 2005 Cutler Marsh Recreation Use Survey (see Appendix D) is a self-selecting survey tool used to gather demographic, recreation activity, and water quality perception information. Potential respondents were asked to complete the survey prior to or following their experience at Cutler Reservoir over the course of two weekends in September and October of 2005. Although the sample size is small (n = 38), most visitors completed the survey. However, because the survey was conducted in the fall, user groups active in the winter, spring, and summer were not represented.
Of the respondents, most were men and the mean age was approximately 35 years. Thirty out of the 38 respondents said they had been to Cutler Reservoir before. On average users have been coming to the reservoir for the past 10 years and visit 23 times per year. Hunting, non-motorized boating, and birding were popular activities. The most popular activities were water sports

Middle Bear River and Cutler Reservoir Final TMDLs February 2010
102
associated with motor boats—e.g., water skiing. On a scale of 1 to 5 (1=very dissatisfied and 5=very satisfied), 4.2 was the mean response when asked how satisfied respondents were with their recreational experience. When asked if current water quality of the reservoir supports its beneficial uses, the majority of the respondents replied yes. However, fewer (20 out of 38) responded in the affirmative when asked if current water quality supports warm water game fisheries. Respondents who were asked if they were concerned about water quality in the Middle Bear River/Cutler Reservoir as it relates to their primary activity returned responses ranging from somewhat concerned to not concerned. However, 19 out of 38 respondents were concerned that some activities or land use practices might affect the water quality of the Middle Bear River/Cutler Reservoir. These activities or land use practices include agriculture; development; oils, pesticides, and chemicals; and boats and jet skis. In addition to these findings, analyses of these data indicate that different user groups prefer specific access points. This is not surprising because the conditions and physical attributes of the reservoir make certain areas more or less suitable for particular activities. In general, birders and hunters access Cutler Reservoir at the southern end whereas water skiers preferred the northern end (see Appendix F: Figure F-10).
The results of this study build upon the body of recreation resource information gathered by PacifiCorp in spring of 2002 using a random telephone survey instrument in Cache County, Box Elder County, and Franklin County, Idaho. Seven recreational access stations were identified in the survey, four of which (Cutler Canyon, Benson Marina, Cutler Marsh Marina, and Little Bear River Access) were targeted in the 2005 Cutler Marsh User Survey. Findings from the PacifiCorp study indicate that the primary uses of Cutler Marsh by visitors are non-motor boating, fishing, bird watching, and hunting. A total of 184 individuals responded to the survey of which 35 had visited Cutler Reservoir, with the majority visiting more than once per year. Of those that had visited Cutler Reservoir, 48% found water quality to be a moderate to big problem with only 20% of the respondents indicating no problem with water quality (Figure 3.6). The concerns of survey respondents were pollution, vandalism, development, safety, user conflict, and water quality. Perceived causes of water quality problems expressed by respondents included bank erosion, development, and inadequate buffers (PacifiCorp 2002).
Don't Know9%
Not Applicable
3%
Big Problem
25%
Moderate Problem
23%
Small Problem
20%
Not a Problem
20%
Figure 3.6. Summary of PacifiCorp recreation survey results on whether water quality is perceived to be a problem in Cutler Reservoir by visitors.

Middle Bear River and Cutler Reservoir Final TMDLs February 2010
103
3.3.3.4 Support Status Summary
The secondary contact recreation beneficial use is listed as being in full support by the State of Utah (UDWQ 2006). All of the TP data collected in Cutler Reservoir and 59% of the samples collected in the Middle Bear River between 1995 and 2006 exceeded the established threshold for reservoirs and rivers respectively. Further examination of the Cutler Reservoir and Middle Bear River system indicates that although mean chlorophyll a concentrations are below the literature threshold identified as being protective of recreational activities, maximum chlorophyll a concentrations indicate heavy algal scum formation and deep discoloration of the water column. Periodic overgrowth of algae violates the narrative standard for waters established by the State of Utah, which requires waters to be maintained such that they do not become offensive by “unnatural deposits, floating debris, oil, scum or other nuisances such as color, odor or taste;…or result in concentrations or combinations of substances which produce undesirable human health effects…” Nuisance algal growth is therefore impairing the recreational uses of Cutler Reservoir and Middle Bear River.
Recreation user surveys conducted by PacifiCorp and SWCA indicate that users perceive water quality to be a problem in Cutler Reservoir. Half of the respondents in a self-selecting survey of recreational users of Cutler Reservoir had some concern that activities in the area might affect the water quality of Cutler Reservoir. A large portion of respondents selected randomly in Cache and Box Elder counties found water quality to be a moderate to big problem in Cutler Reservoir.
Finally, the threat of blue-green algal blooms is real for Cutler Reservoir, given that blue-green species do exist in the system and could be triggered to dominate under higher nutrient conditions than those currently observed. This threat could severely impact the recreational uses of the reservoir.
The State of Utah did not list Cutler Reservoir as impaired for secondary contact recreation due to elevated bacteria counts. The assessment of bacteria data in this document is not intended as a determination of beneficial support status for secondary contact recreation. Such a determination is the sole responsibility of the State of Utah and would require a more robust dataset than is available to this effort. However, the observed exceedances of the E. coli criteria suggest a potential concern that should be monitored in the future.
3.3.4 ASSESSMENT OF WARM WATER FISHERY BENEFICIAL USE (3B)
3.3.4.1 Summary of Water Quality Exceedances and Correlation with Fishery Data
Acceptable temperature and DO ranges vary for different species of fish; warm water species are the most tolerant of high water temperatures. Temperature and DO standards have been established by the State of Utah to protect the aquatic life needs of warm water species, especially at early life stages.
Diurnal DO data collected throughout Cutler Reservoir indicate routine exceedances of both the early and all life-stage DO criteria; the criteria are a daily minimum DO value of greater than 3 mg/L and 5 mg/L respectively.
The highest percentage of DO exceedances occurs in the open water portions of the Southern Reservoir, and the lowest percentage of exceedances occurs in the open water portions of the Northern Reservoir. In the Northern Reservoir, 13% and 18% of the DO data collected exceed the 1-day criteria for all life stages and early life stages, respectively (Table 3.35). In the Southern Reservoir 16% and 32% of the DO data collected exceed the 1-day criteria for all life stages and early life stages, respectively (Table 3.35). The majority of these exceedances are near Benson Marina, an open water area of the Southern Reservoir. Open water areas

Middle Bear River and Cutler Reservoir Final TMDLs February 2010
104
experienced 20% and 38% exceedance of the all life stages and early life stages criteria, respectively. Assessment of diurnal data collected in the Middle Bear River indicates only isolated exceedances of DO criteria. No exceedances of the all life-stage criteria (<3 mg/L) were observed at any of the stations monitored in the Middle Bear River.
In addition to the low DO concentrations seen at some stations in Cutler Reservoir, large fluctuations in daily DO concentration from 2 to 10 mg/L were observed. Although some diurnal variation in DO is natural and fish species are adapted to it, substantial variations are detrimental to aquatic life. Even when DO concentrations remain within the range described by the water quality criteria, substantial diurnal fluctuations in DO are likely to be stressful and damaging to fish health because these fluctuations can reduce fish growth rates, result in poor feed conversion, and reduce resistance to disease (Nebeker et al. 1992; Whitworth 1968; and Seager et al. 2000).
Diurnal data collected between 2003 and 2007 show that water temperature within Cutler Reservoir fluctuate on a diurnal cycle, similar to DO concentrations. Fluctuations of 6 to 8oC are common in Cutler Reservoir. The water quality criteria for warm water fisheries require fluctuations of temperature to be less than 4oC for full support of this beneficial use. Exceedance of the temperature criteria for warm water fisheries of 27oC occur occasionally during the summer months in Cutler Reservoir with the highest recorded exceedances observed at the Footbridge South of Benson Marina station during July 2006 (44% exceedance) and June 2007 (36% exceedance).
Spawning periods for many of the primary game fish species in Cutler Reservoir (black bullhead, black crappie, bluegill, channel catfish, largemouth bass, and smallmouth bass) intersect or precede the periods of low DO identified by the diurnal data, indicating that water quality conditions may fail to support early life stages in Cutler Reservoir. Diurnal DO and temperature data collected in 2005 and 2007 indicate several instances when DO levels dipped below the early life-stage criteria during the spawning period of fish, including carp, rainbow trout, walleye, black crappie, black bullhead, sunfish, and fathead minnow (Table 3.36, Figure 3.9).
Several fish species found in Cutler Reservoir rely on benthic macroinvertebrates as a component of their diet. Based on stomach diet analysis, aquatic invertebrates make up a significant portion of the black crappie diet and a small component of the catfish and walleye (Budy et al. 2007). Carp are also known to feed extensively on benthic macroinvertebrates (Wetzel 2001).
Table 3.35. Summary of DO Criteria Exceedances in Cutler Reservoir and Middle Bear River
Station Limno Class
Total Number of
Days Sampled
Exceedance of all Life-stage Criteria (daily minimum <3
mg/L)
Exceedance of Early Life-
stage Criteria (daily
minimum<5 mg/L)
Bear River at Utah-Idaho line Riverine 4 0% 25%
Bear River at Amalga Riverine 3 0% 0%
Bear River Above Cutler Reservoir Riverine 12 0% 33%
Bear River Below Cutler Reservoir Riverine 3 0% 100%
Total Middle Bear River System 22 0% 36% Northern Reservoir
Cache Junction Lacustrine 15 0% 13%

Middle Bear River and Cutler Reservoir Final TMDLs February 2010
105
Clay Slough 1 Littoral 8 63% 63%
Clay Slough 2 Littoral 13 0% 0%
East of Dam Lacustrine 2 0% 0%
Total Northern Reservoir 38 13% 18% Southern Reservoir
Benson Marina Lacustrine 17 41% 71%
Foot Bridge S of Benson Marina Lacustrine 10 40% 60%
Pelican Island Lacustrine 3 0% 0%
Swift Slough Littoral 21 5% 19%
Valley View Riverine 26 0% 12%
Total Southern Reservoir 77 16% 32% Northern Tributaries
Newton Creek Riverine 2 0% 0%
Southern Tributaries Blue Springs Ditch Ditch 13 0% 0%
Little Bear at Mendon Road Riverine 12 42% 50%
Logan River at Mendon Road Riverine 5 0% 0%
Spring Creek at Mendon Road Riverine 16 13% 19%

Middle Bear River and Cutler Reservoir Final TMDLs February 2010
106
This page intentionally blank.

Middle Bear River and Cutler Reservoir Final TMDLs February 2010
107
Table 3.36. Temperature Requirements, Spawning Season, and Habitat for Fish Species Found in Cutler Reservoir
Species Optimal
Adult Temp*
Lethal Adult
Temp *
Spawning Season
Spawning Time
Spawning Temp
Spawning Habitat Nursery Habitat Spawning Area of Cutler Reservoir
Black Bullhead
30 36 Jun–Aug Night 21–30° C (70–86° F)
Sandy substrate, shallow backwaters, or lake margin 1–4 feet in depth.
Young form large pelagic schools.
Southern reservoir and tributaries
Black Crappie 21 31 Mar–July Day 15–20° C (59–68° F)
Shallow vegetated littoral areas over soft mud, sand, or gravel.
Nests guarded by males, fry are pelagic.
Southern reservoir and tributaries
Bluegill Sunfish
May–Sep Day 20–28° C (68–82° F)
Shallow vegetated littoral areas over soft mud, sand, or gravel.
Juveniles remain in littoral habitats.
Southern reservoir and tributaries
Brown Trout 14 23 Mid- Sep–
Nov Day
2–6° C (36–43° F)
Builds redds in riffle areas of tributaries. Backwaters and small side channels.
Tributaries
Carp 31 40 Mar–April Day/ Night
18–22° C (64–72° F)
Shallow lake margins, submerged vegetation.
Littoral habitat with cover. Southern reservoir and tributaries
Channel Catfish
29 36 May–
mid-June Night
21–24° C (70–75° F)
Nest cavities or burrows. Guarded by males. Throughout reservoir
Fathead Minnow
26 33 Mid-May–mid-Aug
Day 15–32° C (59–90° F)
Build nest on the underside of submerged objects.
Guarded by the male. Throughout reservoir
Green Sunfish
May–Sep Day 20–28° C (68–82° F)
Shallow vegetated littoral areas over soft mud, sand, or gravel.
Juveniles remain in littoral habitats.
Throughout reservoir
Largemouth Bass
27.5 37 Jun–Jul Day 15–17° C (59–62° F)
Shallow vegetated littoral areas over soft mud, sand, or gravel.
Juveniles form pelagic schools.
Throughout reservoir
Rainbow Trout
17 26 Mar–Apr Day 12–13° C (54–56° F)
Builds redds in riffle areas of tributaries. Backwaters and small side channels.
Tributaries
Smallmouth Bass
Jun–Jul Day 15–17° C (59–62° F)
Shallow vegetated littoral areas over mud, sand, or gravel near cover.
Nests guarded by males. Throughout reservoir
Utah Sucker Mid-Apr–mid-Jun
Day/ Night
17–21° C (62–70° F)
Streams or along lake shores, preferably in the vicinity of vegetation.
Silt, sand, gravel, rocks littoral habitat w/ cover.
Throughout reservoir
Walleye 22 31 Mid-Mar–mid-Apr
Night 4–10° C
(40–50° F) Rocky substrate, in-reservoir and tributaries.
Larvae and juveniles are pelagic.
Throughout reservoir/tributaries
Fish species present in the reservoir but not protected under the warm water game fish designation are in grey. Many of these species are noted to be the most popular for anglers in the area (Budy et al. 2007). *Source: Jobling 1981.

Middle Bear River and Cutler Reservoir Final TMDLs February 2010
108
0
2
4
6
8
10
12
March April May June July August October
Min
imum
Daily
DO
Conce
ntr
atio
n (
mg/L
) Northern Reservoir Southern Reservoir Tributary
1-day early life stage criteria
Black bullhead
Black crappieBluegill and Green
Sunfish
Channel catfish
Fathead minnow
Largemouth, Smallmouth
bass
Carp,Rainbow
trout,Walleye
Utah sucker
**
*
Figure 3.7. Minimum daily DO values from diurnal sampling plotted against fish spawning period. * Indicates STORET data collected during the afternoon.
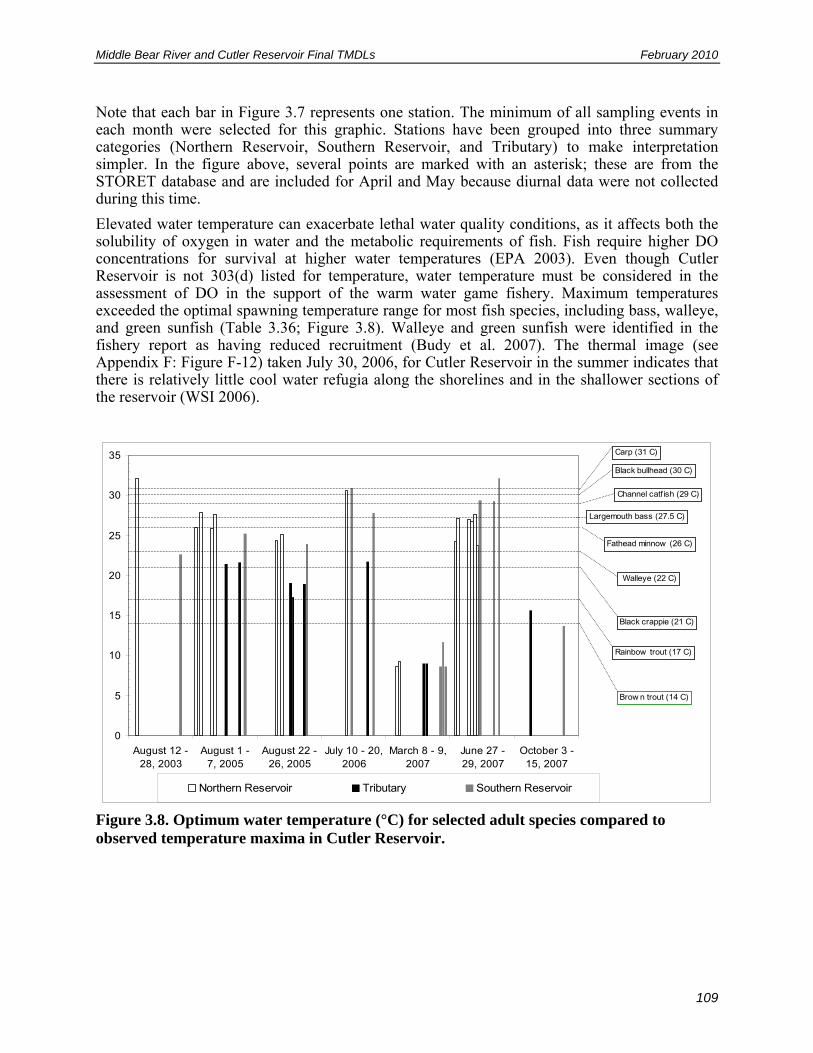
Middle Bear River and Cutler Reservoir Final TMDLs February 2010
109
Note that each bar in Figure 3.7 represents one station. The minimum of all sampling events in each month were selected for this graphic. Stations have been grouped into three summary categories (Northern Reservoir, Southern Reservoir, and Tributary) to make interpretation simpler. In the figure above, several points are marked with an asterisk; these are from the STORET database and are included for April and May because diurnal data were not collected during this time.
Elevated water temperature can exacerbate lethal water quality conditions, as it affects both the solubility of oxygen in water and the metabolic requirements of fish. Fish require higher DO concentrations for survival at higher water temperatures (EPA 2003). Even though Cutler Reservoir is not 303(d) listed for temperature, water temperature must be considered in the assessment of DO in the support of the warm water game fishery. Maximum temperatures exceeded the optimal spawning temperature range for most fish species, including bass, walleye, and green sunfish (Table 3.36; Figure 3.8). Walleye and green sunfish were identified in the fishery report as having reduced recruitment (Budy et al. 2007). The thermal image (see Appendix F: Figure F-12) taken July 30, 2006, for Cutler Reservoir in the summer indicates that there is relatively little cool water refugia along the shorelines and in the shallower sections of the reservoir (WSI 2006).
0
5
10
15
20
25
30
35
August 12 -28, 2003
August 1 -7, 2005
August 22 -26, 2005
July 10 - 20,2006
March 8 - 9,2007
June 27 -29, 2007
October 3 -15, 2007
Northern Reservoir Tributary Southern Reservoir
Black bullhead (30 C)
Black crappie (21 C)
Channel catf ish (29 C)
Largemouth bass (27.5 C)
Walleye (22 C)
Brow n trout (14 C)
Carp (31 C)
Fathead minnow (26 C)
Rainbow trout (17 C)
Figure 3.8. Optimum water temperature (°C) for selected adult species compared to observed temperature maxima in Cutler Reservoir.

Middle Bear River and Cutler Reservoir Final TMDLs February 2010
110
0
2
4
6
8
10
12
14
BensonMarinaBottom
BensonMarina Top
New tonBottom
New tonTop
ValleyView
Bottom
ValleyViewMiddle
ValleyView Top
Deg
rees
C
March 8 - 9, 2007
Walleye Spaw ningTemperatureRange(4 - 10 degrees C)
Figure 3.9. Spawning temperature range and observed maximum temperatures (for March 8-9, 2007 sampling dates) during spawning period for walleye in Cutler Reservoir.
0
5
10
15
20
25
30
35
Bea
r R
iver
Bea
r R
iver
2
Ben
son
Mar
ina
Cac
he J
unct
ion
Cla
y S
loug
h 1
Cla
y S
loug
h 2
Eas
t of D
am
Foo
t Brid
ge S
of
Ben
son
Mar
ina
Littl
e B
ear
atM
endo
n R
oad
Loga
n R
iver
at
Men
don
Roa
d
Pel
ican
Isla
nd
Spr
ing
Cre
ek a
tM
endo
n R
oad
Sw
ift S
loug
h
Val
ley
Vie
w
Deg
rees
C
August 12 - 28, 2003 August 1 - 7, 2005 August 22 - 26, 2005 July 10 - 20, 2006 June 27 - 29, 2007
Green SunfishSpawning TemperatureRange(21 - 30 degrees C)
Figure 3.10. Spawning temperature range and observed maximum temperatures (by sampling date) during spawning period for largemouth bass and smallmouth bass in Cutler Reservoir.
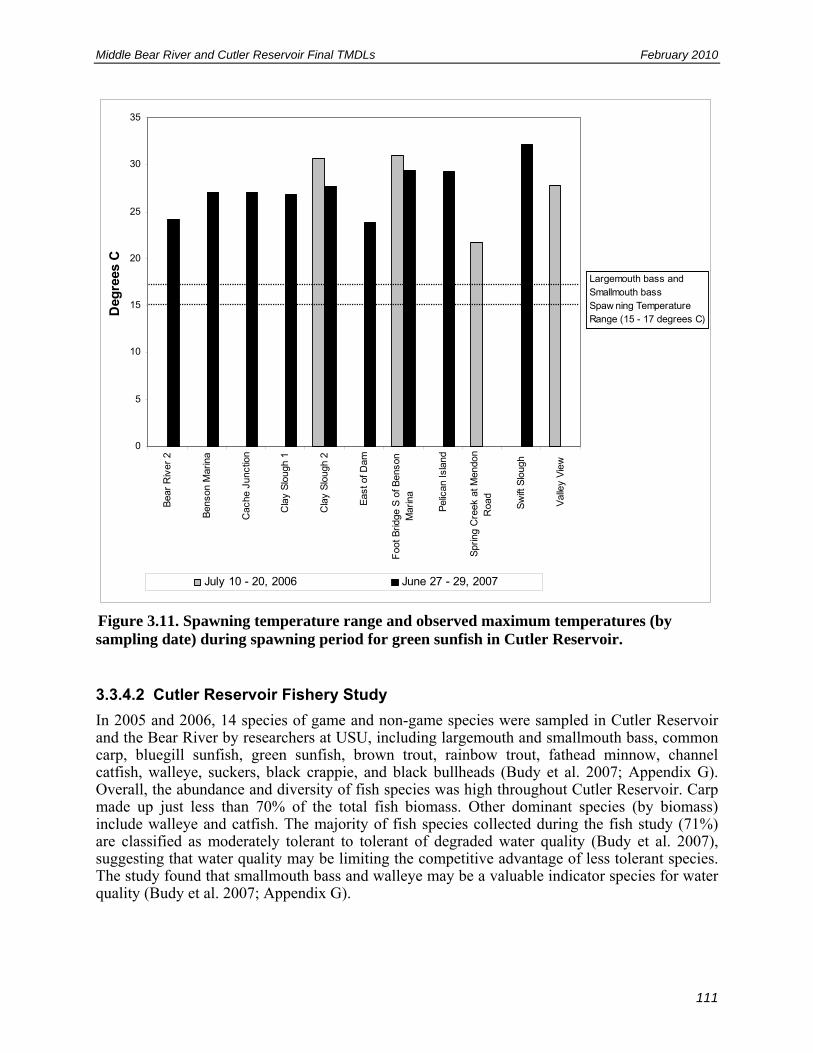
Middle Bear River and Cutler Reservoir Final TMDLs February 2010
111
0
5
10
15
20
25
30
35
Bea
r R
iver
2
Ben
son
Mar
ina
Cac
he J
unct
ion
Cla
y S
loug
h 1
Cla
y S
loug
h 2
Eas
t of D
am
Foo
t Brid
ge S
of B
enso
nM
arin
a
Pel
ican
Isla
nd
Spr
ing
Cre
ek a
t Men
don
Roa
d
Sw
ift S
loug
h
Val
ley
Vie
w
Deg
rees
C
July 10 - 20, 2006 June 27 - 29, 2007
Largemouth bass and Smallmouth bass Spaw ning TemperatureRange (15 - 17 degrees C)
Figure 3.11. Spawning temperature range and observed maximum temperatures (by sampling date) during spawning period for green sunfish in Cutler Reservoir.
3.3.4.2 Cutler Reservoir Fishery Study
In 2005 and 2006, 14 species of game and non-game species were sampled in Cutler Reservoir and the Bear River by researchers at USU, including largemouth and smallmouth bass, common carp, bluegill sunfish, green sunfish, brown trout, rainbow trout, fathead minnow, channel catfish, walleye, suckers, black crappie, and black bullheads (Budy et al. 2007; Appendix G). Overall, the abundance and diversity of fish species was high throughout Cutler Reservoir. Carp made up just less than 70% of the total fish biomass. Other dominant species (by biomass) include walleye and catfish. The majority of fish species collected during the fish study (71%) are classified as moderately tolerant to tolerant of degraded water quality (Budy et al. 2007), suggesting that water quality may be limiting the competitive advantage of less tolerant species. The study found that smallmouth bass and walleye may be a valuable indicator species for water quality (Budy et al. 2007; Appendix G).

Middle Bear River and Cutler Reservoir Final TMDLs February 2010
112
Fish condition across species was generally at or above average, compared to similar reservoirs. Relatively high growth rates and relatively large populations of large fish were also observed throughout the reservoir. Although a diversity of age and size classes were present for most species, there are some indications that walleye and green sunfish have limited to poor recruitment. The study suggests that a good portion of the walleye present in Cutler Reservoir originated in the Bear River in Idaho and have moved into Cutler Reservoir, further supporting the conclusion that there is limited walleye recruitment in the reservoir itself (Budy et al. 2007; Appendix G). Recruitment was poor for walleye and green sunfish in Cutler Reservoir, as indicated by length-frequency and proportional stock density values (Budy et al. 2007). The dominant species in the reservoir are those that are moderately tolerant to tolerant of degraded water quality. Fish species that are intolerant to degraded water quality are either absent or present in very low numbers. Because water quality is an import determinant of fish growth rate, it is also a factor in species composition and persistence (Sherwood et al. 2002). Fish species tolerance to low DO levels varies by species, but because of the limiting effects of low DO on habitat availability and suitability, it is more likely to affect juvenile fish by limiting growth rates as a result of increased stress, higher metabolic demands, and reduced resources (Rajotte 2002 in Budy et al. 2007).
The sport fishing pressure on Cutler Reservoir is limited primarily to road access points and is classified as low to moderate with negligible boat angling. Primary sport fish targets appear to be channel catfish, black bullhead, and carp (Budy et al. 2007), as well as black crappie. Total fish abundance and fish species richness were observed to decline with a decrease in DO concentrations. These patterns were documented in the fish study conducted by USU in 2005 and 2006 (Budy et al. 2007; Appendix G).
3.3.4.3 Support Status Summary
The warm water fishery is listed by the State of Utah as only partially supported in Cutler Reservoir and Middle Bear River (UDWQ 2006). The direct criteria exceedance and a general biological and habitat assessment for warm water fish species conducted in this study supports this determination. Diurnal data collected between 2005 and 2007 identify exceedance of the early and all life-stage criteria at 25% and 15% respectively for all stations and days of diurnal monitoring in Cutler Reservoir. Exceedances of the early and all life-stage criteria were 37% and 0% respectively at the Middle Bear River station above Cutler Reservoir. Fish stress caused by low DO is exacerbated by high temperature in the reservoir during summer months. Exceedances of the DO and temperature criteria intersect known spawning months for many of the species identified in Cutler Reservoir. A small dataset of benthic macroinvertebrate sampling indicates depressed benthic macroinvertebrate biomass and reduced populations of chironomids in the more eutrophic stations sampled (Swift Slough). Anoxia is known to adversely affect benthic macroinvertebrates, a known food resource for fish in the reservoir.
The State of Utah provides for modification to an initial support status assessment through evaluation of the TSI, reported fish kills, and the presence of significant blue-green algal species in the phytoplankton community. All of these additional indicators suggest that Cutler Reservoir is not fully supporting the warm water fishery beneficial use. Trophic state index values for the reservoir point to a hyper-eutrophic system with the Bear River characterized as eutrophic. A kill of young-of-year crappie were observed in early June in 2002 in Cutler Reservoir by Craig Schaugaard (UDWiR). Although the exact reason for the kill cannot be definitively determined, the kill could have been caused by lethal temperature and DO conditions. Finally, blue-green algal species are present in the reservoir, though they are not yet dominant. The evidence indicating non support of the warm water fishery is summarized in Table 3.37.
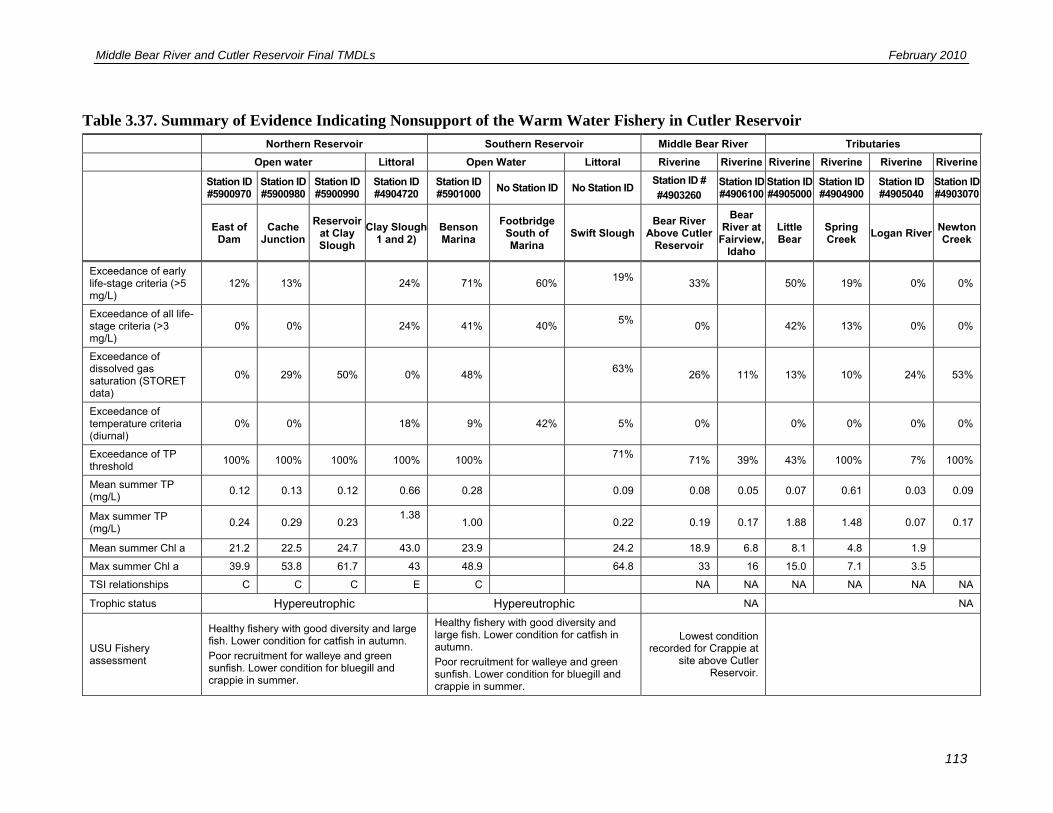
Middle Bear River and Cutler Reservoir Final TMDLs February 2010
113
Table 3.37. Summary of Evidence Indicating Nonsupport of the Warm Water Fishery in Cutler Reservoir
Northern Reservoir Southern Reservoir Middle Bear River Tributaries
Open water Littoral Open Water Littoral Riverine Riverine Riverine Riverine Riverine Riverine
Station ID #5900970
Station ID #5900980
Station ID #5900990
Station ID #4904720
Station ID #5901000
No Station ID No Station ID Station ID #
#4903260 Station ID #4906100
Station ID #4905000
Station ID #4904900
Station ID #4905040
Station ID #4903070
East of Dam
Cache Junction
Reservoir at Clay Slough
Clay Slough1 and 2)
Benson Marina
Footbridge South of Marina
Swift Slough Bear River
Above Cutler Reservoir
Bear River at
Fairview, Idaho
Little Bear
Spring Creek
Logan RiverNewton Creek
Exceedance of early life-stage criteria (>5 mg/L)
12% 13% 24% 71% 60% 19%
33% 50% 19% 0% 0%
Exceedance of all life-stage criteria (>3 mg/L)
0% 0% 24% 41% 40% 5%
0% 42% 13% 0% 0%
Exceedance of dissolved gas saturation (STORET data)
0% 29% 50% 0% 48% 63%
26% 11% 13% 10% 24% 53%
Exceedance of temperature criteria (diurnal)
0% 0% 18% 9% 42% 5% 0% 0% 0% 0% 0%
Exceedance of TP threshold
100% 100% 100% 100% 100% 71%
71% 39% 43% 100% 7% 100%
Mean summer TP (mg/L)
0.12 0.13 0.12 0.66 0.28 0.09 0.08 0.05 0.07 0.61 0.03 0.09
Max summer TP (mg/L)
0.24 0.29 0.23 1.38
1.00 0.22 0.19 0.17 1.88 1.48 0.07 0.17
Mean summer Chl a 21.2 22.5 24.7 43.0 23.9 24.2 18.9 6.8 8.1 4.8 1.9
Max summer Chl a 39.9 53.8 61.7 43 48.9 64.8 33 16 15.0 7.1 3.5
TSI relationships C C C E C NA NA NA NA NA NA
Trophic status Hypereutrophic Hypereutrophic NA NA
USU Fishery assessment
Healthy fishery with good diversity and large fish. Lower condition for catfish in autumn.
Poor recruitment for walleye and green sunfish. Lower condition for bluegill and crappie in summer.
Healthy fishery with good diversity and large fish. Lower condition for catfish in autumn.
Poor recruitment for walleye and green sunfish. Lower condition for bluegill and crappie in summer.
Lowest condition recorded for Crappie at
site above Cutler Reservoir.
Middle Bear River and Cutler Reservoir Final TMDLs February 2010
114
This page intentionally blank.
Middle Bear River and Cutler Reservoir Final TMDLs February 2010
115
3.3.5 ASSESSMENT OF AVIAN BENEFICIAL USE (3D)
3.3.5.1 Summary of Water Quality Exceedances
The water quality standards related to DO, temperature, and pH, identified by the State of Utah for all life stages of warm water fish also apply for the bird related beneficial use (3D). Thus, all water quality exceedances discussed in the previous section also apply to this use. In summary, exceedances of the DO (15%) and temperature (9%) criteria are common in Cutler Reservoir especially during the summer months.
3.3.5.2 Wetland Functional Assessment
In an attempt to characterize the status of Cutler Reservoir’s avian habitat, SWCA focused on wetlands, or those transitional areas between uplands and deep water habitat that support avian resources during various life stages. The intent of this study is to identify habitat related impacts to avian communities that may or may not be directly related to water quality. Correction of impairments not directly related to water quality are outside of the scope of this TMDL study. A summary of the interactions between other management entities and decisions on the Cutler Reservoir hydrologic and ecological system is presented in Appendix F: Figure F-16. After identifying three study stations (see Appendix F: Figure F-13) with existing bird survey data, different wetland types typical of the Cutler Reservoir and its environs (i.e., a riparian zone in the vicinity of Benson Bridge, an emergent marsh at the mouth of Swift Slough, and a mineral flat at the end of Clay Slough in the Amalga Barrens), SWCA applied a wetland assessment model to evaluate functionality. The model, developed by UDWiR, uses land use, hydrologic, modification, and invasive plant establishment as surrogate indicators of human impacts on, or impairment of, wetland functions. These functions include measures of:
4. External water delivery 5. Internal water retention 6. The capacity to remove dissolved compounds 7. Retention of particulates 8. Wildlife habitat
The model does not assess actual water quality and it does not account for existing, ambient water quality conditions; it only assesses the ability of a wetland to perform services related to water quality. However, the results of the model when compared to data from water quality sampling can offer discussion points regarding the effects of dispersed, nonpoint source pollution and point sources within the Cutler Reservoir study area. Likewise, bird survey data allow for triangulation of the wildlife habitat functional score relative to species richness and feeding habitat guilds.
3.3.5.2.1 Functional Assessment Scores Functional capacity is scored on a scale of 0 to 1.0, with one being the highest. Table 3.38 presents the results of the functional assessment model for each station across all functional capacity indices: hydrologic modification, internal water flow, capacity for removing dissolved and particulate elements, and habitat. A more complete discussion of the development of the model and formulas used to calculate these scores can be found in Appendix E.
In general all three wetland stations scored highly in the functional assessment. None are significantly affected by hydrologic modification outside the assessment area, nor is land use within and outside the wetlands of a type or extent that has a large impact on water quality

Middle Bear River and Cutler Reservoir Final TMDLs February 2010
116
function (i.e., the land does not generate loads beyond the wetlands’ capacity to remove dissolved solids and particulates). There is a slight difference in scores associated with flow within each wetland, which is a function of land use and vegetative structure. For example, hydrology with the Swift Slough wetland complex is likely modified by the presence of cattail and common reed that grow in dense stands and have the capacity to restrict flows. Finally, although habitat function scores are similar across all three wetlands, they are lower than scores for the other functions. This is because wildlife habitat outside the wetland assessment areas experience increased disturbance and thus is given a marginal value for land use (Figure 3.12).
The findings of the model, although generally positive, are associated with landscape level processes upslope of the wetlands and do not reflect the potential impact of nutrient enrichment or low levels of DO on the wetlands directly from Middle Bear River or Cutler Reservoir. Field reconnaissance conducted to gather data for the model found some areas of cattail and common reed infestation. Many researchers have shown that the shift from a diverse wetland plant community to a stand of cattail has often been associated with changes in hydrology and nutrients, whereas other literature suggests that water levels alone are not sufficient to facilitate the establishment of this invasive species (Woo and Zedler 2002).
Table 3.38. Wetland Functional Capacity Index Scores
FCI1 Benson Bridge Swift Slough Amalga Barrens
Hydro 0.93 0.95 0.97
InHydro 0.88 0.85 0.96
Dissolved 0.90 0.92 0.95
Particulates 0.98 0.99 0.99
Habitat 0.73 0.70 0.75 1FCI: Functional Capacity Indices
Hydro capacity measures a wetland’s capacity for intercepting groundwater and surface water outside the wetland, as affected by land use and hydrologic modification.
InHydro capacity measures the internal water flow as related to vegetative structure; it also measures effects on soil permeability and vegetation type by land use within the wetland.
Dissolved capacity measures a wetland's capacity to remove dissolved elements or compounds through biotic, physical, and chemical processes.
Particulates capacity measures the deposition and detention of inorganic and organic particulates due primarily to physical processes.
Habitat capacity is a measure of composition and characteristics of the living plant biomass as associated with human disturbances related to various land uses.

Middle Bear River and Cutler Reservoir Final TMDLs February 2010
117
Wetlands Functional Assessment
0.000.100.200.300.400.500.600.700.800.901.00
Hydro Inhydro Dissolved Particles Habitat
Functional Capacity Indices
FA
Sco
re
Benson Bridge
Sw ift Slough
Amalga Barrens
Figure 3.12. Functional capacity indices for wetlands around Cutler Reservoir.
3.3.5.2.2 Avian Resources of the Cutler Reservoir and Middle Bear River Complex Wetlands around Cutler Reservoir have been nominated by the Audubon Society as an Important Bird Area (IBA) in Utah. The results of the wetland functional assessment show that, overall, wildlife habitat function is not degraded by intensive land use. In addition, the study area is rural and thus experiences relatively low levels of disturbance associated with roads and residential development, such as noise, light, and accidental mortality. Among the criteria that qualify the Cutler Marsh and Amalga Barrens as an IBA are recorded occurrences of state sensitive bird species (American white pelican and long-billed curlew), breeding populations of Utah Partners in Flight priority species (American avocet and black-necked stilt), diverse ecosystem types (e.g., playas, lowland riparian, wet meadow, etc.), and the area’s ability to function as a refugia during Great Salt Lake high water years.
Table 3.39 summarizes bird monitoring data gathered at or in the vicinity of the three wetland functional assessment stations. Monitoring protocol varied across stations and included observations of birds outside the wetlands to the extent that they were visible and identifiable. Therefore, not all bird observations are indicative of breeding, foraging, or other habitat use within the wetland area. The source of Benson Bridge data are 16 survey events from November 2000 to May 2003 by citizen scientists volunteering as part of a UDWiR wetland monitoring program. Swift Slough data were gathered during seven survey events from May 2001 to May 2002 by members of Bridgerland Audubon. Amalga Barrens data consist of seven survey events over a one-month period from April to May of 2005 by members of Bridgerland Audubon Society. It is important to note that these data may not be representative of typical habitat conditions in the reservoir, and additional data are needed to fully assess breeding and non-breeding bird use of reservoir habitats.
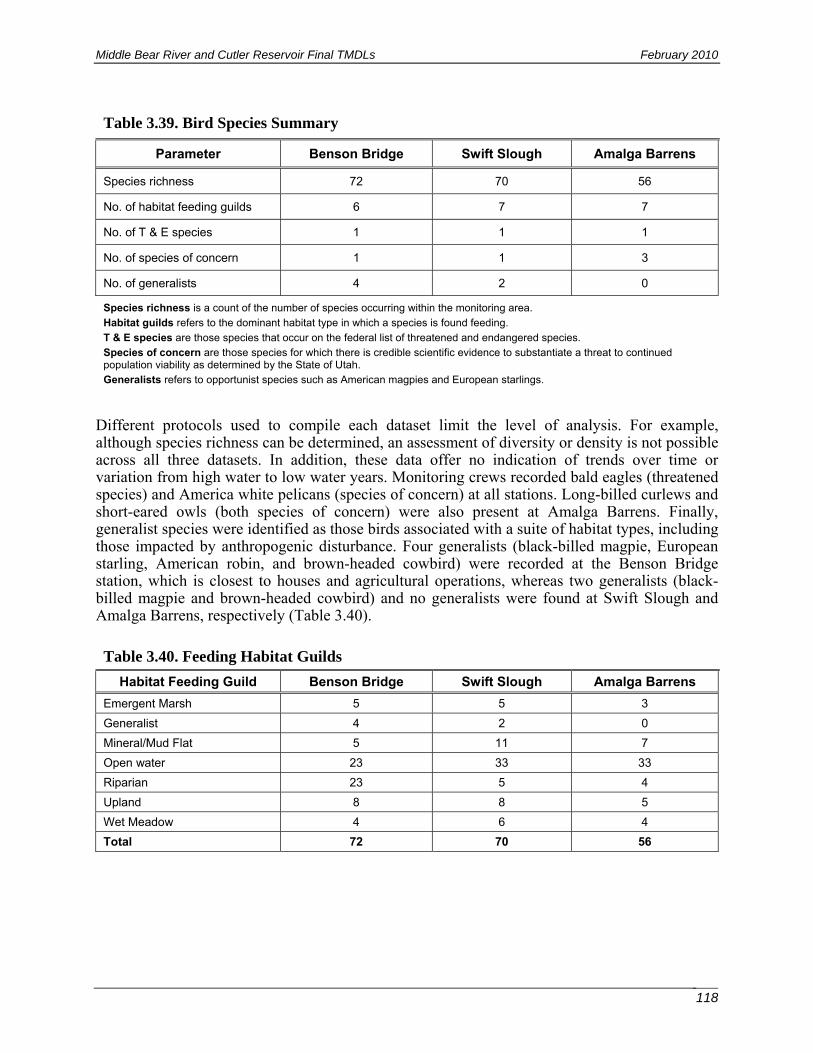
Middle Bear River and Cutler Reservoir Final TMDLs February 2010
118
Table 3.39. Bird Species Summary
Parameter Benson Bridge Swift Slough Amalga Barrens
Species richness 72 70 56
No. of habitat feeding guilds 6 7 7
No. of T & E species 1 1 1
No. of species of concern 1 1 3
No. of generalists 4 2 0
Species richness is a count of the number of species occurring within the monitoring area.
Habitat guilds refers to the dominant habitat type in which a species is found feeding.
T & E species are those species that occur on the federal list of threatened and endangered species.
Species of concern are those species for which there is credible scientific evidence to substantiate a threat to continued population viability as determined by the State of Utah.
Generalists refers to opportunist species such as American magpies and European starlings.
Different protocols used to compile each dataset limit the level of analysis. For example, although species richness can be determined, an assessment of diversity or density is not possible across all three datasets. In addition, these data offer no indication of trends over time or variation from high water to low water years. Monitoring crews recorded bald eagles (threatened species) and America white pelicans (species of concern) at all stations. Long-billed curlews and short-eared owls (both species of concern) were also present at Amalga Barrens. Finally, generalist species were identified as those birds associated with a suite of habitat types, including those impacted by anthropogenic disturbance. Four generalists (black-billed magpie, European starling, American robin, and brown-headed cowbird) were recorded at the Benson Bridge station, which is closest to houses and agricultural operations, whereas two generalists (black-billed magpie and brown-headed cowbird) and no generalists were found at Swift Slough and Amalga Barrens, respectively (Table 3.40).
Table 3.40. Feeding Habitat Guilds
Habitat Feeding Guild Benson Bridge Swift Slough Amalga Barrens
Emergent Marsh 5 5 3
Generalist 4 2 0
Mineral/Mud Flat 5 11 7
Open water 23 33 33
Riparian 23 5 4
Upland 8 8 5
Wet Meadow 4 6 4
Total 72 70 56

Middle Bear River and Cutler Reservoir Final TMDLs February 2010
119
Avian species distribution by feeding area
0
5
10
15
20
25
30
35
Ag /Emergent
M arsh
Ag /Riparian
Ag /Range
Ag / WetM eadow
EmergentM arsh
EmergentM arsh /Riparian
Generalist M ineral /M ud Flat
OpenWater
OpenWater /
Riparian
Range Riparian WetM eadow
WetM eadow /Emergent
M arsh
Habitat Types
# o
f S
pec
ies
Benson Bridge
Sw ift Slough
Amalga Barrens
Figure 3.13. Avian species distribution by feeding area in wetlands around Cutler Reservoir.
3.3.5.3 Avian Food Chain Inventory and Benthic Macroinvertebrate Summary
Although sufficient water quality data exist to describe the chemical characteristics of different areas of Cutler Reservoir and Middle Bear River, the lack of empirical data on macroinvertebrate assemblages makes it difficult to draw concrete conclusions regarding the effects of water quality on these organisms. Five hypotheses are supported by the literature (although specific fieldwork conducted across the broad range of aquatic ecosystems is limited); together, these hypotheses reflect the integrated components illustrated in Figure 3.13:
• Macroinvertebrates exhibit various levels of tolerance to different water quality parameters (Rosenberg and Resh 1993, Yuan 2004).
• Nutrient enrichment can change macroinvertebrate community structure. For example, as lakes become more eutrophic, the number of chironomids and other benthic animals decreases and the number of oligochaete worms increases (Wetzel 2001).
• There is an observational linkage between nutrients and the health of macroinvertebrates in natural streams. For example, macroinvertebrate index scores are negatively correlated with increasing concentrations of nutrients (Wang et al. 2007).
• Nutrient enrichment can result in population densities of phytoplankton and epiphytes that shade submersed vegetation, leading to a decrease in littoral habitat (Wetzel 2001).
• Aquatic macroinvertebrates are a primary food source for many water related birds (Kaufman 1996, Skagen and Oman 1996, Cornell 2008).
A small dataset is available for macroinvertebrates in Cutler Reservoir. The data were collected by USU students under the supervision of Wayne Wurtsbaugh. Benthic invertebrate biomasses in the open sediments of Cutler Reservoir were observed to be very low (Stoller 2008, Dees 2008). Total macroinvertebrate biomass and density in Swift Slough was 42% and 50% compared to Logan River stations, the least impaired station in the Cutler Reservoir system. Samples

Middle Bear River and Cutler Reservoir Final TMDLs February 2010
120
collected in Swift Slough exhibited very low biomass of benthic invertebrates compared to other systems (Stoller 2008, Dees 2008).
Macroinvertebrate populations in Cutler Reservoir were found to be dominated by worms (oligochaetes) and chironomids (Stoller 2008, Dees 2008). Both taxa are relatively tolerant of eutrophic conditions although oligochaetes are substantially more tolerant. As eutrophication becomes more severe, populations of chironomids tend to be reduced with corresponding increases in oligochaetes (Wetzel 2001). Oligochaeate dominance in Swift Slough indicates strongly eutrophic conditions with low DO. Based on the available macroinvertebrate data, bird and fish foraging on benthic invertebrates in the open water sections of the reservoir could be limited by supplies of prey (Wurtsbaugh 2008). Additional macroinvertebrate data are required to determine if this condition extends to other parts of Cutler Reservoir and to examine populations of other macroinvertebrates such as EPT taxa.
A survey of the diet requirements of bird species found around Cutler Reservoir (Kaufman 1996; Cornell 2008) indicates numerous species that depend on chironomids as part of their diet including the following: American avocet, white-faced ibis, California gull, Franklin’s gull, ring-billed gull, cinnamon teal, northern pintail, northern shoveler, redhead, ruddy duck, spotted sandpiper, common snipe, lesser yellowlegs, semipalmated sandpiper, song sparrow, Barrow’s goldeneye, marbled godwit, American pipit, American dipper, Baird’s sandpiper, least sandpiper, and solitary sandpiper (Table 3.41). Many other birds depend on EPT taxa as a component of their diet (Table 3.41).
Table 3.41. Summary of Birds Observed in Cutler Reservoir that Depend on Various Macroinvertebrate Taxa as a Component of Their Diet
Species EPT Taxa a
Component of Diet
Chironomids in Diet
Oligochaetes in Diet
Odonta in Diet
American Avocet X
Black-necked Stilt < 5% of diet
Virginia Rail X
White-faced Ibis X X
American Bittern X
California Gull X
Franklin's Gull X
Ring-billed Gull X
Cinnamon Teal X 17% of diet in postbreeding males in GSL, UT
4% of diet in postbreeding male in GSL, UT
Northern Pintail X X
Northern Shoveler X
Redhead X 49%-63% of diet for both sexes, Prairie Pothole, N. Dakota
22% of diet in Great Basin wetlands
Ruddy Duck 1% of male diet in N. Dakota X X
American Coot X
Spotted Sandpiper X X
Common Snipe X X

Middle Bear River and Cutler Reservoir Final TMDLs February 2010
121
Table 3.41. Summary of Birds Observed in Cutler Reservoir that Depend on Various Macroinvertebrate Taxa as a Component of Their Diet
Species EPT Taxa a
Component of Diet
Chironomids in Diet
Oligochaetes in Diet
Odonta in Diet
Greater Yellowlegs X
Lesser Yellowlegs X X
Semipalmated Sandpiper
X
Song Sparrow X X X
Barrow's Goldeneye X X X
Common Goldeneye X X
Canvasback 27% of ducklings diet in Ruby Lake, NV X
American Wigeon X X
Marbled Godwit X X X
Lincoln's Sparrow X
Wilson's Warbler X
Bank Swallow X X
Tree Swallow X
American Pipit X X X
Common Nighthawk X
American Dipper X X X X
Western Meadowlark X
Bohemian Waxwing X X
Western Grebe X
Pied-billed Grebe X
Baird's Sandpiper X
Black Tern X X
Black-bellied Plover X X
Least Sandpiper X
Semipalmated Plover X
Solitary Sandpiper X X X
Stilt Sandpiper X
3.3.5.4 Support Status Summary
The waterfowl, shorebirds, and other aquatic related organisms beneficial use is listed as being in full support by the State of Utah (UDWQ 2006). However, exceedances of water quality criteria specific to this beneficial use indicate an impairment. The wetland function assessment suggests that habitat around Cutler Reservoir is healthy. Therefore, the system is unlikely to be habitat limited. Diurnal data collected between 2005 and 2007 identify 15% exceedance of the DO criteria for the 3D use in Cutler Reservoir. A small dataset of benthic macroinvertebrate
Middle Bear River and Cutler Reservoir Final TMDLs February 2010
122
sampling indicates depressed benthic macroinvertebrate biomass and reduced populations of chironomids in the more eutrophic stations sampled (Swift Slough). Anoxia is known to adversely affect benthic macroinvertebrates (Wetzel 2001). A literature based food resource inventory suggests that bird foraging on benthic macroinvertebrates in Cutler Reservoir could be limited by supplies of prey, especially in open water areas. The threat of blue-green algal blooms is real for Cutler Reservoir, given that cyanobacteria species do exist in the system and could be triggered to dominate under higher nutrient conditions than those currently observed. Cyanotoxins would pose a threat to bird populations around the reservoir (Beasely et al. 1989).
Further study is needed on the Cutler Reservoir and Middle Bear River system to define relationships between water quality, aquatic macroinvertebrate diversity, habitat and biomass, and the populations of water-oriented birds that depend on macroinvertebrates. In particular, an assessment of breeding birds and nesting success would differentiate between resident and migratory populations. Any multiyear study that could be correlated to existing datasets could provide further insight into avian population trends. Finally, an assessment of food resources and availability (i.e., plant and macroinvertebrate assemblages and associated water depth/quality) would quantify the population potential of different feeding groups.
3.3.6 ASSESSMENT OF AGRICULTURAL WATER SUPPLY BENEFICIAL USE (4)
3.3.6.1 Summary of Water Quality Exceedances
No water quality exceedances of criteria specific to the agricultural use were observed in Cutler Reservoir or Middle Bear River.
3.3.6.2 Support Status Summary
The agricultural uses for Cutler Reservoir and the Middle Bear River are in full support, according to the State of Utah (UDWQ 2006). The water quality analysis of TDS and pH supports this determination. No TDS exceedances were identified for Cutler Reservoir or the Middle Bear River. Exceedances in tributaries to Cutler Reservoir were few and primarily isolated to Clay Slough. The threat of blue-green algal blooms is real for Cutler Reservoir, given that blue-green species do exist in the system and could be triggered to dominate under higher nutrient conditions than those currently observed. This threat could impact agricultural uses of the reservoir.
3.4 CONCLUSIONS
This chapter represents the impairment assessment and summary of current water quality and habitat conditions in Cutler Reservoir and Middle Bear River. Impairments were identified for three of the four beneficial uses in Cutler Reservoir including secondary contact recreation (2B), warm water game fishery (3B) and waterfowl, water birds, and associated food chain (3D). However, only the warm water game fishery designated use was listed as impaired by the State of Utah (UDWQ 2006).The agricultural use was found to be fully supported in Cutler Reservoir. Only isolated exceedances of water quality criteria were found on the Middle Bear River itself, although the river contributes to the impairment in Cutler Reservoir.
The existing current TMDL for TP for the Bear River was approved on October 23, 1997. The current TMDL identifies an instream DO concentration target of 0.05 mg/l. The Middle Bear River was found not to be in exceedance of the all life stage criteria for DO of 3.0 mg/l, based on diurnal dissolved oxygen monitoring from 2003–2007. However, the river exceeds the early life stage criteria of 5.0 mg/l on 36% of the days for which diurnal data are available during the same

Middle Bear River and Cutler Reservoir Final TMDLs February 2010
123
period. For this reason, no additional nutrient reductions have been identified in the TMDL beyond those required under the existing Bear River TMDL, which are necessary to reduce the impact of Bear River on the Cutler Reservoir system.
In Cutler Reservoir, the original impairment determinations are based on exceedances of water quality standards. The impairment of the reservoir is supported by additional numeric water quality data (low DO and high temperature), the narrative water quality standard (nuisance algal conditions), and supplemental evidence used to assess the overall health of Cutler Reservoir and its designated uses. A TSI indicates eutrophic to hypereutrophic conditions, especially in the southern portion of the reservoir and Clay Slough. Carp are the dominant fish in Cutler Reservoir, making up almost 70% of the total fish biomass. Carp have been observed to alter the littoral habitat such that submerged macrophytes are eliminated, sediments are disturbed, and turbidity increased (Wetzel 2001). Sediment suspension may also result from wind mixing in the shallow Southern Reservoir. High turbidity may exert a somewhat protective effect on water quality within the Southern Reservoir because the depth to which light can penetrate the water column is reduced. Turbidity thus reduces the potential for algal growth in the reservoir. Benthic macroinvertebrate populations appear to be depressed and a wide variety of birds were found to include benthic macroinvertebrates in their diets. Recreation use surveys, conducted by SWCA and PacifiCorp, show that recreational users perceive water quality to be a problem in Cutler Reservoir. The nitrogen to phosphorus ratios recorded and limited enrichment trials indicate that the reservoir is co-limited by both nutrients. All of the beneficial uses in Cutler Reservoir are threatened by the potential of blue-green algal blooms and their associated cyanotoxins. Cyanobacteria species do exist in the system and could be triggered to dominate under higher nutrient conditions than those currently observed.

Middle Bear River and Cutler Reservoir Final TMDLs February 2010
124
This page intentionally blank.
Middle Bear River and Cutler Reservoir Final TMDLs February 2010
125
CHAPTER 4 SOURCE IDENTIFICATION AND LOAD ANALYSIS
4.1 MAJOR SOURCES OF PHOSPHORUS LOADING TO CUTLER RESERVOIR
Phosphorus is the primary focus of this analysis because management of the system as phosphorus-limited reduces the threat of blue-green algae while also reducing the concentration of total algae in the water column and thereby improving oxygen concentrations. Significant sources of phosphorus loading in the Cutler Reservoir watershed include the following:
• Regulated municipal and industrial point sources • Stormwater runoff from developed areas • On-site wastewater treatment systems (septic systems) • Animal feeding operations (AFOs) and confined animal feeding operations (CAFOs) • Runoff from irrigated and fertilized agricultural lands • Runoff from pasturelands • Cattle in streams, riparian areas, and reservoir shoreline • Runoff from forested lands • Runoff from rangelands • Seasonal internal reservoir sources • Pipes discharging into Cutler Reservoir and tributaries • Stream erosion and reservoir shoreline erosion • Atmospheric sources • Natural background sources
Although references to numerous pollutants are provided in this background section, only assumptions relevant to the calculation of phosphorus loads are included in the load analysis.
4.1.1 REGULATED SOURCES
4.1.1.1 Municipal and Industrial Point Sources
Most of the regulated point sources of phosphorus in the Cutler Reservoir watershed were analyzed as part of other TMDLs on tributaries to these systems. These include TMDLs for the Little Bear River, Spring Creek, Newton Creek, Cub River, and the Idaho portion of the Bear River. Additional analyses of these regulated point sources have not been conducted for the Cutler Reservoir study; instead, the original loads reported for regulated point sources in existing TMDLs (for the current period defined as 1995–2006) have been used directly. Furthermore, identified load reductions in existing TMDLs were found to be sufficient to support the load analysis of the Cutler Reservoir TMDL; therefore, allocated loads identified in other TMDLs are incorporated into the Cutler Reservoir TMDL. A list of regulated point sources covered under other TMDLs is summarized in Table 4.1. Loads specific to regulated point sources are identified by drainage in this chapter. The only point source discharges that will receive new waste LAs in the Cutler Reservoir TMDL are the Fisheries Experiment Station and the Logan Regional WWTP, both of which discharge to sloughs in the Southern Reservoir.
4.1.1.1.1 Fisheries Experiment Station UDWiR operates a fisheries experiment station in the Cutler Reservoir watershed to “provide technological development and extension support for the Utah State fish culture program”
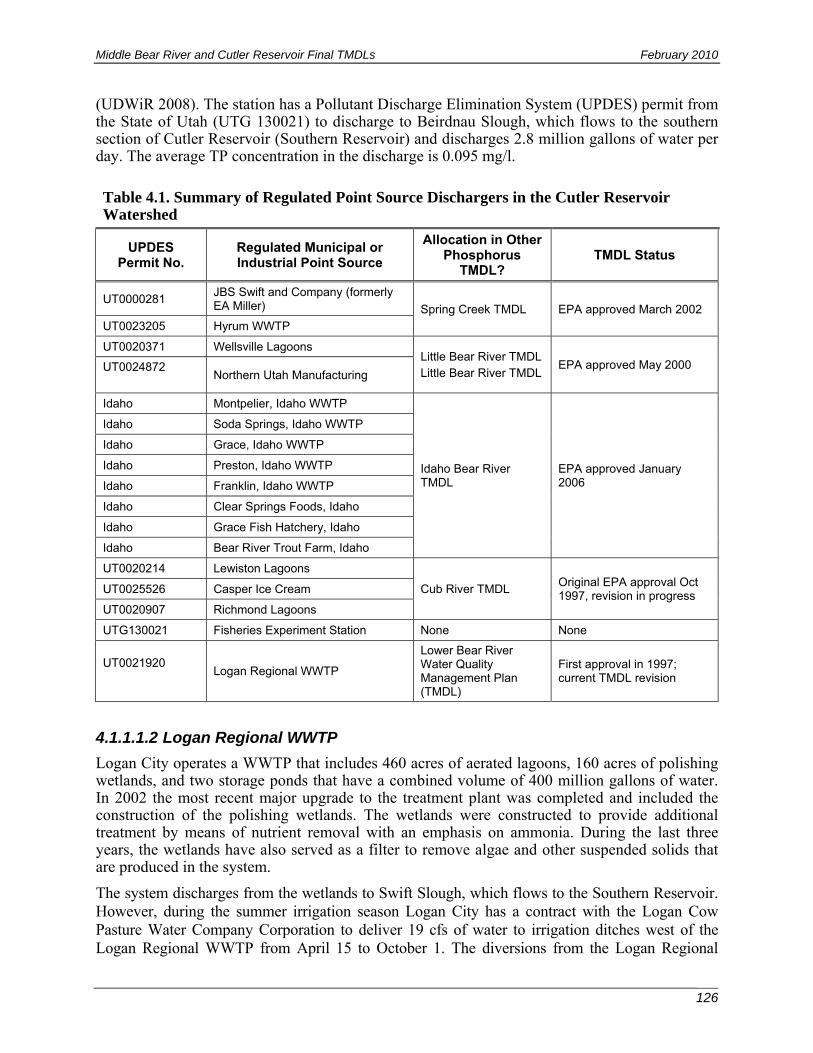
Middle Bear River and Cutler Reservoir Final TMDLs February 2010
126
(UDWiR 2008). The station has a Pollutant Discharge Elimination System (UPDES) permit from the State of Utah (UTG 130021) to discharge to Beirdnau Slough, which flows to the southern section of Cutler Reservoir (Southern Reservoir) and discharges 2.8 million gallons of water per day. The average TP concentration in the discharge is 0.095 mg/l.
4.1.1.1.2 Logan Regional WWTP Logan City operates a WWTP that includes 460 acres of aerated lagoons, 160 acres of polishing wetlands, and two storage ponds that have a combined volume of 400 million gallons of water. In 2002 the most recent major upgrade to the treatment plant was completed and included the construction of the polishing wetlands. The wetlands were constructed to provide additional treatment by means of nutrient removal with an emphasis on ammonia. During the last three years, the wetlands have also served as a filter to remove algae and other suspended solids that are produced in the system.
The system discharges from the wetlands to Swift Slough, which flows to the Southern Reservoir. However, during the summer irrigation season Logan City has a contract with the Logan Cow Pasture Water Company Corporation to deliver 19 cfs of water to irrigation ditches west of the Logan Regional WWTP from April 15 to October 1. The diversions from the Logan Regional
Table 4.1. Summary of Regulated Point Source Dischargers in the Cutler Reservoir Watershed
UPDES Permit No.
Regulated Municipal or Industrial Point Source
Allocation in Other Phosphorus
TMDL? TMDL Status
UT0000281 JBS Swift and Company (formerly EA Miller) Spring Creek TMDL EPA approved March 2002
UT0023205 Hyrum WWTP
UT0020371 Wellsville Lagoons Little Bear River TMDL Little Bear River TMDL
EPA approved May 2000 UT0024872
Northern Utah Manufacturing
Idaho Montpelier, Idaho WWTP
Idaho Bear River TMDL
EPA approved January 2006
Idaho Soda Springs, Idaho WWTP
Idaho Grace, Idaho WWTP
Idaho Preston, Idaho WWTP
Idaho Franklin, Idaho WWTP
Idaho Clear Springs Foods, Idaho
Idaho Grace Fish Hatchery, Idaho
Idaho Bear River Trout Farm, Idaho
UT0020214 Lewiston Lagoons
Cub River TMDL Original EPA approval Oct 1997, revision in progress
UT0025526 Casper Ice Cream
UT0020907 Richmond Lagoons
UTG130021 Fisheries Experiment Station None None
UT0021920
Logan Regional WWTP
Lower Bear River Water Quality Management Plan (TMDL)
First approval in 1997; current TMDL revision

Middle Bear River and Cutler Reservoir Final TMDLs February 2010
127
WWTP occur along a canal that connects the lagoon and wetland components of the treatment system. This water is disinfected by chlorine and then de-chlorinated before it enters the irrigation canal. Head gates at irrigation ditches along the canal are controlled by Logan City and are opened during the irrigation season to deliver 19 cfs. Once the water enters the main irrigation ditches, farmers direct the water into smaller ditches and laterals for flood irrigation of fields. A significant portion of the water returns to irrigation ditches via irrigation return flow and eventually drains directly into Cutler Reservoir. In addition, during periods of harvest, irrigators do not use the water released from the canal and it flows directly from the WWTP canal to Cutler Reservoir via irrigation ditches. During periods when water is not diverted for irrigation, the water flows from the Logan Regional WWTP lagoons to a large screw pump station that delivers the water to the constructed wetlands for polishing prior to discharge to Swift Slough.
4.1.1.2 Municipal Stormwater (MS4 Permits)
Stormwater discharges from urban areas consist of concentrated flows that accumulate from streets, parking areas, rooftops, and other impervious areas. Constituents included within this flow and transported during storm events include oils and grease from vehicles, sediment and nutrients, and organic materials. Discharges from municipal separate storm sewer systems (MS4s) are permitted under the Utah General Stormwater Permit for Small Dischargers, issued December 9, 2002. Under the General Permit, a municipality may discharge stormwater to a water of the State of Utah as long as the discharge does not increase the potential to impair the waterbody as defined by its DBUs and water quality standards. Primary sources of pollutants associated with rural subdivisions consist of sediment and nutrients in both dissolved and sediment-bound forms from roadways and impervious surface runoff as well as snowmelt, irrigation practices, and yard and vehicle maintenance. The unincorporated areas within Cache County are under the jurisdiction of the Cache County Planning and Zoning Department and the requirements of county code.
Limited data exist from municipal areas in the Cutler Reservoir watershed to characterize stormwater loads to the surface water system during precipitation and snowmelt events. The municipalities of Logan, Smithfield, and Hyrum have MS4 systems that discharge directly to surface waters of Utah (personal communication between Hope Hornbeck, SWCA, and the City of Hyde Park public works director, May 2009). These three municipalities represent the majority of areas with urban land uses. The other small municipalities do not have any stormwater systems to direct stormwater to a concentrated outfall, and runoff occurs throughout them. Mixed within the urban areas are other land uses such as suburban and small agricultural lands that may include irrigated acreages and animal production activities. Logan City is currently collecting water quality data related to stormwater runoff.
According to a stormwater study completed in Cache County (JUB Engineers 2003), stormwater conveyance in the basin is very complex, and there is currently no regional planning to address it. Basin-wide irrigation canals that generally run north and south receive and convey stormwater across municipal areas. Stormwater from one city is conveyed through the canals across city boundaries into adjacent cities. The canals make up the backbone of the stormwater system in Cache County because most of the runoff ultimately ends up in the canals. The major canals run primarily along the east bench of the valley and distribute water throughout the valley. Stormwater accumulates and flows primarily to the west, where it is intercepted. Select major canals within the valley are listed in Table 4.2. According to JUB (2003), stormwater systems generally consist of curb and gutter, culverts, ditches, and swales that discharge into one of the canals. There are also some piped sections and a few detention basins that empty directly into canals or streams.
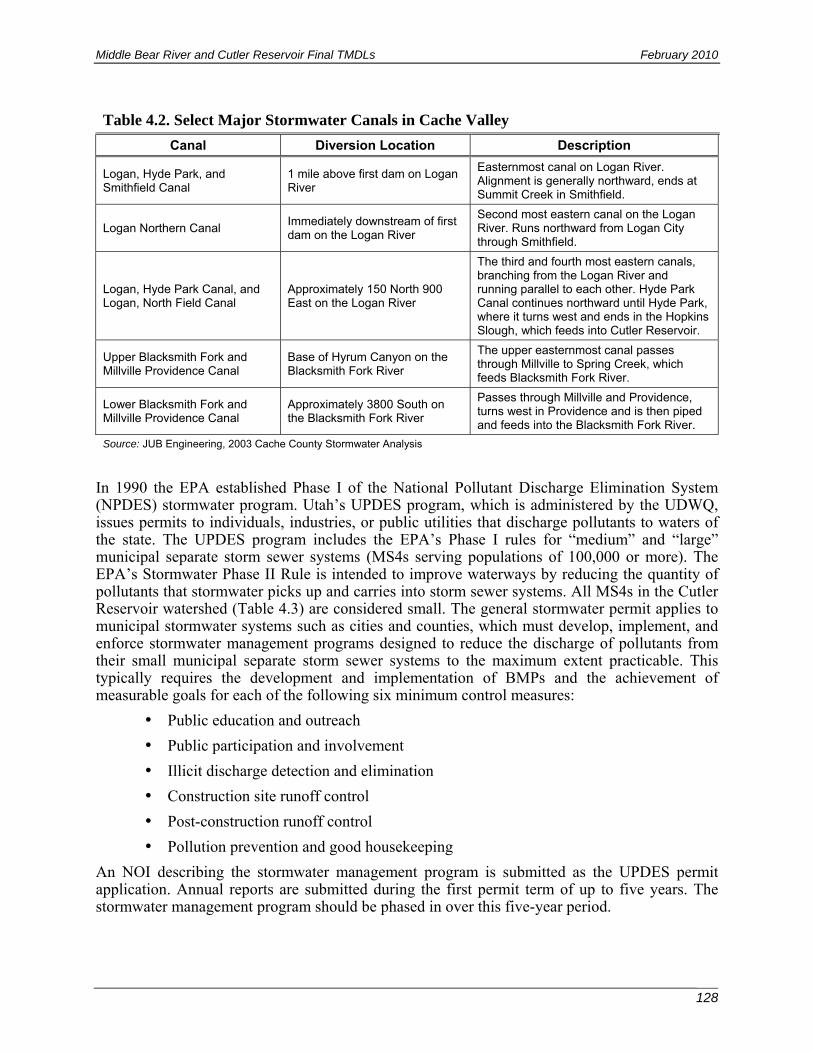
Middle Bear River and Cutler Reservoir Final TMDLs February 2010
128
Table 4.2. Select Major Stormwater Canals in Cache Valley
Canal Diversion Location Description
Logan, Hyde Park, and Smithfield Canal
1 mile above first dam on Logan River
Easternmost canal on Logan River. Alignment is generally northward, ends at Summit Creek in Smithfield.
Logan Northern Canal Immediately downstream of first dam on the Logan River
Second most eastern canal on the Logan River. Runs northward from Logan City through Smithfield.
Logan, Hyde Park Canal, and Logan, North Field Canal
Approximately 150 North 900 East on the Logan River
The third and fourth most eastern canals, branching from the Logan River and running parallel to each other. Hyde Park Canal continues northward until Hyde Park, where it turns west and ends in the Hopkins Slough, which feeds into Cutler Reservoir.
Upper Blacksmith Fork and Millville Providence Canal
Base of Hyrum Canyon on the Blacksmith Fork River
The upper easternmost canal passes through Millville to Spring Creek, which feeds Blacksmith Fork River.
Lower Blacksmith Fork and Millville Providence Canal
Approximately 3800 South on the Blacksmith Fork River
Passes through Millville and Providence, turns west in Providence and is then piped and feeds into the Blacksmith Fork River.
Source: JUB Engineering, 2003 Cache County Stormwater Analysis
In 1990 the EPA established Phase I of the National Pollutant Discharge Elimination System (NPDES) stormwater program. Utah’s UPDES program, which is administered by the UDWQ, issues permits to individuals, industries, or public utilities that discharge pollutants to waters of the state. The UPDES program includes the EPA’s Phase I rules for “medium” and “large” municipal separate storm sewer systems (MS4s serving populations of 100,000 or more). The EPA’s Stormwater Phase II Rule is intended to improve waterways by reducing the quantity of pollutants that stormwater picks up and carries into storm sewer systems. All MS4s in the Cutler Reservoir watershed (Table 4.3) are considered small. The general stormwater permit applies to municipal stormwater systems such as cities and counties, which must develop, implement, and enforce stormwater management programs designed to reduce the discharge of pollutants from their small municipal separate storm sewer systems to the maximum extent practicable. This typically requires the development and implementation of BMPs and the achievement of measurable goals for each of the following six minimum control measures:
• Public education and outreach
• Public participation and involvement
• Illicit discharge detection and elimination
• Construction site runoff control
• Post-construction runoff control
• Pollution prevention and good housekeeping
An NOI describing the stormwater management program is submitted as the UPDES permit application. Annual reports are submitted during the first permit term of up to five years. The stormwater management program should be phased in over this five-year period.

Middle Bear River and Cutler Reservoir Final TMDLs February 2010
129
Table 4.3. MS4 Stormwater Permits in the Cutler Reservoir Watershed (Cache County)
City Name Subwatershed Number
of Outfalls
Number of Illicit
Discharges
Phosphorus BMPs
Targeted Pollutants
Have BMPs Been
Developed for all MS4 Field Activities?
MS4 Status
Millville City Logan River 30 0 gas, oil, fertilizers, sediment No 2008 annual report
Nibley City Logan River, Spring Creek
19 0 vehicle spills, lawn chemicals, animal waste, construction sites
Yes 2008 annual report
Wellsville City
Little Bear River 27 0 runoff sediments, litter, illicit discharges
No 2008 annual report
Logan City
Logan River, direct drainage to Southern Reservoir, Mainstem Bear River
51 7 illicit discharges, construction No 2008 annual report
Providence City
Logan River not identified
not identified not identified No 2008 annual report
River Heights
Logan River 3 0 oil, grease, illicit discharges No 2008 annual report
Hyde Park City
Mainstem Bear River
0 0 stormwater runoff, sediment, lawn clippings
Yes 2008 annual report
North Logan City
Mainstem Bear River
not identified
no inspections
erosion and sediment controls; revegetation requirements
improperly used, stored, and disposed-of pollutants
Yes 2007 annual report
Smithfield City
Mainstem Bear River
18 0 lawn fertilizers, household hazardous wastes
Yes 2008 annual report
Hyrum City Corporation
Spring Creek 4 0 hazardous wastes, garbage, fertilizers, pesticides
Yes 2008 annual report

Middle Bear River and Cutler Reservoir Final TMDLs February 2010
130
This page intentionally blank.
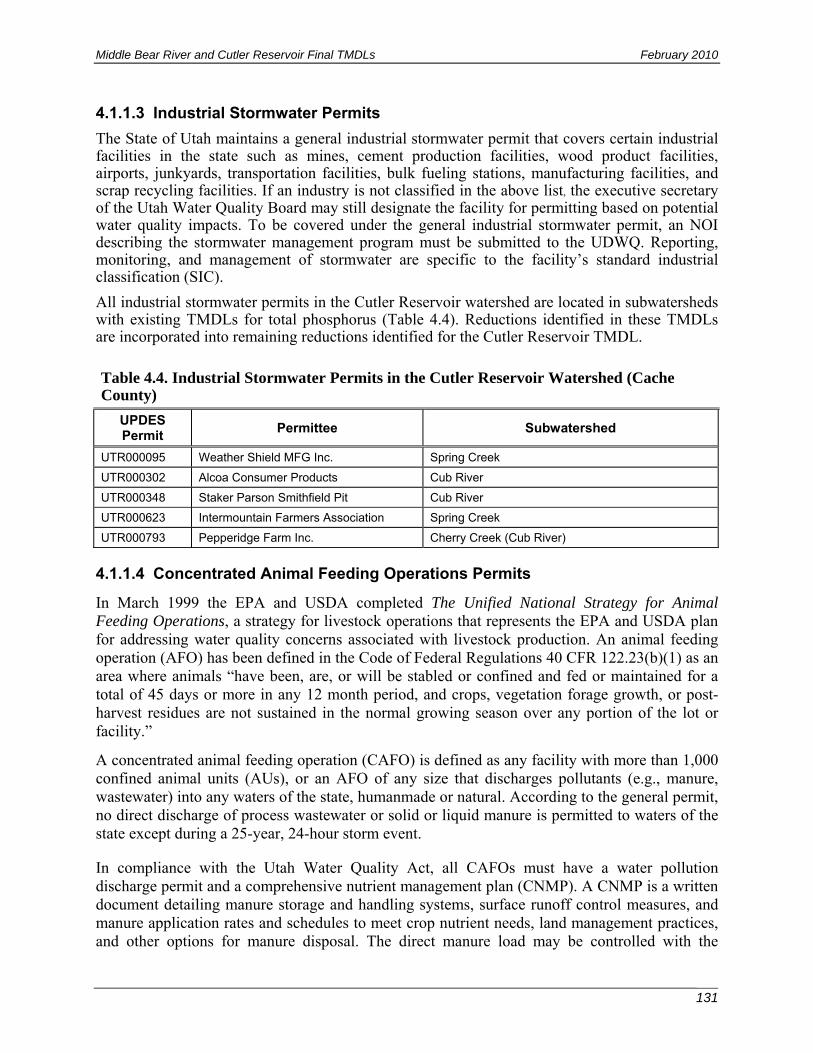
Middle Bear River and Cutler Reservoir Final TMDLs February 2010
131
4.1.1.3 Industrial Stormwater Permits
The State of Utah maintains a general industrial stormwater permit that covers certain industrial facilities in the state such as mines, cement production facilities, wood product facilities, airports, junkyards, transportation facilities, bulk fueling stations, manufacturing facilities, and scrap recycling facilities. If an industry is not classified in the above list, the executive secretary of the Utah Water Quality Board may still designate the facility for permitting based on potential water quality impacts. To be covered under the general industrial stormwater permit, an NOI describing the stormwater management program must be submitted to the UDWQ. Reporting, monitoring, and management of stormwater are specific to the facility’s standard industrial classification (SIC).
All industrial stormwater permits in the Cutler Reservoir watershed are located in subwatersheds with existing TMDLs for total phosphorus (Table 4.4). Reductions identified in these TMDLs are incorporated into remaining reductions identified for the Cutler Reservoir TMDL.
Table 4.4. Industrial Stormwater Permits in the Cutler Reservoir Watershed (Cache County)
UPDES Permit
Permittee Subwatershed
UTR000095 Weather Shield MFG Inc. Spring Creek
UTR000302 Alcoa Consumer Products Cub River
UTR000348 Staker Parson Smithfield Pit Cub River
UTR000623 Intermountain Farmers Association Spring Creek
UTR000793 Pepperidge Farm Inc. Cherry Creek (Cub River)
4.1.1.4 Concentrated Animal Feeding Operations Permits
In March 1999 the EPA and USDA completed The Unified National Strategy for Animal Feeding Operations, a strategy for livestock operations that represents the EPA and USDA plan for addressing water quality concerns associated with livestock production. An animal feeding operation (AFO) has been defined in the Code of Federal Regulations 40 CFR 122.23(b)(1) as an area where animals “have been, are, or will be stabled or confined and fed or maintained for a total of 45 days or more in any 12 month period, and crops, vegetation forage growth, or post-harvest residues are not sustained in the normal growing season over any portion of the lot or facility.”
A concentrated animal feeding operation (CAFO) is defined as any facility with more than 1,000 confined animal units (AUs), or an AFO of any size that discharges pollutants (e.g., manure, wastewater) into any waters of the state, humanmade or natural. According to the general permit, no direct discharge of process wastewater or solid or liquid manure is permitted to waters of the state except during a 25-year, 24-hour storm event.
In compliance with the Utah Water Quality Act, all CAFOs must have a water pollution discharge permit and a comprehensive nutrient management plan (CNMP). A CNMP is a written document detailing manure storage and handling systems, surface runoff control measures, and manure application rates and schedules to meet crop nutrient needs, land management practices, and other options for manure disposal. The direct manure load may be controlled with the
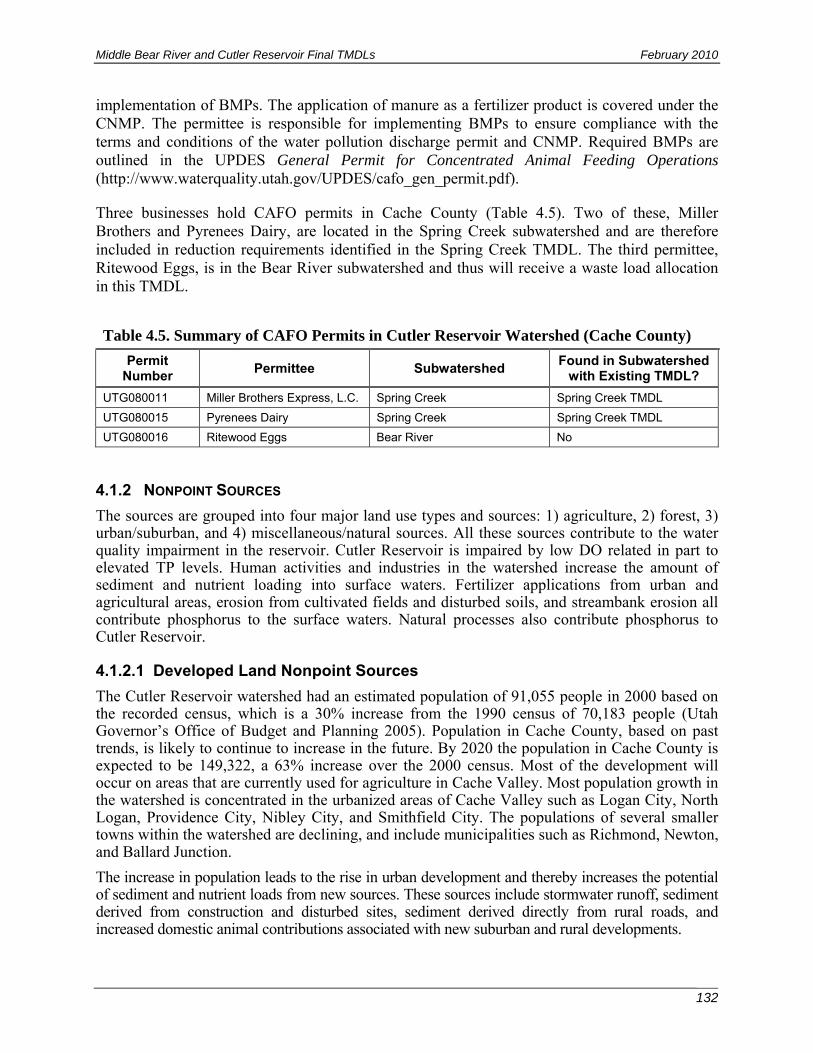
Middle Bear River and Cutler Reservoir Final TMDLs February 2010
132
implementation of BMPs. The application of manure as a fertilizer product is covered under the CNMP. The permittee is responsible for implementing BMPs to ensure compliance with the terms and conditions of the water pollution discharge permit and CNMP. Required BMPs are outlined in the UPDES General Permit for Concentrated Animal Feeding Operations (http://www.waterquality.utah.gov/UPDES/cafo_gen_permit.pdf).
Three businesses hold CAFO permits in Cache County (Table 4.5). Two of these, Miller Brothers and Pyrenees Dairy, are located in the Spring Creek subwatershed and are therefore included in reduction requirements identified in the Spring Creek TMDL. The third permittee, Ritewood Eggs, is in the Bear River subwatershed and thus will receive a waste load allocation in this TMDL.
Table 4.5. Summary of CAFO Permits in Cutler Reservoir Watershed (Cache County)
Permit Number
Permittee Subwatershed Found in Subwatershed
with Existing TMDL?
UTG080011 Miller Brothers Express, L.C. Spring Creek Spring Creek TMDL
UTG080015 Pyrenees Dairy Spring Creek Spring Creek TMDL
UTG080016 Ritewood Eggs Bear River No
4.1.2 NONPOINT SOURCES
The sources are grouped into four major land use types and sources: 1) agriculture, 2) forest, 3) urban/suburban, and 4) miscellaneous/natural sources. All these sources contribute to the water quality impairment in the reservoir. Cutler Reservoir is impaired by low DO related in part to elevated TP levels. Human activities and industries in the watershed increase the amount of sediment and nutrient loading into surface waters. Fertilizer applications from urban and agricultural areas, erosion from cultivated fields and disturbed soils, and streambank erosion all contribute phosphorus to the surface waters. Natural processes also contribute phosphorus to Cutler Reservoir.
4.1.2.1 Developed Land Nonpoint Sources
The Cutler Reservoir watershed had an estimated population of 91,055 people in 2000 based on the recorded census, which is a 30% increase from the 1990 census of 70,183 people (Utah Governor’s Office of Budget and Planning 2005). Population in Cache County, based on past trends, is likely to continue to increase in the future. By 2020 the population in Cache County is expected to be 149,322, a 63% increase over the 2000 census. Most of the development will occur on areas that are currently used for agriculture in Cache Valley. Most population growth in the watershed is concentrated in the urbanized areas of Cache Valley such as Logan City, North Logan, Providence City, Nibley City, and Smithfield City. The populations of several smaller towns within the watershed are declining, and include municipalities such as Richmond, Newton, and Ballard Junction.
The increase in population leads to the rise in urban development and thereby increases the potential of sediment and nutrient loads from new sources. These sources include stormwater runoff, sediment derived from construction and disturbed sites, sediment derived directly from rural roads, and increased domestic animal contributions associated with new suburban and rural developments.

Middle Bear River and Cutler Reservoir Final TMDLs February 2010
133
4.1.2.2 On-site Wastewater Treatment Systems (Septic Systems)
Large tracts of urban and residential development have been completed in the center portion of Cache Valley. Most of this development is associated with the Logan City area, where the majority of urban and residential developments have access to sewer hookups. However, a significant number of homes within the watershed rely on septic systems to treat household effluent. These on-site wastewater treatment systems have the potential to contribute nutrients to streams in the watershed, especially where they are installed in close proximity to existing waterways, where they are installed incorrectly, or where they fail.
A study completed by the UGS (Lowe et al. 2003) determined appropriate septic system density on a per-acre basis. The proficiency of the soils to treat leachfield effluent is dependant upon a number of factors such as percolation rate and depth to groundwater. Installing leachfields using generally accepted design requirements for slope, soil characteristics and permeability, and vertical separation distances between the septic effluent distribution pipes and seasonal high groundwater depth, reduces the potential for exceedance of the soils’ sorptive capacity, and is generally effective at minimizing TP movement into groundwater (Canter and Knox 1985). These factors led to the determination of septic density recommendations established by the UGS (see Appendix F: Figure F-18). The septic system density classifications include one-third, one-fifth, and one-tenth systems per acre (one septic system per 3, 5, or 10 acres, respectively). The recommended septic density in the remaining foothill and mountainous regions within the basin is one septic system per 40 acres (Lowe et al. 2003). If the density of home sites is too high, there is the potential for seasonal high groundwater tables to increase the mobilization of phosphorus, where ultimately it is transported from septic tank effluent to the surface water system and eventually to Cutler Reservoir.
4.1.2.3 Agricultural Nonpoint Sources
Primary sources of pollutants associated with agriculture consist of sediment and nutrients present in dissolved, organic, and particulate forms resulting from irrigation, cropping, pasturing, and small farms (Table 4.6). Related impacts are alteration of stream flows and temperatures from activities that directly influence the riparian area. The generation and transport of pollutants from agricultural nonpoint sources are influenced by the following:
• Health of riparian areas through which water flows • Overland flow from runoff and snowmelt • Irrigation practices • Pasture and rangeland management • Fertilizer application • Location of irrigation ditches or canals that intercept surface waters • Soil type and conditions • Cultivation methods • Crop stage and density • Land slope and direction • BMPs (filter strips, detention areas, wells, contour farming, terracing, etc.)
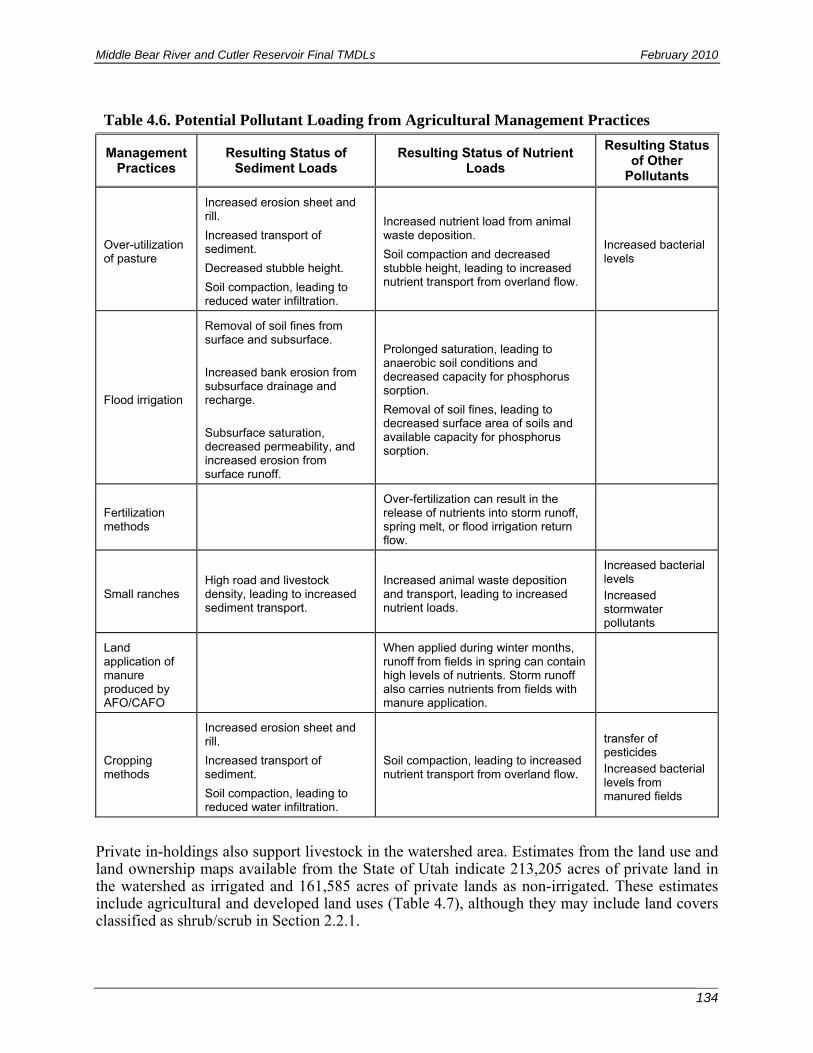
Middle Bear River and Cutler Reservoir Final TMDLs February 2010
134
Table 4.6. Potential Pollutant Loading from Agricultural Management Practices
Management Practices
Resulting Status of Sediment Loads
Resulting Status of Nutrient Loads
Resulting Status of Other
Pollutants
Over-utilization of pasture
Increased erosion sheet and rill.
Increased transport of sediment.
Decreased stubble height.
Soil compaction, leading to reduced water infiltration.
Increased nutrient load from animal waste deposition.
Soil compaction and decreased stubble height, leading to increased nutrient transport from overland flow.
Increased bacterial levels
Flood irrigation
Removal of soil fines from surface and subsurface. Increased bank erosion from subsurface drainage and recharge. Subsurface saturation, decreased permeability, and increased erosion from surface runoff.
Prolonged saturation, leading to anaerobic soil conditions and decreased capacity for phosphorus sorption.
Removal of soil fines, leading to decreased surface area of soils and available capacity for phosphorus sorption.
Fertilization methods
Over-fertilization can result in the release of nutrients into storm runoff, spring melt, or flood irrigation return flow.
Small ranches High road and livestock density, leading to increased sediment transport.
Increased animal waste deposition and transport, leading to increased nutrient loads.
Increased bacterial levels Increased stormwater pollutants
Land application of manure produced by AFO/CAFO
When applied during winter months, runoff from fields in spring can contain high levels of nutrients. Storm runoff also carries nutrients from fields with manure application.
Cropping methods
Increased erosion sheet and rill.
Increased transport of sediment.
Soil compaction, leading to reduced water infiltration.
Soil compaction, leading to increased nutrient transport from overland flow.
transfer of pesticides Increased bacterial levels from manured fields
Private in-holdings also support livestock in the watershed area. Estimates from the land use and land ownership maps available from the State of Utah indicate 213,205 acres of private land in the watershed as irrigated and 161,585 acres of private lands as non-irrigated. These estimates include agricultural and developed land uses (Table 4.7), although they may include land covers classified as shrub/scrub in Section 2.2.1.
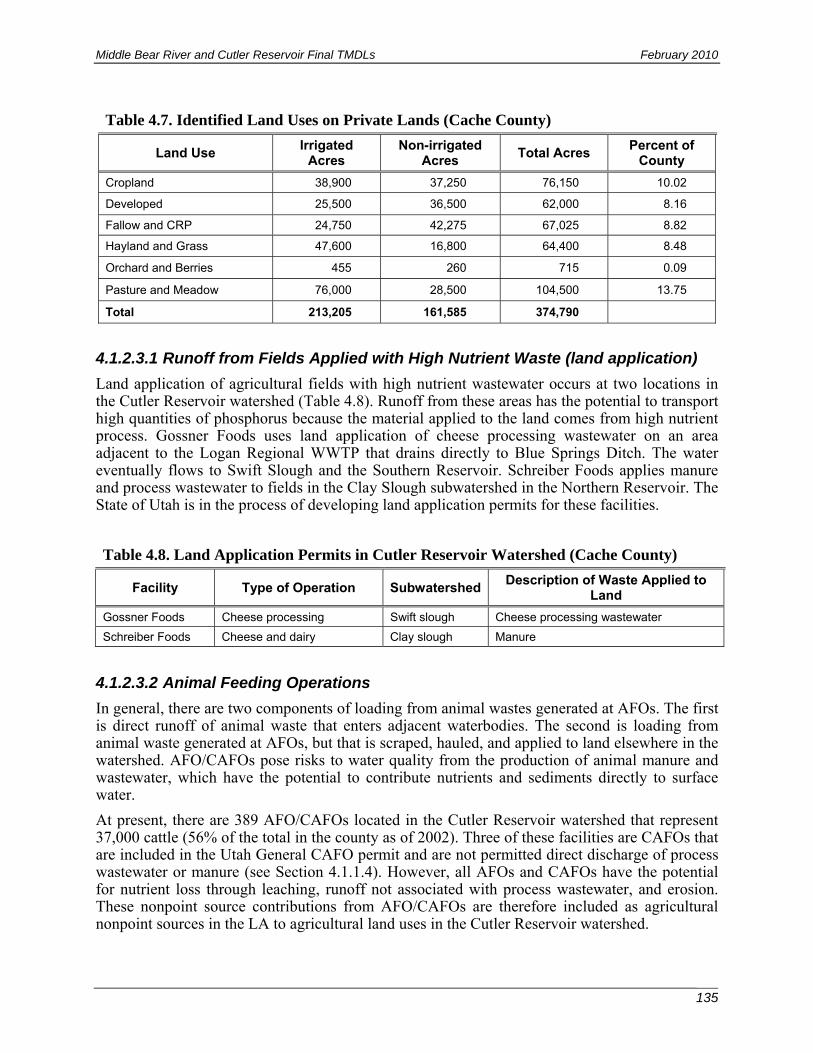
Middle Bear River and Cutler Reservoir Final TMDLs February 2010
135
Table 4.7. Identified Land Uses on Private Lands (Cache County)
Land Use Irrigated
Acres Non-irrigated
Acres Total Acres
Percent of County
Cropland 38,900 37,250 76,150 10.02
Developed 25,500 36,500 62,000 8.16
Fallow and CRP 24,750 42,275 67,025 8.82
Hayland and Grass 47,600 16,800 64,400 8.48
Orchard and Berries 455 260 715 0.09
Pasture and Meadow 76,000 28,500 104,500 13.75
Total 213,205 161,585 374,790
4.1.2.3.1 Runoff from Fields Applied with High Nutrient Waste (land application) Land application of agricultural fields with high nutrient wastewater occurs at two locations in the Cutler Reservoir watershed (Table 4.8). Runoff from these areas has the potential to transport high quantities of phosphorus because the material applied to the land comes from high nutrient process. Gossner Foods uses land application of cheese processing wastewater on an area adjacent to the Logan Regional WWTP that drains directly to Blue Springs Ditch. The water eventually flows to Swift Slough and the Southern Reservoir. Schreiber Foods applies manure and process wastewater to fields in the Clay Slough subwatershed in the Northern Reservoir. The State of Utah is in the process of developing land application permits for these facilities.
4.1.2.3.2 Animal Feeding Operations In general, there are two components of loading from animal wastes generated at AFOs. The first is direct runoff of animal waste that enters adjacent waterbodies. The second is loading from animal waste generated at AFOs, but that is scraped, hauled, and applied to land elsewhere in the watershed. AFO/CAFOs pose risks to water quality from the production of animal manure and wastewater, which have the potential to contribute nutrients and sediments directly to surface water.
At present, there are 389 AFO/CAFOs located in the Cutler Reservoir watershed that represent 37,000 cattle (56% of the total in the county as of 2002). Three of these facilities are CAFOs that are included in the Utah General CAFO permit and are not permitted direct discharge of process wastewater or manure (see Section 4.1.1.4). However, all AFOs and CAFOs have the potential for nutrient loss through leaching, runoff not associated with process wastewater, and erosion. These nonpoint source contributions from AFO/CAFOs are therefore included as agricultural nonpoint sources in the LA to agricultural land uses in the Cutler Reservoir watershed.
Table 4.8. Land Application Permits in Cutler Reservoir Watershed (Cache County)
Facility Type of Operation SubwatershedDescription of Waste Applied to
Land
Gossner Foods Cheese processing Swift slough Cheese processing wastewater
Schreiber Foods Cheese and dairy Clay slough Manure

Middle Bear River and Cutler Reservoir Final TMDLs February 2010
136
In 2001 the Utah Department of Agriculture and Foods began implementing a statewide strategy and program to address water pollution issues related to animal feeding operations. Since 2000, in partnership with the Utah Association of Conservation Districts, Logan Field Office, most of the AFOs and CAFOs in the Cutler Reservoir watershed have been inventoried, and BMPs implemented where necessary to minimize impacts to water quality. Most of this work was funded by Environmental Quality Incentive Program (EQIP) and 319 nonpoint source pollution reduction grants with substantial cost-share contributions from landowners (personal communication between Erica Gaddis, SWCA, and Nathan Dauggs, Utah Association of Conservation Districts, Logan Field Office, May 29, 2008).
4.1.2.3.3 Runoff from Irrigated and Fertilized Agricultural Lands Impacts from cultivated agriculture within the watershed include irrigated lands used for crop production and may also include the impacts from fertilizers used to establish growth in newly seeded fields and soil erosion from disturbed or exposed soils during cultivation, seeding, or intense storm activity. Erosion hazard is closely linked to the topography because areas of steep slopes have a high risk of erosion and areas where slopes are gradual have a much lower risk of erosion. Farming practices, however, can increase the risk of erosion because the soils are disturbed and are more susceptible to erosion. Irrigation practices may also increase the mobility of soils because the use of flood irrigation will contribute to soil losses.
Irrigation of crops occurs within the valley floor of the watershed by diversion of surface water from streams into canal delivery systems, or by pumping groundwater into canals or irrigation systems. The primary sources of irrigation return flows to a surface water system include canal seepage, groundwater flow, surface water bypass flow, and irrigation tail water (EPA 1972). All of these flows have the potential to re-enter surface waters. Some of the returning flows, such as irrigation tail waters, may contain high concentrations of organic material, sediment, and nutrients. Other return flow sources may have little appreciable changes such as irrigation bypass flow that does not leave the irrigation canal.
Surface irrigation practices may substantially alter the water table and may lead to changes in the mobility of phosphorus within the shallow subsurface. Phosphorus has been observed to move more easily through soils that are consistently waterlogged because the majority of the iron present in these soils is reduced and sorption potential is decreased (Sharpley et al. 1995). Such irrigation practices create a substantially increased subsurface flow that facilitates transport. In addition, movement of water in subsurface layers results in the preferential loss and transport of fine, lightweight soil fractions (clay particles), which provide the primary phosphorus sorption sites in the soil. These particles carry a significant amount of sorbed phosphorus because they are removed and leave the remaining soil deficient in sorption sites. Therefore, not only is the subsurface water enriched directly through the sorbed phosphorus on the particulate, but further runoff from the original soils will be enriched due to the decrease in phosphorus sorption capacity (Hedley et al. 1995). In addition, phosphorus sorption-desorption characteristics, buffer capacity, and the sorption index of the transported sediments are altered in this process, and the equilibrium phosphorus content is usually enriched (Sharpely et al. 1995).
Inorganic dissolved phosphorus adsorbs to the surfaces of clay and CaCO3 minerals in alkaline soils and to iron and aluminum oxides and hydroxides in acidic soils. An equilibrium phosphorus concentration (EPC) is maintained by desorption, which buffers decreases in dissolved phosphorus due to leaching and plant uptake (McDowell and Sharpley 2001). Organic matter, iron oxides, and aluminum oxides determine the total available adsorption sites in a soil and thus the equilibrium phosphorus concentration for a soil at a given pH. Besides parent material, the most important factor determining the amount and forms of iron, aluminum, and calcium in a

Middle Bear River and Cutler Reservoir Final TMDLs February 2010
137
soil is the cation exchange capacity (CEC). CEC is a measure of a soil’s ability to maintain cations (e.g., Al3+, Ca, and Fe) and exchange them for H+ additions to the soil (thus buffering the pH). CEC results from the net negative charge found in clays, due to ionic substitutions within the clay (silicate) minerals, and hydroxide groups on the surface of clay particles that are relatively permanent. In temperate climates, CEC is also determined by soil organic matter, which come from the charged phenolic (-OH) and organic acid (-COOH) groups of humic substances. Without CEC, aluminum and iron would leach through the soil profile into the lower B and C horizons. Maintaining cations in the top layers of a soil profile increases the buffering capacity of the soil to absorb additional phosphates (through adsorption or precipitation depending on soil pH and reduction-oxidation), thus reducing the equilibrium phosphorus concentration (Schlesinger 1997).
When fertilizers are added to a soil, the goal is to outpace the natural buffering (precipitation) of the soil so that more phosphorus is available for plant uptake. In some cases, twice as much phosphorus than is required for crop production must be added to the soil to provide adequate available phosphorus due to fast precipitation rates (Magdoff et al. 1997). Clearly, if erosion or runoff occur during this period of dissolved phosphorus excess, significantly more phosphorus will be transported from the land than at other times of the year. The ability of soils to eventually fix or trap excess phosphorus is based on the existing level of phosphorus saturation (remaining adsorption sites), pH, and reduction-oxidation (Lindsay et al. 1989; Magdoff et al. 1997).
The relatively slow rate of phosphorus mineralization compared to fixation means that when organic forms of phosphorus (such as manures) are used to fertilize crops, significantly more phosphorus is added to the soil than is taken out by plant growth (Magdoff et al. 1997). In addition, phosphorus added from manures is typically fixed through adsorption to calcium-phosphorus crystals rather than precipitation. Eventually, this low utilization and over-fertilization of soils with both organic and inorganic phosphates can contribute to the saturation of soils. Because of this, much work has been done to develop a good method to determine the soil phosphorus threshold above which additional phosphorus is likely to remain dissolved and be released into surface waters (Magdoff et al. 1997; Jokela et al. 1998; Magdoff et al. 1999; Sharpley et al. 2001). Many agricultural soils (and wetlands) that receive large volumes of phosphorus inputs have already become “saturated” (Jokela et al. 1998; Sharpley et al. 2002). Once this occurs, significant amounts of time (hundreds to thousands of years) are required for noticeable depletion (Young and Ross 2001). This could be an important factor to consider when agricultural fields are flooded. Dissolved forms of phosphorus are increased in flood water due to the anoxic reducing environment in the soil, and in unsaturated soils these forms reprecipitate when they diffuse to the oxic side of the reduction-oxidation threshold at the surface of the soil (provided that the concentration of phosphate does not exceed the capacity of iron to reprecipitate). However, in soils with higher phosphorus levels and less organic matter, phosphorus is not reprecipitated and is transported from the land with floodwaters (Young and Ross 2001).
Subsurface return flows can also function as a nutrient source to surface waters. The fine, lightweight soil fractions preferentially removed from the subsurface through some irrigation practices are deposited in the flow channel after subsurface flows discharge to streams and tributaries. These waters generally contain high concentrations of phosphorus and nitrogen compared to ambient concentrations of local streams (Omernik et al. 1981; Shewmaker 1997). Natural processes maintain equilibrium between nutrient concentrations in the streambed sediment and nutrient concentrations in the flowing water. Thus, if nutrient concentrations in overlying water are smaller than nutrient concentrations in the deposited sediments, sorbed nutrients will be more readily dissolved by the flowing water. This process enriches tributary

Middle Bear River and Cutler Reservoir Final TMDLs February 2010
138
inflow concentrations to the reservoir and extends the peak nutrient-input period to the reservoir beyond the traditional irrigation season (Sonzongi 1982).
In addition, inefficient irrigation water management practices can reduce stream flows unnecessarily, resulting in increased water temperatures. Warmer water temperature contributes to the impairment on the warm water fishery (see Sections 6.3.6 and 6.5.2).
4.1.2.3.4 Runoff from Pasturelands Pasturelands are found along most of the major tributaries in the Cutler Reservoir watershed. Manure concentration per unit of land is relatively small, but the total grazed-land area is relatively large and follows major waterways such as the Bear River in the watershed. The phosphorus contained in manure is in a highly soluble, readily bioavailable form. Because of the high solubility, phosphorus loading and transport from a manured field can be 67 times higher than from a field that is not enriched with manure (Khaleel et al. 1980; Olness et al. 1975; Omernik et al. 1981; Reddell et al. 1971; Hedley et al. 1995; Sharpley et al. 1992).
As previously mentioned, although a small portion of the available phosphorus in plant material is used by grazing animals to grow and maintain bones and teeth, 60% to 95% of the phosphorus intake returns to the environment as manure (Magdoff et al. 1997). Manure has a slower physical decomposition rate than plant material on the surface. This results in increased accumulation of soluble phosphorus in a physically unstable form within the grazed area. Such deposition is especially noticeable when correlated with the spatial distribution of animals in grazing and bedding routines.
Reduced vegetative cover from overgrazing on private and public lands as well as sheet and rill erosion from storm events will result in increased sediment transport to streams and channels. Overuse of pastureland can result in subsurface compaction of soil as hoof action and animal weight create a pressure wave that compresses the soil profile, resulting in the formation of a dense layer of low permeability soil 12 to 15 inches below the upper soil horizon. During storm events and spring melt, water infiltration into this compacted layer is limited and the volume and velocity of overland flow increases, as does the associated sediment and nutrient load. Vegetation in overused pasture areas is often insufficient to retain sediment within overland flow and deposited manure is easily transported directly into water or downstream within existing stream and irrigation channels.
Estimates of the number of animals grazing on private lands in the watershed as of 2002 were obtained from the Utah Agriculture Census information (NASS 2008). In 2002 there were 65,950 cows on 546 farms in Cache County. Since 1997 these values represent a 14% decrease in cattle (from 76,692 cows) and a 28% decrease in farms with cattle (from 754 farms). In 2002, 10,704 cattle (16% of the total) were found on farms with a total of 100 cows or less. In addition, there were 7,278 hogs on 27 farms and 6,048 sheep on 48 farms. Data regarding poultry are withheld to protect privacy (NASS 2008).
Some animal operators graze animals in the lower valley pastures until May or June and then move them to public grazing allotments on state and federal lands or high-elevation private lands during the summer. The grazing allotments managed by the USFS are primarily used during the late spring through early fall. Other operations in the watershed keep cows on private grazing pastures or in animal feeding operations in the valley year-round.
4.1.2.3.5 Cattle in Streams, Riparian Areas, and Reservoir Shoreline If improperly managed, cattle grazing along streambanks and in the channel may exacerbate erosion in two major ways: 1) the shearing action of hooves on streambanks destabilizes the soil
Middle Bear River and Cutler Reservoir Final TMDLs February 2010
139
and increases the potential for significant erosion as loose sediments are rapidly removed by flowing water, and 2) grazing cattle remove or substantially reduce riparian vegetation (Platts and Nelson 1995). Erosional processes occurring in an ungrazed or forested watershed would require a significantly greater amount of time and transport to produce the same effect on bioavailable phosphorus loading than direct deposition of phosphorus-rich animal wastes into the channel or floodplain of a stream.
By destabilizing and eroding streambanks and by depositing manure and urine into surface waters, cattle affect riparian areas and stream channels through increased sediment and nutrient loading (Mosley et al. 1997). Bank erosion is accelerated where riparian vegetation has been removed or heavily grazed. Streambank vegetation serves to stabilize bank sediments and reduces the erosional force of flowing water. It also serves as a depositional area for sediment already in the stream. Water entering vegetated reaches slows down because of the resistance plant stems create within the flow path. As flow velocity decreases, larger sediment particles settle out within the riparian areas. Reduction or removal of riparian vegetation decreases bank stability through the loss of root mass within the soil profile and decreases settling and sedimentation at the edges of the stream channel. As a result, streambanks have become unstable in many stream reaches in the watershed. Related impacts include increased water temperatures in the tributaries due to removal of stream-side vegetation. Cattle in a grazed pasture rarely spread out and cover the entire acreage evenly; rather, they tend to congregate around areas where water is readily available (riparian areas and stream channels) and where forage is plentiful. Consequently, a greater proportion of manure is deposited in or nearby stream channels and riparian areas.
4.1.2.4 Runoff from Forested Lands
Grazing practices alter forested lands through soil compaction, manure deposition, and increased sediment and nutrient loading due to destabilization and erosion of forest soils. The USFS Wasatch-Cache National Forest maintains grazing allotments for private cattle in the upper reaches of the watershed. The contribution of grazing animals to nutrient concentrations in surface waters is discussed in previous sections.
Road construction and road use on forested allotments associated with forestry management contribute to dissolved and sediment-bound phosphorus. Sediment erosion from all-purpose forest roads and natural processes can be deposited in streams during low flow and rapidly re-suspended and transported to the reservoir during high-flow events (Megahan 1972 and 1979; Mahoney and Erman 1984; Whiting 1997). If not properly managed, these factors may result in increased sediment and phosphorus loading within the watershed. Careful management and BMPs can minimize the impact and duration of weather-related complications, including increased sediment loading that occurs periodically due to high-flow or fire events. Restriction of OHV use to designated routes away from waterways and drainage areas also reduces sediment loading due to soil erosion and bank destabilization.
4.1.2.5 Runoff from Rangelands
In the study area, the BLM has very limited areas of rangeland in the watershed. The only parcel of BLM grazing land is located east of Hyde Park and is approximately 53 acres. The parcel is managed by the BLM's Salt Lake City Field Office.
Production on rangeland in the watershed is estimated at 4 acres per AUM. The effects on water quality from rangeland management are similar to those from forest land management and pasturelands. See Section 4.1.2.5 for a complete discussion.

Middle Bear River and Cutler Reservoir Final TMDLs February 2010
140
4.1.3 SEASONAL INTERNAL RESERVOIR SOURCES
Phosphorus contained in reservoir bottom sediments represents a potentially significant source of phosphorus to the water column. The deposition, release, and dissolution of sediment-bound phosphorus are all dependent on physical, chemical, and biological processes in the watershed and reservoir. Physical processes dominate in the transport of phosphorus contained within or adsorbed to sediment and particulate matter. Chemical processes dominate in the transport of dissolved phosphorus and in the transformation of phosphorus from one form or state (i.e., free or adsorbed) to another, in both the transport pathway to the reservoir and to the water column.
Phosphorus in the water column can be divided into two major sources: 1) suspended sediment-bound phosphorus and 2) dissolved phosphorus. Suspended matter can be colloidal in nature (under 0.45 um in diameter) and can resist settling because the ratio of surface area to mass is high enough that internal buoyancy counteracts gravity. Sediment and organic matter that has settled to the reservoir bottom may also become re-suspended and may act as a source of dissolved phosphorus. Carp activity in the Southern Reservoir could be responsible for some re-suspension of sediments. Significant phosphorus release from bottom sediments has been observed under anaerobic conditions (personal communication between Erica Gaddis, SWCA, and Theron Miller, UDWQ, spring 2007). Phosphorus sorption sites are related to the charge state and concentration of iron and aluminum within sediment particles. Under anaerobic conditions, the charge state of these metals is changed, resulting in the release of bound phosphorus to the overlying water column as sorption potential is decreased (Sharpely et al. 1995). Therefore, low DO levels lead to sediment release of bound phosphorus.
Biological processes may also play an important role in the source-sink dynamics in Cutler Reservoir, especially in the Southern Reservoir where there are extensive stands of emergent wetland plants. During the spring, new macrophyte growth consumes some phosphorus which is maintained in plant tissues until the plants senesce in late fall. During senescence, some phosphorus is released back into the water column or bound to sediments while some phosphorus will remain bound in an organic form in decaying vegetation. Additional research is required to determine the magnitude of this seasonal flux.
The release of phosphorus from bottom sediments creates a time lag between watershed load reduction and improved reservoir water quality. Although the average recovery time of lakes is two to 10 years following external load reduction (Wetzel 1983), a reservoir with higher levels of internal loading can significantly increase the length of time needed for recovery, even at external loading rates at or below those prior to accelerated inputs.
4.1.4 PIPES DISCHARGING INTO CUTLER RESERVOIR AND TRIBUTARIES
PacifiCorp personnel and the UDWQ have identified a number of pipes that discharge water to Cutler Reservoir and its tributaries. The source of these pipes is unknown but could include field drains from agricultural fields, potentially illicit discharges of septic systems, drainages from barnyard areas, and/or return irrigation flow. A map of known pipe locations discharging to Cutler Reservoir is in Appendix F: Figure F-19.
4.1.5 STREAM EROSION AND RESERVOIR SHORELINE EROSION
Stream erosion in the drainage area is associated with cattle grazing in streams and riparian areas; agricultural land uses bordering streams and rivers that result in the removal and disruption of riparian vegetation; and peak stream flows (associated with storms and snowmelt) that cause stream downcutting in some areas and widening in others. Visual stream assessments on several creeks in the Newton Creek drainage and Spring Creek drainage indicate large portions of the stream to be in poor condition (85% in Newton Creek drainage; see Section 2.1.3.3.1).
Middle Bear River and Cutler Reservoir Final TMDLs February 2010
141
There is substantial agricultural activity on the lands directly surrounding Cutler Reservoir. Erosion due to agricultural practices such as livestock grazing and removal of shoreline vegetative buffers is extensive. Erosive forces such as reservoir wave action can cause banks to recede, thereby resulting in loss of land and loss of vegetation cover. Shoreline erosion near popular recreation sites has been a problem in the past. Nutrients such as nitrogen and phosphorus from eroded soils could also contribute to water quality impairments. PacifiCorp is actively working to reduce shoreline erosion through the establishment of shoreline buffers and bank stabilization practices. Progress was documented in the monitoring report prepared by PacifiCorp for the FERC in November 2002. Remobilization of sediment associated with mud flats, sand bars, and recently deposited sediments within Cutler Reservoir provide an additional mechanism for generating an internal phosphorus load. This remobilization may be associated with peak river flows during spring melt and storms. Sediment deposition and remobilization by the wind, recreational users, and carp may also generate substantial erosion from within the reservoir.
4.1.6 ATMOSPHERIC SOURCES
Phosphorus does not have a gaseous state; however, phosphorus contained in dust particles in the atmosphere can contribute a small load of phosphorus to the landscape and directly to waterbodies.
4.1.7 NATURAL BACKGROUND SOURCES
Natural background loads are those nutrient loads that would naturally occur under undisturbed conditions. Natural processes that contribute to background sources consist of weathering of bedrock and surficial geologic formations, atmospheric deposition, mobilization via wildlife deposition, natural sheet and rill erosion of soils, and stream channel formation. The predominant lithology consists of intrusive igneous rocks, extrusive igneous rocks, and hydrothermal mineral deposits, with some minor amounts of limestone and other sedimentary rocks. Apatite, a common phosphate mineral, is widely distributed in all rock types.
4.2 METHODOLOGY AND MODELING TOOLS USED IN LOAD ANALYSIS
4.2.1 EXTENT OF ANALYSIS
The timeframe considered representative of current loads to Cutler Reservoir is 1995 to 2006 (defined in Chapter 3 as the current period of record). All summaries of water quality and hydrologic data in this load analysis are specific to this timeframe and define the period of study for this TMDL. Annual loads have been separated into two seasons: summer (May–October) and winter (November–April) as defined in Chapter 3. These seasons roughly represent the irrigation vs. non-irrigation season as well as the algal growth vs. non-algal growth season in the reservoir. Since DO excursions have been isolated to the summer season, this period is the critical season in terms of reducing algal growth throughout Cutler Reservoir. However, reduced TP concentrations at the dam are required to comply with the Lower Bear River TMDL year-round. This downstream TMDL will dictate TP reductions for the winter season.
Cutler Reservoir was divided into a Northern and Southern section based on water quality, morphometry, and habitat characteristics as described in Chapter 3. Therefore, modeling and analysis of water quality in the reservoir, and selected water quality endpoints are specific to these two areas.
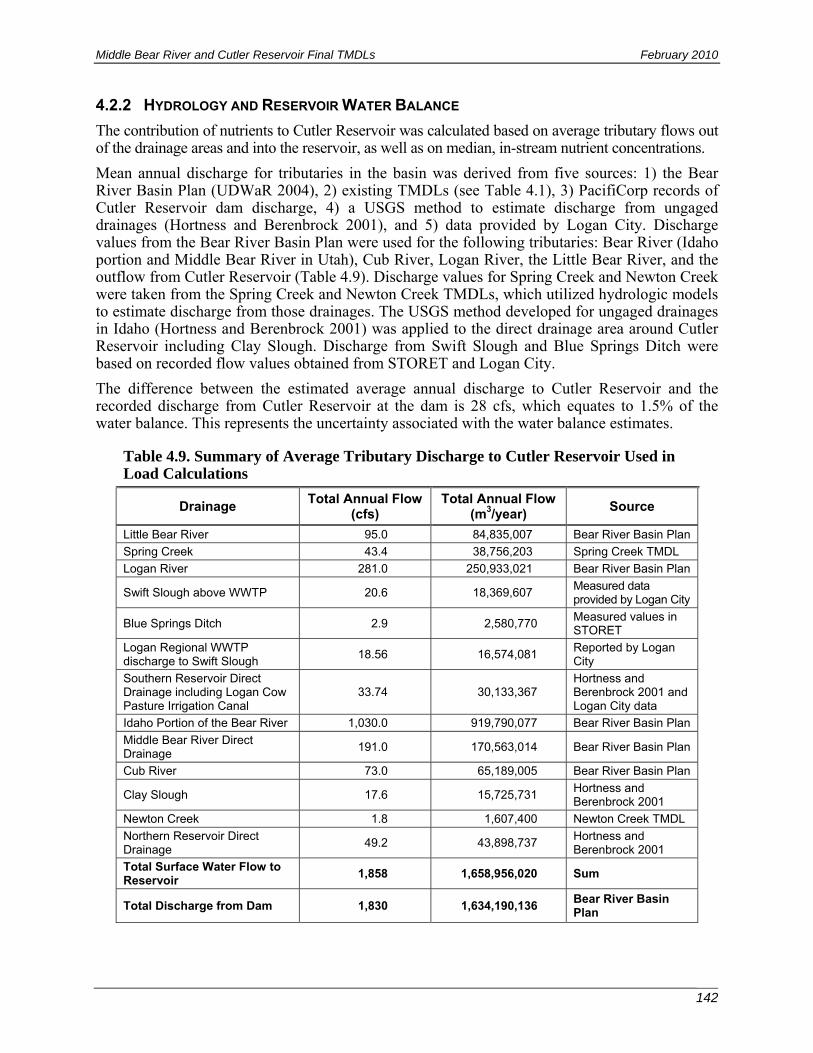
Middle Bear River and Cutler Reservoir Final TMDLs February 2010
142
4.2.2 HYDROLOGY AND RESERVOIR WATER BALANCE
The contribution of nutrients to Cutler Reservoir was calculated based on average tributary flows out of the drainage areas and into the reservoir, as well as on median, in-stream nutrient concentrations.
Mean annual discharge for tributaries in the basin was derived from five sources: 1) the Bear River Basin Plan (UDWaR 2004), 2) existing TMDLs (see Table 4.1), 3) PacifiCorp records of Cutler Reservoir dam discharge, 4) a USGS method to estimate discharge from ungaged drainages (Hortness and Berenbrock 2001), and 5) data provided by Logan City. Discharge values from the Bear River Basin Plan were used for the following tributaries: Bear River (Idaho portion and Middle Bear River in Utah), Cub River, Logan River, the Little Bear River, and the outflow from Cutler Reservoir (Table 4.9). Discharge values for Spring Creek and Newton Creek were taken from the Spring Creek and Newton Creek TMDLs, which utilized hydrologic models to estimate discharge from those drainages. The USGS method developed for ungaged drainages in Idaho (Hortness and Berenbrock 2001) was applied to the direct drainage area around Cutler Reservoir including Clay Slough. Discharge from Swift Slough and Blue Springs Ditch were based on recorded flow values obtained from STORET and Logan City.
The difference between the estimated average annual discharge to Cutler Reservoir and the recorded discharge from Cutler Reservoir at the dam is 28 cfs, which equates to 1.5% of the water balance. This represents the uncertainty associated with the water balance estimates.
Table 4.9. Summary of Average Tributary Discharge to Cutler Reservoir Used in Load Calculations
Drainage Total Annual Flow
(cfs) Total Annual Flow
(m3/year) Source
Little Bear River 95.0 84,835,007 Bear River Basin Plan
Spring Creek 43.4 38,756,203 Spring Creek TMDL
Logan River 281.0 250,933,021 Bear River Basin Plan
Swift Slough above WWTP 20.6 18,369,607 Measured data provided by Logan City
Blue Springs Ditch 2.9 2,580,770 Measured values in STORET
Logan Regional WWTP discharge to Swift Slough
18.56 16,574,081 Reported by Logan City
Southern Reservoir Direct Drainage including Logan Cow Pasture Irrigation Canal
33.74 30,133,367 Hortness and Berenbrock 2001 and Logan City data
Idaho Portion of the Bear River 1,030.0 919,790,077 Bear River Basin Plan
Middle Bear River Direct Drainage
191.0 170,563,014 Bear River Basin Plan
Cub River 73.0 65,189,005 Bear River Basin Plan
Clay Slough 17.6 15,725,731 Hortness and Berenbrock 2001
Newton Creek 1.8 1,607,400 Newton Creek TMDL
Northern Reservoir Direct Drainage
49.2 43,898,737 Hortness and Berenbrock 2001
Total Surface Water Flow to Reservoir
1,858 1,658,956,020 Sum
Total Discharge from Dam 1,830 1,634,190,136 Bear River Basin Plan
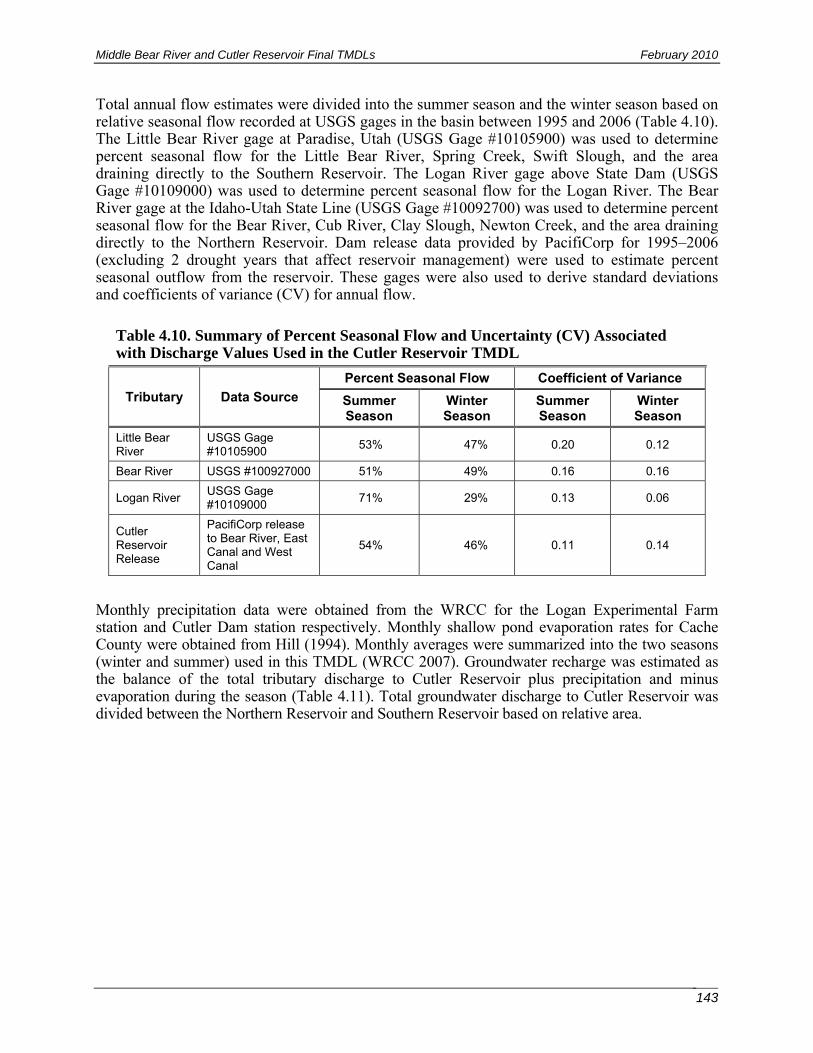
Middle Bear River and Cutler Reservoir Final TMDLs February 2010
143
Total annual flow estimates were divided into the summer season and the winter season based on relative seasonal flow recorded at USGS gages in the basin between 1995 and 2006 (Table 4.10). The Little Bear River gage at Paradise, Utah (USGS Gage #10105900) was used to determine percent seasonal flow for the Little Bear River, Spring Creek, Swift Slough, and the area draining directly to the Southern Reservoir. The Logan River gage above State Dam (USGS Gage #10109000) was used to determine percent seasonal flow for the Logan River. The Bear River gage at the Idaho-Utah State Line (USGS Gage #10092700) was used to determine percent seasonal flow for the Bear River, Cub River, Clay Slough, Newton Creek, and the area draining directly to the Northern Reservoir. Dam release data provided by PacifiCorp for 1995–2006 (excluding 2 drought years that affect reservoir management) were used to estimate percent seasonal outflow from the reservoir. These gages were also used to derive standard deviations and coefficients of variance (CV) for annual flow.
Table 4.10. Summary of Percent Seasonal Flow and Uncertainty (CV) Associated with Discharge Values Used in the Cutler Reservoir TMDL
Tributary Data Source
Percent Seasonal Flow Coefficient of Variance
Summer Season
Winter Season
Summer Season
Winter Season
Little Bear River
USGS Gage #10105900
53% 47% 0.20 0.12
Bear River USGS #100927000 51% 49% 0.16 0.16
Logan River USGS Gage #10109000
71% 29% 0.13 0.06
Cutler Reservoir Release
PacifiCorp release to Bear River, East Canal and West Canal
54% 46% 0.11 0.14
Monthly precipitation data were obtained from the WRCC for the Logan Experimental Farm station and Cutler Dam station respectively. Monthly shallow pond evaporation rates for Cache County were obtained from Hill (1994). Monthly averages were summarized into the two seasons (winter and summer) used in this TMDL (WRCC 2007). Groundwater recharge was estimated as the balance of the total tributary discharge to Cutler Reservoir plus precipitation and minus evaporation during the season (Table 4.11). Total groundwater discharge to Cutler Reservoir was divided between the Northern Reservoir and Southern Reservoir based on relative area.

Middle Bear River and Cutler Reservoir Final TMDLs February 2010
144
Table 4.11. Water Balance for the Cutler Reservoir System
Variable Reservoir Season Calculation
Method/Source Summer Winter
Evaporation Rate (m/season)
0.76 0.25 Hill 1994
Precipitation (m/season) 0.22 0.23 WRCC data
Reservoir Area (m2 & % of total area)
Southern 8,449,361
60% Derived from GIS
Northern 5,652,639
40%
Total Evaporation (m3/season)
Southern 6,421,514 2,112,340 Area x Evaporation Rate
Northern 4,296,006 1,413,160
Total Precipitation (m3/season)
Southern 1,832,666 1,960,252 Area x Precipitation Rate
Northern 1,226,057 1,311,412
Tributary Flow including direct drainage (m3/season)
Southern 278,441,418 161,109,590 See Table 4.5 and 4.7
Northern 621,888,127 595,778,838
Total Discharge from Reservoir (m3/season)
882,462,673 751,727,463 Bear River Basin Plan divided into seasons (Table 4.5, 4.7)
Uncertainty 10,208,075 4,907,129 Quc = Qr - Qt - P + E
Qr= total discharge from reservoir, Qt=tributary flow including direct drainage, P=total precipitation, E=total evaporation; Quc- uncertainty associated with estimates.
Table 4.12 summarizes the seasonal discharge estimates used in the development of the Cutler Reservoir TMDL.
Table 4.12. Summary of Daily Flow Values Used in the Cutler Reservoir TMDL
Drainage Summer Season
Winter Season
Gage Used for Seasonal Distribution and
Uncertainty Flow (m3/day)
Little Bear River 244,362 220,290 Little Bear
Spring Creek 111,635 100,638 Little Bear
Logan River 968,274 402,047 Logan River
Swift Slough 52,912 47,700 Little Bear
Blue Springs Ditch 7,434 6,701 Little Bear
Logan Regional WWTP* 16,730 34,485 None
Southern Reservoir Direct Drainage
111,922 78,247 Little Bear
Idaho Portion of the Bear River 2,549,418 2,490,039 Bear River
Middle Bear River 475,231 464,163 Bear River
Cub River 180,687 176,479 Bear River
Clay Slough 43,588 42,572 Bear River
Newton Creek 4,455 4,352 Bear River
Northern Reservoir Direct Drainage 126,447 113,991 Bear River
* See Section 4.2.5.

Middle Bear River and Cutler Reservoir Final TMDLs February 2010
145
4.2.3 WATER QUALITY
Water quality data are available for most of the tributaries in the watershed. Statistics for tributary water quality are described in more detail in Section 3.3. Water quality data for all tributaries were found to have a high degree of variability. Median concentrations more accurately represent the true central tendency of the data. For tributaries that had not been studied under a previous TMDL, the median water quality data from 1995 to 2006 (Tables 4.13 and 4.14) were combined with seasonal discharge estimates (Table 4.12) to determine the current load to Cutler Reservoir.
Table 4.13. Summary of Median Water Quality Data Collected during the Summer Season (May–October) during the Current Period of Record and Uncertainty (CV)
Tributary
Total Phosphorus
Dissolved Phosphorus
Nitrogen
mg/L CV mg/L CV TN
(mg/L) Inorganic N (mg/L)
CV
Bear River below Cutler Reservoir at UP&L Bridge
0.120 0.19 0.026* 0.28 0.270 0.172 0.29
Little Bear River at Mendon Road crossing
0.035 0.23 0.021 0.11 0.888 0.564 0.07
Spring Creek at Mendon Road crossing
0.595 0.07 0.550 0.09 2.726 1.730 0.09
Logan River above CNFL/Little Bear River at Mendon Road crossing
0.024 0.08 0.020 0.06 0.330 0.209 0.13
Swift Slough above Logan Regional WWTP
0.090 0.29 0.049 0.150 0.095 0.22
Bear River at Utah-Idaho Stateline (west of Fairview, Idaho)
0.040 0.09 0.020 0.11 Not estimated because not a direct input to the model.
Cub River above CNFL/Bear River east of old high school
0.089 0.22 0.038 0.22 Not estimated because not a direct input to the model.
Bear River above Cutler Reservoir at Bridge 1 mile west of Benson
0.079 0.07 0.020 0.07 0.485 0.308 0.40
Clay Slough above Bear River at CR Crossing (Sam Fellow Rd.)
0.621 0.15 0.119 0.34 0.200 0.127 0.14
Newton Creek 1 mile above Cutler Reservoir
0.103 0.30 0.040 0.31 0.835 0.530 0.04
Blue Springs Ditch above CNFL/Logan Lagoons Effluent
0.305 0.26 0.021 0.51 No data. Swift Slough above WWTP assumed to be representative of Blue Springs.
* Ortho-phosphate value used in place of dissolved P.
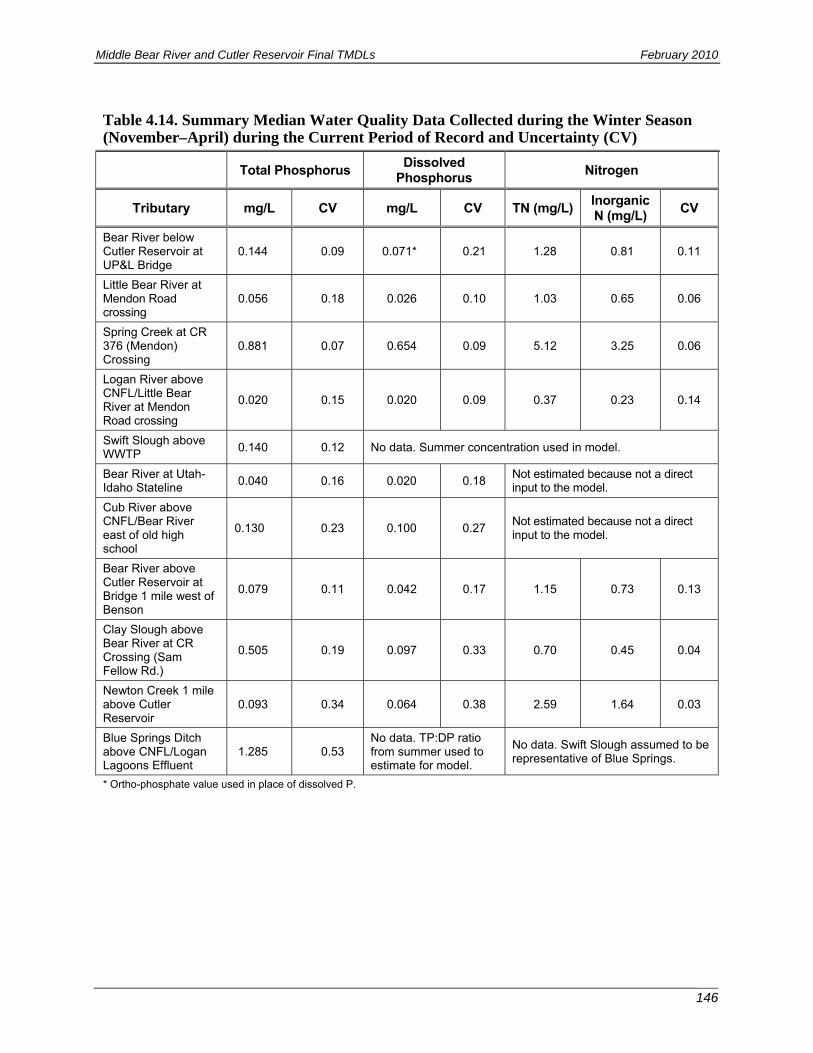
Middle Bear River and Cutler Reservoir Final TMDLs February 2010
146
Table 4.14. Summary Median Water Quality Data Collected during the Winter Season (November–April) during the Current Period of Record and Uncertainty (CV)
Total Phosphorus Dissolved
Phosphorus Nitrogen
Tributary mg/L CV mg/L CV TN (mg/L) Inorganic N (mg/L)
CV
Bear River below Cutler Reservoir at UP&L Bridge
0.144 0.09 0.071* 0.21 1.28 0.81 0.11
Little Bear River at Mendon Road crossing
0.056 0.18 0.026 0.10 1.03 0.65 0.06
Spring Creek at CR 376 (Mendon) Crossing
0.881 0.07 0.654 0.09 5.12 3.25 0.06
Logan River above CNFL/Little Bear River at Mendon Road crossing
0.020 0.15 0.020 0.09 0.37 0.23 0.14
Swift Slough above WWTP
0.140 0.12 No data. Summer concentration used in model.
Bear River at Utah-Idaho Stateline
0.040 0.16 0.020 0.18 Not estimated because not a direct input to the model.
Cub River above CNFL/Bear River east of old high school
0.130 0.23 0.100 0.27 Not estimated because not a direct input to the model.
Bear River above Cutler Reservoir at Bridge 1 mile west of Benson
0.079 0.11 0.042 0.17 1.15 0.73 0.13
Clay Slough above Bear River at CR Crossing (Sam Fellow Rd.)
0.505 0.19 0.097 0.33 0.70 0.45 0.04
Newton Creek 1 mile above Cutler Reservoir
0.093 0.34 0.064 0.38 2.59 1.64 0.03
Blue Springs Ditch above CNFL/Logan Lagoons Effluent
1.285 0.53 No data. TP:DP ratio from summer used to estimate for model.
No data. Swift Slough assumed to be representative of Blue Springs.
* Ortho-phosphate value used in place of dissolved P.
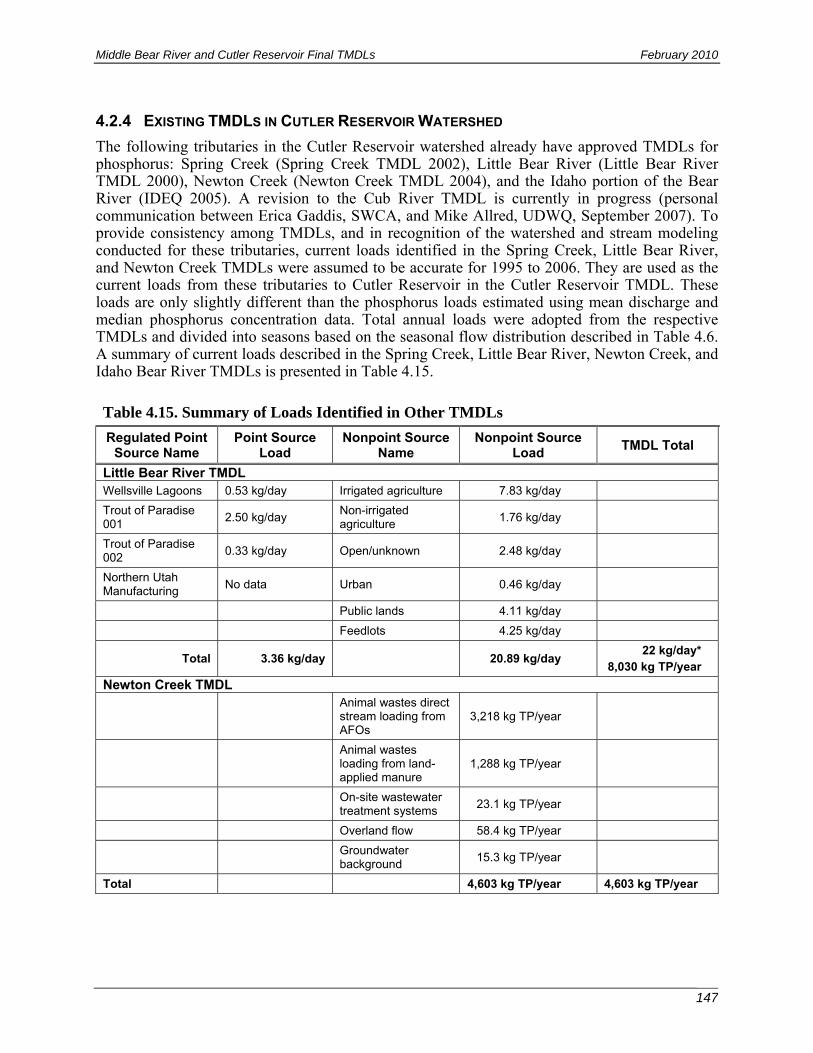
Middle Bear River and Cutler Reservoir Final TMDLs February 2010
147
4.2.4 EXISTING TMDLS IN CUTLER RESERVOIR WATERSHED
The following tributaries in the Cutler Reservoir watershed already have approved TMDLs for phosphorus: Spring Creek (Spring Creek TMDL 2002), Little Bear River (Little Bear River TMDL 2000), Newton Creek (Newton Creek TMDL 2004), and the Idaho portion of the Bear River (IDEQ 2005). A revision to the Cub River TMDL is currently in progress (personal communication between Erica Gaddis, SWCA, and Mike Allred, UDWQ, September 2007). To provide consistency among TMDLs, and in recognition of the watershed and stream modeling conducted for these tributaries, current loads identified in the Spring Creek, Little Bear River, and Newton Creek TMDLs were assumed to be accurate for 1995 to 2006. They are used as the current loads from these tributaries to Cutler Reservoir in the Cutler Reservoir TMDL. These loads are only slightly different than the phosphorus loads estimated using mean discharge and median phosphorus concentration data. Total annual loads were adopted from the respective TMDLs and divided into seasons based on the seasonal flow distribution described in Table 4.6. A summary of current loads described in the Spring Creek, Little Bear River, Newton Creek, and Idaho Bear River TMDLs is presented in Table 4.15.
Table 4.15. Summary of Loads Identified in Other TMDLs
Regulated Point Source Name
Point Source Load
Nonpoint Source Name
Nonpoint Source Load
TMDL Total
Little Bear River TMDL Wellsville Lagoons 0.53 kg/day Irrigated agriculture 7.83 kg/day
Trout of Paradise 001
2.50 kg/day Non-irrigated agriculture
1.76 kg/day
Trout of Paradise 002
0.33 kg/day Open/unknown 2.48 kg/day
Northern Utah Manufacturing
No data Urban 0.46 kg/day
Public lands 4.11 kg/day
Feedlots 4.25 kg/day
Total 3.36 kg/day 20.89 kg/day 22 kg/day*
8,030 kg TP/year
Newton Creek TMDL
Animal wastes direct stream loading from AFOs
3,218 kg TP/year
Animal wastes loading from land-applied manure
1,288 kg TP/year
On-site wastewater treatment systems
23.1 kg TP/year
Overland flow 58.4 kg TP/year
Groundwater background
15.3 kg TP/year
Total 4,603 kg TP/year 4,603 kg TP/year

Middle Bear River and Cutler Reservoir Final TMDLs February 2010
148
Spring Creek ConAgra 29,420 kg TP/year AFO/CAFO 1,390 kg TP/year
Regulated Point Source Name
Point Source Load
Nonpoint Source Name
Nonpoint Source Load
TMDL Total
Hyrum WWTP 3,630 kg TP/year Other agriculture 1,990 kg TP/year
Miller Brothers Feedlot
400 kg TP/year Urban 190 kg TP/year
Arambel Dairy 200 kg TP/year Groundwater 530 kg TP/year
Background 580 kg TP/year
Total 27,131* kg TP/year
Idaho Bear River Montpelier WWTP 521 kg TP/year Winter baseflow 188 kg/day
Soda Springs WWTP
1,033 kg TP/year Lower basin runoff 467 kg/day
Grace WWTP 84 kg TP/year Upper basin runoff 337 kg/day
Preston WWTP 1,617 kg TP/year Summer baseflow 112 kg/day
Franklin WWTP 43 kg TP/year
Clear Springs Foods
301 kg TP/year
Grace Fish Hatchery
0 kg TP/year
Bear River Trout Farm
54 kg TP/year Not calculated
*Note: Totals do not match sum of loads, presumably because in-stream processing has been accounted for in delivering loads to the outlets of the creeks. Total loads at the outlets were used in the Cutler TMDL. Sources were adjusted proportional based on difference between sum of sources and outlet load.
The loads identified in the Idaho Bear River TMDL are substantially higher than the loads calculated using monitoring data and hydrologic information. However, this TMDL was completed in 2001 and derives loads based on data from 1972 to 2000; therefore, it was found not to be representative of the current period of record for Bear River at the Idaho-Utah state line. Since completion of the TMDL in 2001, there have been substantial efforts to reduce loads from regulated point and nonpoint sources in Idaho. The current monitoring data reflects this improvement. Therefore, the Bear River load from Idaho was calculated using water quality data and mean hydrologic data.
4.2.5 WASTEWATER TREATMENT PLANTS
The majority of regulated point sources in the Cutler Reservoir watershed are accounted for in the other TMDLs in the watershed. The remaining two wastewater point sources in the drainage area are the Logan Regional WWTP and the Fisheries Experiment Station. These two sources have UPDES permits for discharge to Cutler Reservoir via Swift Slough and Bierdnau Slough respectively. Neither facility has a phosphorus discharge limit in their permit, although both are required to monitor effluent phosphorus concentrations. Data used to characterize the point source loads from the Fisheries Experiment Station were provided by the UDWQ permitting section. The permitting section maintains a database of reported flow and water quality by regulated discharges in the state. Mean TP data for the Fisheries Experiment Station were 0.1 mg/L with a mean daily flow of 2.8 million gallons from March 2005–April 2008.
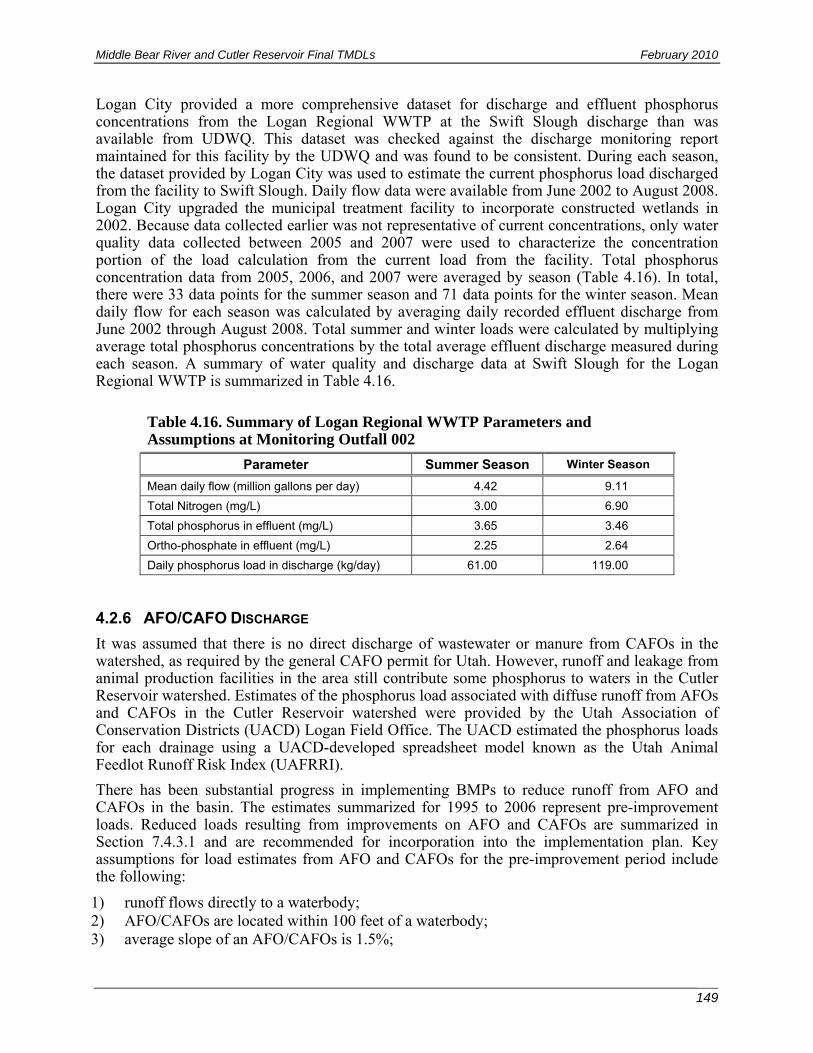
Middle Bear River and Cutler Reservoir Final TMDLs February 2010
149
Logan City provided a more comprehensive dataset for discharge and effluent phosphorus concentrations from the Logan Regional WWTP at the Swift Slough discharge than was available from UDWQ. This dataset was checked against the discharge monitoring report maintained for this facility by the UDWQ and was found to be consistent. During each season, the dataset provided by Logan City was used to estimate the current phosphorus load discharged from the facility to Swift Slough. Daily flow data were available from June 2002 to August 2008. Logan City upgraded the municipal treatment facility to incorporate constructed wetlands in 2002. Because data collected earlier was not representative of current concentrations, only water quality data collected between 2005 and 2007 were used to characterize the concentration portion of the load calculation from the current load from the facility. Total phosphorus concentration data from 2005, 2006, and 2007 were averaged by season (Table 4.16). In total, there were 33 data points for the summer season and 71 data points for the winter season. Mean daily flow for each season was calculated by averaging daily recorded effluent discharge from June 2002 through August 2008. Total summer and winter loads were calculated by multiplying average total phosphorus concentrations by the total average effluent discharge measured during each season. A summary of water quality and discharge data at Swift Slough for the Logan Regional WWTP is summarized in Table 4.16.
Table 4.16. Summary of Logan Regional WWTP Parameters and Assumptions at Monitoring Outfall 002
Parameter Summer Season Winter Season
Mean daily flow (million gallons per day) 4.42 9.11
Total Nitrogen (mg/L) 3.00 6.90
Total phosphorus in effluent (mg/L) 3.65 3.46
Ortho-phosphate in effluent (mg/L) 2.25 2.64
Daily phosphorus load in discharge (kg/day) 61.00 119.00
4.2.6 AFO/CAFO DISCHARGE
It was assumed that there is no direct discharge of wastewater or manure from CAFOs in the watershed, as required by the general CAFO permit for Utah. However, runoff and leakage from animal production facilities in the area still contribute some phosphorus to waters in the Cutler Reservoir watershed. Estimates of the phosphorus load associated with diffuse runoff from AFOs and CAFOs in the Cutler Reservoir watershed were provided by the Utah Association of Conservation Districts (UACD) Logan Field Office. The UACD estimated the phosphorus loads for each drainage using a UACD-developed spreadsheet model known as the Utah Animal Feedlot Runoff Risk Index (UAFRRI).
There has been substantial progress in implementing BMPs to reduce runoff from AFO and CAFOs in the basin. The estimates summarized for 1995 to 2006 represent pre-improvement loads. Reduced loads resulting from improvements on AFO and CAFOs are summarized in Section 7.4.3.1 and are recommended for incorporation into the implementation plan. Key assumptions for load estimates from AFO and CAFOs for the pre-improvement period include the following:
1) runoff flows directly to a waterbody; 2) AFO/CAFOs are located within 100 feet of a waterbody; 3) average slope of an AFO/CAFOs is 1.5%;
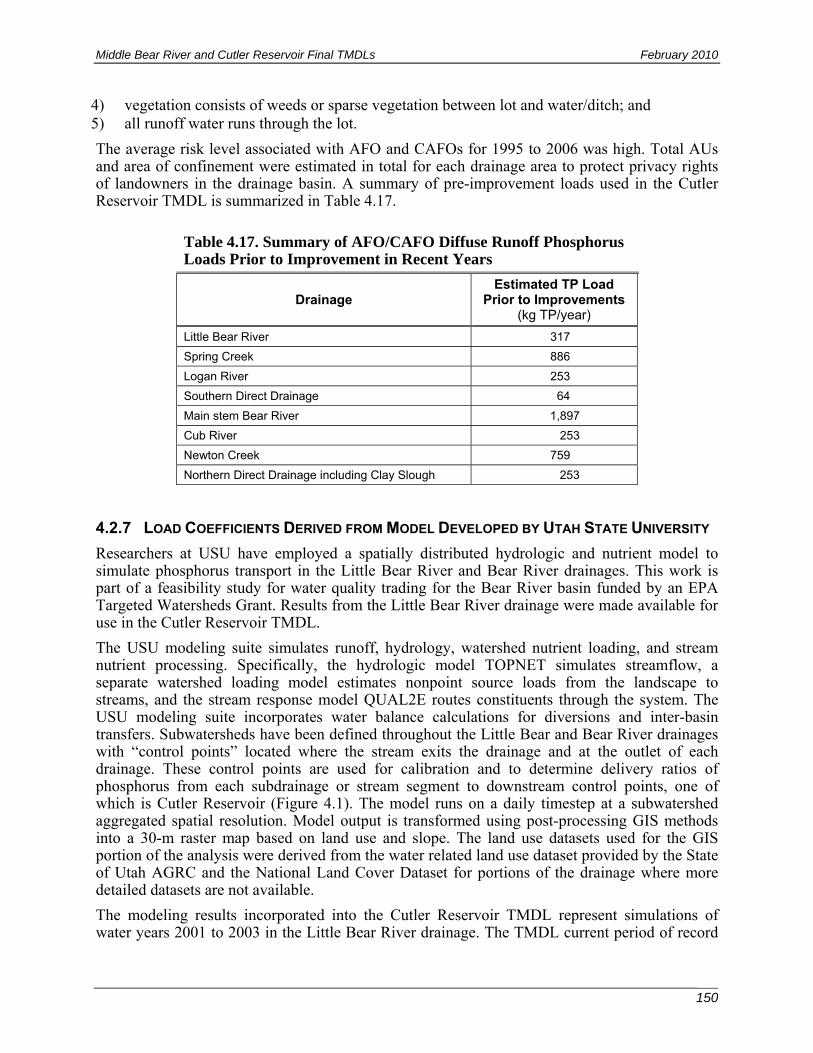
Middle Bear River and Cutler Reservoir Final TMDLs February 2010
150
4) vegetation consists of weeds or sparse vegetation between lot and water/ditch; and 5) all runoff water runs through the lot.
The average risk level associated with AFO and CAFOs for 1995 to 2006 was high. Total AUs and area of confinement were estimated in total for each drainage area to protect privacy rights of landowners in the drainage basin. A summary of pre-improvement loads used in the Cutler Reservoir TMDL is summarized in Table 4.17.
Table 4.17. Summary of AFO/CAFO Diffuse Runoff Phosphorus Loads Prior to Improvement in Recent Years
Drainage Estimated TP Load
Prior to Improvements (kg TP/year)
Little Bear River 317
Spring Creek 886
Logan River 253
Southern Direct Drainage 64
Main stem Bear River 1,897
Cub River 253
Newton Creek 759
Northern Direct Drainage including Clay Slough 253
4.2.7 LOAD COEFFICIENTS DERIVED FROM MODEL DEVELOPED BY UTAH STATE UNIVERSITY
Researchers at USU have employed a spatially distributed hydrologic and nutrient model to simulate phosphorus transport in the Little Bear River and Bear River drainages. This work is part of a feasibility study for water quality trading for the Bear River basin funded by an EPA Targeted Watersheds Grant. Results from the Little Bear River drainage were made available for use in the Cutler Reservoir TMDL.
The USU modeling suite simulates runoff, hydrology, watershed nutrient loading, and stream nutrient processing. Specifically, the hydrologic model TOPNET simulates streamflow, a separate watershed loading model estimates nonpoint source loads from the landscape to streams, and the stream response model QUAL2E routes constituents through the system. The USU modeling suite incorporates water balance calculations for diversions and inter-basin transfers. Subwatersheds have been defined throughout the Little Bear and Bear River drainages with “control points” located where the stream exits the drainage and at the outlet of each drainage. These control points are used for calibration and to determine delivery ratios of phosphorus from each subdrainage or stream segment to downstream control points, one of which is Cutler Reservoir (Figure 4.1). The model runs on a daily timestep at a subwatershed aggregated spatial resolution. Model output is transformed using post-processing GIS methods into a 30-m raster map based on land use and slope. The land use datasets used for the GIS portion of the analysis were derived from the water related land use dataset provided by the State of Utah AGRC and the National Land Cover Dataset for portions of the drainage where more detailed datasets are not available.
The modeling results incorporated into the Cutler Reservoir TMDL represent simulations of water years 2001 to 2003 in the Little Bear River drainage. The TMDL current period of record
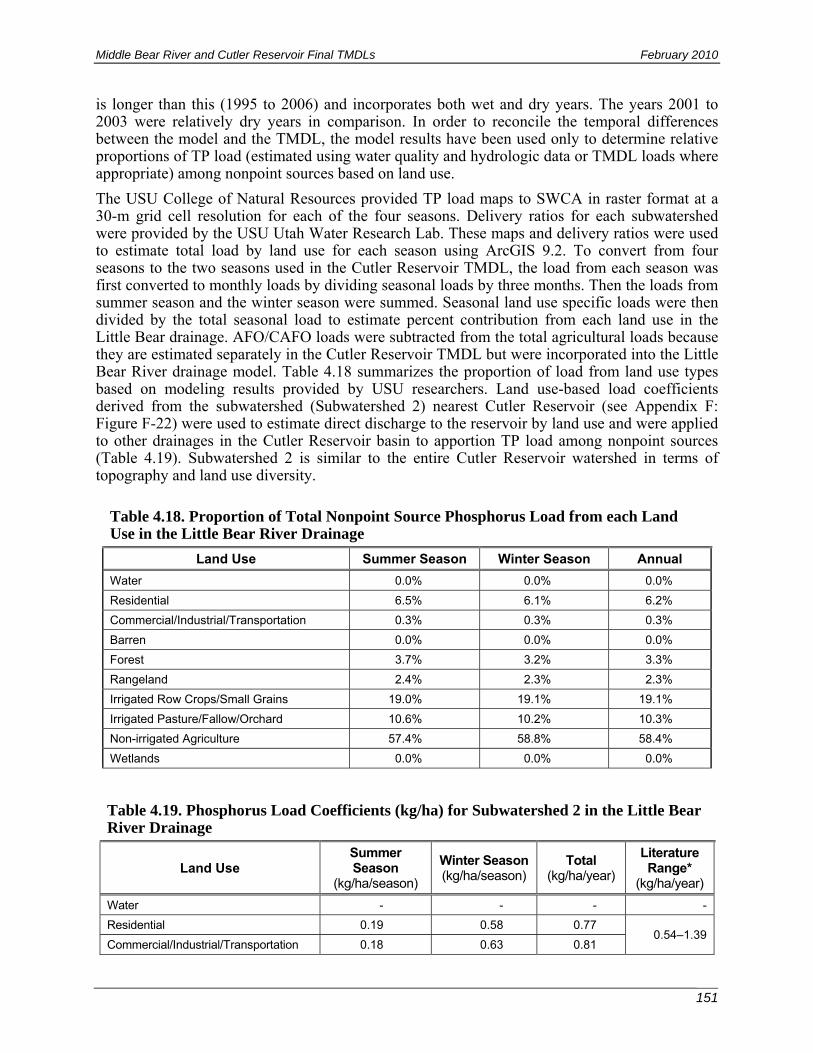
Middle Bear River and Cutler Reservoir Final TMDLs February 2010
151
is longer than this (1995 to 2006) and incorporates both wet and dry years. The years 2001 to 2003 were relatively dry years in comparison. In order to reconcile the temporal differences between the model and the TMDL, the model results have been used only to determine relative proportions of TP load (estimated using water quality and hydrologic data or TMDL loads where appropriate) among nonpoint sources based on land use.
The USU College of Natural Resources provided TP load maps to SWCA in raster format at a 30-m grid cell resolution for each of the four seasons. Delivery ratios for each subwatershed were provided by the USU Utah Water Research Lab. These maps and delivery ratios were used to estimate total load by land use for each season using ArcGIS 9.2. To convert from four seasons to the two seasons used in the Cutler Reservoir TMDL, the load from each season was first converted to monthly loads by dividing seasonal loads by three months. Then the loads from summer season and the winter season were summed. Seasonal land use specific loads were then divided by the total seasonal load to estimate percent contribution from each land use in the Little Bear drainage. AFO/CAFO loads were subtracted from the total agricultural loads because they are estimated separately in the Cutler Reservoir TMDL but were incorporated into the Little Bear River drainage model. Table 4.18 summarizes the proportion of load from land use types based on modeling results provided by USU researchers. Land use-based load coefficients derived from the subwatershed (Subwatershed 2) nearest Cutler Reservoir (see Appendix F: Figure F-22) were used to estimate direct discharge to the reservoir by land use and were applied to other drainages in the Cutler Reservoir basin to apportion TP load among nonpoint sources (Table 4.19). Subwatershed 2 is similar to the entire Cutler Reservoir watershed in terms of topography and land use diversity.
Table 4.18. Proportion of Total Nonpoint Source Phosphorus Load from each Land Use in the Little Bear River Drainage
Land Use Summer Season Winter Season Annual
Water 0.0% 0.0% 0.0%
Residential 6.5% 6.1% 6.2%
Commercial/Industrial/Transportation 0.3% 0.3% 0.3%
Barren 0.0% 0.0% 0.0%
Forest 3.7% 3.2% 3.3%
Rangeland 2.4% 2.3% 2.3%
Irrigated Row Crops/Small Grains 19.0% 19.1% 19.1%
Irrigated Pasture/Fallow/Orchard 10.6% 10.2% 10.3%
Non-irrigated Agriculture 57.4% 58.8% 58.4%
Wetlands 0.0% 0.0% 0.0%
Table 4.19. Phosphorus Load Coefficients (kg/ha) for Subwatershed 2 in the Little Bear River Drainage
Land Use Summer Season
(kg/ha/season)
Winter Season (kg/ha/season)
Total (kg/ha/year)
Literature Range*
(kg/ha/year)
Water - - - -
Residential 0.19 0.58 0.77 0.54–1.39
Commercial/Industrial/Transportation 0.18 0.63 0.81
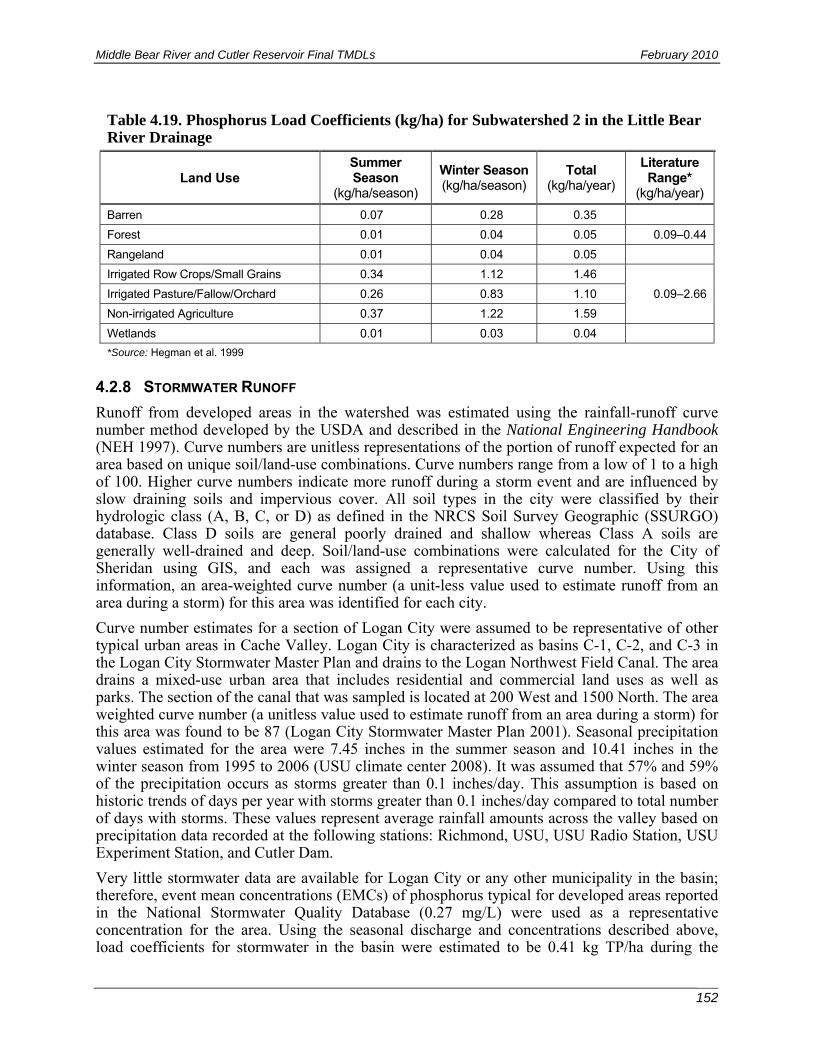
Middle Bear River and Cutler Reservoir Final TMDLs February 2010
152
Table 4.19. Phosphorus Load Coefficients (kg/ha) for Subwatershed 2 in the Little Bear River Drainage
Land Use Summer Season
(kg/ha/season)
Winter Season (kg/ha/season)
Total (kg/ha/year)
Literature Range*
(kg/ha/year)
Barren 0.07 0.28 0.35
Forest 0.01 0.04 0.05 0.09–0.44
Rangeland 0.01 0.04 0.05
Irrigated Row Crops/Small Grains 0.34 1.12 1.46
0.09–2.66 Irrigated Pasture/Fallow/Orchard 0.26 0.83 1.10
Non-irrigated Agriculture 0.37 1.22 1.59
Wetlands 0.01 0.03 0.04
*Source: Hegman et al. 1999
4.2.8 STORMWATER RUNOFF
Runoff from developed areas in the watershed was estimated using the rainfall-runoff curve number method developed by the USDA and described in the National Engineering Handbook (NEH 1997). Curve numbers are unitless representations of the portion of runoff expected for an area based on unique soil/land-use combinations. Curve numbers range from a low of 1 to a high of 100. Higher curve numbers indicate more runoff during a storm event and are influenced by slow draining soils and impervious cover. All soil types in the city were classified by their hydrologic class (A, B, C, or D) as defined in the NRCS Soil Survey Geographic (SSURGO) database. Class D soils are general poorly drained and shallow whereas Class A soils are generally well-drained and deep. Soil/land-use combinations were calculated for the City of Sheridan using GIS, and each was assigned a representative curve number. Using this information, an area-weighted curve number (a unit-less value used to estimate runoff from an area during a storm) for this area was identified for each city.
Curve number estimates for a section of Logan City were assumed to be representative of other typical urban areas in Cache Valley. Logan City is characterized as basins C-1, C-2, and C-3 in the Logan City Stormwater Master Plan and drains to the Logan Northwest Field Canal. The area drains a mixed-use urban area that includes residential and commercial land uses as well as parks. The section of the canal that was sampled is located at 200 West and 1500 North. The area weighted curve number (a unitless value used to estimate runoff from an area during a storm) for this area was found to be 87 (Logan City Stormwater Master Plan 2001). Seasonal precipitation values estimated for the area were 7.45 inches in the summer season and 10.41 inches in the winter season from 1995 to 2006 (USU climate center 2008). It was assumed that 57% and 59% of the precipitation occurs as storms greater than 0.1 inches/day. This assumption is based on historic trends of days per year with storms greater than 0.1 inches/day compared to total number of days with storms. These values represent average rainfall amounts across the valley based on precipitation data recorded at the following stations: Richmond, USU, USU Radio Station, USU Experiment Station, and Cutler Dam.
Very little stormwater data are available for Logan City or any other municipality in the basin; therefore, event mean concentrations (EMCs) of phosphorus typical for developed areas reported in the National Stormwater Quality Database (0.27 mg/L) were used as a representative concentration for the area. Using the seasonal discharge and concentrations described above, load coefficients for stormwater in the basin were estimated to be 0.41 kg TP/ha during the
Middle Bear River and Cutler Reservoir Final TMDLs February 2010
153
summer season and 0.60 kg TP/ha during the winter season. These coefficients were assumed to be representative of stormwater and spring melt runoff from urban areas throughout Cache Valley, that are not included in MS4 permitted discharges, and were applied to each drainage area in the Cutler Reservoir watershed based on the area of developed land uses determined using GIS.
This method estimates total phosphorus load from areas considered to be developed in the Cutler Reservoir watershed, including those covered by the general municipal stormwater permit described in Section 4.1.1.2.
4.2.9 IRRIGATION RETURN FLOW FROM AREAS IRRIGATED WITH WASTEWATER EFFLUENT Wastewater from the Logan Regional WWTP is used for irrigation in the summer from April 15 to October 1, according to the contract between Logan City and the Logan Cow Pasture Water Company Corporation. The contract between irrigators and Logan City permits the delivery of 19 cfs of water during this period. Variations in wet year and dry year operations may cause discharges to be released earlier or later depending on temperatures and precipitation. The irrigation canal, to which the WWTP discharges, drains directly to Cutler Reservoir. The diversions from the Logan Regional WWTP occur along a canal that connects the lagoon and wetland components of the treatment system. This water is disinfected by chlorine and then de-chlorinated before it enters the irrigation canal. Head gates at irrigation ditches along the canal are controlled by Logan City and are opened during the irrigation season to deliver 19 cfs. Once the water enters the main irrigation ditches farmers direct the water into smaller ditches and laterals for flood irrigation of fields. A significant portion of the water returns to irrigation ditches via irrigation return flow and eventually drains directly to Cutler Reservoir. In addition, during periods of harvest irrigators do not use the water released from the canal and it flows directly from the WWTP canal to Cutler Reservoir via irrigation ditches.
There are approximately 800 acres of pastureland and cropland between the Logan Regional WWTP and Cutler Reservoir that are flood irrigated each summer with effluent water. Of these 800 acres, approximately 580 acres are irrigated fallow/pasture area and 220 acres are used for crop production (personal communication between Erica Gaddis, SWCA, and UACD, Logan Field Office, spring 2008). Separate methods were employed to estimate the load in the return irrigation flow from these two agricultural land uses.
On irrigated fallow and pastureland it was assumed that the irrigation water efficiency rate was 35% and that therefore 65% of the water used for irrigation, returned to the canal, and was discharged to Cutler Reservoir. The phosphorus load associated with this water during the summer season was calculated to be 87.6 kg/day or 13,407 kg TP/season, assuming 1) a constant discharge of 19 cfs from the Logan Regional WWTP, 2) a TP concentration of 4.0 mg/L (the recorded average from 2005 to 2007 at the outlet of the lagoons, monitoring site 001, from the Logan Regional WWTP), and 3) 153 days of discharge to the canal during the summer season defined for the TMDL (May–October). During the winter season (15 days during April for the irrigation contract) the phosphorus load associated with water discharged to the irrigation canal is 130.2 kg/day or 1,953 kg/season based on 1) 15 days of discharge during the winter season, 2) 19 cfs of flow, and 3) a phosphorus concentration of 4.3 mg/L (the average recorded at monitoring site 001 during the winter season).
On the land used for crop production, a crop replacement value was calculated based on average crop yield (2.5 tons/acre) and phosphorus crop uptake (12.7 lbs/ton). Any phosphorus that was not taken up by the crops was assumed to return to the irrigation canal in the form of return flow. The TP load that returns to canals from the crop producing areas was calculated to be 4,655 kg
Middle Bear River and Cutler Reservoir Final TMDLs February 2010
154
TP/season during the summer. Because crop harvesting does not take place during April, the load associated with return flow during this month was incorporated into the calculation for non-harvested lands above.
In total, the load from the irrigation canal is 18,061.6 kg TP/season during the summer season and 1,953 kg TP/season during the winter season. These loads are in addition to the estimated load from other areas draining directly to the Southern Reservoir (such as the area directly west of the reservoir).
4.2.10 INTERNAL RESERVOIR AND UNKNOWN SOURCES USING MASS BALANCE METHOD
A phosphorus mass balance model was developed for the Northern Reservoir and the Southern Reservoir specific to the summer and winter seasons. To calculate the net internal/unknown load over each season, the seasonal load entering each reservoir section was subtracted from the calculated seasonal load exiting from that section. The load exiting from each reservoir section was estimated by multiplying the seasonal flow out of that particular section (see Section 4.2.2) by the median TP concentration at Benson Marina for the Southern Reservoir (0.260 mg/L in summer and 0.389 mg/L in winter) and at the dam for the Northern Reservoir (0.119 mg/L in summer and 0.144 mg/L in winter). The mass balance approach effectively quantifies all sources of phosphorus that are observed exiting the reservoir but not accounted for in tributary load estimates. The balance includes all internal reservoir sources (derived from sediment and/or biota) and unknown sources such as the load associated with pipes discharging directly to Cutler Reservoir. The balance of load entering Cutler Reservoir also represents some of the uncertainty associated with assumptions regarding inflows or nonpoint source phosphorus loads. Uncertainty is also incorporated into the TMDL with the MOS and phased TMDL process.
4.3 SUMMARY OF PHOSPHORUS LOADS BY TRIBUTARY AND SOURCE
4.3.1 SOUTHERN RESERVOIR
4.3.1.1 Little Bear River Drainage
The total annual phosphorus load to Cutler Reservoir from the Little Bear River drainage is 8,030 kg TP/year (22 kg/day) as described in the Little Bear River TMDL (EPA approved May 2000). As detailed in Table 4.20, this load was divided into the summer season and the winter season based on percent seasonal flow as described in Section 4.2.2. Regulated point source loads in the Little Bear River drainage consist of Wellsville Lagoons, Trout of Paradise 001, and Trout of Paradise 002. Estimated annual loads from regulated point sources are from the Little Bear River TMDL and are divided equally into seasons because wastewater effluent is relatively equal across seasons. In total, regulated point sources account for 1,050 kg TP/year or 13% of the TP load in the Little Bear River drainage. Loads from AFO/CAFOs in the watershed were derived using the UAFRRI model based on assumptions provided by UACD (see Section 4.2.6). These loads represent management of AFO/CAFOs prior to implementation of BMPs in the past several years, not direct discharges prohibited by the general CAFO permit in Utah. Other nonpoint source loads were derived by adjusting the nonpoint source loads estimated with load coefficients derived from the USU model of the Little Bear River. Loads were adjusted by 0.27 in the summer and winter to match the total nonpoint source load reported in the Little Bear TMDL. In total, nonpoint source loads account for 6,980 kg TP/year or 87% of the total load in the Little Bear River drainage. The developed nonpoint source load estimated for the Little Bear River includes loads associated with the MS4 permits for Nibley City and Wellsville City.
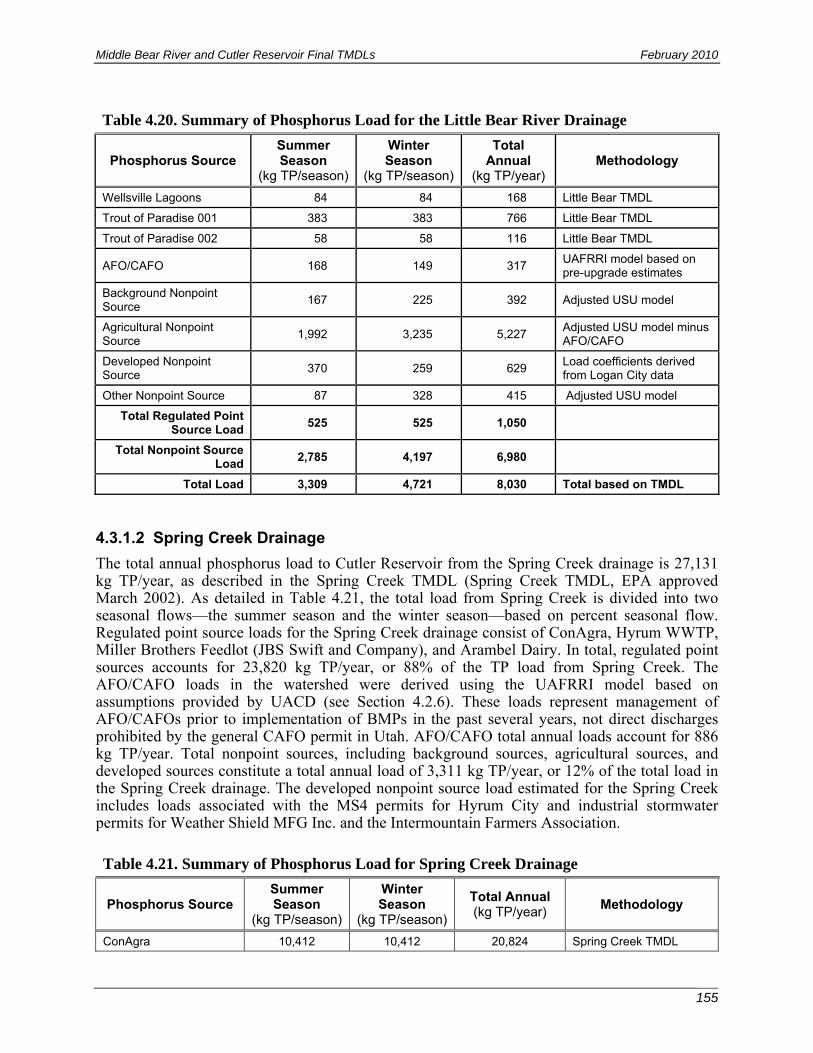
Middle Bear River and Cutler Reservoir Final TMDLs February 2010
155
Table 4.20. Summary of Phosphorus Load for the Little Bear River Drainage
Phosphorus Source Summer Season
(kg TP/season)
Winter Season
(kg TP/season)
Total Annual
(kg TP/year) Methodology
Wellsville Lagoons 84 84 168 Little Bear TMDL
Trout of Paradise 001 383 383 766 Little Bear TMDL
Trout of Paradise 002 58 58 116 Little Bear TMDL
AFO/CAFO 168 149 317 UAFRRI model based on pre-upgrade estimates
Background Nonpoint Source
167 225 392 Adjusted USU model
Agricultural Nonpoint Source
1,992 3,235 5,227 Adjusted USU model minus AFO/CAFO
Developed Nonpoint Source
370 259 629 Load coefficients derived from Logan City data
Other Nonpoint Source 87 328 415 Adjusted USU model
Total Regulated Point Source Load
525 525 1,050
Total Nonpoint Source Load
2,785 4,197 6,980
Total Load 3,309 4,721 8,030 Total based on TMDL
4.3.1.2 Spring Creek Drainage
The total annual phosphorus load to Cutler Reservoir from the Spring Creek drainage is 27,131 kg TP/year, as described in the Spring Creek TMDL (Spring Creek TMDL, EPA approved March 2002). As detailed in Table 4.21, the total load from Spring Creek is divided into two seasonal flows—the summer season and the winter season—based on percent seasonal flow. Regulated point source loads for the Spring Creek drainage consist of ConAgra, Hyrum WWTP, Miller Brothers Feedlot (JBS Swift and Company), and Arambel Dairy. In total, regulated point sources accounts for 23,820 kg TP/year, or 88% of the TP load from Spring Creek. The AFO/CAFO loads in the watershed were derived using the UAFRRI model based on assumptions provided by UACD (see Section 4.2.6). These loads represent management of AFO/CAFOs prior to implementation of BMPs in the past several years, not direct discharges prohibited by the general CAFO permit in Utah. AFO/CAFO total annual loads account for 886 kg TP/year. Total nonpoint sources, including background sources, agricultural sources, and developed sources constitute a total annual load of 3,311 kg TP/year, or 12% of the total load in the Spring Creek drainage. The developed nonpoint source load estimated for the Spring Creek includes loads associated with the MS4 permits for Hyrum City and industrial stormwater permits for Weather Shield MFG Inc. and the Intermountain Farmers Association.
Table 4.21. Summary of Phosphorus Load for Spring Creek Drainage
Phosphorus Source Summer Season
(kg TP/season)
Winter Season
(kg TP/season)
Total Annual (kg TP/year)
Methodology
ConAgra 10,412 10,412 20,824 Spring Creek TMDL
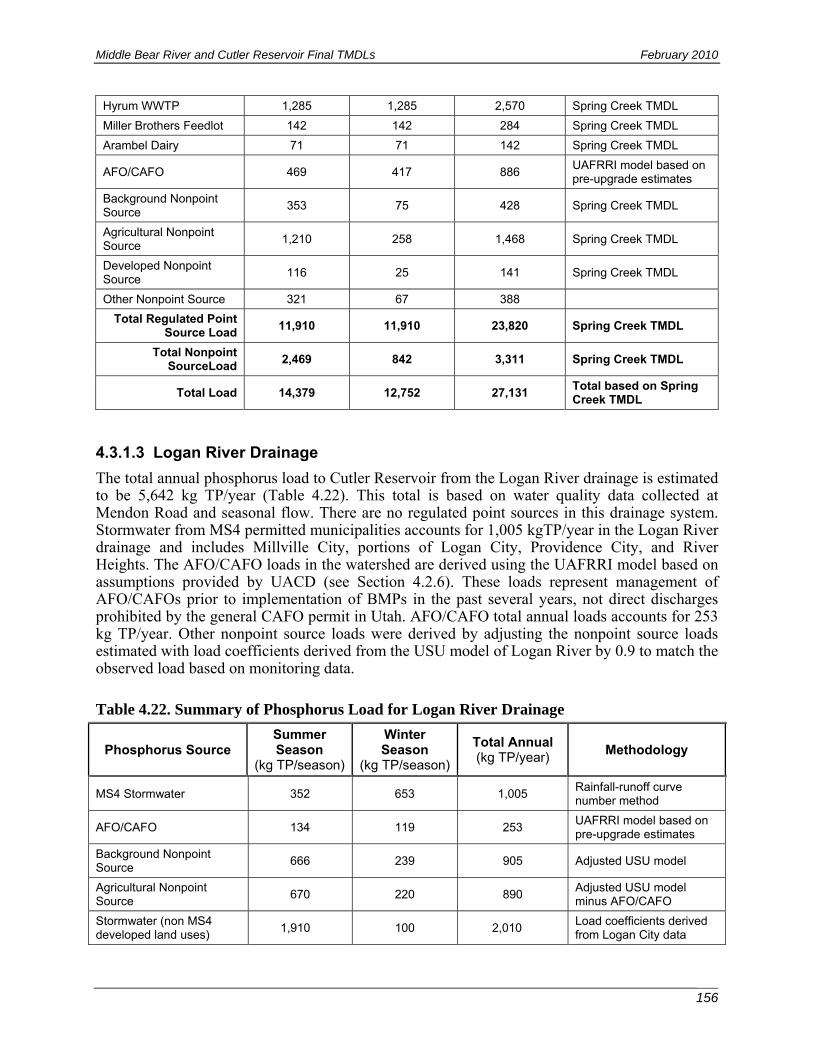
Middle Bear River and Cutler Reservoir Final TMDLs February 2010
156
Hyrum WWTP 1,285 1,285 2,570 Spring Creek TMDL
Miller Brothers Feedlot 142 142 284 Spring Creek TMDL
Arambel Dairy 71 71 142 Spring Creek TMDL
AFO/CAFO 469 417 886 UAFRRI model based on pre-upgrade estimates
Background Nonpoint Source
353 75 428 Spring Creek TMDL
Agricultural Nonpoint Source
1,210 258 1,468 Spring Creek TMDL
Developed Nonpoint Source
116 25 141 Spring Creek TMDL
Other Nonpoint Source 321 67 388
Total Regulated Point Source Load
11,910 11,910 23,820 Spring Creek TMDL
Total Nonpoint SourceLoad
2,469 842 3,311 Spring Creek TMDL
Total Load 14,379 12,752 27,131 Total based on Spring Creek TMDL
4.3.1.3 Logan River Drainage
The total annual phosphorus load to Cutler Reservoir from the Logan River drainage is estimated to be 5,642 kg TP/year (Table 4.22). This total is based on water quality data collected at Mendon Road and seasonal flow. There are no regulated point sources in this drainage system. Stormwater from MS4 permitted municipalities accounts for 1,005 kgTP/year in the Logan River drainage and includes Millville City, portions of Logan City, Providence City, and River Heights. The AFO/CAFO loads in the watershed are derived using the UAFRRI model based on assumptions provided by UACD (see Section 4.2.6). These loads represent management of AFO/CAFOs prior to implementation of BMPs in the past several years, not direct discharges prohibited by the general CAFO permit in Utah. AFO/CAFO total annual loads accounts for 253 kg TP/year. Other nonpoint source loads were derived by adjusting the nonpoint source loads estimated with load coefficients derived from the USU model of Logan River by 0.9 to match the observed load based on monitoring data.
Table 4.22. Summary of Phosphorus Load for Logan River Drainage
Phosphorus Source Summer Season
(kg TP/season)
Winter Season
(kg TP/season)
Total Annual (kg TP/year)
Methodology
MS4 Stormwater 352 653 1,005 Rainfall-runoff curve number method
AFO/CAFO 134 119 253 UAFRRI model based on pre-upgrade estimates
Background Nonpoint Source
666 239 905 Adjusted USU model
Agricultural Nonpoint Source
670 220 890 Adjusted USU model minus AFO/CAFO
Stormwater (non MS4 developed land uses)
1,910 100 2,010 Load coefficients derived from Logan City data

Middle Bear River and Cutler Reservoir Final TMDLs February 2010
157
Table 4.22. Summary of Phosphorus Load for Logan River Drainage
Phosphorus Source Summer Season
(kg TP/season)
Winter Season
(kg TP/season)
Total Annual (kg TP/year)
Methodology
Other Nonpoint Source 455 124 579 Adjusted USU model
Total Regulated Point Source Load
352 653 1,005
Total Nonpoint Source Load
3,835 802 4,637
Total Load 4,187 1,455 5,642 Total based on monitoring data
4.3.1.4 Swift Slough Drainage
The total annual phosphorus load to Cutler Reservoir from the Swift Slough drainage is determined to be 36,893 kg TP/year, calculated based on monitoring data (Table 4.23). Loads for Swift Slough drainage above the WWTP and for Blue Springs Ditch are divided into two seasonal flows—the summer season and the winter season—based on percent seasonal flow. The Logan Regional WWTP is the only regulated point source in the Swift Slough drainage. In total, this source accounts for 32,832 kg TP/year or 89% of the TP load in the Swift Slough drainage. MS4 permitted stormwater discharge from Logan City accounts for 145 ktTP/year in the drainage. During the winter season, there is a higher load than in the summer season because the treatment plant discharges to an irrigation ditch during part of the summer season (see Section 4.2.9). There are no loads from AFO/CAFO sources in the Swift Slough drainage. Nonpoint source loads were derived by adjusting the nonpoint source loads—estimated with load coefficients derived from the USU model of Swift Slough—by 0.39 to match the total monitored load estimated in Swift Slough just above the WWTP and in Blue Springs Ditch, including runoff from the Gossner Foods cheese-processing facility that uses land application for wastewater disposal. In total, nonpoint source loads account for 3,915 kg TP/year or 11% of the TP load in the Swift Slough drainage.
Table 4.23. Summary of Phosphorus Load for Swift Slough Drainage
Phosphorus Source Summer Season
(kg TP/season)
Winter Season
(kg TP/season)
Total Annual
(kg TP/year) Methodology
Logan Regional WWTP 11,236 21,597 32,832 Monitoring data
MS4 Stormwater 51 94 145 Rainfall-runoff curve number method
Blue Springs Ditch 417 1,559 1,976 Monitoring data
AFO/CAFO 0 0 0 Incorporated into Southern Reservoir Direct Drainage Summary.
Background Nonpoint Source
16 25 41 Adjusted USU model
Agricultural Nonpoint Source
494 885 1,379 Adjusted USU model
Stormwater (non MS4 315 204 519 Load coefficients derived
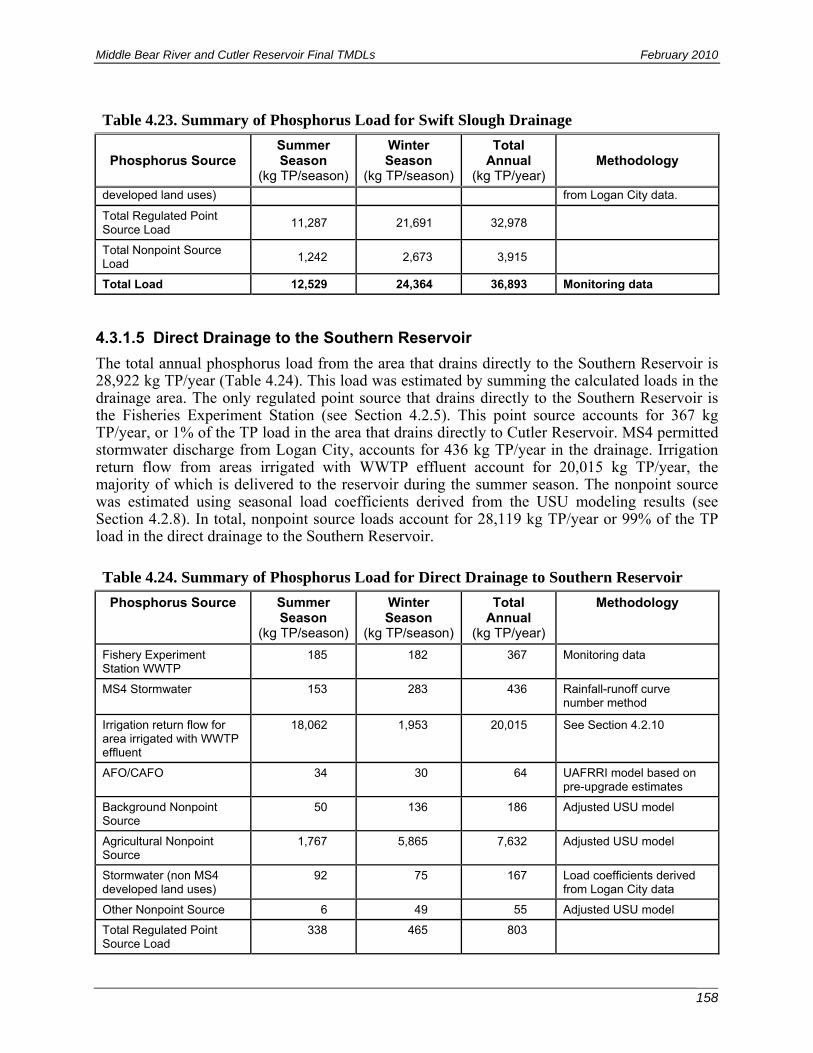
Middle Bear River and Cutler Reservoir Final TMDLs February 2010
158
Table 4.23. Summary of Phosphorus Load for Swift Slough Drainage
Phosphorus Source Summer Season
(kg TP/season)
Winter Season
(kg TP/season)
Total Annual
(kg TP/year) Methodology
developed land uses) from Logan City data.
Total Regulated Point Source Load
11,287 21,691 32,978
Total Nonpoint Source Load
1,242 2,673 3,915
Total Load 12,529 24,364 36,893 Monitoring data
4.3.1.5 Direct Drainage to the Southern Reservoir
The total annual phosphorus load from the area that drains directly to the Southern Reservoir is 28,922 kg TP/year (Table 4.24). This load was estimated by summing the calculated loads in the drainage area. The only regulated point source that drains directly to the Southern Reservoir is the Fisheries Experiment Station (see Section 4.2.5). This point source accounts for 367 kg TP/year, or 1% of the TP load in the area that drains directly to Cutler Reservoir. MS4 permitted stormwater discharge from Logan City, accounts for 436 kg TP/year in the drainage. Irrigation return flow from areas irrigated with WWTP effluent account for 20,015 kg TP/year, the majority of which is delivered to the reservoir during the summer season. The nonpoint source was estimated using seasonal load coefficients derived from the USU modeling results (see Section 4.2.8). In total, nonpoint source loads account for 28,119 kg TP/year or 99% of the TP load in the direct drainage to the Southern Reservoir.
Table 4.24. Summary of Phosphorus Load for Direct Drainage to Southern Reservoir
Phosphorus Source Summer Season
(kg TP/season)
Winter Season
(kg TP/season)
Total Annual
(kg TP/year)
Methodology
Fishery Experiment Station WWTP
185 182 367 Monitoring data
MS4 Stormwater 153 283 436 Rainfall-runoff curve number method
Irrigation return flow for area irrigated with WWTP effluent
18,062 1,953 20,015 See Section 4.2.10
AFO/CAFO 34 30 64 UAFRRI model based on pre-upgrade estimates
Background Nonpoint Source
50 136 186 Adjusted USU model
Agricultural Nonpoint Source
1,767 5,865 7,632 Adjusted USU model
Stormwater (non MS4 developed land uses)
92 75 167 Load coefficients derived from Logan City data
Other Nonpoint Source 6 49 55 Adjusted USU model
Total Regulated Point Source Load
338 465 803
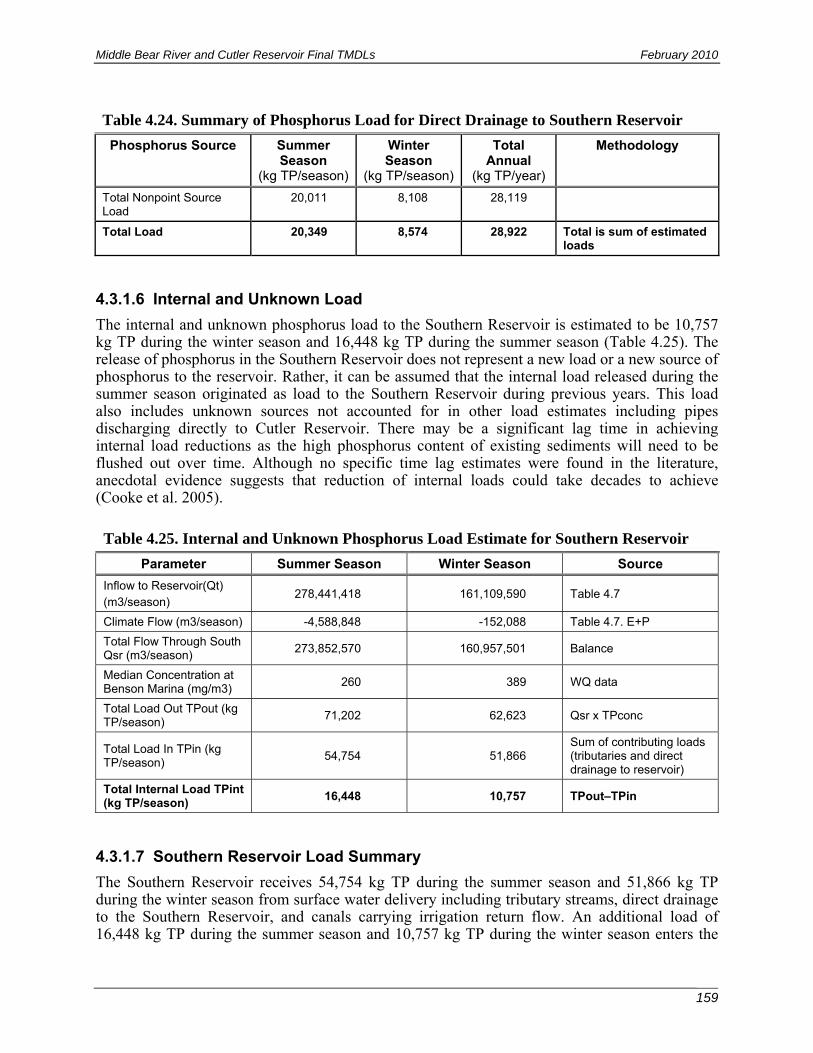
Middle Bear River and Cutler Reservoir Final TMDLs February 2010
159
Table 4.24. Summary of Phosphorus Load for Direct Drainage to Southern Reservoir
Phosphorus Source Summer Season
(kg TP/season)
Winter Season
(kg TP/season)
Total Annual
(kg TP/year)
Methodology
Total Nonpoint Source Load
20,011 8,108 28,119
Total Load 20,349 8,574 28,922 Total is sum of estimated loads
4.3.1.6 Internal and Unknown Load
The internal and unknown phosphorus load to the Southern Reservoir is estimated to be 10,757 kg TP during the winter season and 16,448 kg TP during the summer season (Table 4.25). The release of phosphorus in the Southern Reservoir does not represent a new load or a new source of phosphorus to the reservoir. Rather, it can be assumed that the internal load released during the summer season originated as load to the Southern Reservoir during previous years. This load also includes unknown sources not accounted for in other load estimates including pipes discharging directly to Cutler Reservoir. There may be a significant lag time in achieving internal load reductions as the high phosphorus content of existing sediments will need to be flushed out over time. Although no specific time lag estimates were found in the literature, anecdotal evidence suggests that reduction of internal loads could take decades to achieve (Cooke et al. 2005).
Table 4.25. Internal and Unknown Phosphorus Load Estimate for Southern Reservoir
Parameter Summer Season Winter Season Source
Inflow to Reservoir(Qt) (m3/season)
278,441,418 161,109,590 Table 4.7
Climate Flow (m3/season) -4,588,848 -152,088 Table 4.7. E+P
Total Flow Through South Qsr (m3/season)
273,852,570 160,957,501 Balance
Median Concentration at Benson Marina (mg/m3)
260 389 WQ data
Total Load Out TPout (kg TP/season)
71,202 62,623 Qsr x TPconc
Total Load In TPin (kg TP/season)
54,754 51,866 Sum of contributing loads (tributaries and direct drainage to reservoir)
Total Internal Load TPint (kg TP/season)
16,448 10,757 TPout–TPin
4.3.1.7 Southern Reservoir Load Summary
The Southern Reservoir receives 54,754 kg TP during the summer season and 51,866 kg TP during the winter season from surface water delivery including tributary streams, direct drainage to the Southern Reservoir, and canals carrying irrigation return flow. An additional load of 16,448 kg TP during the summer season and 10,757 kg TP during the winter season enters the

Middle Bear River and Cutler Reservoir Final TMDLs February 2010
160
water column in the Southern Reservoir. This load was calculated using a mass balance method and represents the combination of internal load from reservoir sediments and biota as well as unknown loading sources around the Southern Reservoir. In total, the load delivered to the Southern Reservoir is 71,201 kg TP in the summer season (56% of the total load to the entire reservoir) and 62,622 kg TP in the winter season (51% of the total load to the reservoir). This entire load flows through Benson Marina to the Northern Reservoir. The following sections summarize the TP load to the Southern Reservoir by drainage and source type.
4.3.1.7.1 Summary by Drainage The primary drainages delivering phosphorus to the Southern Reservoir are Swift Slough, direct drainage from areas adjacent to the Southern Reservoir, and Spring Creek. Together they comprise 66% of the total load to the Southern Reservoir in the summer and 73% of the total load in the winter. The internal and unknown load is an important source to the Southern Reservoir during both the summer (23%) and winter seasons (17%). In addition, Swift Slough carries a larger TP load in the winter season because all of the Logan Regional WWTP effluent is discharged to Swift Slough during this season, whereas discharge is split between Swift Slough and an irrigation canal during the summer season. The load from the direct drainage area is also smaller in the winter season because there is substantially less irrigation return flow of WWTP effluent, during the winter compared to the summer.
Figure 4.1. Proportional phosphorus load from drainages to the Southern Reservoir during the summer season.
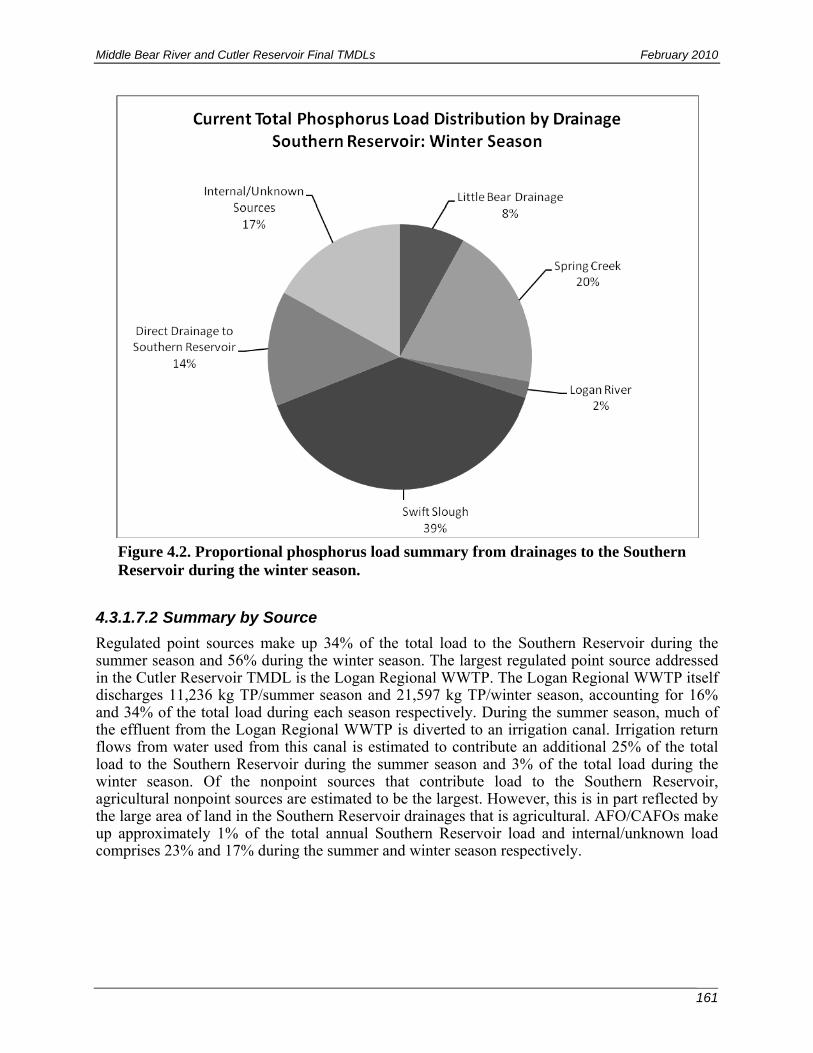
Middle Bear River and Cutler Reservoir Final TMDLs February 2010
161
Figure 4.2. Proportional phosphorus load summary from drainages to the Southern Reservoir during the winter season.
4.3.1.7.2 Summary by Source Regulated point sources make up 34% of the total load to the Southern Reservoir during the summer season and 56% during the winter season. The largest regulated point source addressed in the Cutler Reservoir TMDL is the Logan Regional WWTP. The Logan Regional WWTP itself discharges 11,236 kg TP/summer season and 21,597 kg TP/winter season, accounting for 16% and 34% of the total load during each season respectively. During the summer season, much of the effluent from the Logan Regional WWTP is diverted to an irrigation canal. Irrigation return flows from water used from this canal is estimated to contribute an additional 25% of the total load to the Southern Reservoir during the summer season and 3% of the total load during the winter season. Of the nonpoint sources that contribute load to the Southern Reservoir, agricultural nonpoint sources are estimated to be the largest. However, this is in part reflected by the large area of land in the Southern Reservoir drainages that is agricultural. AFO/CAFOs make up approximately 1% of the total annual Southern Reservoir load and internal/unknown load comprises 23% and 17% during the summer and winter season respectively.

Middle Bear River and Cutler Reservoir Final TMDLs February 2010
162
Figure 4.3. Proportional phosphorus load summary from sources to the Southern Reservoir during the summer season. Nonpoint Source = nonpoint source.
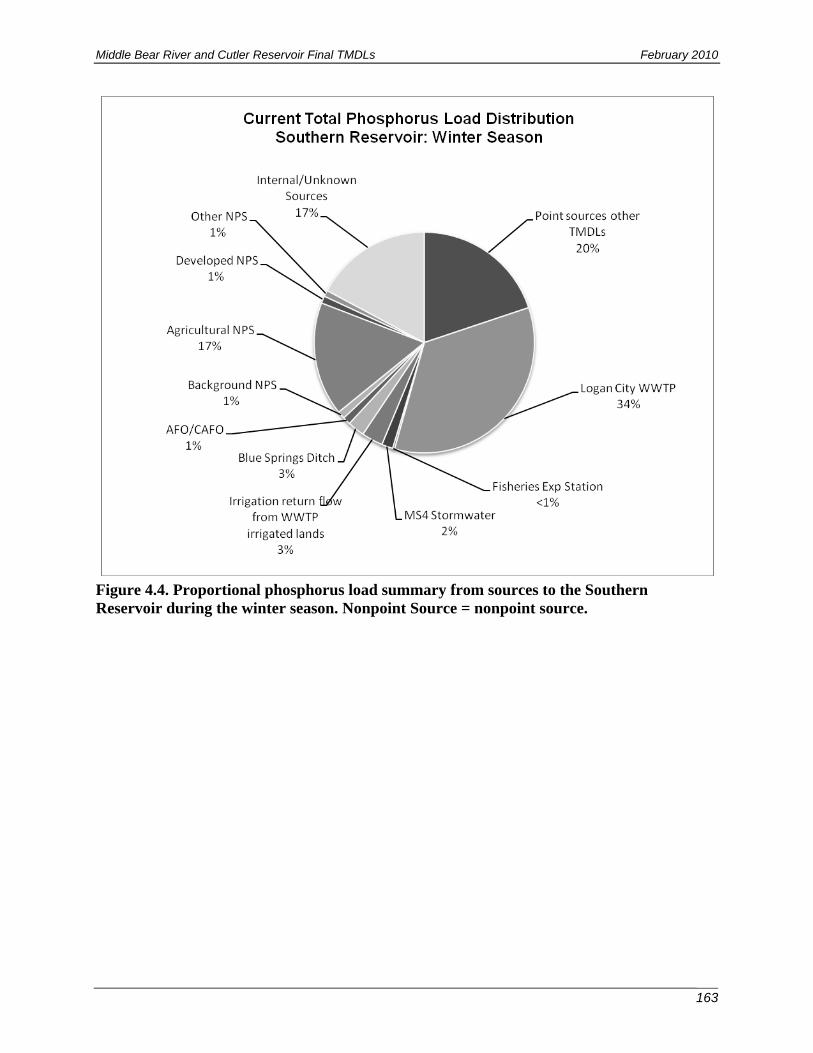
Middle Bear River and Cutler Reservoir Final TMDLs February 2010
163
Figure 4.4. Proportional phosphorus load summary from sources to the Southern Reservoir during the winter season. Nonpoint Source = nonpoint source.

Middle Bear River and Cutler Reservoir Final TMDLs February 2010
164
4.3.2 NORTHERN RESERVOIR
4.3.2.1 Clay Slough Drainage
Based on monitoring data and estimated flow, the total annual phosphorus load to Cutler Reservoir from the Clay Slough drainage was calculated to be 8,863 kg TP/year (Table 4.26). There are no regulated point sources in this drainage. Loads for the Clay Slough drainage were divided into seasonal loads based on percent seasonal flow (see Section 4.2.2). Nonpoint source loads were derived by proportionally adjusting the nonpoint source loads estimated with load coefficients derived from the USU model by 1.38 to match the monitored load from Clay Slough. This adjustment may reflect runoff from nutrient rich areas that have received land application of wastewater from the local cheese processing industry. Nonpoint sources in Clay Slough include runoff from land application of waste by Schreiber Foods.
Table 4.26. Summary of Phosphorus Load for Clay Slough
Phosphorus Source Summer Season
(kg TP/season)
Winter Season
(kg TP/season)
Total Annual
(kg TP/year) Methodology
MS4 Stormwater 0 55 55 Curve number method and National EMCs
Background Nonpoint Source
97 70 167 Adjusted USU model
Agricultural Nonpoint Source
4,562 3,700 8,262 Adjusted USU model
Stormwater (non MS4 developed land uses)
317 62 379 Load coefficients derived from Logan City data
Total Regulated Point Source Load
0 55 55
Total Nonpoint SourceLoad
4,976 3,832 8,808
Total Load 4,976 3,887 8,863 Total is based on monitoring data
4.3.2.2 Bear River Drainage
Based on monitoring data at the Bear River just prior to entering Cutler Reservoir, the total annual phosphorus load to Cutler Reservoir from the Bear River is calculated to be 91,075 kg TP/year (Table 4.27). Loads for the Bear River drainage were divided into two seasonal flows—the summer season and the winter season—based on percent seasonal flow (see Section 4.2.2). The Bear River load was then subdivided into three loads: 1) the load that enters Utah from Idaho (Idaho Bear River load), 2) the Middle Bear River (Utah's main stem drainage of the Bear River above Cutler Reservoir), and 3) the Cub River (a tributary to the Middle Bear River). Loads in the Cub River and Idaho portion of the Bear River are further summarized in other TMDLs and are not repeated in this TMDL. Rather, a breakdown of sources along the main stem of the Middle Bear River in Utah has been compiled. The Idaho Bear River TMDL and the Cub River TMDL account for all known regulated point sources in the Middle Bear River drainage.
The total annual load from the Idaho portion of the Bear River drainage is 35,665 kg TP/year or 39% of the total Bear River load into Cutler Reservoir. The total annual load from the Cub River
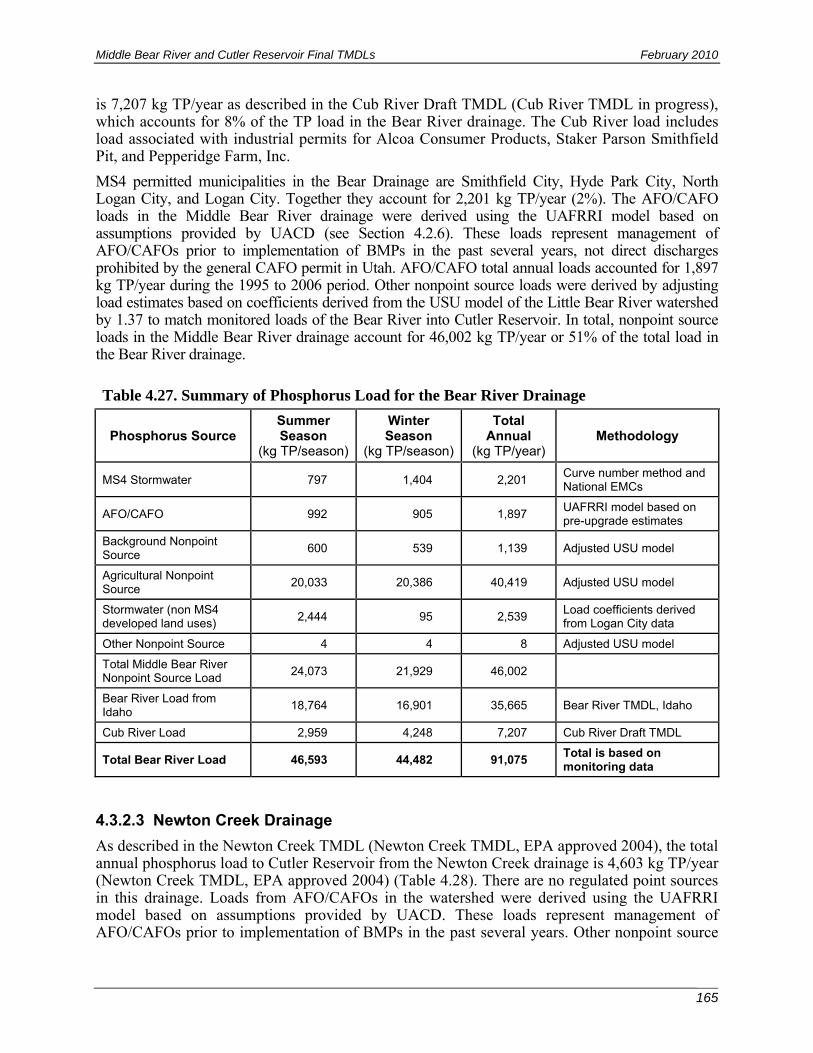
Middle Bear River and Cutler Reservoir Final TMDLs February 2010
165
is 7,207 kg TP/year as described in the Cub River Draft TMDL (Cub River TMDL in progress), which accounts for 8% of the TP load in the Bear River drainage. The Cub River load includes load associated with industrial permits for Alcoa Consumer Products, Staker Parson Smithfield Pit, and Pepperidge Farm, Inc.
MS4 permitted municipalities in the Bear Drainage are Smithfield City, Hyde Park City, North Logan City, and Logan City. Together they account for 2,201 kg TP/year (2%). The AFO/CAFO loads in the Middle Bear River drainage were derived using the UAFRRI model based on assumptions provided by UACD (see Section 4.2.6). These loads represent management of AFO/CAFOs prior to implementation of BMPs in the past several years, not direct discharges prohibited by the general CAFO permit in Utah. AFO/CAFO total annual loads accounted for 1,897 kg TP/year during the 1995 to 2006 period. Other nonpoint source loads were derived by adjusting load estimates based on coefficients derived from the USU model of the Little Bear River watershed by 1.37 to match monitored loads of the Bear River into Cutler Reservoir. In total, nonpoint source loads in the Middle Bear River drainage account for 46,002 kg TP/year or 51% of the total load in the Bear River drainage.
Table 4.27. Summary of Phosphorus Load for the Bear River Drainage
Phosphorus Source Summer Season
(kg TP/season)
Winter Season
(kg TP/season)
Total Annual
(kg TP/year) Methodology
MS4 Stormwater 797 1,404 2,201 Curve number method and National EMCs
AFO/CAFO 992 905 1,897 UAFRRI model based on pre-upgrade estimates
Background Nonpoint Source
600 539 1,139 Adjusted USU model
Agricultural Nonpoint Source
20,033 20,386 40,419 Adjusted USU model
Stormwater (non MS4 developed land uses)
2,444 95 2,539 Load coefficients derived from Logan City data
Other Nonpoint Source 4 4 8 Adjusted USU model
Total Middle Bear River Nonpoint Source Load
24,073 21,929 46,002
Bear River Load from Idaho
18,764 16,901 35,665 Bear River TMDL, Idaho
Cub River Load 2,959 4,248 7,207 Cub River Draft TMDL
Total Bear River Load 46,593 44,482 91,075 Total is based on monitoring data
4.3.2.3 Newton Creek Drainage
As described in the Newton Creek TMDL (Newton Creek TMDL, EPA approved 2004), the total annual phosphorus load to Cutler Reservoir from the Newton Creek drainage is 4,603 kg TP/year (Newton Creek TMDL, EPA approved 2004) (Table 4.28). There are no regulated point sources in this drainage. Loads from AFO/CAFOs in the watershed were derived using the UAFRRI model based on assumptions provided by UACD. These loads represent management of AFO/CAFOs prior to implementation of BMPs in the past several years. Other nonpoint source

Middle Bear River and Cutler Reservoir Final TMDLs February 2010
166
loads were derived by adjusting the nonpoint source loads estimated with load coefficients derived from the USU model of Newton Creek. Loads were adjusted by 0.31 in order to match the total nonpoint source load reported in the Newton Creek TMDL.
Table 4.28. Summary of Phosphorus Load for Newton Creek Drainage
Phosphorus Source Summer Season
(kg TP/season)
Winter Season
(kg TP/season)
Total Annual
(kg TP/year) Methodology
AFO/CAFO 406 353 759 UAFRRI model based on pre-upgrade estimates
Background Nonpoint Source
46 37 83 Adjusted USU model
Agricultural Nonpoint Source
1,871 1,691 3,562 Adjusted USU model
Developed Nonpoint Source
141 58 199 Load coefficients derived from Logan City data
Total Regulated Point Source Load
0 0 0
Total Nonpoint Source Load
2,464 2,139 4,603
Total Load 2,464 2,139 4,603 Total is based on Newton Creek TMDL
4.3.2.4 Direct Drainage to the Northern Reservoir
The total annual phosphorus load from the area that drains directly to the Northern Reservoir is determined to be 8,867 kg TP/year (Table 4.29). This load was estimated using seasonal load coefficients derived from the USU modeling results from Subwatershed 2, the subwatershed nearest the reservoir (see Appendix F: Figure F-22). This subdrainage was determined to be most representative of the area that drains directly to Cutler Reservoir. Loads from AFO/CAFOs in the watershed were derived using the UAFRRI model based on assumptions provided by UACD (see Section 4.2.6). These loads represent management of AFO/CAFOs prior to improvement in the past several years.
Table 4.29. Summary of Phosphorus Load for Direct Drainage to Northern Reservoir
Phosphorus Source Summer Season
(kg TP/season)
Winter Season
(kg TP/season)
Total Annual
(kg TP/year) Methodology
AFO/CAFO 129 124 253 UAFRRI model based on pre-upgrade estimates
Background Nonpoint Source
40 115 155 USU model for lower basin drainage
Agricultural Nonpoint Source 1,833 6,217 8,050 USU model for lower basin drainage
Developed Nonpoint Source 166 243 409 Load coefficients derived from Logan City data
Total Nonpoint Source Load 2,168 6,699 8,867
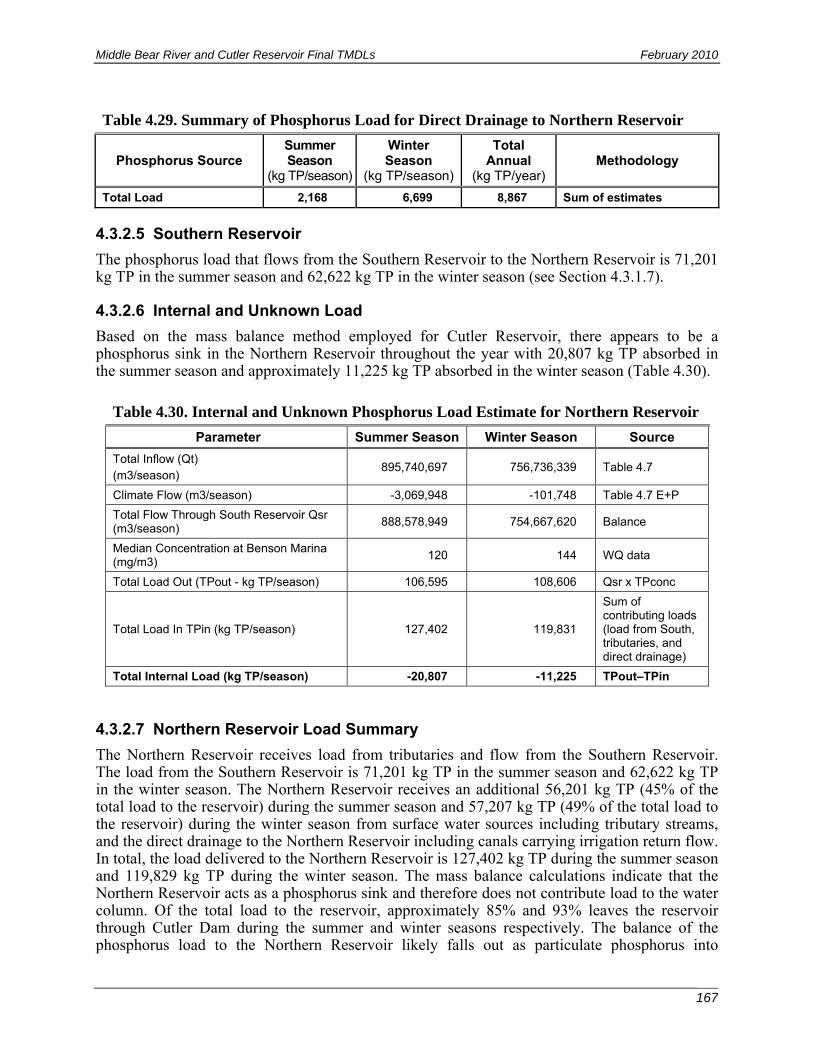
Middle Bear River and Cutler Reservoir Final TMDLs February 2010
167
Table 4.29. Summary of Phosphorus Load for Direct Drainage to Northern Reservoir
Phosphorus Source Summer Season
(kg TP/season)
Winter Season
(kg TP/season)
Total Annual
(kg TP/year) Methodology
Total Load 2,168 6,699 8,867 Sum of estimates
4.3.2.5 Southern Reservoir
The phosphorus load that flows from the Southern Reservoir to the Northern Reservoir is 71,201 kg TP in the summer season and 62,622 kg TP in the winter season (see Section 4.3.1.7).
4.3.2.6 Internal and Unknown Load
Based on the mass balance method employed for Cutler Reservoir, there appears to be a phosphorus sink in the Northern Reservoir throughout the year with 20,807 kg TP absorbed in the summer season and approximately 11,225 kg TP absorbed in the winter season (Table 4.30).
Table 4.30. Internal and Unknown Phosphorus Load Estimate for Northern Reservoir
Parameter Summer Season Winter Season Source
Total Inflow (Qt) (m3/season)
895,740,697 756,736,339 Table 4.7
Climate Flow (m3/season) -3,069,948 -101,748 Table 4.7 E+P
Total Flow Through South Reservoir Qsr (m3/season)
888,578,949 754,667,620 Balance
Median Concentration at Benson Marina (mg/m3)
120 144 WQ data
Total Load Out (TPout - kg TP/season) 106,595 108,606 Qsr x TPconc
Total Load In TPin (kg TP/season) 127,402 119,831
Sum of contributing loads (load from South, tributaries, and direct drainage)
Total Internal Load (kg TP/season) -20,807 -11,225 TPout–TPin
4.3.2.7 Northern Reservoir Load Summary
The Northern Reservoir receives load from tributaries and flow from the Southern Reservoir. The load from the Southern Reservoir is 71,201 kg TP in the summer season and 62,622 kg TP in the winter season. The Northern Reservoir receives an additional 56,201 kg TP (45% of the total load to the reservoir) during the summer season and 57,207 kg TP (49% of the total load to the reservoir) during the winter season from surface water sources including tributary streams, and the direct drainage to the Northern Reservoir including canals carrying irrigation return flow. In total, the load delivered to the Northern Reservoir is 127,402 kg TP during the summer season and 119,829 kg TP during the winter season. The mass balance calculations indicate that the Northern Reservoir acts as a phosphorus sink and therefore does not contribute load to the water column. Of the total load to the reservoir, approximately 85% and 93% leaves the reservoir through Cutler Dam during the summer and winter seasons respectively. The balance of the phosphorus load to the Northern Reservoir likely falls out as particulate phosphorus into

Middle Bear River and Cutler Reservoir Final TMDLs February 2010
168
reservoir sediments. The capacity of the Northern Reservoir to continue as a phosphorus sink into the future is unknown and should not be counted on as a long-term mechanism for phosphorus reduction. The following sections summarize the total load to the Northern Reservoir by drainage and source type.
4.3.2.7.1 Summary by Drainage During the summer season, 56% of the phosphorus load to the Northern Reservoir flows from the Southern Reservoir. Load from the Southern Reservoir makes up only 52% of the load to the Northern Reservoir during the winter season. The remaining loads during both seasons come primarily from the Bear River, which makes up 37% of the load to the Northern Reservoir in the summer and winter seasons, over half of which comes from the Middle Bear River drainage in Utah (Figures 4.5 and 4.6).
Figure 4.5. Proportional phosphorus load summary from drainages to Northern Reservoir during the summer season.

Middle Bear River and Cutler Reservoir Final TMDLs February 2010
169
Figure 4.6. Proportional phosphorus load summary from drainages to Northern Reservoir during the winter season.
4.3.2.7.2 Summary by Source The majority of the load to the Northern Reservoir comes from the Southern Reservoir and from nonpoint sources. The only regulated wastewater treatment point sources in the Northern Reservoir drainage are incorporated into the Cub River and Idaho Bear River TMDLs. Stormwater discharges from permitted MS4 municipalities in the Bear River drainage account for 1% of the total load to the reservoir. Of the nonpoint sources that contribute load to the Northern Reservoir, agricultural nonpoint sources are the largest. However, this is primarily reflective of the large area of land in the Northern Reservoir drainage that is agricultural. AFO/CAFOs make up approximately 1% of the total Northern Reservoir load (Figures 4.7 and 4.8).
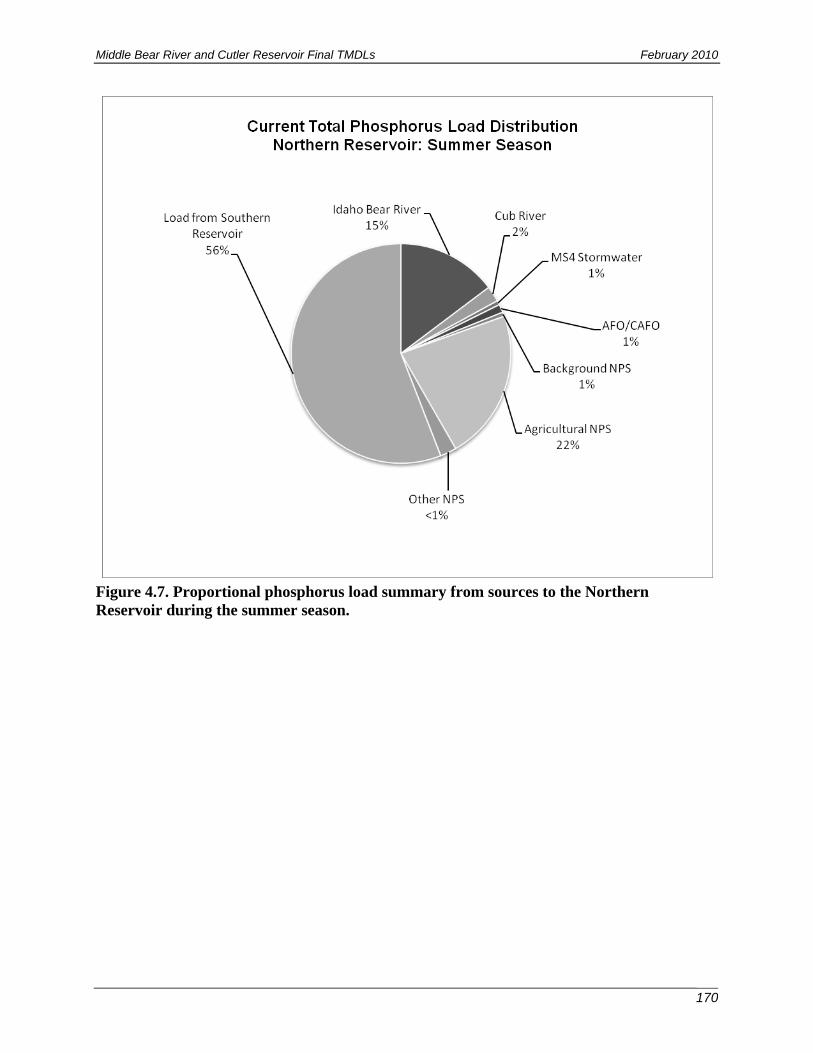
Middle Bear River and Cutler Reservoir Final TMDLs February 2010
170
Figure 4.7. Proportional phosphorus load summary from sources to the Northern Reservoir during the summer season.
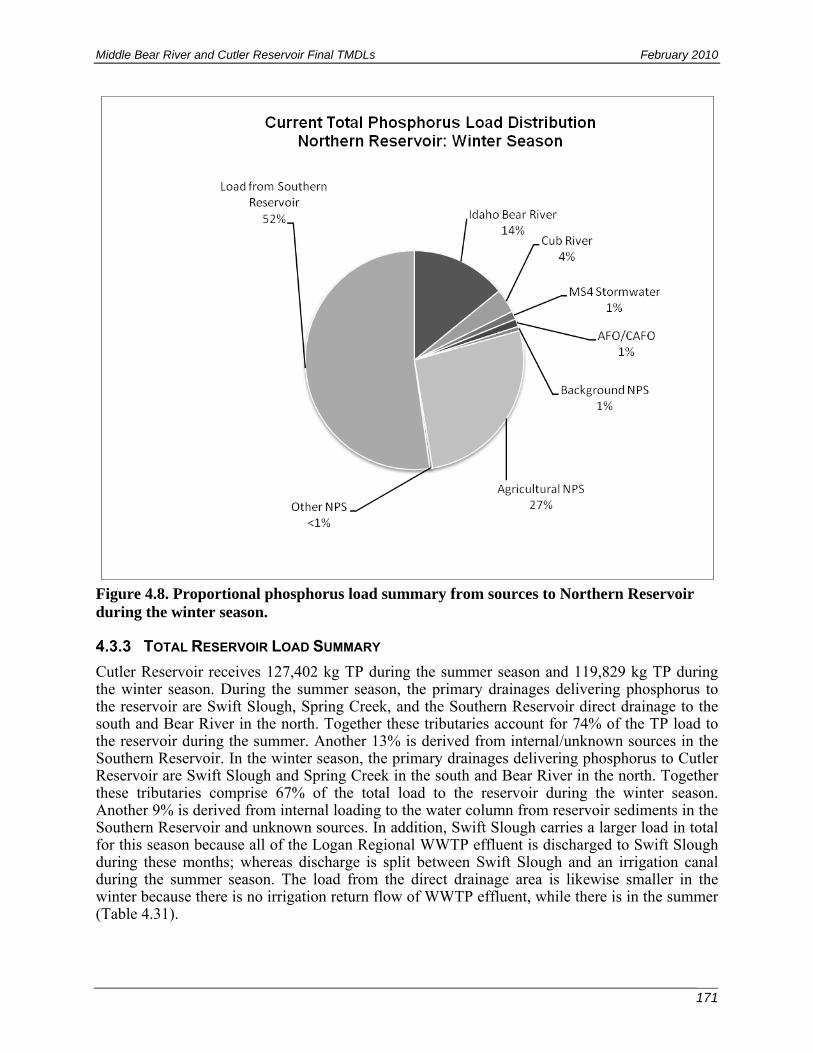
Middle Bear River and Cutler Reservoir Final TMDLs February 2010
171
Figure 4.8. Proportional phosphorus load summary from sources to Northern Reservoir during the winter season.
4.3.3 TOTAL RESERVOIR LOAD SUMMARY
Cutler Reservoir receives 127,402 kg TP during the summer season and 119,829 kg TP during the winter season. During the summer season, the primary drainages delivering phosphorus to the reservoir are Swift Slough, Spring Creek, and the Southern Reservoir direct drainage to the south and Bear River in the north. Together these tributaries account for 74% of the TP load to the reservoir during the summer. Another 13% is derived from internal/unknown sources in the Southern Reservoir. In the winter season, the primary drainages delivering phosphorus to Cutler Reservoir are Swift Slough and Spring Creek in the south and Bear River in the north. Together these tributaries comprise 67% of the total load to the reservoir during the winter season. Another 9% is derived from internal loading to the water column from reservoir sediments in the Southern Reservoir and unknown sources. In addition, Swift Slough carries a larger load in total for this season because all of the Logan Regional WWTP effluent is discharged to Swift Slough during these months; whereas discharge is split between Swift Slough and an irrigation canal during the summer season. The load from the direct drainage area is likewise smaller in the winter because there is no irrigation return flow of WWTP effluent, while there is in the summer (Table 4.31).
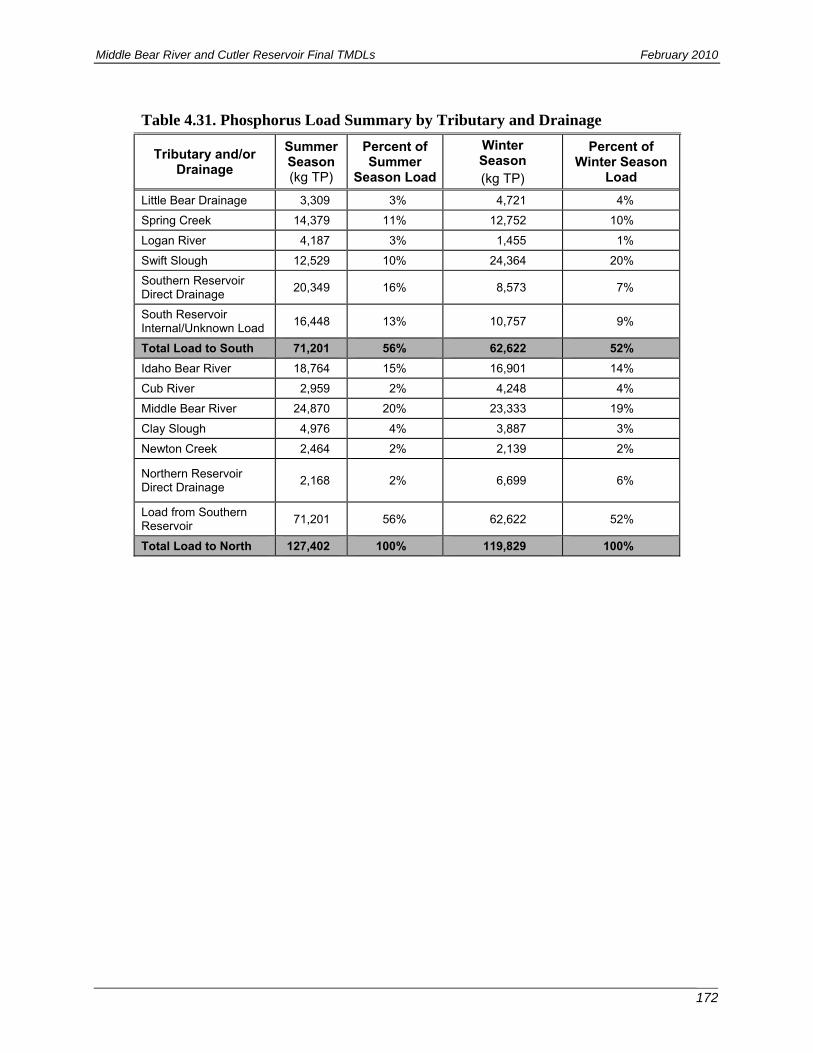
Middle Bear River and Cutler Reservoir Final TMDLs February 2010
172
Table 4.31. Phosphorus Load Summary by Tributary and Drainage
Tributary and/or Drainage
Summer Season (kg TP)
Percent of Summer
Season Load
Winter Season (kg TP)
Percent of Winter Season
Load
Little Bear Drainage 3,309 3% 4,721 4%
Spring Creek 14,379 11% 12,752 10%
Logan River 4,187 3% 1,455 1%
Swift Slough 12,529 10% 24,364 20%
Southern Reservoir Direct Drainage
20,349 16% 8,573 7%
South Reservoir Internal/Unknown Load
16,448 13% 10,757 9%
Total Load to South 71,201 56% 62,622 52%
Idaho Bear River 18,764 15% 16,901 14%
Cub River 2,959 2% 4,248 4%
Middle Bear River 24,870 20% 23,333 19%
Clay Slough 4,976 4% 3,887 3%
Newton Creek 2,464 2% 2,139 2%
Northern Reservoir Direct Drainage
2,168 2% 6,699 6%
Load from Southern Reservoir
71,201 56% 62,622 52%
Total Load to North 127,402 100% 119,829 100%
Middle Bear River and Cutler Reservoir Final TMDLs February 2010
173
CHAPTER 5 RESERVOIR MODELING USING BATHTUB
5.1 MODEL SELECTION
Several different water quality models were considered for the Cutler Reservoir TMDL including CE-QUAL-W2, QUAL2E/2K, BATHTUB, PREWET, and WiLMS. In consultation with the Cutler Reservoir Technical Advisory Committee, the UDWQ selected the BATHTUB model for Cutler Reservoir in December 2005. BATHTUB was determined to be the most appropriate model for a shallow reservoir system with prediction capabilities for most of the parameters of interest to the Cutler Reservoir TMDL. The ability to run the BATHTUB model on a seasonal rather than a daily timestep best fit the discrete dataset available for the TMDL process. A short summary of all of the models considered for the Cutler Reservoir TMDL including the advantages, disadvantages, and data inputs, is provided in the following subsections.
5.1.1 BATHTUB
The BATHTUB reservoir model was developed by the U.S. Army Corps of Engineers as an empirical model for predicting eutrophication in reservoirs. The model predicts reservoir response in a spatially segmented reservoir under steady-state conditions using empirical relationships derived from assessments of hundreds of reservoirs (Walker 1999). Model outputs include tabular and/or graphic displays of segment hydraulics, water and nutrient balances, predictions of nutrient concentrations, transparency (Secchi Depth), chlorophyll a concentrations, and oxygen depletion in deep reservoirs (Walker 1999). The model performs mass loading and water balance computations. The model uses a series of empirical eutrophication models to account for constituent (including nutrients) advective and diffusive transport, and sedimentation.
Model inputs include reservoir morphometry (mean depth, length, width, mixed-layer depth), hydraulic connectivity (between reservoir segments and tributaries), tributary water quality (total nutrients, dissolved nutrients, and flow), and climatic parameters (precipitation and evapotranspiration). The model uses empirical equations for physical processes—advective transport, diffusive transport, and nutrient sedimentation—to predict nutrient concentrations and reservoir water quality (Walker 1999).
Model applications are limited to steady-state evaluations of relations between nutrient loading, transparency, hydrology, and eutrophication response. Short-term responses and effects related to structural modifications or responses to variables other than nutrients cannot be explicitly evaluated using this suite of models. The level of uncertainty in model projections is proportional to the variability and level of uncertainty (lack of data) in the available flow and water quality datasets. Statistics relating observed and predicted values are also provided. More details on model inputs are available in Walker (1999) and summarized for Cutler Reservoir in Section 5.2.
5.1.2 CE-QUAL-W2
CE-QUAL-W2 is a two dimensional, laterally averaged, hydrodynamic, water quality model. The model assumes lateral homogeneity and is therefore best applied to relatively long and narrow waterbodies (rivers, lakes, reservoirs). By using separate, correlated models, branched networks can be modeled. Water quality features include eutrophication kinetics and algal growth. Bottom sediment capabilities include settled particles, nutrient releases to the water
Middle Bear River and Cutler Reservoir Final TMDLs February 2010
174
column, and user-modulated sediment oxygen demand (a version with expanded sediment modeling capability is under development). The model is limited in that it requires continuous flow and water quality data. This can be overcome by interfacing with a watershed and stream model that extrapolate daily flow values from a discrete dataset. The resulting additional level of uncertainty in model projections is in direct proportion to the variability and level of uncertainty (lack of data) in the available flow dataset. CE-QUAL-W2 is typically run at a daily timestep and therefore requires daily data inputs from all tributaries feeding the reservoir.
5.1.3 QUAL2E/2K
QUAL2E is a one dimensional, steady state models that simulates non-uniform steady flow and water quality in well-mixed streams and rivers, but not reservoirs. This model is not appropriate for modeling unsteady flows, or for areas receiving highly variable pollutant loads. However, the model can simulate daily variations in meteorological conditions affecting water temperature and algal photosynthesis. Water temperature and diurnal heat budget are simulated as a function of diurnal meteorological data. Similarly, all water quality variables are simulated on a diurnal time scale, therefore requiring data inputs on a subdaily time scale. Point and nonpoint loadings are also simulated. It was developed as a planning tool for developing TMDLs in streams and is currently incorporated into the Little Bear River model developed by USU and used in the load analysis for this TMDL. Model limitations are similar to CE-QUAL-W2, in that it requires continuous flow and water quality inputs.
QUAL2K is an updated version of QUAL2E and includes the ability to designate unequally spaced reaches with multiple loadings for the following simulations:
1) slow oxidizing carbonaceous BOD, rapidly oxidizing carbonaceous BOD, and detritus (carbon, nitrogen and phosphorus);
2) denitrification occurring at low DO concentrations; 3) sediment-water fluxes of DO and nutrients as a function of settling particulate organic
matter, reactions within the sediments, and the concentrations of soluble forms in the overlying waters;
4) attached bottom algae; calculation of light extinction as a function of algae, detritus and inorganic solids; calculation of pH as a function of alkalinity and total inorganic carbon; and
5) generic pathogen and removal as a function of temperature, light and settling rates.
QUAL2K is an excellent model for systems with uniform flow, but was found not to be applicable to the complex flow conditions in Cutler Reservoir. Further, the level of detail required to define boundary conditions for Cutler Reservoir into numerous small linked segments of the reservoir was not available. In addition, QUAL2K also would not account for respiration associated with macrophytes or periphyton for the Cutler Reservoir system. Daily data sets (measured, interpolated, or watershed model) would be required for each tributary input to drive the model. It was determined that increasing model complexity without the data to drive and calibrate the model would dramatically increase the uncertainty associated with the output. For this reason, the simpler BATHTUB model was selected for total phosphorus modeling and the uncertainty associated with the linkage between nutrients and dissolved oxygen in the reservoir was made explicit through a qualitative linkage analysis.
Middle Bear River and Cutler Reservoir Final TMDLs February 2010
175
5.1.4 BASINS (BETTER ASSESSMENT SCIENCE INTEGRATING POINT AND NONPOINT
SOURCES)
This watershed model is designed for download of specific GIS data input (by EPA region) and meteorological data (by state). The model integrates and displays information on land use, point source discharges, water supply withdrawals and other attributes at a user-defined scale. The software allows local data import, land use, DEM reclassification, watershed delineation, water quality data, and access to national environmental information; with application of a variety of nonpoint loading and water quality models. The model allows the user to assess water quality data at selected stream sites or throughout an entire watershed. Other models can be incorporated into a BASINS model including HSPF, TOXIROUTE, and QUAL2E. Post-processing tools provide excellent visualization for interpreting water quality modeling results. Model limitations are similar to those discussed for CE-QUAL-W2 and QUAL 2E as described above. Further, this model is not designed to simulate water quality in reservoirs.
Tools included with the model (version 3.1) allow prediction of the effects of various artificial features such as urban developments, small detention reservoirs, or lined channels on flood hydrographs and sediment yield. Also included in the model are the analyses of sediment issues using a Rosgen-based index; analysis of likely effects on the aquatic biota in receiving waters, and automated model calibration and quantification of the uncertainty associated with specific model predictions.
5.1.5 PREWET
PREWET is a screening-level, analytical model for estimating water quality improvement provided by wetlands with a minimal amount of data (basic characteristics). The model calculates pollutant removal efficiencies, total suspended solids, total coliform bacteria, BOD, total nitrogen, TP, and other chemicals (e.g., organic chemicals and trace metals). The calculated removal efficiency is dependent on detention time and removal rate for the specific constituent, microbial metabolism, adsorption, volatilization, denitrification, settling, etc., and ambient conditions, such as water temperature. Literature values or mathematical formulations for dominant long-term removal mechanisms are used in the calculation of removal efficiencies.
5.1.6 WISCONSIN LAKE MODELING SUITE
The Wisconsin Lake Modeling Suite (WiLMS) suite of models is designed to evaluate the impact of phosphorus loading on lake and reservoir water quality with specific application to shallow lakes and reservoirs. WiLMS includes an export coefficient-driven watershed loading module, with thirteen annualized empirical lake and reservoir response models that are coupled with trophic response, evaluation routines, and uncertainty analysis. This suite of models can be used to project a high level estimate of the impact of various land use and point source management alternatives on receiving water quality and phosphorus sediment delivery rates given different land uses. It can also consider point sources of phosphorus such as WWTPs and septic systems as well as nonpoint sources. The model suite is designed to sum annual phosphorus loading from all sources’ predict lake TP levels for spring overturn, predict growing season means, or annual average concentrations; predict trophic response specific to internal loads; and identify lake eutrophication potential.
Data inputs include tributary drainage area (the area contributing surface water runoff and nutrient loading), annual runoff volume from the tributary drainage area, lake/reservoir surface area and volume, and net precipitation expressed as precipitation minus evaporation. Model limitations relate to the general nature of the model being specific to lakes in Wisconsin and its application as a screening tool only.
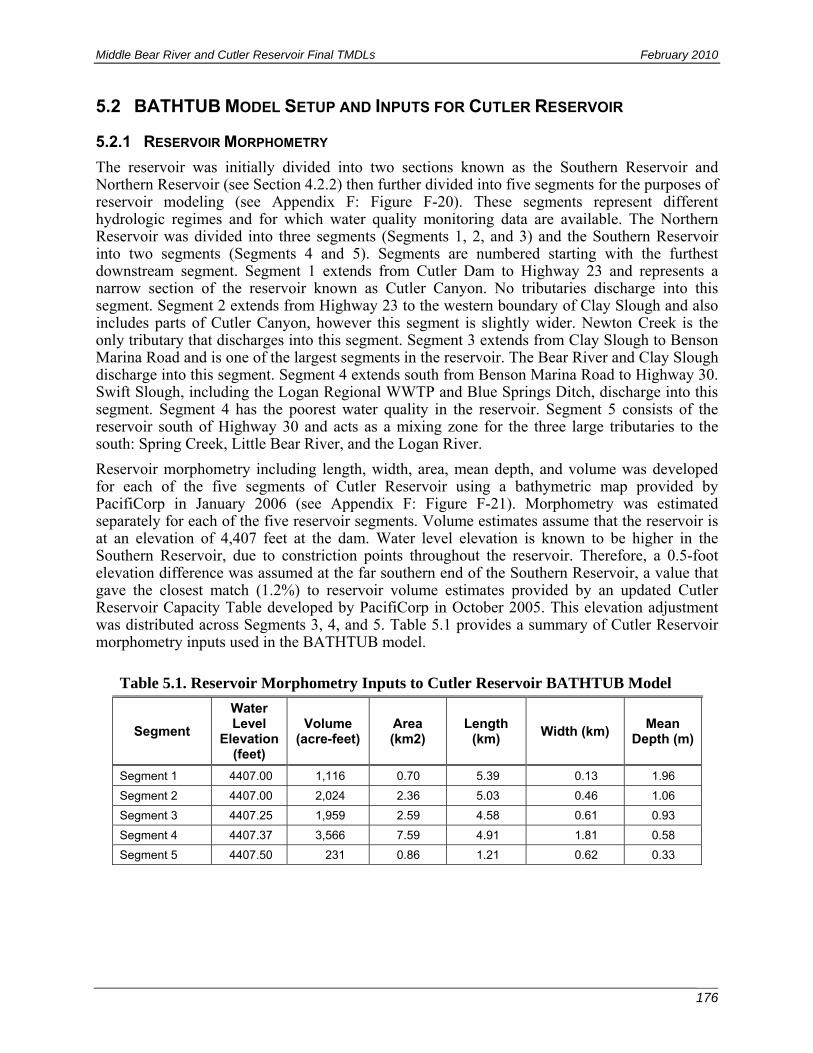
Middle Bear River and Cutler Reservoir Final TMDLs February 2010
176
5.2 BATHTUB MODEL SETUP AND INPUTS FOR CUTLER RESERVOIR
5.2.1 RESERVOIR MORPHOMETRY
The reservoir was initially divided into two sections known as the Southern Reservoir and Northern Reservoir (see Section 4.2.2) then further divided into five segments for the purposes of reservoir modeling (see Appendix F: Figure F-20). These segments represent different hydrologic regimes and for which water quality monitoring data are available. The Northern Reservoir was divided into three segments (Segments 1, 2, and 3) and the Southern Reservoir into two segments (Segments 4 and 5). Segments are numbered starting with the furthest downstream segment. Segment 1 extends from Cutler Dam to Highway 23 and represents a narrow section of the reservoir known as Cutler Canyon. No tributaries discharge into this segment. Segment 2 extends from Highway 23 to the western boundary of Clay Slough and also includes parts of Cutler Canyon, however this segment is slightly wider. Newton Creek is the only tributary that discharges into this segment. Segment 3 extends from Clay Slough to Benson Marina Road and is one of the largest segments in the reservoir. The Bear River and Clay Slough discharge into this segment. Segment 4 extends south from Benson Marina Road to Highway 30. Swift Slough, including the Logan Regional WWTP and Blue Springs Ditch, discharge into this segment. Segment 4 has the poorest water quality in the reservoir. Segment 5 consists of the reservoir south of Highway 30 and acts as a mixing zone for the three large tributaries to the south: Spring Creek, Little Bear River, and the Logan River.
Reservoir morphometry including length, width, area, mean depth, and volume was developed for each of the five segments of Cutler Reservoir using a bathymetric map provided by PacifiCorp in January 2006 (see Appendix F: Figure F-21). Morphometry was estimated separately for each of the five reservoir segments. Volume estimates assume that the reservoir is at an elevation of 4,407 feet at the dam. Water level elevation is known to be higher in the Southern Reservoir, due to constriction points throughout the reservoir. Therefore, a 0.5-foot elevation difference was assumed at the far southern end of the Southern Reservoir, a value that gave the closest match (1.2%) to reservoir volume estimates provided by an updated Cutler Reservoir Capacity Table developed by PacifiCorp in October 2005. This elevation adjustment was distributed across Segments 3, 4, and 5. Table 5.1 provides a summary of Cutler Reservoir morphometry inputs used in the BATHTUB model.
Table 5.1. Reservoir Morphometry Inputs to Cutler Reservoir BATHTUB Model
Segment
Water Level
Elevation (feet)
Volume (acre-feet)
Area (km2)
Length (km)
Width (km) Mean
Depth (m)
Segment 1 4407.00 1,116 0.70 5.39 0.13 1.96
Segment 2 4407.00 2,024 2.36 5.03 0.46 1.06
Segment 3 4407.25 1,959 2.59 4.58 0.61 0.93
Segment 4 4407.37 3,566 7.59 4.91 1.81 0.58
Segment 5 4407.50 231 0.86 1.21 0.62 0.33
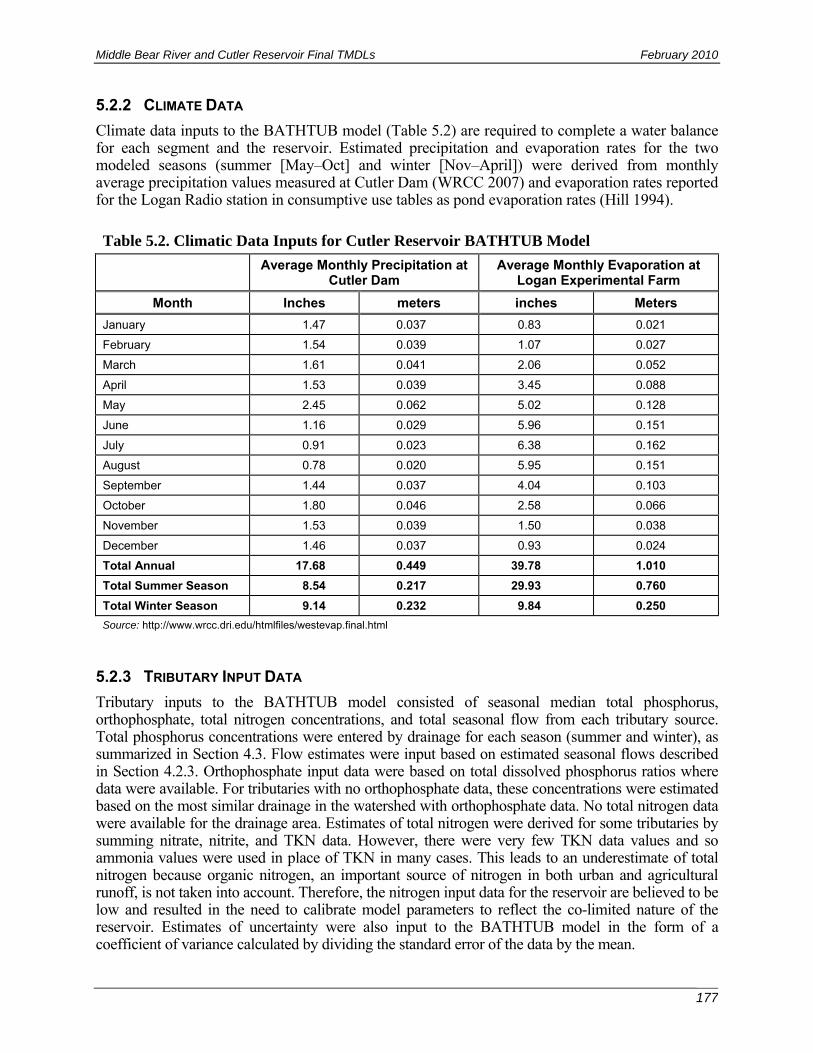
Middle Bear River and Cutler Reservoir Final TMDLs February 2010
177
5.2.2 CLIMATE DATA
Climate data inputs to the BATHTUB model (Table 5.2) are required to complete a water balance for each segment and the reservoir. Estimated precipitation and evaporation rates for the two modeled seasons (summer [May–Oct] and winter [Nov–April]) were derived from monthly average precipitation values measured at Cutler Dam (WRCC 2007) and evaporation rates reported for the Logan Radio station in consumptive use tables as pond evaporation rates (Hill 1994).
Table 5.2. Climatic Data Inputs for Cutler Reservoir BATHTUB Model
Average Monthly Precipitation at Cutler Dam
Average Monthly Evaporation at Logan Experimental Farm
Month Inches meters inches Meters
January 1.47 0.037 0.83 0.021
February 1.54 0.039 1.07 0.027
March 1.61 0.041 2.06 0.052
April 1.53 0.039 3.45 0.088
May 2.45 0.062 5.02 0.128
June 1.16 0.029 5.96 0.151
July 0.91 0.023 6.38 0.162
August 0.78 0.020 5.95 0.151
September 1.44 0.037 4.04 0.103
October 1.80 0.046 2.58 0.066
November 1.53 0.039 1.50 0.038
December 1.46 0.037 0.93 0.024
Total Annual 17.68 0.449 39.78 1.010
Total Summer Season 8.54 0.217 29.93 0.760
Total Winter Season 9.14 0.232 9.84 0.250
Source: http://www.wrcc.dri.edu/htmlfiles/westevap.final.html
5.2.3 TRIBUTARY INPUT DATA
Tributary inputs to the BATHTUB model consisted of seasonal median total phosphorus, orthophosphate, total nitrogen concentrations, and total seasonal flow from each tributary source. Total phosphorus concentrations were entered by drainage for each season (summer and winter), as summarized in Section 4.3. Flow estimates were input based on estimated seasonal flows described in Section 4.2.3. Orthophosphate input data were based on total dissolved phosphorus ratios where data were available. For tributaries with no orthophosphate data, these concentrations were estimated based on the most similar drainage in the watershed with orthophosphate data. No total nitrogen data were available for the drainage area. Estimates of total nitrogen were derived for some tributaries by summing nitrate, nitrite, and TKN data. However, there were very few TKN data values and so ammonia values were used in place of TKN in many cases. This leads to an underestimate of total nitrogen because organic nitrogen, an important source of nitrogen in both urban and agricultural runoff, is not taken into account. Therefore, the nitrogen input data for the reservoir are believed to be low and resulted in the need to calibrate model parameters to reflect the co-limited nature of the reservoir. Estimates of uncertainty were also input to the BATHTUB model in the form of a coefficient of variance calculated by dividing the standard error of the data by the mean.
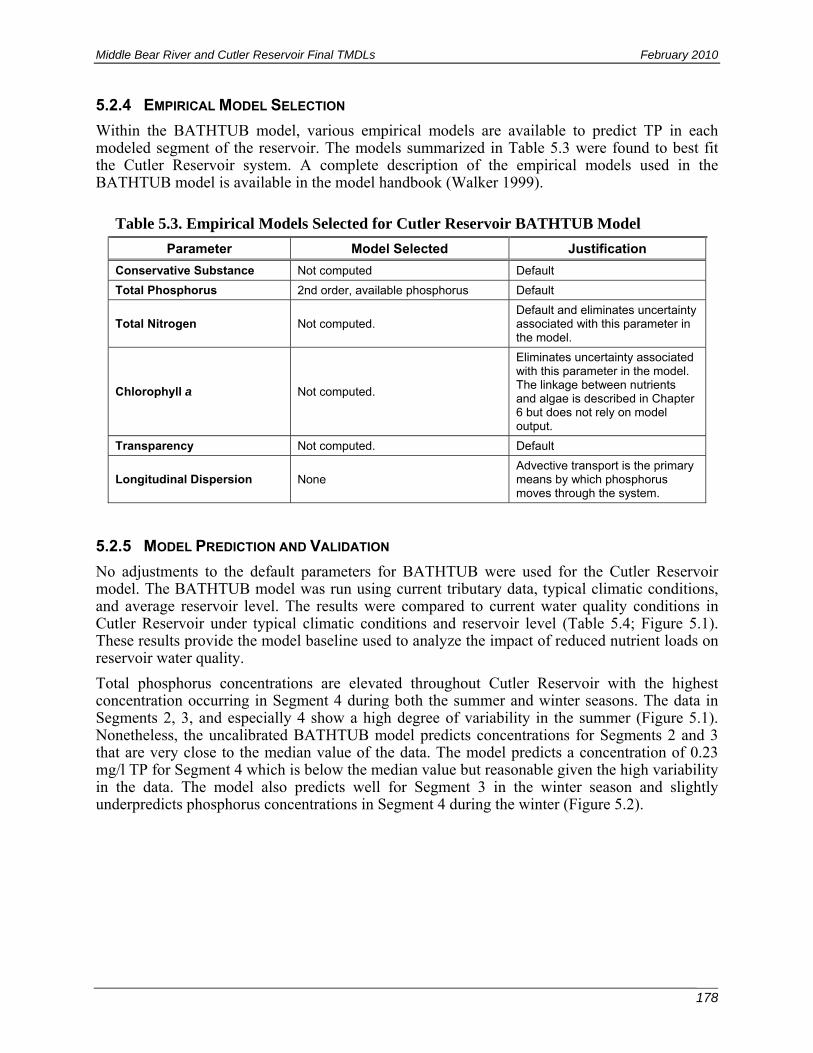
Middle Bear River and Cutler Reservoir Final TMDLs February 2010
178
5.2.4 EMPIRICAL MODEL SELECTION
Within the BATHTUB model, various empirical models are available to predict TP in each modeled segment of the reservoir. The models summarized in Table 5.3 were found to best fit the Cutler Reservoir system. A complete description of the empirical models used in the BATHTUB model is available in the model handbook (Walker 1999).
Table 5.3. Empirical Models Selected for Cutler Reservoir BATHTUB Model
Parameter Model Selected Justification
Conservative Substance Not computed Default
Total Phosphorus 2nd order, available phosphorus Default
Total Nitrogen Not computed. Default and eliminates uncertainty associated with this parameter in the model.
Chlorophyll a Not computed.
Eliminates uncertainty associated with this parameter in the model. The linkage between nutrients and algae is described in Chapter 6 but does not rely on model output.
Transparency Not computed. Default
Longitudinal Dispersion None Advective transport is the primary means by which phosphorus moves through the system.
5.2.5 MODEL PREDICTION AND VALIDATION
No adjustments to the default parameters for BATHTUB were used for the Cutler Reservoir model. The BATHTUB model was run using current tributary data, typical climatic conditions, and average reservoir level. The results were compared to current water quality conditions in Cutler Reservoir under typical climatic conditions and reservoir level (Table 5.4; Figure 5.1). These results provide the model baseline used to analyze the impact of reduced nutrient loads on reservoir water quality.
Total phosphorus concentrations are elevated throughout Cutler Reservoir with the highest concentration occurring in Segment 4 during both the summer and winter seasons. The data in Segments 2, 3, and especially 4 show a high degree of variability in the summer (Figure 5.1). Nonetheless, the uncalibrated BATHTUB model predicts concentrations for Segments 2 and 3 that are very close to the median value of the data. The model predicts a concentration of 0.23 mg/l TP for Segment 4 which is below the median value but reasonable given the high variability in the data. The model also predicts well for Segment 3 in the winter season and slightly underpredicts phosphorus concentrations in Segment 4 during the winter (Figure 5.2).
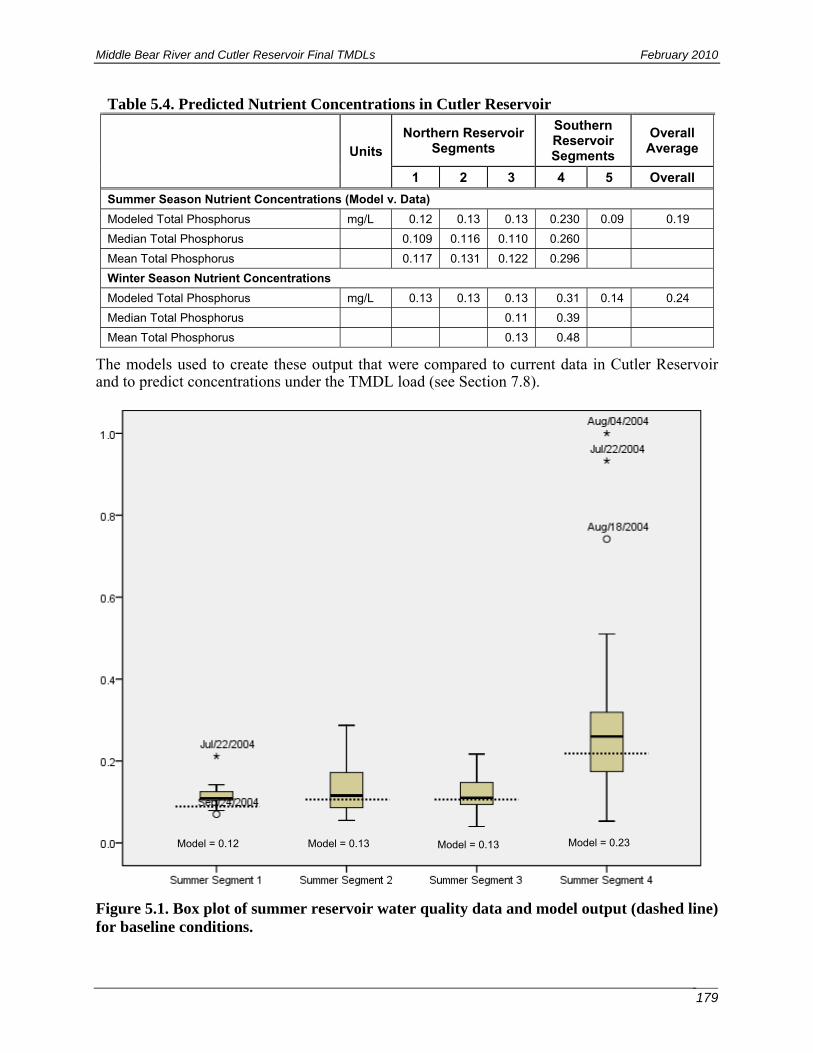
Middle Bear River and Cutler Reservoir Final TMDLs February 2010
179
Table 5.4. Predicted Nutrient Concentrations in Cutler Reservoir
Units Northern Reservoir
Segments
Southern Reservoir Segments
Overall Average
1 2 3 4 5 Overall
Summer Season Nutrient Concentrations (Model v. Data)
Modeled Total Phosphorus mg/L 0.12 0.13 0.13 0.230 0.09 0.19
Median Total Phosphorus 0.109 0.116 0.110 0.260
Mean Total Phosphorus 0.117 0.131 0.122 0.296
Winter Season Nutrient Concentrations
Modeled Total Phosphorus mg/L 0.13 0.13 0.13 0.31 0.14 0.24
Median Total Phosphorus 0.11 0.39
Mean Total Phosphorus 0.13 0.48
The models used to create these output that were compared to current data in Cutler Reservoir and to predict concentrations under the TMDL load (see Section 7.8).
Figure 5.1. Box plot of summer reservoir water quality data and model output (dashed line) for baseline conditions.
Model = 0.12 Model = 0.13 Model = 0.13 Model = 0.23
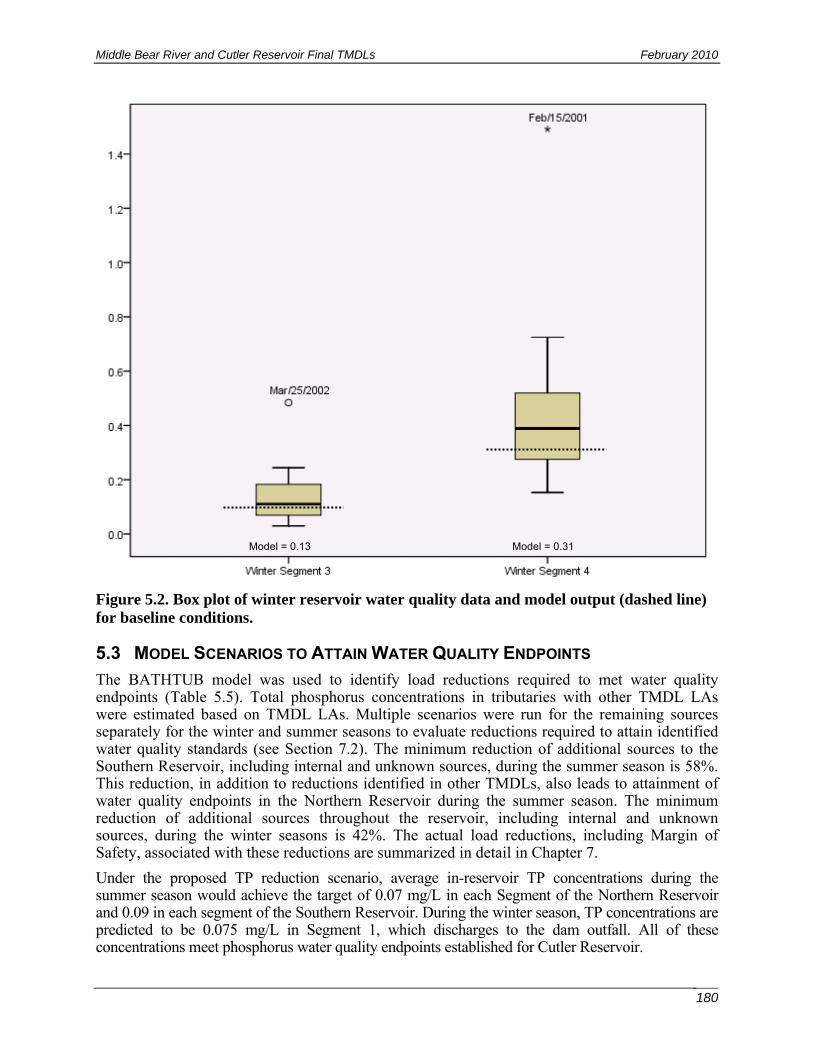
Middle Bear River and Cutler Reservoir Final TMDLs February 2010
180
Figure 5.2. Box plot of winter reservoir water quality data and model output (dashed line) for baseline conditions.
5.3 MODEL SCENARIOS TO ATTAIN WATER QUALITY ENDPOINTS
The BATHTUB model was used to identify load reductions required to met water quality endpoints (Table 5.5). Total phosphorus concentrations in tributaries with other TMDL LAs were estimated based on TMDL LAs. Multiple scenarios were run for the remaining sources separately for the winter and summer seasons to evaluate reductions required to attain identified water quality standards (see Section 7.2). The minimum reduction of additional sources to the Southern Reservoir, including internal and unknown sources, during the summer season is 58%. This reduction, in addition to reductions identified in other TMDLs, also leads to attainment of water quality endpoints in the Northern Reservoir during the summer season. The minimum reduction of additional sources throughout the reservoir, including internal and unknown sources, during the winter seasons is 42%. The actual load reductions, including Margin of Safety, associated with these reductions are summarized in detail in Chapter 7.
Under the proposed TP reduction scenario, average in-reservoir TP concentrations during the summer season would achieve the target of 0.07 mg/L in each Segment of the Northern Reservoir and 0.09 in each segment of the Southern Reservoir. During the winter season, TP concentrations are predicted to be 0.075 mg/L in Segment 1, which discharges to the dam outfall. All of these concentrations meet phosphorus water quality endpoints established for Cutler Reservoir.
Model = 0.13 Model = 0.31
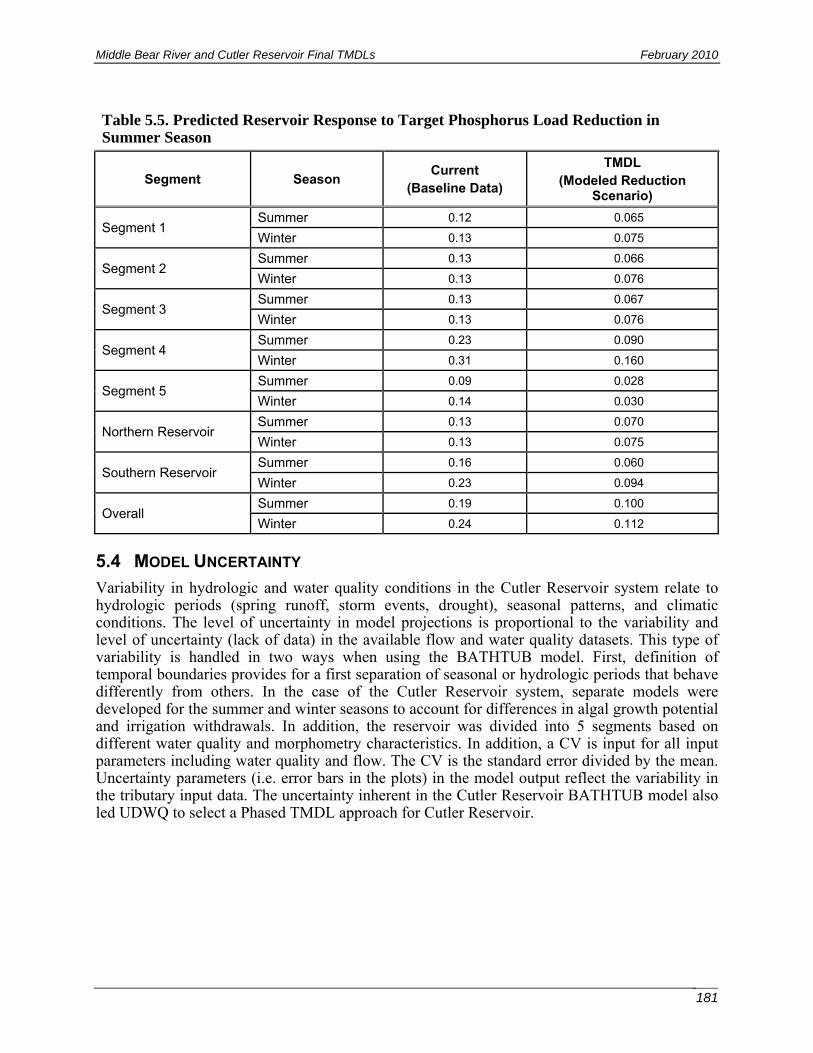
Middle Bear River and Cutler Reservoir Final TMDLs February 2010
181
Table 5.5. Predicted Reservoir Response to Target Phosphorus Load Reduction in Summer Season
Segment Season Current
(Baseline Data)
TMDL (Modeled Reduction
Scenario)
Segment 1 Summer 0.12 0.065
Winter 0.13 0.075
Segment 2 Summer 0.13 0.066
Winter 0.13 0.076
Segment 3 Summer 0.13 0.067
Winter 0.13 0.076
Segment 4 Summer 0.23 0.090
Winter 0.31 0.160
Segment 5 Summer 0.09 0.028
Winter 0.14 0.030
Northern Reservoir Summer 0.13 0.070
Winter 0.13 0.075
Southern Reservoir Summer 0.16 0.060
Winter 0.23 0.094
Overall Summer 0.19 0.100
Winter 0.24 0.112
5.4 MODEL UNCERTAINTY
Variability in hydrologic and water quality conditions in the Cutler Reservoir system relate to hydrologic periods (spring runoff, storm events, drought), seasonal patterns, and climatic conditions. The level of uncertainty in model projections is proportional to the variability and level of uncertainty (lack of data) in the available flow and water quality datasets. This type of variability is handled in two ways when using the BATHTUB model. First, definition of temporal boundaries provides for a first separation of seasonal or hydrologic periods that behave differently from others. In the case of the Cutler Reservoir system, separate models were developed for the summer and winter seasons to account for differences in algal growth potential and irrigation withdrawals. In addition, the reservoir was divided into 5 segments based on different water quality and morphometry characteristics. In addition, a CV is input for all input parameters including water quality and flow. The CV is the standard error divided by the mean. Uncertainty parameters (i.e. error bars in the plots) in the model output reflect the variability in the tributary input data. The uncertainty inherent in the Cutler Reservoir BATHTUB model also led UDWQ to select a Phased TMDL approach for Cutler Reservoir.

Middle Bear River and Cutler Reservoir Final TMDLs February 2010
182
This page intentionally blank.

Middle Bear River and Cutler Reservoir Final TMDLs February 2010
183
CHAPTER 6 LINKAGE ANALYSIS AND RESERVOIR DYNAMICS
Nutrients are linked to beneficial uses in Cutler Reservoir via algal growth, turbidity, DO, and macrophytes. In addition to low DO, other concerns associated with elevated nutrient inputs include nuisance levels of algal and periphyton growth (increased turbidity and organic sediments), elevated pH, and cyanotoxins from cyanobacteria (blue-green algae) growth.
These mechanisms and interacting linkages are summarized in the following sections and displayed visually in a system diagram for Cutler Reservoir (Appendix F: Figure F-15). In addition, a diagram of data availability and uncertainty associated with individual components of the Cutler Reservoir hydrologic and ecological system is available in Appendix F: Figure F-17.
6.1 UNIQUE PROPERTIES OF CUTLER RESERVOIR
Cutler Reservoir is a unique and heterogenous reservoir. Some parts of the reservoir resemble a slow moving shallow river while other parts are best defined as wetland habitat. The Southern Reservoir is generally shallow, wide, and slow moving with extensive areas of wetland and marsh habitat. In shallow lakes, end of season decomposition of macrophytes and algae can severely reduce oxygen content of the entire water body and result in fish and macroinvertebrate kills (Wetzel 2001). The effects of low DO on the warm water fishery in Cutler Reservoir may be exacerbated due to the greater potential for nutrient cycling from sediments (Welch and Lindell 1992), lack of a refuge from anoxic and warm conditions, high and low temperature extremes, and dense macrophyte growth.
The Northern Reservoir is deeper, faster moving, and narrower due to the flow from the Bear River, which enters the reservoir north of Benson Marina and flows directly toward Cutler Canyon to the dam. Several oxbows and sloughs exist throughout the reservoir, which are characterized by slow-moving, often stagnant areas of water. Such conditions are found in Clay Slough, the oxbow formed by the old Bear River channel in the Northern Reservoir, and Swift Slough in the Southern Reservoir. There are many other unnamed sloughs and stagnant areas around the edge of Cutler Reservoir. As a result, water chemistry, vegetation, and flow conditions vary widely throughout the reservoir. Therefore, averaging of data from multiple locations must be done with attention to the hydrologic and habitat differences through the reservoir. Water quality in these stagnant littoral areas of the reservoir is generally worse than water quality conditions in the open free-flowing portions of the reservoir.
6.2 DISSOLVED OXYGEN AND AQUATIC LIFE
The linkage between nutrients, algal and plant growth, and diurnal fluctuations in oxygen concentrations resulting in low night-time DO is well established in the limnology literature (Schindler 1977; Schindler et al. 1978; Welch and Lindell 1992; Wetzel 2001; Morgan et al. 2006; Ryding and Rast 1989). The observation of diurnal DO flux in Cutler Reservoir is a clear indication of nighttime respiration and daytime photosynthesis, and occurs in both the open water and littoral areas of the reservoir (Budy et al. 2007). Dissolved oxygen is generally highest in the early afternoon when sunlight is at its peak and photosynthesis is occurring at maximum levels. This is followed by a decline in oxygen concentrations over time as light levels and photosynthesis decrease. Although photosynthesis is the dominant oxygen-exchange process during the day, respiration (where plants take in oxygen and give off carbon dioxide) is constantly occurring. During low- and no-light hours, respiration is the dominant oxygen-exchange process, resulting in a nightly sag in water column DO (generally shortly before dawn) when oxygen uptake by algae and aquatic plants reaches its peak (Wetzel 2001). The resulting

Middle Bear River and Cutler Reservoir Final TMDLs February 2010
184
depletions in nighttime DO concentrations affect fish by causing physical stress, increasing susceptibility to disease, slowing growth, limiting habitat availability, and altering behaviors such as predator avoidance, feeding, migration, and reproduction (Welch and Lindell 1992). Low DO levels can affect fish indirectly by reducing the quality and quantity of suitable habitats and by reducing the habitats and abundance of prey species (Budy et al. 2007). Extremely low oxygen levels lead to cellular breakdown and mortality in fish. Over the long term, elevated nutrient inputs (eutrophication) can reduce the diversity of fish and their associated food chains to only those species tolerant of low DO concentrations (Welch and Lindell 1992).
6.2.1 ACUTE AND CHRONIC IMPACTS OF LOW DO ON FISH
High concentrations of DO (6–8 mg/L or greater) are necessary for the health and viability of fish and other aquatic life. Low concentrations of DO (below 4 mg/L) can result in stress to aquatic species, lowered resistance to environmental stressors, and even death at very low levels (less than 2 mg/L). Thresholds of DO for fish vary by species and a number of environmental conditions such as water temperature and hardness. Generally fish are more tolerant to low oxygen levels at cold temperatures and low hardness. Nighttime oxygen sags followed by daytime oxygen supersaturation generally occur in summer and can affect fish at both extremes. Nighttime oxygen sags generally last a few hours, but short exposure to concentrations of 3.1 mg/L or less in summer and 1.4 mg/L or less in winter are regarded as hazardous or lethal to most fish (McKee and Wolf 1963). Low DO caused by algal blooms was implicated in two-thirds of all fish kills where the cause was known in canals and tidal creeks and rivers of the Coastal Bays Region (Luckett and Poukish 2004). Lowest observed concentrations at which certain fish groups died or survived after 24 hours in summer varied considerably by species (Table 6.1) and may partly explain persistence of certain “rough species” such as carp and bullheads and low levels of more desirable sportfish such as trout, bass, and sunfish.
Table 6.1. 24-hour Lethal DO Concentrations for Fish
Species Lowest Concentration (mg/L) at
Which Fish Survived for 24 Hours Concentrations (mg/L) at Which
Fish Died in 24 Hours
Bass 5.5 3.1
Black Bullhead 3.3 2.9
Black Crappie 5.5 4.2
Carp 1.3 <1.0
Sunfish 4.2 3.1
Trout 6.0 5.0
Yellow Perch 4.4 3.1
Source: McKee and Wolf 1963; Wozniewski and Opuszynski 1988; Schofield et al. 2005
Lethal low oxygen concentrations for carp in a laboratory study varied from 1.3 to 0.7 mg/L (Wozniewski and Opuszynski 1988). In addition to direct effects on aquatic life, low DO concentrations can change water and sediment chemistry, which can influence the concentration and mobility of nutrients and toxins in the water column (e.g., phosphorus, ammonia, and mercury). Low DO at the bottom can result in substantial releases of adsorbed nutrients to the water column, which in turn can lead to increased algal growth and further decrease the DO concentration in a waterbody.

Middle Bear River and Cutler Reservoir Final TMDLs February 2010
185
Developing embryos and young emergent fish are especially sensitive to changes in DO concentrations. Small fish often shelter near the shoreline (littoral) areas, which provide the best vegetative cover. As these areas experience the changeover from photosynthesis to respiration, the shallow water column can become depleted of oxygen quickly and young fish can be stressed or die due to the low concentrations. Low DO levels at the sediment/water interface also represent a concern related to the food chain. Anoxia (low to no DO) can have adverse effects on benthic organisms (lower life forms that live in the bottom sediments) and other macroinvertebrates, which are a food source for many fish and bird species.
A recent literature review by Breitburg (2002) summarized field research on the effect of declining DO concentrations on fisheries. The collected works show that as oxygen concentrations decrease, the abundance and diversity of fish species decline. Longer exposure to low oxygen and more severe hypoxia led to avoidance of and migration from the affected area. All larval, juvenile, and adult fish in the surveyed studies responded to low DO by moving upward or laterally away from waters with low DO concentrations. Studies have shown that fish not only avoid lethal conditions, they avoid those that require greater energy expenditures for ventilation, which would result in reduced growth. Field and laboratory studies have documented that DO concentrations routinely avoided are two to three times higher than those that would lead to 50% mortality in a population (Breitburg 1990, 1992; Breitburg et al. 1997, 1999, 2001; Breitburg and Riedel 2005; Nebeker et al. 1992; Whitworth 1968; Seager et al. 2000).
6.2.2 DISSOLVED GAS SATURATION
The effects of oxygen supersaturation (more than 100% saturation) on fish are not as well known as the effects of oxygen sags. Oxygen supersaturation appears to be detrimental and sometimes lethal to fish at concentrations of greater than approximately 150% saturation, primarily because oxygen in water at supersaturated levels tends to form bubbles that destroy cells and membranes—i.e., gas bubble trauma (GBT). However, high concentrations of oxygen (at or slightly above 100% saturation) are often used to treat fish under stress, for transport, to promote growth, or to recover from disease treatment. Fish generally tolerate water supersaturated with oxygen quite well, at least temporarily. When water is supersaturated, fish control their oxygen uptake by reducing blood flow through the gills through reduced respiration.
Only a few studies have attributed GBT to excess oxygen. A bloom of Chlamydomonas increased DO to as high as 30 to 32 mg/L (>300% saturation) and was associated with a fish kill in which the dead fish exhibited characteristic gill and skin lesions from gas bubble disease (Woodbury 1942). A similar situation occurred in Galveston Bay, Texas, where fish mortality was observed after an algal bloom at a DO concentration of 250% (Renfro 1963). Trout and sunfish in a California lake died when oxygen reached 300% saturation because their gills were surrounded by oxygen bubbles (McKee and Wolf 1963). Bass and bluegill exposed to water supersaturated with oxygen showed no effect until concentrations reached 310% to 410% (Lassleben 1951). Oxygen supersaturation may add to multiple stressors without being the single cause of mortality. Common carp in ponds with 150% oxygen saturation had a higher incidence of disease than fish in ponds with 100% to 125% saturation (Lassleben 1951). Deaths of trout with whirling disease increased when the fish were subjected to additional stressors, including oxygen supersaturation (Schisler et al. 2000).
EPA has published dissolved gas supersaturation (DGS) water quality guidelines that recommend a maximum total gas pressure (TGP) of 110% of local atmospheric pressure (EPA 1986). This guideline has been adopted by most of the states, but it does not distinguish concentration requirements of the two primary gases—nitrogen and oxygen. No guidelines have been established for DGS or for oxygen supersaturation. Fish losses from DGS are most often
Middle Bear River and Cutler Reservoir Final TMDLs February 2010
186
attributed to excess nitrogen and not oxygen (Lassleben 1951); nitrogen at high concentrations comes out of solution to form gas bubbles around the eyes and in the fins.
Dissolved oxygen sampling in an instantaneous fashion does not generally capture the critical time frame for DO sags. The potential for these sags to occur during nighttime hours is directly related to the magnitude of growth occurring in the waterbody. As growth and photosynthesis act to increase DO in the water during daylight hours, the potential for nighttime DO sag to occur is proportional to the occurrence of supersaturation during daylight hours. Thus, exceedance of the DO saturation criteria during daylight discrete sampling events is indicative of low DO conditions during nighttime hours.
6.3 FACTORS INFLUENCING DO IN CUTLER RESERVOIR
6.3.1 ALGAL AND MACROPHYTE GROWTH
Excessive algae or periphyton growth is a good indicator of eutrophication or elevated nutrient loading to a surface water system. Nuisance aquatic growth, both algae (phytoplankton or water column algae and periphyton or attached algae) and rooted plants (macrophytes) can adversely affect both aquatic life and recreational water uses. Excessive algal growth can result in supersaturated DO concentrations during daylight hours followed by low DO conditions during nighttime hours (D’Avanzo and Kremer 1994). Algal growth also contributes to loading of organic material into the reservoir. Organic material can result in longer-term DO sags as oxygen is removed from the water column through decomposition (see Section 6.3.2, Sediment Oxygen Demand).
Algal blooms occur where nutrient concentrations (nitrogen and phosphorus) are sufficient to support growth (Dillon and Rigler 1974, Jones and Bachmann 1976, Ahlgren et al. 1988). Available nutrient concentrations, flow rates, velocities, water temperatures, and penetration of sunlight in the water column are all factors that influence algae (and macrophyte) growth (Wetzel 2001). Increased algal density and growth rates are often episodic, with algal blooms occurring in response to nutrient influx and favorable climatic conditions. Both the explosive growth and subsequent collapse of an algal bloom contribute to low DO concentrations. When conditions are appropriate and nutrient concentrations exceed the quantities needed to support algal growth, excessive blooms may develop (Wetzel 2001; Schlesinger 1997). Commonly, these blooms appear as extensive layers or algal mats on the surface of the water. Reservoir systems that experience low flow-through rates during the growing season, such as the southern section of Cutler Reservoir, can experience conditions that are optimal for algal growth and decomposition (Carpenter 1983).
Algae is not always damaging to water quality, however. The extent of negative effects is dependent on both the type(s) of algae present and the size, extent, and timing of the bloom. In many systems algae provide a critical food source for aquatic insects, which in turn serve as food for fish. Although some algal growth is natural and beneficial to river and reservoir systems, excessive growth can decrease DO through respiration and decomposition processes and is therefore often directly linked to the support status of aquatic life. Excessive algal growth can also shade the water below, which prevents photosynthesis and can contribute to the decline of submerged aquatic vegetation (Dennison et al. 1993). Submerged aquatic vegetation provides food for waterfowl and aquatic life and essential habitat for fish and other aquatic life. Algal growth is also commonly linked to the public’s aesthetic perception of water quality. Overgrowth of cyanobacteria has been associated in other systems with the occurrence of toxins and mortality to resident animal populations (Sabater and Admiraal 2005). Although cyanobacteria may be of
Middle Bear River and Cutler Reservoir Final TMDLs February 2010
187
low toxicity, cyanotoxins can become highly concentrated in the environment or through bioaccumulation where cyanobacterial overgrowth occurs.
Suspended algae are most commonly measured as chlorophyll a. A review of existing literature regarding nuisance thresholds and chlorophyll a (a surrogate measure of algal growth) was undertaken to identify generally accepted values based on current science and other regulatory processes. The review of aquatic life needs (Pilgrim et al. 2001) reported chlorophyll a concentrations of 10–15 μg/L to be protective of waters inhabited by salmonids, and 25–40 μg/L for waters inhabited by non-salmonids.
6.3.2 SEDIMENT OXYGEN DEMAND
Sediment oxygen demand (SOD) is the rate at which oxygen is consumed by sediments from the overlying water column. It can represent a large proportion of total oxygen uptake in aquatic systems (Hanes and Irvine 1968), and sediment nutrient release and SOD can have a significant impact on water quality. Sediment oxygen demand is an indirect result of high nutrient loading to aquatic systems resulting in overly productive growth of algae and macrophytes, and subsequent decay of that organic material.
Excessive algal or macrophyte growth (a state that originates from high nutrient loading to the system) results in the accumulation of decaying organic matter as bottom sediments in eutrophic systems. The biochemical processes that occur as the algae decompose remove oxygen from the surrounding water. Because most of the decomposition occurs within the lower levels of the water column, DO concentrations near the bottom of lakes and reservoirs can be substantially depleted by a large algal bloom and subsequent decomposition. In shallow, unstratified lakes, this process is somewhat offset by reaeration from wind action at the surface. Nonetheless, low DO can occur for prolonged periods throughout the water column, resulting in decreased fish habitat and even fish kills if the fish can find no oxygenated water in which to take refuge. Sediments and decaying organic material increase DO consumption due to the decomposition and chemical oxidation of sediments (Walker and Snodgrass 1986; Price et al. 1994). In addition, the accumulation of sediment and detritus favors bottom-feeding species such as carp, and tends to reduce the size and diversity of the zooplankton fauna (Haines 1973).
6.3.3 HYDRODYNAMICS AND MORPHOMETRY
Cutler Reservoir is long, narrow, and shallow, all factors that contribute to nutrient cycling, algal growth, and DO excursions patterns in the system. The shallower a lake, the more quickly eutrophication can occur once nutrient and oxygen balances are disturbed (Ryding and Rast 1989). This is because nutrient recycling from sediments is higher in shallower lakes (Carpenter 1983). Shallower lakes are also more easily influenced by wind patterns (Uhlmann 1982) that may stir internally derived phosphorus into the water column, making phosphorus more available to phytoplankton during the summer months—precisely when productivity would be otherwise phosphorus limited (Lazoff 1983).
The shape of a lake also influences eutrophication. Elongated water bodies may experience a longitudinal gradient in water quality due to differences in flushing rates as water moves through them (Ryding and Rast 1989).
The southern portion of Cutler Reservoir contains slow moving, shallow, wide sections and extensive areas of wetland and marsh habitat. The Northern Reservoir is deeper, faster moving, and narrower due to flow from the Bear River, which enters the reservoir north of Benson Marina and flows directly toward Cutler Canyon and out to the dam. Several oxbows and sloughs exist throughout the reservoir, which are characterized by slow-moving, often stagnant

Middle Bear River and Cutler Reservoir Final TMDLs February 2010
188
areas of water. Such conditions are found in Clay Slough, the oxbow formed by the old Bear River channel in the Northern Reservoir, and Swift Slough in the Southern Reservoir. There are many other unnamed sloughs and stagnant areas around the edge of Cutler Reservoir. As a result, water chemistry, vegetation, and flow conditions vary widely throughout the reservoir. Water quality in the reservoir’s stagnant littoral areas is generally worse than that in the open free-flowing portions. This relates to macrophyte growth and decay resulting in organic sediments with a relatively high sediment oxygen demand, as well as enhanced cycling of nutrients (see Section 6.3.4 regarding macrophyte cycling of phosphorus from sediment to the water column).
6.3.4 TURBIDITY
Turbidity from inorganic particles can limit algal growth due to light limitation, even if there are sufficient nutrients for algal blooms. In Cutler Reservoir, large populations of carp contribute to turbid conditions by stirring up bottom sediments and reducing aquatic macrophyte growth, which may confound efforts to measure sediment inputs into the system. Light limitation from large amounts of suspended inorganic particles can limit algal growth; however, turbidity is correlated with phytoplankton density in very productive aquatic systems (Wetzel 2001). Increased turbidity and nutrient levels created by foraging carp can alter primary productivity rates and subsequently alter zooplankton community structure (Lougheed et al. 1998). Turbidity thus reduces the potential for algal growth, and, thereby, oxygen fluctuations caused by algal growth and decay in the reservoir.
6.3.5 CLIMATE
Wind can influence DO concentrations and algal densities in the Cutler Reservoir system. Because it is a shallow, unstratified reservoir, oxygen is mixed into the entire water column by wind turbulence. Water aeration occurs when wind turbulence brings a greater volume of water into contact with air (through wave action), which allows more air to diffuse into the water column. Wind patterns on Cutler Reservoir may also relocate and concentrate surface algae, which can contribute to high-volume heterogeneous algal blooms. As a result, mean chlorophyll a values may overestimate or underestimate productivity in different areas of the reservoir due to wind distribution of suspended algae to shorelines and away from open water portions of the reservoir. In Cutler Reservoir, diurnal DO cycles may be influenced by wind mixing and water reaeration in addition to water quality conditions.
6.3.6 WATER TEMPERATURE
Oxygen is dissolved in surface waters at equilibrium with the atmosphere and is influenced by water temperature and atmospheric pressure. Oxygen solubility (the amount of oxygen that will dissolve in the water) decreases with increasing water temperature. Thus, the warmer the water is, the less oxygen will dissolve. Dissolved oxygen solubility was calculated for Cutler Reservoir using an elevation of 4,409 feet above sea level and a range of water temperatures between freezing (32°F, 0°C) and 100°F (38°C). Elevated water temperatures can exacerbate lethal water quality conditions for fish, as it affects both the solubility of oxygen in water and metabolic requirements. Fish use gill respiration to extract oxygen from the water column. As the temperature of the water increases, oxygen can be more easily extracted from it. However, cold blooded organisms also have increased metabolic rates and higher oxygen requirements at elevated water temperatures, so the additional oxygen gained at higher temperatures is offset and does not benefit the fish. High water temperatures often occur near the surface, and fish seek deeper levels to avoid the warmer water.
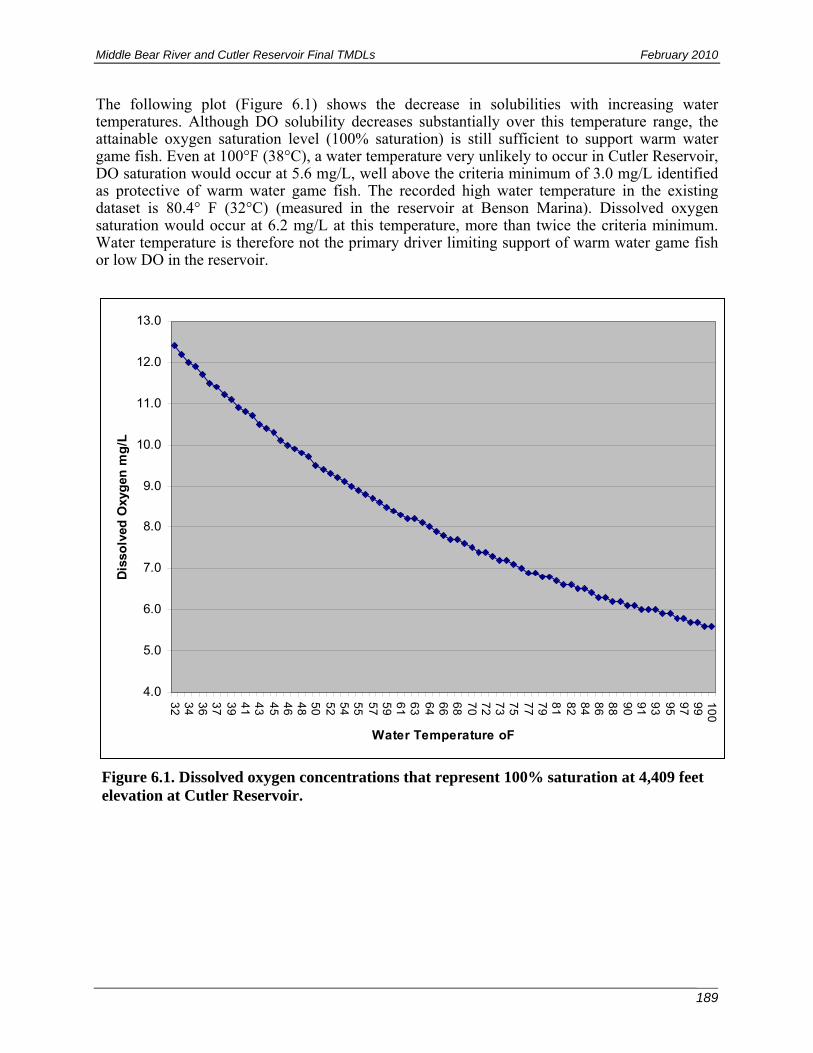
Middle Bear River and Cutler Reservoir Final TMDLs February 2010
189
The following plot (Figure 6.1) shows the decrease in solubilities with increasing water temperatures. Although DO solubility decreases substantially over this temperature range, the attainable oxygen saturation level (100% saturation) is still sufficient to support warm water game fish. Even at 100°F (38°C), a water temperature very unlikely to occur in Cutler Reservoir, DO saturation would occur at 5.6 mg/L, well above the criteria minimum of 3.0 mg/L identified as protective of warm water game fish. The recorded high water temperature in the existing dataset is 80.4° F (32°C) (measured in the reservoir at Benson Marina). Dissolved oxygen saturation would occur at 6.2 mg/L at this temperature, more than twice the criteria minimum. Water temperature is therefore not the primary driver limiting support of warm water game fish or low DO in the reservoir.
4.0
5.0
6.0
7.0
8.0
9.0
10.0
11.0
12.0
13.0
32
34
36
37
39
41
43
45
46
48
50
52
54
55
57
59
61
63
64
66
68
70
72
73
75
77
79
81
82
84
86
88
90
91
93
95
97
99
10
0
Water Temperature oF
Dis
solv
ed O
xyg
en m
g/L
Figure 6.1. Dissolved oxygen concentrations that represent 100% saturation at 4,409 feet elevation at Cutler Reservoir.

Middle Bear River and Cutler Reservoir Final TMDLs February 2010
190
6.4 EUTROPHICATION DYNAMICS
6.4.1 NUTRIENTS AND OTHER DRIVERS OF EUTROPHICATION
Algal concentrations are a function of the availability of nutrients on a continuing basis, the availability of adequate light, and the presence of flows (velocities) that will permit continued growth without losses due to flushing (of phytoplankton), sloughing (of attached algae or periphyton), or mechanical breakage and scouring (of rooted macrophytes). In quiescent systems such as Cutler Reservoir during the summer season, algal concentrations are dependent on nutrient availability, and only if nutrient concentrations have been depleted by algal uptake does the growth rate approach zero and phytoplankton begin to die. In fast-moving systems, periodic flushing can keep algal concentrations down, whereas slow-moving systems allow more algal growth and biomass accumulation.
The relationship between phosphorus concentrations and algal growth is well established (Dillon and Rigler 1974; Jones and Bachmann 1976; Ahlgren et al. 1988). Nutrient and sediment loading result from upland and streambank erosion, overland flow, and other point and nonpoint sources. Nutrients are dissolved in the water column, sequestered in living and dead organisms, and adsorbed to sediments. Excess nutrient inputs contribute to eutrophication, where growth of algae and aquatic macrophytes exceeds losses by consumption, respiration, and decomposition (Novotny and Olem 1994). Large amounts of plant and algal biomass cause diurnal fluctuations in DO due to photosynthetic release of DO during the day and consumption of DO by respiring plants at night. Dead organic matter from algal blooms and aquatic macrophyte growth accumulates as sediment and results in high SOD during decomposition.
6.4.2 LIMITING NUTRIENTS AND ALGAL SPECIATION
Both nitrogen and phosphorus can contribute to eutrophication. Either nutrient may be the limiting factor for algal growth depending on algal species. Freshwater systems are usually phosphorus limited, however there is a large body of literature concerning the impact of the N:P ratio in freshwater systems. However, there is recent evidence that many freshwater systems are co-limited, according to Utah researchers (Oldham 2001, personal communication between Erica Gaddis, SWCA, and Wayne Wurtsbaugh, USU, October 12, 2007). Typically N:P ratios less than 10 suggest a nitrogen limited system, whereas higher ratios suggest that nitrogen and phosphorus are either co-limiting or that the system is phosphorus limited. However, the cut off for an N:P ratio below which nitrogen is likely the limiting agent ranges from 7 to 15 (EPA 2000a). Above a 10:1 to 16:1 N:P ratio, surface water systems will likely experience an algal bloom, the severity of which is most commonly in direct relation to the excess phosphorus available (Schindler 1977).
In systems where cyanobacteria (blue-green algae) are the dominant population, nitrogen is not limiting because cyanobacteria have the ability to fix nitrogen. Therefore, these organisms can grow where low nitrogen concentrations may inhibit the growth of other algal species (Sharpley et al. 1995 and 1984; Tiessen 1995). Blue-green algae commonly dominate the algal flora in eutrophic lakes, and impact water quality by forming scums on the water surface that are potentially toxic to humans and animals (Welch and Lindell 1992). Regardless of which nutrient is currently limiting algal growth, an important management goal of freshwaters is to control phosphorus and create phosphorus limitation in the system to reduce the risk of blue-green algal blooms.
Middle Bear River and Cutler Reservoir Final TMDLs February 2010
191
6.4.3 INTERNAL NUTRIENT CYCLING
Internal nutrient cycling plays an important role in seasonal concentrations of nutrients and eutrophication during summer months. During winter months when flow may be low and biological activity is reduced, organically bound nutrients may settle with sediment particles onto the reservoir floor. During summer, nutrients may be re-suspended through fish activity or released into the water column through bacterial decomposition of organic matter, a process that increases with increased water temperature. Phosphorus in particular is readily adsorbed to sediments and later released to the water column, and can thereby contribute to internal loading of nutrients for long periods after external sources of nutrients have been reduced or eliminated (Hu et al. 2001).
Submerged plants or macrophytes often act as phosphorus pumps that relocate otherwise stable phosphorus from the sediment and release it into the water column. Some macrophytes obtain most (>90%) of their phosphorus from the sediment through their roots (Carignan and Kalff 1980), then translocate it into their shoots from which it is finally leached via senescent shoots into the water column (Carpenter 1983). This leached phosphorus is then readily available to bacteria and algae. The phosphorus pumping theory is supported by a study by Landers and Lottes (1983) that found significant increases not only of phosphorus but of ammonia and nitrate in treatment tanks with decomposing macrophytes. The extent to which plants act as phosphorus pumps varies widely among taxa (Landers and Lottes 1983) and is influenced by the trophic status of the lake or reservoir. Macrophyte decay is higher in eutrophic systems than in oligotrophic systems due to macrophyte biomass and turnover rates (Carpenter 1983). For example, Lake Wingra, Wisconsin, a shallow and unstratified lake, receives half its internal phosphorus loading from macrophyte decay (Carpenter 1983). In this sense, eutrophication can be viewed as an appositive feedback system in which sedimentation eventually transforms the lake into a swamp (Carpenter 1983). Internal phosphorus loading facilitates increased growth of phytoplankton that, after dying, add to organic sedimentation. As the lake becomes shallower, its surface area expands, as does the area that can be colonized by more macrophytes, and the cycle continues.
6.4.4 NUTRIENT AVAILABILITY
Many sources and conditions contribute to levels of phosphorus and nitrogen in the environment. Phosphorus can be present as a constituent of certain rock types and is found in the mineral apatite. The environment itself can also be a factor in the phosphorus and nitrogen levels occurring within a region, as the climate, pH of natural waters, and presence of other substances that may adsorb or release phosphorus can all potentially affect phosphorus levels (Hedley et al. 1995). Wildlife and waterfowl that utilize the watershed often mobilize nutrients from stable to dissolved forms. Although these populations are relatively stable throughout much of the year, substantial increases in some populations are observed with spring and fall migration patterns.
Nutrients bound to organic particles and sediments comprise the largest source of enrichment in reservoir and wetland systems, although particulate forms are generally considered kinetically less available for algal uptake. Mineralization and microbial activity can convert substantial amounts of particulate-bound nutrients to more soluble forms over time, further enhancing the pool of nutrients available for algal uptake and growth. Measurements of phosphorus and nitrogen represent both particulate or suspended and dissolved nutrients within the system and are good indicators of the total loading that will be available over time for plant growth.
Phosphorus can be present in a waterbody in a variety of forms. The most common forms of phosphorus monitored in the Cutler Reservoir watershed are TP, which includes all phosphorus

Middle Bear River and Cutler Reservoir Final TMDLs February 2010
192
(dissolved and particulate-bound); dissolved phosphorus (primarily orthophosphate) includes highly soluble, oxidized phosphorus. Because of its solubility, orthophosphate is commonly more available for biological uptake and leads more rapidly to algal growth than TP (Sonzongi et al. 1982). The relative amount of each form measured can provide information on the potential for algal growth within the system. If a high percentage of the TP is present as soluble orthophosphate, it is more likely that rapid algal growth will occur than if the majority of the TP was mineral phosphorus incorporated in sediment, provided other conditions such as light and temperature are adequate. As a result, we would expect to see high orthophosphate concentrations coinciding with, or followed by, high chlorophyll a concentrations. Because algal blooms and associated phosphorus turnover can occur over a few days, very low orthophosphate concentrations coupled with high chlorophyll a may indicate that available phosphorus has been utilized by the algae. However, due to phosphorus cycling (conversion between forms) it is important to consider TP concentrations in the evaluation of nutrient loading.
Total nitrogen measurements represent both particulate and dissolved nitrogen within the system and are a good indicator of the total loading that will be available over time for plant growth. Nitrogen bound to organic particles and sediments generally comprise the largest source of enrichment in reservoir and wetland systems. Dissolved nitrate + nitrite measurements represent that fraction of the nitrogen loading that is readily available for immediate algal uptake and has the greatest short-term potential to stimulate growth.
Generally, a phosphate concentration of 0.01 mg/L will support plankton, whereas concentrations of 0.03 to 0.1 mg/L phosphate or higher will likely trigger blooms (EPA 1986; Dunne and Leopold 1978). A high availability of phosphorus does not always indicate continued production because the system may become nitrogen limited.
6.5 LINKAGE BETWEEN NUTRIENTS AND CUTLER RESERVOIR BENEFICIAL USES
6.5.1 SECONDARY CONTACT RECREATION (2B)
Nutrient effects on water quality are related to the quality, safety, and frequency of recreational use through two key mechanisms. Eutrophication related to nutrient loading is associated with algal overgrowth, which can reduce water clarity (turbidity) and color and increase growth of algal mats (periphyton) both of which reduce the frequency of recreation uses (Figure 6.2).
Periodic overgrowth of algae violates the narrative water quality standard established by the State of Utah, which requires waters to be maintained such that they do not become offensive by “unnatural deposits, floating debris, oil, scum, or other nuisances such as color, odor, or taste;…or result in concentrations or combinations of substances which produce undesirable human health effects…” (Utah State Code, Title R317). The narrative standard established by the State of Utah is the basis for development of numeric water quality endpoints related to nuisance algal concentrations for Cutler Reservoir.
Nuisance algal concentrations, related to recreational beneficial uses, range from 25 μg/L (Walker 1985; Raschke 1994) to 40 μg/L. Human perceptions of aesthetics and “swimability” are subjective and dependent on the expectations and tolerances of the public (Table 6.2). In one study, nuisance conditions were encountered at 20 to 30 µg/l with severe nuisance conditions encountered at >30 µg/l (Walmsey 1984). Studies on water discoloration indicate that unacceptable discoloration to the average recreational user commonly occurs at chlorophyll a concentrations above 30 µg/l (Raschke 1994). At these concentrations, deep discoloration and formation of algal scums may be observed.
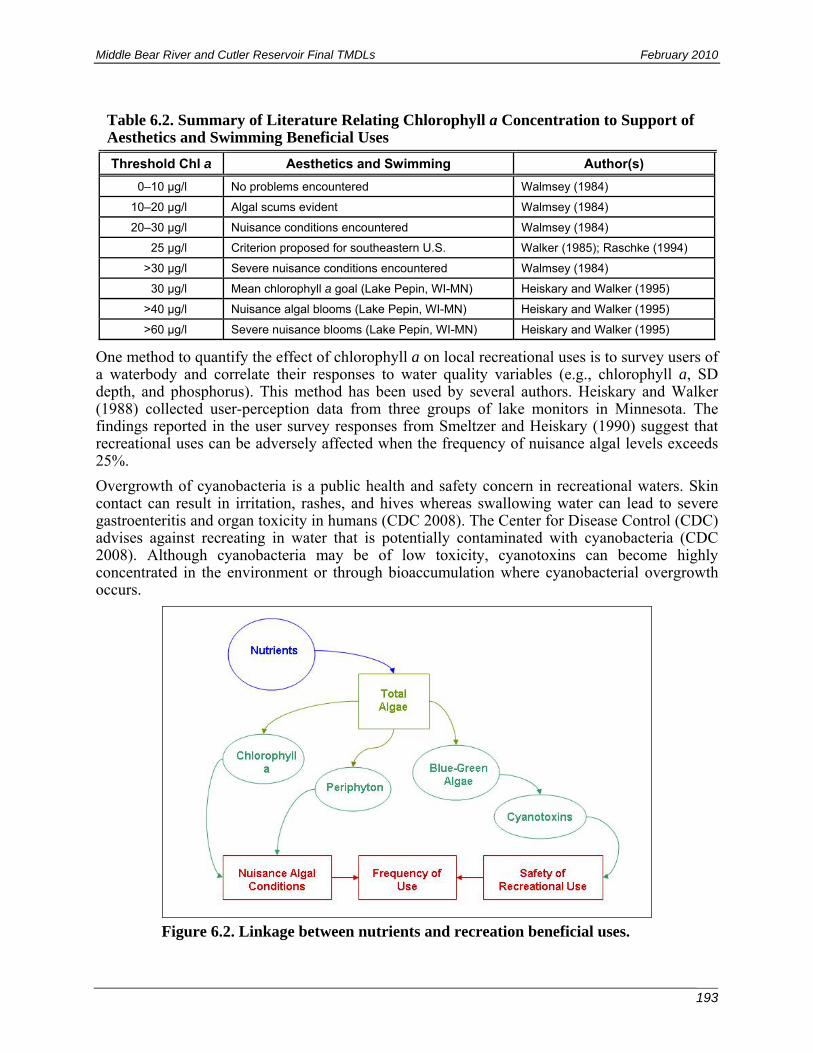
Middle Bear River and Cutler Reservoir Final TMDLs February 2010
193
Table 6.2. Summary of Literature Relating Chlorophyll a Concentration to Support of Aesthetics and Swimming Beneficial Uses
Threshold Chl a Aesthetics and Swimming Author(s)
0–10 µg/l No problems encountered Walmsey (1984)
10–20 µg/l Algal scums evident Walmsey (1984)
20–30 µg/l Nuisance conditions encountered Walmsey (1984)
25 µg/l Criterion proposed for southeastern U.S. Walker (1985); Raschke (1994)
>30 µg/l Severe nuisance conditions encountered Walmsey (1984)
30 µg/l Mean chlorophyll a goal (Lake Pepin, WI-MN) Heiskary and Walker (1995)
>40 µg/l Nuisance algal blooms (Lake Pepin, WI-MN) Heiskary and Walker (1995)
>60 µg/l Severe nuisance blooms (Lake Pepin, WI-MN) Heiskary and Walker (1995)
One method to quantify the effect of chlorophyll a on local recreational uses is to survey users of a waterbody and correlate their responses to water quality variables (e.g., chlorophyll a, SD depth, and phosphorus). This method has been used by several authors. Heiskary and Walker (1988) collected user-perception data from three groups of lake monitors in Minnesota. The findings reported in the user survey responses from Smeltzer and Heiskary (1990) suggest that recreational uses can be adversely affected when the frequency of nuisance algal levels exceeds 25%.
Overgrowth of cyanobacteria is a public health and safety concern in recreational waters. Skin contact can result in irritation, rashes, and hives whereas swallowing water can lead to severe gastroenteritis and organ toxicity in humans (CDC 2008). The Center for Disease Control (CDC) advises against recreating in water that is potentially contaminated with cyanobacteria (CDC 2008). Although cyanobacteria may be of low toxicity, cyanotoxins can become highly concentrated in the environment or through bioaccumulation where cyanobacterial overgrowth occurs.
Figure 6.2. Linkage between nutrients and recreation beneficial uses.
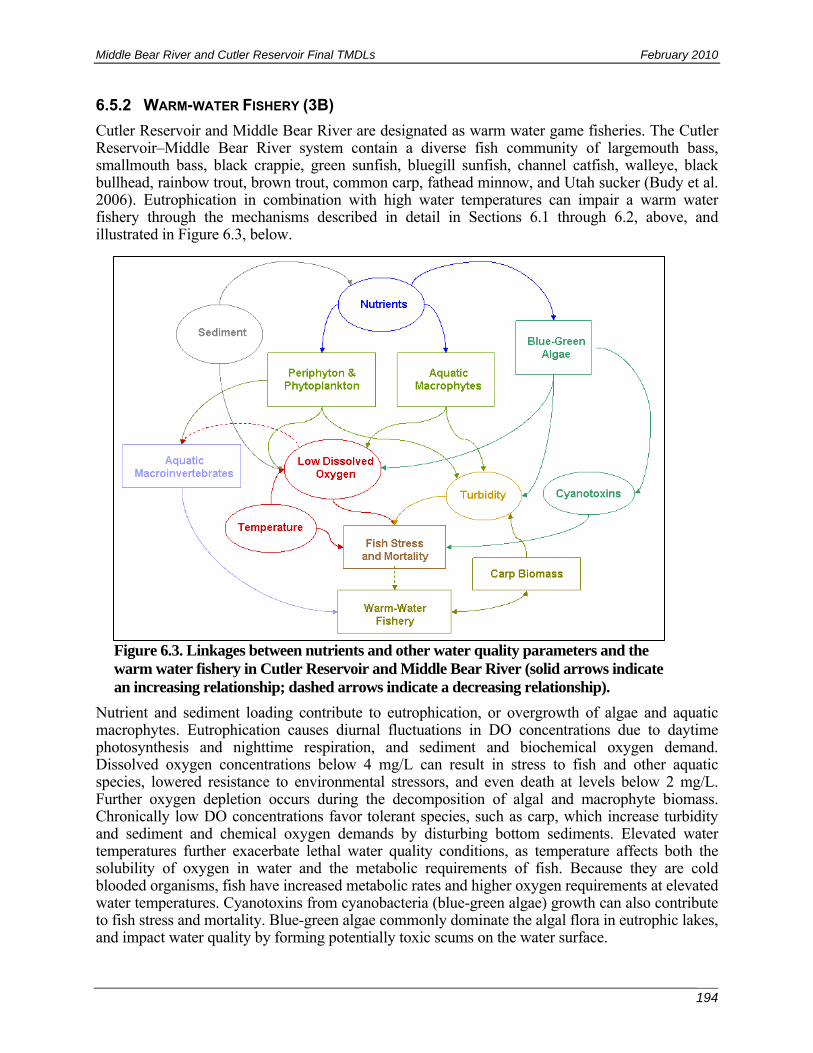
Middle Bear River and Cutler Reservoir Final TMDLs February 2010
194
6.5.2 WARM-WATER FISHERY (3B)
Cutler Reservoir and Middle Bear River are designated as warm water game fisheries. The Cutler Reservoir–Middle Bear River system contain a diverse fish community of largemouth bass, smallmouth bass, black crappie, green sunfish, bluegill sunfish, channel catfish, walleye, black bullhead, rainbow trout, brown trout, common carp, fathead minnow, and Utah sucker (Budy et al. 2006). Eutrophication in combination with high water temperatures can impair a warm water fishery through the mechanisms described in detail in Sections 6.1 through 6.2, above, and illustrated in Figure 6.3, below.
Figure 6.3. Linkages between nutrients and other water quality parameters and the warm water fishery in Cutler Reservoir and Middle Bear River (solid arrows indicate an increasing relationship; dashed arrows indicate a decreasing relationship).
Nutrient and sediment loading contribute to eutrophication, or overgrowth of algae and aquatic macrophytes. Eutrophication causes diurnal fluctuations in DO concentrations due to daytime photosynthesis and nighttime respiration, and sediment and biochemical oxygen demand. Dissolved oxygen concentrations below 4 mg/L can result in stress to fish and other aquatic species, lowered resistance to environmental stressors, and even death at levels below 2 mg/L. Further oxygen depletion occurs during the decomposition of algal and macrophyte biomass. Chronically low DO concentrations favor tolerant species, such as carp, which increase turbidity and sediment and chemical oxygen demands by disturbing bottom sediments. Elevated water temperatures further exacerbate lethal water quality conditions, as temperature affects both the solubility of oxygen in water and the metabolic requirements of fish. Because they are cold blooded organisms, fish have increased metabolic rates and higher oxygen requirements at elevated water temperatures. Cyanotoxins from cyanobacteria (blue-green algae) growth can also contribute to fish stress and mortality. Blue-green algae commonly dominate the algal flora in eutrophic lakes, and impact water quality by forming potentially toxic scums on the water surface.
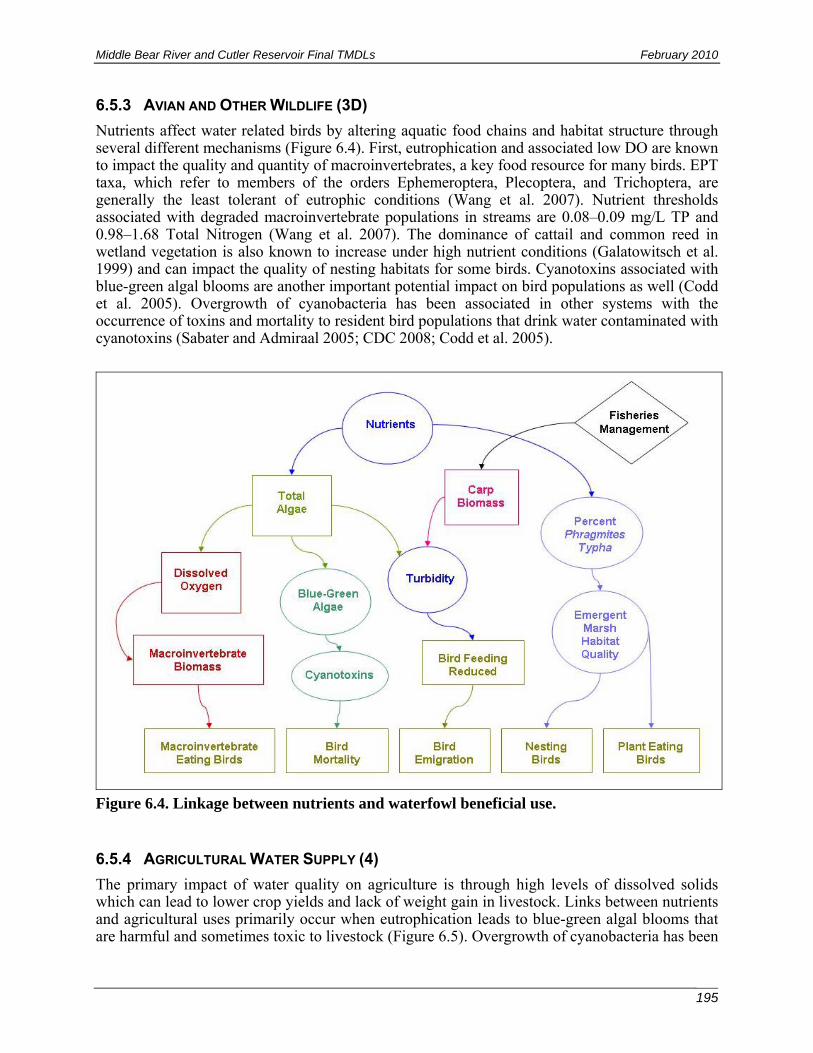
Middle Bear River and Cutler Reservoir Final TMDLs February 2010
195
6.5.3 AVIAN AND OTHER WILDLIFE (3D)
Nutrients affect water related birds by altering aquatic food chains and habitat structure through several different mechanisms (Figure 6.4). First, eutrophication and associated low DO are known to impact the quality and quantity of macroinvertebrates, a key food resource for many birds. EPT taxa, which refer to members of the orders Ephemeroptera, Plecoptera, and Trichoptera, are generally the least tolerant of eutrophic conditions (Wang et al. 2007). Nutrient thresholds associated with degraded macroinvertebrate populations in streams are 0.08–0.09 mg/L TP and 0.98–1.68 Total Nitrogen (Wang et al. 2007). The dominance of cattail and common reed in wetland vegetation is also known to increase under high nutrient conditions (Galatowitsch et al. 1999) and can impact the quality of nesting habitats for some birds. Cyanotoxins associated with blue-green algal blooms are another important potential impact on bird populations as well (Codd et al. 2005). Overgrowth of cyanobacteria has been associated in other systems with the occurrence of toxins and mortality to resident bird populations that drink water contaminated with cyanotoxins (Sabater and Admiraal 2005; CDC 2008; Codd et al. 2005).
Figure 6.4. Linkage between nutrients and waterfowl beneficial use.
6.5.4 AGRICULTURAL WATER SUPPLY (4)
The primary impact of water quality on agriculture is through high levels of dissolved solids which can lead to lower crop yields and lack of weight gain in livestock. Links between nutrients and agricultural uses primarily occur when eutrophication leads to blue-green algal blooms that are harmful and sometimes toxic to livestock (Figure 6.5). Overgrowth of cyanobacteria has been
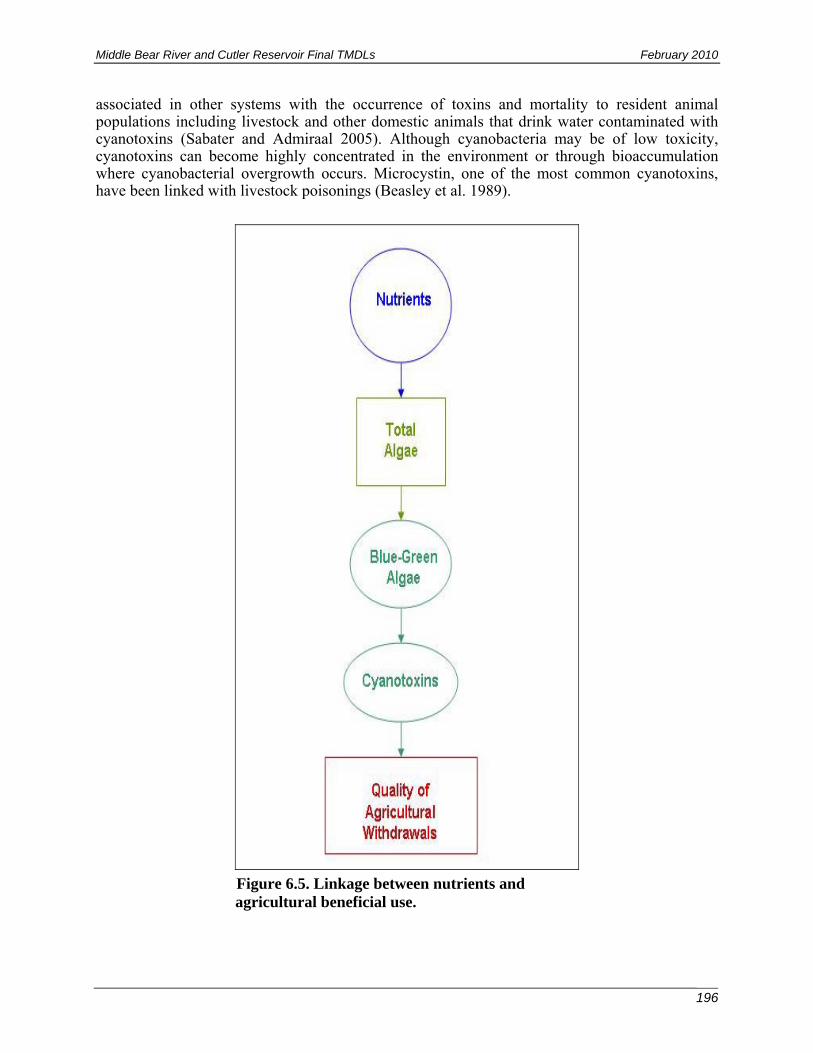
Middle Bear River and Cutler Reservoir Final TMDLs February 2010
196
associated in other systems with the occurrence of toxins and mortality to resident animal populations including livestock and other domestic animals that drink water contaminated with cyanotoxins (Sabater and Admiraal 2005). Although cyanobacteria may be of low toxicity, cyanotoxins can become highly concentrated in the environment or through bioaccumulation where cyanobacterial overgrowth occurs. Microcystin, one of the most common cyanotoxins, have been linked with livestock poisonings (Beasley et al. 1989).
Figure 6.5. Linkage between nutrients and agricultural beneficial use.
Middle Bear River and Cutler Reservoir Final TMDLs February 2010
197
CHAPTER 7 TOTAL MAXIMUM DAILY LOAD ANALYSIS
7.1 PHASED TMDL APPROACH AND JUSTIFICATION FOR CUTLER RESERVOIR
EPA guidance (EPA 2006) recommends use of a phased TMDL when “predictive tools may not be adequate to characterize the problem with a sufficient level of certainty.” Uncertainty in the Cutler Reservoir TMDL is associated with the following factors:
Total phosphorus and DO linkage. A quantitative linkage between low DO and TP could not be drawn for Cutler Reservoir during this TMDL study due to the unique nature of the reservoir’s internal processes and because chlorophyll a and TP sampling dates could not be paired with diurnal DO data.
Unique nature of Cutler Reservoir system. Unique components of the Cutler Reservoir system are discussed in depth in Chapter 6 including the shallow depth and wetland habitat found in the Southern Reservoir (see Sections 3.3.5.3), high temperatures that provide additional stress to fish in the system (see Section 3.3.1.7), and turbidity interference with algal growth (see Section 3.3.2.2).
Tributary TMDL attainment. Attainment of the water quality endpoints identified in the Cutler Reservoir TMDL depends on attainment of TMDL allocations identified in the following other TMDLs for tributaries to Cutler Reservoir: Little Bear River TMDL (2000), Spring Creek TMDL (2002), Idaho Bear River TMDL (2006), Cub River TMDL (1997; revision in progress), and Newton Creek TMDL (2004).
Despite this uncertainty, several lines of evidence indicate a clear impairment to the fishery and avian uses (3B and 3D) of the reservoir including direct exceedance of DO criteria (see Section 3.3.1.4), correlation of DO and exceedances with spawning periods of fish found in the reservoir (Section 3.3.4.1), chlorophyll a concentrations and recorded algal blooms (see Section 3.3.1.3), the presence of blue-green algae in the system (see Section 3.3.2.4), and the trophic state index of the reservoir (see Section 3.3.2.2). A fishery study conducted for Cutler Reservoir provides a detailed assessment of the current status of the fishery and indicated poor recruitment for walleye and green sunfish (see Section 3.3.4.2).
Reducing TP and chlorophyll a concentrations in Cutler Reservoir is needed to improve the status of three of the reservoir’s designated beneficial uses: warm water game fish (3A), waterfowl and other aquatic wildlife (3D), and recreation (2B). For this reason, the UDWQ has elected a phased TMDL approach for the Cutler Reservoir TMDL.
EPA recommends that phased TMDLs include implementation and monitoring plans as well as a scheduled time frame for revision of the TMDL. An adaptive implementation plan (see Appendix I) has been developed to attain the load reductions to Cutler Reservoir identified in this TMDL, including a monitoring plan. Interim water quality milestones have also been identified in the watershed-based implementation plan.
In addition, the UDWQ has scheduled the Cutler Reservoir TMDL to be reevaluated in 2019. Ten years is believed to be an appropriate amount of time for revisiting the Cutler Reservoir TMDL for the following reasons:
1. Ten years provides sufficient time for implementation of point source reductions and nonpoint source management measures and for monitoring their effectiveness in improving water quality.

Middle Bear River and Cutler Reservoir Final TMDLs February 2010
198
2. Ten years is a sufficient period of time for the reservoir to begin flushing excess phosphorus residing in bottom sediment and/or for sediments that are less phosphorus rich to cover the top of the existing sediment.
3. Revisions to water quality standards and assessment methodology will be completed in this time frame.
If water quality targets have not been achieved by 2019, the Cutler Reservoir TMDL will be reopened, and additional actions will be taken to attain all water quality standards at that time. If nutrient targets have been attained but DO concentrations continue to exceed water quality standards, a sediment oxygen demand endpoint may be required to address other contributors to low DO. Additional actions could include further phosphorus reductions associated with watershed sources, a formal trading program between point and nonpoint sources in the watershed, and/or attention to other factors affecting DO concentrations in the reservoir such as organic matter loading. A SOD endpoint could be achieved through additional nutrient reductions (further reducing internally generated SOD from decaying aquatic plants and algae), reduction in organic matter loading to the reservoir, or in-reservoir treatments such as dredging or aeration to breakdown existing organic matter in sediments.
7.2 WATER QUALITY ENDPOINTS
Setting water quality endpoints is an important step in the TMDL process. The final goal for the Cutler Reservoir TMDL is to achieve state water quality criteria so that the DBUs are being fully supported as quickly as possible. Setting water quality endpoints is a key precursor to the calculation of the load reductions needed to support the beneficial uses for Cutler Reservoir. The water quality endpoints identified for the Middle Bear River TMDL are carried over from the previous Bear River TMDL approved by EPA in 1997.
Several methods were employed to derive water quality endpoints for Cutler Reservoir. The DO endpoints, based on state water quality criteria, are primary water quality endpoints for Cutler Reservoir because they are intricately linked with the identified impairment of the warm water fishery (3B) and other aquatic wildlife (3D) in the reservoir. Total phosphorus endpoints were derived from literature-based phosphorus thresholds associated with aquatic life, EPA recommended methodologies used to determine nutrient endpoints based on ecoregional and historical data, management of the system as phosphorus limited, examples from other phosphorus TMDLs, impacts on downstream waters documented in the Lower Bear River TMDL, and EPA nutrient criteria guidance.
The endpoints identified focus on the open water (lacustrine) areas of the reservoir because most of the data available to the TMDL process are from lacustrine areas of the reservoir. Additional data collection for littoral areas is identified as an important goal in the monitoring plan that accompanies this TMDL.
7.2.1 DISSOLVED OXYGEN ENDPOINTS
The State of Utah has designated Cutler Reservoir and Middle Bear River as protected for warm water game fish and their associated food chain (Class 3B). This DBU was identified as partially supported on the State of Utah 2006 303(d) list. This impairment was confirmed in the impairment assessment sections of this TMDL (see Chapter 3). In addition, the waterfowl, water birds, and associated food chains beneficial use (Class 3D) was determined to be impaired based on DO criteria.

Middle Bear River and Cutler Reservoir Final TMDLs February 2010
199
The DO endpoints for the TMDL are the state water quality standards for warm-water fisheries:
• 1-day min DO of 3.0 mg/L throughout the water column
• 7-day average DO to be maintained above 4.0 mg/L
• 30-day average DO to be maintained above 5.5 mg/L
7.2.2 TOTAL PHOSPHORUS ENDPOINTS FOR CUTLER RESERVOIR
Selection of total phosphorus endpoints for the Phased TMDL was based on a convergence of several lines of evidence. These include phosphorus thresholds associated with aquatic life, endpoints selected for other shallow systems, an EPA Method used to derive endpoints from historical data, examination of nutrient data at the ecoregion scale, management of the system as phosphorus limited, and impacts on downstream waters.
7.2.2.1 Phosphorus Thresholds Associated with Aquatic Life Eutrophication and associated low DO are known to affect the quality and quantity of macroinvertebrates, a key food resource for many birds. EPT taxa, which refer to members of the orders Ephemeroptera, Plecoptera, and Trichoptera, are generally the least tolerant of eutrophic conditions (Wang et al. 2007). Nutrient thresholds associated with degraded macroinvertebrate populations in streams are 0.08–0.09 mg/L TP (Wang et al. 2007). A similar study for nonwadable rivers in Wisconsin found that biologically meaningful changes in macroinvertebrate and fish assemblages occurred at a TP threshold of 0.06 mg/l to 0.15 mg/l (Weigel and Robertson 2007). Weijters et al. (2009) reviewed 22 studies that explored the relationship between nutrients and river and stream biodiversity, and found a significant negative correlation between EPT taxa in streams and rivers and orthophosphate concentration. A value of 0.075 mg/l was recommended by Dodds et al. (1998) as a eutrophic boundary in temperature streams for protection of aquatic life uses.
7.2.2.2 Historical Data Analysis TP data were analyzed with a method similar to that employed for chlorophyll a, but are more appropriate for physical water quality parameters than biological data. This method, based on the nutrient criteria technical guidance manual (EPA 2000a), indicates that when a reference condition is not available, the lower 25th percentile of historical data should be considered representative of best attainable conditions (EPA 2000a). The lower 25th percentile of the TP dataset (1975–2007) is 0.11 and 0.08 mg/L TP for the Northern and Southern Reservoirs respectively (Table 7.1).
Table 7.1. Summary of Total Phosphorus Data (mg/L) in Cutler Reservoir during All Seasons for the Entire Period of Record (1975–2007)
Reservoir 25th
Percentile Median Mean
75th Percentile
Northern Reservoir 0.11 0.15 0.16 0.20
Southern Reservoir 0.08 0.12 0.19 0.21
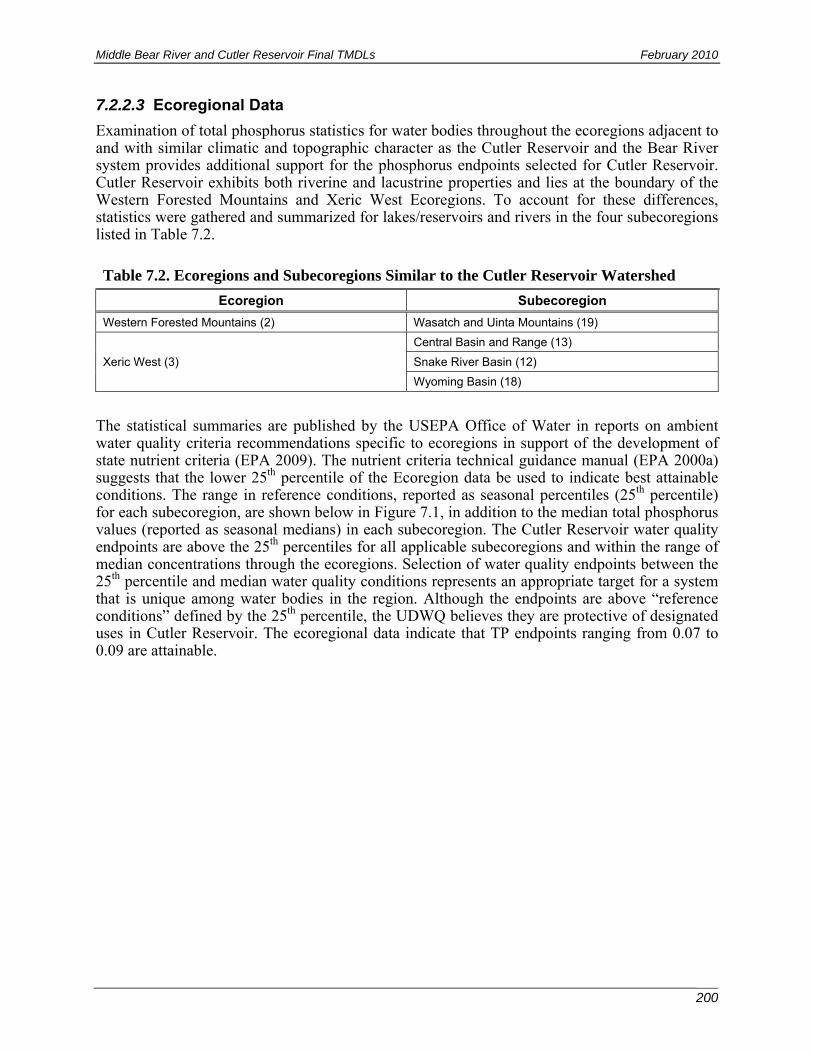
Middle Bear River and Cutler Reservoir Final TMDLs February 2010
200
7.2.2.3 Ecoregional Data Examination of total phosphorus statistics for water bodies throughout the ecoregions adjacent to and with similar climatic and topographic character as the Cutler Reservoir and the Bear River system provides additional support for the phosphorus endpoints selected for Cutler Reservoir. Cutler Reservoir exhibits both riverine and lacustrine properties and lies at the boundary of the Western Forested Mountains and Xeric West Ecoregions. To account for these differences, statistics were gathered and summarized for lakes/reservoirs and rivers in the four subecoregions listed in Table 7.2.
Table 7.2. Ecoregions and Subecoregions Similar to the Cutler Reservoir Watershed
Ecoregion Subecoregion
Western Forested Mountains (2) Wasatch and Uinta Mountains (19)
Xeric West (3)
Central Basin and Range (13)
Snake River Basin (12)
Wyoming Basin (18)
The statistical summaries are published by the USEPA Office of Water in reports on ambient water quality criteria recommendations specific to ecoregions in support of the development of state nutrient criteria (EPA 2009). The nutrient criteria technical guidance manual (EPA 2000a) suggests that the lower 25th percentile of the Ecoregion data be used to indicate best attainable conditions. The range in reference conditions, reported as seasonal percentiles (25th percentile) for each subecoregion, are shown below in Figure 7.1, in addition to the median total phosphorus values (reported as seasonal medians) in each subecoregion. The Cutler Reservoir water quality endpoints are above the 25th percentiles for all applicable subecoregions and within the range of median concentrations through the ecoregions. Selection of water quality endpoints between the 25th percentile and median water quality conditions represents an appropriate target for a system that is unique among water bodies in the region. Although the endpoints are above “reference conditions” defined by the 25th percentile, the UDWQ believes they are protective of designated uses in Cutler Reservoir. The ecoregional data indicate that TP endpoints ranging from 0.07 to 0.09 are attainable.

Middle Bear River and Cutler Reservoir Final TMDLs February 2010
201
Figure 7.1. Summary of applicable ecoregion total phosphorus statistics compared to Cutler Reservoir water quality endpoints. Error bars represent the range in median values found in the ecoregion.
7.2.2.4 Phosphorus Limitation and Algal Dominance Algal speciation, in addition to bloom intensity, is also important for the protection of beneficial uses in Cutler Reservoir. In particular, blooms of blue-green algae are often the most problematic because of their ability to form surface scum, clog water intakes, produce toxins, and adversely affect the taste and odor of a waterbody (Smith 1985; Pitois et al. 2000). A search of the scientific literature did not reveal studies that attempted to develop chlorophyll a standards as correlated with blue-green nuisance conditions. Although no reports of toxic cyanobacteria blooms in Cutler Reservoir have emerged, the potential for such blooms is demonstrated by the presence of blue-green species in the reservoir (see Section 3.3.3.2). Once a reservoir system becomes dominated by blue-green algae species, phosphorus reductions alone will be required to shift the population back to green algal dominance because blue-green species are capable of fixing atmospheric nitrogen (Codd et al. 2005). Blue-green algal blooms can be harmful to recreational users as well as local populations of wild and domesticated animals. Therefore, an additional endpoint identified for Cutler Reservoir is the maintenance of algal populations dominated by species other than cyanophyta (blue-green algae).
Average recorded dissolved nitrogen values in Cutler Reservoir during the summer season range from 0.13 at the Benson Marina Site to 0.44 mg/l at the Cutler Reservoir Dam. To attain a dissolved nitrogen to phosphrous ration of 10 to 15 N:P, dissolved phosphorus ratios would need to be 0.01 to 0.04 mg/l. The average dissolved P to total P ratio in Cutler Reservoir is 0.47
0
0.02
0.04
0.06
0.08
0.1
0.12
0.14
0.16
0.18
0.2
Was
atch
and
Uin
taM
ount
ains
(19)
Cen
tral
Bas
in a
ndR
ange
(13)
Sna
keR
iver
Bas
in (
12)
Wyo
min
gB
asin
(18
)
Was
atch
and
Uin
taM
ount
ains
(19)
Cen
tral
Bas
in a
ndR
ange
(13)
Sna
keR
iver
Bas
in (
12)
Wyo
min
gB
asin
(18
)
WesternForested
Mountains (2)
Xeric West (3) WesternForested
Mountains (2)
Xeric West (3)
Lakes and Reservoirs Rivers
Ecoregion and Subecoregion
TP
(m
g/l
)
Reference Condition (25th Percentile)
Seasonal Median
Cutler Reservoir Endpoints
Middle Bear River and Cutler Reservoir Final TMDLs February 2010
202
(47%). This ratio was used to estimate the total phosphorus associated with the dissolved phosphorus range and returns a range in TP values of 0.02 to 0.11 mg/l. This range of TP values should maintain the system as phosphorus limited under most conditions. Slightly higher values would likely result in a co-limited condition. These estimates would be improved with total nitrogen or total dissolved nitrogen data.
7.2.2.5 Phosphorus TMDL and Nutrient Criteria Precedents The Cutler Reservoir system is unique in that it exhibits wetland, riverine, and lacustrine properties. Total phosphorus endpoints appropriate for deep impoundments in Utah are therefore not directly applicable to Cutler Reservoir, nor are total phosphorus standards applied to wadable streams in the region. Because of the shallow and productive nature of the reservoir and the short hydrologic retention time, the reservoir may support designated uses at higher nutrient concentrations than other waterbodies in Utah and the Intermountain Region. The Snake River–Hells Canyon system exhibits similar properties to Cutler Reservoir. The TMDL for this system identified a total phosphorus target of 0.07 mg/l which was found to be protective of both recreation and aquatic life uses and water quality. Long and Farquar Lakes in Minnesota, also shallow lake systems, identified a total phosphorus concentration of 0.09 mg/l, which is the shallow lake TP standard for Class 2B recreational waters in Minnesota’s Western Corn Belt Plains Ecoregion (MPCA 2009).
7.2.2.6 Impacts on Downstream Waters The EPA nutrient criteria guidance indicates that nutrient criteria should “provide for the attainment and maintenance of proximal downstream water quality” (EPA 2000a). A year-round target phosphorus criterion of 0.075 mg/L has been established for the Lower Bear River just below Cutler Dam (UDWQ 2002). Thus, a year-round TP criterion of 0.075 mg/L must be established for the outflow from Cutler Dam, in order to protect downstream water quality.
7.2.2.7 EPA Nutrient Criteria Guidance
According to EPA nutrient criteria guidance for lakes and reservoirs (EPA 2000a), “the light-limited condition of hypereutrophy (TSI 70, TP of 0.1 mg/l) is characterized by dense algal and macrophyte communities and should be considered undesirable under all circumstances.” The EPA identifies a maximum upper limit of 0.1 mg/l TP regardless of designated use, unless it can be demonstrated that the natural reference condition is this high. The ecoregional statistics, historic data for Cutler Reservoir, and current data in the Bear River system indicate that the natural reference condition is below this value. The EPA nutrient criteria guidance for rivers (EPA 2000b) identifies a value of 0.075 mg/l as a threshold total phosphorus value for avoidance of eutrophic conditions in river and stream systems.
7.2.2.8 Summary of Total Phosphorus Endpoints for Cutler Reservoir
The mean TP endpoints selected for Cutler Reservoir for the summer season are 0.07 mg/L and 0.09 mg/L for the Northern and Southern Reservoirs respectively. In addition, a TP target of 0.075 mg/L must be maintained throughout the year at the Cutler Dam outfall in order to protect downstream waters and comply with Lower Bear River TMDL.
Middle Bear River and Cutler Reservoir Final TMDLs February 2010
203
7.2.3 TOTAL PHOSPHORUS ENDPOINT FOR MIDDLE BEAR RIVER
The mean TP endpoint identified in the 1997 Bear River TMDL (UDWQ 1997) for the Middle Bear River is 0.05 mg/l. This standard has not yet been attained in the Bear River. Recent exceedances of the DO standard in the Middle Bear River are limited to exceedances of the early life stage criteria of 5.0 mg/l Impairment of the Middle Bear River impairments. Therefore, the UDWQ believes that the 0.05 mg/l endpoint remains an appropriate target for the river.
7.3 LOADING CAPACITY: TOTAL MAXIMUM DAILY AND SEASONAL LOADS
The TMDLs for Cutler Reservoir and Middle Bear River are presented in two seasons: May–October (summer season) and November–April (winter season) (Table 7.3). These seasons roughly represent the irrigation vs. non-irrigation season as well as the algal growth vs. non-algal growth season in the reservoir. Recent TMDL guidance from the EPA recommends that loads be expressed as daily loads in addition to other averaging periods (such as seasons). Daily loads are calculated by dividing the seasonal load for the summer by 184 days, and the seasonal load for the winter by 181 days. The resulting daily loads (Table 7.3) should be viewed as daily average loads because the actual loads delivered to the reservoir will vary based on factors such as precipitation, land use, and seasonal patterns.
TMDL loads for Cutler Reservoir are separated into the Northern and Southern sections of the reservoir based on water quality, morphometry, and habitat characteristics. The Southern Reservoir load includes loads associated with internal and unknown sources, and is based on water quality data at the boundary between the Southern and Northern areas of the reservoir. Because water flows through the reservoir from south to north, the total load to the north is cumulative in that it includes load to the Southern Reservoir that flows north through Benson Marina. In this way, the load summarized as Northern Reservoir load is additive and therefore represents the total load to the reservoir.
The maximum TP load that will attain water quality endpoints identified for the Southern Reservoir is 25,539 kg TP/season during the summer season and 28,986 kg TP/season during the winter season (Table 7.3). The maximum TP load that will attain water quality endpoints identified for the Northern Reservoir is 62,103 kg TP/season during the summer season and 63,433 kg TP/season during the winter season. This represents a reduction of load to the Southern Reservoir of 64% and 54% in the summer and winter seasons, respectively, and reduction of load to the Northern Reservoir of 51% and 47% in the summer and winter seasons respectively. A large part of the required reductions are accounted for in existing TMDLs and AFO/CAFO improvements that have already been implemented in the watershed.
The maximum TP load that will attain water quality endpoints identified for the Middle Bear River is 29,578 kg TP/season during the summer season and 28,361 kg TP/season during the winter season. This represents a reduction of load to the Middle Bear River of 36% kg TP/season in both the summer and winter seasons.
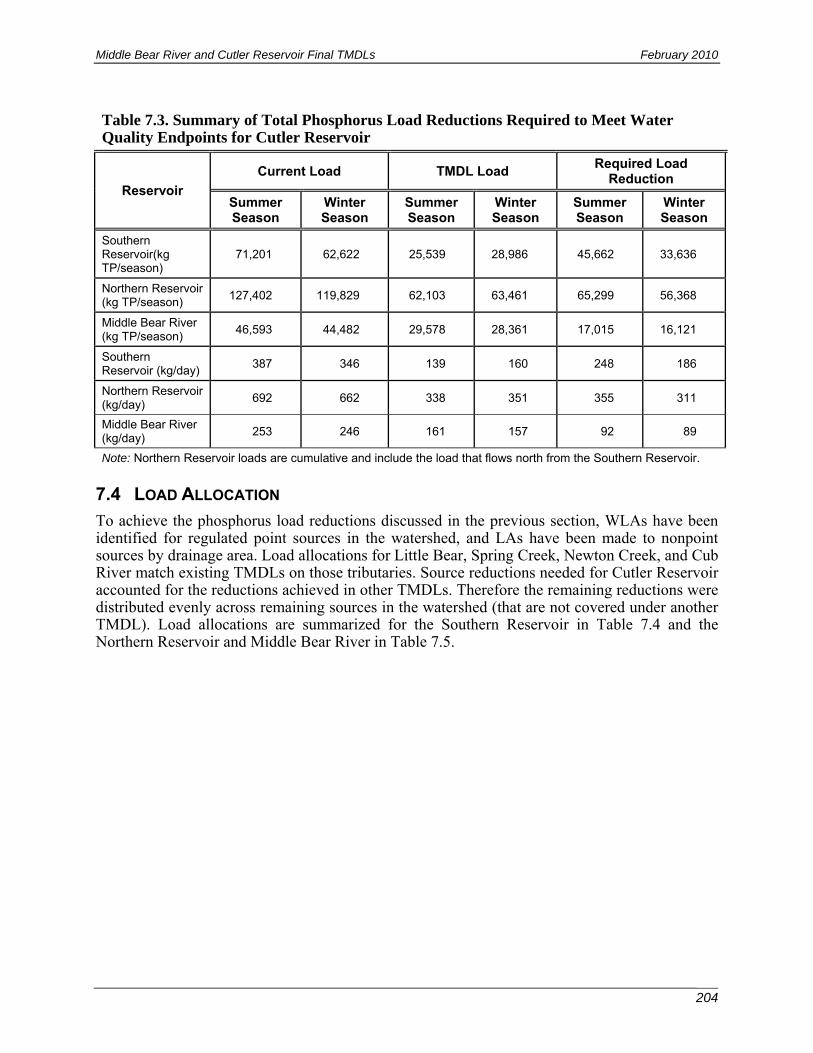
Middle Bear River and Cutler Reservoir Final TMDLs February 2010
204
Table 7.3. Summary of Total Phosphorus Load Reductions Required to Meet Water Quality Endpoints for Cutler Reservoir
Reservoir
Current Load TMDL Load Required Load
Reduction
Summer Season
Winter Season
Summer Season
Winter Season
Summer Season
Winter Season
Southern Reservoir(kg TP/season)
71,201 62,622 25,539 28,986 45,662 33,636
Northern Reservoir (kg TP/season)
127,402 119,829 62,103 63,461 65,299 56,368
Middle Bear River (kg TP/season)
46,593 44,482 29,578 28,361 17,015 16,121
Southern Reservoir (kg/day)
387 346 139 160 248 186
Northern Reservoir (kg/day)
692 662 338 351 355 311
Middle Bear River (kg/day)
253 246 161 157 92 89
Note: Northern Reservoir loads are cumulative and include the load that flows north from the Southern Reservoir.
7.4 LOAD ALLOCATION
To achieve the phosphorus load reductions discussed in the previous section, WLAs have been identified for regulated point sources in the watershed, and LAs have been made to nonpoint sources by drainage area. Load allocations for Little Bear, Spring Creek, Newton Creek, and Cub River match existing TMDLs on those tributaries. Source reductions needed for Cutler Reservoir accounted for the reductions achieved in other TMDLs. Therefore the remaining reductions were distributed evenly across remaining sources in the watershed (that are not covered under another TMDL). Load allocations are summarized for the Southern Reservoir in Table 7.4 and the Northern Reservoir and Middle Bear River in Table 7.5.
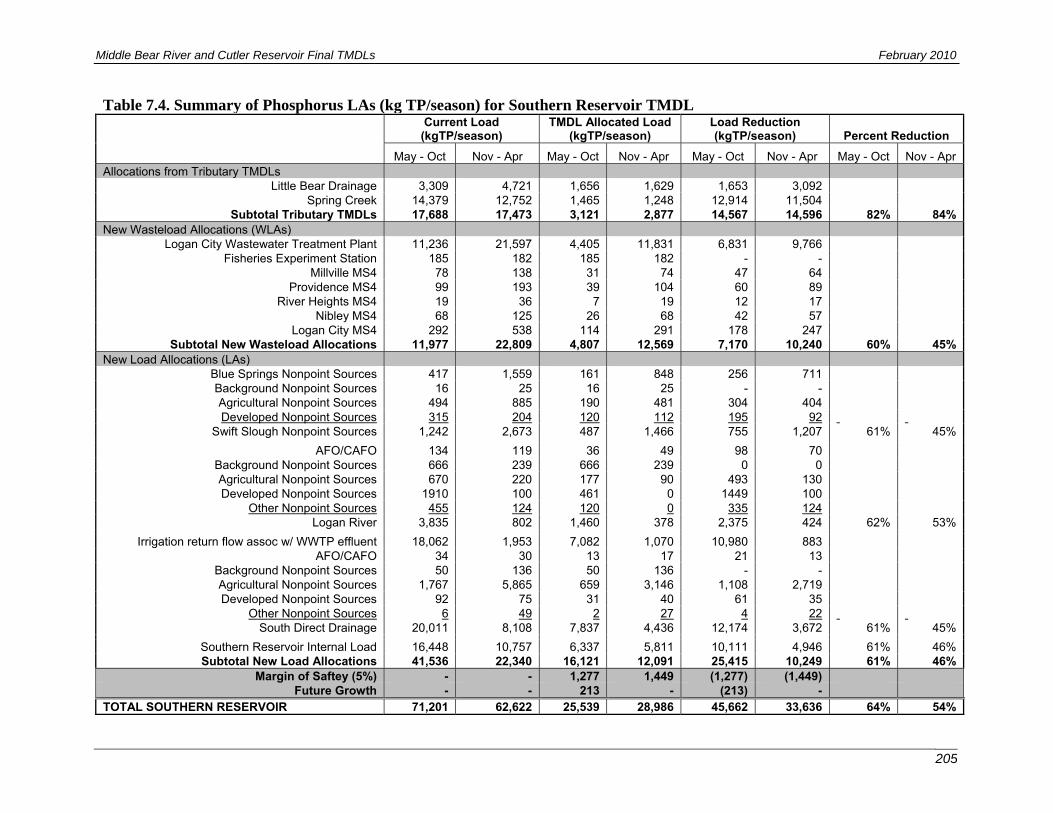
Middle Bear River and Cutler Reservoir Final TMDLs February 2010
205
Table 7.4. Summary of Phosphorus LAs (kg TP/season) for Southern Reservoir TMDL
Current Load (kgTP/season)
TMDL Allocated Load (kgTP/season)
Load Reduction (kgTP/season) Percent Reduction
May - Oct Nov - Apr May - Oct Nov - Apr May - Oct Nov - Apr May - Oct Nov - Apr Allocations from Tributary TMDLs
Little Bear Drainage 3,309 4,721 1,656 1,629 1,653 3,092 Spring Creek 14,379 12,752 1,465 1,248 12,914 11,504
Subtotal Tributary TMDLs 17,688 17,473 3,121 2,877 14,567 14,596 82% 84%New Wasteload Allocations (WLAs)
Logan City Wastewater Treatment Plant 11,236 21,597 4,405 11,831 6,831 9,766 Fisheries Experiment Station 185 182 185 182 - -
Millville MS4 78 138 31 74 47 64 Providence MS4 99 193 39 104 60 89
River Heights MS4 19 36 7 19 12 17 Nibley MS4 68 125 26 68 42 57
Logan City MS4 292 538 114 291 178 247 Subtotal New Wasteload Allocations 11,977 22,809 4,807 12,569 7,170 10,240 60% 45%
New Load Allocations (LAs) Blue Springs Nonpoint Sources 417 1,559 161 848 256 711 Background Nonpoint Sources 16 25 16 25 - - Agricultural Nonpoint Sources 494 885 190 481 304 404 Developed Nonpoint Sources 315 204 120 112 195 92
Swift Slough Nonpoint Sources 1,242 2,673 487 1,466 755 1,207 61% 45%
AFO/CAFO 134 119 36 49 98 70 Background Nonpoint Sources 666 239 666 239 0 0 Agricultural Nonpoint Sources 670 220 177 90 493 130 Developed Nonpoint Sources 1910 100 461 0 1449 100
Other Nonpoint Sources 455 124 120 0 335 124 Logan River 3,835 802 1,460 378 2,375 424 62% 53%
Irrigation return flow assoc w/ WWTP effluent 18,062 1,953 7,082 1,070 10,980 883 AFO/CAFO 34 30 13 17 21 13
Background Nonpoint Sources 50 136 50 136 - - Agricultural Nonpoint Sources 1,767 5,865 659 3,146 1,108 2,719 Developed Nonpoint Sources 92 75 31 40 61 35
Other Nonpoint Sources 6 49 2 27 4 22 South Direct Drainage 20,011 8,108 7,837 4,436 12,174 3,672 61% 45%
Southern Reservoir Internal Load 16,448 10,757 6,337 5,811 10,111 4,946 61% 46%Subtotal New Load Allocations 41,536 22,340 16,121 12,091 25,415 10,249 61% 46%
Margin of Saftey (5%) - - 1,277 1,449 (1,277) (1,449) Future Growth - - 213 - (213) -
TOTAL SOUTHERN RESERVOIR 71,201 62,622 25,539 28,986 45,662 33,636 64% 54%
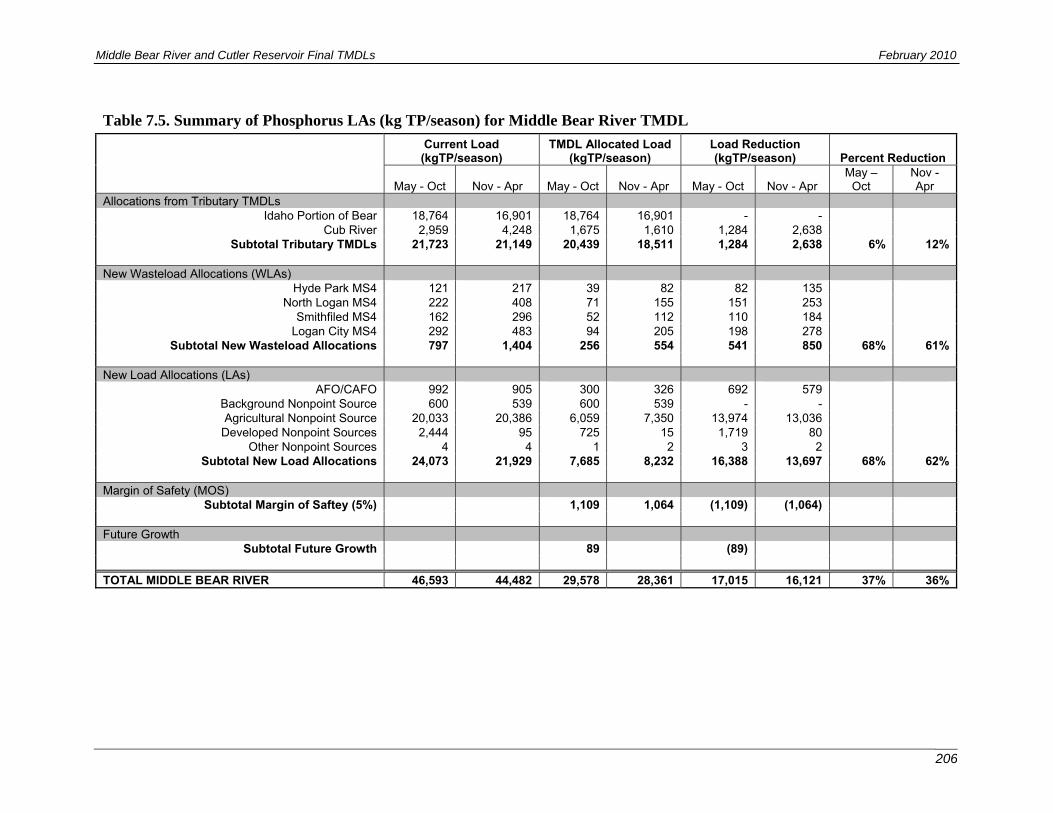
Middle Bear River and Cutler Reservoir Final TMDLs February 2010
206
Table 7.5. Summary of Phosphorus LAs (kg TP/season) for Middle Bear River TMDL
Current Load (kgTP/season)
TMDL Allocated Load (kgTP/season)
Load Reduction (kgTP/season) Percent Reduction
May - Oct Nov - Apr May - Oct Nov - Apr May - Oct Nov - Apr May –
Oct Nov - Apr
Allocations from Tributary TMDLs Idaho Portion of Bear 18,764 16,901 18,764 16,901 - -
Cub River 2,959 4,248 1,675 1,610 1,284 2,638 Subtotal Tributary TMDLs 21,723 21,149 20,439 18,511 1,284 2,638 6% 12%
New Wasteload Allocations (WLAs)
Hyde Park MS4 121 217 39 82 82 135 North Logan MS4 222 408 71 155 151 253
Smithfiled MS4 162 296 52 112 110 184 Logan City MS4 292 483 94 205 198 278
Subtotal New Wasteload Allocations 797 1,404 256 554 541 850 68% 61%
New Load Allocations (LAs) AFO/CAFO 992 905 300 326 692 579
Background Nonpoint Source 600 539 600 539 - - Agricultural Nonpoint Source 20,033 20,386 6,059 7,350 13,974 13,036
Developed Nonpoint Sources 2,444 95 725 15 1,719 80 Other Nonpoint Sources 4 4 1 2 3 2
Subtotal New Load Allocations 24,073 21,929 7,685 8,232 16,388 13,697 68% 62%
Margin of Safety (MOS) Subtotal Margin of Saftey (5%) 1,109 1,064 (1,109) (1,064)
Future Growth
Subtotal Future Growth 89 (89)
TOTAL MIDDLE BEAR RIVER 46,593 44,482 29,578 28,361 17,015 16,121 37% 36%
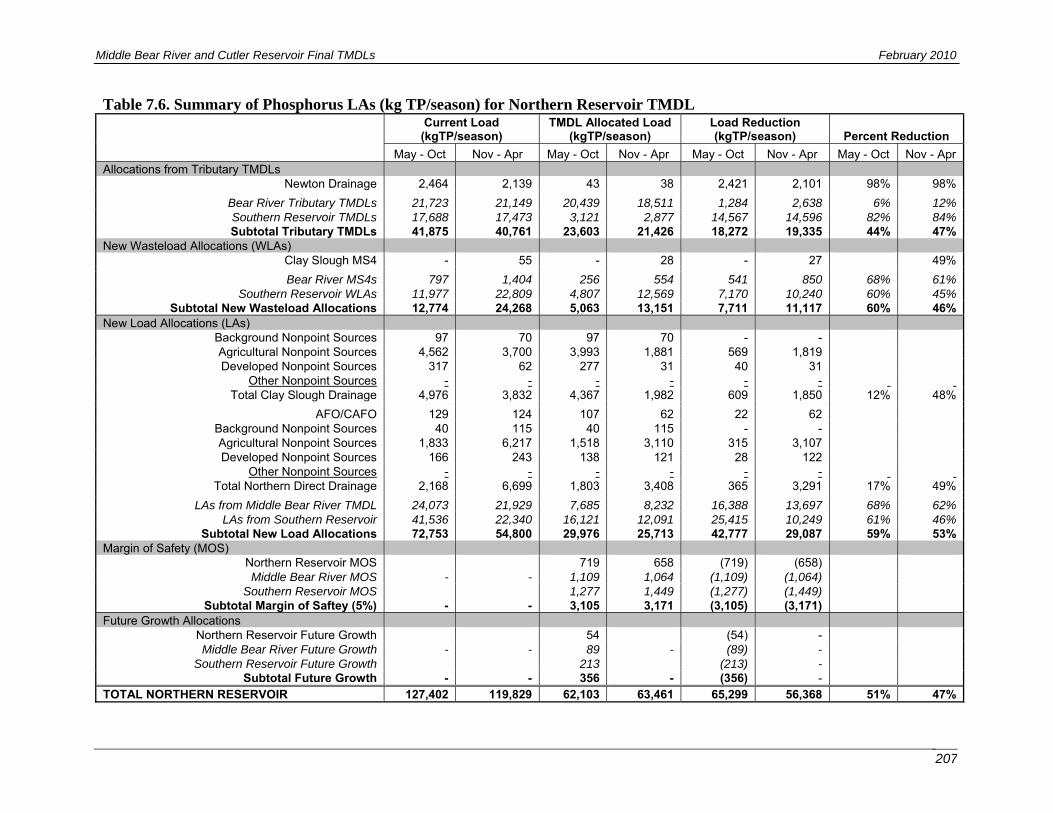
Middle Bear River and Cutler Reservoir Final TMDLs February 2010
207
Table 7.6. Summary of Phosphorus LAs (kg TP/season) for Northern Reservoir TMDL
Current Load (kgTP/season)
TMDL Allocated Load (kgTP/season)
Load Reduction (kgTP/season) Percent Reduction
May - Oct Nov - Apr May - Oct Nov - Apr May - Oct Nov - Apr May - Oct Nov - Apr Allocations from Tributary TMDLs
Newton Drainage 2,464 2,139 43 38 2,421 2,101 98% 98%
Bear River Tributary TMDLs 21,723 21,149 20,439 18,511 1,284 2,638 6% 12% Southern Reservoir TMDLs 17,688 17,473 3,121 2,877 14,567 14,596 82% 84% Subtotal Tributary TMDLs 41,875 40,761 23,603 21,426 18,272 19,335 44% 47%
New Wasteload Allocations (WLAs) Clay Slough MS4 - 55 - 28 - 27 49%
Bear River MS4s 797 1,404 256 554 541 850 68% 61% Southern Reservoir WLAs 11,977 22,809 4,807 12,569 7,170 10,240 60% 45%
Subtotal New Wasteload Allocations 12,774 24,268 5,063 13,151 7,711 11,117 60% 46%New Load Allocations (LAs)
Background Nonpoint Sources 97 70 97 70 - - Agricultural Nonpoint Sources 4,562 3,700 3,993 1,881 569 1,819 Developed Nonpoint Sources 317 62 277 31 40 31
Other Nonpoint Sources - - - - - - Total Clay Slough Drainage 4,976 3,832 4,367 1,982 609 1,850 12% 48%
AFO/CAFO 129 124 107 62 22 62 Background Nonpoint Sources 40 115 40 115 - - Agricultural Nonpoint Sources 1,833 6,217 1,518 3,110 315 3,107 Developed Nonpoint Sources 166 243 138 121 28 122
Other Nonpoint Sources - - - - - - Total Northern Direct Drainage 2,168 6,699 1,803 3,408 365 3,291 17% 49%
LAs from Middle Bear River TMDL 24,073 21,929 7,685 8,232 16,388 13,697 68% 62% LAs from Southern Reservoir 41,536 22,340 16,121 12,091 25,415 10,249 61% 46%
Subtotal New Load Allocations 72,753 54,800 29,976 25,713 42,777 29,087 59% 53%Margin of Safety (MOS)
Northern Reservoir MOS 719 658 (719) (658) Middle Bear River MOS - - 1,109 1,064 (1,109) (1,064)
Southern Reservoir MOS 1,277 1,449 (1,277) (1,449) Subtotal Margin of Saftey (5%) - - 3,105 3,171 (3,105) (3,171)
Future Growth Allocations Northern Reservoir Future Growth 54 (54) - Middle Bear River Future Growth - - 89 - (89) -
Southern Reservoir Future Growth 213 (213) - Subtotal Future Growth - - 356 - (356) -
TOTAL NORTHERN RESERVOIR 127,402 119,829 62,103 63,461 65,299 56,368 51% 47%

Middle Bear River and Cutler Reservoir Final TMDLs February 2010
208
This page intentionally blank.

Middle Bear River and Cutler Reservoir Final TMDLs February 2010
209
7.4.1 LOAD ALLOCATIONS AND REDUCTIONS IDENTIFIED IN EXISTING TMDLS
Significant reductions have been identified for the Little Bear River, Spring Creek, Newton Creek, the Cub River, and the Idaho portion of the Bear River in other TMDLs currently being implemented in the watershed (see Tables 7.4, 7.5, and 7.6). The Middle Bear River has existing load reduction requirements identified in a prior TMDL. However, because this document represents an update to that TMDL, Middle Bear River allocations are not included in this section. Reductions identified by other TMDLs account for a net reduction of 18,272 kg TP/season during the summer season and 19,335 kg TP/season during the winter season. These reductions directly account for 44% and 47% of the required reduction to the reservoir in the summer and winter, respectively. The bulk of these reductions are in the Spring Creek drainage although significant reductions as a percent of current loads are also identified for the other TMDLs. The monitored loads for the Idaho section of the Bear River indicate that TMDL targets have already been achieved for that section of the Bear River.
Load allocations identified in other TMDLs include stormwater runoff from small Municipal Separated Stormwater Sewer Systems (MS4), industrial stormwater permits, and CAFOs as follows:
Little Bear River TMDL
o Portion of Nibley City and Wellsville City MS4
Spring Creek TMDL
o Hyrum City MS4
o Weather Shield MFG Inc. industrial stormwater (UPDES Permit UTR000095)
o Intermountain Farmers Association industrial stormwater (UPDES Permit UTR000623)
o Miller Brothers Express, L.C. CAFO (UPDES Permit UTG080011)
o Pyrenees Dairy CAFO (UPDES Permit UTG080015)
Cub River TMDL
o Alcoa Consumer Products industrial stormwater (UPDES Permit UTR000302)
o Staker Parson Smithfield Pit industrial stormwater (UPDES Permit UTR000348)
o Pepperidge Farm Inc. industrial stormwater (UPDES Permit UTR000793)
After accounting for the reductions required by other TMDLs and adding a 5% MOS, significant load reductions are still required to achieve water quality targets identified for Cutler Reservoir. Additional reductions for remaining sources of phosphorous to the Southern Reservoir must come from the remaining tributaries and sources, including the Logan Regional WWTP, nonpoint sources in the subwatersheds of Swift Slough, Logan River, Clay Slough drainages, the Direct Drainage to the Reservoir, the Middle Bear River, as well as internal and unknown sources. New load reductions average 61% and 46% in the Southern Reservoir during the summer and winter seasons respectively (Table 7.4); 68% and 62% in the Middle Bear River during the summer and winter seasons respectively (Table 7.5); and 59% and 53% in the Northern Reservoir during the summer and winter seasons respectively (Table 7.6). The LAs associated with these reductions are summarized in the sections to follow.
Middle Bear River and Cutler Reservoir Final TMDLs February 2010
210
7.4.2 NEW WLAS
The Logan Regional WWTP is located in the Swift Slough subwatershed, which drains to the Southern Reservoir. The WLA for this facility is 4,405 kg TP/season during the summer and 11,831 kg TP/season during the winter. The lower allocation in the summer represents the use of wastewater effluent for irrigation water during that season. In addition, water quality endpoints identified for the winter season are not specific to the Southern Reservoir, requiring less total reduction from associated sources.
The Fisheries Experiment Station is located in the Direct Drainage to the Southern Reservoir. The WLA for this facility is 185 kg TP/season during the summer and 182 kg TP/season during the winter. The allocation reflects the current TP concentrations (0.1 mg/l) in the discharge from this facility. The facility was recently upgraded and represents a small portion (0.25%) of the watershed total. Therefore additional reductions are not required by this TMDL.
Millville City, Providence City, and River Heights are MS4 permitted municipalities in the Southern Reservoir drainage that discharge primarily to tributaries to the Logan River. Nibley City discharges a portion of its stormwater to the Logan River drainage. Logan City discharges a portion of its stormwater to the Logan River drainage and to canals and tributaries draining directly to the Southern Reservoir (a portion of Logan City’s stormwater load is discharged in the Middle Bear River subwatershed to the north). The WLAs for MS4 permitted municipal stormwater discharges in the Southern Reservoir account for 217 kgTP/season during the summer season and 556 kgTP/season during the winter seasons respectively, accounting for 0.8% and 1.9% of the loading capacity to the Southern Reservoir during the summer and winter seasons respectively.
Hyde Park, North Logan City, and Smithfield City are MS4 permitted municipalities in the Northern Reservoir drainage that discharge to tributaries of Bear River. Logan City also discharges a portion of its stormwater to the Bear River drainage. The WLAs for MS4 permitted municipal stormwater discharges in the Northern Reservoir (including the Bear River) are 256 kg TP/season during the summer season and 582 kg TP/season during the winter season respectively, accounting for less than 1% of the loading capacity to the Northern Reservoir.
The new WLAs identified in this TMDL represent a 60% and 46% reduction from current loads during the summer and winter seasons respectively, which is identical to reductions associated with nonpoint source LAs in the Southern Reservoir drainages.
7.4.3 NEW NONPOINT SOURCE LAS
7.4.3.1 AFO/CAFOs
Load allocations for AFO/CAFOs are associated with reductions to nonpoint source runoff and leakage from animal production facilities in the area. As required by the general CAFO permit for Utah, there is no direct discharge of wastewater or manure from CAFOs in the watershed. Load allocations for AFOs and CAFOs are 456 kg TP/season and 454 kg TP/season during the summer and winter seasons respectively (Tables 7.4, 7.5, and 7.6). The resulting required reductions are consistent with other nonpoint source reductions as well as point source reductions identified for Cutler Reservoir based on season and location in the watershed.
Modest reductions have already been achieved in the past few years due to improvement of waste treatment on AFOs and CAFOs (Table 7.7). Estimated reductions were calculated using the UAFFRI model by changing several assumptions as recommended by Nathan Daugs of the UACD. These assumptions include assuming that runoff previously flowed directly to waters,
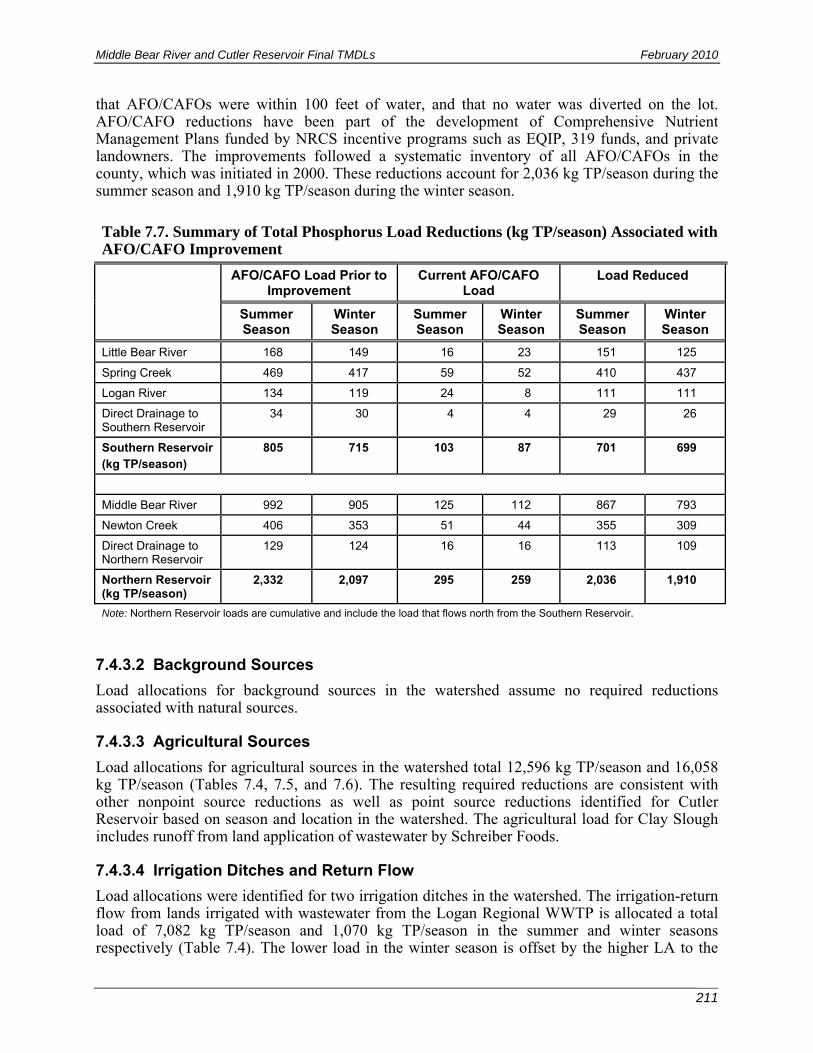
Middle Bear River and Cutler Reservoir Final TMDLs February 2010
211
that AFO/CAFOs were within 100 feet of water, and that no water was diverted on the lot. AFO/CAFO reductions have been part of the development of Comprehensive Nutrient Management Plans funded by NRCS incentive programs such as EQIP, 319 funds, and private landowners. The improvements followed a systematic inventory of all AFO/CAFOs in the county, which was initiated in 2000. These reductions account for 2,036 kg TP/season during the summer season and 1,910 kg TP/season during the winter season.
Table 7.7. Summary of Total Phosphorus Load Reductions (kg TP/season) Associated with AFO/CAFO Improvement
AFO/CAFO Load Prior to Improvement
Current AFO/CAFO Load
Load Reduced
Summer Season
Winter Season
Summer Season
Winter Season
Summer Season
Winter Season
Little Bear River 168 149 16 23 151 125
Spring Creek 469 417 59 52 410 437
Logan River 134 119 24 8 111 111
Direct Drainage to Southern Reservoir
34 30 4 4 29 26
Southern Reservoir (kg TP/season)
805 715 103 87 701 699
Middle Bear River 992 905 125 112 867 793
Newton Creek 406 353 51 44 355 309
Direct Drainage to Northern Reservoir
129 124 16 16 113 109
Northern Reservoir (kg TP/season)
2,332 2,097 295 259 2,036 1,910
Note: Northern Reservoir loads are cumulative and include the load that flows north from the Southern Reservoir.
7.4.3.2 Background Sources
Load allocations for background sources in the watershed assume no required reductions associated with natural sources.
7.4.3.3 Agricultural Sources
Load allocations for agricultural sources in the watershed total 12,596 kg TP/season and 16,058 kg TP/season (Tables 7.4, 7.5, and 7.6). The resulting required reductions are consistent with other nonpoint source reductions as well as point source reductions identified for Cutler Reservoir based on season and location in the watershed. The agricultural load for Clay Slough includes runoff from land application of wastewater by Schreiber Foods.
7.4.3.4 Irrigation Ditches and Return Flow
Load allocations were identified for two irrigation ditches in the watershed. The irrigation-return flow from lands irrigated with wastewater from the Logan Regional WWTP is allocated a total load of 7,082 kg TP/season and 1,070 kg TP/season in the summer and winter seasons respectively (Table 7.4). The lower load in the winter season is offset by the higher LA to the
Middle Bear River and Cutler Reservoir Final TMDLs February 2010
212
Logan Regional WWTP during winter, and reflects the lack of irrigation water use during that season.
The LA for Blue Springs Ditch is 161 kg TP/season and 848 kg TP/season in the summer and winter season respectively (Table 7.4). The high winter allocation reflects current load estimates based on monitoring data in Blue Springs Ditch during the winter season. These LAs also reflect runoff from Gossner Foods, which uses land application of cheese-processing wastewater on an area that drains directly to Blue Springs Ditch.
The resulting required reductions for these two ditches of 61% and 45% are identical to other point and nonpoint source reductions required for the Southern Reservoir.
7.4.3.5 Developed Sources
Load allocations for developed sources, other than those accounted for in MS4 permitted discharges (see Section 7.4.2) in the watershed total 1,752 kg TP/season and 319 kg TP/season in the summer and winter seasons respectively (Tables 7.4, 7.5, and 7.6). The resulting required reductions are consistent with other nonpoint source reductions as well as point source reductions identified for Cutler Reservoir based on season and location in the watershed. These LAs do not include stormwater runoff from small MS4s in the watershed. Three other communities with small MS4s are accounted for in other TMDLs in the watershed (see Section 7.4.1).
7.4.3.6 Other Nonpoint Sources
Load allocations for other nonpoint sources in the watershed total 123 kg TP/season and 29 kg TP/season (Tables 7.4, 7.5, and 7.6). The resulting required reductions are consistent with other nonpoint source reductions as well as point source reductions identified for Cutler Reservoir based on season and location in the watershed.
7.4.3.7 Internal and Unknown Sources
Load allocations for unknown and internal sources in the watershed total 6,337 kg TP/season and 5,811 kg TP/season in summer and winter respectively (Table 7.4). This load allocation includes internal release of phosphorus from sediments and biological degradation of organic matter in the reservoir. It also includes load from pipes that discharge water directly to Cutler Reservoir and its tributaries. The source of these pipes is unknown but could include field drains from agricultural fields, potentially illicit discharges of septic systems, drainages from barnyard areas, and/or return irrigation flow.
The resulting required reductions of 61% and 46% during the summer and winter seasons are consistent with other nonpoint source reductions as well as point source reductions identified for the Southern Reservoir.
7.4.4 MARGIN OF SAFETY
The CWA requires that the total load capacity “budget” calculated in TMDLs must also include an MOS. The MOS accounts for uncertainty in the loading calculation, and does not have to be the same for different waterbodies due to differences in the availability and strength of data used in the calculations. The MOS can be incorporated into TMDLs via the use of conservative assumptions in the load calculation or be specified explicitly as a proportion of the total load. This TMDL uses conservative assumptions to meet the MOS requirement and an additional explicit MOS of 5%.
Middle Bear River and Cutler Reservoir Final TMDLs February 2010
213
Conservative assumptions are incorporated into the data analysis, reservoir modeling, load analysis, and selection of water quality endpoints for Cutler Reservoir. Among these assumptions are the following:
• Selection of water quality endpoints protective of downstream impacts during the winter season requires significantly more load reduction than the summer season endpoints derived to meet beneficial uses in the reservoir. These additional load reductions will have additional positive beneficial effects on the reservoir.
• TMDL loads for Little Bear River were used as the current load to Cutler Reservoir, although monitoring data indicates that current loads are lower.
• Calculations related to AFO/CAFO discharges assume that the entire load from these sources is delivered to Cutler Reservoir. In reality, some of the phosphorus is lost due to in-stream processing.
• As a conservative approach, the assimilative capacity of sediments in the Northern Reservoir was not included in the load assessment. Therefore, meeting the TMDL endpoints is not dependent on the sediments acting as a sink into the future.
• An MOS is incorporated into the other TMDLs in the watershed.
The explicit 5% MOS incorporated into the LAs for Cutler Reservoir was estimated by allocating 5% of the TMDL load to the MOS. For the Southern Reservoir, this corresponds to 1,277 kg TP/season and 1,449 kg TP/season during the summer and winter seasons respectively. For the Northern Reservoir, this corresponds to an additional 1,828 kg TP/season and 1,722 kg TP/season during the summer and winter seasons respectively. The total MOS, including that allocated to the Southern Reservoir, is 3,105 kg TP/season and 3,171 kg TP/season during the summer and winter respectively (Table 7.5). A large portion of the Northern Reservoir MOS is allocated to the Middle Bear River: 1,109 kg TP/season and 1,064 kg TP/season during the summer and winter seasons respectively. The MOS was distributed proportionally across existing sources in the watershed that are not already incorporated into another TMDL and are reflected in the LAs identified in Tables 7.4, 7.5, and 7.6.
7.4.5 FUTURE GROWTH
The percent change in population in Cache County from 2005 to 2030 is estimated to increase by approximately 80% (see Section 2.2.2). Most population growth in the Cutler Reservoir watershed is anticipated to occur in urbanized areas such as Nibley City, Logan City, North Logan, Providence City, and Smithfield City.
Future growth is incorporated into the Little Bear River TMDL, the Spring Creek TMDL, the Cub River TMDL, and the Newton Creek TMDL. Growth in the remaining areas of the watershed relates to conversion of agricultural land into urban land. To estimate the conversion of Cache County agricultural land to developed land, current population estimates were divided by total current developed acreage in the watershed. This estimate of acreage per person was multiplied by expected population growth to yield an estimated 10,148 acres of additional agricultural land conversion by the year 2020. Total acreage was then multiplied by load coefficients to estimate additional phosphorus load in models. Approximately 356 kg TP season during the summer was incorporated into the TMDL allocated load; the Northern Reservoir was allocated 143 kg TP per summer season including 89 kg TP allocated to the Middle Bear River. The Southern Reservoir was allocated 213 kg TP per summer season. The total future growth load, including that allocated to the Southern Reservoir, is 356 kg TP during the summer season (Table 7.5). Future growth of the Logan Regional WWTP is also incorporated into the load allocated to this source.
Middle Bear River and Cutler Reservoir Final TMDLs February 2010
214
7.5 SEASONALITY
The seasonality requirement for TMDLs as described in the CWA is inherent in this TMDL study, which has focused on the algal growth season (the summer season) as the critical season for nutrient reductions to the reservoir necessary to support beneficial uses. Reductions have also been identified and modeled for the non-algal growth season (the winter season) to comply with the Lower Bear River TMDL established below Cutler Reservoir that has established a year-round water quality endpoint of 0.075 mg/L.
7.6 REASONABLE ASSURANCE
Load reductions for the Cutler Reservoir Watershed Implementation Proposal rely on a combination of point and nonpoint source reductions to achieve desired water quality and protect designated beneficial uses. The UDWQ believes that attainment of water quality endpoints identified in this TMDL will be made within a 10-year period through a combination of the following actions:
Point-source reductions attained through modification to UPDES permits in the watershed.
Nonpoint-source reductions attained through implementation of BMPs for agriculture, stormwater, and other land uses.
Attainment of tributary TMDL endpoints through full implementation of recommendations identified in those documents.
Logan City has identified phosphorus reduction projects throughout the Cutler Reservoir watershed in a management plan drafted for UDWQ review. Many of the projects identified in the plan could be feasibly attained through federal funding of nonpoint-source reduction projects, committed funds from Logan City, and local watershed funding from other stakeholders on the Bear River and Cutler Reservoir Advisory Committee. This plan is included as Appendix I to this TMDL and will be used as a guide by the UDWQ to identify phosphorus reduction projects throughout the watershed. Monitoring and reporting will be conducted to determine the effectiveness of implemented BMPs. If monitoring shows that load reductions are not occurring to the extent necessary, BMPs will be modified accordingly. This monitoring and modification “feedback loop” provides further assurance that estimated load reductions will be achieved by implementing a suite of BMPs, as described here. A monitoring plan is included as Appendix H to this TMDL.
In addition, the UPDES permit for the Logan Regional WWTP will be reopened upon approval of the TMDL and will be revised to be consistent with the LA identified in the TMDL. The compliance schedule for the new permit will be negotiated during the revision process. The UDWQ recognizes that the attached implementation document (Appendix I) outlines a 10-year compliance schedule for attainment of the new targets; however, the UDWQ believes that attainment of the WLA can be reasonably achieved in a shorter period of time.
7.7 SUMMARY
This document represents the TMDL analysis for Cutler Reservoir and a revised TMDL analysis for the Middle Bear River in northern Utah. The 6,900-square mile Cutler Reservoir watershed, including the Middle Bear River, is part of the Bear River basin that encompasses northeastern Utah, southeastern Idaho and southwestern Wyoming. The watershed is predominantly forest and shrubland cover in the mountains, and agricultural land uses in the lower elevations, primarily in
Middle Bear River and Cutler Reservoir Final TMDLs February 2010
215
the Cache Valley. A portion of Cache Valley is densely populated and developed for residential and commercial land uses. The reservoir and its shoreline are owned and managed by PacifiCorp.
The overall goal of the TMDL process is to restore and maintain water quality in Cutler Reservoir and Middle Bear River to a level that protects and supports the designated beneficial uses. Both the reservoir and river experience periodic low DO conditions that impair the warm water fishery use (3B). Phosphorus has been identified as the primary contributor to water quality exceedances within the Cutler Reservoir system. Cutler Reservoir was first listed as impaired on the 2004 303(d) list and was also included in the 2006 303(d) list. The Middle Bear River was first listed on the 1992 303(d) list of impaired waters. A total phosphorus TMDL was approved in 1996 on 27.84 miles of the river from Cutler Reservoir to the Idaho Stateline. This TMDL represents a revision to the original 1996 TMDL for the Middle Bear River.
In the Cutler Reservoir watershed, the following tributaries have approved TMDLs for phosphorus: Spring Creek (Spring Creek TMDL 2002), Little Bear River (Little Bear River TMDL 2000), Newton Creek (Newton Creek TMDL 2004), and the Idaho portion of the Bear River (IDEQ 2006). A revision to the Cub River TMDL is currently in progress (personal communication between Erica Gaddis, SWCA, and Mike Allred, UDWQ, September 2007). In addition, a TMDL was completed for the Lower Bear River downstream of Cutler Reservoir in 2002.
Unique components of the Cutler Reservoir system include the shallow depth and wetland habitat found in the Southern Reservoir, high temperatures that provide additional stress to fish in the system, and turbidity interference with algal growth. Due to these unique characteristics and because chlorophyll a and TP sampling dates could not be paired with diurnal DO data, a quantitative linkage between low DO and TP was not drawn for Cutler Reservoir during this TMDL study. Despite this uncertainty, several lines of evidence indicate a clear impairment to the fishery and avian uses of the reservoir, including direct exceedance of DO criteria, correlation of DO and exceedances with spawning periods of fish found in the reservoir, chlorophyll a concentrations and recorded algal blooms, the presence of blue-green algae in the system, and the trophic state index of the reservoir. A fishery study conducted for Cutler Reservoir provides a detailed assessment of the current status of the fishery and indicated poor recruitment for walleye and green sunfish.
Water quality endpoints identified for the revised Cutler Reservoir and Middle Bear River TMDLs aim to improve conditions for the warm water fishery beneficial use while also protecting recreational uses of the reservoir. The DO endpoints identified for the reservoir are consistent with existing State Water Quality criteria as follows:
• 1-day min DO of 3.0 mg/L throughout the water column
• 7-day average DO to be maintained above 4.0 mg/L
• 30-day average DO to be maintained above 5.5 mg/L
Selection of total phosphorus endpoints for the Phased TMDL was based on a convergence of several lines of evidence. These include phosphorus thresholds associated with aquatic life, endpoints selected for other shallow systems, an EPA method used to derive endpoints from historical data, examination of nutrient data at the ecoregion scale, management of the system as phosphorus limited, and impacts on downstream waters. The mean TP endpoints selected for Cutler Reservoir for the summer season are 0.07 mg/L and 0.09 mg/L for the Northern and Southern Reservoirs respectively. In addition, a TP target of 0.075 mg/L must be maintained throughout the year at the Cutler Dam outfall to protect downstream waters and comply with the Lower Bear River TMDL. The mean TP endpoint identified in the 1997 Bear River TMDL (UDWQ 1997) for the Middle Bear River is 0.05 mg/l. This standard has not yet been attained in

Middle Bear River and Cutler Reservoir Final TMDLs February 2010
216
the Bear River. Recent exceedances of the DO standard in the Middle Bear River are limited to exceedances of the early life stage criteria of 5.0 mg/l. Therefore, the UDWQ believes that the 0.05 mg/l endpoint remains an appropriate target for the river.
Attainment of the water quality endpoints identified in the Cutler Reservoir TMDL depend on attainment of TMDL allocations identified in the following other TMDLs for tributaries to Cutler Reservoir: the Little Bear River TMDL (2000), the Spring Creek TMDL (2002), the Idaho Bear River TMDL (2006), the Cub River TMDL (1997; revision in progress), and the Newton Creek TMDL (2004).
The majority of regulated point sources in the Cutler Reservoir watershed are accounted for in the other TMDLs in the watershed. The remaining regulated point sources in the drainage area are the Logan Regional WWTP, the Fisheries Experiment Station, and stormwater from MS4 permitted municipalities. Nonpoint sources are grouped into four major land use types and sources: 1) agriculture, 2) forest, 3) urban/suburban (including stormwater that is not included in MS4 permitted discharges), and 4) miscellaneous/natural sources. All these sources contribute to the water quality impairment in the reservoir and have been allocated a load in this TMDL. New WLAs and LAs identified for the Southern Reservoir require a 61% and 46% reduction of total phosphorus during the summer and winter seasons respectively. New WLAs and LAs identified for the Northern Reservoir require a 59% and 53% reduction of total phosphorus during the summer and winter seasons respectively. New LAs identified for the Middle Bear River require a 68% and 62% reduction of total phosphorus from nonpoint sources in Utah during the summer and winter seasons respectively.

Middle Bear River and Cutler Reservoir Final TMDLs February 2010
217
REFERENCES
American Public Health Association (APHA). 1992. Standard methods for the Examination of Water and Wastewater, 18th edition. American Public Health Association, Washington DC.
Bayne, D. R., M. J. Maceina, and W.C. Reeves. 1994. Zooplankton, fish, and sport fishing quality among four Alabama and Georgia reservoirs or varying trophic status. Lake and Reservoir Management. 8(2):153–163.
Beasley, V. R.; Cook, W. O.; Dahlem, A. M.; Hooser, S. B.; Lovell, R. A.; and Valentine, W. M. (1989). Algae intoxication in livestock and waterfowl. Vet. Clin. N. Am.—Food Animal Practice 5(2):345-361.
Breitburg, D. L. 1990. Nearshore hypoxia in the Chesapeake Bay: Patterns and relationships among physical factors. Estuarine Coastal and Shelf Science. 30:593–610.
Breitburg, D. L. 1992. Episodic hypoxia in the Chesapeake Bay: interacting effects of recruitment, behavior and a physical disturbance. Ecological Monographs. 62:525–546.
Breitburg, D. L., T. Loher, C. A. Pacey, and A. Gerstein. 1997. Varying effects of low dissolved oxygen on trophic interactions in an estuarine food web. Ecological Monographs 67:489–507.
Breitburg, D. L., S. P. Seitzinger, and J. G. Sanders (eds.). 1999. The effects of multiple stressors in marine and freshwater systems. Limnology and Oceanography (special issue). 44, no. 3, pt. 2: 233.
Breitburg, D. L., L. Pihl and S. E. Kolesar. 2001. Effects of low dissolved oxygen on the behavior, ecology and harvest of fishes: A comparison of the Chesapeake and Baltic systems. 241–267. In Nancy N. Rabalais and R. Eugene Turner (eds.), Coastal Hypoxia: Consequences for Living Resources and Ecosystems. Coastal and Estuarine Studies 58, American Geophysical Union, Washington, D.C.
Breitburg, D. L.. 2002. Effects of hypoxia, and the balance between hypoxia and enrichment, on coastal fishes and fisheries. Estuaries. 25:767–781.
Breitburg, D. L., and G. F. Riedel. 2005. Multiple stressors in marine systems, p. 167–182. In: E. Norse and L. Crowder, eds. Marine Conservation Biology: The Science of Maintaining the Sea’s Biodiversity. Island Press, Washington.
Budy, P., K. Dahle, and G. P. Thiede. 2006. An evaluation of the fish community of Cutler Reservoir and the Bear River above the reservoir with consideration of the potential for future fisheries enhancement. 2005 Annual Report to Utah Department of Environmental Quality, Division of Water Quality (UTCFWRU 2006(5):1–58), Salt Lake City, Utah.
Budy, P., K. Dahle, and G. P. Thiede. 2007. An evaluation of the fish community of Cutler Reservoir and the Bear River above the reservoir with consideration of the potential for future fisheries enhancement. 2006 Annual Report to the Utah Department of Environmental Quality, Division of Water Quality. 75 pp.
Canter, L. W. and R. C. Knox. 1985. Septic Tank System Effects on Ground Water Quality. CRC Press.
Middle Bear River and Cutler Reservoir Final TMDLs February 2010
218
Carignan, R. and J. Kalff. 1980. Phosphorus sources for aquatic weeds: Water or sediment? Science 207: 987–989.
Carlson, R. E. 1977. A trophic state index for lakes. Limnology and Oceanography. 22(2):361–369.
Carlson, R.E. 1992. Expanding the trophic state concept to identify non-nutrient limited lakes and reservoirs. pp. 59-71 [In] Proceedings of a National Conference on Enhancing the States’ Lake Management Programs. Monitoring and Lake Impact Assessment. Chicago.
Carlson, R.E. and J. Simpson. 1996. A Coordinator's Guide to Volunteer Lake Monitoring Methods. North American Lake Management Society. 96 pp.
Carpenter, S.R. 1983. Submersed macrophyte community structure and internal loading: Relationship to lake ecosystem productivity and succession. In Lake restoration, protection, and management: Proceedings of the Second Annual Conference of NALMS in Vancouver, British Columbia, October 26–29, 1982, by the US EPA, 105–111. Washington D.C.: EPA.
Center for Disease Control (CDC). 2008. Facts about cyanobacteria and cyanobacterial harmful algal blooms. Accessed: March 5, 2008. Available at www.cdc.gov/hab/cyanobacteria/facts.htm
Codd, G. A., J. Lindsay, F. M. Young, L. F. Morrison, and J. S. Metcalf. 2005. Harmful cyanobacteria: From mass mortalities to management measures. p. 9 In: Azim, M. E., M. C. J. Verdegem, A. A. Van Dam, and M. C. M. Beveridge (eds.). Periphyton: Ecology, Exploitation and Management. CABI Publishing; Cambridge, Massachusetts. 319 pp.
Cooke, G. D., E. B. Welch, S. Peterson, and S. A. Nichols. 2005. Restoration and Management of Lakes and Reservoirs. CRC Press.
Cornell University 2008. Birds of North America Online (BNA). Accessed December 7, 2007. Web site available at: http://bna.birds.cornell.edu/bna.
D’Avanzo, C. and J. N. Kremer. 1994. Diel oxygen dynamics and anoxic events in an eutrophic estuary of Waquoit Bay, Massachusetts. Estuaries. 17:131–139.
Dees, T. 2008. Effects of wastewater treatment plant discharge on benthic invertebrate communities in Cutler Reservoir. In W.A. Wurtsbaugh (ed.), Comparison of chemical and biological characteristics in Cutler Reservoir (Utah) near the inflows of the Logan River and the Logan Waste Water Treatment Plant. Aquatic Ecology Practicum Class Report, College of Natural Resources, Utah State University.
Dennison, W. C., R. J. Orth, K. A. Moore, J. C. Stevenson, V. Carter, S. Kollar, P. W. Bergstrom, R.A. Batiuk. 1993. Assessing Water Quality with Submersed Aquatic Vegetation. BioScience, 43(2):86–94.
Dillon, P. J. and F. H. Rigler. 1974. The phosphorus-chlorophyll relationship in lakes. Limnol. Oceanogr, 19, 767–73.
Dodds, W.K., Jones, J.R., and E.B. Welch. 1998. Suggested classification of stream trophic state: Distributions of temperate stream types by chlorophyll, total nitrogen, and phosphorus. Water Research 32 (5): 1455 – 1462.
Dunne, T. and L.B. Leopold. 1978. Water in Environmental Planning. W.H. Freeman and Company, New York.
Middle Bear River and Cutler Reservoir Final TMDLs February 2010
219
Elder, D., Killam, G., and T.P. Koberstein. 1999. The Clean Water Act: An owner's manual. Portland Oregon. River Network.
EPA and Colorado State University, May 1972. Managing Irrigated Agriculture to Improve Water Quality. Proceedings of National Conference on Managing Irrigated Agriculture to Improve Water Quality.
Environmental Protection Agency (EPA). 1983. Methods for Chemical Analysis of Water and Wastes (1983), USEPA, EPA 600/4-79-020.
EPA 1986. Quality Criteria for Water. EPA-440/5-86-001, Washington, D.C.
EPA. 1998. Lake and reservoir bioassessment and biocriteria technical guidance manual. EPA-841-B-98-007. Washington D.C.
EPA, Office of Water. 2000a. Nutrient criteria technical guidance manual: Lakes and reservoirs. EPA-922-BOO-001. (April 2000).
EPA, Office of Water. 2000b. Nutrient criteria technical guidance manual: Rivers and streams. EPA-922-BOO-002. (July 2000).
EPA. 2001. Ambient water quality criteria recommendations: Information supporting the development of state and tribal nutrient criteria. Lakes and Reservoirs in Nutrient Ecoregion III, United States Environmental Protection Agency, Office of Water. EPA 822-B-01-008.
EPA. 2003. Ambient water quality criteria for dissolved oxygen, water clarity, and chlorophyll a for Chesapeake Bay and its tributaries. EPA-903-R-03-002 (April 2003).
EPA. 2006. Clarification regarding “phased” Total Maximum Daily Loads. Memorandum. August 2, 2006. URL: http://www.epa.gov/owow/tmdl/tmdl_clarification_letter.pdf
EPA. 2007. STORET Database Access. Accessed 9/15/2007. Available at www.epa.gov/storet/dbtop.html
EPA, Office of Water. 2009. Ecoregional nutrient criteria. Available at http://www.epa.gov/waterscience/criteria/nutrient/ecoregions/ Accessed August 16, 2009.
Galatowitcsh, S. M., N. O. Anderson, and P. D. Ascher. 1999. Invasiveness in wetland plants in temperate North America. Wetlands. 19, no. 4:733–755.
Haines, T.A. (1973) Effects of nutrient enrichment and a rough-fish population (carp) on a game-fish population (smallmouth bass). Trans. Am. Fish Soc., 102, 346–54.
Hedley, M.J., J.J. Mortvedt, N.S. Bolan, and J.K. Syers. 1995. Phosphorus Fertility Management in Agrosystems; Chapter 5 In: Phosphorus in the Global Environment: Transfers, Cycles and Management. Tiessen, H.; (ed.); John Wiley and Sons, Chichester.
Hegman, W., Want, D., and Borer, C. 1999. Estimation of Lake Champlain basinwide nonpoint source phosphorus export. Lake Champlain Basin Program Technical Report No. 31. Grand Isle, VT.
Heiskary, S. A. and W. W. J. Walker. 1988. Developing phosphorus criteria for Minnesota lakes. Lake and Reservoir Management. 4(1):1–9.
Heiskary, S. A. and W. W. J. Walker. 1995. Establishing a chlorophyll a goal for a run-of-the-river reservoir. Lake and Reservoir Management. 1(1):67–76.
Middle Bear River and Cutler Reservoir Final TMDLs February 2010
220
Herbert, L. R. and B.K. Thomas. 1992. Seepage Study of the Bear River Including Cutler Reservoir in Cache Valley, Utah and Idaho. Utah Department of Natural Resources Technical Publication No. 105. 18 p.
Hill, R.W. 1994. Consumptive use of irrigated crops in Utah. Research Report 145. Utah Agricultural Experiment Station; Utah State University, Logan, Utah. pp. 361.
Hortness, J.E. and C. Berenbrock. 2001. Estimating monthly flow and annual streamflow statistics at ungaged sites in Idaho. Water-Resources Investigations Report 01-4093. USGS, Boise, ID.
Hu, W. F., W. Lo, H. Chua, S. N. Sin, and P. H. F. Yu. 1991. Nutrient release and sediment oxygen demand in a eutrophic land-locked embayment in Hong Kong. Environment International 26: 369–375.
Idaho Department of Environmental Quality (IDEQ). 2005. Bear River/Malad River Sub-basin Assessment and Total Maximum Daily Load Plan. Idaho Department of Environmental Quality, Pocatello, Idaho. 258p.
IDEQ. 2006. Bear River/Malad Creek Snake River–Hells Canyon Total Maximum Daily Load (TMDL). Idaho Department of Environmental Quality, Boise. Oregon Department of Environmental Quality, Portland. 574p.
Jobling, M. 1981. Temperature tolerance and the final preferendum: Rapid methods for the assessment of optimum growth temperatures. Journal of Fish Biology. 19:439-455.
Jokela, W.E., Magdoff, F.R., and Durieux, R.P. 1998. Improved phosphorus recommendations using modified Morgan phosphorus and aluminum soil tests. Communications in Soil Science and Plant Analysis. 29(11-14): p. 1739-1749
Jones, J. R. and R. W. Bachmann. 1976. Prediction of phosphorus and chlorophyll levels in lakes. J. Water Pollut. Control Fed., 48, 2176–82.
Jones, J. R. and M. V. Hoyer. 1982. Sportfish harvest predicted by summer chlorophyll a concentration in midwestern lakes and reservoirs. Transactions of the American Fisheries Society 111:176–179.
JUB Engineers. 2003. Cache County Urbanized Area Stormwater Analysis.
Karr, J. R., K. D. Fausch, P. L. Angermeier, P. R. Yant, and I. J. Schlosser. 1986. Assessment of biological integrity in running water: A method and its rationale. Illinois Natural History Survey, Special Publication Number 5, Campaign, Illinois.
Kaufman, K. 1996. Lives of North American Birds. Houghton Mifflin: New York
Keate, N. S. 2001. Functional Assessment of Great Salt Lake Ecosystem Slope and Depressional Wetlands. 2001 Model. Utah Division of Wildlife Resources, Salt Lake City.
Keate, N. S. 2005. Functional Assessment of Great Salt Lake Ecosystem Slope and Depressional Wetlands. 2005 Model. Utah Division of Wildlife Resources, Salt Lake City.
Khaleel, R.; Reddy, K.R.; Overcash, M.R.. 1980. Transport of Potential Pollutants in Runoff Water from Land Areas Receiving Animal Wastes: A Review. Water Research 14: 421–436.
Middle Bear River and Cutler Reservoir Final TMDLs February 2010
221
Landers, D.H. and E. Lottes. 1983. Macrophyte dieback: Effects on nutrients and phytoplankton dynamics. In Lake restoration, protection, and management: Proceedings of the Second Annual Conference of NALMS in Vancouver, British Columbia, October 26–29, 1982, by the US EPA, 105–111. Washington DC: Environmental Protection Agency.
Lassleben, P. 1951. Is supersaturation with oxygen dangerous? Fischbauer 2, 105; Water Pollution Abstracts, 25:6.
Lazoff, S.B. 1983. Evaluation of internal phosphrous loading from anaerobic sediments. In Lake restoration, protection, and management: Proceedings of the Second Annual Conference of NALMS in Vancouver, British Columbia, October 26–29, 1982, by the EPA, 105–111. Washington D.C.: EPA.
Lindsay, W.L., Vlek, P.L.G., and Chien, S.H., Phosphate minerals, in Minerals in soil environments, Dixon, J.B. and Weed, S.B., Editors. 1989, Soil Science Society of America: Madison.
Logan City, 2001. Logan City Stormwater Master Plan. Available at http://208.187.223.182/accounts/dept14/images/swmp.pdf
Lougheed, V.L., B. Crosbie, and P. Chow-Fraser. 1998. Predictions on the effect of common carp (Cyprinus carpio) exclusion on water quality, zooplankton, and submergent macrophytes in a Great Lakes wetland. Canadian Journal of Fish and Aquatic Science 55:1189–1197.
Lowe, M., Wallace, J., and C.E. Bishop. 2003. Ground-water quality classification and recommended septic tank soil-absorption-system density maps. Cache Valley, Cache County, Utah. Utah Geologic Survey Special Study 101.
Luckett, C., and C. Poukish. 2004. Fish kill trends in the Maryland Coastal Bays. Maryland’s Coastal Bays: Ecosystem Health Assessment. Maryland Department of Natural Resources, Annapolis, Maryland.
Maceina, M. J. 2001. Trophic state and fish in Alabama reservoirs. Lakeline 21(3):16–19.
Magdoff, F., Lanyon, L., and Liebhardt, B. 1997. Nutrient cycling, transformations, and flows: Implications for a more sustainable agriculture. Advances in Agronomy. 60: p. 1-73
Magdoff, F.R., Jokela, W.E., and Durieux, R.P., Evaluation of soil factors controlling phosphorus concentration in runoff from agricultural soils in the Lake Champlain basin. 1997, Lake Champlain Basin Program: Burlington, Vermont.
Magdoff, F.R., Hryshko, C., Jokela, W.E., Durieux, R.P., and Bu, Y. 1999. Comparison of phosphorus soil test extractants for plant availability and environmental assessment. Soil Science Society of America Journal. 63(4): p. 999-1006
Mahoney, D.; Erman, D.C. 1984. An Index of Stored Fine Sediment in Gravel Bedded Streams. Water Resources Bulletin 20 (3): 343–348.
McKee, J. E., and H. W. Wolf. 1963. Water quality criteria, second edition. Publication No. 3-A, State Water Quality Control Board; Sacramento, CA.
Megahan, W.F. 1972. Volume Weight of Reservoir Sediment in Forested Areas; Journal of the Hydraulics Division, Proceedings of the American Society of Civil Engineers; Volume 98; Number HY8. August. pp. 1335–1342.

Middle Bear River and Cutler Reservoir Final TMDLs February 2010
222
Megahan, W.F. 1979. Channel Stability and Channel Erosion Processes. Workshop Proceedings: Scheduling Timber Harvest for Hydraulic Concerns; Portland, Oregon; November 27–29; p. 18.
Morgan, A.M., Royer, T.V., David, M.B., and L.E. Gentry. 2006. Relationships among nutrients, chlorophyll-a, and dissolved oxygen in agricultural streams in Illinois. Journal of Environmental Quality 35: 1110–1117.
Mosley, J.C., TP.S. Cook, A.J. Griffis, and J. O'Laughlin. 1997. Guidelines for Managing Cattle Grazing in Riparian Areas to Protect Water Quality: Review of Research and Best Management Practices Policy. University of Idaho.
MPCA (Minnesota Pollution Control Agency). 2009. Long and Farquar Lakes TMDL — Excess Nutrients. Availablt at http://www.pca.state.mn.us/water/tmdl/project-longfarquar-nutrients.html. Accessed August 21, 2009.
National Agricultural Statistics Service (NASS). 2002 Census of agriculture county profile: Cache County, Utah. Accessed at http://www.nass.usda.gov/census/census02/profiles/ut/cp49005.PDF.
NASS. 2008. 2002 Census of agriculture. United States Department of Agriculture, national Agricultural Statistics Service. URL: http://www.agcensus.usda.gov/Publications/2002/index.asp. Accessed 11/12/2008.
Natural Resources Conservation Service (NRCS–USDA). 1998. NWCC Technical Note 99–1, Stream Visual Assessment Protocol. December 1998.
Nebeker, A. V., S. T. Onjukka, D. G. Stevens, G. A. Chapman and S. E. Dominguez. 1992. Effects of low dissolved oxygen on survival, growth and reproduction of Daphnia, Hyalella, and Gammarus. Environmental Toxicology and Chemistry, 11(3):373–379.
Ney, J. J. et al. 1990. Factors affecting the sport fishery in a multiple-use Virginia reservoir. Lake and Reservoir Management. 6(1): 21–32.
Novotny, V. and H. Olem. 1994. Water Quality: Prevention, Identification, and Management of Diffuse Pollution. John Wiley and Sons, Inc.; New York. pp. 250–251. 1054 p.
Oldham, J. H. 2001. Evaluating the trophic status and setting nutrient protection endpoints in Utah lakes and reservoirs. Civil and Environmental Engineering. Logan, UT, Utah State University. Master of Science: 138.
Olness, A.; Smith, S.J.; Rhoades, E.D.; Menzel, R.D. 1975. Nutrient and Sediment Discharge from Agricultural Watersheds in Oklahoma. Journal of Environmental Quality 4(3): 331–336.
Omernik, J.M.; Abernathy, A.R.; Male, L.M.. 1981. Stream Nutrient Levels and Proximity of Agricultural and Forest Land to Streams: Some Relationships. Journal of Soil and Water Conservation July-August: 227–231
PacifiCorp. 2002. Cutler Hydro Project no. 2420 resource management plan five-year implementation and monitoring report: 1995–2002. Prepared for the Federal Energy Regulatory Commission, Portland Regional Office; 101 SW Main Street, Suite 905; Portland, Oregon 97204.
Middle Bear River and Cutler Reservoir Final TMDLs February 2010
223
Pilgrim, K., D. Sanders, and T. Dupuis. 2001. Relationship between chlorophyll a and beneficial uses. CH2M Hill, Boise, Idaho. 10 p.
Pitois, S., M.H. Jackson, and B.J.B. Wood. 2000. Problems associated with the presence of cyanobacteria in recreational and drinking waters. International Journal of Environmental Health Research. 10(3):203–218.
Pitt, R., Maestre, A., and Morquecho, R. 2004. Findings from the National Stormwater Quality Database (NSQD). Center for Watershed Protection. Ellicott City, MD.
Platts, W.S. and Nelson, R.L. 1995. Streamside and Upland Vegetation Use by Cattle. Rangelands 7(1): 5–7.
Price, C. B., C. Cerco, and D. Gunnison. 1994. Sediment oxygen demand and its effects on dissolved oxygen concentrations and nutrient release: initial laboratory studies. Water Quality Research Program Technical Report W-94-1. Prepared for the U.S. Army Corps of Engineers, Waterways Experiment Station, Vicksburg, MS. March 1994. 41 pages + appendix.
Raschke, R. 1993. Guidelines for assessing and predicting eutrophication status of small southeastern piedmont impoundments. EPA-Region IV. Environmental Services Division, Ecological Support Branch. Athens, Georgia.
Raschke, R. L. 1994. Phytoplankton bloom frequencies in a population of small southeastern impoundments. Lake and Reservoir Management 8(2):205–210.
Raschke, R. L. 1995. Phytoplankton bloom frequencies in a population of small southeastern impoundments. Lake and Reservoir Management, 8(2):205–210.
Reddell, D.L., Johnson, W.H., Lyerly, TP.J., and Hobgood, TP. 1971. Disposal of Beef Manure by Deep Plowing. Livestock Waste Management and Pollution Abatement; ASAE Publication, Proceedings -271, ASAE; St. Joseph, Michigan; pp. 235–238.
Renfro, W. C. 1963. Gas-bubble mortality of fishes in Galveston Bay, Texas. Trans. Am. Fish. Soc. 92:320–322.
Rosenberg, D.M., and V.H. Resh. 1993. Freshwater biomonitoring and benthic macroinvertebrates. Chapman and Hall: New York.
Rushforth, S. R., and S. J. Rushforth. 2005. A study of phytoplankton floras from Utah lakes and reservoirs collected late summer 2004. Report to the Utah Division of Water Quality.
Ryding, S.O., and Rast, W. [editors]. 1989. The control of eutrophication of lakes and reservoirs. New Jersey: The Partheon Publishing Group.
Sabater, S., and W. Admiraal. 2005. Periphyton as biological indicators in managed aquatic ecosystems, p.159–177. In: Azim, M. E., Verdegem, M. C. J., A. A. Van Dam, and M. C. M. Beveridge (eds.). Periphyton: Ecology, Exploitation and Management. CABI Publishing, Cambridge, Massachusetts. 319 pp.
Schisler, G. J., E. P. Bergeresen, and P. G. Walker. 2000. Effects of multiple stressors on morbidity and mortality of fingerling rainbow trout infected with Myxobolus cerebralis. Transactions of the American Fisheries Society 129:859–865.
Schindler, D.W. 1977. Evolution of Phosphorus Limitation in Lakes. Science 187:260–262.
Middle Bear River and Cutler Reservoir Final TMDLs February 2010
224
Schofield, P. J., J. D. Williams, L. G. Nico, P. Fuller, and M. R. Thomas. 2005. Distribution and biology: U.S. Geological Survey scientific investigations report. 2005–5041:03
Schlesinger, W.H. 1997. Biogeochemistry: an analysis of global change. 2nd ed. San Diego: Academic Press.
Seager, J., I. Milne, M. Mallett, and I. Sims. 2000. Effects of short-term oxygen depletion on fish. Environmental Toxicology and Chemistry. 19, no. 6 (December): 2937–2942
Sharpley, A.N., C.A. Jones, C. Grey, and C.V. Cole. 1984. A simplified soil and plant phosphorus model II: Prediction of labile, organic and sorbed phosphorus; Soil Science Society of America Journal 48: 805-809.
Sharpley, A.N.; Smith, S.J.; Jones, O.R.; Berg, W.A.; Coleman, G.A.. 1992. The Transport of Bioavailable Phosphorus in Agricultural Runoff. Journal of Environmental Quality 21: 30–35.
Sharpley, A.N., Hedley, M.J., Sibbesen, E., Hillbricht-Ilkowska, A., House, W.A., Ryszkowski, L. 1995. Phosphorus transfers from terrestrial to aquatic ecosystems. Chapter 11 In Phosphorus in the Global Environment: transfers, cycles and management; Tiessen, H.(ed.); John Wiley and Sons, Chichester.
Sharpley, A.N., Kleinman, P.J.A., McDowell, R.W., Gitau, M., and Bryant, R.B. 2002. Modeling phosphorus transport in agricultural watersheds: Processes and possibilities. Journal of Soil and Water Conservation. 57(6): p. 425-439
Sherwood, G.D., J. Kovecses, A. Hontela, and J.B. Rassmussen. 2002. Simplified food webs lead to energetic bottlenecks in polluted lakes. Canadian Journal of Fish and Aquatic Science 59:1-5.
Shewmaker, G.E.. 1997. Livestock Grazing Effects on Phosphorus Cycling in Watersheds. Proceedings: Watershed and Riparian Workshop. LeGrand, Oregon; September 11–13; p. 25.
Schindler, D.W. 1977. Evolution of phosphrous limitation in lakes. Science 195: 260–262.
Schindler, D.W., Fee, E.J., and T. Ruszczynski. 1978. Phopshorus input and its consequences for phytoplankton standing crop and production in the Experimental Lakes Area and in smilar lakes. Journal of the Fisheries Research Board of Canada 35: 190–196.
Schlesinger, W.H. 1997. Biogeochemistry: An analysis of global change. Academic Press, San Diego.
Skagen, S.K, and H.D. Oman. 1996. Dietary flexibility of shorebirds in the Western Hemisphere. Canadian Field-Naturalist. 110(3):419–444.
Smeltzer, E. and S. A. Heiskary. 1990. Analysis and applications of lake user survey data. Lake and Reservoir Management. 6(1):109–118.
Smith, V. 1985. Protective models for the biomass of blue-green algae in lakes. Water Resources Bulletin WARBAQ 2(3):433–439.
Sonzongi, W.C.; Chapra, S.C.; Armstrong, D.E.; Logan, T.J.1982. Bioavailability of Phosphorus Inputs to Lakes. Journal of Environmental Quality 11(4): 555–563.
Middle Bear River and Cutler Reservoir Final TMDLs February 2010
225
Stoller, J. 2008. Benthic invertebrate biomass and densities in Cutler Reservoir near the inflow of the Logan River and the Logan Waste Water Treatment Plant, In W.A. Wurtsbaugh (ed.), Comparison of chemical and biological characteristics in Cutler Reservoir (Utah) near the inflows of the Logan River and the Logan Waste Water Treatment Plant. Aquatic Ecology Practicum Class Report, College of Natural Resources, Utah State University.
Tiessen, H. (ed.). 1995. Phosphorus in the Global Environment: Transfers, Cycles and Management. Scientific Committee on Problems of the Environment (SCOPE) 54; John Wiley and Sons, Chichester.
Uhlmann, D. 1982. Evaluation of strategies for controlling eutrophication of lakes and reservoirs. International Revue der gesamten Hydrobiologie 67 (6): 821–835.
U.S. Department of Agriculture (USDA) A. 1997. National Engineering Handbook: Part 630 Hydrology. Natural Resources Conservation Service, United States Department of Agriculture. September 1997. URL: http://directives.sc.egov.usda.gov/18380.wba
Utah Audubon Society. 2004. Online publication. [Accessed September 12, 2007]. Audubon recognizes ten new “Important Bird Areas” in Utah, Announcement Comes on Eve of International Migratory Bird Day (May 8, 2004). Available at http://www.world-wire.com/news/0507040003F.html.
Utah Division of Water Resources (UDWaR). 2004. Bear River Basin: Planning for the Future.
Utah Department of Workforce Services (UDWS), 2007. Cache County Demographic and Economic Profile. Salt Lake City, Utah.
Utah Division of Water Quality (UDWQ), Department of Environmental Quality (UDEQ). 2006. Utah's 2006 Integrated Report. Volume II – 303(d) List of Impaired Waters.
UDWQ, UDEQ. 2004. Clarkston Creek, Newton Reservoir, Newton Creek TMDL Study. Prepared for Utah Division of Environmental Quality-Division of Water Quality by Cirrus Ecological Solutions, LC, Logan, Utah. June 24, 2004. 123 p.
UDWQ, UDEQ. 2004. Newton Creek TMDL Water Quality Study. Salt Lake City, Utah.
UDWQ, UDEQ. 2002. Lower Bear River Watershed Restoration Action Strategy: A Sub-basin Assessment for the Lower Bear River and Tributaries from GSL to Cutler Reservoir in Box Elder County, Utah. Salt Lake City, Utah, Utah Department of Environmental Quality, Division of Water Quality.
UDWQ, UDEQ. 2002. Spring Creek TMDL Water Quality Study. Salt Lake City, Utah.
UDWQ. 2002. Lower Bear River and Tributaries TMDL. URL: http://www.waterquality.utah.gov/TMDL/Lower_Bear_River_TMDL.pdf
UDWQ, UDEQ. 2000. Little Bear Reservoir TMDL Water Quality Study. Salt Lake City, Utah.
UDWQ, UDEQ. In progress. Cub River TMDL Water Quality Study. Salt Lake City, Utah.
UDWQ, UDEQ. 1997. Lower Bear River Water Quality Management Plan. Prepared by Ecosystem Research Institute and Bear River RC&D. Prepared for Utah Department of Environmental Quality/Division of Water Quality and Utah Department of Natural Resources/Division of Water Resources. November 1995. 160 pp. + Appendices.
Middle Bear River and Cutler Reservoir Final TMDLs February 2010
226
Utah Division of Water Resources (UDWaR). 2004. Bear River Basin: Planning for the Future. Salt Lake City: State of Utah, Natural Resources, Division of Water Resources.
Utah Division of Wildlife Resources. 2007. Sensitive species by county. Accessed at http://dwrcdc.nr.utah.gov/ucdc/ViewReports/sscounty.htm.
Utah Division of Wildlife Resources (UDWiR). 2008. Fisheries Experiment Station. URL: http://wildlife.utah.gov/fes/
Utah Governors Office of Planning and Budget. 2005 Economic and demographic projections. Online publication. Accessed November 2, 2007. Website available at http://www.governor.utah.gov/DEA/05BaselineCityProj.pdf.
Utah Office of Tourism. 2004. State and county economic and travel indicator profiles. Salt Lake City, Utah. March 2004.
Walker, R. R. and W. J. Snodgrass. 1986. Model for sediment oxygen demand in lakes. Journal of Environmental Engineering 112(1): 25–43.
Walker, W. W. 1999. Simplified procedures for eutrophication assessment and prediction: User manual. Vicksburg, MS, U.S. Army Corps of Engineers, Waterways Experiment Station.
Walker, W. W. J. 1985. Empirical methods for predicting eutrophication in impoundments. Report 3. Phase II. Model Refinements. Technical Report. .
Walmsley, R. D. 1984. Chlorophyll a trophic status classification system for South African impoundments. Journal of Environmental Quality 13(1):97–104.
Wang, L., D.M. Robertson, and P.J. Garrison. 2007. Linkages between Nutrients and Assemblages of Macroinvertebrates and Fish in Wadeable Streams: Implication to Nutrient Criteria Development. Environmental Management 39:194-212.
Warren, R. S., P. E. Fell, J. L. Grimsby, E. L. Buck, G. C. Rilling, and R. A. Fertik. 2001. Rates, patterns, and impacts of Phragmites australis expansion and effects of experimental phragmites control on vegetation, macroinvertebrates, and fish within tidelands of the lower Connecticut River. Estuaries. 24, no. 1:90–107.
Watershed Sciences, Inc. (WSI). 2006. Airborne thermal infrared remote sensing: Cutler Reservoir, Utah. Watershed Sciences, Inc.; 230 SW 3rd Street, Suite 206; Corvallis, Oregon 97333.
Weigel, B.M. and D.M. Robertson. 2007. Identifying biotic integrity and water chemistry relations in nonwadable rivers of Wisconsin: Toward the development of nutrient criteria. Environmental Management 40: 691–708.
Weijters, M.J., Janse, J.H., Alkemade, R., and J.T. A. Verhoeven. 2009. Quantifying the effect of catchment land use and water nutrient concentrations on freshwater river and stream biodiversity. Aquatic Conservation: Marine and Freshwater Ecosystems. 19: 104–112.
Welch, E. B. and T. Lindell. 1992. Ecological effects of wastewater: applied limnology and pollutant effects. E & FN Spon, Taylor and Francis Group. 425 pp.
Wetzel, R.G. 1983. Limnology. Saunders, Philadelphia.
Wetzel, R.G. 2001. Limnology: Lake and River Ecosystems. 3rd Edition ed. San Diego: Academic Press.
Middle Bear River and Cutler Reservoir Final TMDLs February 2010
227
Whiting, TP.J.; Matisoff, G.; Bonniwell, E.C. 1997. Phosphorus Radionuclide Tracing of Fine Sediment in Forested Watersheds. Case Western Reserve University, Department of Geological Sciences, Cleveland, Ohio; July; 39 p + appendices.
Whitworth, W. R. 1968. Effects of diurnal fluctuations of dissolved oxygen on the growth of brook trout. J. Fish. Res. Board Canada 25:579–584.
Woo I. and J. B. Zedler. 2002. Can nutrients alone shift a sedge meadow towards dominance by the invasive Typha x glauca? Wetlands 22(3):509–521.
Woodbury. L. A. 1942. A sudden mortality of fishes accompanying a supersaturation of oxygen in Lake Waubesa, Wisconsin. Transactions of the American Fisheries Society 71:112–117.
Wozniewski, M. and K. Opuszynski, 1988. Threshold oxygen content in water for juvenile stages of the cyprinids (Ctenopharyngodon idella val., Hypophthalmichthys molitrix val., Aristichthys nobilis Rich., Cyprinus carpio L.). Roczniki Nauk Rolniczych, 101(4):51–59. [In Polish with English summary.]
Wurtsbaugh, W.A. [ed]. 2008. Comparison of chemical and biological characteristics in Cutler Reservoir (Utah) near the inflows of the Logan River and the Logan Waste Water Treatment Plant. Aquatic Ecology Practicum Class Report, College of Natural Resources, Utah State University.
Young, E.O. and Ross, D.S. 2001. Phosphate release from seasonally flooded soils: A laboratory microcosm study. Journal of Environmental Quality. 30(1): p. 91-101
Yuan L. L. 2004. Assigning macroinvertebrate tolerance classifications using generalized additive models. Freshwater Biology 49(5):662–677.

Middle Bear River and Cutler Reservoir Final TMDLs February 2010
228
This page intentionally blank.
Middle Bear River and Cutler Reservoir Final TMDLs February 2010
229
References Consulted but Not Directly Cited Baldwin, C. 2005. Cutler Reservoir capacity table update. PacifiCorps Co. November 22, 2005.
Bayne, D. R., M. J. Maceina, and W.C. Reeves. 1994. Zooplankton, fish, and sport fishing quality among four Alabama and Georgia reservoirs or varying trophic status. Lake and Reservoir Management. 8(2):153–163.
Bjornn, T. C. and D. W. Reiser. 1991. Habitat requirements of salmonids in streams. American Fisheries Society Special Publication. 19:83–138.
Effler, S. W. and A. P. Bader. 1998. A limnological analysis of Cannonsville Reservoir, NY. Lake and Reservoir Management. 14(2–3):125–139.
Effler, S. W., R. K. Gelda, M. Perkins, D. A. Matthews, E. M. Owens, C. Stepczuk, and A. P. Bader. 1998. Characteristics and origins of metalimnetic dissolved oxygen minima in a eutrophic reservoir. Lake and Reservoir Management, 14(2–3):332–343.
Environmental Protection Agency (EPA). 1998. Lake and reservoir bioassessment and biocriteria technical guidance manual. EPA-841-B-98-007. Washington D.C.
EPA. 2002. Consolidated Assessment and Listing Methodology Webpage, Office of Water, Monitoring Water Quality. Accessed at http://www.epa.gov/owow/monitoring/calm.html.
Fore, L. S. and C. S. Grafe. 2000. River diatom index. In: C. S. Grafe, editor. Chapter 5, Idaho river ecological assessment framework: An integrated approach. Idaho Department of Environmental Quality, Boise. 207 p.
Grafe, C. S., M. J. McIntyre, C. A. Mebane, and D. T. Mosier. 2000. The Idaho Department of Environmental Quality Waterbody Assessment Guidance, Second Edition. Idaho. Department of Environmental Quality, Boise. 94 p.
Harrison, J., S. Wells, et al. 1999. 1999 Status Report on Brownlee Reservoir Water Quality and Model Development. Boise, ID., Idaho Power Company.
Heiskary, S. A. and W. W. Walker. 1988. Developing phosphorus criteria for Minnesota lakes. Lake and Reservoir Management. 4(1):1–9.
Heiskary, S. A. and W. W. Walker. 1995. Establishing a chlorophyll a goal for a run-of-the-river reservoir. Lake and Reservoir Management. 11(1):67–76.
Hendricks, A. S., M. J. Maceina, and W. C. Reeves. 1995. Abiotic and biotic factors related to black bass fishing quality in Alabama. Lake and Reservoir Management, 11(1):47–56.
Hoelscher, B. 2002. Evaluation of chlorophyll a nuisance thresholds and targets for the southwest Snake River and Brownlee Reservoir. Technical Attachment, Hells Canyon Complex FERC no. 1971 (April).
Idaho Department of Environmental Quality (IDEQ) 58.01.02. No Date. Water quality standards and wastewater treatment requirements. IDPQ, Idaho State Office, Boise. 161 p.
IDEQ. 2000. Waterbody assessment guidance–public review draft. Prepared by Grafe, C. S., M. J. McIntyre, C. A. Mebane, and D. T. Mosier. Second Edition. Idaho. Department of Environmental Quality, Boise, Idaho. December 2000.
IDEQ, 2005. Bear River/Malad Subbasin Assessment and Total Maximum Daily Load Plan for HUCs 16010102, 16010201, 16010202, 16010204. Prepared by Ecosystems Research Institute, Inc., Logan, UT. January 2005.

Middle Bear River and Cutler Reservoir Final TMDLs February 2010
230
IDEQ and Oregon Department of Environmental Quality (ODEQ). 2003. Snake River - Hells Canyon Total Maximum Daily Load. IDEQ and ODOE.
IDEQ AND ODEQ. 2004. Snake River–Hells Canyon Total Maximum Daily Load (TMDL). Idaho Department of Environmental Quality, Boise. Oregon Department of Environmental Quality, Portland. 574p.
Idaho Power Company. 2001. Salmonid spawning a beneficial use for Brownlee Reservoir (Habitat requirements of spawning salmonids and Brownlee Reservoir salmonid observations).
Jones, J .R. and M. V. Hoyer. 1982. Sportfish harvest predicted by summer chlorophyll a concentration in Midwestern lakes and reservoirs. Transactions of the American Fisheries Society. 111:176-179.
Karr, J. R., K. D. Fausch, P. L. Angermeier, P. R. Yant, and I. J. Schlosser. 1986. Assessment of biological integrity in running water: A method and its rationale. Illinois Natural History Survey, Special Publication Number 5, Campaign, Illinois.
Maceina, M. J. 2001. Trophic state and fish in Alabama reservoirs. Lakeline. North American Lake Management Society. Fall 2001.
McDowell, R.W. and Sharpley, A.N. 2001. Approximating phosphorus release from soils to surface runoff and subsurface drainage. Journal of Environmental Quality. 30(2): p. 508-520
Meehan, W. R and T. C. Bjornn. 1991. Salmonid distributions and life histories. American Fisheries Society Special Publication 19:47–82.
Milligan, J. H., R. A. Lyman, C. M. Falter, E. E. Krumpe, and J. E. Carlson. 1983. Classification of Idaho’s freshwater lakes. University of Idaho, Idaho Water and Energy Resources. Research Institute, Moscow. 67p.
NALMS. 1992. Developing eutrophication standards for lakes and reservoirs. A Report Prepared by the Lake Standards Subcommittee. May 1992.
National Academy of Sciences (NAS). 2001. Assessing the TMDL approach to water quality management: Committee to assess the scientific basis of the TMDL approach to water pollution reduction. Water and Science Technology Board, Division on Earth and Life Sciences, National Research Council. June 2001.
Ney, J. J., C. M. Moore, M. S. Tisa, J. J. Yurk, and R. J. Neves. 1990. Factors affecting the sport fishery in a multiple use Virginia reservoir. Lake and Reservoir Management, 6(1):21–32.
Ney, J-J. 1996. Oligotrophication and its discontents: Effects of reduced nutrient loading on reservoir fisheries. In L. E. Miranda and D. R. Devires eds., Multidimensional approaches to reservoir fisheries management. American Fisheries Society. Bethesda, Maryland.
Northcote, T. G. 1997. Potamodromy in salmonidae: Living and moving in the fast lane. North American Journal of Fisheries Management. 17:1029–1045.
OAR 340-041. No Date. Water quality standards and beneficial uses. Oregon Department of Environmental Quality, Portland. 270 p.

Middle Bear River and Cutler Reservoir Final TMDLs February 2010
231
ODEQ. 1986. Memorandum from ODEQ director to Environmental Quality Commission, agenda item no. 0, January 31, 1986 EQC Meeting, [see especially, Attachment E, Rationale for chlorophyll a levels and methodology].
ODEQ. 2007. Water Pollution. Division 41. Water quality standards: Beneficial uses, policies, and criteria for Oregon. Nuisance Phytoplankton Growth. Oregon Department of Environmental Quality. 340-041-0019. http://arcweb.sos.state.or.us/rules/OARs_300/OAR_340/340_041.html.
Ogelsby, R. T. 1977. Relationship of fish yield to lake phytoplankton standing crop, production, and morphoedaphic factors. Journal of the Fisheries Research Board of Canada. 34:2271-2279.
Pitois, S., et al. 2000. Problems associated with the presence of cyanobacteria in recreational and drinking waters. International Journal of Environmental Health and Research. 10: 203-218.
Raschke, R. L. 1995. Phytoplankton bloom frequencies in a population of small southeastern impoundments. Lake and Reservoir Management, 8(2):205–210.
Reid, W. W., W. H. Goodnight, and B. Bowler. 1973. Survey of angler use and harvest in the Snake River above Brownlee Reservoir Job III-a) and Survey of Fish Populations in the Snake River above Brownlee Reservoir Job III-b). Federal Aid to Fish Restoration, Snake River Fisheries Investigations, Job Progress Report F-63-R-2. Idaho Department of Fish and Game.
Scott, W. B. and E. J. Crossman. 1973. Freshwater Fishes of Canada. Fisheries Research Board of Canada, Bulletin 184.
Sharpley, A.N., McDowell, R.W., and Kleinman, P.J.A. 2001. Phosphorus loss from land to water: integrating agricultural and environmental management. Plant and Soil. 237(2): p. 287-307
Smeltzer, E. and S. A. Heiskary. 1990. Analysis and applications of lake user survey data. Lake and Reservoir Management, 6(1):109–118.
Smith, V. H. 1985. Predictive models for the biomass of blue-green algae in lakes. Water Resources Bulletin, 21(3):433–438.
Smith, V. H. e. a. 1987. Predicting the summer peak biomass of four species of blue-green algae in Swedish lakes. Journal of the American Water Resources Association 23(3): 397–402.
Sorensen, D. L., Caupp, C., Grenney, W. J., Eberl, S., Messer, J. J., Ludvigsen, P. and C. W. Ariss. 1986. Water quality management studies for water resources development in the Bear River Basin.
Steed, R. 2002. Beneficial Use Reconnaissance Project. Unpublished data.
Stumm, W. and Morgan, J.J. 1981. Aquatic Chemistry: An Introduction Emphasizing Chemical-Equilibria in Natural-Waters. New York: John Wiley and Sons.
Trimbee, A. M. and E. E. Prepas. 1987. Evolution of total phosphorus as a predictor of the relative biomass of blue-green algae with emphasis on Alberta Lakes. Canadian Journal of Fisheries and Aquatic Sciences 44(7):1337–1342.
Middle Bear River and Cutler Reservoir Final TMDLs February 2010
232
Trimbee, A. M., and E. E. Prepas. 1987. Evaluation of total phosphorus as a predictor of the relative biomass of blue-green algae with emphasis on Alberta lakes. Can. J. Fish. Aquat. Sci., 44:1337–1342.
Utah Division of Administrative Rules. Rule 317-2. Standards of Quality for Waters of the State, as in effect on June 1, 2003. Accessed 9/1/2003. Website was available at: www.rules.utah.gov/publicat/code/r317/r317-002.htm.
Utah Division of Water Quality (UDWQ). 1995. Lower Bear River water quality management plan. Prepared by Ecosystems Research Institute for Utah Department of Environmental Quality.
VTANR and NYDEC. 2002. Lake Champlain Phosphorus Total Maximum Daily Load (TMDL). Waterbury, VT and Albany, NY, Vermont Agency of Natural Resources and New York State Department of Environmental Conservation. 133.
Walker, W. W. 1985. Water quality criteria and standards. In: Lake and reservoir management: Practical applications. Proceedings of the 4th Annual Conference and International Symposium. (October 16–19):57–62.
Webb, W. E. 1964. General investigation in water quality. Idaho Department of Fish and Game, Idaho State Office, Boise. Investigations Project F 34-R-5.
Weiss, C. M. a. E. J. K. 1976. The trophic state of North Carolina lakes, University of North Carolina Water Resources Research Institute. Report 119.
Western Regional Climate Center (WRCC). 2006. Western Regional Climate Center. Available at: www.wrcc.sage.dri.edu/summary/climsmut.html
Woo I. and J. B. Zedler. 2002. Can nutrients alone shift a sedge meadow towards dominance by the invasive Typha x glauca? Wetlands 22(3):509–521.
WRRI, N. 2001. The cholorphyll a standard: A primer. Water Resources Research Institute News of The University of North Carolina. 328:8–10.

Middle Bear River and Cutler Reservoir Final TMDLs February 2010
233
LIST OF ABBREVIATIONS
Abbreviation Definition
~ approximate ac acre acre-ft acre foot cfs cubic feet per second cts counts ft foot ft3 cubic foot h hectare kg kilogram km kilometer L liter m meter MGD million gallons per day mi mile mL milliliter pH measure of acidity: pH 1-6 = acidic, pH 7 = neutral, pH 8-14 = basic SU standard units T ton Tier 1 all land within 150 feet of either side of a stream Tier 2 low land, mostly irrigated crop and pastureland Tier 3 upland mostly non-irrigated pasture mg milligram µg microgram yr year oC degrees Celsius
§303(d) Refers to Section 303 subsection (d) of the Clean Water Act, or a list of impaired waterbodies required by this section
μ micro, one-one thousandth § Section (usually a section of federal or state rules or statutes) AFO Animal Feed Operation APHA American Public health Association AU animal unit AUM Animal Unit Month AWS agricultural water supply BAG Basin Advisory Group BLM United States Bureau of Land Management BMP best management practice BOD biochemical oxygen demand BOR United States Bureau of Reclamation BURP Beneficial Use Reconnaissance Program C Celsius CAFO Confined Animal Feeding Operations CDC Center for Disease Control CEC Cation exchange capacity CFR Code of Federal Regulations (refers to citations in the federal
administrative rules) cfs cubic feet per second Chl a chlorophyll a cm centimeters

Middle Bear River and Cutler Reservoir Final TMDLs February 2010
234
Abbreviation Definition
CN curve number CNFL Confluence CNMP Comprehensive nutrient management plan CV coefficients of variance CWA Clean Water Act CWAL cold water aquatic life DBU designated beneficial uses DEM digital elevation model DEQ Department of Environmental Quality DGL digital graph line DLG dissolved gas supersaturation DO dissolved oxygen DOI U.S. Department of the Interior DWS domestic water supply EMC Event Mean concentration EPA United States Environmental Protection Agency EPC equilibrium phosphorus concentration EQUIP Environmental Quality Incentive Program ESA Endangered Species Act ET Evapotranspiration rate Exceedance Refers to a violation of water quality criteria. If the criteria reads “greater
than”, then an exceedance is any recorded value that is below the criteria. If the criteria reads “less than”, then an exceedance is any recorded value that is above the criteria.
F Fahrenheit FERC Federal Energy Regulatory Commission FWS U.S. Fish and Wildlife Service FWPCA Federal Water Pollution Control Act GBT gas bubble trauma GIS Geographical Information Systems HOD hypolimnetic oxygen depletion HRU hydrologic response unit HUC Hydrologic Unit Code IBA Important Bird Area IDEQ Idaho Department of Environmental Quality INFISH The federal Inland Native Fish Strategy km Kilometer km2 square kilometer LA load allocation LC load capacity m meter m3 cubic meter mi mile mi2 square miles MBI macroinvertebrate index MGD million gallons per day mg/L milligrams per liter mm millimeter MOD metalimnetic oxygen depletion rate MOS margin of safety MRLC Multi-Resolution Land Characteristics Consortium MUSLE Modified Universal Soil Loss Equation MWMT maximum weekly maximum temperature n.a. not applicable
Middle Bear River and Cutler Reservoir Final TMDLs February 2010
235
Abbreviation Definition
N Nitrogen NA not assessed NB natural background nd no data (data not available) NED National Elevation Dataset NFS not fully supporting NHD National Hydrography Dataset N:P nitrogen-to-phosphorus NPDES National Pollutant Discharge Elimination System NRCS Natural Resources Conservation Service NTU nephelometric turbidity unit ORW Outstanding Resource Water P Phosphorus PCR primary contact recreation PFC proper functioning condition ppm part(s) per million QA quality assurance QC quality control RHCA riparian habitat conservation area SBA sub-basin assessment SCR secondary contact recreation SCS Soil Conservation Service SD Secchi Depth SE standard error SNOTEL snow telemetry SRP soluble reactive phosphorus SS salmonid spawning SSOC stream segment of concern SSURGO Soil Survey Geographic (SSURGO) Database STATSGO State Soil Geographic (STATSGO) Database STORET EPA water quality database SVAP Stream Visual Assessment Protocol SWReGAP Southwest Regional Gap Analysis Project TAC The Bear River and Cutler Reservoir Technical Advisory Committee TDG total dissolved gas TDS total dissolved solids T&E threatened and/or endangered species TGP total gas pressure TIN total inorganic nitrogen TKN total Kjeldahl nitrogen TMDL total maximum daily load TP total phosphorus TS total solids TSI Trophic State Index TSS total suspended solids t/y tons per year UACD Utah Association of Conservation Districts UAFRRI Utah Animal Feedlot Runoff Risk Index UDEQ Utah Department of Environmental Quality UDNR Utah Department of Natural Resources UDWaR Utah Division of Water Resources UDWRi Utah Division of Water Rights UDWiR Utah Division of Wildlife Resources UDWQ Utah Division of Water Quality
Middle Bear River and Cutler Reservoir Final TMDLs February 2010
236
Abbreviation Definition
UGS Utah Geological Survey UPDES Utah Pollutant Discharge Elimination System U.S. United States U.S.C. United States Code USACE United States Army Corps of Engineers USDA United States Department of Agriculture USDI United States Department of the Interior USFS United States Forest Service USGS United States Geological Survey USU Utah State University WAG Watershed Advisory Group WBID water body identification number WiLMS Wisconsin Lake Modeling Suite WLA wasteload allocation WQLS water quality limited segment WQMP water quality management plan WQS water quality standard WRCC Western Regional Climate Center WWTP Logan Wastewater Treatment Plant