c17.0 total maximum daily loads (tmdls) development plan … · · 2004-01-23c17.0 total maximum...
TRANSCRIPT

C17.0 Total Maximum Daily Loads (TMDLs) Development Plan for
Cooks Run Watershed
230

Stream segments in the Cooks Run watershed (Stream Segment ID# s 482 and 482A) were listed as being impaired by “nutrients” and “cause unknown” from urban runoff/storm sewers and a municipal point source. An analysis of the loads from this particular watershed reveal that, in fact, the watershed is essentially a point source-dominated watershed, and that nutrients from all other sources are quite insignificant. As shown in the results of an AVGWLF model run (see Table C17.1), on an annual basis, the sole municipal point source in the watershed (PA0021172) contributes 77% of the total phosphorus load. During low-flow conditions, this percentage is even higher. During such conditions, the only other loads essentially are those contributed by groundwater (i.e., base flow) and septic systems. When these are considered, the point source contribution during low-flow conditions is approximately 92% of the total. Consequently, a TMDL for nutrients from “urban runoff/storm sewers” was not developed for the stream segments in this sub-watershed. Rather, as described for other sub-watersheds in previous sections, the nutrient impairments due to point source discharges are dealt with in Section D. A TMDL was also not developed for “unknown causes”. It was assumed that addressing nutrient loads via point source reductions will at the same time reduce the level of these unknown causes within the watershed.
Figure C17.1. Cooks Run Watershed.
231

Table C17.1. Existing P Loading Values for the Cooks Run Watershed
Land Use Category Area (acres)
Mean Annual Phosphorus Load
(lbs/year)
Unit Area Phosphorus Load
(lbs/acre/yr) Hay/Pasture 84 18 0.21Cropland 321 256 0.80Coniferous Forest 69 0 <0.01
77 0 <0.01Deciduous Forest 151 1 <0.01Transitional 47 35 0.74Low Intensity Developed 783 6 0.01High Intensity Developed 699 95
Groundwater 183Point Source 2,050Septic Systems 6Total 2,231 2,664
Mixed Forest
0.14Stream Bank 14
1.19
232

C18.0 Total Maximum Daily Loads (TMDL) Development Plan for Neshaminy Tributary #4 Watershed
233

Segments in the Neshaminy Creek Tributary #4 watershed (Stream Segment ID#s 980609-1258-GLW and 980609-1259-GLW) were listed as being impaired by water/flow variability caused by urban runoff/storm sewers. A TMDL for this impairment was not developed for this watershed because neither the U.S. Environmental Protection Agency (EPA) nor PaDEP currently have water quality criteria for this impairment. Furthermore, quantitative measures for water flow variability or alterations as “impairments” are not currently available. However, it is assumed for these segments that addressing sediment loads through the use of urban BMPs will at the same time reduce water flow variability or alterations within the watershed. As discussed previously, all municipalities within the Neshaminy Creek watershed will be affected by PaDEP’s new stormwater management policy (MS4), a copy of which has been included in Appendix E.
Additionally, one of the stream segments (ID# 980609-1259-GLW) was also listed for a nutrient impairment due to a municipal point source. This also was not addressed in this section. Rather, as described for other sub-watersheds in previous sections, the nutrient impairments due to point source discharges are dealt with in Section D.
Figure C18.1. Neshaminy Creek Tributary #4 watershed.
234

EXECUTIVE SUMMARY FOR POINT SOURCE SECTION This section addresses stream segments listed due to problems associated with municipal point source discharges within the Neshaminy Creek watershed. Based upon field assessments completed under the State’s Unassessed Waters Program, 81.4 miles of the 418.3 stream miles in the watershed have been listed as being impaired by municipal point sources on the State’s current 303(d) List since 1996. Such problems are primarily related to excess nutrients. In some areas where point source discharges are located, problems with nutrient-enriched sediment from agricultural and urban areas also occur. These latter problems have been identified and addressed in Section C. In such cases, TMDLs were developed to address this type of problem.
In contrast to what was done for the nonpoint source-related problems discussed in Section C, a combined approach involving the use of the watershed-based AVGWLF model and the “in-stream” STREAMPLAN-PA model was used. In this case, AVGWLF was first used to estimate non-point source loads to affected streams, and then STREAMPLAN-PA was subsequently used to combine these loads with point source discharge data to estimate in-stream nutrient concentrations. These estimated in-stream concentrations were calculated for critical, low-flow conditions; conditions under which point source-dominated systems such as Neshaminy Creek are most vulnerable. In-stream phosphorus concentrations under future loading (i.e., discharge) conditions were compared with concentrations under existing loading conditions in order to determine required point source load reductions. It was determined based on the modeling exercise that in-stream water quality conditions could be improved (i.e., phosphorus concentrations could be decreased) when point source phosphorus limits are reduced to 1 mg/l under current discharged flows. (Most of the limits are now set at 2 mg/l, with some exceptions). However, it is expected that in-stream phosphorus concentrations will increase above current levels once all wastewater facilities in the watershed are operating at maximum capacity (i.e., maximum discharge flows) under a phosphorus limit of 1 mg/l. (At present, the cumulative discharged flow from all facilities is about 50% of the cumulative permitted maximum flow). In order offset these increases as discharge flows increase, and to again improve water quality beyond current conditions, it will be necessary to further reduce phosphorus loads from the point sources. After numerous model runs with discharges at permitted flows, it was found that the effluent phosphorus concentration from point sources must be reduced to 0.8 mg/L in order to achieve reductions (relative to current conditions) in water column phosphorus concentrations at all points in the watershed.
235

D1.0 INTRODUCTION TO POINT SOURCE-RELATED ASSESSMENTS This section addresses stream segments listed due to problems associated with municipal point source discharges within the Neshaminy Creek watershed. Such problems are primarily related to excess nutrients. In some areas where point source discharges are located, problems with nutrient-enriched sediment from agricultural and urban areas also occur. These latter problems have been identified and addressed in the Section C. In such cases, TMDLs were developed to address this type of problem. Information pertaining to segments impaired by municipal point sources is summarized in Table D1.1, and the segments themselves are graphically depicted in Figure D1.1. Based upon field assessments completed under the State’s Unassessed Waters Program, 81.4 miles of the 418.3 stream miles in the watershed have been listed as being impaired by municipal point sources on the State’s current 303(d) List since 1996. In a modeling study conducted by the U.S. EPA in the early 1980s (U.S. EPA, 1982), it was determined that Neshaminy Creek was experiencing dissolved oxygen and organic enrichment problems due to excessive nutrient loads from municipal wastewater treatment plants in the watershed. Two of the recommendations of this report for eliminating the above problems were: 1) that municipal treatment plants install advanced treatment to remove excess phosphorus, and 2) that DEP implement a phosphorus discharge limit of 2 mg/l during low-flow periods for municipal facilities. Both of these recommendations have since been implemented, and as described in the next section, such upgrades and phosphorus discharge limits appear to have reduced in-stream loads of nutrients (particularly phosphorus) over the last half-dozen years. Also, as described later, most point source dischargers appear to be complying with limitations stated in their respective NPDES Table D1.1. Segments impaired by municipal point source discharges as described on the Pennsylvania’s current 303(d) list.
Stream
Segment ID
Cause
Year Listed
Cooks Run
Little Neshaminy Cr. Mill Creek
Neshaminy Creek*
Neshaminy Creek Park Creek
W. Branch, Nesh. Cr.
467
980609-1259-GLW 980622-1146-GLW
PH
Other organics Nutrients
Flow Alterations
2002 2002 & 1996
Neshaminy Creek* Neshaminy Creek* Neshaminy Creek Neshaminy Creek
Park Creek W. Branch, Nesh. Cr. W. Branch, Nesh. Cr. W. Branch, Nesh. Cr.
482A
980629-1342-GLW 20010417-1342-GLW
467 467
980515-1347-GLW 980515-1347-GLW
980622-1147-GLW 492
980202-1043-GLW 980205-1330-GLW 980205-1333-GLW
Nutrients Nutrients Nutrients Nutrients
Organic Enrichment/Low DO
Water/Flow Variability
Nutrients & DO/BOD Nutrients Nutrients
Excess Algal Growth/Nutrients
Flow Alterations
1996 1996 2002 1996 1996 1996 2002 1996
2002 1996
2002/1996 2002 2002
* Note: Same segment is listed for three different impairment causes
236

Figure D1.1. Map depicting location of streams impaired (Y) or not impaired (N) by point source discharges as noted on DEP’s current 303(d) list.
permits, and where occasional compliance problems have occurred, the frequency and magnitude
of such events suggest minimal compliance problems with point source discharges in the watershed. However, as detailed in later sub-sections, it is also readily apparent that these reductions have not been sufficient to mitigate water quality impairments related to high nutrient levels (specifically phosphorus), and that more reductions in point source discharges are needed in order to achieve acceptable water quality conditions. As detailed in the previous section (Section C), the AVGWLF modeling approach was used to support TMDL development in watersheds containing stream segments that were listed as being primarily impaired due to non-point sources (e.g., agriculture, urban areas, land development, etc.). With this approach, AVGWLF was typically used to estimate unit area loading rates for sediment and/or nutrients in an impaired watershed and compare the loads against similarly-derived loads in either a reference watershed or in the same watershed during a “pre-problem” time period. However, in situations where streams were listed for nutrient impairments due to
237
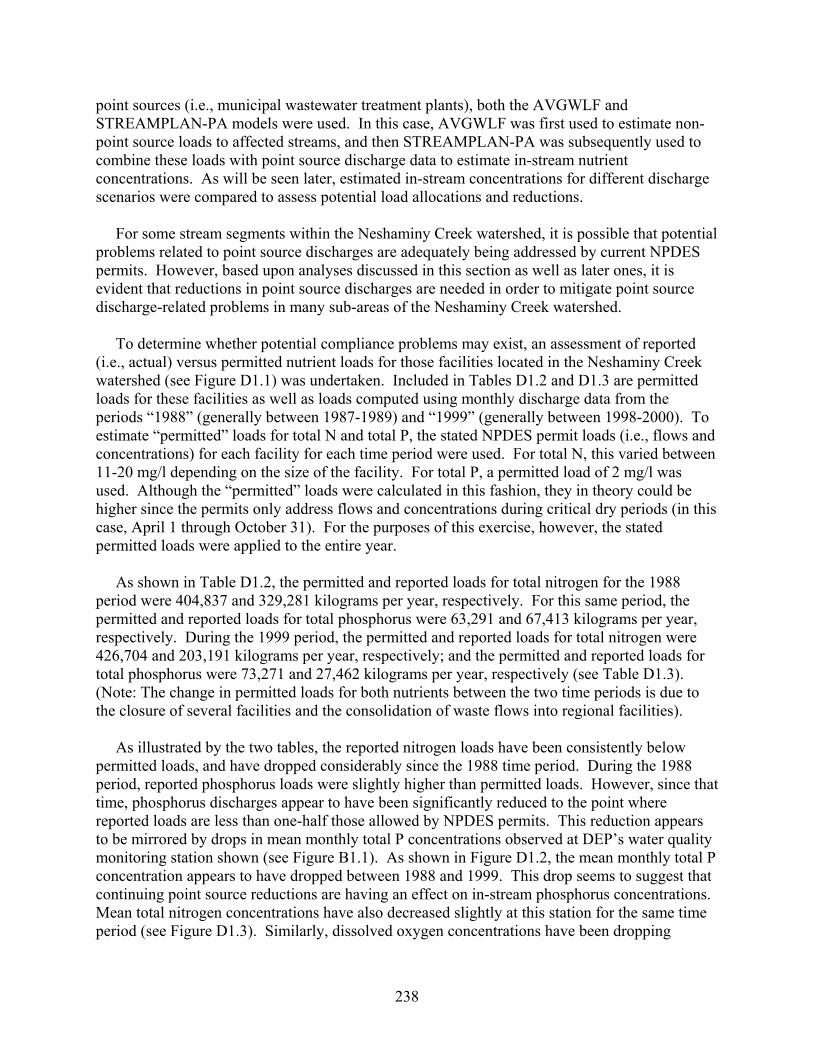
point sources (i.e., municipal wastewater treatment plants), both the AVGWLF and STREAMPLAN-PA models were used. In this case, AVGWLF was first used to estimate non-point source loads to affected streams, and then STREAMPLAN-PA was subsequently used to combine these loads with point source discharge data to estimate in-stream nutrient concentrations. As will be seen later, estimated in-stream concentrations for different discharge scenarios were compared to assess potential load allocations and reductions. For some stream segments within the Neshaminy Creek watershed, it is possible that potential problems related to point source discharges are adequately being addressed by current NPDES permits. However, based upon analyses discussed in this section as well as later ones, it is evident that reductions in point source discharges are needed in order to mitigate point source discharge-related problems in many sub-areas of the Neshaminy Creek watershed. To determine whether potential compliance problems may exist, an assessment of reported (i.e., actual) versus permitted nutrient loads for those facilities located in the Neshaminy Creek watershed (see Figure D1.1) was undertaken. Included in Tables D1.2 and D1.3 are permitted loads for these facilities as well as loads computed using monthly discharge data from the periods “1988” (generally between 1987-1989) and “1999” (generally between 1998-2000). To estimate “permitted” loads for total N and total P, the stated NPDES permit loads (i.e., flows and concentrations) for each facility for each time period were used. For total N, this varied between 11-20 mg/l depending on the size of the facility. For total P, a permitted load of 2 mg/l was used. Although the “permitted” loads were calculated in this fashion, they in theory could be higher since the permits only address flows and concentrations during critical dry periods (in this case, April 1 through October 31). For the purposes of this exercise, however, the stated permitted loads were applied to the entire year. As shown in Table D1.2, the permitted and reported loads for total nitrogen for the 1988 period were 404,837 and 329,281 kilograms per year, respectively. For this same period, the permitted and reported loads for total phosphorus were 63,291 and 67,413 kilograms per year, respectively. During the 1999 period, the permitted and reported loads for total nitrogen were 426,704 and 203,191 kilograms per year, respectively; and the permitted and reported loads for total phosphorus were 73,271 and 27,462 kilograms per year, respectively (see Table D1.3). (Note: The change in permitted loads for both nutrients between the two time periods is due to the closure of several facilities and the consolidation of waste flows into regional facilities). As illustrated by the two tables, the reported nitrogen loads have been consistently below permitted loads, and have dropped considerably since the 1988 time period. During the 1988 period, reported phosphorus loads were slightly higher than permitted loads. However, since that time, phosphorus discharges appear to have been significantly reduced to the point where reported loads are less than one-half those allowed by NPDES permits. This reduction appears to be mirrored by drops in mean monthly total P concentrations observed at DEP’s water quality monitoring station shown (see Figure B1.1). As shown in Figure D1.2, the mean monthly total P concentration appears to have dropped between 1988 and 1999. This drop seems to suggest that continuing point source reductions are having an effect on in-stream phosphorus concentrations. Mean total nitrogen concentrations have also decreased slightly at this station for the same time period (see Figure D1.3). Similarly, dissolved oxygen concentrations have been dropping
238

slightly as well (see Figure D1.4), which is not a positive trend if it continues too long into the future. However, even with this drop, recorded concentrations are still consistently above 8.0 mg/l, which suggests relatively good oxygen levels in general.
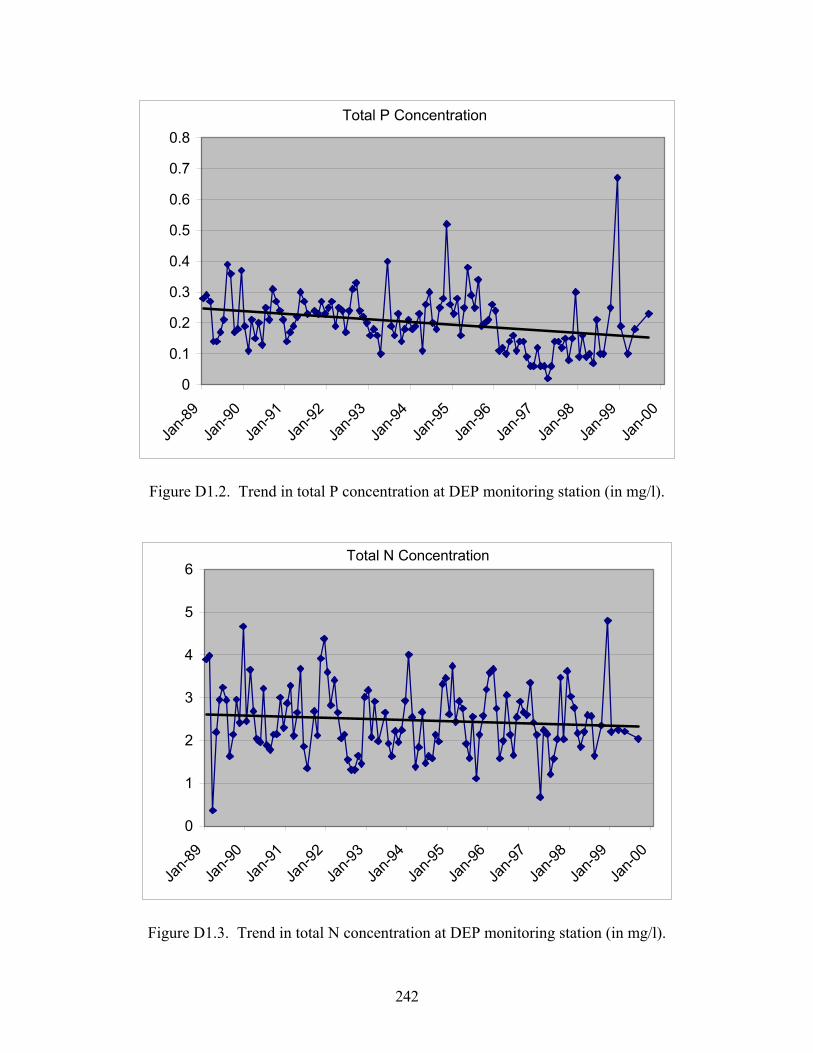
Additionally, a review of recent monthly discharge reports compiled by PaDEP was completed to determine if permitted facilities were in compliance with effluent limitations stated in their respective NPDES permits. More specifically, an evaluation of all facilities within the Neshaminy Creek watershed was made to determine if any facility had exceeded effluent limitations for various pollutant parameters, including ammonia (NH3-N), nitrite plus nitrate (NO2-N + NO3-N), phosphate phosphorus (PHOS-P), and dissolved oxygen (DO) during the time period reviewed (i.e., 1998-2000). The results of this review are provided in Table D1.4.
In this table, the values recorded indicate the number of times the permitted limit for a given parameter was exceeded based on monthly observations. During this period, effluent limitations collectively were exceeded 67 times for the four pollutant parameters evaluated. While at first glance this number seems high, this number is actually relatively low given the potential number of times these limits could have been exceeded. For example, given the number of facilities, number of parameters, and the time period reviewed (1998-2000), the number of potential observations is approximately 7,488 ((26 facilities x 12 months x 3 years x 4 parameters x 2 exceedance types (i.e., concentration and loading)). Under this scenario, effluent limitations for the stated parameters were collectively exceeded less than 1 % of the time (67/3744 = 0.0089). (Note: This percentage is likely somewhat higher since concentrations for two of the parameters [i.e, NO2-N + NO3-N and P] are only reported for “critical periods”, and hence are not reported for all 12 months of the year). Given the fact that permit infractions seem to be minimal, and therefore excessive nutrient loads due to permit exceedances are not a problem, it does appear that discharge levels under current point source permits are not sufficiently low to produce acceptable water quality conditions in many areas of the Neshaminy Creek watershed.
239

Table D1.2. Estimated point source discharges for the period 1988.
240

Table D1.3. Estimated point source discharges for the period 1999.
241
Total P Concentration
0
0.1
0.2
0.3
0.4
0.5
0.6
0.7
0.8
Jan-8
9
Jan-9
0
Jan-9
1
Jan-9
2
Jan-9
3
Jan-9
4
Jan-9
5
Jan-9
6
Jan-9
7
Jan-9
8
Jan-9
9
Jan-0
0
Figure D1.2. Trend in total P concentration at DEP monitoring station (in mg/l).
Total N Concentration
0
1
2
3
4
5
6
Jan-8
9
Jan-9
0
Jan-9
1
Jan-9
2
Jan-9
3
Jan-9
4
Jan-9
5
Jan-9
6
Jan-9
7
Jan-9
8
Jan-9
9
Jan-0
0
Figure D1.3. Trend in total N concentration at DEP monitoring station (in mg/l).
242

Dissolved Oxygen
0
5
10
15
20
Jan-8
8
Jan-8
9
Jan-9
0
Jan-9
1
Jan-9
2
Jan-9
3
Jan-9
4
Jan-9
5
Jan-9
6
Jan-9
7
Jan-9
8
Jan-9
9
Figure D1.4. Trend in DO concentration at DEP monitoring station (in mg/l).
243
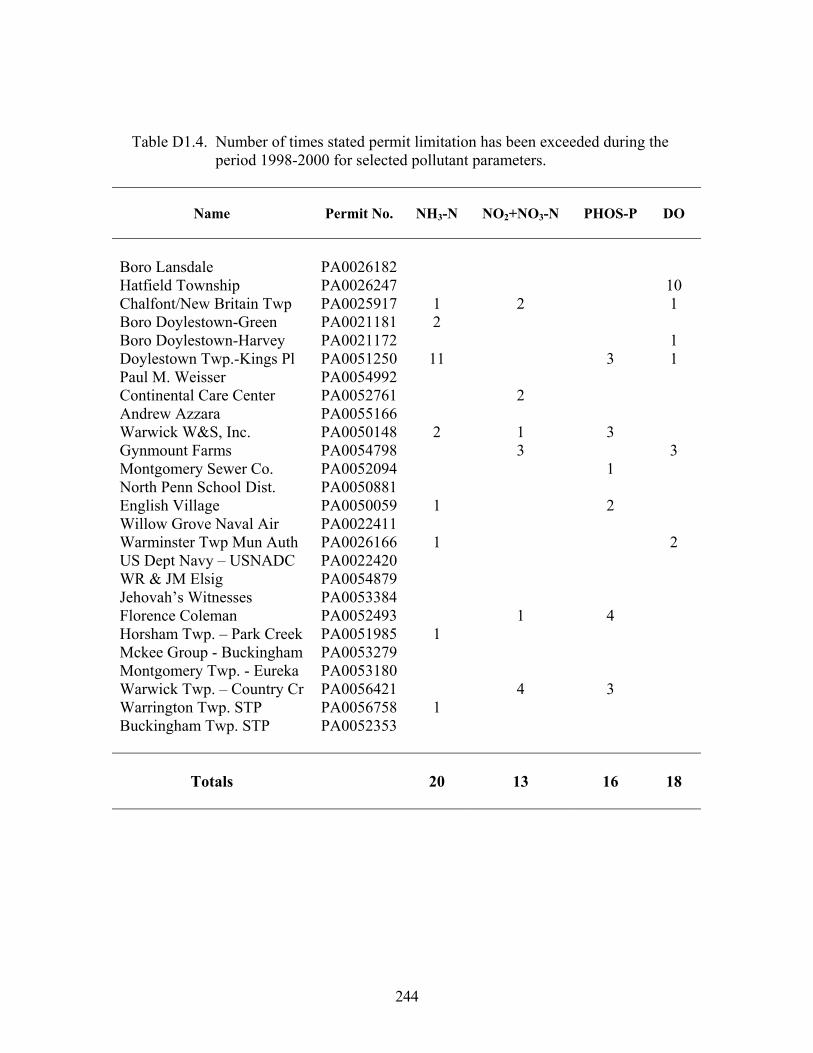
Table D1.4. Number of times stated permit limitation has been exceeded during the period 1998-2000 for selected pollutant parameters.
Permit No.
Name
NH3-N NO2+NO3-N
PHOS-P DO
Boro Lansdale Hatfield Township Chalfont/New Britain Twp
Montgomery Sewer Co.
Montgomery Twp. - Eureka Warwick Twp. – Country Cr Warrington Twp. STP
PA0021181 PA0021172
PA0052761
PA0050148
PA0050059
3
1
3
Boro Doylestown-Green Boro Doylestown-Harvey Doylestown Twp.-Kings Pl Paul M. Weisser Continental Care Center Andrew Azzara Warwick W&S, Inc. Gynmount Farms
North Penn School Dist. English Village Willow Grove Naval Air Warminster Twp Mun Auth US Dept Navy – USNADC WR & JM Elsig Jehovah’s Witnesses Florence Coleman Horsham Twp. – Park Creek Mckee Group - Buckingham
Buckingham Twp. STP
PA0026182 PA0026247 PA0025917
PA0051250 PA0054992
PA0055166
PA0054798 PA0052094 PA0050881
PA0022411 PA0026166 PA0022420 PA0054879 PA0053384 PA0052493 PA0051985 PA0053279 PA0053180 PA0056421 PA0056758 PA0052353
1 2
11 2 1 1 1 1
2 2 1
1 4
3 3
1 2 4
3
10 1 1
2
Totals
20 13
16
18
244

D2.0 APPROACH TO NUTRIENT TMDL FOR POINT SOURCES Point source dischargers in the Neshaminy Creek watershed are currently permitted to discharge 2 mg/L TP with a few exceptions. Most of the dischargers are doing much better than the 2 mg/L permit limit, but nutrient impairments remain in many tributaries and on the main stem of Neshaminy Creek. This TMDL is designed to remove impairments in these waters and meet water quality standards. Pennsylvania’s criterion for nutrients is included in 25 Pa. Code § 93.6, general water quality criteria, as a narrative. There is currently no numeric criterion for phosphorus in the water quality standards. The narrative criterion must be interpreted in order to define the water quality for nutrients - in this case, phosphorus - that will demonstrate the TMDL will address the stream impairment. The impact of phosphorus on the watershed is nuisance algae growth. In this watershed, the impairment is attributable to point source discharges, and the critical period occurs under extreme low flows. Therefore, the phosphorus target of the TMDL must be addressed as an instantaneous or daily maximum value. The determination of target phosphorus in-stream concentrations for the purpose of establishing a TMDL for algae control is difficult. Literature values are of limited value because the cited values are often given as monthly or annual mean values, which are not translatable into maximum values. In addition, significant ecological differences in various areas of the country preclude broad applicability of transferred data. Pennsylvania is developing numeric criteria for nutrients. Although significant amounts of data have been compiled, criteria development methods must be determined and refined, and the criteria for the several ecoregions in Pennsylvania are not expected until at least 2007. Therefore, to address the impairment in the Neshaminy watershed, the Department used Best Professional Judgment to limit the amount of phosphorus input to the stream by reducing permitted concentrations of phosphorus from dischargers. As explained in various sections of this document, a stream water quality model was used to predict in-stream phosphorus concentrations under various reduction scenarios. A TMDL is normally expressed as a load over time; however, it is the in-stream phosphorus concentration under critical, low-flow conditions that must be reduced to remove the nutrient impairments in the Neshaminy Creek watershed. Therefore, water quality improvements will be evaluated through comparison of water column phosphorus concentrations at the critical condition. Several iterations of model runs were made until in-stream levels of phosphorus were reduced at all points. In achieving reductions at the most difficult points in the watershed, significant reductions in phosphorus levels were shown at all other sites in the watershed. The Department believes that these reductions will remove the impairments to Neshaminy Creek and its tributaries, and allow the waters to meet water quality standards. To confirm that prescribed phosphorus reductions correct the impairment, stream conditions will be evaluated following implementation of this TMDL. If the watershed is found to continue
245

to have nuisance algae problems, the TMDL will have to be reassessed and additional nutrient controls will be considered. In that case, it is likely that the significant sources will have to further reduce the amount of phosphorus discharged. The first step taken in the modeling analysis in Neshaminy Creek was to model existing phosphorus concentrations under 7Q10 flow conditions where point source flows comprise almost the entire flow of the stream. This run was necessary to develop a baseline for the impaired condition upon which subsequent reduction scenario runs could be compared to gauge improvement. Once the baseline conditions were established, phosphorus inputs from dischargers were reduced until in-stream phosphorus concentrations were reduced below existing concentrations at all points in the watershed. More details on this modeling effort are provided in the following section. D3.0 STREAM REACH/SUBAREA ASSESSMENTS D3.1 Modeling Overview As shown earlier in Table D1.1, twelve (12) stream segments (reaches) spanning six (6) streams have been included on DEP’s current 303(d) list as being impaired by municipal point source discharges in one way or another. These stream segments were depicted graphically in Figure D1.1. As discussed previously in Section C, some of these same segments were also determined to be impaired by nutrients from other sources such as urban and agricultural runoff. These impairments were treated as “sediment-related”, and addressed separately in that section. For modeling purposes, the impaired segments shown in Figure D1.1 were organized into eleven sub-basins as shown in Figure D3.1. This was done primarily for the purpose of more precisely estimating non-point source nutrient loads using AVGWLF within each sub-basin. Within each sub-basin, and cascading through the entire stream network, nutrient loads and concentrations computed for each upstream reach with STREAMPLAN-PA were passed as input to succeeding downstream reaches. As can be seen in Figure D3.1, these sub-basins have been identified as Sub-basins 1 through 11, with the numbers increasing relative to the sub-basin’s downstream location. To further facilitate the modeling process, the eleven sub-basins shown in Figure D3.1 were aggregated into four larger sub-basins, and simulated phosphorus concentrations were evaluated at the outlet of each larger sub-basin as also shown in Figure D3.1. Table D3.2 shows the sub-basins that correspond to each of the outlet locations shown in Figure D3.1. Table D3.3 shows how the segments impaired by municipal point sources given previously in Table D1.1 correspond to the sub-basins outlets in the watershed (note that smaller sub-basins can be “nested” within larger sub-basins). Finally, Table D3.4 shows sub-basins in which the municipal point sources listed previously in Table D1.4 are located. In addition to using a different simulation model, there is another major difference between what was done for the following TMDL assessments when compared to what was done for the TMDL assessments described in Section C where unit area loads based on AVGWLF output were used to calculate required load reductions. For assessments discussed in this section,
246

STREAMPLAN-PA was used to estimate in-stream nutrient concentrations (specifically phosphorus), and these estimates were subsequently compared with in-stream phosphorus concentrations under different discharge regimes to evaluate potential load reductions. Phosphorus concentration was targeted in this case, because as discussed below, phosphorus was determined to be the limiting nutrient in each sub-basin based on estimated nutrient loads. As discussed previously in Section B1.5, excess amounts of a limiting nutrient can lead to problems with increased organic enrichment (i.e., high plant productivity) and low dissolved oxygen levels. Based on the use of the calibrated AVGWLF/STREAMPLAN-PA modeling approach (see related discussion in Section B), mean annual nutrient loads were calculated for each of the sub-basins depicted in Figure D3.1 as shown in Table D3.5. Since N/P ratios for essentially all sub-basins were much higher than 10, phosphorus was determined to be the limiting nutrient.
Figure D3.1. Map depicting location of sub-basins and outlets used within STREAMPLAN- PA, with municipal point source discharges shown in blue and point source- impaired stream segments shown in red.
247
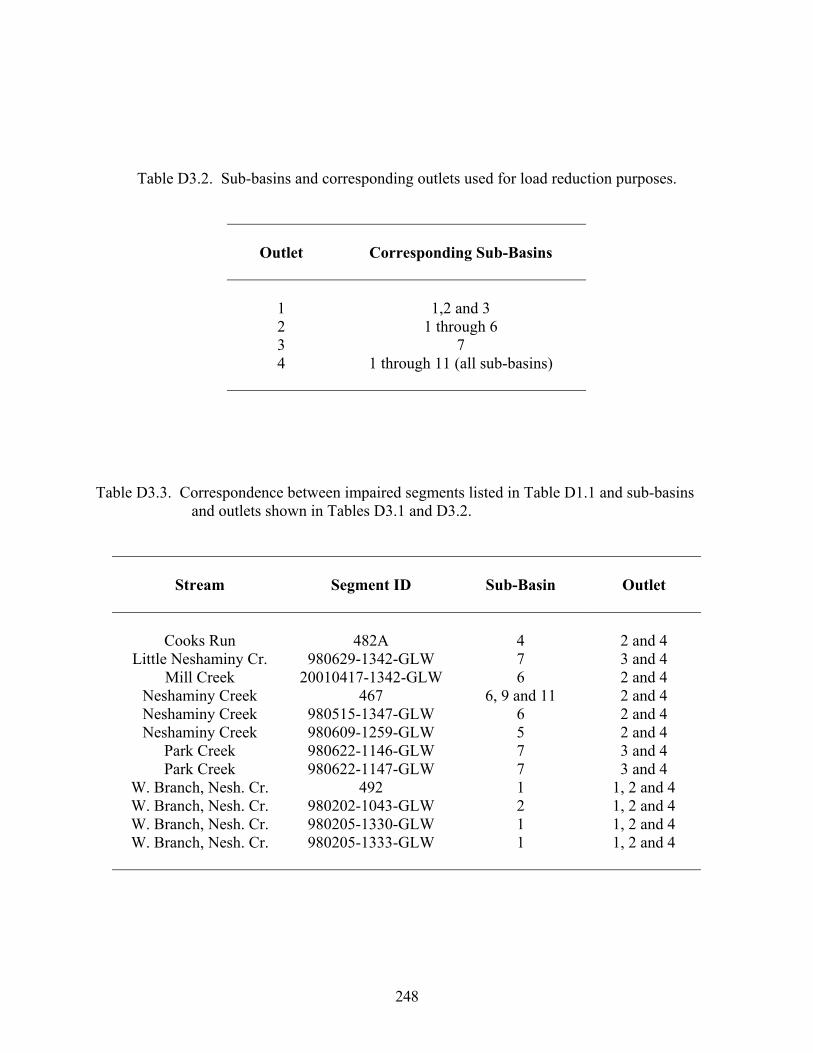
Table D3.2. Sub-basins and corresponding outlets used for load reduction purposes.
Outlet
Corresponding Sub-Basins
1 2 3 4
1,2 and 3
1 through 6 7
1 through 11 (all sub-basins)
Table D3.3. Correspondence between impaired segments listed in Table D1.1 and sub-basins
Stream
Outlet
and outlets shown in Tables D3.1 and D3.2.
Segment ID Sub-Basin
Cooks Run
Mill Creek
Neshaminy Creek
W. Branch, Nesh. Cr.
W. Branch, Nesh. Cr.
980515-1347-GLW 980609-1259-GLW 980622-1146-GLW 980622-1147-GLW
492 980202-1043-GLW 980205-1330-GLW 980205-1333-GLW
5
1 2 1 1
3 and 4 2 and 4
2 and 4 2 and 4
3 and 4 1, 2 and 4
1, 2 and 4 1, 2 and 4
Little Neshaminy Cr.
Neshaminy Creek
Neshaminy Creek Park Creek Park Creek
W. Branch, Nesh. Cr.
W. Branch, Nesh. Cr.
482A 980629-1342-GLW
20010417-1342-GLW 467
4 7 6
6, 9 and 11 6
7 7
2 and 4
2 and 4
3 and 4
1, 2 and 4
248
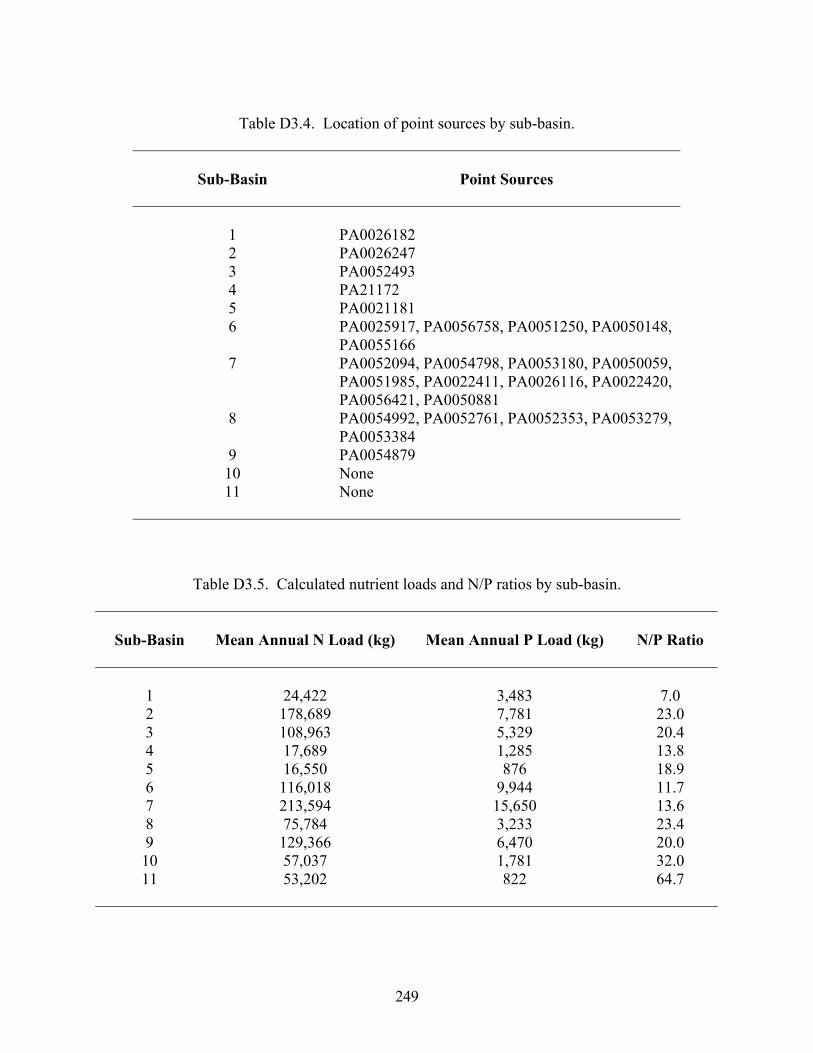
Table D3.4. Location of point sources by sub-basin.
Sub-Basin
Point Sources
1 2 3
PA21172
PA0025917, PA0056758, PA0051250, PA0050148,
PA0054992, PA0052761, PA0052353, PA0053279,
4 5 6 7 8 9 10 11
PA0026182 PA0026247 PA0052493
PA0021181
PA0055166 PA0052094, PA0054798, PA0053180, PA0050059, PA0051985, PA0022411, PA0026116, PA0022420, PA0056421, PA0050881
PA0053384 PA0054879 None None
Sub-Basin
Table D3.5. Calculated nutrient loads and N/P ratios by sub-basin.
Mean Annual N Load (kg)
Mean Annual P Load (kg) N/P Ratio
1
6
24,422
108,963
53,202
3,483 7,781
1,781
11.7
2 3 4 5
7 8 9 10 11
178,689
17,689 16,550 116,018 213,594 75,784 129,366 57,037
5,329 1,285 876
9,944 15,650 3,233 6,470
822
7.0 23.0 20.4 13.8 18.9
13.6 23.4 20.0 32.0 64.7
249

D3.2 Consideration of Low Flow Conditions
During low flow conditions (typically between May and October of any given year), the effluent discharged from wastewater treatment plants in the Neshaminy Creek watershed often comprises over 90% of the total stream flow in many stream reaches. In a point source-dominated stream system, such periods are considered to be the most critical in terms of potential water quality impacts (Thomann and Mueller, 1987). Given this, it was determined that the point source load analysis should be performed using low-flow conditions.
A standard flow often used for in-stream, low-flow analysis is the 7Q10 flow, which is defined as the minimum stream flow that occurs over 7 consecutive days and has a 10-year recurrence interval (i.e., a 7Q10 event would be expected to occur once every 10 years). Based on historic flow records, a representative critical low-flow period (i.e., 7Q10 flow) for Neshaminy Creek (at the WQN station shown in Figure B1.1) was determined to occur during August 1995. During this period, the flow averaged 28.99 cfs, and point source effluent constituted about 77% of the total stream flow. The remainder was comprised of releases from surface water impoundments in the watershed (about 22%), and relatively minute flows from groundwater sources and septic systems (about 1%). In simulating in-stream phosphorus concentrations during low-flow conditions, the “Average” flows (i.e., discharge volumes) for point sources shown in Table D3.6 were used except in cases where data on “low-flow” discharges were provided by wastewater treatment plants. The “low-flow” data used in these exceptions include 1.38 mgd for PA0026182, 0.312 mgd for PA0021181, 0.48 mgd for PA0021172, 0.33 mgd for PA0050148, and 0.32 mgd for PA0051985.
D3.3 Estimation of Required Phosphorus Load Reductions
Figure B1.1 shows that portion of the watershed used in the calibration process (shaded) and the location of the WQN sampling station for which historical nutrient concentration and flow data were obtained in order to compute observed loads. Also shown in this figure are the locations of the point sources that discharge nutrients to surface waters in the watershed. During the calibration step, AVGWLF was first used to estimate non-point source loads within each of the sub-basins depicted in Figure B1.1, and STREAMPLAN-PA was then used to combine these loads with point source discharge data to estimate in-stream nutrient concentrations. To better reflect localized conditions, groundwater sampling data available from DEP were used to verify (and adjust if necessary) groundwater nitrogen and phosphorus concentrations within each sub-basin.
As described in Section B1.4, the models used for this analysis (AVGWLF and STREAMPLAN-PA) were calibrated for this watershed using available water quality sample data for the period 4/93 to 3/99. To adequately represent point source discharges in the watershed during this period, data obtained from DEP monthly discharge monitoring reports (ca. 1999) were used. In the calibration process, various model parameters were “fine-tuned” to more accurately depict critical model parameters. In particular, available groundwater quality sample data were used to verify (and adjust if necessary) GWLF parameter values relating to sub-surface concentrations of nitrogen and phosphorus (GWN and GWP, respectively) in various sub-areas of the watershed.
250

Table D3.6. Point source effluent flows and phosphorus concentrations as determined from DEP monthly discharge data and/or municipal treatment plants.
Facility Name
Permit No.
Average
Flow (MGD)4
Flow
Average
(mg/l)
P Conc.
(lbs/day)
Permitted
(MGD)
P Conc.
Permitted
(mg/l)
TMDL P Conc. (mg/l)5
TMDL WLA
6
Boro Lansdale Hatfield Township
Boro Doylestown-Green
Doylestown Twp.-Kings Pla
Continental Care Center
Warwick W&S, Inc. Gynmount Farms
North Penn School District English Village Willow Grove Naval Air Warminster Twp Mun Aut
1
WR & JM Elsig
Florence Coleman
Montgomery Twp. - Eureka Warwick Twp. – Cntry Crs. Warrington Twp. STP Buckingham Twp. STP
PA0026182 PA0026247 PA0025917 PA0021181 PA0021172 PA0051250 PA0054992 PA0052761 PA0055166 PA0050148 PA0054798 PA0052094 PA0050881 PA0050059 PA0022411 PA0026166 PA0022420 PA0054879 PA0053384 PA0052493 PA0051985 PA0053279 PA0053180 PA0056421 PA0056758 PA0052353
2.40 2.98 3.14 0.54 0.63 0.29 0.00 0.01 0.00 0.48 0.02 0.08 0.00 0.13 0.19 4.56 0.00 0.00 0.00
0.51 0.06 0.43 0.03 0.09 0.16
2.60 6.43
1.20 0.90 0.43 0.00 0.01 0.00 0.85 0.02 0.15 0.01 0.12 1.00 8.18 1.20 0.00 0.01 0.00 1.00 0.10 2.40 0.32 0.33 0.24
1.02 1.19 1.34 0.83 1.07 1.38 1.00 0.94 1.00 1.28 1.04 1.11 0.84 2.41 1.89 1.26 0.00 1.00 1.00
0.81 1.68 0.49 1.33 0.95 1.00
2.00
2.00 1.20 2.00
NA2 2.00
2.00
2.00
2.00 2.00 NA2
2 2.00 2.00 2.00 0.65 0.75 2.00 0.003
0.8 0.8 0.8 0.8 0.8 0.8
NA2 0.8
NA2 0.8
0.8 0.8 0.8 0.8
0.8 NA2 NA2 0.8 0.8 0.8
0.65 0.75 0.8 0.8
42.90 26.69 8.01 6.00
NA2
0.09 NA2
5.67 0.16 1.00 0.04
6.67 54.58 8.01 NA2
NA2
0.02
0.67 13.01 2.00
1.57
Chalfont/New Britain Twp
Boro Doylestown-Harvey
Paul M. Weisser
Andrew Azzara
Montgomery Sewer Co.
US Dept Navy – USNADC
Jehovah’s Witnesses
Horsham Twp. – Park Creek Mckee Group - Buckingham
0.00
4.00
1.64
2.00
2.00
NA2 2.00
2.00
2.00 2.00
NA
0.8
0.8
17.35
2.84
0.80
6.67
2.20
1This facility is currently not operational, but is planned to be back in service in the next few years under new ownership.
NA means “Not Applicable” (i.e, no P limit exists in permit)2
During low-flow periods (May-October) effluent from this facility is spray-irrigated 3
Average discharges obtained from DEP records or from municipal treatment plants 4
Assumes treatment plant discharges (flows) increase beyond current (i.e., “Average” levels) 5
Permitted flow (MGD) x TMDL P concentration (mg/l) x conversion factor of 8.34 6
After model calibration, the weather data set for August 1995 was used to represent critical, low-flow conditions in the watersheds. First, the in-stream phosphorus conditions were simulated using discharge data reported by the wastewater treatment plants operating in the watershed to DEP (i.e, as shown in Table D3.6 or as given for the “low-flow” exceptions noted above). The model was then iteratively run using different discharge flows and phosphorus
251
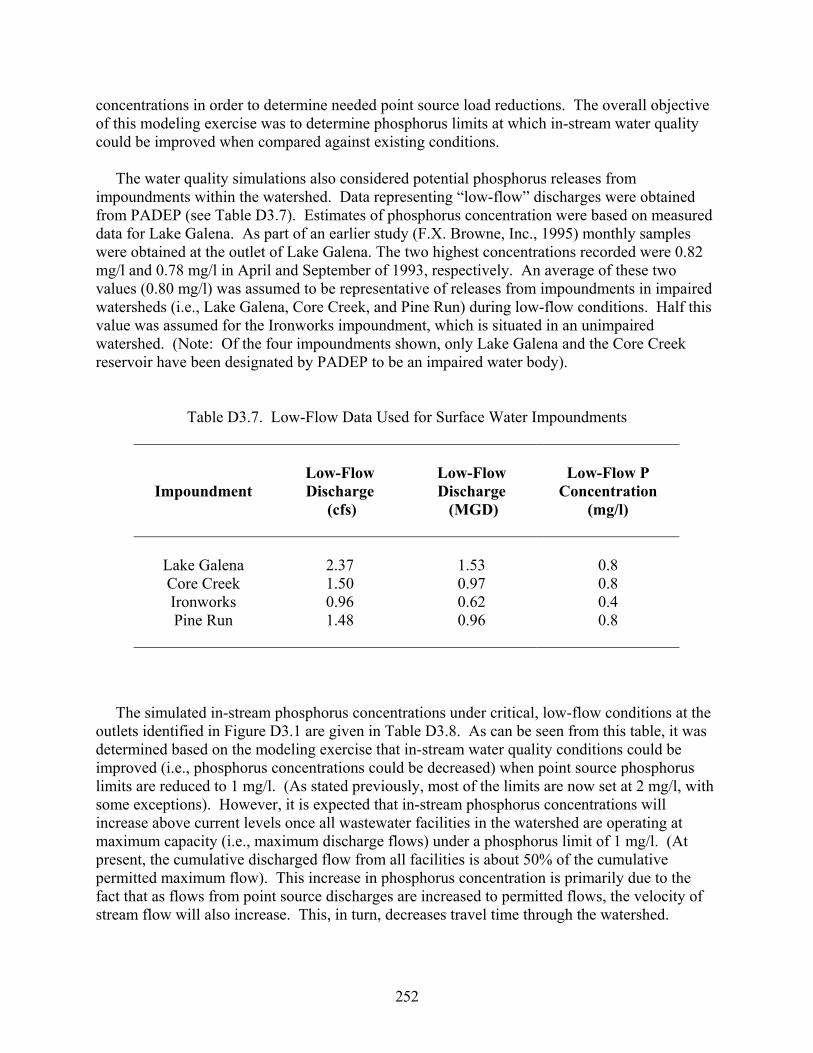
concentrations in order to determine needed point source load reductions. The overall objective of this modeling exercise was to determine phosphorus limits at which in-stream water quality could be improved when compared against existing conditions. The water quality simulations also considered potential phosphorus releases from impoundments within the watershed. Data representing “low-flow” discharges were obtained from PADEP (see Table D3.7). Estimates of phosphorus concentration were based on measured data for Lake Galena. As part of an earlier study (F.X. Browne, Inc., 1995) monthly samples were obtained at the outlet of Lake Galena. The two highest concentrations recorded were 0.82 mg/l and 0.78 mg/l in April and September of 1993, respectively. An average of these two values (0.80 mg/l) was assumed to be representative of releases from impoundments in impaired watersheds (i.e., Lake Galena, Core Creek, and Pine Run) during low-flow conditions. Half this value was assumed for the Ironworks impoundment, which is situated in an unimpaired watershed. (Note: Of the four impoundments shown, only Lake Galena and the Core Creek reservoir have been designated by PADEP to be an impaired water body).
Table D3.7. Low-Flow Data Used for Surface Water Impoundments
Low-Flow Discharge
Low-Flow P
Impoundment Low-Flow Discharge
(cfs) (MGD)
Concentration (mg/l)
Lake Galena Core Creek Ironworks
2.37 1.50 0.96 1.48
1.53
0.62 0.96
0.8 0.8 0.4 0.8
Pine Run
0.97
The simulated in-stream phosphorus concentrations under critical, low-flow conditions at the outlets identified in Figure D3.1 are given in Table D3.8. As can be seen from this table, it was determined based on the modeling exercise that in-stream water quality conditions could be improved (i.e., phosphorus concentrations could be decreased) when point source phosphorus limits are reduced to 1 mg/l. (As stated previously, most of the limits are now set at 2 mg/l, with some exceptions). However, it is expected that in-stream phosphorus concentrations will increase above current levels once all wastewater facilities in the watershed are operating at maximum capacity (i.e., maximum discharge flows) under a phosphorus limit of 1 mg/l. (At present, the cumulative discharged flow from all facilities is about 50% of the cumulative permitted maximum flow). This increase in phosphorus concentration is primarily due to the fact that as flows from point source discharges are increased to permitted flows, the velocity of stream flow will also increase. This, in turn, decreases travel time through the watershed.
252
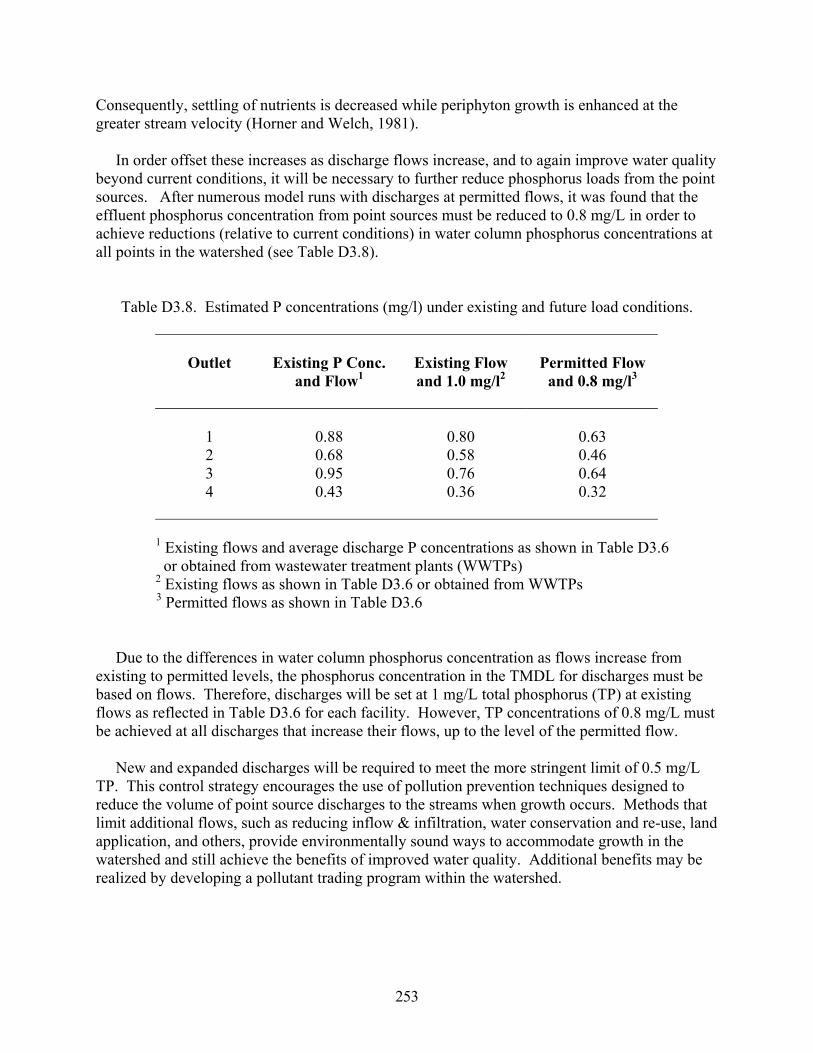
Consequently, settling of nutrients is decreased while periphyton growth is enhanced at the greater stream velocity (Horner and Welch, 1981). In order offset these increases as discharge flows increase, and to again improve water quality beyond current conditions, it will be necessary to further reduce phosphorus loads from the point sources. After numerous model runs with discharges at permitted flows, it was found that the effluent phosphorus concentration from point sources must be reduced to 0.8 mg/L in order to achieve reductions (relative to current conditions) in water column phosphorus concentrations at all points in the watershed (see Table D3.8).
Table D3.8. Estimated P concentrations (mg/l) under existing and future load conditions.
Outlet
Existing P Conc.
and Flow1
Existing Flow and 1.0 mg/l2
Permitted Flow and 0.8 mg/l3
1 2 3 4
0.88 0.68 0.95 0.43
0.80 0.58 0.76 0.36
0.63 0.46 0.64 0.32
1 Existing flows and average discharge P concentrations as shown in Table D3.6 or obtained from wastewater treatment plants (WWTPs) 2 Existing flows as shown in Table D3.6 or obtained from WWTPs 3 Permitted flows as shown in Table D3.6 Due to the differences in water column phosphorus concentration as flows increase from existing to permitted levels, the phosphorus concentration in the TMDL for discharges must be based on flows. Therefore, discharges will be set at 1 mg/L total phosphorus (TP) at existing flows as reflected in Table D3.6 for each facility. However, TP concentrations of 0.8 mg/L must be achieved at all discharges that increase their flows, up to the level of the permitted flow. New and expanded discharges will be required to meet the more stringent limit of 0.5 mg/L TP. This control strategy encourages the use of pollution prevention techniques designed to reduce the volume of point source discharges to the streams when growth occurs. Methods that limit additional flows, such as reducing inflow & infiltration, water conservation and re-use, land application, and others, provide environmentally sound ways to accommodate growth in the watershed and still achieve the benefits of improved water quality. Additional benefits may be realized by developing a pollutant trading program within the watershed.
253

D3.4 Additional Expected Phosphorus Reductions from Non-Point Source Loads As discussed in Section C, a number of sediment-related TMDLs have been developed for various sub-basins of the Neshaminy Creek watershed. Since phosphorus that enters a stream is often attached to sediment eroded from upland areas and stream banks, it is expected that phosphorus loads from non-point sources will also be realized on a mean annual basis due to BMPs implemented to reduce sediment loss in these sub-basins. Table D3.9 shows current and expected sediment loads based on the TMDL targets described in Section C. Based on available data, it is estimated that the soils in Neshaminy Creek watershed on average have a soil phosphorus (total P) content of about 400 mg/kg. This translates into an approximate soil P concentration of about 0.04%. Given a typical sediment enrichment ratio of 2.0 (i.e., there is usually about twice as much P associated with “transported” P as compared to “in situ” P), this concentration is actually closer to 0.08% Using this value, the amount of phosphorus reduced in each of the sub-basins has been calculated as shown in Table D3.9. Given that the mean annual phosphorus load for the watershed is about 136,400 lbs/year, this represents an additional reduction of about 7%.
Projected
(lbs/year)
Reduced Sediment Load
P Load
Table D3.9. Estimated non-point source load reductions by sub-basin.
Sub-Basin
Existing
Sediment Load(lbs/year)
Sediment Load
(lbs/year)
Associated
(lbs/year)
Little Neshaminy Creek
Lake Galena* Pine Run
West Branch Neshaminy #1 West Branch Neshaminy #2 West Branch Neshaminy #3 West Branch Neshaminy #4
Neshaminy Tributary #1 Neshaminy Tributary #2 Neshaminy Tributary #3
Mill Creek Core Creek
Neshaminy Creek South #1 Neshaminy Creek South #3
8,369,480
4,089,628154,296682,119930,419
9,859,400721,215165,561
1,054,7462,181,460
62,382
445,778
678,944
1,543
391
1,775,9813,073,4001,414,300
7,708,168
2,160,265143,267328,848496,654
5,998,845232,830
292,6671,735,6821,474,7232,394,456
999,759
661,312
1,929,360 11,029
353,271 433,765
3,860,555 488,385 103,179 762,079
301,258
414,541
529907
9283347
3,088
83610357241543332
TOTAL
34,528,302 24,028,546
10,443,456 9,263
* Phosphorus reduction was computed directly as part of TMDL
254

D3.5 Additional Discussion on Impairments from Municipal Point Sources D3.5.1 Main Stem of Neshaminy Creek (467) This segment is the single longest listed impaired reach in the entire Neshaminy Creek watershed (36.5 miles), and was added to the 303(d) list in 1996 (see Figure D3.2). With respect to municipal sources, this stream segment was listed as being impaired by nutrients, organic enrichment/DO, and pH. Since this segment represents the main stem of Neshaminy Creek, and because all of the tributaries within the entire watershed flow into it at some point, it is difficult to isolate specific municipal point sources as being the principal sources of impairment. Rather, it is more correct to say that whatever impairments exist due to such point sources probably result from the cumulative effects of all of them within the entire watershed.
Figure D3.2. Impaired portion of the Neshaminy Creek main stem.
As discussed in Section B1.5, there is a very direct relationship between nutrients, organic enrichment, and dissolved oxygen level. Over time, it is expected that problems with excessive plant growth (organic enrichment) and low dissolved oxygen levels will decrease as smaller loads of the limiting nutrient (in this case, phosphorus) are introduced into Neshaminy Creek and its tributaries. In fact, as discussed in an earlier section, lower observed concentrations of phosphorus at the WQN monitoring station (see Figure B1.1) appear to mirror reported drops in phosphorus loads discharged by municipal sources in the watershed since the mid-1990s. Again,
255
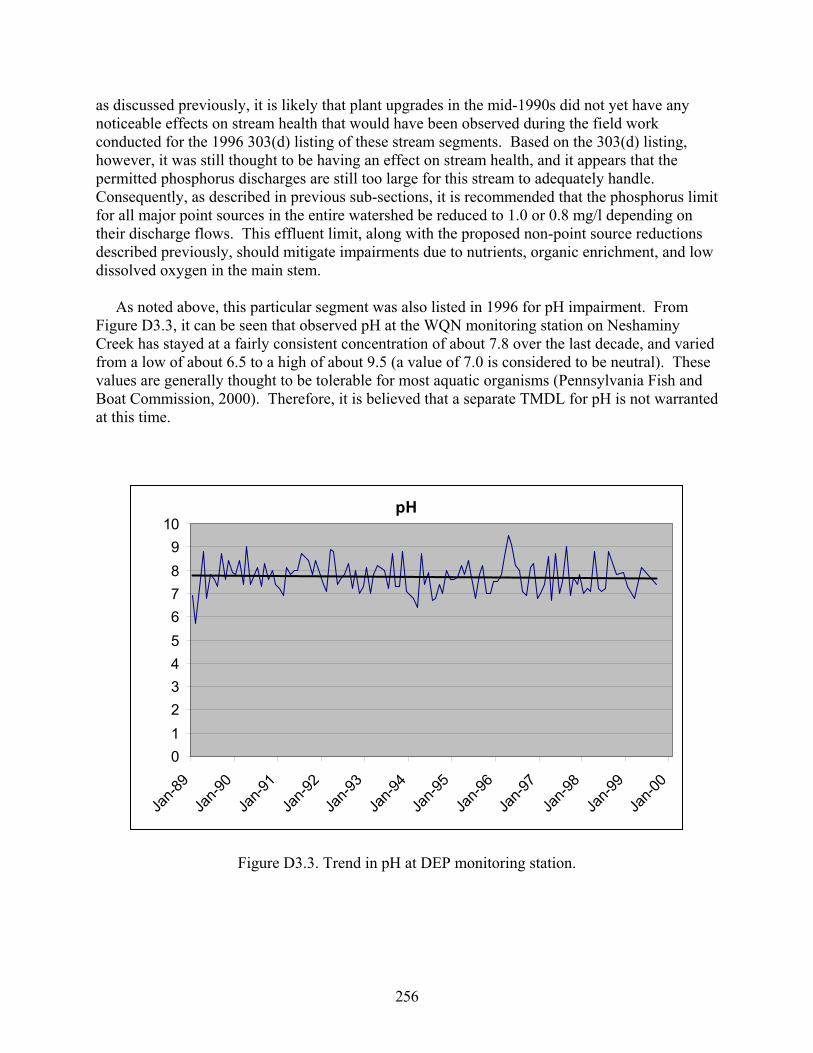
as discussed previously, it is likely that plant upgrades in the mid-1990s did not yet have any noticeable effects on stream health that would have been observed during the field work conducted for the 1996 303(d) listing of these stream segments. Based on the 303(d) listing, however, it was still thought to be having an effect on stream health, and it appears that the permitted phosphorus discharges are still too large for this stream to adequately handle. Consequently, as described in previous sub-sections, it is recommended that the phosphorus limit for all major point sources in the entire watershed be reduced to 1.0 or 0.8 mg/l depending on their discharge flows. This effluent limit, along with the proposed non-point source reductions described previously, should mitigate impairments due to nutrients, organic enrichment, and low dissolved oxygen in the main stem. As noted above, this particular segment was also listed in 1996 for pH impairment. From Figure D3.3, it can be seen that observed pH at the WQN monitoring station on Neshaminy Creek has stayed at a fairly consistent concentration of about 7.8 over the last decade, and varied from a low of about 6.5 to a high of about 9.5 (a value of 7.0 is considered to be neutral). These values are generally thought to be tolerable for most aquatic organisms (Pennsylvania Fish and Boat Commission, 2000). Therefore, it is believed that a separate TMDL for pH is not warranted at this time.
pH
0123456789
10
Jan-8
9
Jan-9
0
Jan-9
1
Jan-9
2
Jan-9
3
Jan-9
4
Jan-9
5
Jan-9
6
Jan-9
7
Jan-9
8
Jan-9
9
Jan-0
0
Figure D3.3. Trend in pH at DEP monitoring station.
256

D3.5.2 Neshaminy Creek (980515-1347-GLW) This segment is about 2 miles long, and is listed as being impaired by water/flow variability from municipal point sources (see Figure D3.4). This particular impairment is not addressed in this document since neither the U.S. EPA or PaDEP have criteria or quantitative measures for dealing with this impairment. However, the listed impairment for “other organics” was dealt with in the modeling and TMDL development process described in the preceding sub-sections
Figure D3.4. Neshaminy Creek point source impact due to flow conditions.
D3.5.3 West Branch Neshaminy Creek (980205-1330-GLW) This segment is about 1.8 miles long, and is actually comprised of three smaller reaches (see Figure D3.5). It is listed as being impaired by flow alterations from municipal point sources. This particular impairment is not addressed in this document since neither the U.S. EPA or PaDEP have criteria or quantitative measures for dealing with this impairment. In this case, it is more likely that such flow alterations are due to urban runoff since no treatment plants are located on any of these segments. It is assumed that addressing sediment loads through the use of urban BMPs will at the same time reduce water flow variability within the watershed (see related discussion in Section C5.0).
257

Figure D3.5. Portion of West Branch Neshaminy Creek listed for flow impacts.
D3.5.4 West Branch Neshaminy Creek (980205-1333-GLW) This segment is about 1.6 miles long, and is also listed as being impaired by flow alterations from municipal point sources (see Figure D3.6). This particular impairment is not addressed in this document since neither the U.S. EPA or PaDEP have criteria or quantitative measures for dealing with this type of impairment. In this case, it is more likely that such flow alterations are due to urban runoff. It is assumed that addressing sediment loads through the use of urban BMPs will at the same time reduce water flow variability within the watershed (see related discussion in Section C5.0).
258
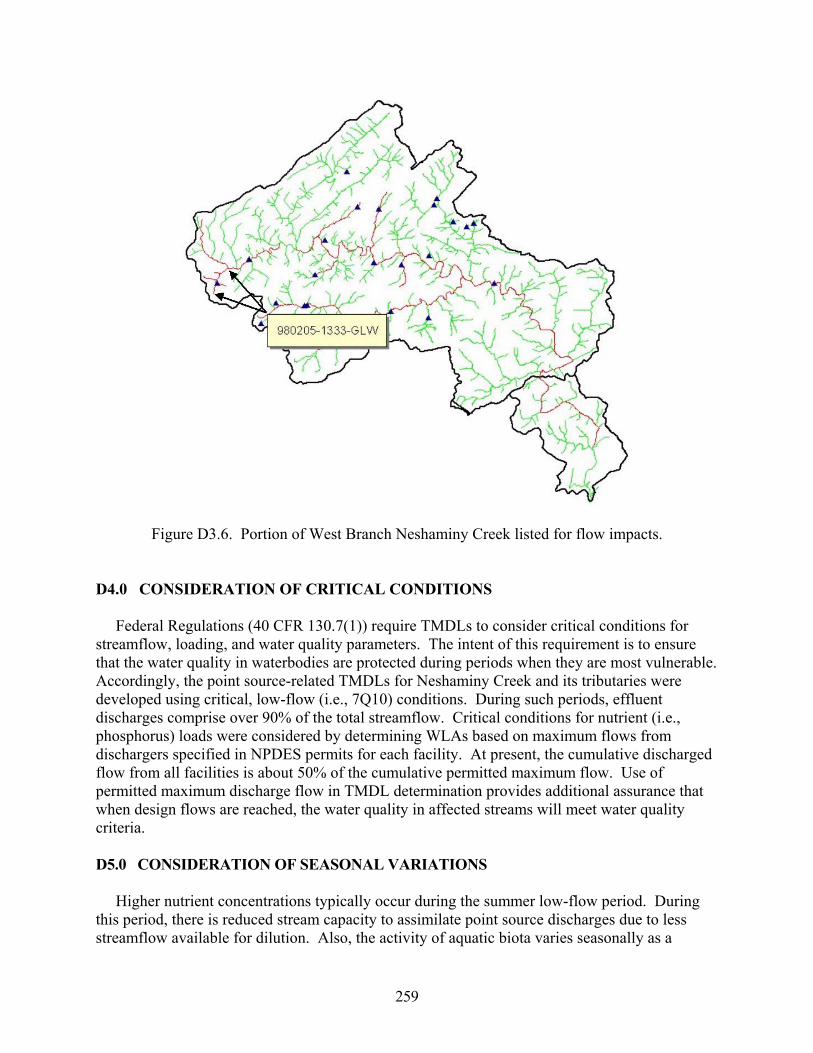
Figure D3.6. Portion of West Branch Neshaminy Creek listed for flow impacts. D4.0 CONSIDERATION OF CRITICAL CONDITIONS Federal Regulations (40 CFR 130.7(1)) require TMDLs to consider critical conditions for streamflow, loading, and water quality parameters. The intent of this requirement is to ensure that the water quality in waterbodies are protected during periods when they are most vulnerable. Accordingly, the point source-related TMDLs for Neshaminy Creek and its tributaries were developed using critical, low-flow (i.e., 7Q10) conditions. During such periods, effluent discharges comprise over 90% of the total streamflow. Critical conditions for nutrient (i.e., phosphorus) loads were considered by determining WLAs based on maximum flows from dischargers specified in NPDES permits for each facility. At present, the cumulative discharged flow from all facilities is about 50% of the cumulative permitted maximum flow. Use of permitted maximum discharge flow in TMDL determination provides additional assurance that when design flows are reached, the water quality in affected streams will meet water quality criteria. D5.0 CONSIDERATION OF SEASONAL VARIATIONS Higher nutrient concentrations typically occur during the summer low-flow period. During this period, there is reduced stream capacity to assimilate point source discharges due to less streamflow available for dilution. Also, the activity of aquatic biota varies seasonally as a
259