stormwater monitoring guide - teledyne isco · stormwater monitoring guide • watersheds • tmdls...
TRANSCRIPT
Stormwater Monitoring Guide
• Watersheds
• TMDLs
• Industrial Sites
Watersheds • TMDLs • Industrial Sites
Program Overviews .................................. 2Industrial Run-off
Construction Site run-off
Municipal Run-off
TMDLs
Water Quality Assessments
State and Local Water Quality
Sampling Options ..................................... 3Manual Sampling
Automatic Sampling
Automatic Sampling ............................ 4-5Basics of Operation
Test Run
Data Collection
Data Retrieval and Analysis
Related Devices
Rain Gauges
Parameter Measurement Devices
Water Level Indicators
Selecting A Site ..................................... 6-7Storm Run-off Pipes
Drainage Ditches
Natural Streams
Installation and Setup ......................... 8-9Sample Intake Installation
Security
Power Sources
Monitoring and Sampling Flow .....10-11Primary Measuring Devices
Secondary Measuring Devices
Manning Formula
Area Velocity
Data Acquisition and Usage .................12On-site Retrieval
Wireless Drive-up Retrieval
Cellular GSM or CDMA Modem
Data Handling Software
Questions And Answers ..................13-15
References................................................16
Additional Reading ................................16
Monitoring Checklist .............................17
Contents
Stormwater Monitoring Timeline
1972Congress creates the National Pollutant Discharge Elimination System (NPDES) as part of the Water Pollution Contract Act.
1985This original target date for the elimination of pollutant discharges under the 1972 NPDES guidelines was never met. By now, it was clear that the early focus on “point source” discharges (i.e., industrial plants and municipal wastewater treatment facilities) simply wasn’t comprehensive enough to fully address the problem.
1987The NPDES program is expanded to include “non-point source” discharges – stormwater runoff from many varied sites (i.e., construction sites, croplands, and urban areas), as it was now understood that such runoff was a major contributor to the pollution of our surface waters.
TodayMore than 35 years after NPDES, federal and state laws covering virtually all lakes, rivers, and streams (as well as the oceans themselves), are in place to reduce pollution from stormwater runoff.
In order to operate, those industries and municipalities affected by such regulations must comply with ever-increasing demands for stormwater runoff control and reporting.
Isco offers this booklet by way of providing some guidance and insight for those regulated entities, whether just initiating a program, or looking to become more efficient with an existing one.
Complete details of federal programs and their requirements are available at the
U.S. Environmental Protection Agency’s website: http://www.epa.gov
Your feedback is welcomed. If you have practical suggestions, or comments regarding content, please tell your authorized Isco Representative, or contact us directly.
1
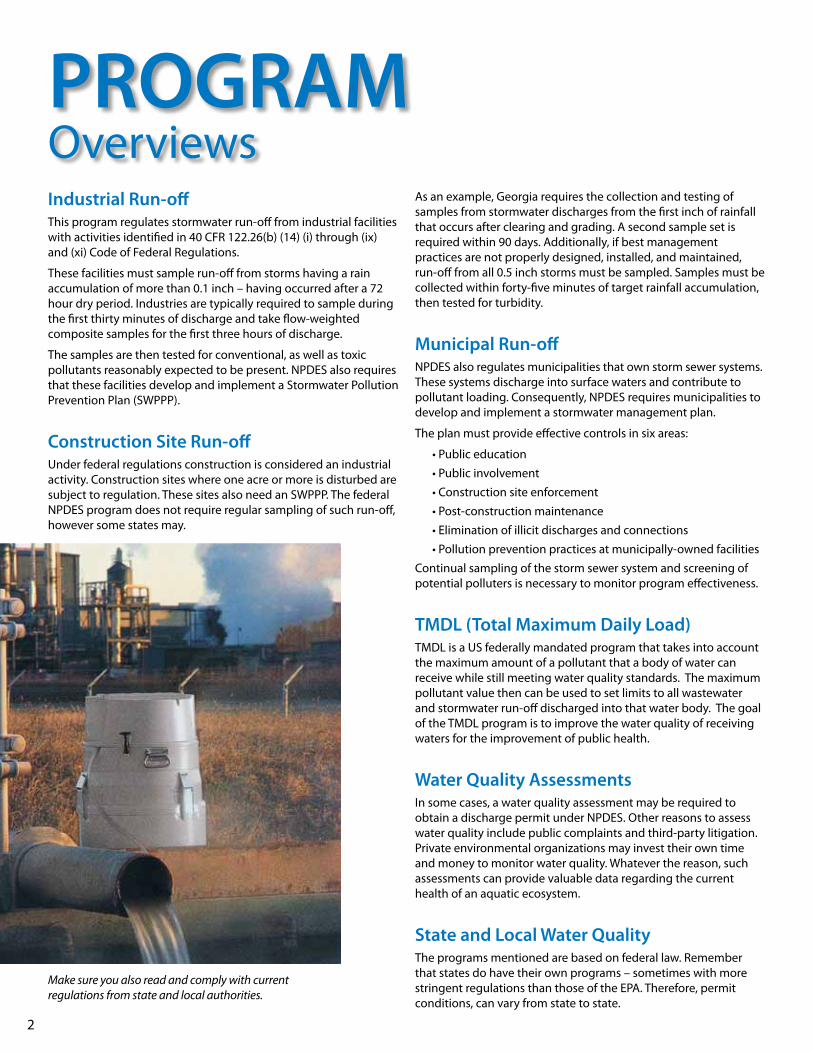
Industrial Run-offThis program regulates stormwater run-off from industrial facilities with activities identified in 40 CFR 122.26(b) (14) (i) through (ix) and (xi) Code of Federal Regulations.
These facilities must sample run-off from storms having a rain accumulation of more than 0.1 inch – having occurred after a 72 hour dry period. Industries are typically required to sample during the first thirty minutes of discharge and take flow-weighted composite samples for the first three hours of discharge.
The samples are then tested for conventional, as well as toxic pollutants reasonably expected to be present. NPDES also requires that these facilities develop and implement a Stormwater Pollution Prevention Plan (SWPPP).
Construction Site Run-offUnder federal regulations construction is considered an industrial activity. Construction sites where one acre or more is disturbed are subject to regulation. These sites also need an SWPPP. The federal NPDES program does not require regular sampling of such run-off, however some states may.
As an example, Georgia requires the collection and testing of samples from stormwater discharges from the first inch of rainfall that occurs after clearing and grading. A second sample set is required within 90 days. Additionally, if best management practices are not properly designed, installed, and maintained, run-off from all 0.5 inch storms must be sampled. Samples must be collected within forty-five minutes of target rainfall accumulation, then tested for turbidity.
Municipal Run-offNPDES also regulates municipalities that own storm sewer systems. These systems discharge into surface waters and contribute to pollutant loading. Consequently, NPDES requires municipalities to develop and implement a stormwater management plan.
The plan must provide effective controls in six areas:
• Public education
• Public involvement
• Construction site enforcement
• Post-construction maintenance
• Elimination of illicit discharges and connections
• Pollution prevention practices at municipally-owned facilities
Continual sampling of the storm sewer system and screening of potential polluters is necessary to monitor program effectiveness.
TMDL (Total Maximum Daily Load)TMDL is a US federally mandated program that takes into account the maximum amount of a pollutant that a body of water can receive while still meeting water quality standards. The maximum pollutant value then can be used to set limits to all wastewater and stormwater run-off discharged into that water body. The goal of the TMDL program is to improve the water quality of receiving waters for the improvement of public health.
Water Quality AssessmentsIn some cases, a water quality assessment may be required to obtain a discharge permit under NPDES. Other reasons to assess water quality include public complaints and third-party litigation. Private environmental organizations may invest their own time and money to monitor water quality. Whatever the reason, such assessments can provide valuable data regarding the current health of an aquatic ecosystem.
State and Local Water QualityThe programs mentioned are based on federal law. Remember that states do have their own programs – sometimes with more stringent regulations than those of the EPA. Therefore, permit conditions, can vary from state to state.
pRogRAM Overviews
Make sure you also read and comply with current regulations from state and local authorities.
2
SAMpLIng Options
Both manual and
automatic methods
can play a valuable part
in your water sampling
activities. In either case,
the goal is to acquire
reliable, defensible data.
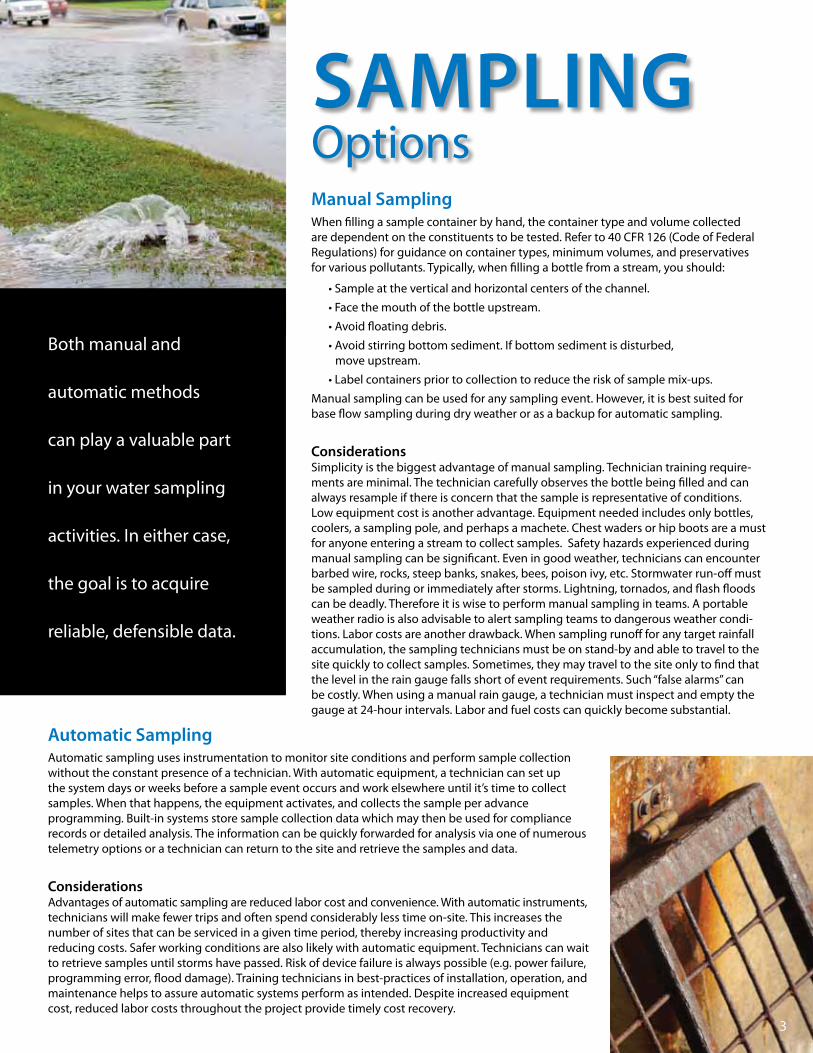
Manual SamplingWhen filling a sample container by hand, the container type and volume collected are dependent on the constituents to be tested. Refer to 40 CFR 126 (Code of Federal Regulations) for guidance on container types, minimum volumes, and preservatives for various pollutants. Typically, when filling a bottle from a stream, you should:
• Sample at the vertical and horizontal centers of the channel.
• Face the mouth of the bottle upstream.
• Avoid floating debris.
• Avoid stirring bottom sediment. If bottom sediment is disturbed, move upstream.
• Label containers prior to collection to reduce the risk of sample mix-ups.
Manual sampling can be used for any sampling event. However, it is best suited for base flow sampling during dry weather or as a backup for automatic sampling.
ConsiderationsSimplicity is the biggest advantage of manual sampling. Technician training require-ments are minimal. The technician carefully observes the bottle being filled and can always resample if there is concern that the sample is representative of conditions. Low equipment cost is another advantage. Equipment needed includes only bottles, coolers, a sampling pole, and perhaps a machete. Chest waders or hip boots are a must for anyone entering a stream to collect samples. Safety hazards experienced during manual sampling can be significant. Even in good weather, technicians can encounter barbed wire, rocks, steep banks, snakes, bees, poison ivy, etc. Stormwater run-off must be sampled during or immediately after storms. Lightning, tornados, and flash floods can be deadly. Therefore it is wise to perform manual sampling in teams. A portable weather radio is also advisable to alert sampling teams to dangerous weather condi-tions. Labor costs are another drawback. When sampling runoff for any target rainfall accumulation, the sampling technicians must be on stand-by and able to travel to the site quickly to collect samples. Sometimes, they may travel to the site only to find that the level in the rain gauge falls short of event requirements. Such “false alarms” can be costly. When using a manual rain gauge, a technician must inspect and empty the gauge at 24-hour intervals. Labor and fuel costs can quickly become substantial.
Automatic SamplingAutomatic sampling uses instrumentation to monitor site conditions and perform sample collection without the constant presence of a technician. With automatic equipment, a technician can set up the system days or weeks before a sample event occurs and work elsewhere until it’s time to collect samples. When that happens, the equipment activates, and collects the sample per advance programming. Built-in systems store sample collection data which may then be used for compliance records or detailed analysis. The information can be quickly forwarded for analysis via one of numerous telemetry options or a technician can return to the site and retrieve the samples and data.
ConsiderationsAdvantages of automatic sampling are reduced labor cost and convenience. With automatic instruments, technicians will make fewer trips and often spend considerably less time on-site. This increases the number of sites that can be serviced in a given time period, thereby increasing productivity and reducing costs. Safer working conditions are also likely with automatic equipment. Technicians can wait to retrieve samples until storms have passed. Risk of device failure is always possible (e.g. power failure, programming error, flood damage). Training technicians in best-practices of installation, operation, and maintenance helps to assure automatic systems perform as intended. Despite increased equipment cost, reduced labor costs throughout the project provide timely cost recovery.
3
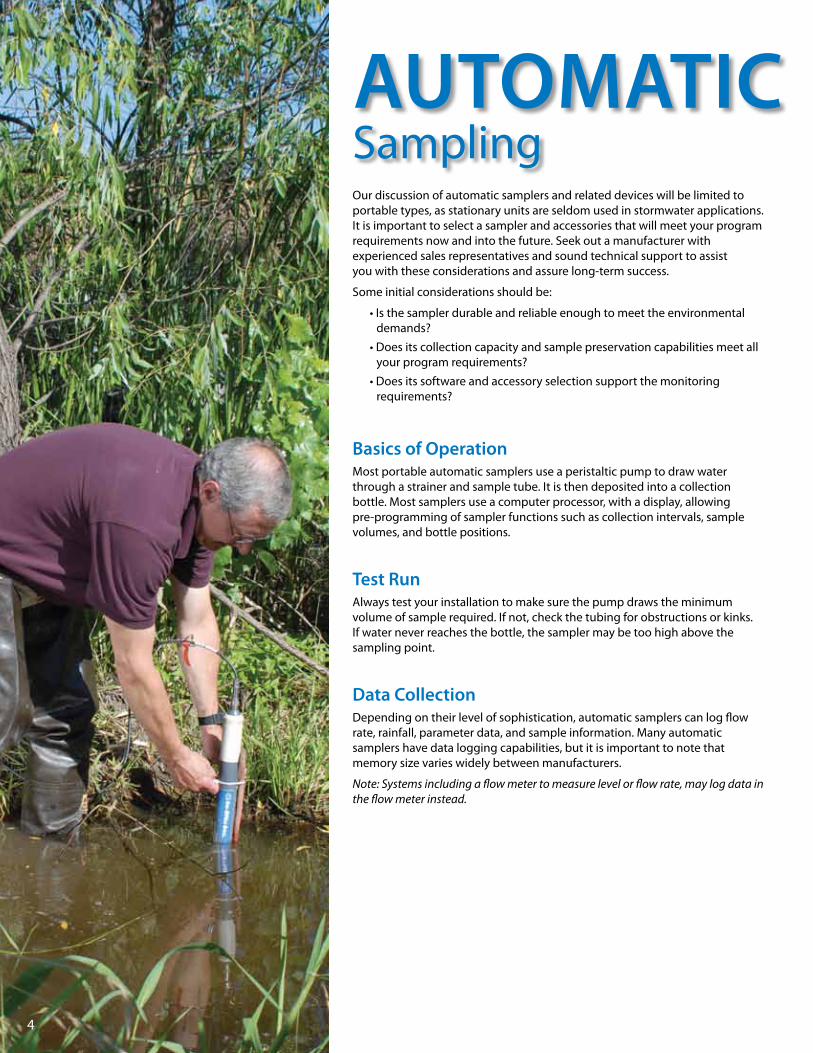
AuToMATIC SamplingOur discussion of automatic samplers and related devices will be limited to portable types, as stationary units are seldom used in stormwater applications. It is important to select a sampler and accessories that will meet your program requirements now and into the future. Seek out a manufacturer with experienced sales representatives and sound technical support to assist you with these considerations and assure long-term success.
Some initial considerations should be:
• Is the sampler durable and reliable enough to meet the environmental demands?
• Does its collection capacity and sample preservation capabilities meet all your program requirements?
• Does its software and accessory selection support the monitoring requirements?
Basics of operationMost portable automatic samplers use a peristaltic pump to draw water through a strainer and sample tube. It is then deposited into a collection bottle. Most samplers use a computer processor, with a display, allowing pre-programming of sampler functions such as collection intervals, sample volumes, and bottle positions.
Test RunAlways test your installation to make sure the pump draws the minimum volume of sample required. If not, check the tubing for obstructions or kinks. If water never reaches the bottle, the sampler may be too high above the sampling point.
Data CollectionDepending on their level of sophistication, automatic samplers can log flow rate, rainfall, parameter data, and sample information. Many automatic samplers have data logging capabilities, but it is important to note that memory size varies widely between manufacturers.
Note: Systems including a flow meter to measure level or flow rate, may log data in the flow meter instead.
4
Data Retrieval and AnalysisAdvanced models now commonly offer remote retrieval of data through a wide assortment of wireless options (cell modem, radio, etc.).
Such remote connections may allow:
• Off -site monitoring of system status
• Data retrieval
• Programming corrections or updates
• Notification when a sample event is occurring, or when the equipment requires service
For dial-out notification, telephone modems can deliver a voice message to phone users. Cellular modems can send text messages or e-mail. More information regarding various data handling methods can be found on Page 12. Once retrieved, data may be analyzed and reported via specialized software such as Isco Flowlink®.
Related DevicesRain gaugesRain gauges figure prominently in many stormwater runoff monitoring systems. The instrument measures on-site rainfall (typically in increments of 0.01 inch or 0.1 millimeter). It allows system components to remain idle (conserving power) until there has been sufficient rainfall to warrant monitoring activity. Once a pre-set rainfall amount is detected, a signal from the rain gauge activates another instrument – usually a sampler or flow meter. The system can also be configured to require additional parameters for activation. When installing rain gauges, avoid obstructions to rainfall, such as an overhead tree canopy or nearby structure. Elevation of the rain gauge should allow access for routine inspection and maintenance – less than six feet above the ground where practical.
parameter Measurement DevicesIn addition to rainfall, a number of other water quality parameters can be used to initiate sampling. These include pH, dissolved oxygen, conductivity, temperature, turbidity, and more. Appropriate in-situ probes or multi-parameter sondes are used as triggers.
Such sensors can save costs and eliminate unnecessary analysis. They can be used to trigger automatic samplers when conditions exceed normal ranges.
Water Level IndicatorsIt is impossible to collect a sample if the water level does not cover the collection tube intake. One example of this condition is a dry ephemeral stream. A rain gauge may indicate an event, but the stormwater has not yet filled the stream bed. A water level indicator, installed alongside the intake, can trigger the sampler once the water level is sufficient. The simplest water level indicator is a conductivity sensor which detects moisture. Other types of water level indicators are bubbler meters or submerged pressure transducers. Many of these devices can measure level and flow rate for later analysis. Refer to pages 10 and 11 in the Monitoring and Sampling Flow section for more information.
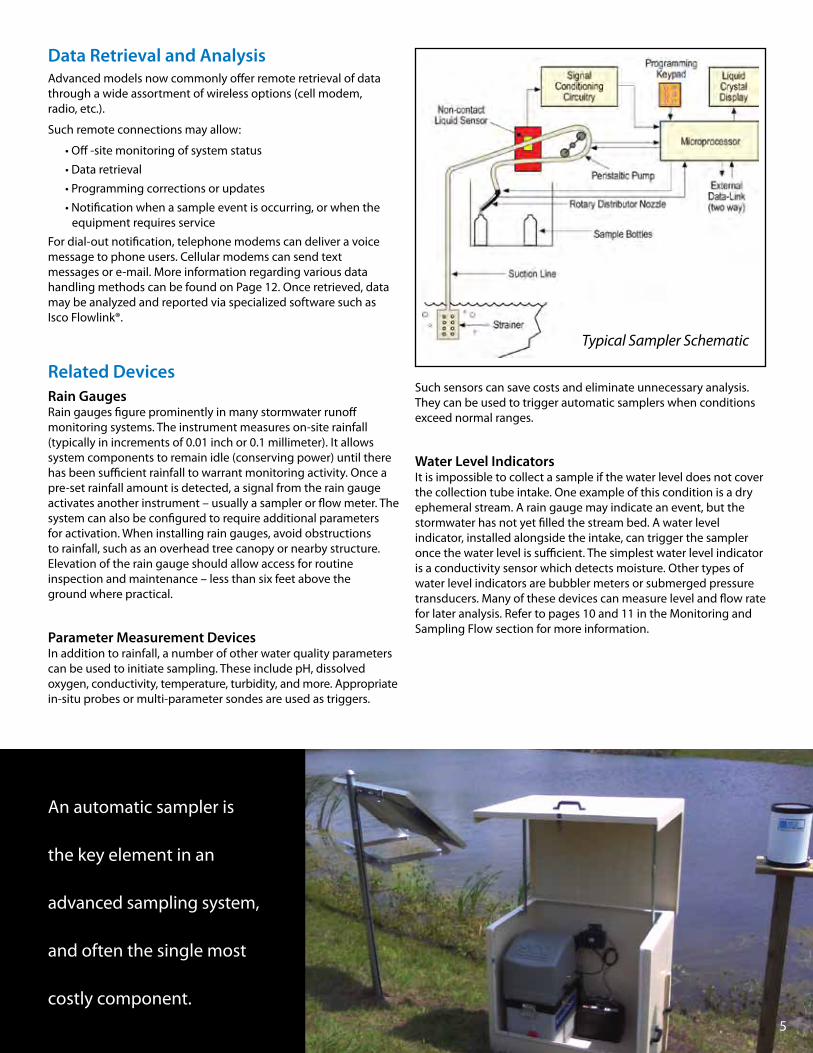
An automatic sampler is
the key element in an
advanced sampling system,
and often the single most
costly component.5
Typical Sampler Schematic
Begin by reviewing maps
and other available data
for possible locations.
Then, visit each potential
site to assess physical
hazards and accessibility.
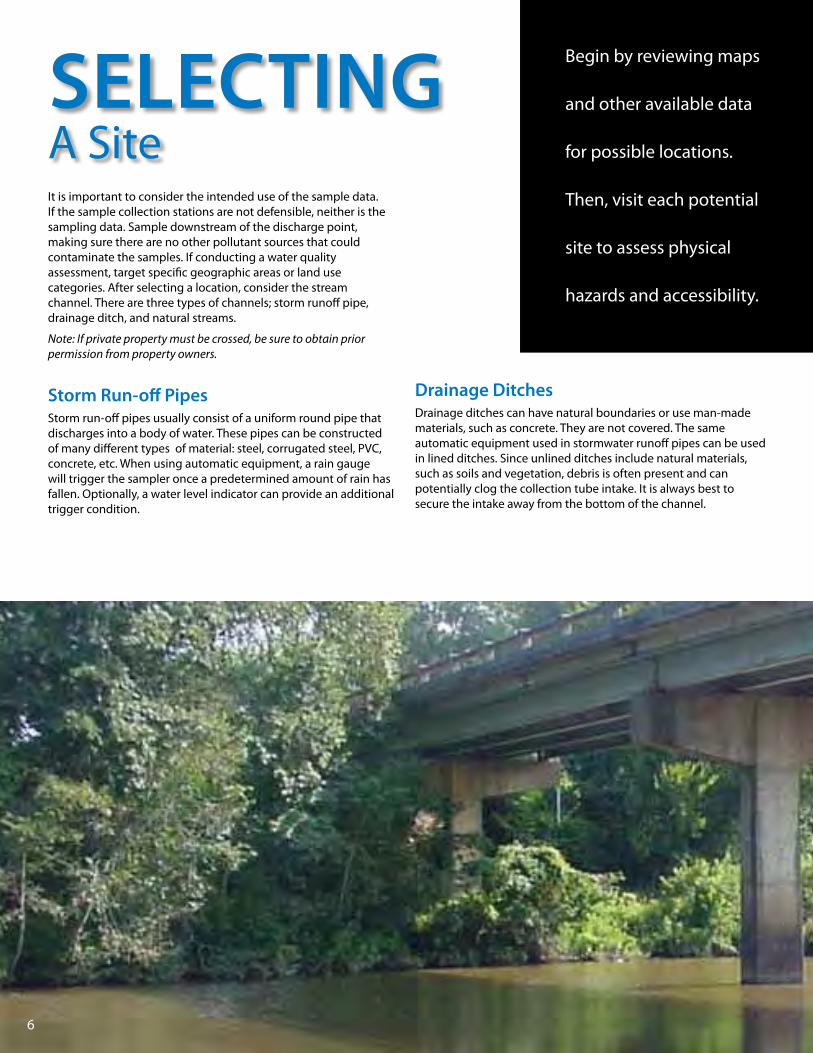
It is important to consider the intended use of the sample data. If the sample collection stations are not defensible, neither is the sampling data. Sample downstream of the discharge point, making sure there are no other pollutant sources that could contaminate the samples. If conducting a water quality assessment, target specific geographic areas or land use categories. After selecting a location, consider the stream channel. There are three types of channels; storm runoff pipe, drainage ditch, and natural streams.
Note: If private property must be crossed, be sure to obtain prior permission from property owners.
Storm Run-off pipesStorm run-off pipes usually consist of a uniform round pipe that discharges into a body of water. These pipes can be constructed of many different types of material: steel, corrugated steel, PVC, concrete, etc. When using automatic equipment, a rain gauge will trigger the sampler once a predetermined amount of rain has fallen. Optionally, a water level indicator can provide an additional trigger condition.
Drainage DitchesDrainage ditches can have natural boundaries or use man-made materials, such as concrete. They are not covered. The same automatic equipment used in stormwater runoff pipes can be used in lined ditches. Since unlined ditches include natural materials, such as soils and vegetation, debris is often present and can potentially clog the collection tube intake. It is always best to secure the intake away from the bottom of the channel.
SeLeCTIng A Site
6
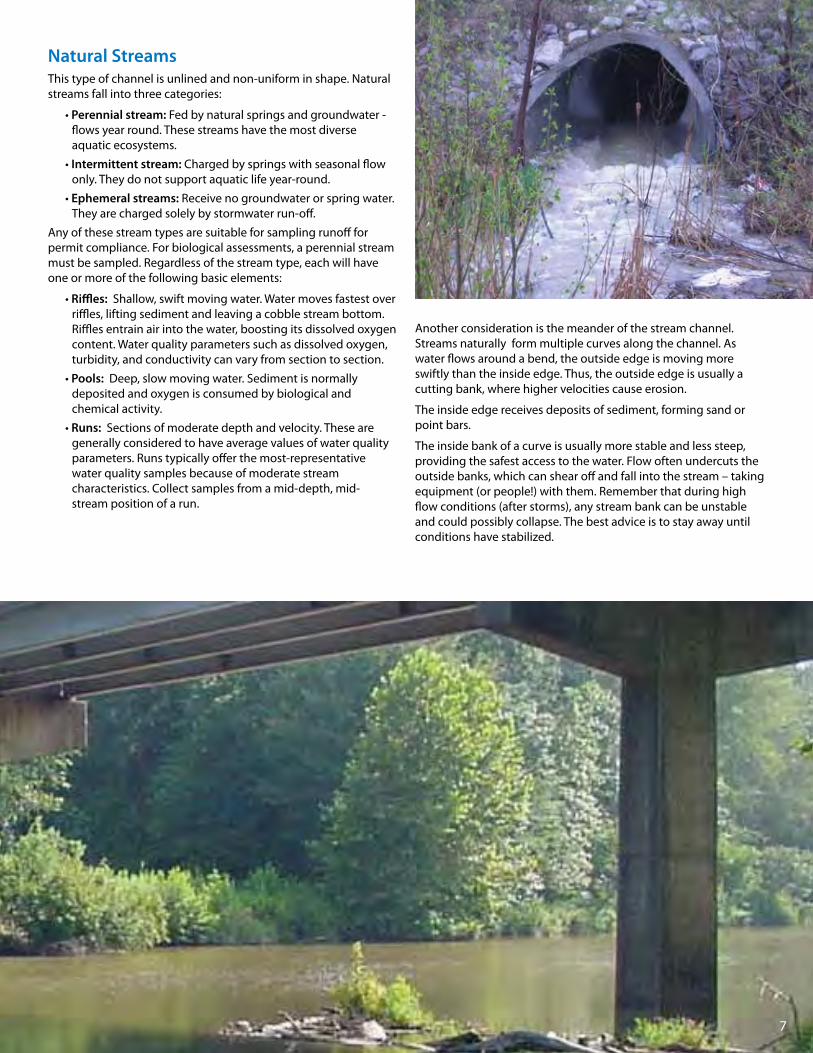
natural StreamsThis type of channel is unlined and non-uniform in shape. Natural streams fall into three categories:
• perennial stream: Fed by natural springs and groundwater - flows year round. These streams have the most diverse aquatic ecosystems.
• Intermittent stream: Charged by springs with seasonal flow only. They do not support aquatic life year-round.
• ephemeral streams: Receive no groundwater or spring water. They are charged solely by stormwater run-off.
Any of these stream types are suitable for sampling runoff for permit compliance. For biological assessments, a perennial stream must be sampled. Regardless of the stream type, each will have one or more of the following basic elements:
• Riffles: Shallow, swift moving water. Water moves fastest over riffles, lifting sediment and leaving a cobble stream bottom. Riffles entrain air into the water, boosting its dissolved oxygen content. Water quality parameters such as dissolved oxygen, turbidity, and conductivity can vary from section to section.
• pools: Deep, slow moving water. Sediment is normally deposited and oxygen is consumed by biological and chemical activity.
• Runs: Sections of moderate depth and velocity. These are generally considered to have average values of water quality parameters. Runs typically offer the most-representative water quality samples because of moderate stream characteristics. Collect samples from a mid-depth, mid- stream position of a run.
Another consideration is the meander of the stream channel. Streams naturally form multiple curves along the channel. As water flows around a bend, the outside edge is moving more swiftly than the inside edge. Thus, the outside edge is usually a cutting bank, where higher velocities cause erosion.
The inside edge receives deposits of sediment, forming sand or point bars.
The inside bank of a curve is usually more stable and less steep, providing the safest access to the water. Flow often undercuts the outside banks, which can shear off and fall into the stream – taking equipment (or people!) with them. Remember that during high flow conditions (after storms), any stream bank can be unstable and could possibly collapse. The best advice is to stay away until conditions have stabilized.
7
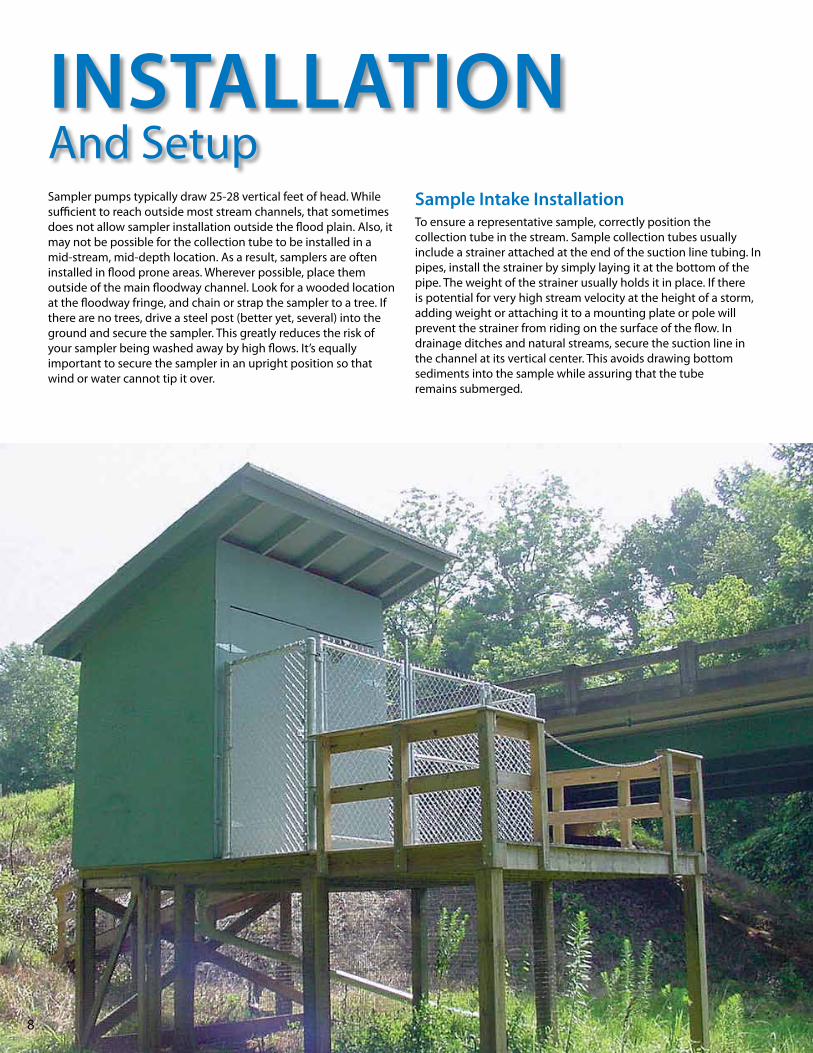
InSTALLATIon And SetupSampler pumps typically draw 25-28 vertical feet of head. While sufficient to reach outside most stream channels, that sometimes does not allow sampler installation outside the flood plain. Also, it may not be possible for the collection tube to be installed in a mid-stream, mid-depth location. As a result, samplers are often installed in flood prone areas. Wherever possible, place them outside of the main floodway channel. Look for a wooded location at the floodway fringe, and chain or strap the sampler to a tree. If there are no trees, drive a steel post (better yet, several) into the ground and secure the sampler. This greatly reduces the risk of your sampler being washed away by high flows. It’s equally important to secure the sampler in an upright position so that wind or water cannot tip it over.
Sample Intake InstallationTo ensure a representative sample, correctly position the collection tube in the stream. Sample collection tubes usually include a strainer attached at the end of the suction line tubing. In pipes, install the strainer by simply laying it at the bottom of the pipe. The weight of the strainer usually holds it in place. If there is potential for very high stream velocity at the height of a storm, adding weight or attaching it to a mounting plate or pole will prevent the strainer from riding on the surface of the flow. In drainage ditches and natural streams, secure the suction line in the channel at its vertical center. This avoids drawing bottom sediments into the sample while assuring that the tube remains submerged.
8
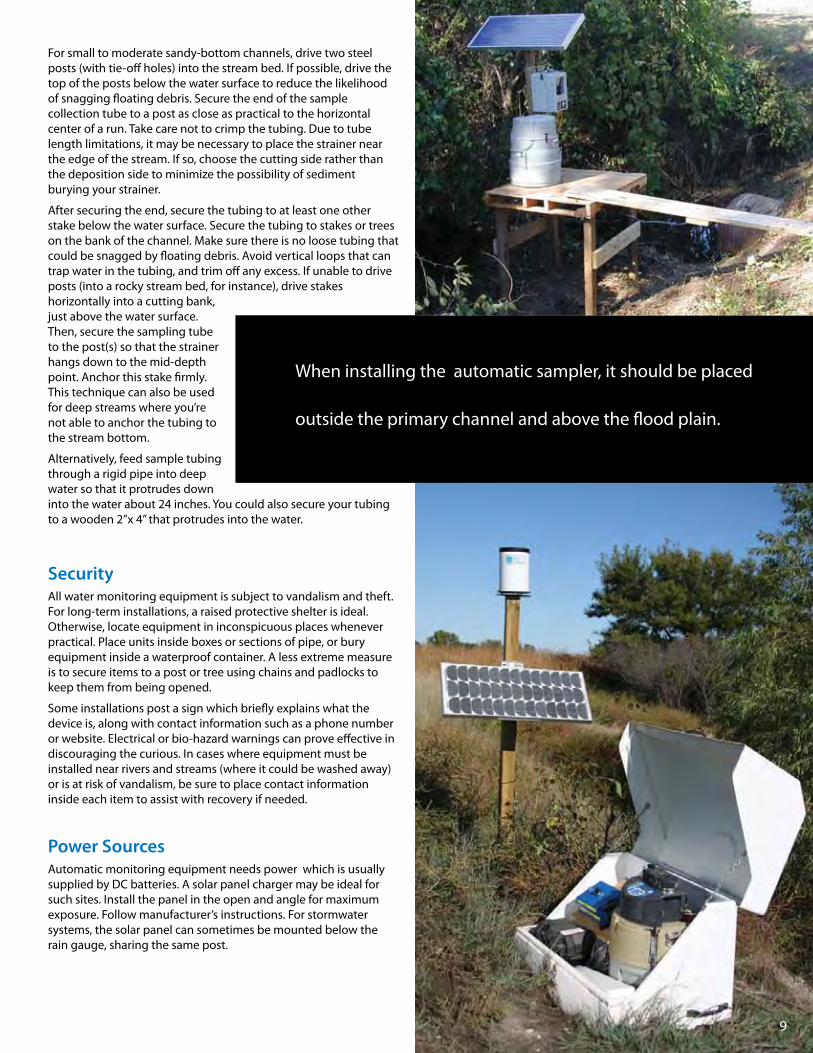
For small to moderate sandy-bottom channels, drive two steel posts (with tie-off holes) into the stream bed. If possible, drive the top of the posts below the water surface to reduce the likelihood of snagging floating debris. Secure the end of the sample collection tube to a post as close as practical to the horizontal center of a run. Take care not to crimp the tubing. Due to tube length limitations, it may be necessary to place the strainer near the edge of the stream. If so, choose the cutting side rather than the deposition side to minimize the possibility of sediment burying your strainer.
After securing the end, secure the tubing to at least one other stake below the water surface. Secure the tubing to stakes or trees on the bank of the channel. Make sure there is no loose tubing that could be snagged by floating debris. Avoid vertical loops that can trap water in the tubing, and trim off any excess. If unable to drive posts (into a rocky stream bed, for instance), drive stakes horizontally into a cutting bank, just above the water surface. Then, secure the sampling tube to the post(s) so that the strainer hangs down to the mid-depth point. Anchor this stake firmly. This technique can also be used for deep streams where you’re not able to anchor the tubing to the stream bottom.
Alternatively, feed sample tubing through a rigid pipe into deep water so that it protrudes down into the water about 24 inches. You could also secure your tubing to a wooden 2”x 4” that protrudes into the water.
SecurityAll water monitoring equipment is subject to vandalism and theft. For long-term installations, a raised protective shelter is ideal. Otherwise, locate equipment in inconspicuous places whenever practical. Place units inside boxes or sections of pipe, or bury equipment inside a waterproof container. A less extreme measure is to secure items to a post or tree using chains and padlocks to keep them from being opened.
Some installations post a sign which briefly explains what the device is, along with contact information such as a phone number or website. Electrical or bio-hazard warnings can prove effective in discouraging the curious. In cases where equipment must be installed near rivers and streams (where it could be washed away) or is at risk of vandalism, be sure to place contact information inside each item to assist with recovery if needed.
power SourcesAutomatic monitoring equipment needs power which is usually supplied by DC batteries. A solar panel charger may be ideal for such sites. Install the panel in the open and angle for maximum exposure. Follow manufacturer’s instructions. For stormwater systems, the solar panel can sometimes be mounted below the rain gauge, sharing the same post.
When installing the automatic sampler, it should be placed
outside the primary channel and above the flood plain.
9
MonIToRIng And Sampling Flow
Whether monitoring stormwater
or surface water quality, flow rate
data may be of interest.
With flow data, you can calculate the loading of specific parameters or determine the impact of a storm on a receiving water body. There are a number of site-specific conditions to consider when choosing a flow measurement technology.
primary Measuring DevicesPrimary devices are structures that restrict flow, establishing a known level-to-flow rate relationship in a waterway. A discharge table or formula then allows flow to be accurately calculated. The two types of primary measuring devices are weirs and flumes.
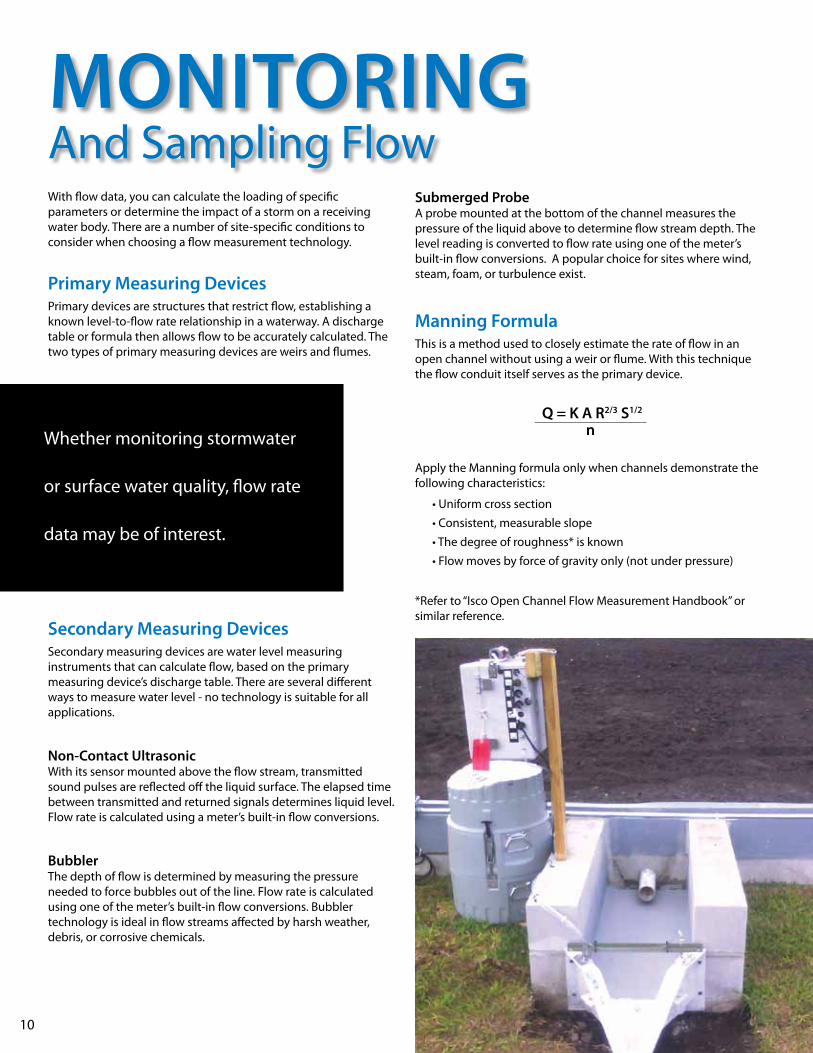
Secondary Measuring DevicesSecondary measuring devices are water level measuring instruments that can calculate flow, based on the primary measuring device’s discharge table. There are several different ways to measure water level - no technology is suitable for all applications.
non-Contact ultrasonicWith its sensor mounted above the flow stream, transmitted sound pulses are reflected off the liquid surface. The elapsed time between transmitted and returned signals determines liquid level. Flow rate is calculated using a meter’s built-in flow conversions.
BubblerThe depth of flow is determined by measuring the pressure needed to force bubbles out of the line. Flow rate is calculated using one of the meter’s built-in flow conversions. Bubbler technology is ideal in flow streams affected by harsh weather, debris, or corrosive chemicals.
Submerged probeA probe mounted at the bottom of the channel measures the pressure of the liquid above to determine flow stream depth. The level reading is converted to flow rate using one of the meter’s built-in flow conversions. A popular choice for sites where wind, steam, foam, or turbulence exist.
Manning FormulaThis is a method used to closely estimate the rate of flow in an open channel without using a weir or flume. With this technique the flow conduit itself serves as the primary device.
Q = K A R2/3 S1/2________________________
n
Apply the Manning formula only when channels demonstrate the following characteristics:
• Uniform cross section
• Consistent, measurable slope
• The degree of roughness* is known
• Flow moves by force of gravity only (not under pressure)
*Refer to “Isco Open Channel Flow Measurement Handbook” or similar reference.
10
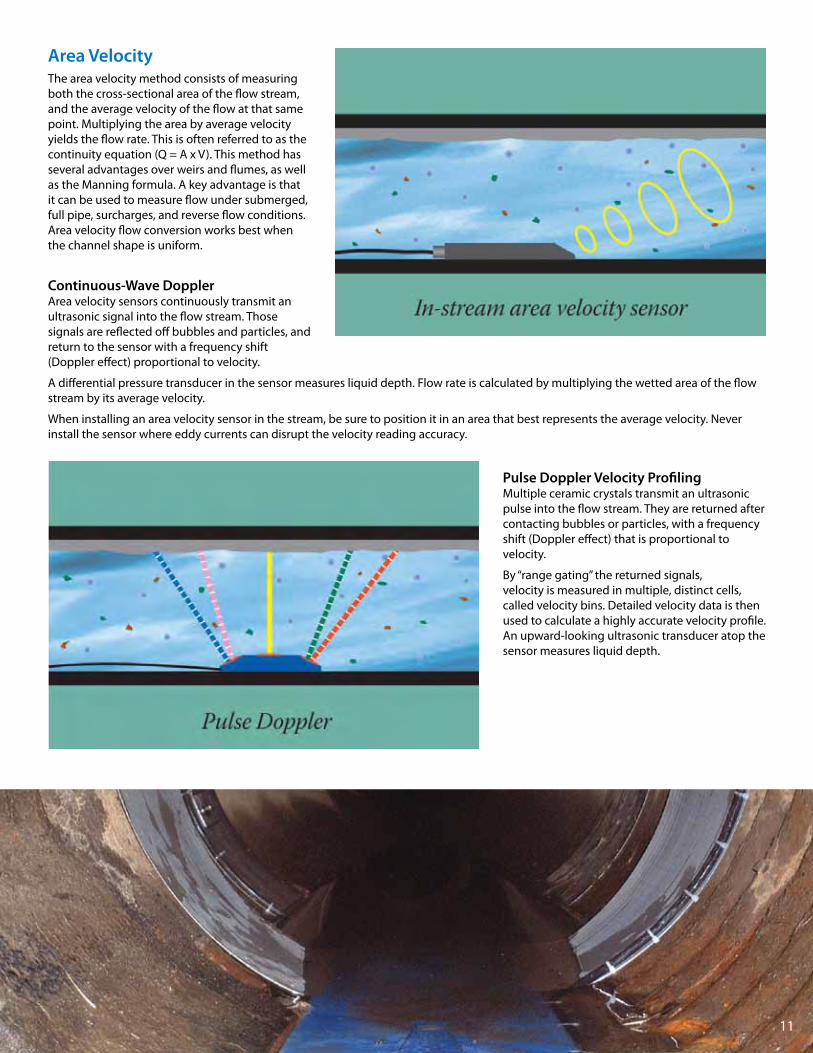
Area VelocityThe area velocity method consists of measuring both the cross-sectional area of the flow stream, and the average velocity of the flow at that same point. Multiplying the area by average velocity yields the flow rate. This is often referred to as the continuity equation (Q = A x V). This method has several advantages over weirs and flumes, as well as the Manning formula. A key advantage is that it can be used to measure flow under submerged, full pipe, surcharges, and reverse flow conditions. Area velocity flow conversion works best when the channel shape is uniform.
Continuous-Wave DopplerArea velocity sensors continuously transmit an ultrasonic signal into the flow stream. Those signals are reflected off bubbles and particles, and return to the sensor with a frequency shift (Doppler effect) proportional to velocity.
A differential pressure transducer in the sensor measures liquid depth. Flow rate is calculated by multiplying the wetted area of the flow stream by its average velocity.
When installing an area velocity sensor in the stream, be sure to position it in an area that best represents the average velocity. Never install the sensor where eddy currents can disrupt the velocity reading accuracy.
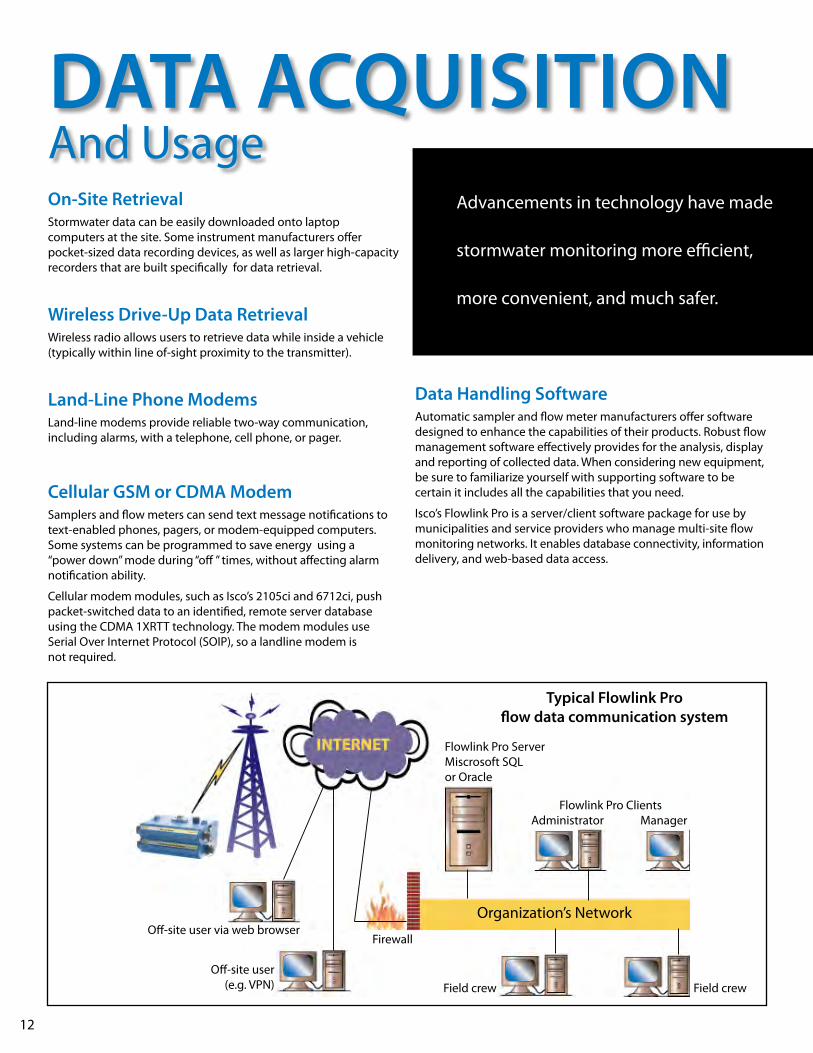
pulse Doppler Velocity profilingMultiple ceramic crystals transmit an ultrasonic pulse into the flow stream. They are returned after contacting bubbles or particles, with a frequency shift (Doppler effect) that is proportional to velocity.
By “range gating” the returned signals, velocity is measured in multiple, distinct cells, called velocity bins. Detailed velocity data is then used to calculate a highly accurate velocity profile. An upward-looking ultrasonic transducer atop the sensor measures liquid depth.
11
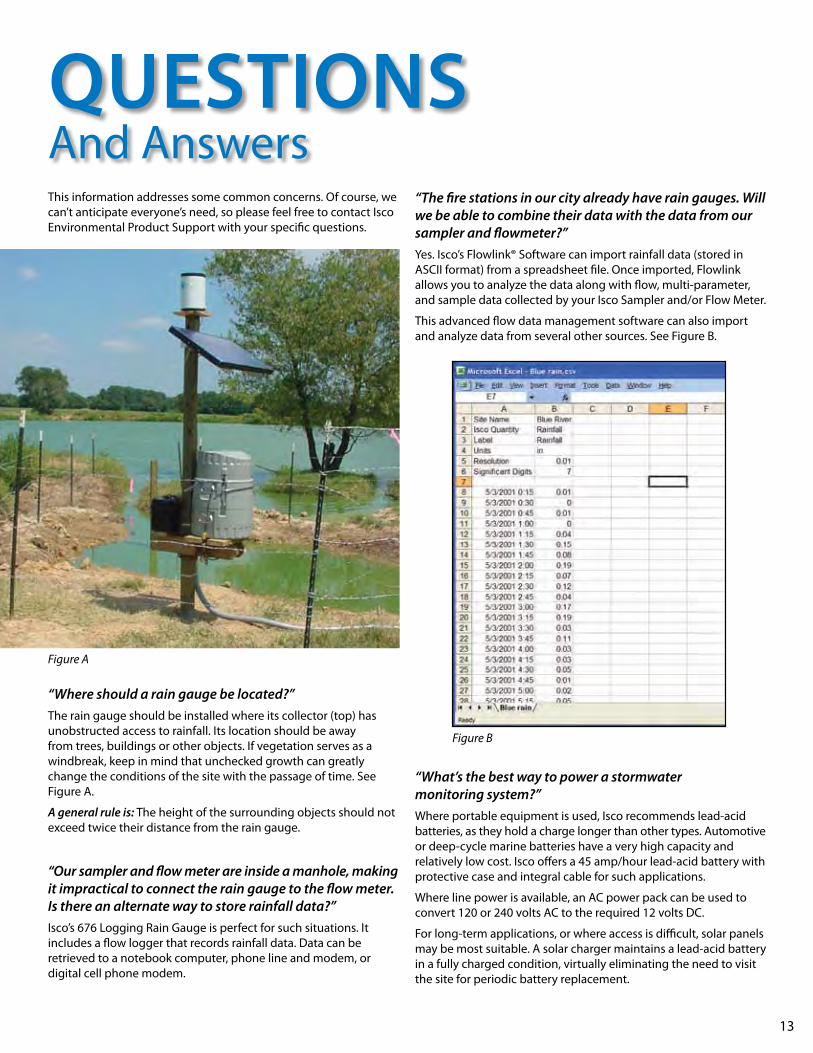
DATA ACQuISITIon And Usageon-Site RetrievalStormwater data can be easily downloaded onto laptop computers at the site. Some instrument manufacturers offer pocket-sized data recording devices, as well as larger high-capacity recorders that are built specifically for data retrieval.
Wireless Drive-up Data RetrievalWireless radio allows users to retrieve data while inside a vehicle (typically within line of-sight proximity to the transmitter).
Land-Line phone ModemsLand-line modems provide reliable two-way communication, including alarms, with a telephone, cell phone, or pager.
Cellular gSM or CDMA ModemSamplers and flow meters can send text message notifications to text-enabled phones, pagers, or modem-equipped computers. Some systems can be programmed to save energy using a “power down” mode during “off ” times, without affecting alarm notification ability.
Cellular modem modules, such as Isco’s 2105ci and 6712ci, push packet-switched data to an identified, remote server database using the CDMA 1XRTT technology. The modem modules use Serial Over Internet Protocol (SOIP), so a landline modem is not required.
Data Handling SoftwareAutomatic sampler and flow meter manufacturers offer software designed to enhance the capabilities of their products. Robust flow management software effectively provides for the analysis, display and reporting of collected data. When considering new equipment, be sure to familiarize yourself with supporting software to be certain it includes all the capabilities that you need.
Isco’s Flowlink Pro is a server/client software package for use by municipalities and service providers who manage multi-site flow monitoring networks. It enables database connectivity, information delivery, and web-based data access.
Advancements in technology have made
stormwater monitoring more efficient,
more convenient, and much safer.
12
Off-site user via web browser
Flowlink Pro Server Miscrosoft SQL or Oracle
Flowlink Pro Clients Administrator Manager
Field crewField crewOff-site user
(e.g. VPN)
Firewall
Organization’s Network
Typical Flowlink pro flow data communication system
13
This information addresses some common concerns. Of course, we can’t anticipate everyone’s need, so please feel free to contact Isco Environmental Product Support with your specific questions.
“Where should a rain gauge be located?”The rain gauge should be installed where its collector (top) has unobstructed access to rainfall. Its location should be away from trees, buildings or other objects. If vegetation serves as a windbreak, keep in mind that unchecked growth can greatly change the conditions of the site with the passage of time. See Figure A.
A general rule is: The height of the surrounding objects should not exceed twice their distance from the rain gauge.
“Our sampler and flow meter are inside a manhole, making it impractical to connect the rain gauge to the flow meter. Is there an alternate way to store rainfall data?”Isco’s 676 Logging Rain Gauge is perfect for such situations. It includes a flow logger that records rainfall data. Data can be retrieved to a notebook computer, phone line and modem, or digital cell phone modem.
“The fire stations in our city already have rain gauges. Will we be able to combine their data with the data from our sampler and flowmeter?”Yes. Isco’s Flowlink® Software can import rainfall data (stored in ASCII format) from a spreadsheet file. Once imported, Flowlink allows you to analyze the data along with flow, multi-parameter, and sample data collected by your Isco Sampler and/or Flow Meter.
This advanced flow data management software can also import and analyze data from several other sources. See Figure B.
“What’s the best way to power a stormwater monitoring system?”Where portable equipment is used, Isco recommends lead-acid batteries, as they hold a charge longer than other types. Automotive or deep-cycle marine batteries have a very high capacity and relatively low cost. Isco offers a 45 amp/hour lead-acid battery with protective case and integral cable for such applications.
Where line power is available, an AC power pack can be used to convert 120 or 240 volts AC to the required 12 volts DC.
For long-term applications, or where access is difficult, solar panels may be most suitable. A solar charger maintains a lead-acid battery in a fully charged condition, virtually eliminating the need to visit the site for periodic battery replacement.
QueSTIonSAnd Answers
Figure A
Figure B
“Some industrial facilities must collect a “first flush” sample during the first 30 minutes of a storm, as well as a flow-weighted composite sample for the entire storm event (or the first three hours of the run-off, whichever occurs first). Can a single sampler collect both of these samples?” Isco’s 6712 Sampler has special programming that allows for both types of samples to be taken. The sampler’s bottles can be divided into two groups. The first group can be programmed to take the “first flush” sample. The second group can be programmed to take flow-weighted samples.
Isco’s 6712 Sampler offers a four 1-gallon glass bottle configuration to accommodate this type of sampling. Bottle #1 can be assigned to the first bottle group and the remaining three bottles can be assigned to take hourly composites. See Figure C.
“It’s difficult to estimate the amount of run-off prior to a storm event. If we underestimate, all the bottles fill too soon. If we overestimate, we don’t collect enough sample for complete analysis. Is there a way to solve this problem?”An Isco sampler with twelve 1-quart glass bottles is the answer. The first-flush sample is stored in the first three bottles. Individual samples are collected into the nine remaining bottles at 20-minute intervals. After the storm, sub-samples from each of these nine bottles can be poured into one container, resulting in a flow-weighted composite sample.
The volume of each sub-sample is proportional to the flow at the time of sampling – as measured by the flow meter – eliminating the need to predict run-off volume before a storm event. See Figure D. “How do we preserve samples at 4° C?”
Isco’s portable samplers feature insulated bases for holding ice to cool samples during short-duration sampling activities (usually less than 12 hours). For long-term use, ice must be added just prior to a storm event. This can be difficult to manage and can expose persons to hazardous weather conditions. See Figure E.
Isco is unique in offering a transportable refrigerated sampler, the Avalanche®. It uses a deep-cycle marine battery, or AC power, but stays powered-down until the first sample is taken. Then, on-board refrigeration cools samples and keeps them at 4°C until retrieval is convenient (typically in 48-72 hours).
“We are required to collect samples, but don’t need to measure flow and rainfall. Is there a way to activate the sampler when run-off occurs – without using a flow meter?”You bet. Use Isco’s 1640 Liquid Level Actuator. It has a probe located in the flow stream bed. When the water level rises and touches the probe, the Liquid Level Actuator signals the sampler to begin collecting.
14
Figure C
Figure D
Figure E
Bottle Number 1 2 3 4
First Flush Sample
Flow Weighted Composite Samples
Bottle Number 1 2 3 4 5 6 7 8 9 10 11 12
100%
75%
50%
25%
0%0.30
0.20Time: 3:00
Flow
15
“What are the options for checking the status of a site without actually going there?”With a telephone modem, a site can be called to view the current parameter readings, and to check the state of the automatic sampler.
At a permanent location, a phone line can be routed directly to a sampler with an internal modem. For temporary use, or where routing a telephone line would be cost prohibitive, an Isco Model 6712 sampler can be fitted with a digital cellular modem.
A phone modem and simple terminal emulation program (Windows® HyperTerminal®, for example), will give you remote access to the site information and allow changes to sampler programming.
“I’d like to leave my monitoring equipment in the field for long periods of time and eliminate unnecessary trips to the site. What do I need?The alarm dial-out feature is what you’re looking for. With an internal modem, an Isco sampler will call up to five phone numbers to notify you of an alarm condition. With a digital cellular modem, the sampler can send text messages to your cell phone or pager. Both modems let you program an Isco Model 6712 sampler to dial-out when the selected conditions occur; i.e., program is complete, the sampler has been activated, the sampler has malfunctioned during its program, etc.
“From time to time, we’d like to install an area velocity sensor where it may be dry for long periods between storm events. I’ve heard that an area velocity sensor must always be covered with water to assure accurate readings. Is this true?”That advice applies to most AV sensors, but not to those on Isco’s 2150 Flow Modules. Typically, once water begins to flow over a “dry” AV sensor (say during a storm event), it cannot adjust for the sudden temperature change, resulting in wildly erroneous level readings - and requiring on-site recalibration before accurate readings can be expected.
Isco’s 2150 AV sensor is “temperature characterized” at the factory to prevent that situation. It automatically compensates and continues to deliver useful data. Contact your Isco Rep for more details.
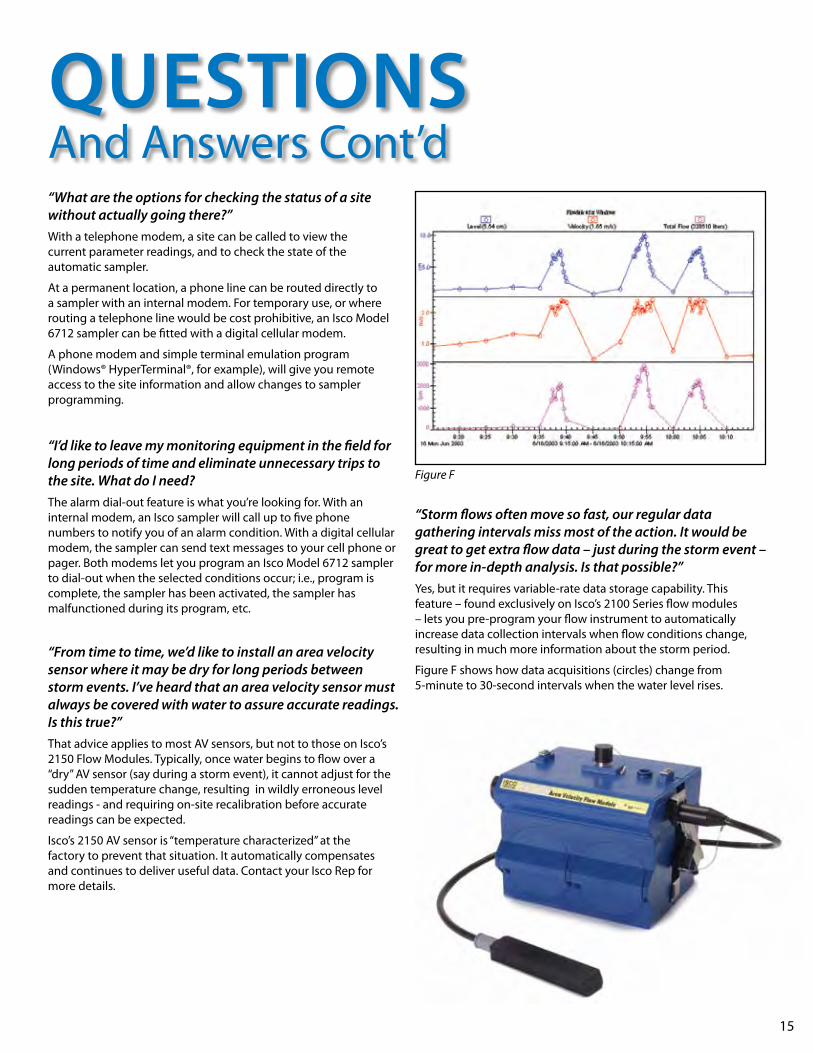
“Storm flows often move so fast, our regular data gathering intervals miss most of the action. It would be great to get extra flow data – just during the storm event – for more in-depth analysis. Is that possible?”Yes, but it requires variable-rate data storage capability. This feature – found exclusively on Isco’s 2100 Series flow modules – lets you pre-program your flow instrument to automatically increase data collection intervals when flow conditions change, resulting in much more information about the storm period.
Figure F shows how data acquisitions (circles) change from 5-minute to 30-second intervals when the water level rises.
QueSTIonSAnd Answers Cont’d
Figure F
16
References1. U.S. EPA. 1983. Results of the Nationwide Urban Runoff Program, Volume 1—Final Report. Office of Water.
Washington, D.C.
2. Driver, N.E., M.H. Mustard, R.B. Rhinesmith, and R.F. Middleburg. 1985. U.S. Geological Survey Urban Storm Water Data Base for 22 Metropolitan Areas Throughout the United States. Report No. 85–337 USGS. Lakewood, CO.
3. Washtenaw County Statutory Drainage Board. 1987. Huron River Pollution Abatement Program.
4. U.S. EPA. 1993. Investigation of Inappropriate Pollutant Entries Into Storm Drainage Systems— A User’s Guide. EPA 600/R–92/238. Office of Research and Development, Washington, DC.
5. U.S. EPA. 1992. Environmental Impacts of Storm Water Discharges: A National Profile. EPA 841–R–92–001. Office of Water, Washington, DC.
6. Schueler, T.R. 1994. ‘‘First Flush of Stormwater Pollutants Investigated in Texas.’’ Note 28. Watershed Protection Techniques 1(2).
7. 40 CFR Parts 9, 122, 123, and 124 National Pollutant Discharge Elimination System—Regulations for Revision of the Water Pollution Control Program Addressing Storm Water Discharges; Final Rule Report to Congress on the Phase II Storm Water Regulations.
8. U.S. EPA, 1997. Urbanization and Streams: Studies of Hydrologic Impacts. EPA 841–R–97-009. Office of Water, Washington, DC.
9. May, C.W., E.B. Welch, R.R. Horner, J.R. Karr, and B.W. May. 1997. Quality Indices for Urbanization Effects in Puget Sound Lowland Streams, Technical Report No.154. University of Washington Water Resources Series.
10. Schueler, T.R. 1994. ‘‘The Importance of Imperviousness.’’ Watershed Protection Techniques 1(3).
11. U.S. EPA. 1998. The National Water Quality Inventory, 1996 Report to Congress. EPA 841–R–97–008. Office of Water, Washington, DC.
Additional ReadingMay, C., R.R. Horner, J.R. Karr, B.W. Mar, and E.B. Welch. 1997. ‘‘Effects Of Urbanization On Small Streams In The Puget Sound Lowland Ecoregion.’’ Watershed Protection Techniques 2(4).
Yoder, C.O., R.J. Miltner, and D. White.1999. ‘‘Assessing the Status of Aquatic Life Designated Uses in Urban and Suburban Watersheds.’’
Proceedings: National Conference on Retrofits Opportunities in Urban Environments. EPA 625–R–99–002, Washington, DC; Yoder, C.O and R.J. Miltner. 1999. ‘‘Assessing Biological Quality and Limitations to Biological Potential in Urban and Suburban Watersheds in Ohio.’’
Cohn-Lee, R. and D. Cameron. 1992. ‘‘Urban Stormwater Runoff Contamination of the Chesapeake Bay: Sources and Mitigation.’’ The Environmental Professional, Vol. 14.
Makepeace, D.K., D.W. Smith, and S.J. Stanley. 1995. ‘‘Urban Storm Water Quality: Summary of Contaminant Data.’’ Critical Reviews in Environmental Science and Technology 25(2):93-139.
Marsalek, J. 1990. ‘‘Evaluation of Pollutant Loads from Urban Non-point Sources.’’ Wat. Sci. Tech. 22(10/11): 23– 30; Makepeace, et al., 1995.
U.S. Geological Survey (USGS). 1998. Research Reveals Link Between Development and Contamination in Urban Watersheds. USGS news release. USGS National Water-Quality Assessment Program.
Masterson, J. and R. Bannerman. 1994. ‘‘Impacts of Storm Water Runoff on Urban Streams in Milwaukee County, Wisconsin.’’ Paper presented at National Symposium on Water Quality: American Water Resources Association.
Novotny, V. and G. Chesters. 1989. ‘‘Delivery of Sediment and Pollutants from Nonpoint Sources: A Water Quality Perspective.’’ Journal of Soil and Water Conservation, 44(6):568–76.
Paterson, R.G., M.I. Luger, E.J. Burby, E.J. Kaiser, H.R. Malcolm, and A.C. Beard. 1993. ‘‘Costs and Benefits of Urban Erosion and Sediment Control: North Carolina Experience.’’ Environmental Management 17(2):167– 78.
Pitt, R., R. Field, M. Lalor, M. Brown 1993. ‘‘Urban stormwater toxic pollutants: assessment, sources, and treatability’’ Water Environment Research, 67(3):260–75.
Hydrologic Data Collection and Water Sampling, http://www.ars.usda.gov/Research/docs.htm?docid=12581
Parameters Monitored __ Rainfall Amount __ DO
__ Flow Rate __ Turbidity
__ Flow Depth __ pH
__ Temperature
Sampling Method __ Time-paced
__ Event-paced
__ Flow-paced
Samples Required __ Periodic
__ First-flush
__ Flow-weighted Composite
Site Conditions __ Easily Accessible
__ Remote
__ AC Power Available
__ Secure __Vulnerable
Channel Type and Condition __ Round Pipe
__ Lined (concrete, etc.)
__ Natural (earthen ditch)
__ Smooth __ Rough __Irregular
__ Surcharge Possible
__ Reverse Flow Possible
__ Submerged Flow Possible
__ Debris Likely Channel Length __________ ft.
Equipment Needed __ Rain Gauge
__ Rainfall Amount __ DO __Standard __Logging
__ Flow Meter __Ultrasonic __Submerged Probe
__Bubbler __A.V. __Other
__ Sampler __Portable __Stationary
__1 Bottle __4 Bottles
__12 Bottles __Other
__ Weir
__Flume
__ System Enclosure
__ Refrigeration
Data Retrieval/Communications __ Notebook PC on site
__ Data Transfer Device on site
__ Telephone Modem/Land Line
__ Alarm Dial-out
__ GSM/CDMA Cellular
__ Drive-up Wireless
__ Radio
__ Internet
__ Push data to server
__ Access data via internet browser
Notes:
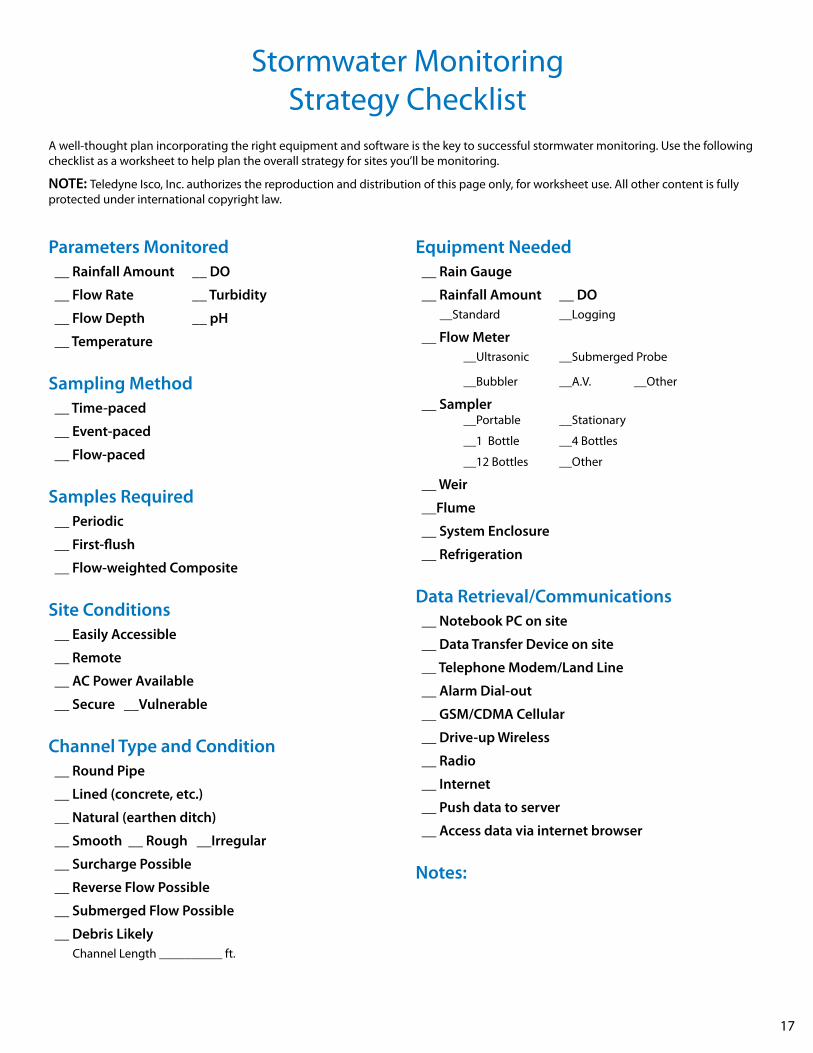
Stormwater Monitoring Strategy Checklist
A well-thought plan incorporating the right equipment and software is the key to successful stormwater monitoring. Use the following checklist as a worksheet to help plan the overall strategy for sites you’ll be monitoring.
NOTE: Teledyne Isco, Inc. authorizes the reproduction and distribution of this page only, for worksheet use. All other content is fully protected under international copyright law.
17
4700 Superior St., Lincoln, NE 68504 USAPhone: 800.228.4373 (USA and Canada), 402.464.0231
Fax: 402.465.3064E-mail: [email protected]
www.isco.com©2012 • L-1105 • 1/12