demystifying the pro-cyclicality of basel ii the pro-cyclicality of basel ii contents refresh of the...
TRANSCRIPT
DEMYSTIFYING THE PRO-CYCLICALITY OF BASEL II
Credit Teach-InCape TownThursday, 28 May 2009
Trevor AdamsTrevor AdamsNedbank Group
Demystifying the pro-cyclicality of Basel II
CONTENTS
Refresh of the key credit risk parameters and differences between Basel II vs IFRS
Pro-cyclicality of Basel II capital requirements
Role of Basel II in the global financial crisis
Changes coming in respect of pro-cyclicality due to the global financial crisis
2
Demystifying the pro-cyclicality of Basel II
CONTENTS
Refresh of the key credit risk parameters and differences between Basel II vs IFRS
Pro-cyclicality of Basel II capital requirements
Role of Basel II in the global financial crisis
Changes coming in respect of pro-cyclicality due to the global financial crisis
3
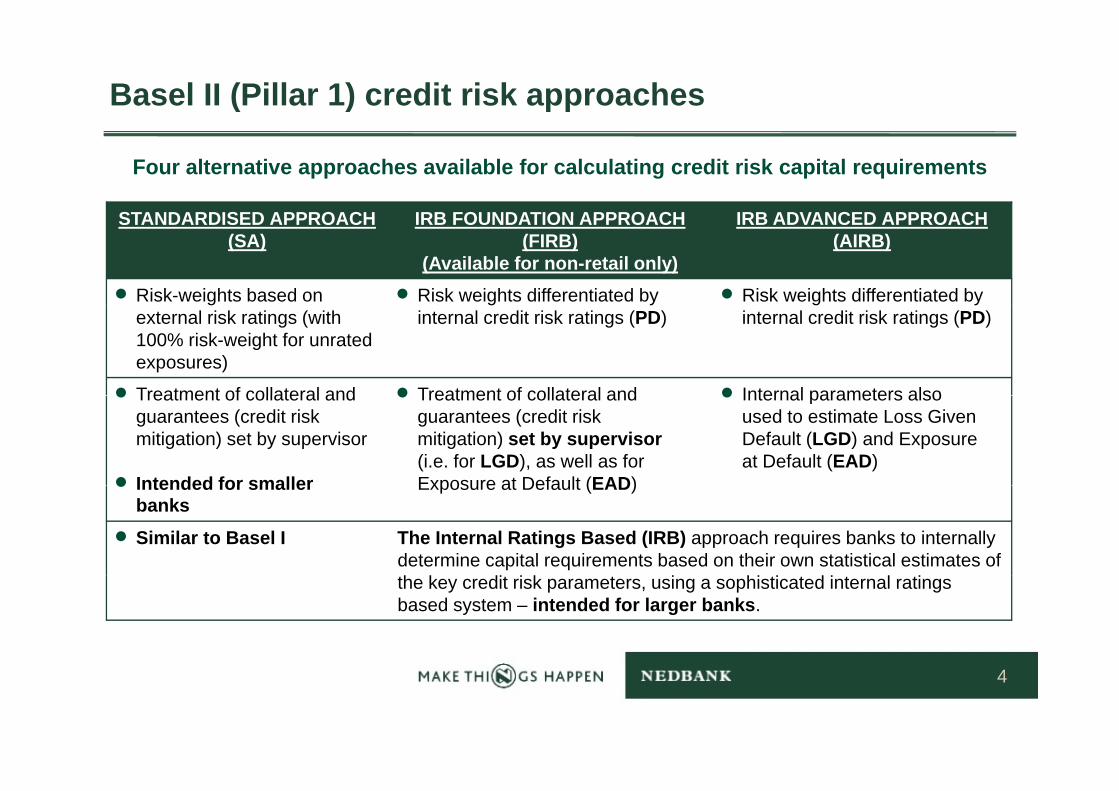
Basel II (Pillar 1) credit risk approaches
Four alternative approaches available for calculating credit risk capital requirements
STANDARDISED APPROACH IRB FOUNDATION APPROACH IRB ADVANCED APPROACHSTANDARDISED APPROACH (SA)
IRB FOUNDATION APPROACH (FIRB)
(Available for non-retail only)
IRB ADVANCED APPROACH (AIRB)
• Risk-weights based on • Risk weights differentiated by • Risk weights differentiated by external risk ratings (with 100% risk-weight for unrated exposures)
internal credit risk ratings (PD) internal credit risk ratings (PD)
• Treatment of collateral and • Treatment of collateral and • Internal parameters also• Treatment of collateral and guarantees (credit risk mitigation) set by supervisor
• Intended for smaller
• Treatment of collateral and guarantees (credit risk mitigation) set by supervisor (i.e. for LGD), as well as for Exposure at Default (EAD)
• Internal parameters also used to estimate Loss Given Default (LGD) and Exposure at Default (EAD)
• Intended for smaller banks
Exposure at Default (EAD)
• Similar to Basel I The Internal Ratings Based (IRB) approach requires banks to internally determine capital requirements based on their own statistical estimates of the key credit risk parameters, using a sophisticated internal ratings based system – intended for larger banks.
4
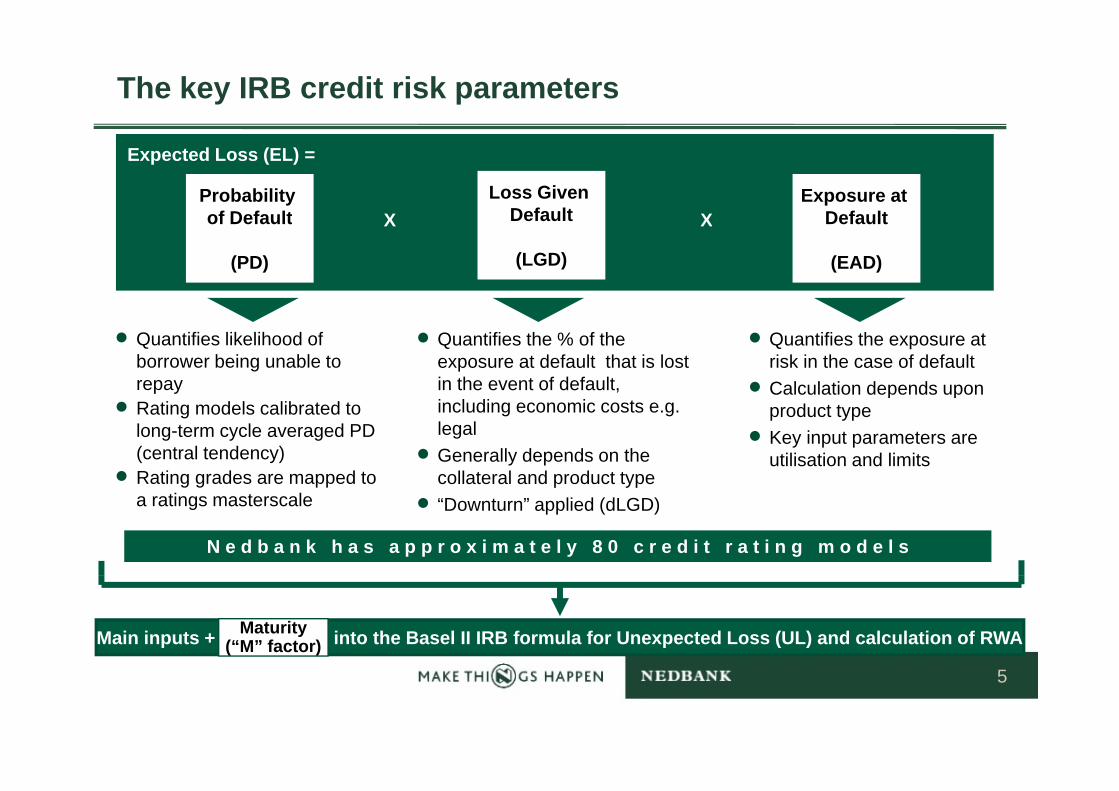
The key IRB credit risk parameters
Exposure at Default
Probability of Default
Loss Given DefaultX X
Expected Loss (EL) =
Default
(EAD)
of Default
(PD)
Default
(LGD)
X X
• Quantifies the % of the exposure at default that is lost in the event of default,
• Quantifies the exposure at risk in the case of default
• Calculation depends upon
• Quantifies likelihood of borrower being unable to repay
including economic costs e.g. legal
• Generally depends on the collateral and product type
p pproduct type
• Key input parameters are utilisation and limits
• Rating models calibrated to long-term cycle averaged PD (central tendency)
• Rating grades are mapped to p yp• “Downturn” applied (dLGD)
g g ppa ratings masterscale
N e d b a n k h a s a p p r o x i m a t e l y 8 0 c r e d i t r a t i n g m o d e l s
Main inputs + into the Basel II IRB formula for Unexpected Loss (UL) and calculation of RWAMaturity(“M” factor)
5

Probability of Default (PD)
Process of mapping a borrower’s score to a rating class and the Basel PD%
Lower PD
Upper 100100 0%0% 0,01%0,01%
Bank'sMasterscale
Basel"PD"
Implied PDBorrower’s scorefrom credit model
Nedbank’s Master Credit Rating ScaleMaster Rating Scale
calibration
range PD range
P01 0,00% 0,01% 0,012%
P02 0,012% 0,014% 0,017%
… … … …
P12 0,38% 0,45% 0,51%
… … …
55 0,4%0,4% 0,45%0,45%Example Example Example
P14 0,76% 0,905% 1,08%
… … … …
5050 1%1% 0,905%0,905%
Look Up Look Upb • Score
α • еP24 24% 29% 34%
P25 34% 41% 49%00 100%100% 41%41%
6

SARB’s IRB master rating scale(ie international scale, not a national / domestic scale)
PRESCRIBED PD BAND DESCRIPTIONPRESCRIBED RATING SCALE
ILLUSTRATIVE CLIENT / SEGMENTLower bound PD% Upper bound
PD %PERFORMING BOOK
00 No risk (political grade) 0.00001 Investment Grade 0.000 0.01202 Investment Grade 0.012 0.017 Large, international bank03 Investment Grade 0.017 0.024 South African Government04 Investment Grade 0.024 0.03405 Investment Grade 0.034 0.048 Large Corporateg p06 Investment Grade 0.048 0.06707 Investment Grade 0.067 0.09508 Investment Grade 0.095 0.13509 Investment Grade 0.135 0.19010 Investment Grade 0.190 0.26911 Investment Grade 0 269 0 38111 Investment Grade 0.269 0.38112 Transition: Investment to Sub 0.381 0.53813 Subinvestment Grade 0.538 0.76114 Subinvestment Grade 0.761 1.076 Average middle market client15 Subinvestment Grade 1.067 1.52216 Subinvestment Grade 1.522 2.15317 Subinvestment Grade 2.153 3.044 Average retail client18 Subinvestment Grade 3.044 4.30519 Subinvestment Grade 4.305 6.08920 Subinvestment Grade 6.089 8.61121 Subinvestment Grade 8.611 12.17722 Subinvestment Grade 12.177 17.22222 Subinvestment Grade 12.177 17.22223 Subinvestment Grade 17.222 24.35524 Subinvestment Grade 24.355 34.443 Low quality microloan25 Subinvestment Grade 34.443 99.999
NON PERFORMING BOOK (DEFAULT) Subinvestment Grade 34.443 99.999
7

Loss Given Default (LGD) calculation
• LGD represents the exposure, net of recoveries, lost in a client default
• Actual economic loss is measured and not Overall LGD Calculation Steps
Value
Overall LGD calculation steps
accounting loss• This means that all cashflows are discounted to
present values and hidden costs considered, such as those of administering problem loans
–
Value
−such as those of administering problem loans
• LGD strongly depends on the seniority of exposure, type of collateral and borrower
• LGD is also a facility specific measure
++
– =++
−
• Based on:• Historical default experience• Internal records on recoveries
EAD Collateral /Recovery
UnsecuredRecovery
AdminCosts
Cost ofCarry
EconomicLoss
• Both direct (legal, repossession) and indirect (collections dept) costs are included
• Differentiation between different types of b t t ll t l tE i L borrowers, structures, collateral, etc.
• Basel II requires downturn LGD (dLGD) to be used for regulatory capital calculations
LGD (%) = Economic Loss
Exposure at Default (EAD)
8

Exposure-at-Default (EAD) calculation
• EAD is a facility specific measure relevant where clients are granted credit limits which are not always fully utilised
Client at Default
ClientHealthy
Client at Default which are not always fully utilised
• Methodology is that a client will tend to draw on available facilities in the period immediately prior to defaultimmediately prior to default
• Different ‘k-factors’ (or ‘credit conversion factors’) are applied
• EAD = Utilisation + K factor *
Limit
• EAD = Utilisation + K-factor * (Limit – Utilisation)
• K-factor = % of unutilised limit that is expected to be drawn in case of default
Exposure at Default
expected to be drawn in case of default
• For committed credit lines to clients
Average Utilisation
• K-factors are derived from historical experience unless under FIRB (0% / 75%)
9

Expected Loss (EL) and Unexpected Loss (UL)
Expected Loss (EL) and Unexpected Loss (UL) are defined as the average and standard deviation, respectively, of the
Expected loss (EL)• Anticipated average annual loss rate• Foreseeable ‘cost’ of doing businessdistribution of potential losses inherent in
the bank’s credit portfolio• Foreseeable cost of doing business• Not ‘risk’ as investors think of it, but rather
a charge which affects anticipated yield • Equal to the mean (average) of losses over q ( g )
an economic cycle• Akin to provisioning (impairments), but
markedly different (explained later)
Creditlosses
Credit lossdistribution
Unexpected loss (UL)• Anticipated volatility of loss rateFuture loss
Past observed losses
• Results in volatility of returns over time• Unanticipated but inevitable• Therefore requires a balance sheet
“cushion” in the form of capital (i e cushionEL UL
potential
cushion in the form of capital (i.e. cushion adequate to absorb any unexpected losses that may occur)Time
UL
Probability
10
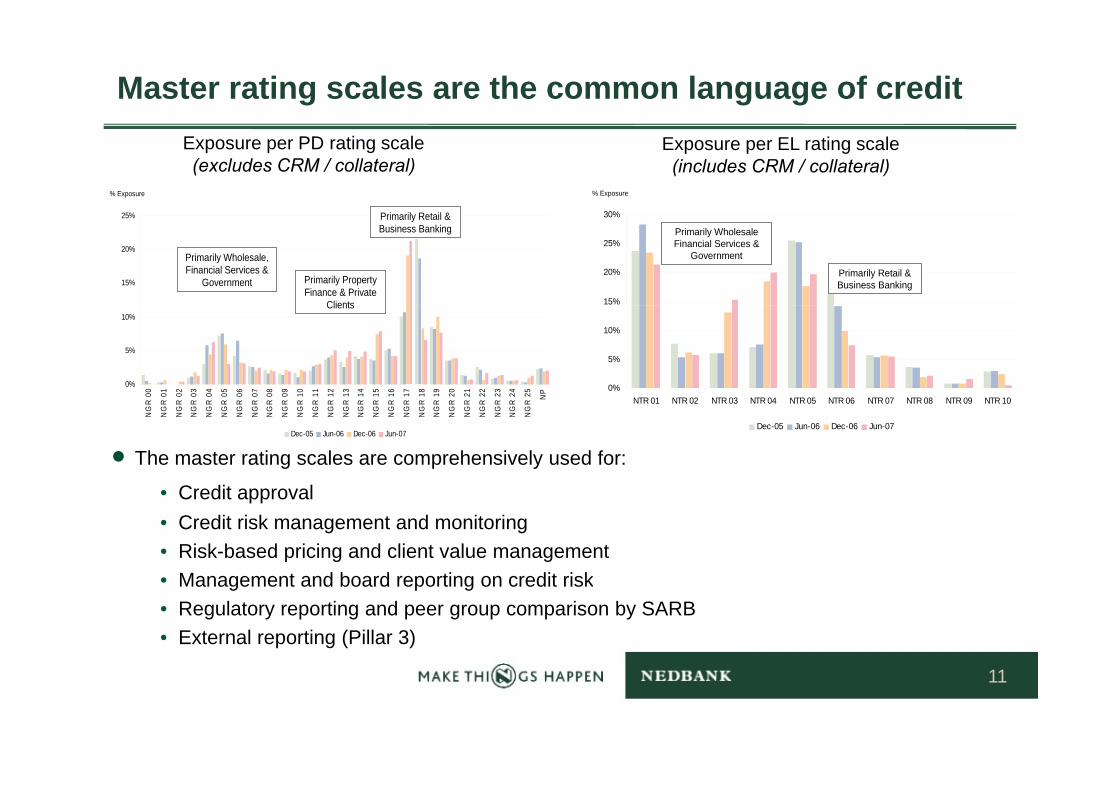
Master rating scales are the common language of credit Exposure per PD rating scale(excludes CRM / collateral)
Exposure per EL rating scale(includes CRM / collateral)
% Exposure
25% Primarily Retail & 30%
% Exposure
15%
20%
25%
Primarily Wholesale, Financial Services &
Government
Primarily Retail & Business Banking
Primarily Property Finance & Private
Clients 15%
20%
25%
30%
Primarily Wholesale Financial Services &
Government
Primarily Retail & Business Banking
0%
5%
10%
00 01 02 03 04 05 06 07 08 09 10 11 12 13 14 15 16 17 18 19 20 21 22 23 24 25 NP
Clients
0%
5%
10%
• The master rating scales are comprehensively used for:
C dit l
NG
R 0
NG
R 0
NG
R 0
NG
R 0
NG
R 0
NG
R 0
NG
R 0
NG
R 0
NG
R 0
NG
R 0
NG
R 1
NG
R 1
NG
R 1
NG
R 1
NG
R 1
NG
R 1
NG
R 1
NG
R 1
NG
R 1
NG
R 1
NG
R 2
NG
R 2
NG
R 2
NG
R 2
NG
R 2
NG
R 2 N
Dec-05 Jun-06 Dec-06 Jun-07
NTR 01 NTR 02 NTR 03 NTR 04 NTR 05 NTR 06 NTR 07 NTR 08 NTR 09 NTR 10
Dec-05 Jun-06 Dec-06 Jun-07
• Credit approval• Credit risk management and monitoring• Risk-based pricing and client value management
M t d b d ti dit i k• Management and board reporting on credit risk• Regulatory reporting and peer group comparison by SARB • External reporting (Pillar 3)
11

Core objectives of Basel II vs IFRS
BASEL II
• To promote the long-term sustainability of banks
• To further strengthen the safety and soundness of the banking industryTo further strengthen the safety and soundness of the banking industry
• Forward looking
IFRS
• To report on the financial position at a point-in-time and the results for the year
• Backward looking
12
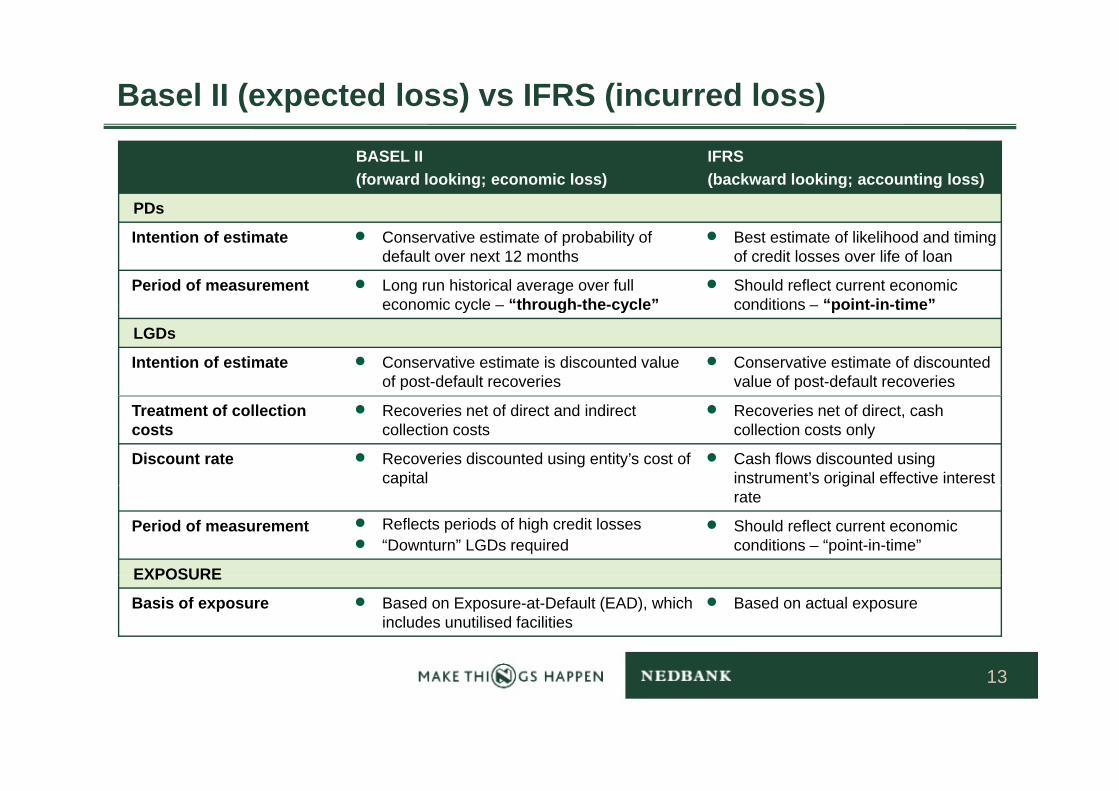
Basel II (expected loss) vs IFRS (incurred loss)
BASEL II(forward looking; economic loss)
IFRS(backward looking; accounting loss)
PDs
Intention of estimate • Conservative estimate of probability of default over next 12 months
• Best estimate of likelihood and timing of credit losses over life of loan
Period of measurement • Long run historical average over full economic cycle – “through-the-cycle”
• Should reflect current economic conditions – “point-in-time”economic cycle – through-the-cycle conditions – point-in-time
LGDs
Intention of estimate • Conservative estimate is discounted value of post-default recoveries
• Conservative estimate of discounted value of post-default recoveries
Treatment of collection costs
• Recoveries net of direct and indirect collection costs
• Recoveries net of direct, cash collection costs only
Discount rate • Recoveries discounted using entity’s cost of capital
• Cash flows discounted using instrument’s original effective interest p grate
Period of measurement • Reflects periods of high credit losses• “Downturn” LGDs required
• Should reflect current economic conditions – “point-in-time”
EXPOSUREEXPOSURE
Basis of exposure • Based on Exposure-at-Default (EAD), which includes unutilised facilities
• Based on actual exposure
13

Basel II (expected loss) vs IFRS (incurred loss)EXPECTED LOSS EXCEEDS INCURRED LOSS INCURRED LOSS EXCEEDS EXPECTED LOSS
Basel II IAS 39 Basel II IAS 39
(IMPAIRMENTS) (IMPAIRMENTS)
nexp
ecte
d lo
ss
otal
cap
ital
quire
men
t
d lo
ss
ital
ent
Un
ss apita
l uc
tion
To req
Une
xpec
ted
ss gibl
e er
2
apita
lTota
l cap
ire
quire
me
50% of Tier 1
Limited to 0,6% f dit RWA
Expe
cted
los
curr
ed
loss
Ca
dedu
pect
ed
loss In
curr
ed lo
s
Elig Ti Ca
50% of Tier 2of credit RWA
Inc l
Book value – PV of expected future cash flowsPD x dLGD x EAD
Exp l
Concept of “minimum regulatory provisions” now obsolete for IRB banks. Replaced by Expected Loss (EL) methodology and a requirement that EL be compared with accounting impairments under IFRS. The difference impacts qualifying capital
14

Demystifying the pro-cyclicality of Basel II
CONTENTS
Refresh of the key credit risk parameters and differences between Basel II vs IFRS
Pro-cyclicality of Basel II capital requirements
Role of Basel II in the global financial crisis
Changes coming in respect of pro-cyclicality due to the global financial crisis
15

Pro-cyclicality of Basel II capital requirements
Definition• Pro-cyclicality is the extent to which the buffer between available and required y y q
regulatory capital levels change as a direct result of changes in the economic cycle.
BackgroundBackground• Credit rating models are required to be calibrated based on long-term historic average
defaulted rates (“through-the-cycle”) of at least 5 years for retail and 7 years for wholesale but the actual level of PDs in any given year tend to represent a hybrid y g y p ybetween a pure cycle-neutral average and a point-in-time default rate
• Credit rating models calibrated to long-term average default rates are much less pro-cyclical than point-in-time rating models that are used for IFRS accounting purposes
• However, due to the fact that Basel PDs are generally hybrids between cycle-neutral d i t i ti d f lt t B l II dit RWA li land point-in-time default rates, Basel II credit RWAs are pro-cyclical
16
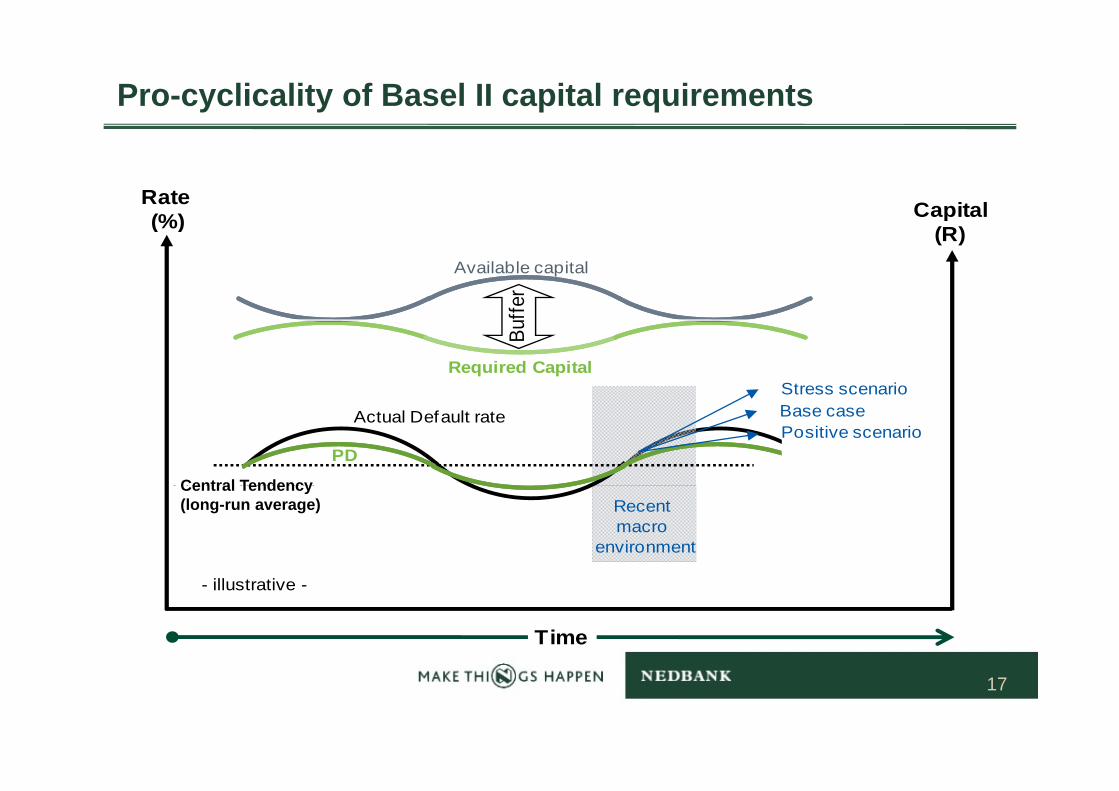
Pro-cyclicality of Basel II capital requirements
Rate (%) Capital
Procyclical “hybrid” PDs in the economic cycle and impact on capital adequacy
(%) Capital(R)
Available capital
er
Stress scenarioRequired Capital
Buffe
PD
Central Tendency
Base casePositive scenario
Actual Default rate
Central TendencyRecent macro
environment
Central TendencyCentral Tendency (long-run average)
- illustrative -
Time
17

Pro-cyclicality of Basel II capital requirements
-Illustrative-
• Basel II (“risk sensitive”) vs Basel I• Basel II regulatory capital
requirements (particularly for credit q (p yrisk) fluctuate over an economic cycle
• Pro-cyclicality of default probabilities (PD)
Available capital
CapitalExpansion Recession
• Pro-cyclicality of collateral values and recovery rates (LGD) but use dLGD
• Pro cyclicality in limit utilisation
Basel II regulatory capital
Buffer
20% 10%
• Pro-cyclicality in limit utilisation (EAD)
• Available capital resources also fluctuate due to earnings volatility
capital
fluctuate due to earnings volatility• Higher default rates leading to
higher impairments• Lower earnings volume• Asset write downs (esp fair value
MTM accounting)Time
Lower risk Higher risk
18
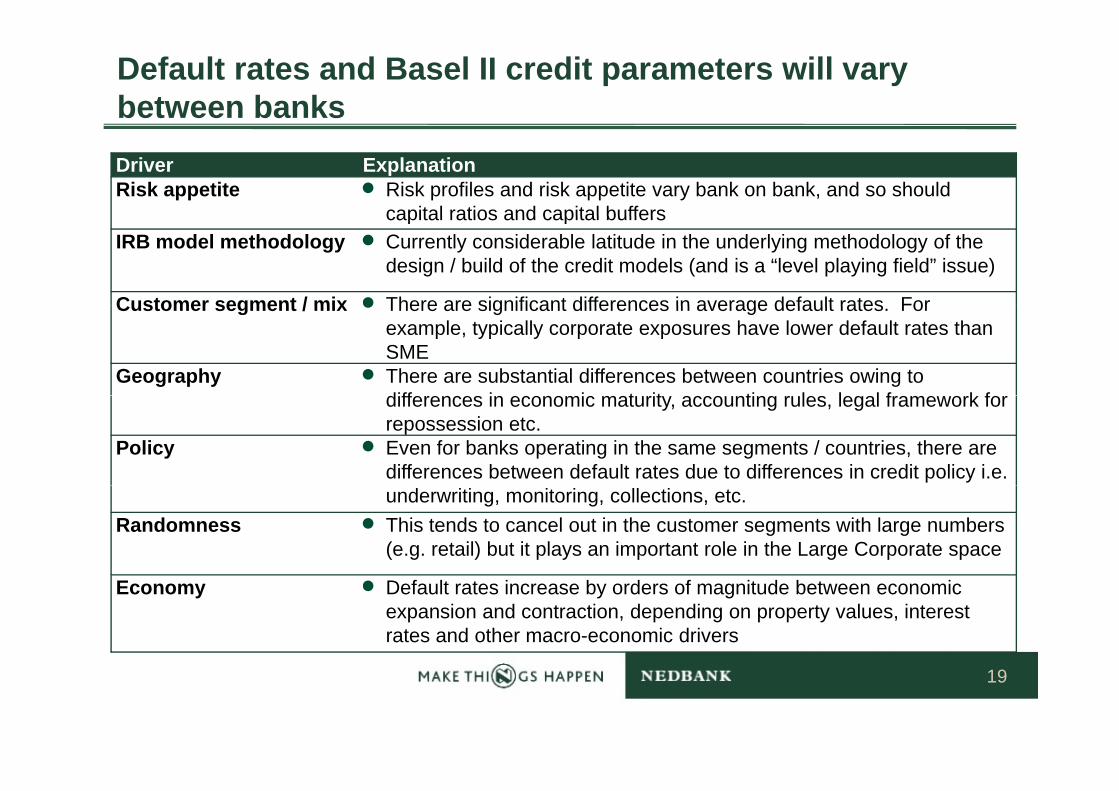
Default rates and Basel II credit parameters will vary between banksDriver ExplanationRisk appetite • Risk profiles and risk appetite vary bank on bank, and so should
capital ratios and capital bufferscapital ratios and capital buffersIRB model methodology • Currently considerable latitude in the underlying methodology of the
design / build of the credit models (and is a “level playing field” issue)
Customer segment / mix • There are significant differences in average default rates ForCustomer segment / mix • There are significant differences in average default rates. For example, typically corporate exposures have lower default rates than SME
Geography • There are substantial differences between countries owing to diff i i t it ti l l l f k fdifferences in economic maturity, accounting rules, legal framework for repossession etc.
Policy • Even for banks operating in the same segments / countries, there are differences between default rates due to differences in credit policy i.e. underwriting, monitoring, collections, etc.
Randomness • This tends to cancel out in the customer segments with large numbers (e.g. retail) but it plays an important role in the Large Corporate space
Economy • Default rates increase by orders of magnitude between economic expansion and contraction, depending on property values, interest rates and other macro-economic drivers
19

In practice most PD models are not “Through-the-Cycle” (by construction)
External Agency RatingsMerton based models
“Through-the-cycle” (TTC)“Point-in-time” (PIT) “Hybrid”
External Agency Ratings
Retail behavioural models
Merton based models
Retail application models
Wholesale / corporate models – scorecard basedWholesale / corporate models – cashflow based
• A pure PIT model would be 100% responsive to changes in credit environment, and should always predict PD equal to observed default
t
• Pure TTC models would be completely invariant to cycle movements, with predicted default rate always equal to long-term cycle
• Most PD models are somewhere between the two extremes, and exhibit dampened cyclicality vis-à-vis actual default / loss rates
rate
• Factors such as delinquency and limit utilisation vary strongly through the cycle, bringing cyclicality to the PD estimates
average
• Factors such as demographic factors tend to be stable through the cycle and contribute to dampening model cyclicality0.9
1.1
1.3
1.5
1.7
1.9 PiTHybridTTCPD estimates model cyclicality
0.3
0.5
0.7
1
• PIT estimates correspond to actual default rates which guide
• Pillar 1 credit RWA is calculated based upon actual model output
• Pillar 1 RWA should theoretically be calculated from TTC PD’s but it’sdefault rates, which guide
impairmentsbased upon actual model output, and is thus partially pro-cyclical
calculated from TTC PD s but it s impossible to build such models directly without a macro overlay as most credit risk factors / drivers tend be somewhat cyclical by nature
20
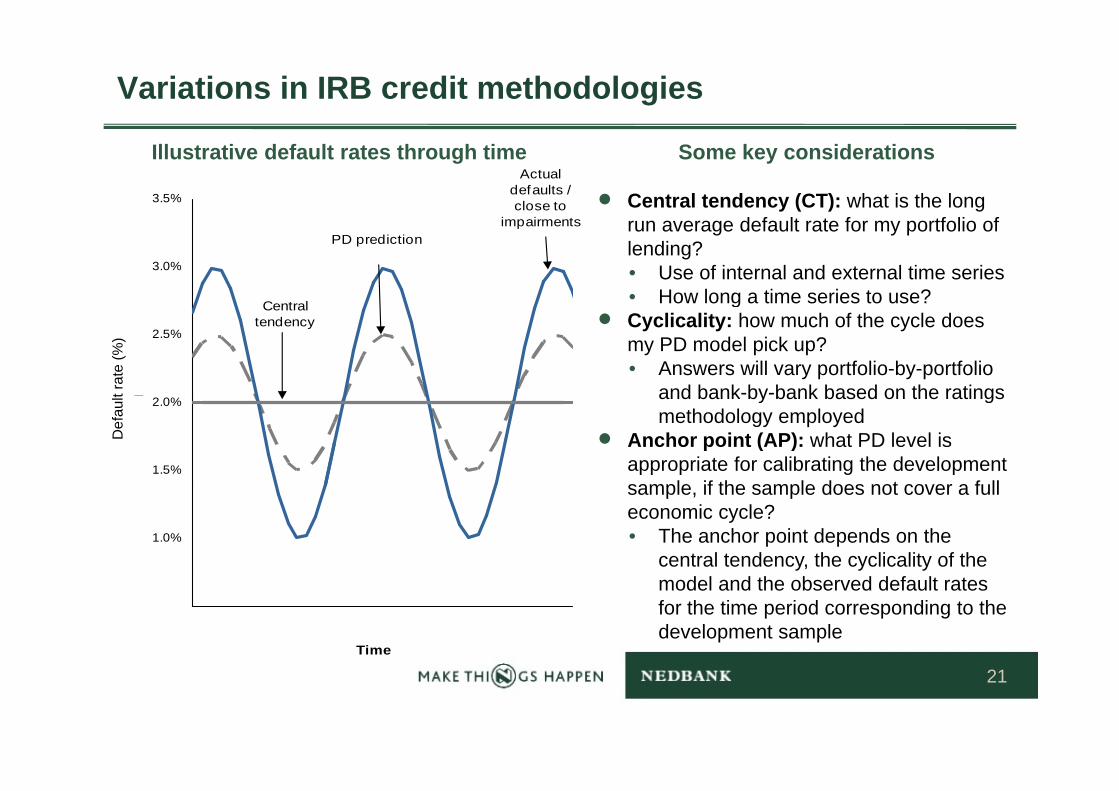
Variations in IRB credit methodologies
Illustrative default rates through time Some key considerations
• Central tendency (CT): what is the long 3.5%
Actual defaults / close to
run average default rate for my portfolio of lending?• Use of internal and external time series• How long a time series to use?
3.0%
Central
PD predictionimpairments
g• Cyclicality: how much of the cycle does
my PD model pick up?• Answers will vary portfolio-by-portfolio
and bank-by-bank based on the ratings
2.5%
lt ra
te (%
)
Central tendency
t rat
e (%
)
and bank by bank based on the ratings methodology employed
• Anchor point (AP): what PD level is appropriate for calibrating the development sample if the sample does not cover a full
1.5%
2.0%
Def
aul
Def
ault
sample, if the sample does not cover a full economic cycle? • The anchor point depends on the
central tendency, the cyclicality of the 1.0%
model and the observed default rates for the time period corresponding to the development sample
0.5%1980 1985 1990 1995 2000
Time
21
Demystifying the pro-cyclicality of Basel II
CONTENTS
Refresh of the key credit risk parameters and differences between Basel II vs IFRS
Pro-cyclicality of Basel II capital requirements
Role of Basel II in the global financial crisis
Changes coming in respect of pro-cyclicality due to the global financial crisis
22

Role of Basel II in the Global Financial Crisis
Some shortcomings in Basel II
• Risk measurement / capture in pillar 1 (ie in trading book, securitisations and
counterparty credit risk)
• Pro cyclicality in Basel II• Pro-cyclicality in Basel II
– And no “general provision” allowed
• Use of and reliance on external ratingsUse of and reliance on external ratings
But there always existed to compensate
• Internal Capital Adequacy Assessment Process (ICAAP)p q y ( )
• Supervisory Review and Evaluation Process (SREP) by Regulator
• Pillar 3 (too early for benefits)
Pillar 2
23

ICAAP is Basel II “end-to-end”
• ICAAP = best practice “enterprise-wide risk management” and is FORWARD LOOKING!• Properly implemented and consistently applied, ICAAP will provide the management information to p y p y pp , p g
help control and optimise risk, and ensure financial sustainability• Its effectiveness, however, is pervasively influenced by a bank’s risk culture and governance, active
and consistent CEO and Board support, and the operating business model
24

Timing and scope of Basel II• In the USA, Basel II was delayed
• In Europe, UK and South Africa, only live from 2008
BUT MORE IMPORTANTLY
• Basel II mostly only applied to commercial banks (ie deposit taking institutions)• Basel II mostly only applied to commercial banks (ie deposit-taking institutions)
• US investment banks were largely unregulated – ie Basel II would not have applied (they drove the excessive “originate and sell” mentality ~ using exotic derivatives to disguise toxic sub-prime assets)sub-prime assets)
• Credit derivatives market unregulated (a flaw admitted to by Alan Greenspan)
• Negative impacts of IFRS accounting rules (MTM / Fair value = “mark to fear”)
• No regulations to prevent:
• irresponsible lending practices” (unlike NCA in South Africa)
• excessive leverage ratios
25
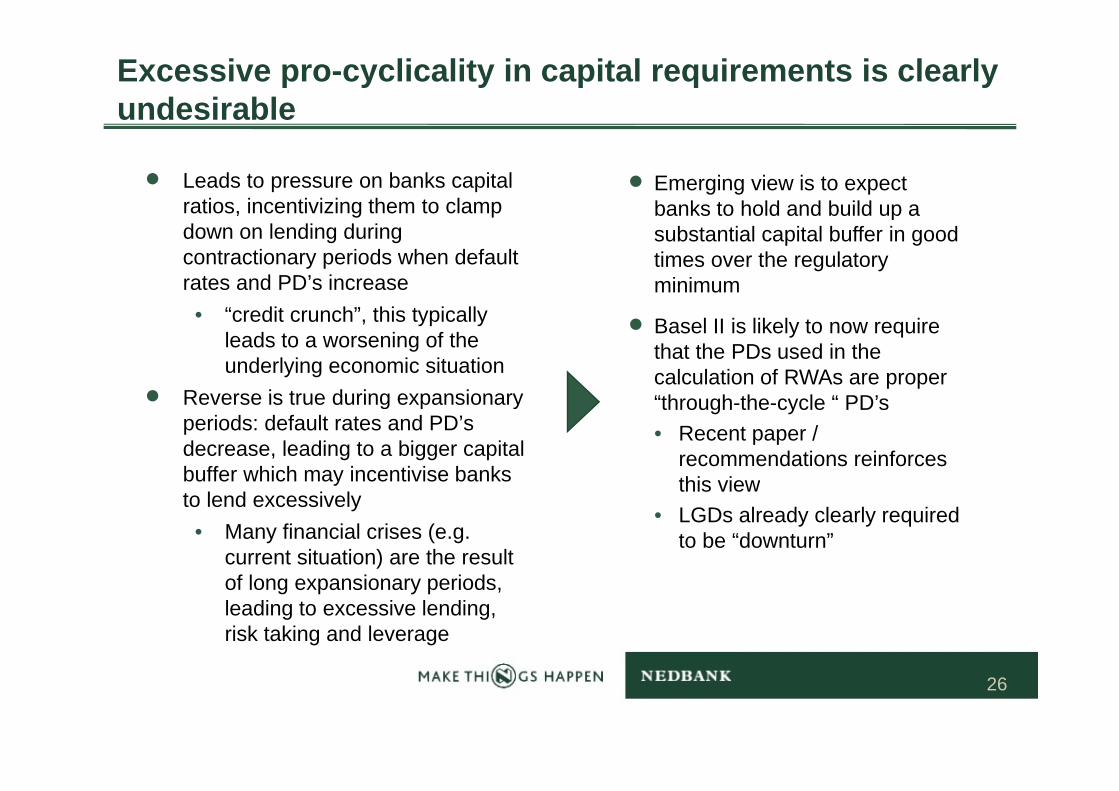
Excessive pro-cyclicality in capital requirements is clearly undesirable
• Leads to pressure on banks capital ratios, incentivizing them to clamp
• Emerging view is to expect banks to hold and build up a , g p
down on lending during contractionary periods when default rates and PD’s increase
psubstantial capital buffer in good times over the regulatory minimum
• “credit crunch”, this typically leads to a worsening of the underlying economic situation
• Reverse is true during expansionary
• Basel II is likely to now require that the PDs used in the calculation of RWAs are proper “th h th l “ PD’• Reverse is true during expansionary
periods: default rates and PD’s decrease, leading to a bigger capital buffer which may incentivise banks
“through-the-cycle “ PD’s• Recent paper /
recommendations reinforces this viewy
to lend excessively• Many financial crises (e.g.
current situation) are the result f l i i d
this view• LGDs already clearly required
to be “downturn”
of long expansionary periods, leading to excessive lending, risk taking and leverage
26

Demystifying the pro-cyclicality of Basel II
CONTENTS
Refresh of the key credit risk parameters and differences between Basel II vs IFRS
Pro-cyclicality of Basel II capital requirements
Role of Basel II in the global financial crisis
Changes coming in respect of pro c clicalit d e toChanges coming in respect of pro-cyclicality due to the global financial crisis
27
Changes coming in respect of pro-cyclicality due to the global financial crisisReport of the Financial Stability Forum (Board) on addressing pro-cyclicality in the financial systemOverview of recommendations (April 2009)
g
Capital“The objective of the measures below is to ensure that the Basel II capital framework promotes prudent capital buffers over the credit cycle and mitigates the risk that the
l t it l f k lifi th t i i f h k b t th fi i l dregulatory capital framework amplifies the transmission of shocks between the financial and real sectors. An integrated package of measures covering the recommendations should be issued for consultation before the end of 2009”.
• Strengthen capital framework so that the quality and level of capital in the banking system increase during strong economic conditions and can be drawn down during periods of economic and financial stress
• Revise the market risk framework of Basel II to reduce the reliance on cyclical VaR-based capitalRevise the market risk framework of Basel II to reduce the reliance on cyclical VaR based capital estimates
• Supplement the risk-based capital requirement with a simple, non-risk based measure to help contain the build-up of leverage
• E h d t t ti (Pill 2) t lid t th d f b k ’ it l b ff• Enhanced stress testing (Pillar 2) to validate the adequacy of banks’ capital buffers• Make appropriate adjustments to dampen excessive cyclicality of the minimum capital
requirements – eg excessive impact of rating migrations on regulatory capital requirements
28

Changes coming in respect of pro-cyclicality due to the global financial crisis• Regular assessments of the risk coverage of Basel II and banks’ evolving risk profiles and make
timely enhancements
g
Provisioning
“Earlier recognition of credit losses could have dampened cyclical moves in the current i i U d th t ti i t f i d l d l i i fcrisis. Under the current accounting requirements of an incurred loss model, a provision for
credit losses is recognised only when a loss impairment event or events have taken place that are likely to result in non-payment of a loan in the future. Identification of the loss event is a difficult and subjective process that results in a range of practice and, potentially, ais a difficult and subjective process that results in a range of practice and, potentially, a failure to fully recognise existing credit losses earlier in the credit cycle. Earlier identification of credit losses is consistent both with financial statement users’ needs for transparency regarding changes in credit trends and with prudential objectives of safety and soundness”.
• FASB and IASB should reiterate that existing standards require the use of judgement to determine an incurred loss for provisioning of credit losses
• FASB and IASB should reconsider the incurred loss model – dynamic provisioning? (ala Spain)• Review of Basel II to assess the adequacy of disclosure of credit loss provisioning under Pillar 3
29
Changes coming in respect of pro-cyclicality due to the global financial crisisValuation and leverage
“A number of developments in financial systems – including increased direct and embedded leverage leverage funded with short-term debt more marketable assets and extensive
g
leverage, leverage funded with short term debt, more marketable assets, and extensive application of fair value accounting – have contributed to an increase in the pro-cyclicality of the system.
The procyclical effects arising from the interplay between leverage and valuation need to be assessed from a macro-prudential perspective. Regulators and supervisors should obtain a clear and comprehensive picture of aggregate leverage and liquidity and have the necessary tools to trigger enhanced surveillance if necessary”necessary tools to trigger enhanced surveillance if necessary .
• Use of constraints on leverage and liquidity margins as macro-prudential tools for supervisory purposes
• Measure funding and liquidity risk attached to maturity transformation, enabling the better pricing of liquidity risk in the financial system
• Examine the use of valuation reserves or adjustments for fair valued financial instruments when data or modelling needed to support their valuation is weakdata or modelling needed to support their valuation is weak
• Examine possible changes to relevant standards to dampen adverse dynamics potentially associated with fair value accounting
30

Changes coming in respect of pro-cyclicality due to the global financial crisisSEC study in the USA on MTM fair value accounting - recommendations
g
• SEC recommended against the suspension of fair value MTM rules
• Reconsider accounting for impairments (eg dynamic provisioning)
• Guidance for determining fair value in inactive markets
• Stress testing / scenario planning
• Better governance and valuation controls• Better governance and valuation controls
• Risk management (eg skills and concentration risk)
• More transparency and disclosure
31

Changes coming in respect of pro-cyclicality due to the global financial crisis
Turner Report (FSA, March 2009)
g
• Capital required against trading book activities should be increased significantly (e.g. several times) and a fundamental review of the market risk capital regime (eg reliance on VAR measures for regulatory purposes) should be launchedfor regulatory purposes) should be launched
• Regulators should take immediate action to ensure that the implementation of the current Basel II capital regime does not create unnecessary pro-cyclicality; this can be achieved by using “through the cycle” rather than “point in time” measures of probabilities of default
• A counter cyclical capital adequacy regime should be introduced with capital buffers• A counter-cyclical capital adequacy regime should be introduced, with capital buffers which increase in economic upswings and decrease in recessions
• Published accounts should also include buffers which anticipate potential future losses, through, p p , g ,for instance, the creation of an “Economic Cycle Reserve”
32

Changes coming in respect of pro-cyclicality due to the global financial crisis
• A maximum gross leverage ratio should be introduced as a backstop discipline against excessive
g
growth
• Liquidity regulation and supervision should be recognised as of equal importance to capital regulationregulation
• Credit rating agencies
• Should be subject to registration and supervision
• Fundamental review of the use of structured finance ratings in the Basel II framework
• Credit Default Swap (CDS) market infrastructure
• Clearing and central counterparty systems should be developed
33

Thank you
QUESTIONSQUESTIONS
34