new evidence on real wage cyclicality …gsolon/workingpapers/wage104.pdf · new evidence on real...
TRANSCRIPT
NEW EVIDENCE ON REAL WAGE CYCLICALITY
WITHIN EMPLOYER-EMPLOYEE MATCHES
Donggyun Shin, Hanyang University
Gary Solon, University of Michigan
December 2004
Abstract: In the most thorough study to date on wage cyclicality among job stayers,
Devereux’s (2002) analysis of men in the Panel Study of Income Dynamics produced two
puzzling findings: (1) the real wages of salaried workers are noncyclical, and (2) wage
cyclicality among hourly workers differs between two alternative wage measures. We
examine these puzzles with additional evidence from other sources. Devereux’s finding of
noncyclical real wages among salaried job stayers is not replicated in the National
Longitudinal Survey of Youth data. The NLSY data, however, do corroborate his finding of
a discrepancy for hourly workers between the cyclicality of the two alternative wage
measures. Evidence from the PSID Validation Study contradicts Devereux’s conjecture that
the discrepancy might be due to a procyclical bias from measurement error in average hourly
earnings. Evidence from the Bureau of Labor Statistics establishment survey supports his
hypothesis that overtime work accounts for part (but not all) of the discrepancy. We
conclude that job stayers’ real average hourly earnings are substantially procyclical and that
an important portion of that procyclicality probably is due to compensation beyond base
wages.
New Evidence on Real Wage Cyclicality within Employer-Employee Matches
Until a few years ago, macroeconomists firmly believed that real wages in the
United States (and elsewhere) are nearly noncyclical, showing little systematic variation
between recessions and expansions. This conventional wisdom was based on a long history
of aggregate time series evidence. The stylized fact of weak wage cyclicality spawned
numerous macroeconomic theories designed to explain how large cyclical swings in
employment could be accompanied by relatively little wage variation. These theories
included efficiency wage models, implicit contract models in which employers provide real
wage insurance to workers, and insider-outsider models.1
More recently, a series of studies based on longitudinal microdata has demonstrated
that real wages in the United States actually are quite procyclical, rising more rapidly in
expansions than in recessions.2 As shown in Solon, Barsky, and Parker (1994), the true
procyclicality of real wages is obscured in aggregate time series data because of a
composition bias: the aggregate statistics are constructed in a way that gives more weight to
low-skill workers during expansions than during recessions. In contrast, studies based on
longitudinal microdata have been able to avoid composition bias by following the same
workers over time.
Some of these studies – such as Bils (1985) and Shin (1994) – have noted that the
wage procyclicality revealed by longitudinal data is especially pronounced among workers
who change employers. It is not surprising that workers who change employers in an
1 Blanchard and Fischer (1989:19), for example, declared, “The correlation between changes in real wages and changes in output or employment is usually slightly positive but often statistically insignificant,” and then they devoted much of their Chapters 7-9 to discussing theories designed to account for weak wage cyclicality. See Solon and Barsky (1989) for a detailed summary of the time series evidence and Solon, Barsky, and Parker (1994) for a discussion of the ways in which that evidence influenced macroeconomic theory. 2 Much of this literature is reviewed in Section IV of Solon, Barsky, and Parker (1992).
1
expansion tend to enjoy wage gains, while workers displaced from their jobs in a recession
tend to suffer wage losses. But several studies – including Bowlus (1993), Solon, Barsky,
and Parker (1994), Shin (1994), and Shin and Shin (2002) – also have found substantial wage
procyclicality among workers who stay with the same employer.
In the most thorough research to date on wage cyclicality among job stayers,
Devereux (2002) studied male stayers in the Panel Study of Income Dynamics (PSID).3 The
special features of Devereux’s analysis were: (1) by focusing on workers who stayed with the
same employer and held only one job, he obtained cleaner measures of wage change within
employer-employee matches; (2) he disaggregated his analysis between salaried workers and
workers paid by the hour; and (3) he compared two different wage measures. Most other
longitudinal studies of wage cyclicality had used the ratio of annual earnings to annual hours
of work, henceforth “average hourly earnings.” Devereux also used a directly reported
hourly wage or per-period salary. While replicating many of the results in earlier research,
Devereux’s analysis also generated two puzzling findings. First, he found very little wage
cyclicality among salaried workers, indicating virtually no tendency for better raises in “good
times.” Second, for hourly workers, he got discrepant results between the two wage
measures. Like other researchers, he estimated substantial procyclicality in average hourly
earnings, but he found almost no cyclicality in the directly reported hourly wage.
In this article, we further explore these puzzles by complementing the evidence from
the PSID with additional data from the National Longitudinal Survey of Youth (NLSY), the
PSID Validation Study, and the Bureau of Labor Statistics establishment survey. We
investigate which of Devereux’s PSID results are replicated in the NLSY, and we use the
3 See Solon, Barsky, and Parker (1994) for evidence on the cyclicality of women’s real wages.
2
other two data sources to investigate the extent to which Devereux’s findings might be
explained by measurement error or overtime pay.
Econometric Methods and Data
Following Bils (1985), most longitudinal studies of real wage cyclicality have
estimated the model
(1) itittit XtUw εαδβ +′++∆=∆ ln
where is the difference between the natural logarithm of worker ’s real wage rate
in year and his log real wage in year
itwln∆ i
t 1−t . The explanatory variable of main interest is
, the year-to-year change in the annual national unemployment rate. Its coefficient tU∆ β
is negative, zero, or positive as the real wage is procyclical, noncyclical, or countercyclical.
The regression also includes a linear time trend and a vector containing an intercept and
measures of the individual’s work experience. Devereux (2002), for example, used a cubic
in potential work experience (age minus years of schooling minus 6) and, in his analyses
restricted to job stayers, a cubic in tenure with employer. Note that time-invariant
individual-specific characteristics that influence wages in levels are “differenced out” in the
measurement of year-to-year change.
itX
The conventional standard error estimates accompanying ordinary least squares
(OLS) estimation of equation (1) would be misleading because the error term itε is
correlated across individuals in the same year. Solon, Barsky, and Parker (1994), Shin
(1994), Solon, Whatley, and Stevens (1997), and Devereux (2002) therefore implemented the
estimation in two steps. The first step applies OLS to the regression of on
and a vector of year dummy variables. The second step obtains estimates of
itwln∆ itX
β and δ by
applying least squares to the regression of the year effects estimated in the first step on tU∆
3
and . Unlike the earlier studies, which used OLS in the second step, Devereux used
weighted least squares (WLS), weighting each year’s observation by the number of
individuals available for that year in the first-step estimation. The issue of optimal
weighting is discussed in detail by Amemiya (1978), Dickens (1990), and Solon, Whatley,
and Stevens (1997). For the sake of comparability with Devereux, we will report results
based on imitating his WLS approach, but we have checked that using alternative weighting
schemes leads to similar results.
t
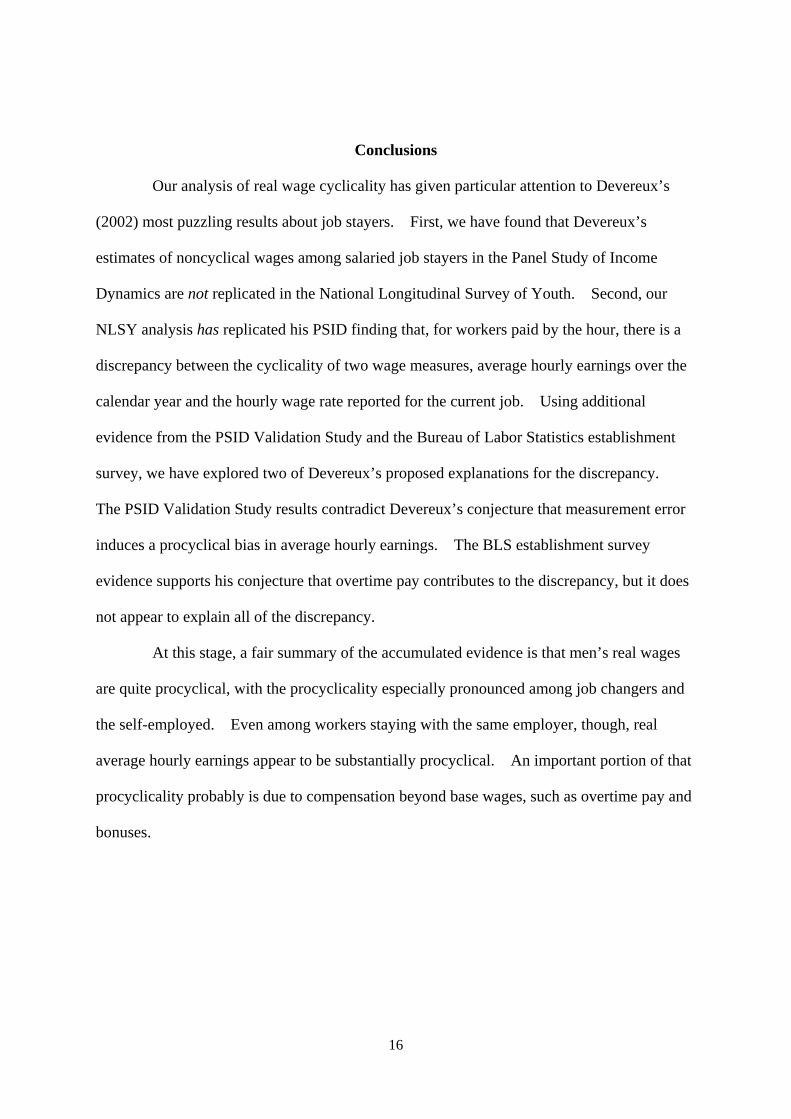
Most longitudinal studies of wage cyclicality have used general samples including
job changers as well as stayers and with the wage measured as “average hourly earnings,”
that is, the ratio of annual earnings to annual hours of work. For example, with a PSID
sample of men observed from 1967-68 through 1986-87, Solon, Barsky, and Parker (1994)
estimated β at -.0140, indicating that, when the unemployment rate rises by an additional
percentage point, real wage growth tends to decline by about 1.4 percentage points. As
shown in the first entry of Table 1, Devereux’s corresponding estimate from PSID data for
1970-71 through 1990-91 was -.0116.4 The next entry in the first column of Table 1 shows
that Devereux’s declined in magnitude to -.0101 when he dropped the self-employed
from the sample.
β̂
The third entry shows that Devereux estimated β at -.0081 when he restricted his
sample to workers staying with the same employer from one year to the next. That estimate
compares to Solon, Barsky, and Parker’s (1994) estimate of -.0124 and Shin’s (1994)
estimate of -.0095 for young men in the National Longitudinal Surveys of labor market
4 Thanks to the remarkable thoroughness with which Devereux reported his methods, we have been able to replicate his PSID results almost exactly. Consequently, our tables comparing PSID results to NLSY results simply restate his PSID estimates instead of listing our own. The one exception is that we present our PSID results for manufacturing because Devereux did not analyze that particular sector.
4
experience. Next, to avoid contaminating the wage measure with earnings from additional
jobs, Devereux restricted his sample to stayers with no extra jobs and reestimated β at
-.0054. While tending to be somewhat smaller than the estimates from earlier studies,
Devereux’s initial estimates of wage procyclicality were still substantial and statistically
significant.
One point of our paper is to replicate Devereux’s analyses with a different data
source, the NLSY. This survey began in 1979 with a national sample then between the ages
of 14 and 22, reinterviewed the sample each year until 1994, and then switched to biennial
interviews. In light of the NLSY’s restriction to this cohort, Devereux’s decision to use the
PSID instead is easy to understand. On the other hand, besides affording a “second
opinion,” the NLSY also provides one other major advantage: because the NLSY makes a
point of recording employer identifiers, it avoids the PSID’s notorious difficulties with
distinguishing job changers and stayers (Brown and Light, 1992). We analyze wage
cyclicality among the NLSY men for the years 1979-80 through 1992-93. We stop at 1993
because, with the switch to biennial interviewing, that is the last year for which annual
earnings and hours (reported for 1993 in the 1994 interview) and a directly reported hourly
wage or per-period salary (reported contemporaneously in 1993) are both available. Like
Devereux, we convert our nominal wage variables into real wages with the Personal
Consumption Expenditure deflator. Also like Devereux, we use an “unbalanced panel”
containing every year-to-year-change for which both years’ observations meet our sample
restrictions. In particular, we use person-years in which the person is at least 16 years old,
his annual work hours are at least 300, and both of his hourly wage measures are between $1
and $500 in 1987 dollars.
5
The second column of Table 1 shows our NLSY-based estimates of wage cyclicality
corresponding to Devereux’s PSID-based estimates in the first column. Our estimates,
ranging from -.0137 for the full sample to -.0113 for job stayers with no extra jobs, run
somewhat higher than Devereux’s and are quite similar to the estimates in earlier studies.
Our estimates are subject to larger standard errors than Devereux’s mainly because they are
based on fewer years. Like Devereux’s estimates, ours become successively smaller in
magnitude as we exclude the self-employed, job changers, and stayers with extra jobs.
In the remainder of this paper, we use the NLSY and other data sources to explore
Devereux’s most surprising findings about stayers with no extra jobs: (1) the absence of wage
cyclicality among salaried workers and (2) discrepant results between the two wage measures
for workers paid by the hour.
Salaried Workers
Data limitations confined Devereux’s analysis of salaried job stayers in the PSID to
the narrower time period from 1976-77 through 1990-91. In addition to the average hourly
earnings variable used in Table 1 and in most previous research, Devereux also used an
alternative wage measure, the worker’s report of his per-period salary rate in his current job.
With either wage measure, Devereux found little evidence that salaried job stayers receive
better raises in expansion years than in recession years. For example, as shown in the first
column of Table 2, for salaried job stayers with no extra jobs, he estimated the wage
cyclicality parameter β at only -.0008 with the average hourly earnings variable and -.0028
with the per-period salary variable. While these point estimates are small, it also is true that
the associated 95 percent confidence intervals encompass quite substantial wage cyclicality
(of either sign).
6
We therefore considered it worthwhile to conduct a parallel analysis with another
data set, the NLSY. As shown in the second column of Table 2, the NLSY data seem to tell
a different story. We estimate the β for salaried stayers with no extra jobs at -.0147 using
average hourly earnings and -.0204 using per-period salary rate. Both of these estimates are
more procyclical than the estimates for job stayers in the previous studies that did not
separately analyze salaried workers.
To explore whether the discrepancy between the two data sets arises from the
different age ranges, we have replicated Devereux’s analysis with a PSID sample restricted to
workers no older than 35. The resulting estimates of β remain very close to zero, so the
difference in age does not appear to account for the discrepancy.
Like Devereux’s estimates from the PSID, our estimates from the NLSY are subject
to sizable standard errors. As a result, neither his estimates nor ours are very significantly
different from an intermediate value like -.0080. We do not think our highly procyclical
point estimates from the NLSY should be taken too literally. By the same token, we do not
think that Devereux’s results from the PSID should be read as proving that salaries of job
stayers are noncyclical.
Hourly Workers
Devereux also analyzed wage cyclicality among workers paid by the hour. Using
PSID data from 1970-71 through 1990-91, he again considered two wage variables, average
hourly earnings over the calendar year and the hourly wage rate reported for the current job.
As shown in the first column of Table 3, when he used the average hourly earnings variable,
he obtained a significantly procyclical of -.0074. In contrast, when he reestimated with
the same sample but using the directly reported hourly wage rate instead, was almost
β̂
β̂
7
exactly zero. Swanson (1995) reported a similar finding in his PSID study that included job
changers as well as stayers.
Again, we have attempted to replicate this finding in the NLSY. Our results,
shown in the second column of Table 3, are for average hourly earnings and
for hourly wage rate. As in Table 1, our estimates are more procyclical than
Devereux’s. Our results are consistent with his, though, in the sense that the magnitude of
the discrepancy between the two wage measures is almost as large in the NLSY as in the
PSID.
0107.ˆ −=β
0049.ˆ −=β
Devereux offered two conjectures about why this discrepancy occurs. First, he
suggested that measurement error in the reporting of annual hours of work might induce a
procyclical bias in the average hourly earnings variable. Second, he noted that the average
hourly earnings variable is more likely to encompass pay from overtime, bonuses, tips, and so
forth. As Devereux acknowledged, there was no way to corroborate either conjecture with
his data from the PSID. Therefore, in the next two subsections, we explore his conjectures
by referring to auxiliary evidence from the PSID Validation Study and the Bureau of Labor
Statistics establishment survey.
Measurement Error
As Devereux pointed out, survey reports of earnings and work hours are notoriously
susceptible to response error, and errors in reporting either earnings or work hours contribute
to measurement error in the average hourly earnings variable, which is the ratio of annual
earnings to annual hours.
8
The usual starting point for analyzing the impact of measurement error on estimation
of regression equations is the classical errors-in-variables model discussed in almost every
introductory econometrics textbook. As applied here, that model is
(2) Eititit vEE +∆=∆ lnln *
and
(3) hititit vhh +∆=∆ lnln *
where and itEln∆ ithln∆ are the true values of year-to-year growth in annual earnings
and hours, and are the corresponding error-ridden measures, and and
are assumed to have zero mean and to be uncorrelated with the true values as well as the
explanatory variables and error term in equation (1).
*ln itE∆ *ln ith∆ Eitv
hitv
If we use ititit hEw lnlnln ∆−∆=∆ to denote the true year-to-year growth in
average hourly earnings, then the error-ridden measure is
(4) . hitEititititit vvwhEw −+∆=∆−∆=∆ lnlnlnln ***
It follows that, when we estimate equation (1) with the error-ridden value of the dependent
variable in place of the true one, the regression equation actually estimated is
(5) , )(ln *hitEititittit vvXtUw −++′++∆=∆ εαδβ
in which the composite error term encompasses the measurement error in the dependent
variable as well as the original regression error term.
As emphasized in the standard textbook analysis, such classical measurement error
in the dependent variable does not induce any inconsistency in least squares estimation of
equation (5).5 Least squares estimation of the regression parameters remains consistent
5 This is true whether the estimation is done by single-step OLS or by the two-step method used by Devereux and ourselves.
9
because the measurement error components of the error term are uncorrelated with the
explanatory variables. Consequently, Devereux must have been assuming some sort of
nonclassical measurement error when he conjectured that errors in reporting earnings or
hours induce a procyclical bias in the estimation of β .
Devereux did not specify his nonclassical alternative to the textbook model, but he
hinted at it when he wrote (on page 837) that “the clumping of reported hours at 40 hours per
week might imply that actual hours are more procyclical than reported hours. Hence, the
procyclicality of reported average hourly earnings might overstate the procyclicality of true
average hourly earnings.”6 To formalize Devereux’s idea that reported values might
systematically understate true variation, we borrow the errors-in-variables model used in Kim
and Solon (forthcoming). That model generalizes the classical model in equations (2) and
(3) to
(6) EititEit vEE +∆=∆ lnln * λ
and
(7) . hitithit vhh +∆=∆ lnln * λ
Intercepts are suppressed in equations (6) and (7) by measuring all variables as deviations
from their population means. Obviously, the classical model is the special case in which
1== hE λλ . Unlike the classical model, the generalized model allows for the possibility of
systematic underreporting of true variation by permitting λ to be less than 1. Bound and
Krueger (1991), for example, used a match of Current Population Survey responses to Social
Security earnings records to estimate Eλ at .65 and coined the expression “mean-reverting
measurement error” to describe this departure from the classical model.
6 Interestingly, Swanson (1995, page 15) made the exact opposite conjecture: “it is difficult to imagine that annual hours are misreported countercyclically – if anything, a procyclical bias seems more likely.”
10
Now we need to generalize the analysis that previously led to equation (5) to
accommodate the broader assumptions of the generalized model. That leads to the
generalized regression equation
(8) , )(ln)()(ln *hitEititEithEittEit vvhXtUw −++∆−+′++∆=∆ ελλλαδβλ
which obviously specializes back to equation (5) when 1== hE λλ . Then, one way to
characterize Devereux’s conjecture would be to assume that 10 << hλ , representing a
tendency to underreport hours variation, but that (contrary to Bound and Krueger’s finding)
there is no such tendency in earnings reporting, so 1=Eλ . In that case, equation (8) would
simplify to
(9) . )(ln)1(ln *hitEititithittit vvhXtUw −++∆−+′++∆=∆ ελαδβ
With 10 << hλ and ithln∆ omitted in least squares estimation of equation (9), the
standard omitted-variables analysis supports Devereux’s claim that would be subject to a
procyclical bias.
β̂
This, however, is not a general implication of equation (8). Consider another
special case, where the errors in measuring earnings and hours growth are subject to the same
degree of mean-reversion, so 10 <==< λλλ hE . Then equation (8) simplifies to
(10) . )(ln *hitEititittit vvXtUw −++′++∆=∆ λεαλλδλβ
Inspection of equation (10) makes clear that the probability limit of the estimated coefficient
of would be tU∆ λβ , not β , producing a tendency to underestimate the cyclicality of
average hourly earnings.
The general point is that evaluating the nature of the inconsistency requires
information on the actual values of Eλ and hλ . An assumption that 1=Eλ is
11
contradicted by Bound and Krueger’s results, but we also need information on hλ . To date,
the only data set that contains information on measurement error for changes in hours as well
as earnings is the PSID Validation Study. That study, described at length in Bound et al.
(1994), combined accurate information on earnings and hours from a company’s records with
information from a PSID-like survey of the company’s workers. Bound et al.’s comparison
of the survey reports of earnings and hours with the company records provided a wealth of
information on properties of the measurement error in worker-reported earnings and hours.
Furthermore, because the validation study was conducted in two waves four years apart, it
also generated information on measurement error in changes in earnings, hours, and their
ratio.
Like Bound and Krueger, Bound et al. found that the measurement error in reported
earnings growth is mean-reverting. Using least squares to estimate equation (6) with a
validation study sample containing both salaried and hourly workers, Bound et al. estimated
Eλ at .779. With twelve outliers excluded, they reestimated Eλ at .782 and, when they
reestimated with the full sample by least absolute deviations instead of least squares, they got
. Their corresponding estimates of 853.ˆ =Eλ hλ for the validation study’s sample of
hourly workers were .834, .862, and .830.7 The general impression is that the λ ’s for
earnings growth and hours growth are both about .8. If so, equation (10) is approximately
applicable, and the many longitudinal studies that have found procyclical average hourly
earnings may have tended to understate the procyclicality by about 20 percent.
7 Based on the sample of hourly workers, Bound et al. also directly estimated the λ for growth in average hourly earnings. Their estimates – .671, .743, and .790 – indicate that the net effect of the mean-reverting measurement errors in both earnings and hours growth is to understate the true variation for average hourly earnings. Kim and Solon (forthcoming) emphasized these results in arguing that longitudinal studies of average hourly earnings have tended to understate the procyclicality of real wages.
12
In conclusion, the only pertinent evidence on measurement error that is currently
available contradicts Devereux’s conjecture that misreporting of average hourly earnings
biases in a procyclical direction. This leaves open the question of why directly reported
hourly wages appear to be less procyclical. It is conceivable that misreporting of the growth
in hourly wage rates may be subject to even more severe mean-reversion, but, to the best of
our knowledge, no evidence presently exists on the nature of measurement error in hourly
wage changes.
β̂
Overtime Pay
Devereux’s other explanation for the discrepancy between the two wage measures
was that the average hourly earnings variable is more likely to encompass pay from overtime,
bonuses, tips, and the like. Swanson (1995, pages 17-18) similarly noted that “the straight-
time hourly wage rates of workers are far less procyclical than their annual earnings divided
by annual hours” and suggested that overtime, bonuses, tips, and commissions “play an
important role” and “would be an invaluable topic for future research.” Unfortunately,
neither the PSID nor the NLSY provides a clear-cut disaggregation of earnings between
straight-time pay and these various other components.
Nevertheless, with overtime pay as with measurement error, it is possible to learn
more by combining some modeling with auxiliary evidence from another source. If we
assume that all overtime work of hourly workers is paid at “time and a half,” we can write a
worker’s average hourly earnings as
(11) bititbititbititit wSwSwSw )5.1()5.1()1( +=+−=
where is the overtime share of the worker’s annual work hours in year and
denotes his straight-time or “base” hourly wage. Then, taking logarithms yields
itS t bitw
13
(12) , itbitit Sww 5.lnln +≅
and differentiating with respect to the unemployment rate gives
(13) t
it
t
bit
t
it
US
Uw
Uw
∂∂
+∂
∂≅
∂∂
5.lnln
.
Equation (13) confirms that the procyclicality of average hourly earnings exceeds the
procyclicality of the straight-time hourly wage if the overtime share of work hours is
procyclical.
It is possible to get an idea of the magnitude of tit US ∂∂ / by referring to time series
data from the Bureau of Labor Statistics establishment survey. Since 1956, that survey has
collected information on total and overtime hours of production workers in manufacturing.
The annual time series are presently available at www.bls.gov/webapps/legacy/cesbtab2.htm.
Because overtime work is especially prevalent in manufacturing (Carr, 1986) and labor
demand in manufacturing is especially cyclical (Mayshar and Solon, 1993; Shin, 2000), it
seems likely that the magnitude of tit US ∂∂ / for production workers in manufacturing sets
an upper bound for the magnitude for all hourly workers.
Before estimating for manufacturing, we should check that
manufacturing exhibits the same discrepancy between the cyclicality of the two wage
measures that appeared for general samples of hourly job stayers in Table 3. Table 4 repeats
the analyses of Table 3 except that it focuses solely on manufacturing workers. Elsewhere
in this paper, we have reported Devereux’s PSID results (which we have been able to
replicate almost exactly). Because Devereux did not report an analysis for manufacturing,
in Table 4 we report our own PSID results for manufacturing workers as well as results from
the NLSY. In both data sets, the reduced sample sizes from restricting to manufacturing
impair the precision of the estimates, but, in both cases, the procyclicality estimated for
average hourly earnings continues to be considerably greater than for the hourly wage rate.
tit US ∂∂ /
14
It is not surprising that the hourly wage is estimated to be more procyclical in the NLSY than
in the PSID because, in some years, the NLSY questions about the current job attempted to
include tips, overtime, and bonuses.
Having verified that the discrepancy between the two wage measures continues to
appear for workers in manufacturing, we now proceed to using the time series data from the
establishment survey to estimate the cyclicality of the overtime share for production workers
in manufacturing. Concordantly with the second step of our two-step estimation of equation
(1), we estimate tit US ∂∂ / by applying least squares to the regression of year-to-year change
in the overtime share of hours on year-to-year change in the unemployment rate and a linear
time trend. The first column in Table 5 shows the results corresponding to Devereux’s
PSID time period, 1970-71 through 1990-91. The -.0059 estimate of the coefficient of
is statistically significant and indicates that the overtime share is quite procyclical.
The next column shows that, when we switch to our NLSY time period of 1979-80 through
1992-93, the estimate declines to -.0047, but remains substantial and statistically significant.
tU∆
Equation (13) shows that multiplying tit US ∂∂ / by .5 approximates the
contribution of overtime pay to the discrepancy between the cyclicalities of the two wage
measures. Recalling that the overtime share probably is more procyclical in manufacturing
than in most sectors, we infer from our establishment survey results that overtime might
account for as much as -.003 of the discrepancy. That is a substantial quantity, but it does
not account for the entirety of the large gaps reported in Tables 3 and 4. It remains possible
that still other pay besides straight-time wages, such as bonuses and tips, might explain an
additional portion of the discrepancy.
15
Conclusions
Our analysis of real wage cyclicality has given particular attention to Devereux’s
(2002) most puzzling results about job stayers. First, we have found that Devereux’s
estimates of noncyclical wages among salaried job stayers in the Panel Study of Income
Dynamics are not replicated in the National Longitudinal Survey of Youth. Second, our
NLSY analysis has replicated his PSID finding that, for workers paid by the hour, there is a
discrepancy between the cyclicality of two wage measures, average hourly earnings over the
calendar year and the hourly wage rate reported for the current job. Using additional
evidence from the PSID Validation Study and the Bureau of Labor Statistics establishment
survey, we have explored two of Devereux’s proposed explanations for the discrepancy.
The PSID Validation Study results contradict Devereux’s conjecture that measurement error
induces a procyclical bias in average hourly earnings. The BLS establishment survey
evidence supports his conjecture that overtime pay contributes to the discrepancy, but it does
not appear to explain all of the discrepancy.
At this stage, a fair summary of the accumulated evidence is that men’s real wages
are quite procyclical, with the procyclicality especially pronounced among job changers and
the self-employed. Even among workers staying with the same employer, though, real
average hourly earnings appear to be substantially procyclical. An important portion of that
procyclicality probably is due to compensation beyond base wages, such as overtime pay and
bonuses.
16
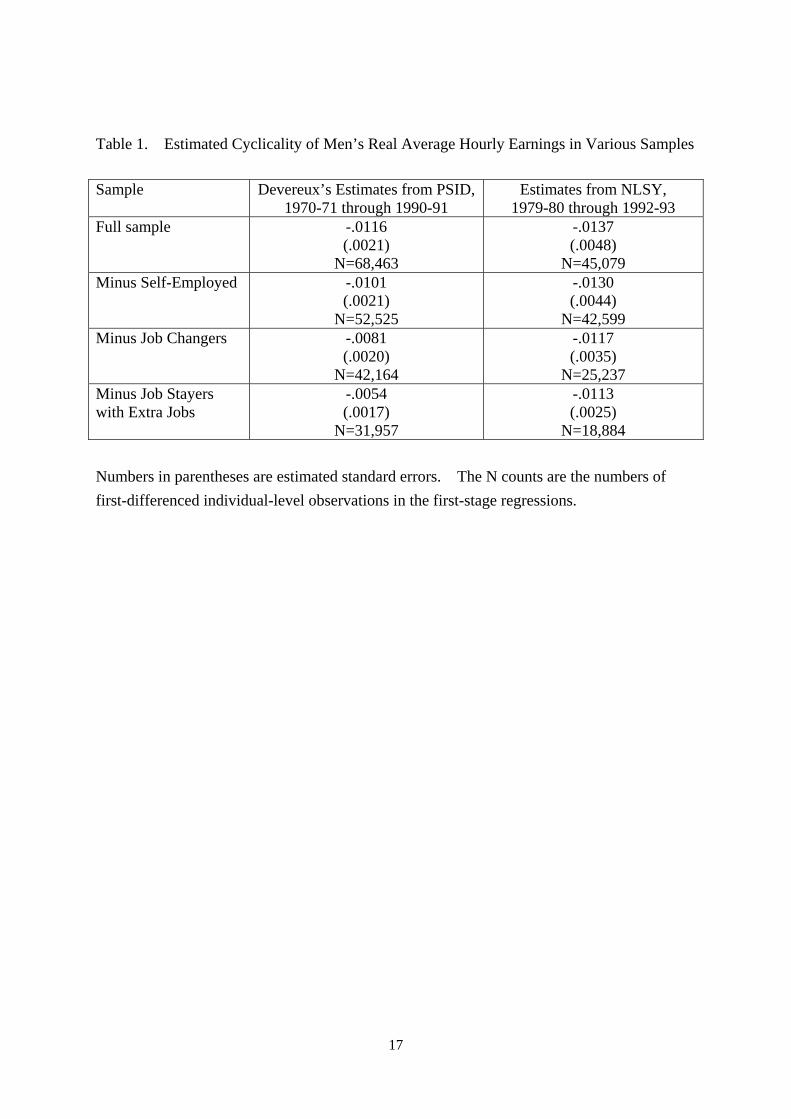
Table 1. Estimated Cyclicality of Men’s Real Average Hourly Earnings in Various Samples
Sample Devereux’s Estimates from PSID, 1970-71 through 1990-91
Estimates from NLSY, 1979-80 through 1992-93
Full sample -.0116 (.0021)
N=68,463
-.0137 (.0048)
N=45,079 Minus Self-Employed -.0101
(.0021) N=52,525
-.0130 (.0044)
N=42,599 Minus Job Changers -.0081
(.0020) N=42,164
-.0117 (.0035)
N=25,237 Minus Job Stayers with Extra Jobs
-.0054 (.0017)
N=31,957
-.0113 (.0025)
N=18,884 Numbers in parentheses are estimated standard errors. The N counts are the numbers of first-differenced individual-level observations in the first-stage regressions.
17

Table 2. Estimated Real Wage Cyclicality for Salaried Job Stayers with No Extra Jobs
Wage Measure Devereux’s Estimates from PSID, 1976-77 through 1990-91
(N=9,078)
Estimates from NLSY, 1979-80 through 1992-93
(N=7,745) Average Hourly Earnings
-.0008 (.0039)
-.0147 (.0066)
Per-Period Salary Rate -.0028 (.0067)
-.0204 (.0061)
Numbers in parentheses beneath coefficient estimates are estimated standard errors. The N counts are the numbers of first-differenced individual-level observations in the first-stage regressions.
18
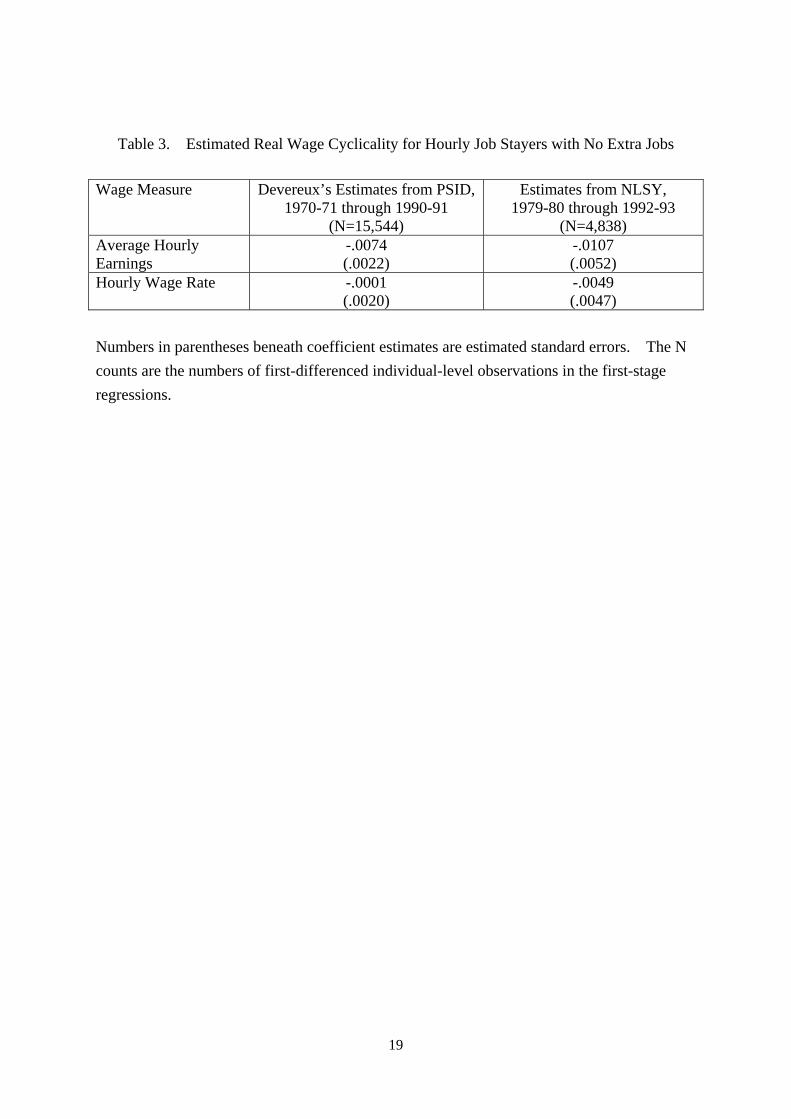
Table 3. Estimated Real Wage Cyclicality for Hourly Job Stayers with No Extra Jobs
Wage Measure Devereux’s Estimates from PSID, 1970-71 through 1990-91
(N=15,544)
Estimates from NLSY, 1979-80 through 1992-93
(N=4,838) Average Hourly Earnings
-.0074 (.0022)
-.0107 (.0052)
Hourly Wage Rate -.0001 (.0020)
-.0049 (.0047)
Numbers in parentheses beneath coefficient estimates are estimated standard errors. The N counts are the numbers of first-differenced individual-level observations in the first-stage regressions.
19
Table 4. Estimated Real Wage Cyclicality in Manufacturing for Hourly Job Stayers with No Extra Jobs
Wage Measure Estimates from PSID,
1970-71 through 1990-91 (N=6,237)
Estimates from NLSY, 1979-80 through 1992-93
(N=1,427) Average Hourly Earnings
-.0131 (.0036)
-.0100 (.0045)
Hourly Wage Rate -.0010 (.0032)
-.0045 (.0081)
Numbers in parentheses beneath coefficient estimates are estimated standard errors. The N counts are the numbers of first-differenced individual-level observations in the first-stage regressions.
20
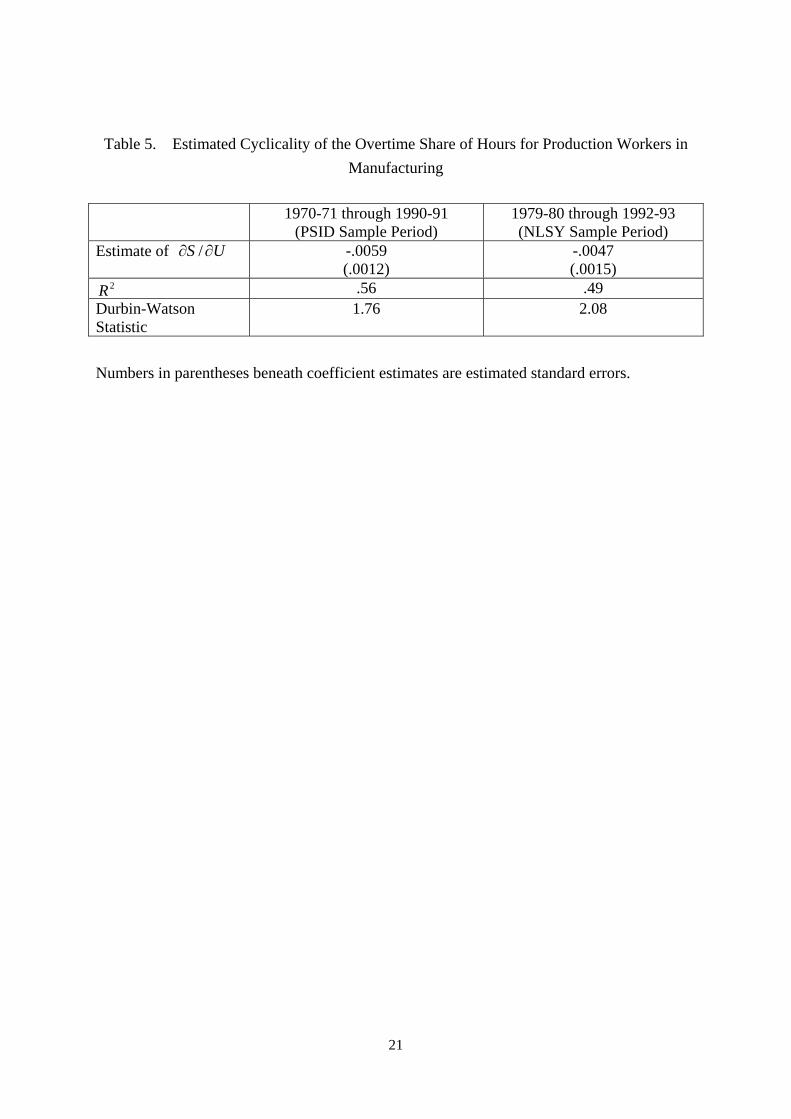
Table 5. Estimated Cyclicality of the Overtime Share of Hours for Production Workers in Manufacturing
1970-71 through 1990-91
(PSID Sample Period) 1979-80 through 1992-93 (NLSY Sample Period)
Estimate of US ∂∂ / -.0059 (.0012)
-.0047 (.0015)
2R .56 .49 Durbin-Watson Statistic
1.76 2.08
Numbers in parentheses beneath coefficient estimates are estimated standard errors.
21
References
Amemiya, Takeshi. 1978. “A Note on a Random Coefficients Model.” International
Economic Review, Vol. 19, No. 3 (October), pp. 793-96.
Bils, Mark J. 1985. “Real Wages over the Business Cycle: Evidence from Panel Data.”
Journal of Political Economy, Vol. 93, No. 4 (August), pp. 666-89.
Blanchard, Olivier Jean, and Stanley Fischer. 1989. Lectures on Macroeconomics.
Cambridge, Mass.: MIT Press.
Bound, John, Charles Brown, Greg J. Duncan, and Willard L. Rodgers. 1994. “Evidence
on the Validity of Cross-sectional and Longitudinal Labor Market Data.” Journal
of Labor Economics, Vol. 12, No. 3 (July), pp. 345-68.
Bound, John, and Alan B. Krueger. 1991. “The Extent of Measurement Error in
Longitudinal Earnings Data: Do Two Wrongs Make a Right?” Journal of Labor
Economics, Vol. 9, No. 1 (January), pp. 1-24.
Bowlus, Audra J. 1993. “Job Match Quality over the Business Cycle.” In H. Bunzel, P.
Jensen, and N. Westergard-Neilsen, eds., Panel Data and Labor Market Dynamics.
Amsterdam: North Holland, pp. 21-44.
Brown, James N., and Audrey Light. 1992. “Interpreting Panel Data on Job Tenure.”
Journal of Labor Economics, Vol. 10, No. 3 (July), pp. 219-57.
Carr, Darrell E. 1986. “Overtime Work: An Expanded View.” Monthly Labor Review,
Vol. 109, No. 11 (November), pp. 36-39.
Devereux, Paul J. 2001. “The Cyclicality of Real Wages within Employer-Employee
Matches.” Industrial and Labor Relations Review, Vol. 54, No. 4 (July), pp. 835-50.
Dickens, William T. 1990. “Error Components in Grouped Data: Is It Ever Worth
Weighting?” Review of Economics and Statistics, Vol. 72, No. 2 (May), pp. 328-
33.
Kim, Bonggeun, and Gary Solon. Forthcoming. “Implications of Mean-Reverting
Measurement Error for Longitudinal Studies of Wages and Employment.” Review
of Economics and Statistics.
22
Mayshar, Joram, and Gary Solon. 1993. “Shift Work and the Business Cycle.”
American Economic Review, Vol. 83, No. 2 (May), pp. 224-28.
Shin, Donggyun. 1994. “Cyclicality of Real Wages among Young Men.” Economics
Letters, Vol. 46, No. 2 (October), pp. 137-42.
Shin, Donggyun. 2000. “Gender and Industry Differences in Employment Cyclicality:
Evidence over the Postwar Period.” Economic Inquiry, Vol. 38, No. 4 (October),
pp. 641-50.
Shin, Donggyun, and Kwanho Shin. 2002. “Why Are the Wages of Job Stayers
Procyclical?” Unpublished paper, Hanyang University.
Solon, Gary, and Robert Barsky. 1989. “Real Wages over the Business Cycle.”
Working Paper No. 2888, National Bureau of Economic Research.
Solon, Gary, Robert Barsky, and Jonathan A. Parker. 1992. “Measuring the Cyclicality of
Real Wages: How Important Is Composition Bias?” Working Paper No. 4202,
National Bureau of Economic Research.
Solon, Gary, Robert Barsky, and Jonathan A. Parker. 1994. “Measuring the Cyclicality of
Real Wages: How Important Is Composition Bias?” Quarterly Journal of
Economics, Vol. 109, No. 1 (February), pp. 1-25.
Solon, Gary, Warren Whatley, and Ann Huff Stevens. 1997. “Wage Changes and
Intrafirm Job Mobility over the Business Cycle: Two Case Studies.” Industrial and
Labor Relations Review, Vol. 50, No. 3 (April), pp. 402-15.
Swanson, Eric. 1995. “Real Wage Cyclicality in the PSID, 1967-1991.” Unpublished
paper, Federal Reserve Board of Governors.
23