demand for nutrients in chain restaurants in canadaageconsearch.umn.edu/bitstream/61417/2/nutrient...
TRANSCRIPT

Demand for Nutrients in Chain Restaurants in Canada
Jeewani Fernando, PhD Candidate, Department of Rural Economy, University of Alberta
Email: [email protected]
Ellen Goddard, Professor, Department of Rural Economy, University of Alberta
Email: [email protected]
Sandeep Mohapatra, Assistant Professor, Department of Rural Economy, University of Alberta
Email: [email protected]
James Rude , Associate Professor, Department of Rural Economy, University of Alberta
Email: [email protected]
Selected Paper prepared for presentation at the Agricultural & Applied Economics
Association 2010. AAEA, CAES, & WAEA Joint Annual Meeting,
Denver, Colorado, July 25-27, 2010
Copyright 2010 by Jeewani Fernando. All rights reserved. Readers may make verbatim
copies of this document for non-commercial purposes by any means, provided that this
copyright notice appears on all such copies.

DEMAND FOR NUTRIENTS IN CHAIN RESTAURANTS IN CANADA
INTRODUCTION
In recent years, the determinants of nutrient demand have been the focus of a number of
economic studies (Abdulai and Aubert 2004; Beatty and LaFrance 2005; Beatty 2007;
Blaylock et al 1999; Briefel and Johnson 2004; Dhehibi et al 2003; Drewnowski 2003;
Fousekis and Lazaridis 2003; Huang & Lin 2000; Nayga et al 1999; Nestle 2002; Park
and Davis 2001; Popkin 2006; Richards et al 2007; Variyam et al 2002). With an
increasing awareness of diet related diseases and increasing interest in public policy
interventions, the need for a more complete understanding of nutrient consumption
patterns has grown. Despite many studies which have been undertaken by nutritionists to
explore the nutrient quality of food away from home (FAFH), especially fast foods (Baric
et al 2003; Binkley 2008; Bowman et al 2004; Fitzpatrick et al 1997; Guthrie et al
2002; Lin et al 2000; Nayga and Capps 1994; Paeratakul et al 2003; Variyam 2004), the
economic studies focused on FAFH in general, are limited. Given an increasing trend in
FAFH spending (Statistics Canada 2006) and the possible link between FAFH and diet
related diseases, an empirical analysis of nutrient demand in FAFH is timely. In addition,
from a policy formulation view, understanding nutrient demand is important as many
policies1 are directly targeted at certain nutrient or nutrients.
Some studies that are available on the nutritional aspects of FAFH (Lin et al 1999;
Guthrie et al 2002) make comparisons between food prepared at home and FAFH (using
data from USDA Nationwide Food Consumption Surveys and Continuing Survey of
Food Intakes by Individuals and calculating nutrient density measures) and provide
information as to how the food intake of Americans have changed over a period of time.
According to Lin et al (1999), over the period 1977 to 1995, Americans have had only
small nutritional improvements in FAFH consumption (foods obtained at various places
other than retail stores) as these foods contain more of the nutrients over consumed
(calories from fat and saturated fats) and fewer of nutrients under consumed (calcium and
fibre). Guthrie et al (2002) had the same findings, as well as the fact that FAFH foods are
also sodium and cholesterol dense. Binkley (2006) added nutrition variables (consumers‟
1 Proposed trans fat regulations, fat taxes, regulations on sodium etc.

concerns and knowledge about nutrition) to standard demographic measures in explaining
demand for FAFH. According to his consumer survey data analysis, Binkley (2006)
showed that nutrition oriented consumers tended to have lower fast food consumption.
There are a number of other studies, which focus on the nutrition aspect of only one
segment of FAFH such as fast food consumption. Nutritionists have undertaken these
studies and the general finding is that frequent fast food consumption leads to higher
energy and fat intake and a lower intake of healthful nutrients. See table 3.1 for a list of
studies done on nutritional aspects of foods including FAFH. Meanwhile, many
researchers have also shown that there is a correlation between FAFH food, especially
fast food consumption and the obesity epidemic in U.S. (French et al 2000; French et al
2001; Binkley et al 2000; Taveras et al 2001).
A number of economic studies have focused on specifying the influence of socio-
demographic characteristics on food nutrient demand in general (Ardrian and Daniel
1976; Devaney and Fraker 1989; Basiotis 1983; Nayga 1994; Nayga 1999; Ramezame
1995; Subramanium and Deaton 1996; Dhehibi et al 2003). As most of these studies
highlight, information on the differential effects of socio-demographic characteristics on
nutrient intake may be useful in designing and targeting nutrition education. According to
Ardrian and Daniel (1976), since certain commodities or commodity groups are primary
sources of specific nutrients, specification of these relationships can also provide
information concerning future demand trends, which will directly affect the types of
agricultural products produced and marketed. However, Huang (1996) argues that if this
measurement of nutrition contribution is to be a better guide for decision making in
policy and business, it needs to be better tied to demand for food supplied. While these
concerns were expressed with regard to food consumption in general, it will be
interesting to analyze FAFH consumption in the above context for a better understanding.
The overall goal of this study is to understand the consumer demand for nutrients in
FAFH foods in Canada in a comprehensive manner. A joint effort by Canadian
Restaurant and Food Services Association and Canada‟s largest restaurant chains to
launch a Nutrition Information Program in February 2005, made it easier for consumers

to obtain detailed nutrition information for standardized menu items in the majority of
chain restaurants in Canada. With this situation, consumers can at least have access to
information on which to base food choices. Therefore, the specific objective is to estimate
the demand for nutrients in the FAFH market focusing on chain restaurants and to
identify socio-demographic characteristics affecting this demand.
Literature Review
In looking for a conceptual framework to analyze the demand for food by nutrients, one
can find different studies that bear some relevance in the economic literature. To look at
the impact of nutrition information on changing behaviour, some have used a nutrient
information index as a variable in demand equations (Brown and Schrader 1990; Capps
and Schmitz 1991; Burton and Young 1996; Kinnucan et al 1997; Kim and Chern 1999).
However, these studies did not measure the demand for nutrients directly and have
focused instead on examining consumers‟ knowledge of nutrition in food demand.
According to Dhehibi et al (2003), two different measurement techniques have been used
to analyse the demand for nutrients. The first method is the “direct method” where
demand equations for specific nutrients are specified as functions of socio-demographic
and economic variables (Ardrian and Daniel 1976; Devaney and Fraker 1989; Basiotis
1983; Nagya 1994; Subramanium and Deaton 1996; Ramazame 1995). In the second
method-“indirect method”- authors have used a two-step process where first, relevant
variable effects on the demand for food products are calculated by estimating a demand
system and second, nutrient intake effects are obtained by applying a nutrient conversion
factor to these specific food effects (Huang 1996 and 1999; Beatty and Lafrance 2005;
Dhehibi et al 2003). Recently, a few other studies using different analytical methods have
become available. For example, the maximum entropy principle has been used by Beatty
(2007) to recover the shadow value of food nutrients and the semi-parametric quantile
regression approach has been used by Variyam et al. (2002) and Fousekis and Lazaidis
(2005) to analyse the demand for selected nutrients. Dhehibi et al (2003) used a panel
data model (a differential consumer demand system2) incorporating nutrients as attributes
and Richards et al (2007) investigated nutrient addiction using a random coefficient
(mixed) logit model. These above methods are briefly reviewed in the next sections in
order to gain some insight on nutrient demand estimation.
In most of the empirical work in the direct method, the demand for nutrients by
households is approximated via an Engel curve relationship in which per capita intake of
a nutrient is specified as a function of a per capita food consumption expenditure and a
vector of household socio-demographic characteristics (Ardrian and Daniel 1976; Huang
and Misra 1991; Devaney and Fraker 1989; Nayga 1994, Nayga and Capps 1994;
Biotosis et al 1983). According to Fousekis and Lazaidis and (2005), this specification is
consistent with Becker‟s household production model as well as with Lancaster‟s goods
characteristics model. In Becker‟ model, nutrients can be considered as inputs in
production of health along with other activities such as regular physical activities and
consumption of medical services (Grossman 1972; Grossman and Kaestner 1997 in
Fousekis and Lazaidis (2005). In the Lancaster model, foods can be considered to have
positive attributes (taste and essential nutrients) as well as negative attributes such as
health risks (Chern and Rickertsen 2003). In both Becker‟s and Lancaster‟s models,
socio-demographic and economic variables enter the utility function as they influence
consumers‟ decision making in healthy dietary choices (Variyam and Golan 2002).
With regard to the relationship between nutrient demand and consumers‟ socio-
demographic and economic variables, Morgan (1986) highlights the fact that the
literature contains a diversity of findings. Morgan (1986) and Davis (1982) suggest a
need for more interdisciplinary research to better understand the relationship between
nutrient intake and socio-demographic and economic characteristics. Given this and
assuming that variation could be attributed to different functional form specifications,
Ramezani (1995) has used AVAS (Additivity and Variance Stabilization), a non
2 This demand system is called as CBS demand system and it comes from the institution in which the
model developers (Keller and Van Driel (1985) worked: Dutch Central Bureau of Statistics
parametric method to specify a multivariate function and then to estimate the demand for
nutrients.
According to the above description, the direct method of nutrient demand seems
appealing for obtaining information related to healthy dietary choices. However, this
method has been criticized by some others arguing that the applicability of the results of
such methods is limited as consumers are observed choosing foods not nutrients and
therefore, nutrients are not directly available in the market (Dhehibi et al 2003).
Nonetheless, in the Canadian FAFH market, this has become less and less the case as
nutrient information is available for the majority of foods provided by the largest chain
restaurants. Specifically, in February 2005, the Canadian Restaurant and Foodservices
Association and Canada‟s largest restaurant chains jointly launched a Nutrition
Information Program to provide detailed nutrition information for standardized menu
items. (Also this became evident according to a survey carried out by authors who
examined restaurant companies‟ websites and collected nutrition data on site of menu
restaurants). Further, public health policy is requiring more and more nutrition
information to be made available to the FAFH consumers in order for them to make
informed and healthful food choices (CSPI 2008; Parliament of Canada 2006).
The studies under the indirect method have tried to link food choices with nutritional
status in the context of the classical demand framework (Huang 1996; Beatty and
Lafrance 2005). Huang (1996) developed a procedure, first of estimating interdependent
demand relationships including own-price, cross-price and income effects and then
incorporating these elasticity estimates directly into the measurement of nutrient
elasticities. For elasticity estimations he has used time series data on quantities and prices
of selected food items using a demand system (Huang 1996). Beatty and Lafrance (2005)
introduced another new model which nests a large class of functional forms for income
and prices within a flexible demand system. Then, combining demand estimates with data
on the nutrient content of foods, they make inferences on the nutritional impacts of
changes in food consumption. These methods of nutrient demand estimation first require
an estimation of demand for each food product under consideration using price and other

relevant information. Although these methods of measuring nutrition contribution can be
tied to demand for food supplied and provide useful policy relevant information, in
FAFH consumption, this method will not be plausible given the large number of products
and the unavailability of individual product price data. Instead of individual food product
prices, FAFH purchase data usually provide total expenditure for a purchase occasion (for
an example NPD CREST data (NPD Group Inc.) provides total expenditure for a
purchase occasion and a purchase occasion may include a number of food products).
Recently, a few studies have been undertaken with new methodological approaches.
Beatty (2007) investigated the shadow value of twenty-eight different nutrients. In his
study the unit prices of foods were linked to the shadow values of nutrients by building
on a utility theoretic model proposed by Gorman. Maximum entropy principles are then
used to estimate the values of the parameters of interest. However, Beatty (2007) did not
use FAFH food intake. The Semi-parametric quantile regression approach has been used
by Variyam et al. (2002) and Fousekis and Lazaidis (2003) to analyse the demand for
selected nutrients. In quantile regression method, a nutrient intake is specified as a
dependent variable in a conditional quantile function and solved for as a minimization
problem. According to Variyam et al (2002), in nutrient demand analysis, the marginal
effects of explanatory variables estimated at the conditional mean using ordinary least
squares may be of limited value as the risk of dietary inadequacy or excess is greater at
the tails of the nutrient intake distribution. Quantile regression is effective in this situation
since it can be used to estimate conditional functions at any part of the distribution
(Variyam 2002; Fousekis and Lazaidis 2003). Dhehibi et al (2007), using a panel data set
(for eight quarters) and incorporating nutrients as attributes directly , estimated a demand
system, in which food quantities are considered as dependent variables. Again in all of
the above studies, FAFH consumption is omitted due to the unavailability of product
quantities in their data. In these studies identification of different products, their quantity,
and their nutrient composition is important to construct the models. All of these new
approaches require proper identification of products and quantities consumed. Given that
FAFH contains a very large number of products with different portion or serving sizes,
applicability of these methods in FAFH nutrient demand analysis is limited due to
computational difficulties. An economic model, specifically a random coefficient (mixed)
logit model was used by Richards et al (2007) to test nutrient addiction and to identify the
relationship between obesity and nutrition consumption.
One of the caveats in nutrient demand studies is the measure of the nutrient content of
foods (Beatty et al 2007). Very often, studies have used per capita nutrient intake on
weight basis. When food intake data is available in the form of food groups and their
quantities, calculation of nutrients using nutrition information sources (may be actual
nutrition information of foods or assumed averages of food groups) is plausible.
However, calculation of per capita nutrient intake on a weight basis is computationally
difficult in FAFH due to serving size differences. Among many measures of the nutrient
content of foods, nutrition density measures are considered to be a promising tool
(Drewnowski 2005), which can be applied to FAFH consumption. Nutrition density
measures the amount of each nutrient for each 1000 or 2000 calories provided by a food
item. Since this standard is calculated using the number of calories as the basis, the
resulting nutrient density ratio is independent of the serving size (Hansen 1979). Given a
large variety of meal items and portion sizes in FAFH consumption measuring exact
nutrient content is difficult due to human error. Therefore, nutrient density can be
considered to be a suitable measure of nutrients for FAFH to avoid the complexity of
calculating exact nutrient content by product and aggregating them.
A majority of the nutrient demand studies have used cross sectional data, while only a
few have used time series data (Huang 2000; Beatty and Lafrance 2005) and panel data
(Dhehibi et al 2003; Richards et al 2007). Some of the modelling issues in cross sectional
nutrient demand studies are described in Park and Davis (2001). The number of nutrients
that are analysed varies from one nutrient (Calories-Subramanium and Deaton 1996) to
twenty-eight nutrients (Beatty 2007). Non-technical descriptive analysis and reviews on
the relationship between food demand and nutrition are also included. Among these,
Blaylock et al 1999 examined the role and influence of economic factors on consumer
food choices, and hence, nutritional outcomes. Drewnowski (2003) examined the link
between income and macro-nutrients (fat and sugar) in developed and developing

countries as well as lower income groups in developed countries. He suggests that obesity
in US and similar societies may be a socio-economic issue. Nestle (2002) describe how
food industry influence nutrition and health of consumers. Popkin (2006) provides a
commentary on global nutrition dynamics and highlights the effects of fast food and
bottled soft drinks industries on the nutrition shift.
Some studies which are related to nutrients and FAFH have focused on the link between
FAFH and obesity (Gills and Bar-Or 2003; Thompson et al 2004; French et al 2000,
2001; Pereira et al 2005; Duffey et al 2007; Burns et al 2001). These studies tried to link
relatively high energy and fat intake from FAFH to obesity. A few studies looked at the
nutrient contribution of FAFH over the years (Lin et al 2000, Gruthrie et al 2001). Other
studies reported in this review have examined different aspects of FAFH and nutrition.
For example, nutrition associated with restaurant diet and its effects on university
students (Baric et al 2003), caloric and gram differences between meals at fast foods and
table service restaurants( Binkley 2008), effects of fast food on children‟s and adults diet
(Brown et al 2003; Paerataket et al 2003), low fat restaurant menus and customer
satisfaction (Fitzpatric et al 1997) and socio-demographic factors on individual intake of
saturated fat and cholesterol from FAFH (Nayga and Capps 1994), nutrition labelling of
restaurant foods (Varityam 2005). In addition, information on nutrition labelling in
restaurants and food services in Canada (Health Canada 2008) and nutrition database
information provided by USDA (USDA 2008) are also reviewed.
Data
This study used a data set on Canadians‟ food away from home food consumption from
the year 2001 to 2006 obtained from NPD Group Inc., Consumer Reports on Eating
Share Trends (CREST) database. Based on a voluntary program starting in 2005 (CRFA
2005), nutrition information is supposed to be available for all chain restaurants in
Canada. As a part of this study collection of a significant amount of nutritional fact
information by Canadian restaurants over the past four years (2006 to 2009) has been
undertaken and this has revealed that nutrition information is available for a majority of
large chain restaurants in Canada. In the CREST data set, despite approximately equal
levels of annual average spending by households on chain and non-chains over the
sample period (about $110 to $125), the annual percentage of total purchase occasions
are higher for chain than for non-chain restaurants (63% for chain restaurants and 37%
for non chain restaurants). Therefore, given access to nutrition information and frequency
of purchases, household purchase data for chain restaurants is the focus for this study.
The data set contains a variety of information on each household‟s socio-demographics,
total expenditure on each purchase occasion, the type of the restaurant visited and its
name and food speciality, and detailed information on the meal and beverage items
purchased (NPD Group Inc. 2007).
The collection of nutrition fact information from restaurants in Canada revealed that
number of restaurants that provided nutrition information increased from 22 in 2006 to
about 70 in 2009. In 2009, about 50% of the restaurants have provided information on all
14 nutrients which are required in nutrition facts panels for processed food products
(Health Canada 2008).
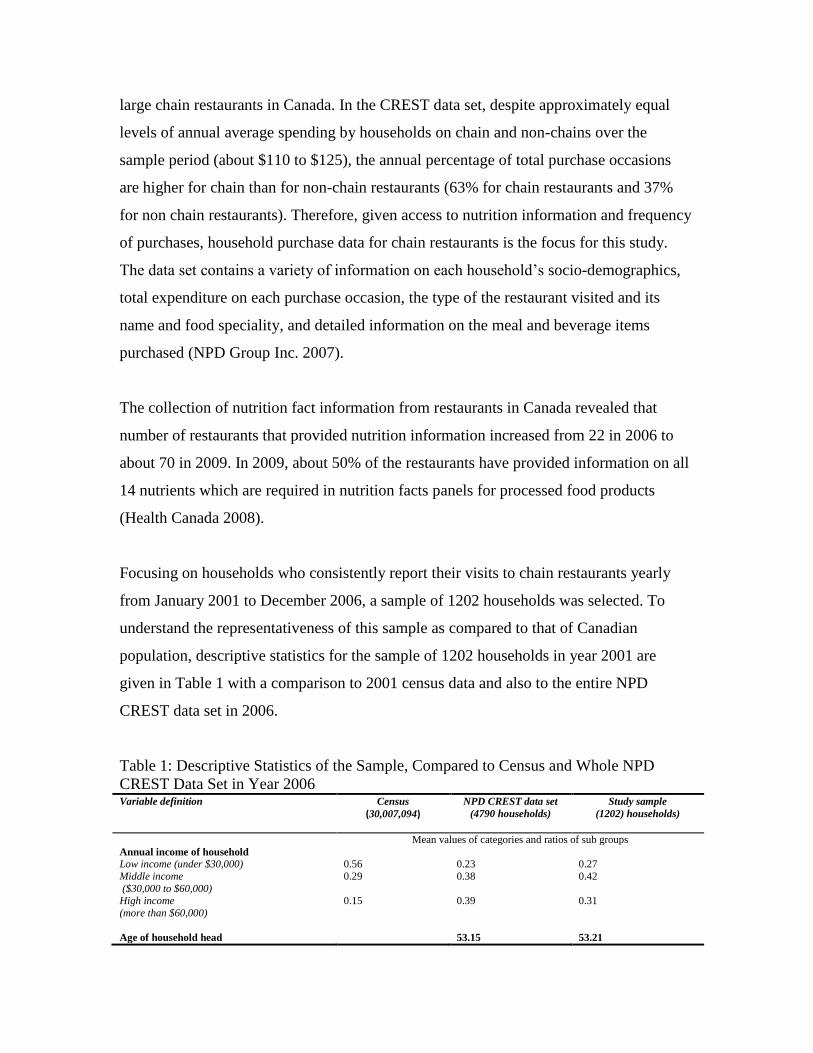
Focusing on households who consistently report their visits to chain restaurants yearly
from January 2001 to December 2006, a sample of 1202 households was selected. To
understand the representativeness of this sample as compared to that of Canadian
population, descriptive statistics for the sample of 1202 households in year 2001 are
given in Table 1 with a comparison to 2001 census data and also to the entire NPD
CREST data set in 2006.
Table 1: Descriptive Statistics of the Sample, Compared to Census and Whole NPD
CREST Data Set in Year 2006 Variable definition Census
(30,007,094)
NPD CREST data set
(4790 households)
Study sample
(1202) households)
Mean values of categories and ratios of sub groups
Annual income of household
Low income (under $30,000) 0.56 0.23
0.38
0.39
0.27
0.42
0.31
Middle income
($30,000 to $60,000)
0.29
High income
(more than $60,000)
0.15
Age of household head 53.15 53.21

Under 15 0.18 0.00 0.00
15 years to 44yearss 0.41 0.32
0.45 0.23
0.31
0.47 0.24
45 years to 65 years 0.27 above 65 years 0.14
Education
Junior high or less 0.08 0.02 0.02
Senior high, college certificate diploma 0.78 0.69 0.71 University degree 0.14 0.29 0.27
Region
British Columbia /West Coast 0.13 0.20 0.18
Alberta 0.11 0.14 0.14 Saskatchewan Prairie Provinces 0.03 0.17 0.06 0.25 0.05 0.25
Manitoba 0.04 0.05 0.06
Ontario (+ HULL, PQ) 0.38 0.29 0.30
Quebec(- HULL, PQ) 0.24 0.17 0.15
New Brunswick 0.02 0.05 0.05
Prince Edward Island 0.004 0.11 0.004 0.114 0.003 0.113 Nova Scotia Atlantic Provinces 0.03 0.05 0.05
Newfoundland 0.02 0.01 0.01
Household composition
Households with children 0.74 0.77
Households without children 0.26 0.23
Total annual expenditure on FAFH 188.01 347.58
Source; Canadian Census 2006, Statistics Canada 2009, NPD CREST data 2001-2007
As compared to Census data and NPD data, the study sample can generally be considered
to be a representative sample of the NPD data set and the Canadian population, with
some variations. One variation is that the representation of low-income households is low
in both the NPD sample and the study sample as compared to Census data while the
representation of middle-income households is higher in both the NPD sample and the
study sample. The average age of the household head is higher in the study sample, with
no representatives from the age group below 15 years. Representation from the
educational sub- groups and the regional sub groups are more or less similar in all three
data sets. The regional representations are more or less similar across three groups of
data, except the fact that representation from Newfoundland is lower than the Census data
and the NPD data. Comparisons of household composition and the average FAFH
expenses were made only between the NPD data set. The proportion of households with
children is lower in the study sample while average spending on FAFH is higher in the
study sample. However, as the study sample is generally representative of Canadian
population, the study results can be extrapolated.
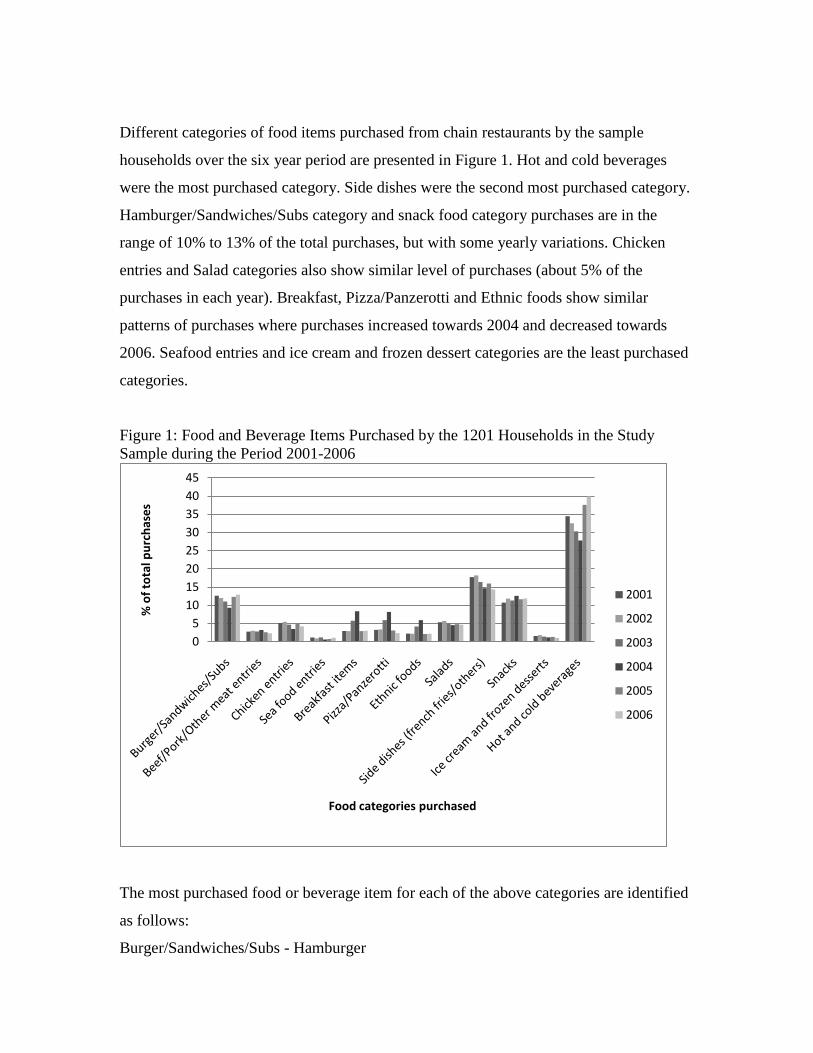
Different categories of food items purchased from chain restaurants by the sample
households over the six year period are presented in Figure 1. Hot and cold beverages
were the most purchased category. Side dishes were the second most purchased category.
Hamburger/Sandwiches/Subs category and snack food category purchases are in the
range of 10% to 13% of the total purchases, but with some yearly variations. Chicken
entries and Salad categories also show similar level of purchases (about 5% of the
purchases in each year). Breakfast, Pizza/Panzerotti and Ethnic foods show similar
patterns of purchases where purchases increased towards 2004 and decreased towards
2006. Seafood entries and ice cream and frozen dessert categories are the least purchased
categories.
Figure 1: Food and Beverage Items Purchased by the 1201 Households in the Study
Sample during the Period 2001-2006
The most purchased food or beverage item for each of the above categories are identified
as follows:
Burger/Sandwiches/Subs - Hamburger
0
5
10
15
20
25
30
35
40
45
% o
f to
tal p
urc
has
es
Food categories purchased
2001
2002
2003
2004
2005
2006
Beef/Pork/Other meat entries – Steak
Chicken entries – Fried chicken
Seafood entries – Fried fish
Breakfast items – Egg based breakfast sandwiches
Pizza/Panzerotti – Regular Pizza
Ethnic foods- Chinese
Salads – Coleslaw side dish size
Side dishes – French fries
Snacks – Donuts
Ice cream and frozen desserts – Soft cones
Hot and cold beverage – Regular coffee with milk
To create nutrition data, first, all of the foods and beverage items purchased by
households in the sample from various chain restaurants for the selected period were
identified. Second, the nutrient composition of each identified meal and beverage item
was obtained from the restaurants‟ nutrition data collected by the authors and for items
not identified by specific restaurants, average data was obtained from USDA National
Nutrition Data base (USDA 2007). The USDA data base was used as a representation
when no restaurant specific data is available. In the data set containing sample
household‟s FAFH purchases, there are 120 food and beverage items. The restaurant
specific nutrition data were not available for 30 food and beverage items (about 25% of
the items).Third, nutrient density, which measures the amount of a nutrient for each 1000
calories, provided by each meal or beverage item was calculated and matched with the
meal and beverage item purchases by the identified households. Finally, annual aggregate
nutrient densities (for 13 nutrients) were calculated for each household in the sample and
were used in the nutrient demand estimations. A nutrition profile of the most demanded
food and beverage products: Hamburger, French fries, Regular coffee with milk and
Cola-medium is provided in Figure 2.

Figure 2: Nutrient Densities of Selected Popular Food and Beverage Items in FAFH
The above figures on the nutrition profiles illustrate that out of the most popular food and
beverage items, cola beverages contain the highest density for carbohydrates , sugars and
calcium. In terms of trans-fat densities, french fries contain the highest density followed
by hamburgers.
Empirical Model Specification
The objective of this study is to estimate the demand for nutrients in chain restaurants in
the FAFH market and to identify socio-demographic characteristics affecting this demand
using panel data. Among the available methodological approaches, the methods described
0.00
50.00
100.00
150.00
200.00
250.00
300.00
Nu
trie
nt
de
nsi
tie
s in
gra
ms
Hamberger
Fries
Regular coffee with milk
0.00
2.00
4.00
6.00
8.00
Nu
trie
nt
de
nsi
ty in
gr
ams
Hamberger
Fries

in the „indirect methods‟ of nutrient demand analysis and in the „other methods‟ of
nutrient demand analysis require food quantity, food prices or both quantity and prices. In
our FAFH dataset, there is a large variety of food choices and available household level
data do not provide individual food prices. Our data only contain total expenditure for a
meal occasion. Given that the application of indirect methods and other methods
described in the conceptual framework is not possible. However, the „direct methods‟ for
nutrient demand are possible in this study context. Therefore, to achieve the study
objective, a simple structural equation based on an Engel curve, as used by Devaney and
Fraker (1989), Nayga (1994), Nayga and Capps (1994) is used with the following
derivation:
in maximizing a consumer's utility subject to a budget constraint will lead to demand
functions for commodities
),,( pygq jj (1)
where jq denotes the quantity of a good yj, denotes income and p is a price vector for
all relevant goods. By extending this model to examine the demand for nutrients, the
intake of nutrient k is given by:
jkjjk qaN (2)
where akj denotes the amount of nutrient k contained in each unit of commodity qj
(Devaney and Fraker 1989). Substituting equation (1) into equation (2) leads to demand
functions for nutrients of the following form:
),( pyfN jk (3)
Assuming that households face identical prices so that explanation of behavioural
differences is sought through differences in total expenditure and household
characteristics, linear regression equations of the following form can be specified for each
of the k nutrients:
),( SyhN ik iki (4)

where kiN corresponds to the intake of nutrient k by household i (in this study aggregate
nutrient density); y, corresponds to the income level of household i; and S is a vector
representing various socio-demographic and economic factors that may affect nutrient
intake.
This theoretical model suggests the estimation of the following model;
),,,,
,,,,,1
,,(
tMI
tT
htRD
htHFL
htHHC
htHHED
htHHI
htHHAAD
htN
htTENC
htTECf
htN t
(5)
where ht
N is the annual aggregated nutrient density of hth
household in time t, ht
TEC is
the total expenditure on chain restaurants by household h at time t; ht
TENC is the
expenditure on non-chain restaurants by household h at time t; 1ht
N is the lagged
nutrient density of hth
household in time t; AD is the total advertising expenditure by
chain restaurants in year t;HHAht is household head‟s age; HHI ht is the household
income; HHEDht is the household head‟s education ( to capture the effect of nutrition
knowledge) ; HHCht is the household composition; HFLht is the household‟s first
language ( to capture the effect of ethnic diversity); and RDht is the households region of
living: ten Canadian regions were categorized into five regions- West Coast, Prairie
provinces, Ontario, Quebec and Atlantic Provinces. The equation (5) is specified for
thirteen (the fourteenth; calories are not included as nutrient density measure calculations
are based on calories) nutrients which are encouraged for use in nutrition facts tables in
restaurants and food services in Canada (Health Canada 2008). The thirteen nutrients are:
Total Fat, Saturated Fat, Trans Fat, Cholesterol, Sodium, Carbohydrate, Fibre, Sugar,
Protein, Vitamin A, Vitamin C, Calcium and Iron. In order to find out the effect of the
agreement between Canadian Restaurants and Foodservice Association and the
government to provide voluntary nutrition information, a dummy variable for the year
2005 was added to the model (T5). The model was also extended to include a media
index (MI) to test the hypothesis that information on nutrition quality of FAFH: trans
fatty acids, sodium, fat and so on, may have impacted the types of food consumers would

purchase in this market. To construct a media variable, the Factiva data base was used to
search the Canadian newspaper Globe and Mail. Using key word “nutrition” and
selecting „food/beverage/tobacco‟ and „hotels/restaurants/casino‟ as industries, newspaper
articles for the 6 years period were searched. The Canadian newspaper Globe and Mail
was used as this is the Canada‟s largest circulation national newspaper with a weekly
readership of 935,000 among English speakers (National Audience Databank Survey
2008). The media variable was constructed using the number of articles found containing
the key words (Figure 3). However, it should be noted that media index construction
using French newspapers may have been different.
Figure 3: Number of Articles Containing the Word 'Nutrition' in
'Food/Beverage/Tobacco' and 'Hotels/Restaurants/Casino' Industries Related News
According to Figure 3, in selected industries, one can see an increasing number of articles
containing the word „nutrition‟ over the years. This may be an indication that people are
having access to more and more information on restaurant food nutrition.
In this study, one objective is to identify whether there are habit forming preferences for
selected nutrients. To analyse that, a lagged dependent variable was introduced into the
model. However, the introduction of a lagged dependent variable into the model
potentially creates biases in model estimation due to autocorrelation (Baltagi 2005).The
standard approach to use is instrumental variable estimation. In a panel data context, a
0
20
40
60
80
100
120
2001 2002 2003 2004 2005 2006
Number of articles

dynamic panel data model introduced by Arellano and Bond (1991) and Arellano and
Bover (1995) (hereafter AB) is commonly used. The AB method can handle many
econometric problems that may arise in these model estimations. Other than the lagged
dependent variable which gives rise to autocorrelation, the time –invariant characteristics
such as demographics and geography (fixed effects) may be correlated with explanatory
variables. The short time dimension in the panel also may contribute to biases in
estimation.
The AB method is a generalized method of moments (GMM) using two types of
instruments: lagged levels of endogenous variables for the equation in first differences,
and lagged first differences of endogenous variables for the equation in levels. In the AB
models it is assumed that the endogenous variables have a constant correlation with the
household specific effects. According to Browning and Collado (2007), this assumption
allows the validity of AB models is tested with a Sargan test (Sargan 1958). This method
can be applied to above equations (5) specified for each nutrient. Descriptive statistics of
the data sample are given in Table 2.
Table 2: Descriptive Statistics of the Study Sample Variable definition Variable
name
and sub-
groups
Mean
2001
Mean
2002
Mean
2003
Mean
2004
Mean
2005
Mean
2006
Dependent variables
Nutrient Density
Total Fat TF 40.38 39.69 40.99 40.18 41.88 41.12
Saturated Fat SF 14.92 14.63 14.85 14.24 14.96 15.21
Trans Fat TRF 2.00 1.98 2.02 1.99 2.26 1.96 Cholesterol CHL 171.27 170.34 182.94 184.62 176.34 183.92
Sodium SOD 1697.29 1711.00 1778.11 1716.52 1813.36 1825.03
Carbohydrate CARB 125.01 126.28 122.60 125.09 120.20 120.06 Fibre FIB 6.83 6.88 6.90 7.44 7.49 6.92
Sugar SUG 51.52 52.25 48.45 47.98 33.94 33.85
Protein PRO 36.20 36.15 37.34 35.71 37.25 39.55 Vitamin A VITA 4976.94 7615.65 5492.38 5124.08 4281.20 4632.00
Vitamin C VITC 55.88 62.25 58.51 62.31 59.68 56.79
Calcium CAL 620.69 621.57 621.33 636.07 606.74 636.11 Iron IRN 3.02 2.94 2.99 3.19 3.10 3.12
Independent variables
Expenditure on chain restaurants EXC 109.67 119.67 121.45 115.27 116.46 114.84
Expenditure on non-chain restaurants EXNC 110.56 116.57 115.71 121.33 125.88 232.74
Restaurants’ advertising expenditure AD 0.22 0.22 0.23 0.26 0.28 0.30
Annual income of household HHI 45653.62 45693.17 45326.81 45995.00 47458.36 46280.00
Age of household head HHA 53 54 55 56 57 58

Region RD
West Coast=1, otherwise=0 RD1 0.19 0.19 0.19 0.19 0.19 0.19
Prairie Provinces=1, otherwise=0 RD2 0.25 0.25 0.25 0.25 0.25 0.25 Ontario=1,otherwise=0 RD3 0.30 0.30 0.30 0.30 0.30 0.30
Quebec=1, otherwise=0 RD4 0.15 0.15 0.15 0.15 0.15 0.15
Atlantic Provinces=1, otherwise=0 RD5 0.11 0.11 0.11 0.11 0.11 0.11
Household composition HHC
Households without children 0 0.23 0.22 0.21 0.21 0.20 0.20 Households with children (<12 yrs) 1
Household’s first language HFL English=1; otherwise=0 HFL1 0.73 0.73 0.73 0.73 0.73 0.73
French=1; otherwise=0 HFL2 0.16 0.16 0.16 0.16 0.16 0.16
Chinese=1;otherwise=0 HFL3 0.01 0.01 0.01 0.01 0.01 0.01 Other=1;otherwise=0 HFL4 0.09 0.09 0.09 0.09 0.09 0.09
According to Table 2, there are no clear trends in mean values of the nutrient densities for
any nutrients over the years. Similarly, mean expenditure on chain and non-chain
restaurants also do not have clear trends. However, restaurant advertising (one period lag
per capita advertising) and has been increasing over the years in the sample. Table 2 also
provides mean values of household income, age of household head, provincial and ethnic
representation of the sample.
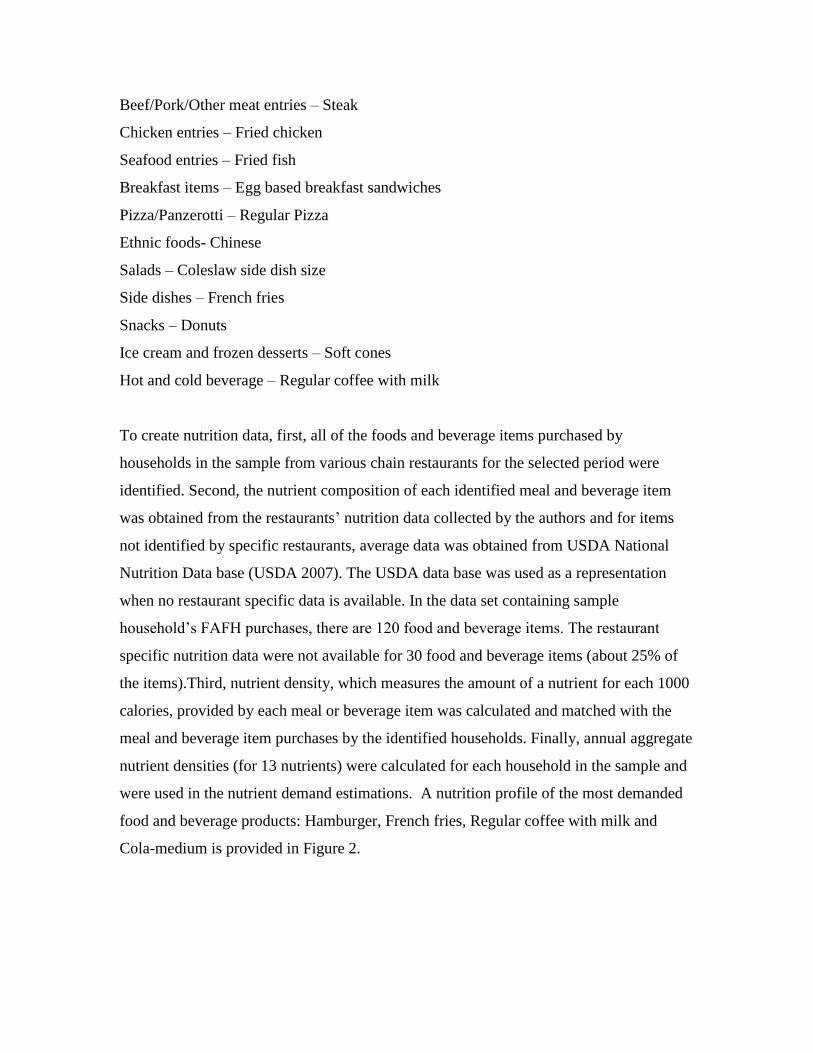
Results and Discussion
The AB models were estimated for the thirteen nutrients identified. According to the
Sargan test statistics, the set of instruments used in the AB models for each nutrient was
not rejected. Therefore, model estimations could be considered as valid. AB model
estimations are provided in Table 3.

Table 3: AB Model Estimations for Thirteen Nutrients
To
tal
Fa
t
Sa
tura
ted
Fa
t
Tra
ns
Fa
t
Ch
ole
stero
l
So
diu
m
Ca
rb
oh
yd
rate
Fib
re
Su
gar
Pro
tein
Vit
A
Vit
C
Ca
lciu
m
Iro
n
Constant 42.709***
(4.538)
8.135***
(0.006)
2.335***
(0.050)
325.509***
(68.686)
1694.33**
(306.936)
145.752***
(18.780)
11.817***
(1.810)
112.436***
(17.945)
23.115***
(5.043)
3184.9***
(1136.66)
148.52***
(36.017)
866.91***
(318.46)
4.178***
(0.704)
Lagged
nutrient
density
-0.084
(0.099)
-0.054
(0.113)
-0.068
(0.091)
-0.145
(0.111)
-0.086
(0.115)
-0.069
(0.107)
-0.006
(0.106)
-0.011
(0.109)
-0.109
(0.103) 0.195*
(0.113)
-0.066
(0.098) -0.286***
(0.129)
-0.154
(0.107)
Expenditure
on chain
restaurants
0.197
(0.123)
0.064
(0.62)
0.010
(0.017)
0.284
(1.994)
-0.801
(8.011)
0.449
(0.348)
-0.021
(0.044)
0.192
(0.387)
-0.100
(0.154)
-153.513
(314.947)
0.559
(1.092)
-5.011
(10.076)
-0.017
(0.018)
Expenditure
on non-
chain
restaurants
-0.146 (0.091)
-0.024 (0.047)
0.009 (0.013)
-1.318 (1.450)
-3.267 (6.065)
0.127 (0.259)
-0.063*
(0.033)
0.079 (0.296)
0.063 (0.116)
293.006 (239.854)
0.466 (0.834)
-3.204 (7.759)
-0.005 (0.014)
Restaurants’
advertising
expenditure
13.540***
(4.138)
38.978***
(9.822)
-0.410
(2.417)
-385.710
(262.449)
865.935
(1083.26) -81.097*
(48.670)
-24.804***
(6.472)
-301.231***
(63.138)
92.444***
(23.243)
-1622.44***
(493.80)
-423.026***
(153.29)
-175.90
(1379.53)
-1.886
(2.592)
Annual
income of
household
0.0005 (0.0008)
0.0008*
(0.0004)
-0.0001 (0.0001)
0.032**
(0.013)
0.004 (0.055)
-0.002 (0.002)
-0.0004 (0.0003)
-0.001 (0.002)
0.003***
(0.001)
-4.231*
(2.190)
-0.002 (0.007)
0.041 (0.072)
0.0001 (0.0001)
Age of
household
head
-0.078
(0.015)
-0.001
(0.007)
0.0008
(0.001) -0.508**
(0.213)
-0.021
(0.885)
0.056
(0.038)
-0.002
(0.004) 0.088*
(0.043)
-0.040**
(0.017)
15.095
(35.990)
-0.132
(0.122)
0.697
(1.123) -0.006***
(0.002)
Education
level of
household
head
-0.284
(0.481)
-0.257
(0.249)
0.069
(0.070)
-10.793
(7.760)
-20.766
(31.367)
0.981
(1.352)
0.229
(0.173)
1.359
(1.536)
-0.520
(0.605) 2150.67*
(1245.044)
4.570
(4.302)
-11.265
(40.132)
-0.054
(0.074)
Region
West Coast -1.369*
(0.782)
-0.764*
(0.406)
-0.008 (0.114)
-4.029 (12.325)
9.749 (51.485)
1.265 (2.202)
0.308 (0.285)
-2.093 (2.536)
-0.131 (0.993)
4417.22**
(2022.49)
4.028 (7.074)
-61.066 (65.528)
0.123 (0.123)
Prairie
Provinces
-1.694**
(0.714)
-0.576
(0.386)
0.012
(0.109)
-10.100
(11.656)
43.324
(49.164)
2.924
(2.082)
0.400
(0.273)
-2.503
(2.460)
-0.128
(0.933) 4319.34**
(1915.04)
0.936
(6.657)
-22.163
(62.551)
0.160
(0.117)
Ontario -1.071
(0.725)
-0.346
(0.376)
0.091
(0.106)
-8.936
(11.404)
53.190
(48.529)
0.856
(2.037)
0.301
(0.266)
-3.294
(2.398)
0.207
(0.916) 4043.24**
(1868.72)
2.228
(6.536) -103.55*
(60.704)
0.128
(0.114)
Quebec -1.924*
(0.993)
-0.371 (0.517)
0.023 (0.145)
-40.254**
(15.839)
1.514 (65.148)
5.402*
(2.810)
0.075 (0.106)
-0.920 (3.177)
-2.103*
(1.254)
2264.29 (2557.10)
-5.701 (8.913)
-48.986 (82.377)
-0.154 (0.155)
Atlantic
Provinces
Reference Group
Household
composition
-0.818
(0.702)
-0.157
(0.363)
0.039
(0.102)
-16.397
(11.042)
0.310
(46.023)
2.328
(1.989)
-0.046
(0.257)
1.803
(2.252) -1.784**
(0.888)
-374.93
(1849.53)
-7.217
(6.306)
83.365
(58.438) -0.195*
(0.109)
*** Statistically significant at 1%. ** Statistically significant at 5%. * Statistically significant at 10%.
Household’s
first
language
English Reference Group
French 0.040 (0.830)
-0.271 (0.428)
0.00009 (0.121)
34.573***
(13.093)
-36.878 (55.271)
-0.545 (2.334)
-0.165 (0.301)
1.910 (2.707)
1.272 (1.048)
1249.62 (2157.41)
12.060 (7.464)
-24.016 (69.313)
0.113 (0.130)
Chinese 0.020
(2.073)
-1.004
(1.070)
0.148
(0.301)
-20.787
(32.440)
40.672
(135.323)
5.852
(5.830) 1.435*
(0.753)
-5.036
(6.618) -9.409***
(2.600)
654.13
(5326.05)
13.748
(18.660)
-188.11
(171.94)
-0.202
(0.324)
Other 1.618**
(0.763)
0.237
(0.394)
0.080
(0.111) 22.507*
(11.979)
28.971
(50.037) -3.747*
(2.141)
-0.024
(0.280)
-2.578
(2.452)
0.635
(0.961)
-50.96
(2014.96)
-3.981
(6.880) -110.43*
(63.470)
0.089
(0.119)
Nutrition
information
availability
(dummy
variable)
1.285***
(0.307)
-0.361**
(0.156)
0.332***
(0.046)
-8.765*
(4.646)
36.513*
(19.445)
-1.600*
(0.835)
0.550***
(0.121)
-5.764***
(1.138)
-1.372***
(0.390)
1962.15**
(817.74)
2.793
(2.656) -42.308*
(25.049)
-0.051*
(0.045)
Media
Index
-0.0006
(0.011) -0.023***
(0.006)
-0.0004
(0.001) 0.457**
(0.185)
0.448
(0.764)
0.002
(0.033) 0.018***
(0.004)
0.035
(0.037) -0.031**
(0.015)
68.64**
(31.700)
0.266**
(0.107)
0.451
(0.965) 0.003*
(0.001)
Income
elasticities
Short tem 0.57 2.45 -2.24 8.53 0.11 -0.73 -2.67 -0.89 3.78 -38.81 -1.63 3.02 1.51 Long term 0.57 2.49 -2.26 8.27 0.10 -0.75 -2.60 -1.03 3.73 -36.41 -1.56 3.03 1.51
Expenditure
elasticities
Short term 0.54 0.47 0.55 0.18 -0.05 0.39 -0.34 0.41 -0.30 -3.38 1.10 -0.89 -0.62
Long term 0.56 0.50 0.57 0.19 -0.05 0.42 -0.34 0.50 -0.31 -3.33 1.10 -0.93 -0.65
Sarg. test
d.f
p-value
31.87
87
0.9921
128.00
87
0.4321
95.84
87
0.2572
142.34
87
0.0010
267.35
87
0.9843
8.86
87
0.9954
667.89
87
0.0031
203.84
87
0.9971
64.63
87
0.9987
13.27
87
0.9992
171.00
87
0.0023
88.22
87
0.4478
99.91
87
0.1628

In spite of no priori expectations of the patterns of demand for the nutrients in chain restaurants,
depending on the analysis of purchase patterns and the analysis of nutrient densities of the
purchased food items, the model estimations can be considered acceptable.
Expenditure at chain restaurants and non-chain restaurants does not affect the household
consumption or intake of selected nutrients significantly. However, it is interesting to see that for
households who spend significantly more on non- chain restaurants, the fibre density of food and
beverages purchased from chain restaurants is significantly low. Annual household income has a
significant positive effect on saturated fat, cholesterol, and protein intake, and has a significant
negative effect on vitamin A intake from the chain restaurants. The model estimates suggest that
the older the household head the higher the intake of sugar. An increase in sugar intake could be
attributed to the highly demanded beverage categories such as cola soft drinks and coffee with
milk. Cholesterol, protein and iron intakes are significantly lower as household head‟s become
older.
It was expected that as the level of education of the household head increases, the intake of
unhealthy nutrients should decrease and the intake of healthy nutrients should increase.
However, for all the nutrients, with the exception of vitamin A, this relationship is not significant
in our model. The higher the level of education of the household head the higher the intake of
Vitamin A. Bowman et al (2004) found that children who consume FAFH have higher intakes of
unhealthy nutrients than the children who do not eat FAFH. In addition to this study, there are
concerns that sugary drinks and fast foods containing trans fat adversely affect children‟s
nutrient intake. However, according to our results, there is a significantly lower intake of vitamin
A and iron by households with children. Even though the trans fat, sodium, carbohydrate and
sugar intakes show positive impacts, these estimates are not significant in this analysis.
Differences in nutrient intake among different ethnic categories were tested using the
household‟s first language as a variable. English speaking households were considered to be the
reference group. As compared to English speaking households, the other language speaking
households consume significantly higher levels of total fat and cholesterol and significantly
lower level of carbohydrates and calcium. Intake of cholesterol is higher in French speaking

households as compared to English speaking households. Chinese speaking households consume
significantly higher level of fibre and significantly lower levels of protein as compared to
English speaking households.
The ten provinces in Canada are categorised into five main regions: West Coast, Prairie
provinces, Ontario, Quebec and Atlantic provinces. Atlantic provinces were considered to be the
reference group. As compared to households in Atlantic provinces, households on the West
Coast consume less total fat and saturated fat, and more vitamin A and iron; households in the
Prairie provinces consume less total fat and more vitamin A; households in Ontario consume
more vitamin A and iron and less calcium; households in Quebec consume less total fat,
cholesterol and protein and, more sugar.
Households‟ habits forming preferences for selected nutrients were modeled using a lagged
dependent variable; nutrient density of each nutrient. Results indicate that only in the case of
vitamin A, there is evidence of habit forming preferences. Restaurant advertising is believed to
affect households‟ FAFH purchasing behaviour and therefore nutrient intake from these foods
and beverages. Our models suggest that total fat, saturated fat and protein intakes significantly
increased with increasing restaurant advertising expenditure while carbohydrate, fibre, sugar,
vitamin A and vitamin are significantly lower with increasing advertising expenditure.
It is expected that the agreement between the Canadian Restaurant and Food Service Association
and the main chain restaurants in Canada to make available nutrition information to consumers
might have impacted households‟ food purchasing behaviour and nutrient intake. It is
hypothesised that after February 2005, when the Canadian chain restaurants voluntarily started to
provide their menu nutrition information through their web sites, leaflets and by various other
means, households became more aware of the nutrient content of different FAFH food and
beverage items and therefore, may have selected healthier menu options. To capture the effect of
this scenario, a dummy variable was used. The results suggest that there are significant
reductions in saturated fat, cholesterol, carbohydrate, sugar, protein, calcium and iron intake
while there are significant increases in total fat, trans fat, sodium, fibre and vitamin A intake
after the above agreement. One should expect that problematic nutrient intake to be reduced as

households have more access to nutrition information. However, according to our results,
households have not shown any concern purchasing items especially with high trans fat or
sodium contents, which are considered very unhealthy nutrients. Meanwhile looking at the media
indices developed for trans fat and sodium (Figure 4 and 5 -in a similar manner for the nutrition
information coverage in general), one can see that media coverage on trans fat and sodium has
started to increase only towards the end of the sample period of this study and therefore, results
may not reflect any consumer concerns regarding these unhealthy nutrients.
Figure 1: Media Index for Trans Fat in 'Food/Beverage/Tobacco' and 'Hotels/Restaurants/Casino'
Industries Related News
Figure 2: Media Index foe Sodium in Food/Beverage/Tobacco' and Hotels/Restaurants/Casino'
Industries Related News
0
5
10
15
20
25
30
2001 2002 2003 2004 2005 2006
number of articles
0
5
10
15
20
25
30
2001 2002 2003 2004 2005 2006
number of articles

A media index was used as a proxy to understand the impact of households‟ awareness of
nutrition of foods and beverages purchased from FAFH markets. Our results explains that media
index is correlated with lower saturated fat and protein intake while it has positive relationship
with cholesterol, fibre, vitamin A, vitamin C and iron intake.
The estimates for the dummy variable which was used to capture availability of nutrition
information and the media index variable both provide evidence that households have used
nutrition information to reduce their intake of saturated fat and protein and to increase their
intake of fibre and vitamin A. Our results do not provide evidence that households have used
information to reduce trans fat intake despite the fact that trans fat has received wide media
coverage recently. Again the reason could be attributed to higher media coverage towards the
end of the study period and therefore may not be reflected in consumer consumption behaviour
in this sample.
Estimated income elasticities imply that trans-fats, carbohydrate, fibre, sugar and vitamin C are
inferior goods; total fat and sodium are necessities; saturated fat, cholesterol, protein, calcium
and iron are luxuries. Estimated expenditure elasticities imply that vitamin A and vitamin C are
expenditure elastic and all the other nutrients are expenditure inelastic. While there are no studies
available on nutrient demand for restaurant foods, income and expenditure elasticity estimations
are widely variable in other nutrient demand studies in other contexts.
Conclusions and Recommendations
This study examined the demand for selected nutrients from foods and beverages in Canadian
chain restaurants. Given that nutrition information is available for chain restaurants in Canada, a
balanced panel data set consisted of 1202 households who have purchased from chain restaurants
in Canada over the period 2001 to 2006 was selected for this study. The panel data was obtained
from the NPD/Crest data base. Allowing for habit forming preferences, a demand model was
specified for 13 nutrients. Nutrient densities were specified as a function of selected economic
and socio-demographic characteristics, lagged nutrient densities, advertising, media index and a

dummy variable to capture the possible impact of increasing availability of restaurant nutrition
information to consumers.
As no previous studies have been undertaken to examine nutrient demand in FAFH foods, there
were no a priori expectations as to how different socio-economic and demographic factors might
affect different nutrient intakes. This study therefore, provides interesting new information about
nutrient consumption from chain restaurants in the FAFH market.
It is disconcerting to learn from our results that household intake of some of the problematic
nutrients, such as saturated fat and cholesterol increase with increasing household head‟s income.
Moreover, sugar intake is increasing with increasing household heads‟ age. Given that Canadian
household heads are aging and have higher incomes, our results suggest higher levels of
unhealthy nutrient intake by Canadian chain restaurant food consumers. There are some
significant variations in nutrient intake among ethnic groups and households in different regions.
Another important finding is the comparatively low levels of vitamin A and iron intake of
households with children as compared to households without children. These findings suggest
that households with children are choosing unhealthy meal items which are low in some
important healthy nutrients. Only vitamin A is found to have habit forming preferences. The
absence of habits or addiction to most of the selected unhealthy nutrients does not suggest any
barriers in designing education programs to promote healthy nutrient intake. However, the
inelastic nature of expenditure on unhealthy nutrients such as sodium, cholesterol, fat, saturated
fat and trans fat may have some implications for the success of imposing nutrient based tax
policies.
Another important finding is the impact of restaurant advertising on nutrient demand. Restaurant
advertising can be considered to be promoting certain kinds of food and beverage products which
may enhance the intake of problematic nutrients in chain restaurants in the FAFH market:
especially total fat and saturated fat. In our study fat, saturated fat, carbohydrates, fibre, sugar,
protein, vitamin A and vitamin C intake was potentially affected by restaurant advertising. The
study finding can be used in many ways to design and target nutrition education programs and to
develop and implement policy tools to promote healthy eating in FAFH market.
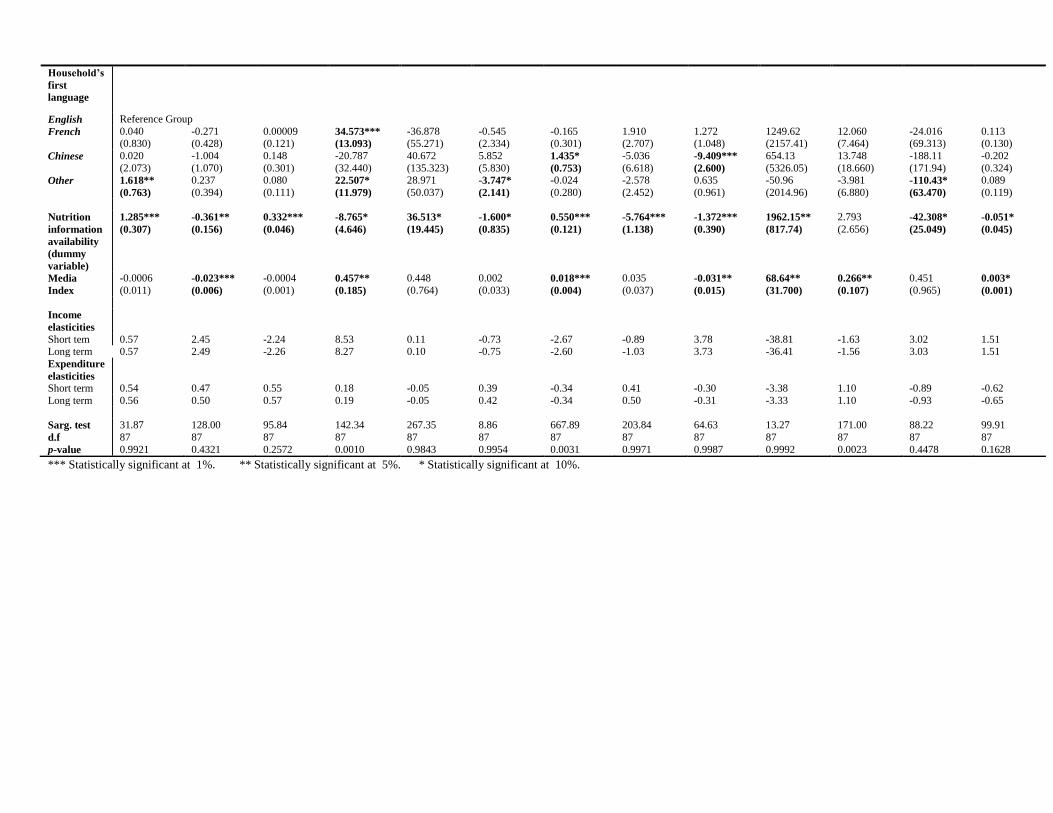
In spite of the efforts to reduce the effects of endogenous variables and fixed effects through the
AB model applications, the highly significant coefficient estimates on the constant terms imply
that there may be omitted variables explaining nutrient demand in chain restaurants in FAFH
market. Some of the important omitted variables could be individual tastes, attitudes,
perceptions, and individual product prices. In this study, given that the modeling is done at the
household level for nutrients, the above important variables were not available. Therefore, future
analysis of stated preference data with the above variables is recommended to obtain more in-
depth information about individual nutrient intake in chain restaurants in the FAFH market.
Another limitation of this study is that model is estimated only for the chain restaurants in FAFH
market and therefore, may not represent the total demand for nutrients in all FAFH purchases.
Unavailability of nutrition information for the menus offered by non -chain restaurants prevented
us from including non-chain restaurants in the study. Perhaps all restaurants should be required
to develop representative or average nutrient information for menu items.

Reference
Abdulai, A., and D. Aubert. 2004. A Cross-Section Analysis of Household Demand for Food
and Nutrients in Tanzania. Agricultural Economics. 31: 67-79.
Adrian, J., and R. Daniel . 1976. Impact of Socioeconomic Factors on Consumption of
Selected Food Nutrients in the United States. American Journal of Agricultural Economics
58, no. 1: 31-38.
Baltagi, B. H. 1995. Econometric Analysis of Panel Data. Third Edition ed. England: John
Wiley & Sons Ltd.
Baltagi, B.H. 2005. Econometric Analysis of Panel Data. Third Edition. Chichester: Wiley.
Bareham, J.R . 2004. Can Consumers be Predictable or are they Unmanageable?
International Journal of Contemporary Hospitality Management. 16, no. 3: 159-65.
Baric,I.C, Z. Satalic and Z.Lukecic. 2003. Nutritive Value of Meals, Dietary Habits and
Nutritive Status in Croatian University Students According to Gender. International Journal
of Food Sciences and Nutrition. 54, no.6:473-484.
Basiotis, P., M. Brown, S. R. Johnson, and K. J. Morgan. 1983. Nutrient Availability, Food
Costs, and Food Stamps. American Journal of Agricultural Economics. 65, no. 4: 685-93.
Beatty, T.K.M. 2007. Recovering the Shadow Value of Nutrients. American Journal of
Agricultural Economics. 89, no.1:52-62.
Beatty,T. K. M., and J. T. Lafrance. 2006. United States Demand for Food and Nutrition in
the Twentieth Century. American Journal of Agricultural Economics. 87, no. 5: 1159–1166.
Binkley, J. K. 2006. The Effect of Demographic, Economic and Nutrition Factors on the
Frequency of Food Away From Home. The Journal of Consumer Affairs. 40, no. 2: 372-91.
Binkley, J.K., J. Eales, and M. Jekanowskei. 2000. The Relation between Dietary Change
and Rising US Obesity. International Journal of Obesity. 24, no. 8:1032-1039.
Binkley, J. 2008. Calorie and Gram Differences between Meals at Fast Food and Table
Service Restaurants. Review of Agricultural Economic. 30,no.4:750-763
Blaylock, J., D. Smallwood, K. Kassel, J.N.Variyam, and L.Aldrich. 1999. Economics, Food
Choices and Nutrition. Food Policy. 24:269-286.
Bowman, S. A., and B. T. Vinyard. 2004. Fast Food Consumption of U.S. Adults: Impact on
Energy and Nutrient Intakes and Overweight Status. Journal of the American College of
Nutrition. 23, no. 2: 163-68.
Bowman, S.A., S.L. Gortmaker, G.B. Ebbeling, M.A. Pereira, and D.S. Ludwig. 2004.
Effects of Fast Foods Consumption on Energy Intake and Diet Quality among Children in a

Nutritional Households Survey. Paediatrics. 113:112-118.
Briefel, R.R. and C.L.Johnson. 2004. Secular Trends in Dietary Intake In The United States.
Annual Review of Nutrition. 24:401-431
Brown, D.J., and L.F. Schrader. 1990. Cholesterol Information and Shell Egg Consumption.
American Journal of Agricultural Economics. 72, no. 3:548-555.
Browning, M., and M.D. Collado. 2007. Habits and Heterogeneity in Demands: A Panel Data
Analysis. Journal of Applied Econometrics. 22, no. 3: 625-40
Burns, C., M. Jackson, C. Gibbsons, and R.M. Stoney. 2001. Foods Prepared Outside the
Home: Association with Selected Nutrients and Body Mass Index in Adult Australians.
Public Health Nutrition. 5, no.3:441-448.
Burton, M. P. and T. Young. 1996. The Impact of BSE on the Demand for Beef and Other
Meats in Great Britain. Applied Economics. 28: 687-93.
Capps, O. Jr., and J.D. Schmitz. 1991. A Recognition of Health and Nutrition Factors in
Food Demand Analysis. Western Journal of Agricultural Economics. 16, no.1:21-35.
Chern, W.S., and K. Rickertsen. 2003. Health, Nutrition and Food Demand. CABI
publishing. Wallingford, Oxon, UK.
CSPI. Center for Science in the Public Interest. 2008. “Trans Fat”. Web page [accessed
2008]. Available at http://www.cspinet.org/transfat/index.html.
Davis, C.G. 1997. The Logic of Testing Structural Change in Meat Demand: A
Methodological Analysis and Appraisal. American Journal of Agricultural Economics. 79,
no. 4: 1186-92.
Davis, C.G. 1982. Linkages Between Socioeconomic Characteristics, Food Expenditure
Patterns, and Nutritional Status of Low Income Households: A Critical Review. American
Journal of Agricultural Economics. 68:1017-1025.
Devaney, B, and T. Fraker. 1989. The Dietary Impacts of the School Breakfast Program.
American Journal of Agricultural Economics 71, no. 4: 932-48.
Dhehibi, B., J. M. Gil, and A. M. Angulo. 2003. Nutrient Effects on Consumer Demand: A
Panel Data Approach. Proceedings of the 25th International Conference of Agricultural
Economists (IAAE).
Drewnowski, A. 2005. Concept of a Nutritious Food: Toward A Nutrient Density Score.
American Journal of Clinical Nutrition. 82, no. 4: 721-32.
Drewnowski, A. 2003. Fat and Sugar: An Economic Analysis. The Journal of Nutrition.
133:838S-840S.

Duffey, K.J., P.G. Larsen, D.R. Jacobs, Jr., O. D. Williams, and B.M. Popkin. 2007.
Differential Association of Fast Food and Restaurant Food Consumption with 3-Yr Change
in Body Mass Index: The Coronary Artery Risk Development in Young Adult Study.
American Journal of Clinical Nutrition. 85:201-208.
Eastwood, D. B., J.R. Brooker, and D.E. Terry. 1986. Household Nutrient Demand: Use of
Characteristics Theory and a Common Attribute Model. Southern Journal of Agricultural
Economic. 18, no.2:235-246.
Fitzpatrick, M.P., G.E. Chapman, and S.I. Barr. 1997. Lower-Fat Menu Items In Restaurants
Satisfy Customers. Journal of American Dietetic Association. 97, no.5:510-514.
Fousekis, P., and P. Lazaridis. 2005. The Demand for Selected Nutrients by Greek
Households: An Empirical Analysis with Quantile Regressions. Agricultural Economics.
32:267-279.
French, S. A., M. Story, D. Neumark-Sztainer, J. A. Fulkerson , and H. Hannan. 2001. Fast
Food Restaurant Use among Adolescents: Associations with Nutrient Intake, Food Choices
and Behavioural and Psychosocial Variables. International Journal of Obesity. 25, no. 12:
1823-33.
French, S. A., M. Story, and R. W. Jeffery. 2001. Environmental Influences on Eating and
Physical Activity. Annual Review of Public Health. 22: 309-35.
French, S.A., L. Harnack, and R.W. Jeffery. 2000. Fast Food Restaurant Use Among Women
In the Pound of Preservation Study: Dietary, Behavioural and Demographic Correlates.
International Journal of Obesity. 24;1353-1359.
Gills, L.J., O. Bar-Or. 2003. Food Away from Home, Sugar Sweetened Drink Consumption
and Juvenile Obesity. Journal of American College of Nutrition. 22, no.6:539-545.
Guthrie, J., F. B. Lin, and E. Frazao. 2002. Role of Food Prepared Away From Home in the
American Diet, 1977-78 versus 1994-96: Changes and Consequences. Journal of Nutrition
Education and Behaviour. 34, no. 3: 140-150.
Grossman, M. 1972. On The Concept of Health Capital and Demand For Health. Journal of
Political Economics. 80, 223–255.
Grossman, M., R.Kaestner. 1997. Effects of Education On Health. In Behrman, J. R., Stacey,
N. G. (Eds.) The Social Benefits of Education. University of Michigan Press, Ann Arbor, MI,
pp. 69–123.
Hansen R.G., B.W. Wyse, and A.W. Sorenson. 1979. Nutrition Quality Index of Food.
Westport: CT: AVI Publishing Co.
Health Canada. 2008. Food and Nutrition: Food Labelling. Web page [accessed 2008].
Available at http://www.hc-sc.gc.ca/fn-an/pubs/label-etiquet/index-eng.php
Huang, K.S. and B.H.Lin. 2000. Estimation of Food Demand and Nutrition Elasticities from
Household Survey Data. Food and Rural Economic Division, Economic Research Service,
U.S. Department of Agriculture. Technical Bulletin No. 1887.
Huang, C.L., and S. Misra. 1991. Assessing Nutritional Adequacy of Americans Based on
Individual Food Intake Patterns. Journal of Consumer Studies and Home Economics. 15:147-
159.
Kim, S.R., and W.S. Chern. 1999. Alternative Measures of Health Information and Demand
for Fats and Oils In Japan. The Journal of Consumer Affairs. 30, no. 1:92-109.
Kinnucan, H.W., H. Xiao, C.J.Hsia, and J.D.Jackson. 1997. Effects of Health Information
and Generic Advertising on U.S. Meat Demand. American Journal of Agricultural
Economics. 79, no. 1: 13-23.
Morgan, K.J., 1986. Socio-Economic Factors Affecting Dietary Status: An Appraisal.
American Journal of Agricultural Economics. 68, no.5:1240-1246.
Nayga, R. M. Jr., and O.Capps. Jr. 1994. Analysis of Away-from-Home and At-Home Intake
of Saturated Fat and Cholesterol. Review of Agricultural Economics. 16, no. 3: 387-98.
Nayga, R. M. Jr., 1994. Effects of Socioeconomic and Demographic Factors on Consumption
of Selected Food Nutrients. Agricultural and Resource Economics Review.23, no.2:171-182.
Nayga, R. M. Jr., and O. Capps, Jr. 1992. Determinants of Food Away from Home
Consumption: - An Update. Agribusiness. 8, no. 6: 549-59.
Nayga, R. M. Jr., J. Beverly, T.L. Rosenzweig. 1999. Assessing The Importance of Health
Related Factors on Food Demand: A Variable Preference Investigation. Applied Economics.
31:1541-1549.
Nestle, M. 2002. Food Politics: How the Food Industry Influences Nutrition and Health:
Revised and expanded version. The University of California Press.
NPD Group Inc. 2007. “Food Service: Consumer Tracking”. Web page, [accessed 2007].
Available at http://www.npd.com/corpServlet?nextpage=foodservice-crest_s.html.
Paeratakul, S., D.P. Ferdinand, C. M. Champagne, D.H. Ryan, and G. A. Bray. 2003. Fast-
Food Consumption Among US Adults and Children: Dietary and Nutrient Intake Profile.
Journal of American Dietetic Association. 103, no. 10: 1332-1338.
Patra,J., S. Popaya, J.Rehm, S.Bondy, R. Flint and N. Giesbrecht. 2007. Economic Cost of
Chronic Diseases in Canada 1995-2003. Report prepared for the Ontario Chronic Diseases
Prevention Alliances and the Ontario Public health Association.
Patric, H. and T.A.Nicklas. 2005. A review of Family and Social Determinants of Children‟s
Eating Patterns and Diet Quality. Journal of American College of Nutrition. 24,no2:83-92.
Pereira, M. A., A. Kartashov, C.B. Ebbeling, L.V. Horn, M.L. Slattery, D.R. Jacobs, Jr., and
D.S. Ludwig. 2005. Fast Food Habits, Weights Gain and Insulin Resistance (The CARDIA
Study):15-Year Prospective Analysis. Lancet. 365: 36-42.
Park, J., G.C. Davis. 2001. The Theory and Econometrics of Health Information in Cross-
Sectional Nutrient Demand Analysis. American Journal of Agricultural Economics. 84, no.
4:840-851.
Parliament of Canada. 2006. Bill C-283. Web page, [accessed in 2008]. Available at
http://www2.parl.gc.ca/content/hoc/Bills/391/Private/C-283/C-283_1/C-283_1.PDF
Patterson, R. E., P. S. Haines, and B. M Popkin. 1994. Diet Quality Index: Capturing A
Multidimensional Behaviour. Journal of the American Dietetic Association. 94, no. 1: 57-64.
Popkin, B.M. 2006. Global Nutrition Dynamics: The World is Shifting Rapidly Towards a
Diet Linked With Non-Communicable Diseases. The American Journal of Clinical Nutrition.
84:289-98.
Ramezani, C. A., 1995. Determinants of Nutrient Demand: A Nonparametric Analysis.
Journal of Agricultural and Resource Economics. 20, no. 1: 165-77.
Richards, T. J., P.M. Patterson, M. Paul , and S.Hamilton. 2007. Fast Food, Addiction, and
Market Power. Journal of Agricultural and Resource Economics. 32: 425-47.
Rickertsen, K., 1998. The Effects of Advertising in an Inverse Demand System: Norwegian
Vegetables Revisited. European Review of Agricultural Economics. 25, no. 1: 129-40.
Statistics Canada. 2007. "Survey of Household Spending and CANSIM II (table no. 203-
0002)." Web page, [accessed January 2008]. Available at http://www.statcan.ca/cgi-
bin/imdb/p2SV.pl?Function=getSurvey&SDDS=3508&lang=en&db=imdb&dbg=f&adm=8
&dis=2 .
Subramanian, S., and A. Deaton. 1996. The Demand for Food and Calories. The Journal of
Political Economy. 104, no. 1: 133-62.
Tansel, A. 1993. Cigarette Demand, Health Scares and Education in Turkey. Applied
Economics. 25: 521-29.
Thompson, O.M., C. Ballew, K. Resnicow, A. Must, L.G.Bandini, H. Cyr, and W.H. Dietz.
2004. Food Purchased Away From Home as a Predictor of Change in BMI-Z Score Among
Girls. International Journal of Obesity. 28:282-289.
Taveras, E.M., C.S. Berkey, S. L. Rifas-Shiman, D.S. Ludwig, H.R.H. Rockett, A.E. Field,
G. A. Colditz, and M.W. Gillman. 2001. Association of Consumption of Fried Food Away
From Home with Body Mass Index and Diet Quality in Older Children and Adolescents.
Paediatrics. 116, no. 4:e518-e524.
USDA National Nutrient Data Base. 2007. "Nutrient Data Laboratory". Web page [accessesd

in 2007]. Also available at http://www.nal.usda.gov/fnic/foodcomp/search/
Variyam, J. N., and E. Golan. 2002. New Health Information is Reshaping Food Choices.
Food Review. 25, no.1:13-18.
Variyam, J. N. 2005. Nutrition Labelling in the Food-Away-From-Home Sector: An
Economic Assessment. USDA-ERS Economic Research Report. Report no.4.
Variyam, J. N., J. Blaylock, and D. Smallwood. 2002. Characterizing the Distribution of
Macronutrients Intake among U.S. Adults: A Quantile Regression Approach. American
Journal of Agricultural Economics. 84, no. 2:454-466.
Verlegh, P.W.J. and M.J.J.M.Candel. 1999. Consumption of Convenience Foods: Reference
Groups and Eating Situations. Food Quality and Preference. 10:457-464.