demand charges & electric vehicle fast-charging
TRANSCRIPT

Demand Charges & Electric Vehicle Fast-Charging
An Intermountain
West Assessment
October 2021

2
Acknowledgements
The National Association of State Energy Officials (NASEO) acknowledges the significant contributions of the Western Interstate Energy Board and the Utah Clean Cities Coalition, who worked in partnership to develop and author this report. NASEO especially appreciates the U.S. Department of Energy’s Clean Cities Program for recognizing the importance of transportation electrification and providing support to make this report possible.
Our special thanks go to the CORWest Advisory Committee Members for graciously sharing their important expertise and perspectives throughout this project: Arizona Department of Administration; Valley of the Sun Clean Cities Coalition; Colorado Energy Office; Colorado Department of Transportation; Denver Metro Clean Cities Coalition; Northern Colorado Clean Cities Coalition; Idaho Governor’s Office of Energy and Mineral Resources; Idaho Department of Transportation; Treasure Valley Clean Cities Coalition; Montana Department of Environmental Quality Energy Office; Yellowstone-Teton Clean Cities; Nevada Governor’s Office of Energy; Nevada Department of Transportation; New Mexico Energy, Minerals, and Natural Resources Division; New Mexico Department of Transportation; Land of Enchantment Clean Cities Coalition; Utah Governor’s Office of Energy Development; Utah Department of Transportation; Wyoming Department of Transportation; and the Wyoming Energy Authority.
This report was authored by Dylan Tucker, NASEO Senior Program Manager with support from Melanie Snyder, Western Interstate Energy Board Program Manager, and Utah Clean Cities. Valuable input was provided by the CORWest Advisory Committee and external reviewers from Kellen Schefter and Shelby Linton-Keddie of the Edison Electric Institute, Paul Allen of MJ Bradley and Associates, Jamie Barber of the Georgia Public Service Commission, Nick Revere of the Michigan Public Service Commission, Marie Steele of NV Energy, Mark LeBel of the Regulatory Assistance Project, and Richard Bachmeier of Tucson Electric Power.

3
Table of Contents
Executive Summary……………….………………………………………………………………4 Introduction…………….………………………………………………………………………….5 Background on Electric Vehicles and Demand Charges…………………………………………...6 Examples of DCFC-Specific Rates………………………………………………………...8 Methodology……….…………………………………………………………………………….10 ESP Selection and Data Collection……….……………………………………………...10 Data Analysis and Assumptions……….…………………………………………………11 Results…….……………………………………………….……………………………………..13 Average Costs and Trends…….………………………………………………………….13 User Price Certainty and Predictability…….……………………………………………15 Case Studies…….……………………………………………….……………………….17 Conclusion.…….……………………………………………….………………………………..18 Appendix: Electric Service Providers - Expected Rates per Charging Event by State…………..20

4
Executive Summary
The National Association of State Energy Official’s (NASEO) Demand Charges and Electric Vehicle Fast-Charging: an Intermountain West Assessment, is an analysis of demand charges and rate structures from a sample of 41 electric service providers (ESPs) throughout the Intermountain West, including investor-owned utilities (IOUs), consumer-owned electric cooperatives, and municipally owned utilities. A range of electric vehicle (EV) fast charging scenarios is then applied to each ESP’s rate structure, to provide illustrative examples of how these electric demand charges impact electric bills for DC Fast Charging (DCFC) station hosts, and by association, prices paid by consumers for fast charging. The goal is to provide a snapshot of current electric rates paid by DCFC station hosts to better inform State Energy Officials and their partners about various approaches to EV-related demand charge structures. A follow-up paper will address alternative strategies to reduce demand charges and support affordable electric bills for end-users, particularly in off-grid or grid-edge environments leveraging on-site storage or generation. Demand charges are a typical element of commercial and industrial electric service rates, charging consumers for the peak amount of power (kW) used at one time, per billing cycle. This provides ESPs a way “to recover some of the costs associated with providing sufficient electricity generation and distribution capacity to their customers.”1 Demand charges are intended to help ESPs keep power systems appropriately sized, efficient, and more affordable for all consumers. However, DCFC infrastructure has relatively unique power demands, with high power capacity required for fast charging, but relatively small amounts of energy consumed per charge. These demand charges are one element that may prevent DCFC station hosts from earning a profit from EV charging services. This assessment examines the scale and impact of demand charges on sample bills for DCFC station hosts, with a focus on the eight Intermountain West states participating in the CORWest Project.2 Across the scenarios examined, demand charges account for nearly 74 percent of the average DCFC station host electric bill. Other factors such as changes in service territory, changes to rate class designation, and rates that fluctuate by time of day and the season make it difficult for DCFC station hosts to provide charging at consistent prices which are competitive with gasoline fueling. These barriers are particularly acute in rural areas, which often have lower-capacity electric infrastructure and fewer potential consumers to pay back investments in DCFC stations. Finally, several rate pilots are being tested to better manage costs associated with DCFC station construction and demand charges. Three strategies being tested are: 1) a temporary reduction in demand charges, 2) alternative maximum demand charge fees capped by kWh energy consumption, and 3) subscription plans for charging services.
1 Clean Energy Group and the National Renewable Energy Laboratory. “An Introduction to Demand Charges.” August 2017. < https://www.cleanegroup.org/wp-content/uploads/Demand-Charge-Fact-Sheet.pdf>. 2 Please see the text box on the following page for more information.
5
Introduction State governments throughout the Western United States have committed to developing an interconnected network of Electric Vehicle (EV) fast charging stations (referred to as Direct Current Fast Charging, DCFC, or Level 3 charging). To ensure this infrastructure development is deployed efficiently, while also enabling a safe, reliable, and affordable charging experience for EV owners, states have collaborated on regional DCFC corridors. For example, the West Coast Electric Highway is a collaboration of California, Oregon, Washington, and the Province of British Columbia, launched in 2014 to support zero-emission vehicle drivers by providing a network of fast charging stations, “enabling electric vehicle drivers to make longer trips and travel between cities.”3 The REV West collaboration was launched in 2017 when the Governors of Arizona, Colorado, Idaho, Montana, Nevada, New Mexico, Utah, and Wyoming signed a Memorandum of Understanding to collaborate on EV infrastructure deployment.4 Initially this work was led by the Governor-designated State Energy Office in each state. As the partnership has progressed state Departments of Transportation have been incorporated, and now the group has partnered with every Clean Cities Coalition in the region through the CORWest Project. In 2019 all eight Governors re-committed to REV West with an updated MOU, expanding the scope of the partnership and enabling better coordination across state agencies.5 As states have worked to develop infrastructure networks to charge EVs, engagement with local ESPs has become a vital step, as they own key electric infrastructure and act as a fuel provider for EVs. However, demand charges on electric bills have emerged as a major barrier to regional DCFC development: differing rates are offered for EV charging throughout regional corridors, and this assessment finds that demand charges account for nearly 74 percent of a DCFC station’s average bill. To depict the current state of DCFC electric bills, this assessment examines a sample of electric rates throughout the Intermountain West and applies these rate structures to a set of light-duty
3 Washington State Department of Transportation. “West Cost Electric Highway.” West Coast Green Highway. Accessed January 5, 2021. <http://www.westcoastgreenhighway.com/electrichighway.htm>. 4 “Memorandum of Understanding: Regional Electric Vehicle Plan for the West.” October 12 2017. <https://www.naseo.org/Data/Sites/1/revwest_mou.pdf>. 5 “Memorandum of Understanding: Regional Electric Vehicle Plan for the West.” December 13 2019. <https://www.naseo.org/Data/Sites/1/revwest_mou_2019_final.pdf>.
The CORWest Project – Led by the Utah Clean Cities Coalition The CORWest Project is a collaboration between the REV West states and all of the Clean Cities
Coalitions in the Intermountain West, spanning Arizona, Colorado, Idaho, Montana, Nevada, New
Mexico, Utah, and Wyoming. CORWest – led by the Utah Clean Cities Coalition – will be implemented
from 2020 – 2022, with support from NASEO, who has facilitated the REV West partnership since 2018.
The CORWest Project will support with several key goals:
• Remove barriers to investment, enabling private DCFC station development;
• Identify key infrastructure gaps, and develop solutions to deploy charging stations, particularly
in rural regions to complete regional charging corridors;
• Develop replicable tools to encourage consumer awareness and education around EV options
as well as economic, cost, and environmental benefits.

6
EV DCFC charging scenarios. All costs will be presented from the point of view of a DCFC station host paying an electric bill, rather than EV drivers paying to use a station. This analysis does not attempt to propose business models, rates, or fee structures for charging stations or ESPs; it simply examines the current cost of providing DCFC as a station host throughout the Intermountain West region. A follow-up report under the CORWest project will examine alternative strategies to reduce electric bills for DCFC station hosts, including on-site storage, generation, and managed charging. The affordability of charging fluctuates greatly based on station usage.6 In the high-use scenarios, the average cost per charge is below $10 at all power levels, and individual cases never exceeds $20/charge, significantly lower than the cost of gasoline fueling. However, in the low- and medium-use scenarios which more closely reflect today’s conditions, the forecasted cost of charging reaches 4-40 times as expensive as the cost to fill a gasoline vehicle.
Background on Electric Vehicles and Electricity Demand Charges Currently, EVs make up a small portion of light-duty passenger vehicle sales, with just over two percent of sales in 2019.7 However, forecasts predict rapid growth: with over 20 new electric models hitting the market in 2021 sales are expected to jump 70 percent in 20218 and could surpass the sales of internal combustion engine vehicles as early as 2030.9 Some states, including California, are moving to adopt policies that would require virtually all new cars sold after 2035 to be Zero Emission Vehicles. Automakers are also making significant investments and commitments to bring multiple new EV models to market sooner than previously predicted, and some plan to phase out gasoline vehicles entirely.10 While most EV charging occurs at homes or offices, public DCFC stations are vital to widespread EV adoption, supporting drivers in multi-unit homes and those taking longer trips. Furthermore, studies have shown that the presence of public DCFC stations relieve consumers’ range anxiety around adopting this new technology,11 the primary concern over EV adoption.12
6 This report will use the threshold of $50/charging event and below to define affordable. Most light duty-vehicles in the United States have gas tanks between 12- and 15-gallons. Assuming a price of gasoline of $3/gallon, this $50/charge threshold is the upper end of what a gasoline fueling session should cost. This a conservative comparison for electric charging, as EV drivers only charge half their batteries during a charging session (discussed below), which is built into the cost assumptions of this report. 7 McDonald, Loren. “Forecast: 2021 EV Sales to Increase 70% Year Over Year.” Clean Technica. October 30,
2020. <https://cleantechnica.com/2020/10/30/forecast-2021-us-ev-sales-to-increase-70-year-over-year/>. 8 Id. 9 Boston Consulting Group. “Who Will Drive Electric Vehicles to the Tipping Point?” January 2, 2020. <https://www.bcg.com/en-us/publications/2020/drive-electric-cars-to-the-tipping-point>. 10 Eisenstein, Paul. “GM to go All-Electric by 2035, phase out gas and diesel engines.” NBC News. January 21, 2021. <https://www.nbcnews.com/business/autos/gm-go-all-electric-2035-phase-out-gas-diesel-engines-n1256055>. 11 Li, Shanjun, Lang Tong, Jianwei Xing, and Yiyi Zhou. “The Market for Electric Vehicles: Indirect Network Effects and Policy Design.” Journal for the Association of Environmental and Resource Economists. Volume 4, Number 1. March 2017. <https://www.journals.uchicago.edu/doi/full/10.1086/689702>. 12 Autolist. “Survey: Price, range and weak charging network are top reasons consumers avoid EVs.” August 19, 2019. <https://www.autolist.com/news-and-analysis/survey-electric-vehicles>.
7
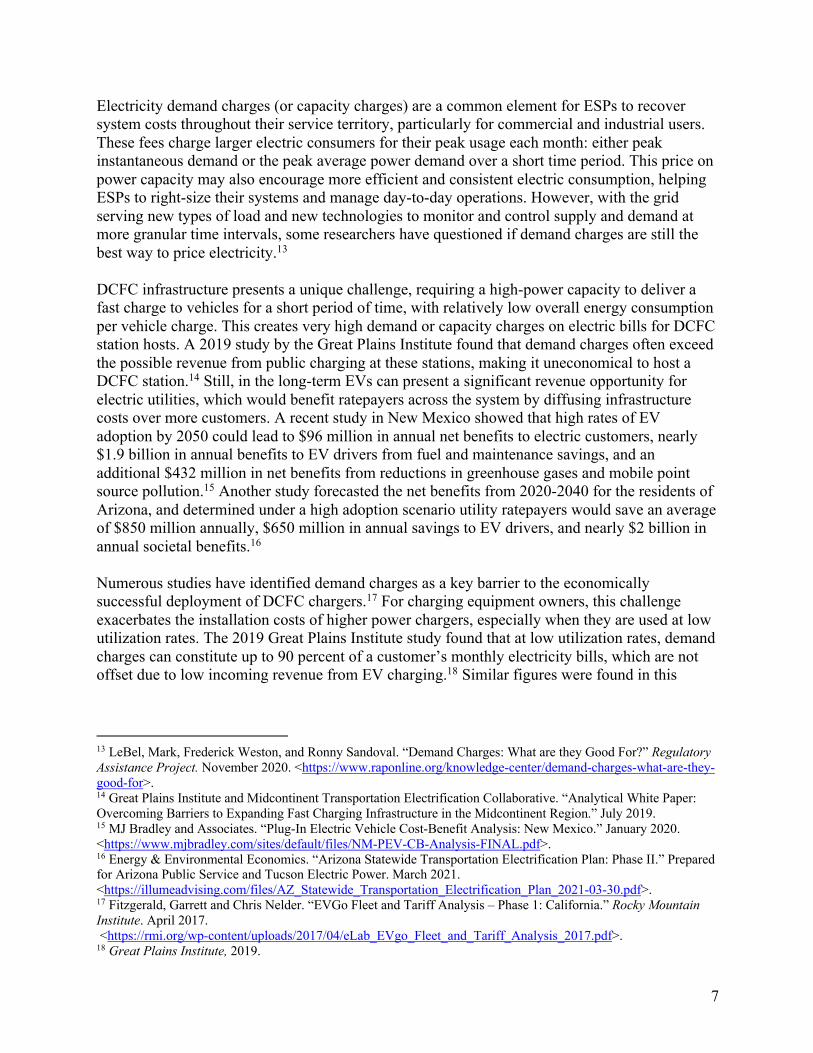
Electricity demand charges (or capacity charges) are a common element for ESPs to recover system costs throughout their service territory, particularly for commercial and industrial users. These fees charge larger electric consumers for their peak usage each month: either peak instantaneous demand or the peak average power demand over a short time period. This price on power capacity may also encourage more efficient and consistent electric consumption, helping ESPs to right-size their systems and manage day-to-day operations. However, with the grid serving new types of load and new technologies to monitor and control supply and demand at more granular time intervals, some researchers have questioned if demand charges are still the best way to price electricity.13 DCFC infrastructure presents a unique challenge, requiring a high-power capacity to deliver a fast charge to vehicles for a short period of time, with relatively low overall energy consumption per vehicle charge. This creates very high demand or capacity charges on electric bills for DCFC station hosts. A 2019 study by the Great Plains Institute found that demand charges often exceed the possible revenue from public charging at these stations, making it uneconomical to host a DCFC station.14 Still, in the long-term EVs can present a significant revenue opportunity for electric utilities, which would benefit ratepayers across the system by diffusing infrastructure costs over more customers. A recent study in New Mexico showed that high rates of EV adoption by 2050 could lead to $96 million in annual net benefits to electric customers, nearly $1.9 billion in annual benefits to EV drivers from fuel and maintenance savings, and an additional $432 million in net benefits from reductions in greenhouse gases and mobile point source pollution.15 Another study forecasted the net benefits from 2020-2040 for the residents of Arizona, and determined under a high adoption scenario utility ratepayers would save an average of $850 million annually, $650 million in annual savings to EV drivers, and nearly $2 billion in annual societal benefits.16 Numerous studies have identified demand charges as a key barrier to the economically successful deployment of DCFC chargers.17 For charging equipment owners, this challenge exacerbates the installation costs of higher power chargers, especially when they are used at low utilization rates. The 2019 Great Plains Institute study found that at low utilization rates, demand charges can constitute up to 90 percent of a customer’s monthly electricity bills, which are not offset due to low incoming revenue from EV charging.18 Similar figures were found in this
13 LeBel, Mark, Frederick Weston, and Ronny Sandoval. “Demand Charges: What are they Good For?” Regulatory Assistance Project. November 2020. <https://www.raponline.org/knowledge-center/demand-charges-what-are-they-good-for>. 14 Great Plains Institute and Midcontinent Transportation Electrification Collaborative. “Analytical White Paper: Overcoming Barriers to Expanding Fast Charging Infrastructure in the Midcontinent Region.” July 2019. 15 MJ Bradley and Associates. “Plug-In Electric Vehicle Cost-Benefit Analysis: New Mexico.” January 2020. <https://www.mjbradley.com/sites/default/files/NM-PEV-CB-Analysis-FINAL.pdf>. 16 Energy & Environmental Economics. “Arizona Statewide Transportation Electrification Plan: Phase II.” Prepared for Arizona Public Service and Tucson Electric Power. March 2021. <https://illumeadvising.com/files/AZ_Statewide_Transportation_Electrification_Plan_2021-03-30.pdf>. 17 Fitzgerald, Garrett and Chris Nelder. “EVGo Fleet and Tariff Analysis – Phase 1: California.” Rocky Mountain Institute. April 2017. <https://rmi.org/wp-content/uploads/2017/04/eLab_EVgo_Fleet_and_Tariff_Analysis_2017.pdf>. 18 Great Plains Institute, 2019.

8
study, available in the appendix. DCFC stations with higher power levels provide faster charging for consumers, but also trigger significant demand charges.19
High costs for charging infrastructure and power are particularly acute in rural and remote regions that do not have sufficient electric infrastructure throughout their service territory to accommodate significant additional demand, and struggle to attract enough customers for high station utilization. Challenging geography in the Intermountain West often exacerbates this problem. It is increasingly clear that in order to successfully and economically deploy EV charging infrastructure, particularly DCFC, demand charges within ESP rate structures must be carefully examined.
Examples of DCFC-Specific Rates Several ESPs throughout the United States have already implemented rates that are tailored specifically for EVs and DCFC charging. Since most EV charging occurs at homes, one common policy is to offer extremely low prices for charging overnight, when system demand is at its lowest. However, this does not address the concern around DCFC stations, which are generally located at commercial operations and busiest during the day.20 DCFC-specific rates are less common, and as demonstrated in our results, time-of-use rates often increase electric bills for DCFC site hosts. As described below, DCFC-specific rates have also been implemented on a limited pilot basis for to facilitate EV adoption and gather real world data on usage in the near-term and. In some cases, these pilot rate classes specifically reduce or eliminate demand charges. Additional case studies from the Intermountain West region are featured in the Results section.
19 Id. 20 Smart, John. “DC Fast Charging and Demand Charges.” Idaho National Laboratory – Energy Storage and Advanced Vehicles. September 7, 2016. Slide 6. <https://avt.inl.gov/sites/default/files/pdf/presentations/INL%20Smart%20DC%20Fast%20Charging%20and%20Demand%20Charges.pdf>.
Speed Matters: Impacts of Power Levels on the User Experience DC fast charging usually refers to stations that can provide at least 50 kW of power instantaneously.
However, charging speeds can be much faster if the infrastructure can support it. Many automakers advocate
for charging speeds provided by 350 kW at DCFC stations. This would require more advanced electric
infrastructure at DCFC stations but would enhance the consumer experience.
When creating charging scenarios for this report, we assumed a vehicle battery size of 50 kWh, and three
charger capacities: 50 kW, 150 kW, and 300 kW. Full explanations for these assumptions are in the
Methodology section below. However, to demonstrate the difference in user experience, the rough charging
time for a 50 kWh battery at each of these three stations types are as follows:
• 50 kWh battery charging at 50 kW: one hour to completely charge
• 50 kWh battery charging at 150 kW: twenty minutes to completely charge
• 50 kWh battery charging at 300 kW: ten minutes to completely charge.
Thus, the charging speed of the infrastructure can vary greatly. As automakers seek to improve the range of
EVs, battery sizes will increase as well, amplifying the difference in charging speeds.
9
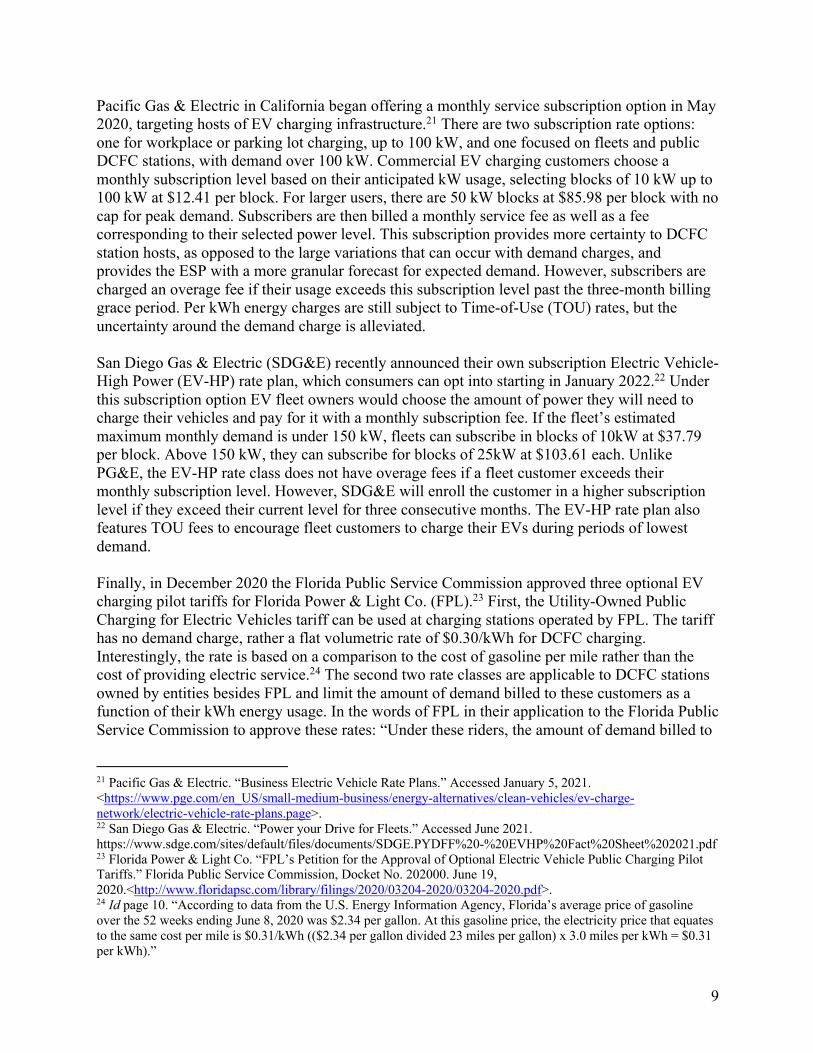
Pacific Gas & Electric in California began offering a monthly service subscription option in May 2020, targeting hosts of EV charging infrastructure.21 There are two subscription rate options: one for workplace or parking lot charging, up to 100 kW, and one focused on fleets and public DCFC stations, with demand over 100 kW. Commercial EV charging customers choose a monthly subscription level based on their anticipated kW usage, selecting blocks of 10 kW up to 100 kW at $12.41 per block. For larger users, there are 50 kW blocks at $85.98 per block with no cap for peak demand. Subscribers are then billed a monthly service fee as well as a fee corresponding to their selected power level. This subscription provides more certainty to DCFC station hosts, as opposed to the large variations that can occur with demand charges, and provides the ESP with a more granular forecast for expected demand. However, subscribers are charged an overage fee if their usage exceeds this subscription level past the three-month billing grace period. Per kWh energy charges are still subject to Time-of-Use (TOU) rates, but the uncertainty around the demand charge is alleviated. San Diego Gas & Electric (SDG&E) recently announced their own subscription Electric Vehicle-High Power (EV-HP) rate plan, which consumers can opt into starting in January 2022.22 Under this subscription option EV fleet owners would choose the amount of power they will need to charge their vehicles and pay for it with a monthly subscription fee. If the fleet’s estimated maximum monthly demand is under 150 kW, fleets can subscribe in blocks of 10kW at $37.79 per block. Above 150 kW, they can subscribe for blocks of 25kW at $103.61 each. Unlike PG&E, the EV-HP rate class does not have overage fees if a fleet customer exceeds their monthly subscription level. However, SDG&E will enroll the customer in a higher subscription level if they exceed their current level for three consecutive months. The EV-HP rate plan also features TOU fees to encourage fleet customers to charge their EVs during periods of lowest demand. Finally, in December 2020 the Florida Public Service Commission approved three optional EV charging pilot tariffs for Florida Power & Light Co. (FPL).23 First, the Utility-Owned Public Charging for Electric Vehicles tariff can be used at charging stations operated by FPL. The tariff has no demand charge, rather a flat volumetric rate of $0.30/kWh for DCFC charging. Interestingly, the rate is based on a comparison to the cost of gasoline per mile rather than the cost of providing electric service.24 The second two rate classes are applicable to DCFC stations owned by entities besides FPL and limit the amount of demand billed to these customers as a function of their kWh energy usage. In the words of FPL in their application to the Florida Public Service Commission to approve these rates: “Under these riders, the amount of demand billed to
21 Pacific Gas & Electric. “Business Electric Vehicle Rate Plans.” Accessed January 5, 2021. <https://www.pge.com/en_US/small-medium-business/energy-alternatives/clean-vehicles/ev-charge-network/electric-vehicle-rate-plans.page>. 22 San Diego Gas & Electric. “Power your Drive for Fleets.” Accessed June 2021. https://www.sdge.com/sites/default/files/documents/SDGE.PYDFF%20-%20EVHP%20Fact%20Sheet%202021.pdf 23 Florida Power & Light Co. “FPL’s Petition for the Approval of Optional Electric Vehicle Public Charging Pilot Tariffs.” Florida Public Service Commission, Docket No. 202000. June 19, 2020.<http://www.floridapsc.com/library/filings/2020/03204-2020/03204-2020.pdf>. 24 Id page 10. “According to data from the U.S. Energy Information Agency, Florida’s average price of gasoline over the 52 weeks ending June 8, 2020 was $2.34 per gallon. At this gasoline price, the electricity price that equates to the same cost per mile is $0.31/kWh (($2.34 per gallon divided 23 miles per gallon) x 3.0 miles per kWh = $0.31 per kWh).”

10
public fast charge stations will be the lesser of: measured demand, as conventionally determined; and limited demand, as calculated by dividing energy sales (kWh) by a fixed constant of 75 hours.”25 All other bill components are billed as FPL’s General Service or General Large Service rate classes. Methodology This assessment catalogues information on billing components from select ESPs across the eight Intermountain West states participating in the CORWest project,26 and applied a common set of DCFC scenarios to forecast expected electric bills. All sample bills generated through this analysis leveraged publicly available information and represent costs to station hosts, not EV drivers. For easier comparison to gasoline fueling and other electric bills, costs are presented on a per charge and per kWh basis. To set an upper and lower limit of DCFC station peak demand, we relied on the REV West Voluntary Minimum Standards. This document—approved by all eight Governors in the Intermountain West in December 2019—sets non-binding minimum DCFC station standards, as well as stretch goals for stations. These standards aim for a minimum power supply of 50 kW per charger, with 150 kW as the stretch goal. This analysis focused on the range of 50 kW to 300 kW corresponding to a single vehicle charging at the 50 kW Voluntary Minimum Standard up to a scenario of two vehicles charging simultaneously at the 150 kW stretch standard. ESP Selection and Data Collection To select a subset of ESPs for this study, the project team chose five ESPs from each of the eight participating states based on the selection criteria below. These criteria are listed in order of importance, and were developed to ensure that the largest and most impactful ESPs in each state were included, as well as ESPs near DCFC corridors and national parks, corresponding with the goals of the CORWest program:
1. The state’s largest investor-owned utility, cooperative, and municipal utility, based on the number of customers;
2. ESPs with territory along key regional charging corridor gaps, as identified in the REV West DCFC map;
3. ESPs with territory including national parks or gateway communities; 4. ESPs suggested by the CORWest Advisory Committee in that state.
As a final step in the selection process, members of the CORWest Advisory Committee27 provided input on the proposed set of ESPs to study within their state, leveraging their local expertise on DCFC deployment and service providers. The Navajo Tribal Electric Authority spans several states but was not large enough to meet the selection criteria in any one state. It was included as a sixth ESP in New Mexico, bringing the total ESPs studied to 41.
25 Id, page 15. 26 Arizona, Colorado, Idaho, Montana, Nevada, New Mexico, Utah, and Wyoming. 27 Including representatives from each state’s State Energy Office, Department of Transportation, and Clean Cities Coalitions.

11
Once the sample of 41 ESPs was selected, the research team determined which rate classes were appropriate to examine. The project team prioritized commercial rate classes serving customers with a peak demand between 50 kW and 300 kW, as explained above. Additionally, special rate classes servicing DCFC infrastructure were considered where appropriate. If an ESP had several rate classes which apply to these scenarios, each rate class was evaluated. Most billing rate information was readily available on company websites.28 Finally, a small number of ESPs account for their customers’ load factor to classify rate classes. These limits were not as readily available as kW and price information, and would require additional assumptions not applying to the full set of ESPs, so scope was limited to kW thresholds. As a final step before analysis, key information was then gathered for each rate class: power requirements to qualify for that rate class, relevant demand charges, monthly service fees, and kWh charges. Rates can change often, and several ESPs have submitted DCFC rates which are not yet approved. Rates in this study represent a snapshot of existing and public rates as of June 2021. Data Analysis and Assumptions Most ESPs had several service classes or billing rates that applied to DCFC scenarios. Depending on the utility, this had several causes: 1) a change in rate classes due to a peak demand threshold (kW) or monthly energy usage threshold (kWh); 2) the option of Time-of-Use rates; 3) differing summer and winter rates; and 4) a small number of ESPs had instituted an EV fast-charging rate. Nearly every utility had on-peak and off-peak charging rates as well, but with DCFC charging occurring primarily during business hours along corridor routes,29 daily peak rates are assumed throughout this analysis. In total, 73 billing rates were considered to capture an accurate snapshot of prices for the 41 ESPs. Once data on the appropriate rate structures was collected, the research team developed sample DCFC site host electric bills for each rate, based on different station- use and station-power scenarios. Given the rural focus of the CORWest Project, and the current low utilization of these stations, the research team included very low-use scenarios. The low-use scenario assumes one EV charge per week (four a month); medium-use assumes ten charges per week; and high-use assumes one hundred charges per week. The low-use and medium-use scenarios were built around existing station use trends, leveraging data from stations hosted by CORWest project partners. The high-use scenario represents a forward-looking scenario where more consumers are driving EVs. To accurately build sample bills, the research team worked with experts at Idaho National Laboratory and the Technical Response Service supported by the U.S. Department of Energy and the National Renewable Energy Laboratory, to develop a set of assumptions to apply to each bill:
28 One municipal utility chosen for this study does not post rates publicly on their website. After multiple attempts to reach out for this information, the research team replaced them with an alternative ESP in the same state. 29 Smart, John. “DC Fast Charging and Demand Charges.” Idaho National Laboratory – Energy Storage and Advanced Vehicles. September 7, 2016. Slide 6. <https://avt.inl.gov/sites/default/files/pdf/presentations/INL%20Smart%20DC%20Fast%20Charging%20and%20Demand%20Charges.pdf>.

12
• Power and energy demand of a DCFC station: Work from the Idaho National Laboratory demonstrated that DCFC stations do not exceed the nameplate power demand of their chargers.30 Thus, no adder was included to account for the kW power demand of each station. However, a small adder of 2 kWh was added to each charging event to power the DCFC station itself.
• Several ESPs structure their demand charge by kilovolt-ampere (kVA) rather than kilowatt (kW). kVA is calculated by multiplying kW demand by the local power factor, representing the energy efficiency of electric infrastructure. Based off INL’s testing of charging equipment, the team assumed an average power factor of 0.98.31
• Charge delivered to EV batteries: A 2017 report by the Rocky Mountain Institute on behalf of EVGo provided values for the size of EV batteries and the percent of the battery filled on average.32 They also created a range of scenarios for these averages in 2027. The research team selected values in between the 2017 values, and 2027 forecasts. For this analysis it is assumed that the average EV battery is 50 kWh in size, and fuels 50 percent of its capacity at each charging event.
Using these assumptions, the project team developed more details for each of our demand scenarios. Results are then presented as an average cost per charge and cost per kWh for the station host, as well as the percent of bill derived from the demand charge.
30 Id. Slide 5. 31 Id. Slide 5. 32 Rocky Mountain Institute, 2017. Page 8.
Summary of Key Assumptions and Scenarios: • Each charging event will draw 27 kWh of power, regardless of charging speed;
• Demand charges are based on instantaneous peak demand, using kW or in some cases kWh
thresholds. Many utilities determine demand charges based on the peak 15-minute or 30-minute
interval. However, in order to simplify the analysis of 73 service classes analyzed across nine
charging scenarios, the scenario’s kW demand will double as the peak power demand;
• DCFC occurs during on-peak hours;
• DCFC is not charged to residential rate classes, only commercial or industrial classes;
• Primary electric service, not secondary;
• Distribution level service, not transmission level;
• These rates represent a snapshot in time. Electric rates can change often, so these ESP electric bills
reflect publicly posted rate schedules as of June 2021.
Power/Use Scenario Low-Use
(4 charges/month) Medium-Use 40 charges/month)
High-Use (400 charges/month)
Low Power (50 kW)
108 kWh, peak of 50 kW
1080 kWh, peak of 50 kW
10,800 kWh, peak of 50 kW
Medium Power (150 kW)
108 kWh, peak of 150 kW
1080 kWh, peak of 150 kW
10,800 kWh, peak of 150 kW
High Power (300 kW)
108 kWh, peak of 300 kW
1080 kWh, peak of 300 kW
10,800 kWh, peak of 300 kW

13
Results
Average Costs and Trends The expected cost per charge varied widely based on the scenario. High baseline levels of power demand across power scenarios sets a high floor for electric bills. It is only once stations usage reached high levels that average costs compete with gasoline fueling. For example, in the low-use scenarios very expensive per charge, the regional average was nearly $775 per charge or $28.62 per kWh in the high-power scenario (see Table 1). However, with high station usage, costs drop significantly to under $10 per charge and $0.35 per kWh, even in the high-power scenario (Table 3 below). Across the board, median bills were lower than the average bill, indicating that several expensive rate classes are skewing the average costs above what most ESPs are charging. As anticipated, demand charges were by far the largest portion of the overall cost of DCFC charging. Across all sample bills, the average demand charge accounted for 73.7 percent of the monthly bill and had an average value of around $10 per kW across all scenarios. User fees, charges not associated with power demand or energy use, averaged $91.74 per month. Even in low-power charging scenarios, if there is insufficient customer use, the cost per charge is uneconomical compared to gasoline fueling. As shown in Table 1, the average costs at 50 kW with low station usage is over $145 per charge, or $5.37 per kWh. In fact, with low consumer use, even at 50 kW, only 11 rate classes studied could provide charging for station hosts under $50 per charge (see appendix for full details). Four of these rate classes are from NV Energy (NVE). Of these 11 least expensive rate classes (in the low-demand scenario), five do not have demand charges, and the other six have demand charges with a maximum of $6/kW.
Sample Site Host Bill Components: Medium Power, Medium-Use Scenario Average Monthly User Fee: $91.74
+ Average Demand Charge at 150 kW: $1,497.57 + Average Energy Charges for 1,080 kWh: $71.32 = Total Average Bill: $1,660.63
Average Cost per Charging event: $41.52
Average Cost per kWh Used: $1.54

14
Table 1: Estimated Average Costs by State and ESP Type – Low Use Scenario
In the medium-use scenario of forty charges per month, average cost per charge falls below $100 for all power levels, and even below $20 per charge at 50 kW of demand. Table 2: Estimated Average Costs by State and ESP Type – Medium Use Scenario
State 50 kW 150 kW 300 kW State 50 kW 150 kW 300 kWArizona $125.19 $314.72 $581.46 Arizona $4.64 $11.66 $21.54Colorado $216.17 $567.83 $1,095.33 Colorado $8.01 $21.03 $40.57Idaho $121.93 $344.36 $682.29 Idaho $4.52 $12.75 $25.27Montana $140.20 $353.82 $670.92 Montana $5.19 $13.10 $24.85Nevada $48.95 $208.86 $400.61 Nevada $1.81 $7.74 $14.84New Mexico $193.44 $556.09 $1,099.76 New Mexico $7.16 $20.60 $40.73Utah $152.35 $427.38 $839.94 Utah $5.64 $15.83 $31.11Wyoming $147.37 $403.86 $788.59 Wyoming $5.46 $14.96 $29.21
IOU $146.14 $382.75 $732.69 IOU $5.41 $14.18 $27.14Coop $156.71 $446.06 $869.43 Coop $5.80 $16.52 $32.20Muni $108.02 $306.80 $599.96 Muni $4.00 $11.36 $22.22Demand Fee (%) 75.7% 86.4% 92.3%
Demand Fee (%) 75.7% 86.4% 92.3%
Average $145.01 $399.06 $772.66 Average $5.37 $14.78 $28.62
Average Cost per kWh: Low Use
Type of ESP
Average Cost per Charge: Low Use
Type of ESP
State 50 kW 150 kW 300 kW State 50 kW 150 kW 300 kWArizona $14.45 $33.40 $60.07 Arizona $0.54 $1.24 $2.22Colorado $22.78 $57.94 $110.69 Colorado $0.84 $2.15 $4.10Idaho $13.48 $35.72 $69.52 Idaho $0.50 $1.32 $2.57Montana $15.22 $36.55 $68.26 Montana $0.56 $1.35 $2.53Nevada $7.21 $23.07 $42.24 Nevada $0.27 $0.85 $1.56New Mexico $20.93 $57.19 $111.56 New Mexico $0.78 $2.12 $4.13Utah $16.54 $44.04 $85.30 Utah $0.61 $1.63 $3.16Wyoming $16.05 $41.70 $80.18 Wyoming $0.59 $1.54 $2.97
IOU $16.12 $39.78 $74.78 IOU $0.60 $1.47 $2.77Coop $17.30 $46.20 $88.53 Coop $0.64 $1.71 $3.28Muni $12.75 $32.62 $61.94 Muni $0.47 $1.21 $2.29Demand Fee (%) 69.4% 84.5% 89.5%
Demand Fee (%) 69.4% 84.5% 89.5%
Average $16.13 $41.52 $78.88 Average $0.60 $1.54 $2.92
Average Cost per kWh: Medium Use
Type of ESP
Average Cost per Charge: Medium Use
Type of ESP

15
In the high-use scenario, every rate class examined provides charging at any speed well below the cost of gasoline fueling. The average cost per charge in the high-use scenario is $3.20 at 50 kW peak demand, and below $10 per charge at the 300 kW level. No rate class examined exceeds $20 per charge in this high-power, high-use scenario. Table 3: Estimated Average Costs by State and ESP Type – High Use Scenario
There were also differing trends by state and by type of ESP. Overall, charging was most economical in Nevada, largely due to DCFC rates adopted by their largest IOU, NVE.33 Demand charges in Nevada also accounted for a lower percentage of an average bill, 54.9 percent, compared to an overall average of 73.7 percent across the region. Arizona had the next lowest demand charges on average, in large part to Tucson Electric Power (TEP), which does not apply demand charges to customers until they surpass 24,000 kWh monthly use. All the scenarios examined were below this threshold. Demand charges also made up a relatively low percentage of Montana’s sample bills, and average costs in Montana were below the study-wide average in every scenario. While no Montana utilities have DCFC-specific rates or rates without demand charges, all have very low, consistent demand charges. Colorado was the most expensive state for charging, with average bills 30 to 50 percent higher than the region-wide average for the low- and medium-use scenarios. New Mexico has the highest demand charges relative to their bill, with nearly 85 percent of the average bill consisting of demand charges. Full details on state-by-state rates can be found in the appendix. The range of average costs by ESP type did not vary as much as state-by-state differences. Overall, municipal utilities offered the lowest average bills, with IOU bills just above the study-
33 Current rates for NVE are available here.
State 50 kW 150 kW 300 kW State 50 kW 150 kW 300 kWArizona $3.38 $5.27 $7.94 Arizona $0.13 $0.20 $0.29Colorado $3.42 $6.93 $12.21 Colorado $0.13 $0.26 $0.45Idaho $2.57 $4.79 $8.17 Idaho $0.10 $0.18 $0.30Montana $2.72 $4.82 $7.99 Montana $0.10 $0.18 $0.30Nevada $2.65 $4.10 $6.02 Nevada $0.10 $0.15 $0.22New Mexico $3.66 $7.29 $12.73 New Mexico $0.14 $0.27 $0.47Utah $3.07 $5.82 $9.95 Utah $0.11 $0.22 $0.37Wyoming $2.92 $5.49 $9.34 Wyoming $0.11 $0.20 $0.35
IOU $3.11 $5.48 $8.97 IOU $0.12 $0.20 $0.33Coop $3.27 $6.13 $10.36 Coop $0.12 $0.23 $0.38Muni $3.26 $5.25 $8.18 Muni $0.12 $0.19 $0.30Demand Fee (%) 41.1% 63.1% 74.3%
Demand Fee (%) 41.1% 63.1% 74.3%
Average $3.20 $5.73 $9.46 Average $0.12 $0.21 $0.35
Average Cost per kWh: High Use
Type of ESP
Average Cost per Charge: High Use
Type of ESP

16
wide average, and cooperatives’ bills as the most expensive. However, this study examined fewer municipalities than other types of ESPs. User Price Certainty and Predictability There were several trends across ESPs that made DCFC rates more unpredictable. First, while nearly every utility has different kW demand thresholds to classify rate classes, several ESPs studied have distinct rate classes that would apply depending on the charging scenario selected. For example, one Nevada ESP studied would bill a 50 kW charger under its Small Commercial Service. This does not include a demand charge, and even in our low-use scenario achieves a cost per charge under $15, compared to a study-wide average of $145 per charge. However, at 100 kVa demand (or 98 kW based on the assumptions of this assessment), service converts to Large Commercial and a demand charge is included. Charging at 150 kW within this service territory and under the same low-use scenario increases the price to nearly $600 per charge.
Figure 2: Nevada ESP Rates, Estimated Cost per Charging Event for Station Host
Beyond changes in rate class designation based on peak demand, the time that charging occurs creates another source of uncertainty for DCFC hosts. Normally, time-of-use (TOU) charging is seen as a benefit to EVs, as most owners charge overnight with low electric rates. However, with most DCFC charging occurring during peak business hours, TOU rates can lead to higher bills for fast charging. For example, Figure 3 compares two rate offerings from an Arizona cooperative with the study-wide average. As shown by the yellow lines, the coop’s Large Power Service Rate has low prices compared to the study-wide average (in grey). However, if a station host selects the TOU rate instead (in red), the price per charge would more than double. This is due to demand rates being charged on a peak rate of $20/kW compared to $8/kW for their general Large Power Service.

17
Figure 3: Arizona ESP Rate Options, Estimated Cost per Charging Event for Station Host Finally, time of the year may impact rates as well, with many ESPs including a cost premium for summer hours. Fifteen of the rate classes examined had different rates for summer and winter months. For these rate classes there was an 8.5 percent premium associated with charging during summer hours. The largest summer cost premium was from NV Energy (NVE) in their southern territory, with a 160 percent cost increase moving from winter to summer hours. While both rates are very low compared to others in the study, the summer demand charge is $0.82/kW compared to just $0.02/kW in the winter. Case Studies: Several ESPs included in the study were able to offer low charging prices across all of our scenarios. A few of these ESPs with unique demand charges are included here as case studies. Moon Lake Electric Association in Utah has a $12/kW demand charge for their Large Power Service applicable to DCFC infrastructure hosts. However, Moon Lake includes a “Demand Charge Limit” of $0.07/kWh.34 In most of the scenarios studied, this demand charge limit effectively eliminates the per kW demand charge, and greatly increases their per kWh fees. As shown in Table 4, this greatly reduces the average cost per charge in all but one of the scenarios examined, making Moon Lake one of the only ESPs studied able to provide DCFC charging competitive with gasoline fueling at lower levels of consumer use. Only in the high-use, low-power scenario does the original rate structure become cheaper for site hosts. The demand charge limit also has a stabilizing effect on rates, with consistent prices in for each use scenario, regardless of the monthly peak power demand (seen in Table 4).
34 Moon Lake Electric Association. “Electric Schedule: Large Power Service.” May 1, 2016. Accessed June 15, 2021. <https://mleainc.com/Documents/rateSchedule/rate_sch_lp.pdf>.
$0
$200
$400
$600
$800
$1,000
$1,200
5 10 20 30 40 50 60 70 80 90 100Number of Charges per Month
Average - 50 kW
Average - 150 kW
Average - 300 kW
Large Power - 50 kW
Large Power - 150 kW
Large Power - 300 kW
TOU - 50 kW
TOU - 150 kW
TOU - 300 kW

18
Table 4. Impact of Moon Lake Electric Association’s Demand Charge Limit
NVE has been heavily involved in the development of the Nevada Electric Highway, building, owning, and operating DCFC stations through their territory. This gives them experience as both a DCFC station host and an ESP providing power. Starting in April 2019, NVE implemented a special “Ten-Year Demand Rate Reduction Transition Period,” which was approved by the Public Utilities Commission of Nevada.35 This rate reduction fully eliminated demand charges for EV charging infrastructure with a demand over 50 kW. Then each year an additional ten percent of the original demand charge is reinstituted until the transition period ends in April 2029. This demand charge assessment was conducted in year three of this transition period, so NVE’s demand charge was 20 percent of their standard rates. Additionally, in their Southern Territory there is a rider for DCFC services of about $0.10 per kWh. The DCFC-specific rates make NVE one of the most affordable ESPs for DCFC in this study. The impact is most apparent in the low-use scenario, as shown in Table 5. Below each DCFC specific rate, is the standard rate if NVE had not implemented their Demand Rate Reduction. These rates are slightly above the study-wide average, across most of the scenarios. However, the DCFC-specific rates eliminate 80 percent of the demand charges and offer much more affordable charging. In the NVE South rates, we again see the effect of a $/kWh adder for DCFC, which makes prices under low- and medium-use cases much more competitive with gasoline fueling. However, with higher EV penetration in the high-use scenario and electric usage that is closer to traditional grid technologies, those prices are lower than the DCFC rate. Table 5. Sample Bills for NVE’s Rate Classes
Conclusion
This assessment of ESP rate structures demonstrates that demand charges constitute a significant portion of most DCFC site host’s electric bills and can be one of several barriers to transportation electrification. On average, demand charges accounted for nearly 74 percent of sample commercial and industrial electric bills in this study. In the low- and medium-use scenarios where electricity consumption is low, the corresponding electric bills would not allow station hosts to earn a profit and provide charging to compete with gasoline costs. In the low-use scenarios, average cost per kWh ranges from $5.37 to $28.62. For comparison, the Energy Information Administration’s average electric costs for these same eight states are $0.09 per
35 Nevada Power Company dba NV Energy. “Schedule No. EVCCR-TOU: Electric Vehicle Commercial Charging Rider Time-of-Use.” Public Utilities Commission of Nevada. March 25, 2019. PUCN Sheet No. 15N.
50 kW 150 kW 300 kW 50 kW 150 kW 300 kW 50 kW 150 kW 300 kW$145.01 $399.06 $772.66 $16.13 $41.52 $78.88 $3.20 $5.73 $9.46
Moon Lake Cooperative Large Power Service 87% $165.81 $465.81 $915.81 $17.54 $47.54 $92.54 $2.71 $5.71 $10.21Moon Lake Cooperative LPS - Capped Demand Charge 64% $17.70 $17.70 $17.70 $4.43 $4.43 $4.43 $3.10 $3.10 $3.10
50 kW 150 kW 300 kW 50 kW 150 kW 300 kW 50 kW 150 kW 300 kW$145.01 $399.06 $772.66 $16.13 $41.52 $78.88 $3.20 $5.73 $9.46
NVE - South IOU Large General - DCFC Summer 63% $38.49 $94.89 $179.49 $9.55 $15.19 $23.65 $6.66 $7.22 $8.07NVE - South IOU Large General - DCFC Winter 45% $17.63 $37.33 $66.88 $5.21 $7.18 $10.14 $3.97 $4.17 $4.46NVE - North IOU EV Rate TOU - Summer 64% $38.37 $97.22 $185.50 $5.50 $11.39 $20.21 $2.21 $2.80 $3.68NVE - North IOU EV Rate TOU - Winter 71% $22.86 $53.81 $100.24 $2.54 $5.64 $10.28 $0.51 $0.82 $1.29
Low Use (one charge/week) Medium Use (ten charges/week) High Use (100 charges/week)ESP Name Type of ESP Demand % of Bill
Cost per Charging Event ($/Charge)Low Use (one charge/week) Medium Use (ten charges/week) High Use (100 charges/week)
Cost per Charging Event ($/Charge)
Utah Electric Service Providers
Nevada Electric Service Providers
ESP Name Type of ESP Demand % of Bill
Type of Service Class
Type of Service Class
Regional Average
Regional Average
50 kW 150 kW 300 kW 50 kW 150 kW 300 kW 50 kW 150 kW 300 kW$145.01 $399.06 $772.66 $16.13 $41.52 $78.88 $3.20 $5.73 $9.46
Moon Lake Cooperative Large Power Service 87% $165.81 $465.81 $915.81 $17.54 $47.54 $92.54 $2.71 $5.71 $10.21Moon Lake Cooperative LPS - Capped Demand Charge 64% $17.70 $17.70 $17.70 $4.43 $4.43 $4.43 $3.10 $3.10 $3.10
50 kW 150 kW 300 kW 50 kW 150 kW 300 kW 50 kW 150 kW 300 kW$145.01 $399.06 $772.66 $16.13 $41.52 $78.88 $3.20 $5.73 $9.46
NVE - South IOU Large General - DCFC Summer 63% $38.49 $94.89 $179.49 $9.55 $15.19 $23.65 $6.66 $7.22 $8.07NVE - South IOU Large General - DCFC Winter 45% $17.63 $37.33 $66.88 $5.21 $7.18 $10.14 $3.97 $4.17 $4.46NVE - North IOU EV Rate TOU - Summer 64% $38.37 $97.22 $185.50 $5.50 $11.39 $20.21 $2.21 $2.80 $3.68NVE - North IOU EV Rate TOU - Winter 71% $22.86 $53.81 $100.24 $2.54 $5.64 $10.28 $0.51 $0.82 $1.29
Low Use (one charge/week) Medium Use (ten charges/week) High Use (100 charges/week)ESP Name Type of ESP Demand % of Bill
Cost per Charging Event ($/Charge)Low Use (one charge/week) Medium Use (ten charges/week) High Use (100 charges/week)
Cost per Charging Event ($/Charge)
Utah Electric Service Providers
Nevada Electric Service Providers
ESP Name Type of ESP Demand % of Bill
Type of Service Class
Type of Service Class
Regional Average
Regional Average

19
kWh for end-users in the commercial sector, and $0.10 per kWh for end-users in the transportation sector.36 However, in the high-use scenarios, every single ESP rate examined would allow a station host to achieve low-cost charging, regardless of their demand charges. The case studies profiled above offer several strategies that ESPs may explore to lower demand charges on DCFC infrastructure: caps on demand charges, setting demand charges on a per kWh basis, and temporary demand charge reductions. Beyond high prices, the mosaic of ESPs throughout the region and varying rates even within individual providers’ territory also create highly uncertain prices for station hosts and consumers. In the sample of five ESPs per state, this assessment examined 73 different rate classes to achieve cost estimates in a comprehensive way. All these rate classes create uncertainty based on the location and technical specifications of DCFC infrastructure, and other factors such as time of day, time of year, and the number of other users during that billing cycle can play a large role in the ultimate price per charge of individual charging sessions. Just within the medium-power scenario, prices ranged from $0.82 per charge to $964 per charge due to changes in station-use and service territory. Still, in the long-term, with higher consumer utilization of public DCFC stations, electric rates do level out and approach the low regional average cost of electricity. It is worth acknowledging that, as mentioned previously, demand charges exist “to recover some of the costs associated with providing sufficient electricity generation and distribution capacity to… customers.”37 Therefore, strategies to limit demand charges for EV charging station operators may cause ESPs to reduce commercial service fees or create standalone EV charging rate classes or raise rates for other customers in order to recover their costs. ESPs and those who regulate them may consider crafting rate structures that can support EV owners without unfairly shifting the costs onto the customer classes who least benefit from EVs. However, as discussed above, numerous studies have shown large public and cost benefits will be derived from the transition to an electrified transportation system. While these benefits will require up front investments, over time, reductions in fuel costs and vehicle maintenance are expected to save drivers billions of dollars,38 new electric customers will benefits ESPs and help lower prices for all electric customers with stronger utilization rates,39 and finally reductions in air pollution and reduced greenhouse gas emissions are projected to create around $200 billion in public benefits nationwide by 2050.40 Service providers could work with states to develop rates that enable ESPs to adequately provide and maintain electric infrastructure, without inhibiting the deployment of DCFC networks which will be necessary and vital to widespread transportation electrification.
36 Energy Information Administration. “Table 5.6.A. Average Price of Electricity to Ultimate Customers by End-Use Source.” Electric Power Monthly. Accessed June 16, 2021. <https://www.eia.gov/electricity/monthly/epm_table_grapher.php?t=epmt_5_6_a>. 37 Clean Energy Group and the National Renewable Energy Laboratory. “An Introduction to Demand Charges.” August 2017. Page 1. <https://www.cleanegroup.org/wp-content/uploads/Demand-Charge-Fact-Sheet.pdf>. 38 Fulton, Lewis, Marshall Miller, Andrew Burke, Qian Wang, and Chris Yang. “Technology and Fuel Transition Scenarios to Low Greenhouse Gas Futures for Cars and Trucks in California.” September 2019. UC-Davis Institute of Transportation. Table 4-15. < https://escholarship.org/uc/item/8wn8920p>. 39 MJ Bradley and Associates. “Electric Vehicle Costs-Benefit Analysis: New Mexico.” January 2020. Figure 17. <https://www.mjbradley.com/sites/default/files/NM-PEV-CB-Analysis-FINAL.pdf>. 40 American Lung Association. “The Road to Clean Air: Benefits of a Nationwide Transition to Electric Vehicles.” 2020. <https://www.lung.org/getmedia/99cc945c-47f2-4ba9-ba59-14c311ca332a/electric-vehicle-report.pdf>.

20
Appendix: Electric Service Providers - Estimated Rates per Charging Event by State Table A1. Arizona ESPs – Estimated Cost per Charging Event
50 kW 150 kW 300 kW 50 kW 150 kW 300 kW 50 kW 150 kW 300 kW
$145.01 $399.06 $772.66 $16.13 $41.52 $78.88 $3.20 $5.73 $9.46
$125.19 $314.72 $581.46 $14.45 $33.40 $60.07 $3.38 $5.27 $7.94
65.6% 75.1% 95.5% 70.9% 87.4% 92.9% 37.3% 61.9% 75.0%Arizona Public Service IOU Primary - Summer* 76% $172.89 $398.08 $630.47 $18.98 $41.47 $64.71 $3.49 $5.74 $8.06Arizona Public Service IOU Primary - Winter* 78% $172.43 $397.65 $630.03 $18.52 $41.04 $64.28 $3.03 $5.28 $7.60Sulphur Springs Valley Cooperative Large Power 78% $117.76 $321.84 $627.97 $13.55 $33.96 $64.57 $3.13 $5.17 $8.23Sulphur Springs Valley Cooperative Large Power - TOU 91% $270.12 $780.33 $1,545.63 $28.16 $79.18 $155.71 $3.96 $9.06 $16.71Tucson Electric IOU Small Gerneral Service - Summer 0% $11.10 $11.10 $11.10 $4.13 $4.13 $4.13 $3.59 $3.59 $3.59Tucson Electric IOU Small Gerneral Service - Winter 0% $10.70 $10.70 $10.70 $3.80 $3.80 $3.80 $3.31 $3.31 $3.31Navopache Electric Cooperative Standard Commercial 73% $198.06 $452.81 $834.93 $21.17 $46.64 $84.85 $3.39 $5.93 $9.75Navopache Electric Cooperative TOU Commercial 75% $203.23 $469.98 $870.10 $21.32 $47.99 $88.00 $3.13 $5.79 $9.79Salt River Project Hybrid/Muni Standard Business - Summer 75% $104.24 $286.49 $559.86 $11.82 $30.05 $57.38 $2.87 $4.69 $7.43Salt River Project Hybrid/Muni Standard Business - Winter 79% $68.95 $182.95 $353.95 $8.41 $19.81 $36.91 $2.02 $3.16 $4.87Salt River Project Hybrid/Muni TOU Business - Summer 69% $101.51 $276.26 $538.39 $13.97 $31.44 $57.65 $5.21 $6.96 $9.58Salt River Project Hybrid/Muni TOU Business - Winter 69% $71.25 $188.50 $364.38 $9.58 $21.30 $38.89 $3.41 $4.58 $6.34*Service jumps from Medium to Large at 100 kW peak demand
High Use (100 charges/week)Cost per Charging Event ($/Charge)
Low Use (one charge/week) Medium Use (ten charges/week)
Regional Average
Demand Charge: Percent of Average Bill
Type of Service Class
Arizona Average
Arizona Electric Service Providers
ESP Name Type of ESP Demand % of Bill

21
Table A2. Colorado ESPs – Estimated Cost per Charging Event
Table A3. Idaho ESPs – Estimated Cost per Charging Event
50 kW 150 kW 300 kW 50 kW 150 kW 300 kW 50 kW 150 kW 300 kW$145.01 $399.06 $772.66 $16.13 $41.52 $78.88 $3.20 $5.73 $9.46$216.17 $567.83 $1,095.33 $22.78 $57.94 $110.69 $3.42 $6.93 $12.2171.0% 80.6% 84.2% 68.3% 79.2% 83.4% 51.2% 68.6% 76.4%
Black Hills Energy IOU Large General 96% $243.05 $696.55 $1,376.80 $24.38 $69.73 $137.75 $2.51 $7.05 $13.85Black Hills Energy IOU Large General TOU - Summer 91% $243.68 $697.18 $1,377.43 $25.20 $70.55 $138.58 $3.35 $7.89 $14.69Black Hills Energy IOU Large General TOU - Winter 95% $243.05 $696.55 $1,376.80 $24.57 $69.92 $137.95 $2.73 $7.26 $14.06Intermountain Rural Cooperative Large Power 84% $188.90 $520.15 $1,017.02 $20.35 $53.47 $103.16 $3.49 $6.81 $11.77Poudre Valley Rural Cooperative Large Commercial 87% $266.26 $741.51 $1,454.38 $28.10 $75.62 $146.91 $4.28 $9.03 $16.16Poudre Valley Rural Cooperative Large Commercial TOU 82% $301.76 $777.01 $1,489.88 $31.65 $79.17 $150.46 $4.63 $9.39 $16.52Colorado Springs Municipal Commercial* 0% $6.54 $6.54 $6.54 $2.99 $2.99 $2.99 $2.45 $2.45 $2.45Xcel Energy IOU Primary General - Summer 51% $147.83 $252.58 $409.71 $16.05 $26.52 $42.24 $2.87 $3.92 $5.49Xcel Energy IOU Primary General - Winter 77% $304.46 $722.46 $1,349.46 $31.71 $73.51 $136.21 $4.44 $8.62 $14.89*Jumps from Small Commercial to General Commercial at 33 kWh per day
Low Use (one charge/week) Medium Use (ten charges/week) High Use (100 charges/week)Demand % of Bill
Cost per Charging Event ($/Charge)
Type of Service Class
Colorado AverageRegional Average
Demand Charge: Percent of Average Bill
Colorado Electric Service Providers
ESP Name Type of ESP
50 kW 150 kW 300 kW 50 kW 150 kW 300 kW 50 kW 150 kW 300 kW$145.01 $399.06 $772.66 $16.13 $41.52 $78.88 $3.20 $5.73 $9.46$121.93 $344.36 $682.29 $13.48 $35.72 $69.52 $2.57 $4.79 $8.1787.9% 95.8% 97.9% 77.7% 91.7% 95.8% 40.8% 67.0% 80.2%
Idaho Power IOU Schedule 19 Primary TOU - Summer 80% $109.08 $304.33 $597.21 $12.45 $31.97 $61.26 $2.78 $4.74 $7.66
Idaho Power IOU Schedule 19 Primary TOU - Winter 78% $75.13 $203.38 $395.76 $8.65 $21.47 $40.71 $2.00 $3.28 $5.20
Avista IOU General 73% $52.68 $202.68 $457.68 $7.43 $22.43 $47.93 $2.43 $3.93 $6.48
Idaho Falls Municipal Industrial 89% $113.55 $338.55 $676.05 $12.30 $34.80 $68.55 $2.18 $4.43 $7.80
Pacificorp IOU Large General - Summer 86% $208.33 $567.33 $1,105.83 $21.80 $57.70 $111.55 $3.15 $6.74 $12.12
Pacificorp IOU Large General - Winter 84% $176.45 $471.70 $914.58 $18.61 $48.14 $92.43 $2.83 $5.78 $10.21
Fall River Cooperative General 81% $118.30 $322.55 $628.93 $13.11 $33.54 $64.18 $2.60 $4.64 $7.70
ESP Name Type of ESPDemand % of Bill
Cost per Charging Event ($/Charge)Low Use (one charge/week) Medium Use (ten charges/week) High Use (100 charges/week)
Type of Service Class
Idaho AverageRegional Average
Demand Charge: Percent of Average Bill
Idaho Electric Service Providers

22
Table A4. Montana ESPs – Estimated Cost per Charging Event
Table A5. Nevada ESPs – Estimated Cost per Charging Event
50 kW 150 kW 300 kW 50 kW 150 kW 300 kW 50 kW 150 kW 300 kW$145.01 $399.06 $772.66 $16.13 $41.52 $78.88 $3.20 $5.73 $9.46$140.20 $353.82 $670.92 $15.22 $36.55 $68.26 $2.72 $4.82 $7.9969.8% 85.0% 91.1% 63.1% 81.5% 88.8% 36.4% 60.6% 73.2%
Flathead Electric Cooperative General Service* 66% $44.17 $137.99 $258.74 $5.67 $14.86 $26.94 $1.82 $2.55 $3.76Yellowstone Valley Cooperative Large Commercial 81% $157.42 $438.42 $859.92 $17.69 $45.79 $87.94 $3.72 $6.53 $10.74Missoula Cooperative Large Commercial 87% $149.18 $424.18 $836.68 $15.98 $43.48 $84.73 $2.66 $5.41 $9.53Montana-Dakota IOU Large General Service - Summer 81% $213.91 $525.16 $992.04 $22.10 $53.22 $99.91 $2.92 $6.03 $10.70Montana-Dakota IOU Large General Service - Winter 79% $197.04 $474.54 $890.79 $20.41 $48.16 $89.79 $2.75 $5.52 $9.69Northwestern Energy IOU General Service - Transmission 39% $79.51 $122.65 $187.35 $9.47 $13.78 $20.25 $2.46 $2.90 $3.54*Service jumps from Medium to Large at 100 kW peak demand
Cost per Charging Event ($/Charge)Low Use (one charge/week) Medium Use (ten charges/week) High Use (100 charges/week)
ESP Name Type of ESPDemand % of Bill
Demand Charge: Percent of Average Bill
Type of Service Class
Montana AverageRegional Average
Montana Electric Service Providers
50 kW 150 kW 300 kW 50 kW 150 kW 300 kW 50 kW 150 kW 300 kW$145.01 $399.06 $772.66 $16.13 $41.52 $78.88 $3.20 $5.73 $9.46$48.95 $208.86 $400.61 $7.21 $23.07 $42.24 $2.65 $4.10 $6.0253.8% 76.4% 80.7% 36.1% 63.0% 71.8% 12.4% 33.9% 45.6%
Valley Electric Cooperative Commercial* 61% $52.45 $127.45 $321.20 $7.45 $14.95 $34.32 $2.95 $3.70 $5.63Wells Rural Cooperative Commercial** 55% $14.49 $583.93 $1,068.05 $3.14 $59.28 $107.69 $2.01 $6.82 $11.66NV Energy - South IOU Large General - DCFC Summer*** 63% $38.49 $94.89 $179.49 $9.55 $15.19 $23.65 $6.66 $7.22 $8.07NV Energy - South IOU Large General - DCFC Winter*** 45% $17.63 $37.33 $66.88 $5.21 $7.18 $10.14 $3.97 $4.17 $4.46NV Energy - North IOU EV Rate TOU - Summer*** 64% $38.37 $97.22 $185.50 $5.50 $11.39 $20.21 $2.21 $2.80 $3.68NV Energy - North IOU EV Rate TOU - Winter*** 71% $22.86 $53.81 $100.24 $2.54 $5.64 $10.28 $0.51 $0.82 $1.29Overton Power District Municipal Large General 79% $132.12 $357.37 $695.24 $14.83 $37.36 $71.14 $3.10 $5.36 $8.73Mt. Wheeler Power Cooperative Large General 0% $33.41 $33.41 $33.41 $9.78 $9.78 $9.78 $5.13 $5.13 $5.13*Service jumps from Commercial to Large Commercial at 250 kW**Service jumps from Small Commercial to Large Commercial at 100 kVa***Reflects year 3 of 10-year rate plan, demand charges at 20% their normal rate for DCFC
Low Use (one charge/week) Medium Use (ten charges/week) High Use (100 charges/week)ESP Name Type of ESP Demand % of Bill
Cost per Charging Event ($/Charge)Nevada Electric Service Providers
Type of Service Class
Demand Charge: Percent of Average BillNevada Average
Regional Average

23
Table A6. New Mexico ESPs – Estimated Cost per Charging Event
Table A7. Utah ESPs – Estimated Cost per Charging Event
50 kW 150 kW 300 kW 50 kW 150 kW 300 kW 50 kW 150 kW 300 kW
$145.01 $399.06 $772.66 $16.13 $41.52 $78.88 $3.20 $5.73 $9.46$193.44 $556.09 $1,099.76 $20.93 $57.19 $111.56 $3.66 $7.29 $12.73
90.7% 96.7% 98.4% 81.7% 93.1% 96.4% 51.5% 72.0% 82.3%PNM IOU General TOU - Summer 93% $339.67 $964.04 $1,906.79 $34.77 $97.20 $191.48 $4.28 $10.52 $19.95PNM IOU General TOU - Winter 92% $258.89 $734.39 $1,447.64 $26.55 $74.10 $145.43 $3.32 $8.07 $15.20PNM IOU General TOU Low Load - Summer 72% $124.84 $327.34 $651.34 $15.29 $35.54 $67.94 $4.33 $6.36 $9.60PNM IOU General TOU Low Load - Winter 71% $98.45 $249.70 $496.83 $11.96 $27.08 $51.80 $3.31 $4.82 $7.29Central New Mexico Cooperative Commercial 89% $239.76 $697.76 $1,384.76 $25.56 $71.36 $140.06 $4.14 $8.72 $15.59Central New Mexico Cooperative Commercial TOU 81% $234.30 $671.80 $1,328.05 $27.08 $70.83 $136.45 $6.35 $10.73 $17.29City of Farmington Municipal Large General Service 86% $135.83 $398.33 $792.08 $15.00 $41.25 $80.63 $2.92 $5.54 $9.48Xcel Energy IOU Primary General - Summer 97% $241.61 $706.61 $1,404.11 $24.28 $70.78 $140.53 $2.55 $7.20 $14.17Xcel Energy IOU Primary General - Winter 97% $202.86 $590.36 $1,171.61 $20.41 $59.16 $117.28 $2.16 $6.04 $11.85Socorro Electric Cooperative Large Commercial 84% $208.34 $583.34 $1,145.84 $22.72 $60.22 $116.47 $4.16 $7.91 $13.53Navajo Tribal Electric Municipal General 71% $43.33 $193.33 $368.33 $6.61 $21.61 $39.11 $2.79 $4.29 $6.04
ESP NameDemand % of Bill
Cost per Charging Event ($/Charge)Low Use (one charge/week) Medium Use (ten charges/week) High Use (100 charges/week)
Type of ESP Type of Service Class
New Mexico Electric Service Providers
New Mexico AverageRegional Average
Demand Charge: Percent of Average Bill
50 kW 150 kW 300 kW 50 kW 150 kW 300 kW 50 kW 150 kW 300 kW$145.01 $399.06 $772.66 $16.13 $41.52 $78.88 $3.20 $5.73 $9.46$152.35 $427.38 $839.94 $16.54 $44.04 $85.30 $3.07 $5.82 $9.9587.7% 92.3% 93.6% 82.8% 90.4% 92.6% 54.8% 74.7% 83.2%
Rocky Mountain Power IOU General, TOU - Summer 91% $230.05 $661.55 $1,308.80 $23.95 $67.10 $131.82 $3.34 $7.65 $14.13Rocky Mountain Power IOU General, TOU - Winter 91% $210.80 $604.05 $1,193.93 $21.92 $61.24 $120.23 $3.03 $6.96 $12.86Garkane Energy Cooperative General Service #2 82% $116.07 $329.82 $650.45 $13.13 $34.51 $66.57 $2.84 $4.98 $8.18St. George Power Municipal Small General Service 82% $187.70 $524.45 $1,029.58 $20.26 $53.93 $104.45 $4.32 $7.69 $12.74Moon Lake Cooperative Large Power Service 87% $165.81 $465.81 $915.81 $17.54 $47.54 $92.54 $2.71 $5.71 $10.21Moon Lake Cooperative LPS - Capped Demand Charge 64% $17.70 $17.70 $17.70 $4.43 $4.43 $4.43 $3.10 $3.10 $3.10Dixie Cooperative Large Commercial 88% $138.28 $388.28 $763.28 $14.53 $39.53 $77.03 $2.16 $4.66 $8.41
Cost per Charging Event ($/Charge)Low Use (one charge/week) Medium Use (ten charges/week) High Use (100 charges/week)
Utah Electric Service Providers
ESP Name Type of ESP Demand % of Bill
Type of Service Class
Utah AverageRegional Average
Demand Charge: Percent of Average Bill

24
Table A8. Wyoming ESPs – Estimated Cost per Charging Event
50 kW 150 kW 300 kW 50 kW 150 kW 300 kW 50 kW 150 kW 300 kW$145.01 $399.06 $772.66 $16.13 $41.52 $78.88 $3.20 $5.73 $9.46$147.37 $403.86 $788.59 $16.05 $41.70 $80.18 $2.92 $5.49 $9.34
80.1% 92.4% 96.3% 73.4% 89.2% 94.5% 44.3% 68.2% 80.5%
Rocky Mountain Power IOU Primary General Service 94% $189.79 $548.54 $1,086.67 $19.30 $55.18 $108.99 $2.25 $5.84 $11.22Powder River Energy Cooperative Large Power Service 63% $95.93 $259.62 $505.15 $11.36 $27.73 $52.28 $2.90 $4.54 $6.99Powder River Energy Cooperative Large Power Service - TOU 70% $126.09 $276.59 $502.34 $13.37 $28.42 $50.99 $2.10 $3.60 $5.86Wheatland Rural Cooperative Large Power Service 76% $155.12 $421.12 $820.12 $18.54 $45.14 $85.04 $4.88 $7.54 $11.53Lower Valley Energy Cooperative Large Power Service 87% $88.51 $263.51 $526.01 $9.76 $27.26 $53.51 $1.89 $3.64 $6.26City of Cody Municipal Commercial Service 89% $228.75 $653.75 $1,291.25 $24.00 $66.50 $130.25 $3.52 $7.77 $14.15
Cost per Charging Event ($/Charge)Low Use (one charge/week) Medium Use (ten charges/week) High Use (100 charges/week)
ESP Name Type of ESPDemand % of Bill
Regional Average
Demand Charge: Percent of Average Bill
Type of Service Class
Wyoming Average
Wyoming Electric Service Providers