estimation of the net charging demand from privately owned
TRANSCRIPT
MasterThesis
M.Sc.EnergyforSmartCities
Estimationofthenetchargingdemandfromprivatelyownedelectricvehicles
usingGameTheory
Author: DevMishraDirector: RobertoVillafáfilaRoblesSession: July2017
Escola Tècnica Superior d’Enginyeria Industrial de Barcelona

2 MasterThesis
DevMishra
AbstractElectricvehiclesaregrowingatasignificantrateintheworldandthatmakesitessentialformodern day electricity networks to be prepared for their integration. A commonapproachofpreparing thenetwork foranykindofdemand is tobeable topredictorestimatethesamebasedondataandsimulationsusingoptimizationtechniques.Thisworkwasaimedatthesameintwodistinctparts.Inthefirstpart,gametheoreticmethods were tried to be applied to an existing multi agent probabilistic modelestimatingnetdemandfromelectricvehicle.Owingtothecomplexityoftheundertaking,it was decided to only include a payoff based allocation of electric vehicle chargingscenariostoestimateelectricvehicledemandwhichaccountedforallscenariosratherthanallvehiclescharginginasinglescenario.Inthesecondpart,asmallerscenarioofanaffluent household with two electric vehicles and typical mobility pattern wasformulated.GametheorysolutionconceptofNashEquilibriumwasusedtooptimizethechargingofbothelectricvehiclesoveraweekofusage.Theresultsfromthefirstpart,displayedanoverallreductioninmaximumloadswhiletherewerecertainshiftsinloadsobservedaswell.Asanexercisewithoutanyinherentoptimizationmechanism theoverall results fromthis segmentwere inconclusive.Theresults fromthesecondpart,demonstratedneeds forchargingtheEVsshiftingtooff-peakhoursandchargingofvehicles,amaximumof1-2timesperweekbasedonuserrange anxiety, game theoretic competition andmobility needs. Further, savings fromchargingatoff-peaktariffsbasedontimeofuseelectricitytariffswerealsoevaluated.

EstimationofthenetchargingdemandfromprivatelyownedelectricvehiclesusingGameTheory 3
DevMishra
Contents
ABSTRACT______________________________________________________________________________________2
CONTENTS______________________________________________________________________________________3
LISTOFFIGURES ______________________________________________________________________________5
LISTOFTABLES________________________________________________________________________________6
GLOSSARY______________________________________________________________________________________7
1. PREFACE_________________________________________________________________________________8
2. INTRODUCTION_________________________________________________________________________92.1. IntroductiontoElectricVehicles...................................................................................................92.1.1. EVTechnologyBasics.............................................................................................................102.1.2. TypesofElectricVehicles.....................................................................................................112.1.3. BatteryTechnology..................................................................................................................132.1.4. EVChargingInfrastructureandChargingTechnologies......................................142.1.5. EVregulationandpolicy.......................................................................................................172.1.6. EVsinSpain.................................................................................................................................20
2.2. IntroductiontoGameTheory......................................................................................................212.3. GameTheoryApplicationsinRelatedFields.......................................................................24
3. LITERATUREREVIEWANDTECHNICALBACKGROUND_________________________273.1. ElectricVehicles..................................................................................................................................273.2. DemandModels..................................................................................................................................273.3. GameTheoryModelling.................................................................................................................293.4. ProposedMethodology...................................................................................................................37
4. METHODOLOGY________________________________________________________________________394.1. Part 1: Modification of existing EV demand prediction model- All charging
strategies................................................................................................................................................394.2. Part2:Twoplayergameinasinglehousehold..................................................................414.2.1. Twoplayerhouseholdgamescenariodescription..................................................424.2.2. Datausedtobuildthescenario.........................................................................................434.2.3. MethodologyimplementationintheScenario...........................................................44
5. RESULTSANDDISCUSSION___________________________________________________________465.1. ResultsandDiscussion:Part1....................................................................................................465.2. Results&Discussion:Part2.........................................................................................................48

4 MasterThesis
DevMishra
6. CONCLUSIONS__________________________________________________________________________536.1. ScopeforAdditionalWork............................................................................................................53
7. ACKNOWLEDGEMENTS_______________________________________________________________55
8. BIBLIOGRAPHY________________________________________________________________________56
ANNEXUREA:ELECTRICITYPRICES_______________________________________________________59
ANNEXUREB:MATLABCODE______________________________________________________________60

EstimationofthenetchargingdemandfromprivatelyownedelectricvehiclesusingGameTheory 5
DevMishra
ListofFiguresFigure1:GlobalGrowthofElectricVehicleStockfrom2010to2015[2] ........................ 10Figure2:Series,ParallelandSeries-ParallelHEVs(a,b,c)andPHEVS(d,e,f)[3] ............... 12Figure3:TypicalpowertrainlayoutforBEVs[3] ................................................................ 12Figure4:BatteryDensityandCostEvolution[2] ................................................................ 13Figure5:DevelopmenttimelineofEVbattery[3] .............................................................. 14Figure6:GlobalChargingInfrastructureOverview ............................................................ 15Figure7:CC/CVchargingprofile[6] .................................................................................... 17Figure8:Pulsechargingandnegativepulsecharging ........................................................ 17Figure9:ScaleofPurchaseincentivesforEVs[2] .............................................................. 19Figure10:SummaryofpolicysupportmechanismsforEVSEdeployment[2] ................ 20Figure11:Technicaldata(energy)forEVssoldinSpain[8] ............................................. 20Figure12:GameTheoretictechniquesforMicroGridApplications[11] ......................... 24Figure13:RepresentationofSequentialgames[18] .......................................................... 31Figure14:Flowchartillustratingalgorithmandinteractionofdata ................................. 38Figure15:OriginalDemandateachnode ............................................................................ 46Figure16:Demandateachnodewithweightedstrategies ................................................ 46Figure17:OriginaldemandforeverytimestepforAgentGroup1 .................................. 47Figure18:ModifieddemandwithweightedstrategiesforAgentGroup1 ....................... 47Figure19:FirstEquilibriumwithEV2chargingonDay4 .................................................. 50Figure20:SecondEquilibriumwithEV1chargingonDay5 .............................................. 51

6 MasterThesis
DevMishra
ListofTablesTable1:Prisoner'sDilemmapayoffmatrix ......................................................................... 30Table2:MatchingPenniespayoffmatrix ............................................................................. 31Table3:Battleofthesexespayoffmatrix ............................................................................ 36Table4:MixedstrategyNashEquilibrium:BattleoftheSexes .......................................... 37Table5:HouseholdLoadsconsideredforLoadProfile ...................................................... 43Table6:EVCharacteristics .................................................................................................... 43Table7:MobilityData ............................................................................................................ 44Table8:Percentageofagentscharginginascenario ......................................................... 48Table9:TypicalPayoffmatrixasobtainedforCharge/Chargeequilibriumscenario ..... 49Table10:Savingsfromgametheoreticelectricvehiclechargingusingoff-peaktariffs .. 52

EstimationofthenetchargingdemandfromprivatelyownedelectricvehiclesusingGameTheory 7
DevMishra
GlossaryAC–AlternatingCurrentBEV–BatteryElectricVehicleDC–DirectCurrentEV–ElectricVehicleEVSE–ElectricVehicleSupplyEquipmentICE–InternalCombustionEngineIEEE–InstituteofElectricalandElectronicsEngineersIESD–IteratedEliminationofStrictlyDominatedStrategiesHEV–HybridElectricVehiclesPHEV–Plug-inHybridVehiclesPPF–ProbabilisticPowerFlowSOC–StateofChargeSAE–SocietyofAutomotiveEngineersTOU–Time-of-use

8 MasterThesis
DevMishra
1. Preface ThisprojectcameaboutasamasterthesisbasedonavailablepositionsatCITCEA-UPCformasterthesisstudentsinthefieldofelectricvehicles.Aneedwasfelttopredictthenet demand from Electric Vehicles (EV) as the same can help the grid prepare forscenariosinwhichelectricvehiclesarethenormandwidescaleEVpenetrationcanthusbefacilitated.PreviousattemptshadbeenmadetoestimatethenetloadfromprivatelyownedEVsandthemotivationbehindundertakingthisstudyistoseeiftheapplicationofanewapproachnamelygametheoreticmethodscanbetterhelpinsimulatingtheloadfromEVsandpresentresultswhichareclosertotheactualdata.Itwasdecidedtoutilizedata and algorithms from [1] to run simulations and compare results to obtain anunderstandingastowhichmethodisbettersuitedanddeliversresultsclosertoreallifescenarios.Whilethatdoesformapartofthiswork,thecompleteimplementationoftheestimation of the electric vehicle demand using the previouswork by applying gametheorytotheagentbasedprobabilisticmodel,couldnotbepossibleduetoreasonsofcomplexity.Furtherdiscussionswith thesupervisorresulted in theprojectevolving toa two-stepundertaking.Inthefirststep,itwasdecidedthatthemodelfrom[1]wouldbemodifiedtoaccountforallkindsofchargingstrategiessimultaneously.Inthesecondstep,itwasdecidedtoformulateahouseholdscenariocomprisingoftwoEVsandusinggametheorytopredictthescheduleanddemandofelectricvehiclecharging.Topicswhichwerestudiedaspartofthisendeavortoapplygametheoreticmethodstoelectric vehicle charging include, types of games, game theory logic and algorithms,solutionconceptsincludingNashequilibrium,paretooptimalityamongstother.ItwillbeattemptedtouseNashequilibriumasthesolutionconceptstoidentifyoptimalstrategieswhichsuitallplayersinthegivenscenario.Initialstudiesduringtheinternshipcarriedoutpreviouslyinvolvedresearchonelectricvehiclesandgametheory tobuilda foundation for themaster thesis.Thisresearch ispresentedinparttogivethereaderanunderstandingandbackgroundonthenecessarytechnicalaspectsofthiswork.Thus, in totality, this master thesis work brings together electric vehicle technology,demandmodelingandgametheoryunderasingleumbrellatoobtainuseful insightinthisdomain.

EstimationofthenetchargingdemandfromprivatelyownedelectricvehiclesusingGameTheory 9
DevMishra
2. IntroductionAttheoutsetofthisprojectitwasdecidedtoattempttoutilizegametheorytomodelthenetelectricvehiclechargingdemandfromprivatelyownedEVs.Inthetechnicalsectionofthisreport,wewillatfirstgothroughthebasicsofelectricvehicletechnology,thestateofartofthetechnologyandinfrastructurepertainingtoEVs,identifyallthestakeholdersintheEVscenarioandlookatregulationsandinitiativesindifferentcountriesregardingEVs.Thereafter,wewillproceedtosurveytechnicalaspectswhichareinvolvedinthisstudy and are necessary to formulate the algorithms for this work. This will includedetailsontheelectricvehiclesused,researchondemandmodels,applicationsofgametheoreticconceptsintheelectricpowersectorandmorespecificallytoelectricvehiclesand their charging and game theoretic modeling concepts. Post this we present anapproachtocreatemodelsandsimulationsbasedonourlearningandavailabledata.Firstup,inthenextsectionswegothroughthebasicsofelectricvehicletechnology.
2.1. IntroductiontoElectricVehiclesAnelectricvehicle isanautomobilewhichuseselectricmotorsor tractionmotors forpropulsionofthevehicle.EVstechnically includebothrailandroadtransport,surfaceandunderwatervesselsaswellasair transportmediumsbut for thisreport the termelectricvehicleorEVwillrefertojustroadtransport.Theelectrificationofallmodesoftransportation isoneof thekeyapproaches to tackle the issueofclimatechange.Thecontinual adoptionof EVs intomarketsworldwide involvesmultiple aspects bringingtogether impactsonthepowergrid,developmentofpowertrain,batteryandchargingtechnologies,aswellaspolicyandregulationindifferentpartoftheglobe.Inthissection,wewilllookatthesemultipleaspectsindetailandunderstandthecurrentstateofaffairsintheseaspects.The focus on EV development has been on powertrains, batteries and chargingequipment or electric vehicle supply equipment (EVSE). In order to meet variousrequirements of the automobile industry such as fuel economy, different powertrainsetups are tried for hybrid vehicles such as series, parallel and series-parallelconfigurations.Advanceshavealsobeenmadeontheelectricmotorusedtodrivethevehicleortosupportoperations.Allthesedevelopmentshaveresultedinvehicleswithbetter fueleconomyandhigherefficiency.Batterytechnologymeanwhile,hasevolvedfromleadacidtonickelbasedandnowtolithiumionbasedbatteriesinaquesttodevelopbatteries which have higher energy density and higher power density along withpropertiesofbeinglightweightanddurable.Similarly,chargingstationshaveprogressedfromslowchargers to fastchargers toaddress the limitationof lowrangeonEVs.AllthesedevelopmentsinEVtechnologyhaveresultedinafasteradoptionofEVsglobally,moresoindevelopednationsandnationswhichareleadingthewayinimplementationof EVs. This can be seen in Fig. 1 from the Global EV Outlook 2016 report by the

10 MasterThesis
DevMishra
International Energy Agency which is an autonomous energy consortium with 29membercountries.
Figure1:GlobalGrowthofElectricVehicleStockfrom2010to2015[2]
Inthefollowingsections,wewillcovertheaspectsofbasicEVtechnology,categoriesofEVs, batteries, charging infrastructure and EVSE, and policy and regulation regardingEVs.TogetsomebetterperspectiveandunderstandingoftheEVscenarioglobally,wewill also look at somenumber andprogression of different parameters over years ofresearchanddevelopment.LetusnowlookatthedifferentcategoriesofEVsandtheircharacteristics.
2.1.1. EVTechnologyBasicsIn terms of EV technology, there is a distinct differentiation between the technologyemployed in traditional internal combustion engine (ICE) powered vehicles and thedifferenttypesofEVsi.e.hybridelectricvehicles(HEVs),plug-inhybridelectricvehiclesandbatteryelectricvehicles (BEVs). It isassumed that thereader is familiarwith theoperationoftraditionalICEpoweredvehicleandinthissection,wewillonlydescribetheadditional technology that goes into EVs. While HEVs and PHEVs retain the ICEcomponentsbutaddcertainelectricdrivecomponents,BEVs includeonly theelectricdrivecomponents.Inthissection,wewilldiscussthecomponentsofBEVsasthesewillbemoreor lessapplicable to theothertypesofEVs.TheothertypesofEVsandtheirfunctioningandlayoutisdescribedinthenextsection.A Battery Electric Vehicle or BEV (also called a pure electric vehicle) consists of thefollowingthreecomponentsystems:1. Thedrivesystem:AtractionmotorformsthecentralpartofthedrivesystemofanEV.Themostefficientdesignistoplacethemotorsdirectlyatthewheel.Thesearethenreferred to aswheelmotors. Three types ofmotors are primarily used for the EVapplications.Theseare:DCbrushtypemotor,DCbrushlesspermanentmagnetmotor

EstimationofthenetchargingdemandfromprivatelyownedelectricvehiclesusingGameTheory 11
DevMishra
andACinductionmotor.Adetaileddiscussionofthesetypesofmotorsisbeyondthescopeofthisreport.
2. Thebattery system:Anelectric vehicle'sbatterydetermines its range, accelerationcapabilityandrechargespecifications.
3. Thecontrolsystem:Thecontrolsystemisresponsibleforoverlookingtheoperationof theelectricvehicle. It comprisesofamicroprocessor just likeacomputerand isoftenreferredtoastheon-boardcomputer.Basedonfeedbacksignalsandemployingawhole range of power electronics the control system controls the functioning ofdifferentcomponentsoftheEV.
TheabovecomponentscanbesaidtobecommontobothPHEVsandBEVshowevertheirplacementandfunctioningmaybesignificantlydifferent.Letusnowproceedtolookthedifferent types of EVsmentioned previously and understand the differences betweenthem.
2.1.2. TypesofElectricVehiclesEVclassificationdependsprimarilyontheextenttowhichelectricityistheirmainenergysource.BasedonthispremiseEVsarebroadlycategorizedasfollows:
2.1.2.1. Hybrid Electric Vehicles (HEVs): HEVs are powered by both a fossil fuel andelectricitybuttheelectricityinthiscaseisgeneratedbyacertainfunctionofthevehicleitselfsuchasregenerativebraking.AtypicalmodeofoperationinvolvestheHEVoperatingthroughtheelectricmotorandthentheenginetakesoveroncetheloadonthevehicleincreases.Theoverallpatternofdrivecontroli.e.electricorICEbasedisgovernedbyanonboardcomputerwhichisprogrammedtooptimizetheswitchesfromelectrictoICEandviceversaforbestfueleconomyandoptimumperformance.ExamplesofthesekindofvehiclesincludestheHONDACivicHybridandtheToyotaCamryHybrid.
Note:AsthiskindofEVhasnoscopeofconnectiontothegrid,itisnotimportantforourstudies.Ithasbeenmentionedheretojustgivethereaderawholesomeoverviewoftheelectricvehicletechnology.
2.1.2.2. Plug-inHybridElectricVehicles(PHEVs):PHEVsasthenamesuggestcanchargethebatterythroughbothafunctionofthevehiclei.e.regenerativebrakingaswellasbyconnectingtoachargingoutlet.ThesevehiclesarealsosometimesreferredtoasrangeextendedEVsastheICEcanrechargethebatteryasitgetslow,therebybyextendingitsrange.TheseEVsmaychoseelectricityastheprimaryenergysource

12 MasterThesis
DevMishra
orthefossilfuel.AgoodexampleofthesameistheToyotaPriuswhichusespetrolastheprimaryenergysourcewhiletheMitsubishiOutlanderutilizeselectricityastheprimaryenergysource.
Note:Asmentionedearlier,hybridvehicles(bothnormalandplug-in)haveexperimentedwithdifferent kindsof powertrain layouts over the years.Thesedifferent layouts areshownbelowinanimagefrom[3]justtogiveabasicunderstandingtothereader.Thesewillnotbediscussedindetailinthisreportasthetheyarenotimportantforestimatingthenetchargingdemand.
Figure2:Series,ParallelandSeries-ParallelHEVs(a,b,c)andPHEVS(d,e,f)[3]
2.1.2.3. BatteryElectricVehicles(BEVs):Batteryelectricvehiclesarefullypoweredbytheironboardbatterieswhichcanbechargedbypluggingintochargingoutlets.Thesevehiclesalsoemploytechniqueslikeregenerativebrakingtochargethebatterybutaren’tprimarilydependentonitanddependsolelyongridenergyforchargingthebatteries. Fig 3. sourced from [3] demonstrates the layout of a BEV. CommonexamplesofBEVsincludetheTeslaModelS,NissanLeafandtheBMWi3.
Figure3:TypicalpowertrainlayoutforBEVs[3]

EstimationofthenetchargingdemandfromprivatelyownedelectricvehiclesusingGameTheory 13
DevMishra
2.1.3. BatteryTechnologyThebatteryisthecentralcomponentofanEVandtheincreasinglytheprimaryenergysourceinPHEVsandtheprimaryenergysourceinBEVsmostdefinitely.Thetechnologyforenergystorageandbatterieshasposedalotoftechnicalchallengestoresearchersandit has been amajor barrier in thewidespread adoption of EVs. There are still someconstraintsonpresentEVbatterytechnology,whichbecomesthebarrierforwiderEVuptake. The present EV battery technology has relatively low energy density whichaffectstheoverallrangeoftheEVandthusmakingEVsalessfavorableoptioncomparedto traditional ICE powered vehicles. Additionally, the cost of batteries is high whichresultsinBEVsandPHEVsbeingconsiderablymoreexpensivethananICEvehicle.Apartfromthistherearealsoconcernsaboutthedegradationofthebatteryoveritslifecycleand certain safety features. Research and development over the past years has beenfocusingon increasingenergydensityand reducingbattery costwhileaddressing theaboveconcerns.ThefollowingchartfromtheGlobalEVOutlook2016demonstratestheevolutionofenergydensityofEVbatteriesandhowtheyhavegottencheaperovertheyears.
Figure4:BatteryDensityandCostEvolution[2]
The reason for the increase in energydensity and fall in prices of EVbatteries is thetremendous advancements which have been made in battery technology in order toachieveanendgoalofabatterywithhighenergydensity,highpowerdensity,cheapanddurable.Theevolutionofbatterytechnologystartedfromtheuseoflead-acidbatteryinautomotive applications. These were soon replaced by nickel based batteries whichincluded nickel-cadmium(Ni-Cd) and nickel-metal hydride(Ni-MH) which had muchhigher energy density than the lead-acid battery. However, these batteries haddrawbackssuchaspoorchargeanddischargeratesandefficiency,whichareessentialforEVapplications.Furthermore,theNi-Cdbatterieswerefoundtobetoxicandharmfulfortheenvironment.AroundthesametimetheZEBRAbattery(sodium-nickelchloride)wasintroducedintotheEVindustry.Thesebatterieshavehighenergyandpowerdensitybutcanonlyoperateatveryhightemperatures.

14 MasterThesis
DevMishra
Posttheeraofthesebatteries,lithiumbasedbatterieswereintroducedasEVbatteriesandmarked the beginning of a new era in EVs. These batteries are one of themostpromisinginthisfieldwithhighenergyandpowerdensity,lightweight,cheapandnon-toxicandwithfastchargerates.Duetothesecharacteristics,LithiumbasedbatteriesarethemostcommonchoiceamongstEVmanufacturerscurrently.Forinstance,lithiumionbattery packs are used in the Tesla Model S, Nissan Leaf, Mitsubishi i-MiEV and theChevrolet Volt, the most preferred EV choices currently amongst customers. SomecategoriesofLithium-basedbatteriesarelithium-ion(Li-ion),lithium-ionpolymer(LiPo)andlithium-ironphosphate(LiFePO4).Itiswidelyacknowledgedthatthelithiumbasedbattery technology holds the potential to be the ideal battery for all future EVapplications.Otherbatterytechnologiescurrentlyinexperimentalphasesbutknowntohavepromisearelithium-sulfur(Li-S),zinc-air(Zn-air)andlithium-air(Li-air)ofwhichLi-airandZn-airhaveveryhighenergydensitiesandarecurrentlyinprototypestagesofdevelopmentinresearch.Fig.5illustratestheevolutionofdifferentEVbatterytechnologiesovertime.
Figure5:DevelopmenttimelineofEVbattery[3]
Inthenextsection,wewilllookatEVcharginginfrastructureandthestateoftheartinthetechnologiespertainingtoEVcharginganddifferentmodesofcharging.
2.1.4. EVChargingInfrastructureandChargingTechnologiesAnEVchargerorEVSEformstheessentialinterfacebetweenanEVandtheelectricgrid.Achargerisnecessarybecausethegridsupplyisinalternatingcurrent(AC)formwhiletheonboardelectronicsandbatteryareindirectcurrent(DC)form.TheEVchargeristhusdesignedtorectifythehigh-powerlevelsinACtoasuitableDClevelwhichcanthenbeusedtochargethebattery.ItisoftendesignedasanAC/DCconverterorrectifier.Incertainmodernapplications suchas fast charging, aDC/DCconverter is added to the

EstimationofthenetchargingdemandfromprivatelyownedelectricvehiclesusingGameTheory 15
DevMishra
designforenhancedenergyconversion.Basedontheirpowerlevelsandhowquicklytheycanchargeavehicle,chargersareoftenveryplainlycategorizedasslowandfastchargerswhichincludesprivateandpublicchargingpoints.InFig.6thechartssourcedfromtheGlobalEVOutlook2016showthenumberofchargingstationsindifferentcountriestogiveanideaabouthowestablishedtheEVinfrastructureisinvariouscountries.
Figure6:GlobalChargingInfrastructureOverview
ForamorethoroughcategorizationwelooktoestablishedinternationalstandardssuchastheSAEEVstandardwithreferencetoSAEElectricVehicleConductiveChargecouplerstandardsSAEJ1772.ThesedividetheEVSEintothreelevels(Level1,Level2andLevel3)eachforACandDC.WithreferencetothisstandardACchargingutilizestheon-boardcharger of the vehiclewhileDC charging is performedwithoff board equipment. Forexample,ACLevel1isapplicabletoslowchargingforovernightdurationsfroma120VACsinglephasenetwork.ACLevel2isratedat240VAC.Similarly,DCLevel1andDCLevel2operateat200-450VDCwithchargingpowersof36kWand90kWrespectively.Mostofthesestandards functionatachargingcurrentofupto80A.DCchargersaretheonesmorecommonlyknownasfastchargersandcanchargeaBEVtoupto80percentStateofCharge(SOC)in30minutes.ACLevel3andDCLevel3arenotstandardizedyet,butproposedpowerlevelsfortheseare20kWand240kWrespectively[4].WhiletheSAEJ1772 is more applicable for North America, in Europe the standard referred to forEuropeanspecificationsisIEC61851.Chargersadheringtodifferentstandardsanddevelopedbydifferentmanufacturershavedifferentplugsandneedadaptersandstandardstobeabletoswitchfromoneformtoanother.Besidesreferringtostandardssuchasabove,EVmanufacturershavecomeupwiththeirownpatentedtechnologieswhichoperateatdifferentpowerlevels.AprimeexampleofthesameistheTeslaSupercharger.Teslasuperchargingstationscanchargewithupto145kWofchargingpowerwhichisdistributedbetweentwoadjacentcars, with a maximum allocation of 120 kW per car. These hi-tech charging stationsprovidedirectcurrentathighchargingpowerstraighttothebatterybypassingtheon-
16 MasterThesis
DevMishra
board charging power supply. The high charging power of the Tesla superchargernetworkallowsachargeofupto100%SOCin75minutes.OthercommonchargingstationsincludetheCHAdeMOstandardwhichisa level3DCfastchargingstationwhichwasdevelopedbytheCHAdeMOAssociationformedbytheTokyoElectricPowerCompany,Nissan,MitsubishiandFujiHeavyIndustries.Theseareprimarily utilized by Japanese cars such as the Nissan Leaf and Mitsubishi i-MiEV.CurrentlytheCHAdeMOchargershaveamaxpoweroutputof50kW.The SAE developed its own level 3 DC fast charger termed the SAE Combo ChargingSystem(CCS)whichisthepreferredtypeforGermanandUSautomobilemanufacturers.TheBMWi3andVWe-Golfusethesetypeofchargerconnections.TheCCSallowsforslowandfastchargingfromasinglecharginginletasopposedtotheCHAdeMOwhichrequiredseparateinletsforslowandfastcharging.ThecurrentmaxpoweroutputlevelforSAECCSchargersisalso50kW.Beforemovingontothenextsection,webrieflylookatthedifferenttechniquesthatcanbeusedtochargeanEVbattery.TheseareimportantastheycanhelpunderstandtheloadprofileovertheentirechargedurationofanEV.ThereareseveralchargingmethodsthatcanbeusedtochargethebatteryofanEV.Somecharging techniques studied in the academia and used conventionally are constantcurrent (CC), constant voltage (CV), constant power (CP), taper charging and tricklecharging[5].Additionally,advancedchargingtechniquesincludecombinationofoneormoreof theabovemethodsresulting in techniquessuchasconstantcurrent/constantvoltage(CC/CV).SomeotheradvancedtechniquesincludePulse-chargingandnegativepulse-chargingwhichare consideredgoodmodesofoperation for fast chargingofEVbatteries[5].CCusesconstantchargingcurrent flow to thebattery till thebatteryattainsa certainvoltagelevelwhereasCVappliesaconstantvoltageacrossthebatteryterminalswhileconstantlyadaptingthechargingcurrenttill it fallstoalmostzero[6] .CPasthenamesuggestsusesconstantpowerwhiletaperchargingisdoneviaanunregulatedconstantvoltagesourceandthereisnocontroloverthedropofchargingcurrentascellvoltageofthe charge builds up[6]. This can tend to damage the battery in case an overchargehappens. Trickle charging uses small currents to account for battery self-discharge.CC/CV charging is the preferred mode of operation for fast charging of lithium-ionbatteries.Thiskindofchargingusesconstantcurrentuptoacertainpredefinedvoltageforthebatterypostwhichitswitchestoconstantvoltage.So.whilemajorityofthechargeisdoneatconstantcurrent, theremainingtimeconstantvoltage isusedwithreduced

EstimationofthenetchargingdemandfromprivatelyownedelectricvehiclesusingGameTheory 17
DevMishra
chargingcurrenttotop-offthebattery.TheCC/CVchargeprofileisillustratedintheFig8.
Figure7:CC/CVchargingprofile[6]
Pulse-chargingprofileusesapulsebasedchargecurrenttochargetheEVbattery.Thisutilizes a short rest period between pulseswhich can help stabilize battery chemicalactions[5].Thisrestperiodissupposedtoallowthechemicalprocessesinthebatterytokeepupwiththechargingprocesstherebyavoidinggasformationattheelectrodes[6].Negativepulsechargingfollowsanoppositeprofiletopulsecharginginadditiontothepulsechargingprofilebyapplyingashortdischargepulseduringtherestperiodofthepulsechargingprofile.Thisisdonetodepolarizethebatterythusclearinggasbubbleswhich might have formed on the electrode during pulse-charging[5]. This kind ofcharging is said to improve theefficiencyof theoverall chargingprocessandprolongbatterylife.Fig9.offersdemonstratespulseandnegativepulsechargingtechniques.
Figure8:Pulsechargingandnegativepulsecharging
2.1.5. EVregulationandpolicyAnEVoffersmuchlowerrunningcostswhencomparedtotraditionalICE.ItisestimatedintheGlobalEVOutlook2016[2]thata100kmtripinanEVwouldcostabout1/4thto1/5thofthecostofusinganICEpoweredvehicle. Overaperiodoffiveyears,ifthesesavingsareaggregated,fuelsavingsexceedingUSD3000maybeachieved.EveninthelightofsuchsavingstherearepotentialobstaclesinthewayofwidescaleEVdeployment

18 MasterThesis
DevMishra
includingbutnotlimitedtohighcostofbatterytechnology,accesstoEVinfrastructure,installationandcostsofsuchinfrastructureaswellasgeneralawarenessandinterestinthiskindoftechnology.However,theidentifiedbenefitsintermsofpollutionreduction,higherintegrationofrenewables,climatechangemitigationaswellasreducedcostofthetechnology over the past decade trigger support mechanisms based on policy andregulation to increase the penetration of EVs while overcoming the aforementionedobstacles.Inthissection,wewillgooversomeofthesepolicysupportmechanisms.Thesepolicysupportmechanismscanbroadlybeclassifiedinto3categories[2]:
• Regulatorymeasures:Theseincluderegulationsonvehicleemissionsregulationsandfueleconomyrequirementsandhomologation,whichmayincludecreditsinfavorofelectricvehicles
• FinancialLevers:Theseincludedifferentiatedvehicletaxationwhichmaybebasedonfueleconomyorgreenhousegas(GHG)emissionsperkilometer
• Othermeasures:Thesecanincludewaiversonparkingfeesandtolls,aswellaslifting off access restrictions (e.g. access toEVs onbus, taxi or high-occupancyvehicle[HOV]lanes).
Inthefollowingsections,wewilllookatsomeexamplesofEVpurchaseincentives,EVuseandcirculationincentives,liftingofaccessrestrictionsandemissionstandardsandexaminehowdifferentpoliciesareaimedatincreasingtheadoptionofEVs. EVPurchase Incentives: Asmentioned in [7], purchase incentives are one of themostmotivatingofincentivestoproduceashiftforconsumersfromconventionalICEbasedvehicles toEVs. In2013,France startedofferingpurchase incentivesofEUR6300 forBEVs(definedasemitting less than20gramsofCO2perkilometerandEUR1000forPHEVs(definedasemittingbetween20gramCO2/kmand60gramCO2/km).Since2016theNetherlands,exemptcarsemittingzeroCO2atthetailpipefromregistrationtax.ForothervehiclesandEVs,theyimplementedasectionalizedtaxationschemewithfivelevelsofCO2emissionswhileprogressivelyincreasingtaxationpergramCO2/km.Forexample,PHEVswhichqualifyforthefirstlevel(below80gCO2/km)payEUR6pergramCO2/km.Compared to traditional ICEbasedvehicles thisoffera significant rebate toBEVsandPHEVs, as vehicleswith ICEhaveemissions ratings above106gCO2/km. In Sweden,vehicleswithemissionslevelslowerthan50gramCO2/kmaregranted40000kronorasrebate. Fig 10. demonstrates the scale of monetary incentives offered in differentcountriesfordifferenttypesofEVs.

EstimationofthenetchargingdemandfromprivatelyownedelectricvehiclesusingGameTheory 19
DevMishra
Figure9:ScaleofPurchaseincentivesforEVs[2]
EVUseandCirculationIncentives:Letusnowlookatsomeexamplesofincentivesbasedon the use and circulation of EVs. BEVs and PHEVs in Germany are exempt fromcirculationtax foraperiodof tenyears fromthedateof their firstregistration. IntheNetherlands, zero-emission cars do not have to pay any road taxes. Japan hasimplementedexemptionsfromannualtonnagetaxandreductionsforautomobiletaxforEVs.InSweden,EVsareexemptfromroadtaxbasedonCO2emissions.Access Restrictions Waiver: Some examples of this are access to EVs to bus lanes inOntario,inHOVlanesinSpain,andalsoinsomecitiesinFrance,theUnitedKingdomandNorway. In China, there have been trials with restricting license plates and givingpreferentialallotmenttoEVs.Emissions: The deployment of EVs is favored by increasingly stringent fuel economyrequirements and tailpipe carbon dioxide (CO2) emission standards as well on theemissionofotherlocalpollutants.BEVswhichhavezerotailpipeemissionsandverygoodenergy efficiency, and PHEVs which have reduced emissions, benefit from theseregulationsinabigway.Intermsofclimatechangemitigation,EVscandeliveronlyiftherearenetCO2emissionswhenconsideringtheelectricitygenerationusedtochargethevehiclewhichischallengeforcountrieswhichareprimarilydependentonfossilfuelbasedenergysourcesfortheirelectricityproduction.

20 MasterThesis
DevMishra
Figure10:SummaryofpolicysupportmechanismsforEVSEdeployment[2]
2.1.6. EVsinSpainThefollowingtableshowstheEVsandlistouttheirenergyrelatedtechnicalparameters.Itistobenotedthatautonomyherereferstotherangeofthelistedvehiclesandhasnoreferencetoautonomouselectricvehicles.
Figure11:Technicaldata(energy)forEVssoldinSpain[8]
AccordingtotheGlobalEVOutlook2016,SpainhasanEVstockof6000vehiclesasof2015,witha2020targetof200,000EVs.Ofthecurrent6000EVstock,around4500areBEVs and 1500 are PHEVs. Let us now look at some incentives and policy relatedinformation. Spain’s national government formulated the “Integral Plan for thePromotion of Electric Vehicles”, which comprised of the “Integrated Strategy for EVs2010–2014”initiativeinSpainthatincludedthetargetof1millionhybridandelectricvehiclesonroadinSpainbytheyear2014[9].ThefollowingsectionsummarizessomeoftheprovisionsunderthisinitiativetopromoteEVs.

EstimationofthenetchargingdemandfromprivatelyownedelectricvehiclesusingGameTheory 21
DevMishra
Accordingto[10],themaximumlimitfortotalamountofmonetarygrantsforvehiclesthataredrivenbybatterieswhichmaybefullyorpartiallychargedbyelectricityfromthegridandwhosemaximumpricedoesnotexceed32,000euros,isspecifiedasfollows:- 2,700eurosforvehicleswithrangenotexceeding40kmandbutgreaterthan15km.- 3,700eurosforvehicleswithrangegreaterthan40kmandlessthanorequalto90km.
- 5,500eurosforvehicleswithrangeofmorethan90km.
Itistobenotedthatrangeabovemeanselectricrangeifthevehicleisahybrid.In the case of charging points for electric vehicles in publicly accessible areas, themaximumamountofaidcanbe40%ofthetotaleligiblecostwiththefollowinglimitsinplace:- 15,000eurosperquickrechargepointinstalled.- 2,000eurospersemi-fastrefuelingpointinstalled.
Afterabriefoverviewofelectricvehicletechnologyandsomeinsightsonregulationandpolicy,aswellaslookingattheEVsceneinSpain,wewillnowexplorethefieldofGameTheory,thebasicconceptsanditsapplicabilitytothepurposeofourstudies.
2.2. IntroductiontoGameTheoryGame theoryprovidesmathematical frameworks toanalyze situationsof ‘conflict andcooperation’(asdescribedbyRogerB.MyersoninhispublicationGameTheory:Analysisof Conflict) between players who can operate on strategies which may or may notinfluencethestrategiesofotherplayers.Itisessentialtonoteherethattheterms‘players’and ‘strategies’ are used in this regard to indicate a model or a scenario and notrecreationalorsportsactivities.Game theory over the years has seen several classifications: co-operative and non-cooperative;symmetricalandasymmetrical;zero-sumandnon-zero-sum;tonameafew.Forthepurposesofthisstudytheclassificationofimportanceisco-operativeandnon-co-operative game theory. As mentioned in [11], Non-cooperative game theory is ofimportancetoanalyzethestrategicdecisionmakingprocessesof independentplayerswho have conflicting interests over the result of a decisionmaking processwhich isinfluenced by their actions. It is to be noted that the term non-cooperative does notessentiallyimplythattheplayersdonotco-operate,butitmeansthat,anyco-operationisobservedarises fromself-interestwithoutanyco-ordinationandcommunicationofstrategies between different players. Thus, it can be said that non-cooperative gametheorymaybeusedtomodeladistributedprocesstooptimizeanoverallgoalwhichisa

22 MasterThesis
DevMishra
result of playerdecisionswithout any communication and co-ordinationbetween thestrategiesofindividualplayers.Co-operativegametheoryontheotherhandconsiderincentivesforindividualplayerstocollaborate.There are twomajor frameworkswhich formco-operative game theory:Nashbargainingandcoalitionalgametheory.Nashbargainingemploysagreementbasedontermsandconditionsbetweenindividualplayerswhilecoalitionalgametheorytakesintoaccountformationofgroupsorcoalitions.LetusnowproceedtolookatsomeofthemathematicalbasicsofGameTheory.Tofollowaconsistencyofnotationandrepresentationwewillbefollowingthestylefrom[12]inordertohaveacoherentpresentationoftheconcepts.[12]describesstrategicgamesasamodelofinteractingdecisionmakers.Itfurthergoesontodefinestrategicgamesasonewhichconsiststhefollowing:
-asetofplayers-asetofactionsforeachindividualplayer-apreferenceprofileoverthesetofactionprofiles
AsetAisassumedtobeconsistingofalltheactionsthat,undercertainconditions,areavailabletoaplayer.InanyspecificconditiontheplayerisfacedwithasubsetofAandchoosesasingleelementtherein.Thenextelementwhichconstitutesastrategicgamemodelisthenotionoftheplayerpreferences.Playerpreferencesarerepresentedintheformofpayofffunctionswhichassociatesanumbertotheoutcomeofeachactioninaway such that actionswithhighernumbers aremore favorable to theplayer and arehencepreferred.MathematicallyforanytwoactionsaandbintheactionsetA,andu(a)issaidtorepresentthepayofffunction,thenu(a)>u(b)impliesthattheplayerprefersactionaoverb.Itmustbenotedthatthepayofffunctiononlyconveysordinalinformation[12].Thismeansthatthepayofffunctioncanonlysuggestifanactionispreferredoveranotherandnottheintensitywithwhichitmaybepreferred.Beforeproceedingfurtherwiththenotionofstrategicgames,itisessentialtomentionheretheconceptofthetheoryofrationalchoicewhichasdescribedin[12]statesthattheaction taken by a decision-maker or player in a specific situation is at least as good,accordingtotheplayer’spreferences,aseveryotheravailableaction.Thistheoryisveryessentialtodefinewhyaplayerwouldchooseacertainactioninacertainconditionandthusenhancestheunderstandingofanysituation.Movingonfromthetheoryofrationalchoicewemustexaminewhatactionswillbetakenbyaplayerinastrategicgame.Asthetheoryofrationalchoiceimpliesaplayerwould

EstimationofthenetchargingdemandfromprivatelyownedelectricvehiclesusingGameTheory 23
DevMishra
choosethebestavailableaction.However,inagamethebestavailableactionwilldependontheactionsofotherplayers.Thus,aplayermustformanopinionabouttheactionsofother players and then base his/her action on the same. In basic game theory, it isassumedthateachplayer’sopinionofotherplayers’actionsisderivedfromtheirpastexperience of playing the game. Furthermore, it is assumed that this experience issufficiently extensive that he/she knows is sure of how their will act. In[12], it issuggestedtoviewofthisscenariointhefollowingidealizedmanner.Eachplayerinthegameisfacedwithapopulationofdifferentplayerswhomay,onanyoccasion,bymeansofrotationstakethatplayer’srole.Foreveryplayofthegame,playersarepickedfromeachpopulation randomly.Therefore, eachplayerparticipates in thegameagainstanever-changingpoolofopponents.Theirexperiencehelpsthemformanopinionaboutatypicalsetofopponents,notanyspecificsetofopponents.BasedonthisbackgroundwewillnowproceedtounderstandtheconceptofNashequilibriumwhichisanessentialconceptinunderstandingstrategicgames.Wewillborrowthedefinitionfrom[12]whichstatesthat:“ANashequilibriumisanactionprofilea∗withthepropertythatnoplayericandobetterbychoosinganactiondifferentfromai∗,giventhateveryotherplayerjadherestoaj∗”
Whatthisessentiallyimpliesisthatforanygivenplayofthegameinwhichtheplayersarerandomlydrawnfromacollectionofpopulations,theNashequilibriumcorrespondstoasteadystate.Insimpletermsifagameisplayedatacertainpointoftimewithanaction profile corresponding to the Nash equilibrium profile a*, then no player has areasontochooseanyactionoutsidetheircomponentina*.Thisconceptwillbefurtherdemonstratedasitwillformthebackboneofformingthesolutionofourgivencase.ThediscussiononthesamewillbetakenupinChapter4.Theaboveconceptofasteadystate isessential instudyingstrategicgamesaswecanapplytoreallifescenarioswhereactionscanfollowrationalchoiceanditcanbeassumedthatplayersaremoreorlesssureoftheactionsofotherplayersandwillactonlyinself-interest.TestingouttheapplicabilityofNashequilibriuminreallifesituationstakesupasignificantpartofgametheoryappliedtoreallifeproblemsandthenotionofequilibriumhasnowbeenexpandedtodifferentformsofgame.Whenthemodellingofelectricvehiclechargingdemandisattempted,thiswillalsobetakenintoconsideration.Inthefollowingsection,weexaminesomecaseswhereinGameTheorywasemployedinrelateddomainsandstudywhatapproachesandmethodologieswereusedtherein.Thiswillbehelpfulinidentifyingtechniqueswhichcanbeusefulincarryingoutthisproject.

24 MasterThesis
DevMishra
2.3. GameTheoryApplicationsinRelatedFieldsInthissection,willlookathowresearchersandmathematicianshavetriedtoapplygametheoretic concepts and formulations to the electricpower sector especially lookingatsmart grids, decentralized electricity markets and electric vehicles integration andoptimizationstounderstandbetterthepossibilityandscopeofapplyingsimilarconceptsand formulations to determine the net electric vehicle charging demand of privatelyownedEVs.In[11]theauthorsenvisionthefuturesmartgridtobeascaledupcyber-physicalsystemwithbuiltinstate-of-theartpower,control,communicationsandcomputingtechnology.The paper analyses the potential of applying game theoretic solutions to address thechallengeofintegratingthesetechnologiesintotheSmartGrid.TheauthorsexplorethreeemergingtechnologyareasintheSmartgridnamelymicro-gridsystems,demand-sidemanagement, and advanced communications systems and study the contributions ofdifferent mathematical game theory modelling systems can have in simulating therespectivebehaviorofthesetechnologies.Theauthorsdiscussonhowgametheorycanhelpinprocessingandoptimizingthevariousparametersineachofthesetechnologiesandsuggestfurtherapplicationsofthesame.
Figure12:GameTheoretictechniquesforMicroGridApplications[11]
Themaintechnicalchallengesineachofthesetechnologyareasareidentifiedandthenitis discussed how specific game theory approaches can be applied to mitigate thesechallenges.Theauthorsalsosuggestfuturedirections,suchasimplementingmorerobustand fool proof strategies amongst other measures, to ensure that the gap betweentheoreticalsimulationsandpracticalimplementationofSmartGridsisreduced.Thisisillustratedintheabovetablefrom[11]whichdelineatestheabovementionedanalysisforthemicrogridstechnologyarea.

EstimationofthenetchargingdemandfromprivatelyownedelectricvehiclesusingGameTheory 25
DevMishra
It is alsonoted thatmost current andpastwork is focusedon static non-cooperativegamesanditissuggestedthatthesebealsoanalyzedfromadynamicperspectiveasalotofparametersrelated to thegridsuchasgenerationanddemandare timevariable innature.ThereisalsomentionofBayesiangameswhichisatypeofnon-cooperativegameinwhichdifferentplayershaveverylimitedknowledgeoftheactionsandstrategiesofofother players. The authors say that given the large-scale nature of the grid it can beinteresting to see how Bayesian games can overcome the technical difficulties inestimatingtheexactstrategiesofalargenumberofplayers.In[6],theauthorsundertakeananalysisoftheeconomicaspectsoftheintegrationofEVsin thesmartgridbydevelopingamean fieldgamemodel.Theydevelopa frameworkwhichenabledananalysisofthevariationofelectricityprice,ofthehourlydemand,andthepossibilityofenergyreservesintheSmartGridwhenEVownerschoosetobuy/sellenergybasedontheirselfishbutrational interestsaimedatmaximizingtheirbenefitsundertherestraintofdifferentelectricitypricing.Theauthorsgoontosaythatsincethenumberofplayers is largeandalike, thepricingpolicybecomesaconsequenceof theactionofalltheplayers,andthustheproblemwastheformulatedasameanfieldgameandthefundamentaldifferentialequationsforwhichwassolvedtoobtainconclusions.Fromthispaper,itisinterestingtoobservetheuseofameanfieldgameanalysis.UnliketraditionalNplayergameswheretheobjectiveistofollowthestateofeachplayer,inameanfieldgameanalysistheobjectiveistoobtaintheoptimaldistributionforallplayerstobeatacertainstateXataninstantoftimet.Thus,insuchacaseitallowsthesimulationtofollowthestateofallusersatthesametime.AdetaileddescriptionofthenotionofNash equilibrium inmean field games, which is termed asmean field equilibrium isoutside of the scope of this report, and the original publication cited here should bereferredfordetailedunderstanding.However,inessencetheconceptoftheequilibriumrepresentingasteadystateissimilartothatofaNashEquilibriumashasbeendiscussedinthesectionexplainingthebasicsofgametheory.In[13],theauthorsformulateanenergymanagementgamewhichexploitsthepotentialof electric vehicles as the most shiftable load to achieve residential demand sidemanagement in the future smart gird. The utilize game theory to come up with anautonomousenergymanagementsystemforresidentialuserswhowanttosellenergybacktothegridbydischargingthebatteryoftheirEVs. Inthiscasetheplayersofthegamearetheresidentialusersandtheirstrategiesaretheirprofilesofdailyusageoftheirhouseholdappliances.ThefurtherdemonstratethattheNashequilibriumoftheirgametheory implementation results in optimization of energy costs even including thedepreciation cost andadverseeffectson the lifeof thebatteryas a resultof frequentdischargingandsellingenergybacktothegrid.Theapplicationofgametheorytotheirenergymanagementmodelresultsinreductionoftotalenergycostsandindividualutilitybills.Theydoconcludeintheendbysayingthatconsideringthedepreciationcostsofthe

26 MasterThesis
DevMishra
batterytheutilitycompanymightneedtoprovideincentivizedspecialpricestopromoteresidentialuserstostoreandsellenergybacktothegridatappropriatetimes.Anothernovelapproachtoourstudyofgametheoryimplementationcanbetheapproachused by [14] using a non-cooperative Stackelberg game which is a type of non-cooperativegamethatworkswithamulti-tieredstrategybaseddecisionmakingprocessinvolving number of independent decision makers or players (called followers) inresponsetothestrategyofamainleadingplayer(theleader).Theymodelthesmartgridastheleadingplayerwhichdecidesitspricingbystrikingabalancebetweenoptimizingrevenue and encouraging participation of EVs. The EVs on the other hand decide onchargingstrategiestooptimizethebalanceofchargingthebatteryandthecostincurredtodoso.TheauthorsfurtherfindanequilibriumforthegamewhichinthiscaseiscalledtheStackelbergequilibriuminwhichforanoptimumgridpricingstrategythereareEVswithpreferredequilibriumstrategies.Theyfurtherformulateadistributedalgorithmtoachieve this equilibrium and run simulations on the same. Their model is furtherexpandedtotimevariablemodelwhichcantakeintoaccountslowlyvaryingconditions.Theirsimulationsdemonstrate improvedperformancegains in termsofutilityperEVcomparedtootheroptimizationtechniques.The above approach may be applied to our attempt to model charging demand ofprivatelyownedelectricvehiclesinacasewherethereisdynamicpricing.Insuchacase,thepricingstrategycanbeassumedtobealeadingstrategywhilethechargingstrategiesoftheEVuserwillresultasthefollowers.Thisisasuggestionatthispointandmayormaynotleadtodeliveringoptimumresults.Overalltheaboveapproachestoemployinggametheoryinfieldsrelatedtoourdomainofstudyhashelpedidentifymethodologiesand approaches whichmight be possible to implement in trying to estimate the netchargingdemandfromprivatelyownedelectricvehicles.

EstimationofthenetchargingdemandfromprivatelyownedelectricvehiclesusingGameTheory 27
DevMishra
3. LiteratureReviewandTechnicalBackgroundInthischapter,wewillbuildbackgroundonrelevantaspectsofthisproject.Inthefirstsection,wewillcoverelectricvehiclesandtheirfeatureswhichwilllaterbeusedforthisproject.Thereafter,wewilltakealookatcertainurbanmobilityconcepts,followedbyastudyofdemandmodels.Inthefinalsectionofthischapterwewilltakealookatconceptsessentialtogametheorymodelingwhichwillbeemployedinthiswork.
3.1. ElectricVehiclesInthissection,wewillcovertheelectricvehicleswhichwereconsideredtobeapplicabletothisproject.Theseincludetwoofthehighestsellingelectricvehiclesintheworld,theTeslaModelSandNissanLeaf.The Tesla Model S was first introduced by Tesla Inc., in 2012. The vehicle is mostrenownedforhavingextensiverangeofupto539kmsforthe2017topendmodelwhichcomes equipped with 100 kWh battery pack. The top endModel S (performance) ispoweredbya3phasefourpoleACinductionrearmountedmotorwith310kWofpowerand600N.moftorque.Thebasemodelwhichisconsideredforthisstudyusesamotorwhichproduces270kWand440N.moftorque.Thebatterycontainslithium-ionbatterycellsinmoduleswhicharewiredinseries.Itisguaranteedfor8yearsor200,000kmsforthebasemodel.ThestandardEuropeanchargeracceptssinglephase230Vat7.6kWand3phase230Vor400Vatupto11kW.The Nissan leaf is a five-door hatchback electric carmanufacture by Nissan andwasintroducedforthefirsttimeintheJapanandUnitedStatesin2010.ThiswasfollowedbyitsintroductionintheEuropeanmarketaswellasCanadaintheyear2011.The2016modelyearLEAFwiththe30kWhbatteryisexpectedtohavearangeof172kmwhilethereisalowerspecmodelwitha24kWhbatterywhichisexpectedtogivearangeof135kms.TheLEAFusesafrontmountedsynchronouselectricmotorwhichcandeliver90kWofpowerand280N.moftorque.Modelsareusuallyequippedwithanon-board3.6kWchargerthatcanbefullychargedinaround8hoursfroma220/240V30Asupply.
3.2. DemandModels[1]usesabottomupapproachutilizingprocessdatawithstochasticvariablesandthemimplementingrepeatedrandomsamplingusingtheMonteCarlotechniquetoemulatetheparameters.Thismodelisthereforetermedasa ‘ProbabilisticAgent-BasedModel’.ThemodelincludestheconceptofanEVagentwhichcomprisesofthedriverplusvehicle.Theagent has associated variables such as type of vehicle, battery power, energyconsumption,autonomyofoperationetc.TheEV typesusesaprobabilitydistributionfunctiontodefinetheprobabilityofdifferenttypesofpassengercarsEVsusedinSpainandasimilarmodelwillbeusedtoforthispaper.Theauthorsfurthergoontodefine

28 MasterThesis
DevMishra
mobilitypatternfortheagentsbasedontripsperday,distancepertrip,destination,timeandday,andvelocity.SocialvariablesaresuchasGDPandpopulationdensityaretakenintoaccounttodeterminethelikelihoodofanumberofagentstobechargingatalocation.Theagentbasedmodelemploysatimeloopwhichupdatestheenvironmentandinsidethereisanagentloopwhichupdatesthestateoftheagent.Thisupdateisbasedonthestochasticvariablesthusrelatingtoacertainprobability.[15]presentsaspatialandtemporalmodelofEVchargingdemandforasinglechargingstationlocatedveryclosetoahighwayexit.Whilethisisdifferentfromthegoalsofourstudy, it is interesting note the approach and certain specific findings. The authorssuggest amathematicalmodel of electric vehicle charging demand for a single rapidchargingstation.TheybasethemodelontrafficflowbasedonafluiddynamicsmodelandtheM/M/squeueingtheory.ThetrafficmodelisutilizedtodetermineanarrivalrateforEVsinneedofchargingtothechargingstationandthenthequeueingtheoryisaddedtoforecastachargingdemandforthegivenstationenablingdistributorsandoperatorstoplanforthesame.Therunasimulationusinganumericalexamplethroughwhichtheyclaimthatthemodelcapturesthespatialandtemporaldynamicsofahighwaychargingstation.[16] applies probabilistic power flow (PPF) to analyze the impact of Plug-in HybridElectric Vehicles (PHEVs) on the electricity grid. The authors assert that since thechargingpattersofPHEVsisdeterminedbyseveraluncertainparameters,PPFisagoodapproachtostudythesame.TheyproposeamethodologywhichstartsbyemployingasinglePHEVchargingdemandmodelandthereafteremploysqueueingtheorytomodelthe behavior of multiple vehicles. The further apply this model to compute the netchargingdemandatanEVchargingstationaswellasfromaresidentialcommunity.TheresultsobtainedfromthemodelarethenputonatestcasebyusingIEEE30bustestsystemandtheresultsofthePPFwerecomparedagainstMonteCarlosimulations.Theauthorsmentionthatwhiletheirmethodologyyieldsgoodresults,infutureitwouldbeimperative to take into account a scenariowith controlled charging of EVs includingmeasuressuchsmartcharging.In [17], the authors try to model and analyze the load demand from an EV batterycharginginatypicalU.K.distributionsystem. Theirapproachistocreateastochasticformulationwhich takes into account the randomly distributed nature of the batterychargingtimesofEVusersandtheinitialSOCofeachbattery.TheyfurtherformulatefourEVchargingscenariostakingintoaccountfuturetrendsinelectricitypricesinthemarketandregulationspertainingtoEVbatterycharginganddocomparativeanalysisbetweenthe four. The time-based charging load for the EV battery is considered for themostcommonbatteryused,theLi-ionbattery.Thepaperfurthercomestoaconclusionthata10%deploymentofEVsintermsofmarketshareinthedistributionsystemunderstudy

EstimationofthenetchargingdemandfromprivatelyownedelectricvehiclesusingGameTheory 29
DevMishra
canresultinanincreaseof17.9%inthedailypeakdemandandconsequentlya20%EVpenetrationmayresultinanincreaseindailypeakdemandofaround36%forascenariowithoutanyexternalcontrolsimposedonthechargingofEVs.Scenariossuchasoff-peakchargingdemonstrateanincreaseddemandonlyduringnightwithnoeffectonthedailypeak demand. The paper also suggests that the distribution of the start times of EVchargingcanhavesignificantimpactontheload.Asaconsequence,theauthorssuggestsmart charging scenariowherein the cheapest hourof electricityprices is selected tobegin charging. However simultaneous start of multiple EV charging may lead tosignificantincreaseinoff-peakloadswhichmayleadtothecreationofanewpeakinoff-peakdemandprofile.TheauthorsfinallysuggestthattheloadfromEVstobeanalyzedindetailmustbesegregatedintoresidential,industrialandcommercialtoassescorrectlythe impact of EVs on the demand load profile. This is advice which is taken intoconsiderationforourfurtherstudiesthusrestrictingthestudytoestimatingtheenergydemandfromchargingonlyprivatelyownedEVs.
3.3. GameTheoryModellingWhentalkingaboutgametheoryandsituationstowhichitcanbeapplied,weoftentalkabouttheparticipantsofthatgameintermsofplayersoragents.Pleasenotethatinthistextboththeseterms,playersandagents,havebeenusedinterchangeably.Toconsidersolvingproblemsusinggametheoryitishelpfultothinkofgamesinthefollowingbasicclassification:
1) Simultaneousplaygamesornormalformgames:The payoffs for a game where each player plays simultaneously withoutknowledgeofprevioushistoricalmovesandofotherplayersmovesi.e.gamesofthenormal form,canbeandareusuallyrepresented inamatrix form.Fora2-playergameitiscanbeindicatedina2Dmatrixwhilemultidimensionalmatricesmayberequiredtoformtheplayoffmatrixofformultipleplayergames.
2) Sequentialplaygamesorextensivegames:Forasequentialplayschemewhereeveryplayerisawareofitsprevioushistoricalmovesandhasarrivedatastatebasedonpreviousdecisionsandstrategies,i.e.anextensiveformgameisusuallyrepresentedinatreeformwhereeachnodeinthetreeindicatesacertainplayersstate.
In the following sections, we will go through certain representations of games andmethodsofsolvingthemwhicharetermedassolutionconcepts.Thesewereessentialinimplementingthegametheorymodellinginthisproject.Therepresentationpresentedhereinisinspiredbytheformatin[18].

30 MasterThesis
DevMishra
RepresentationofNormalformorSimultaneousgames–MatrixRepresentationAgamewithfinitenumberofplayersalsocalledan-persongamecanberepresentedinthefollowingmanner.ThesetNisusedtorepresentallagentsorplayers.ThusAgent1,Agent2,Agent3andsoonuptillAgentnarerepresentedbythefollowingset: 𝑁 = {1,2, …… , 𝑛} (1)Nowforeveryplayeroragentithereexistsafinitesetofallpossibleactions𝐴+ .Thesetofallpossibleactionswhichcanbetakenbyaplayeroragentiscalledanactionprofileandisrepresentedas: 𝑎-, 𝑎. …… , 𝑎/ ∈ 𝐴-×𝐴.×……×𝐴/ (2)Anactionprofileisinessenceachoiceofactionordecisionforeachagent.Now,foreachAgenti,wecancreatearealvaluedfunctionwhichwillassignutilitypayoffsbasedontheactionselectedbytheagent. 𝑢-:𝐴-×𝐴.×……×𝐴/ → ℝ (3)A naturalway to represent a normal-form game iswith an n-dimensional payoff (orutility)matrixthatshowseveryagent’sutilityforeveryactionprofile.Eachcell inthematrixbecomesthepositionofautilityforacertainactionprofile.Forthefamousgametheoryexampleproblem,theprisoner’sdilemmawhichisatwopersoncomply/defectgame,thiscanberepresentedasfollows:
Table1:Prisoner'sDilemmapayoffmatrix
1/2 C D
C -1,-1 -4,0
D 0,-4 -3,-3
Theaboverepresentationisexplainedasfollows.Thefirstrowcorrespondstoplayer2’sstrategies,andthefirstcolumncorrespondstothestrategiesofplayer1.Thefirstnumberineachcellisthepayoffobtainedbyplayer1forthatmixofplayers’strategiesandthesecondisthepayoffavailabletoplayer2.Intheabovetable,CstandsforComplyandDstands forDefect.These strategieswillbe furtherdiscussedat theendof this sectionwhentheabovegameissolved.

EstimationofthenetchargingdemandfromprivatelyownedelectricvehiclesusingGameTheory 31
DevMishra
RepresentationofExtensiveformorSequentialgamesExtensiveformcanbeconvertedtonormalformandthusbasicnomenclatureregardingrepresentationremainssimilar.However, there isan inherent temporalstructure inasequential game and thus the representation is not possible in amatrix form. A treestructureisusedtorepresentsequentialgames.Thisisdemonstratedinthefollowingimage:
Figure13:RepresentationofSequentialgames[18]
Itisessentialtonoteherethatallsequentialgamescanbereducedtonormalformorsimultaneousgamesandthatateachnodeintheabovetreerepresentationcorrespondstoasimultaneousmoveornormalformgame.Beforeproceedingwith thediscussionofdifferentkindsof strategiesasapplicable togames,wewillbrieflyexamineacategorizationofgameswhichmightbeusefulinourstudy.Thiscategorizationisbasedonthesumofpayoffsobtainedforeachactionprofile.Ifforallactionprofiles,thesumofthepayoffisthesameandisaconstant,itiscalledaconstantsumgame. 𝑢- 𝑎-, 𝑎. …… , 𝑎/ +……+ 𝑢/ 𝑎-, 𝑎. …… , 𝑎/ = 𝐶 (4)Ifthesumofpayoffsisaconstant,thegamecanbetransformedintowhatiscommonlyknownasazero-sumgamebysubtractingC/nfromeachpayoff.Thesegamesarepurelycompetitive(win/lose)innature.Thisisillustratedinthefollowingpayoffmatrixinthegameofmatchingpennies.
Table2:MatchingPenniespayoffmatrix
1/2 Heads Tails
Heads 1,-1 -1,1
Tails -1,1 1,-1

32 MasterThesis
DevMishra
On the other hand if the sum 𝑢- 𝑎-, 𝑎. …… , 𝑎/ +……+ 𝑢/ 𝑎-, 𝑎. …… , 𝑎/ is not aconstantorzeroandisdifferentfordifferentactionprofiles,thegameiscalledanon-zerosumgame.Theuniquefeatureofthesegamesisthattheycanfeatureco-ordinationandco-operation.StrategiesinGamesIngames,therecanbeinessencetwokindsofstrategieswhichplayerscanadoptandtheseareclassifiedbasedonsuretyorprobabilityoftheplayerstakingacertainaction.Whileinonesetofstrategieseachactionisfullycertain,intheothercertainprobabilityisassociatedwitheachactionprofile.ThesetwokindsofstrategiesarePureStrategyandMixedStrategy.Purestrategyisdefinedasasingleactionthataplayeroragentcantakeinagame.Itcomprisesofasingleactiononpartofeachoftheagentsorplayers.Eachrowandcolumnofapayoffmatrixrepresentapurestrategy.Asetofallsuchstrategiesistermedaspurestrategyactionprofile.Amixedstrategyisonewhichhasacertainprobabilityattachedtoeachoftheactionsthatanagentcantake.Amixedstrategywhenrepresentedas𝑠+ ,implies: 𝑠+ 𝑎+ =probabilitythataction𝑎+ willbeplayedundermixedstrategy𝑠+ (5)Boththesekindsofstrategieswillbebetterexplainedinthesectiononsolvinggames,wherewith the help of simple games, exampleswould be provided of these kinds ofstrategies.Sinceapayoffmatrixorgametreerepresentsonlypayoffsorutilityobtainedfrompurestrategy profiles, there is need to introduce a concept regarding the utility formixedstrategyprofiles.ExpectedUtilityInapayoffmatrix,eachrowandcolumnrepresentsapurestrategyandeachcellgivesthepayoffforacertainstrategybasedontheactionsofalltheplayers.However,whenthecaseisgeneralizedtoincludemixedstrategies,wehavetointroducetheconceptofexpectedutility.Thekeyhereistocalculatetheprobabilityofeachoutcomebasedonthestrategiesofallagentsandthencalculatetheaveragepayoffforagentiweightedbytheprobabilities.Forastrategyprofile 𝑠-, 𝑠. …… , 𝑠/ theexpectedutilityis
𝑢+ 𝑠-, 𝑠. …… , 𝑠/ = 𝑢+ 𝑎-, 𝑎. …… , 𝑎/:;,:<……,:= ∈>
𝑠? 𝑎?
/
?@-
(6)

EstimationofthenetchargingdemandfromprivatelyownedelectricvehiclesusingGameTheory 33
DevMishra
Thiswillbedemonstratednumericallyinthelatterpartofthenextsection.Solvinggames:Whenwearedealingwithasingleagenttheoptimalstrategycanbebasedonmaximizingthepayoff in the field thedecision theory isbeingapplied to.However,withmultipleagents, thebeststrategycanandwillusuallydependonotheragents’ choices.This issolvedby trying to identifycertain logicaloutcomesdefinedbydifferentgame theorytextsandliteratureandarecalledsolutionconcepts.In the following section, wewill briefly go through themost important game theorysolution concepts and see indetail throughexamples the solution conceptwewill beapplyingtotheproblemathand,theNashEquilibrium.DominanceAstrategy𝑠+ issaidtodominatestrategy𝑠+A,iftheformergivestheagentabetterpayoffthanthelatterforeverystrategyprofile𝑠B+ofotheragent.Thus,thissolutionconceptisbasedonIteratedeliminationofstrictlydominatedstrategies(IESD)orotherwaysoffindstrategies dominated by other strategies as by the theory of rational choice and tomaximizepayoffnoagentwouldeverplayadominatedstrategy.Thismethodisbasedoniteratingrepeatedlytocheckifacertainstrategydominatesotherforacertainagent.
ParetooptimalityAstrategyprofileSissaidtoParetodominatestrategyprofileS’ifnoagentigetsapayoffwhichisworsebyplayingwithprofileSoverprofileS’foralli.Whilethisimpliesthatthepayoffsmaybeequal, there isanadditionalclausewhichstatesthatat leastoneagentshouldhaveabetterpayoffwithstrategySthanwithS’.TheconceptofParetooptimalityisbasedontheabovedefinitionofParetodominance.Astrategy profile S is said to be Pareto Optimal if there is no profile S’ which ParetodominatesS. It isalsoknownthateverygamemusthaveat least oneParetoOptimalprofile and there always exists one Pareto Optimal profile wherein all strategies arepure.[18]
NashequilibriumWhiletheconceptofNashEquilibriumwasbrieflymentionedintheintroductiontogametheoryinchapter2,herewewilldelvedeeperintotheconcept.ItisessentialtostateherethatmostsolutionconceptsareinterrelatedinonewayortheotherandthisparticularsolutionconceptwaschosenforthisprojectasaNashequilibriumrepresentsasteadyand stable state for a given systemwhereno agenthas an incentive to shift fromhisactions.Asforamultiagentsystematwhichthisprojectwasoriginallyaimedthegoalistofindthefinalstateofthesystemwhichisstablethisconceptwaschosenforsolvingtheproblemathandusinggametheory.

34 MasterThesis
DevMishra
To understand the concept of Nash equilibrium it is essential to know first of bestresponse. A best response for a given player is an action profilewhere in the playercannotgainmoreutilitybyshiftingtoanotheractionprofile.Inessencedrawingfromthedefinitioninchapter2,itcanbesaidwheneachplayerisplayingbestresponsestootherplayersbestresponses,thesystemissaidtobeinNashEquilibrium.
Mathematicallythiscanbeexplainedasfollows.Let𝑆B+bethesetofallstrategieswithoutthestrategyofagenti.
𝑆B+ = 𝑠-, 𝑠. … 𝑠+B-𝑠+D- … , 𝑠/ (7)Thus𝑆B+ isthestrategyprofileSwiththestrategyofagenti.Let𝑠+ bebystrategyforagenti.Then,
(𝑠+, 𝑆B+) = 𝑆 (8)Let𝑠+Abethebestresponseto𝑆B+ ,thenforallstrategy𝑠+ availabletoagenti:
𝑢+ 𝑠+A, 𝑆B+ ≥ 𝑢+(𝑠�, 𝑆B+) (9)NowcomingbacktoNashEquilibrium,astrategyprofile𝑠 = 𝑠-, 𝑠., …… , 𝑠/ isaNashequilibrium if forevery i,𝑠+ is thebest response to𝑆B+ , that isnoagentorplayercanbenefitfromdeviatingfromhisstrategy.
ANashEquilibriumissaidtobestrictif𝑠+ istheonlybestresponseto𝑆B+ , thatisanydeviationfromtheequilibriumstrategywillresultintheplayerdoingworse.Iftherearemultiplebestresponsesto𝑆B+ ,theneachofthemwillformweakNashequilibrium.Purestrategy nash equilibria can be both wear or strict where as mixed strategy nashequilibriaarealwaysweak.ThereasonformixedstrategyNashequilibriabeingweakisbecauseiftherearemorethan2purestrategiesthatarebestresponsesto𝑆B+ ,thenanymixtureofthemisalsoabestresponse.
Ifastrictlydominantstrategyexistsforoneplayerinagame,thatplayerwillplaythatstrategyineachofthegame'sNashequilibria.Ifbothplayershaveastrictlydominantstrategy, the game has only one unique Nash equilibrium. However, that Nashequilibrium is not necessarily Pareto optimal, meaning that there may be non-equilibriumoutcomesofthegamethatwouldbebetterforbothplayers.Pleasenotehere,thatsolvinggamesisnotbeingdiscussedextensivelywithrespecttosequentialgames,asforourstudythescenarioreducestomultiplecharge/notchargesimultaneousgamesateverytimestepofthedaywhichisessentiallyasequentialgame.Andthemethodtosolveasequentialgameofteninvolvesreducingittonormalformandthen proceeding with a solution concept. While talking of solving sequential games

EstimationofthenetchargingdemandfromprivatelyownedelectricvehiclesusingGameTheory 35
DevMishra
withoutconvertingtonormalform,twoconceptsareoftendiscussedsub-gameperfectequilibrium and backward induction. Subgame perfect equilibrium deals with anequilibrium situation in a certain branch of the game where a certain agent has noincentivetofollowacertainpathbasedontheoutcomes.Backwardinductionisamethodofsolvinggamesbystartingattheendoftreebranchretracingstepstoseethelogicalsolutionofthegameoftenidentifyingsubgameequilibriaaswell.After discussing the above strategies, we will now proceed to see some numericalexampleswhereitwillbedemonstratedonhowNashEquilibriaarefoundindifferentcases.Letus first lookat theprisoner’sdilemmagametounderstandsolving forpurestrategyNashequilibrium.Letussetthepremiseofthegamefirst.Therearetwoprisonersinpolicecustodyintwoseparaterooms.Foreachprisoner,thepolicearetryingtogetthemtotestifyagainsttheotherprisonerandinreturnfortestifyingagainsttheotherprisoner,theprisonerwhotestifieswillbeofferedareducedsentence.Thescenarioboilsdowntothefactthatiftheybothtestifyagainsteachotheri.e.defect/betraywiththeotherprisoner,theybothgetsentenceof3yearseach. If theyon theotherhandbothrefuse to testifyagainsteachother,therebycooperatingwitheachotherandremainsilent,thepolicehaslessevidenceandcanonlyputthembothawayfor1year.However,ifonebetrays(defect)andotherremainssilent(co-operate),theonewhobetraysgoesfreewhiletheotherissentencedto4yearsofprisontime.These jail timesarerepresentedastheirnegativesto formthepayoffmatrixinTable1sothathigherjailtimeisalowerpayoff.If we analyze the game, let us see the outcomeswhen player 1 either defects or co-operates.Ifplayer1co-operatesbutplayer2defects,player1getsajailtimeof4yearsandplayer2goesfree.However,ifplayer2co-operatesbothgetajailtimefor1year.So,ifplayer1,goeswithco-operationitsalwaysinplayer2’sinteresttodefect.Now,ifplayer1chosestodefect,player2willstillprefertodefectas3yearsislessjailtimethan4.Andthiswillholdtruetheotherwayaround.Thus,thedefect,defectstrategyprofilebecomesastrictNashequilibrium.Hereitcanbenoticedthatdefectionalwaysresultsinabetteroutcome and hence it is the dominant strategy and co-operation is the dominatedstrategyandhencecanbeeliminated.AnyunilateraldeviationfromtheequilibriumisworseforeachplayerandthisiscoreofthealgorithmwhichwillbeusedtodeterminetheexistenceofpurestrategyNashequilibriuminourproject.LetusnowexploreanothergamecalledtheBattleoftheSexestodemonstratehowtofindmixedstrategyNashequilibrium.Thepremiseofthegameisasfollows.Amanandawoman in a couplewant to gooutoneevening for entertainmentbut theyhavenomeansofcommunicationandco-ordination.Themanwantstogotowatchafightwhilethewomanpreferstogototheballet.Moreover,theybothpreferbeingtogetherthan

36 MasterThesis
DevMishra
endingupaloneattheirpreferredformofentertainment.Thepayoffmatrixforthisgameisdemonstratedinthefollowingtable.
Table3:Battleofthesexespayoffmatrix
Man/Woman Ballet Fight
Ballet 1,2 0,0
Fight 0,0 2,1
Ascanbeobservedthewomanhasahigherpayoffof2overtheman’s1, if theybothattendtheballetwhilethemanhasthehigherpayoffiftheybothattendthefight.Incase,theyattendanyformofentertainmentalonebothreceivenopayoffs.Itiseasytoobservethatballet,balletand fight, fightarebothpurestrategyNashequilibriaas there isnounilateraldeviationforeitherplayerineithercasetobeabletoobtainabetteroutcome.LetusnowmoveontoexplorethemethodoffindingmixedstrategyNashequilibrium.Thewaytodothatistoemployamixedstrategyalgorithmforeachplayer.Webeginherebyapplyingitforplayer1,themaninthiscase.Automaticallyplayer2isthewoman.Theconceptistoequateexpectedutilitiesforplayer2,whenplayer2playseitherballetorfight,basedonwhatplayer1plays.Asmentionedearliertheexpectedutilityisafunctionoftheplayersmixedstrategyprobability.Letusdenotethisasfollows: 𝑢.H = 𝑓 𝜎-H = 𝜎-H 2 + 1 − 𝜎-H ∗ 0 (10) 𝑢.N = 𝑓 𝜎-H = 𝜎-H 0 + 1 − 𝜎-H ∗ 1 (11) 𝑢.H = 𝑢.N (12)The above equations numerically illustrate the expected utilities of player 2 playingballet,whenplayer1playsballetwithaprobability𝜎-H .Thusineq.10whenplayer1playsballetwithaprobability𝜎-H ,player2getsapayoffof2forplayingballetwhiletherestofthetimeplayer1playsfightwithaprobability1 − 𝜎-Handthenplayer2receives0payoff.Eq.11doesthesameforplayer2playingfight.Whentheseareequatedineq.12andsolvedfor𝜎-H ,weget𝜎-H = 1/3.Thusplayer1’smixedstrategyNashequilibrium,is(Ballet=1/3|Fight=2/3).However,thisisnotsufficientrepresentationandweneedtofindthecorrespondingmixedstrategyforplayer2.Onsolvingsimilarlyasabove,weobtain𝜎.H = 2/3.Thusplayer2’smixedstrategy component for these equilibria is (Ballet =2/3|Fight=1/3). Thus (Ballet=1/3|Fight=2/3,Ballet=2/3|Fight=1/3)isthemixedstrategyNashequilibriumforthisgame.

EstimationofthenetchargingdemandfromprivatelyownedelectricvehiclesusingGameTheory 37
DevMishra
To calculate the payoff for each playerwhen playing the abovemixed strategy Nashequilibrium,wemultiplytheindividualprobabilitiesoftheplayersforacertainoutcomeandtheninturnmultiplywitheachplayerspayoffandthesumofallthesenumbersistheindividual’splayoffforplayingthemixedstrategyequilibrium.Thisisdemonstratedthroughthetablebelow.
Table4:MixedstrategyNashEquilibrium:BattleoftheSexes
Man/Woman Ballet(2/3) Fight(1/3)
Ballet(1/3) 1,2(2/9) 0,0(1/9)
Fight(2/3) 0,0(4/9) 2,1(2/9)
Thus player 1’s utility can be calculated as 1× .
Q+ 0× -
Q+ 2× .
Q+ 0× R
Q= S
Q= .
T. When
calculatedforplayer2,itcomestothesame.Thus,itisinterestingtonotethatforbothplayerthepurestrategyNashequilibriamentionedearlierofferhigherpayoffsthanthemixedstrategyones.Afterhavingcoveredtherequiredtopicforcarryingoutgametheorymodelingforourproject,wewillnowproceedtomakeanoutlineoftheprocessfollowedtoachievetheresults.
3.4. ProposedMethodologyAshaspreviouslybeenmentioned,theproposedoutlinefortheprojectwassupposedtobe based on the utilization of the algorithm in [1] and thereaftermaking the agentscompeteamongstthemselvesusinggametheorytoformulateascenariowhereallthecharging strategies which were formulated by the author are chosen based oncompetition and to check if the system had any equilibria. However, as the workprogressed,duetolackofexpertiseinthedomainofgametheorymodelingitwasagreedandthecomplexityofmodelinganextensivenpersongame,itwasdecidedtonarrowthescopeoftheproject.Throughdiscussionswiththesupervisor,itwasconcluded,thatintheinterestoftimeandowingtothelackofexpertguidanceonthesubjectmatter,itwasbesttoreducethegivenproblemtoasmallerscopeandapplygametheorytoittobetterunderstand the theory and observe its performance on a simple system beforeattemptingtoemployitinalargesystem.Thus,thisprojectwasrestrictedtoatwo-stepundertaking;inthefirstpart,itwasattemptedtoemploygametheorytoamulti-agentsystembutdue to thecomplexityof thesystem, itwasreduced toa formof selectingstrategiesbasedonweightageassignedtoacertainstrategyforasingleagentwhichinturnwasbasedonapayoffassigned.Thesecondstepemploysgametheorytoasmallerscenarioathandofahouseholdwith2electricvehicleswithdifferentmobilitypatternsandtoseeiftheseelectricvehiclesweremadetocompeteusinggametheory,whatkind

38 MasterThesis
DevMishra
of load profile was to be observed for the electric vehicle charging. A flow diagramindicatingtheprocessflowforthesecondpartisdemonstratedbelow:
Figure14:Flowchartillustratingalgorithmandinteractionofdata

EstimationofthenetchargingdemandfromprivatelyownedelectricvehiclesusingGameTheory 39
DevMishra
4. MethodologyAsmentionedinthepreviouschapter,thecentralthoughtbehindthisundertakingwastoemploytheexistingsetupfrom[1]andemploygametheorytotheselectionofchargingstrategiesbyusers.Inthesimplestofterms,theprocedurewillallowforpayoffstobeassociatedwitheachagent’schargingneedsbasedonthetimeofday,electricitypriceand chargingprice and an agent ismore likely to chargehis electric vehicle if higherpayoffisassociatedatacertainpointoftime.Here,itbecomesdifficulttoconsidertheinfluenceoftheremainingagentsonthebehaviorofthesaidagent.Itcanbeassumedthatanagent’sbehaviorwillbecompletelydrivenbyhisownselfishintentandasthereisnoreasonablewayoftheagenttoknowoftheactionsofotheragents,hewillactsolelywiththepurposeofmaximizinghispayoff.While at the outset it was planned to employ game theory to a previous work, thecomplexityofsolvingmulti-agentnplayergameswas foundtobesubstantialandthenecessaryexpertiseingametheorymodelingwasnotavailableanditwasdeemedthattherequiredexpertisecouldnotbeacquiredwithinthetimeframeofthemasterthesis.Assuchitwasdecidedtoundertakethisstudyinthefollowingtwoparts:
1. TousetheexistingworkandallotweightagetodifferentchargingstrategiesbasedonSOC,priceofelectricityandtimeofdayandevaluatehowtheloadprofilefromelectricvehicleswouldchangeasaresultthat
2. Tostaytruetotheinitialaimofemployinggametheory,itwasdecidedtoreducetheproblemtothescopeofasinglehouseholdandsimulateagameoftwoplayersinthesamehousehold-ascenariowasbuiltwhereafamilyhouseholdhadtwodistinctEVsfordifferentpurposesandthusdifferentmobilitypatternsandtheywouldcompeteamongstthemselvestochargeornotchargeatagiventimeintheday.Thegamecouldbetreatedasmultiplesimultaneousmovegamesateverytimestepofthedayoronesinglesequentialmovegametodetermineoptimumequilibriumstrategyforeachplayer.
Inthefollowingsections,wewillgothroughthestepscarriedouttoimplementtheaboveparts.
4.1. Part1:ModificationofexistingEVdemandpredictionmodel-Allchargingstrategies
For this part it is essential to understand themethodology applied in [1]. A detailedreviewofthepublicationin[1]isnecessarytofullyunderstandtheapproachappliedandthestepstakentoestimatetheelectricvehiclechargingdemand.Inthissection,wewillbrieflygothroughtheapproachandthemodificationsmadetoobtainadifferentcharging

40 MasterThesis
DevMishra
demand at the 37-node system as considered in the original publication. A shortdescription of the model is mentioned in Section 3.2. Hereafter we will list certainnecessary details of the model which are required to understand the modificationscarriedoutinthisstudy:1. Agent based modelling details: Six groups of agents were defined in this study
consideringmobilityandtheirresidence.Mobilityreasonswerebasedonpersonalor professional functions. Three different areas of residence were identified andformedthebasisofstartandendoftripsandadditionallyneedforchargingwithinthenetworkbeingexamined.These6agentgroupsareenlistedhere:
- Group1:Residentsofthenetwork- Group2:Non-Residentsbutwillchargeoncetheirtripisoverandwillstopwithin
network- Group3:Privateindividualsfromthemetropolitan- Group4:Professionals-residentofthenetwork- Group5:Professionals-non-residentsofthenetwork- Group6:Metropolitanareaprofessionals
Thesedifferentgroupshavean inclination tochargeatdifferent times forexamplesaresidentofthenetworkpreferstochargeatthecompletionofhistripswhereassomeonetravelling from urban/metropolitan areas can charge between consecutivedisplacements.Thenumberofthesegroupsissourcedfromopendataandconsidersthat38% of all vehicles [19] in Barcelona are driven every day. Additionally, an EVpenetrationfactorof10%-40%canbeappliedtoevaluatedifferentresults.ForthesakeofthisstudywehaveusedanEVpenetrationfactorof10%whichimpliesthat10%ofallvehiclesbeingdriveninBarcelona2. The test network is a 37-node IEEE test feederMV networkwhich is adapted to
Barcelonanetworkcharacteristicsof25kVMVand thegeographicdistribution isadaptedtoBarcelona’smobilitydata.High,mediumandlowinhabitantsperhouseandvehiclesperinhabitantareidentifiedandadistributionofbranchesandnodesiscarriedout.Moredetailsonthesameareavailablein[1].
3. Theauthorin[1]hascreated4chargingscenariosbetweenwhichwewillbemixing
inthisstudytoobtainamodifiedchargingdemand.Thesearedescribedinbriefhere:- ScenarioA-IntensiveCharge–Userchargesassoonaspossiblewheneverpossible- ScenarioB-Plug-And-Play–UserchargesathomewhenSOCislessthan20%- ScenarioC-Off-PeakTariff–UserhasaTime-of-Use(TOU)tariffspeciallyforEVsbased on Spanish Regulation with the cheapest hour of electricity pricingbeginningat1:00AM

EstimationofthenetchargingdemandfromprivatelyownedelectricvehiclesusingGameTheory 41
DevMishra
- ScenarioD-SmartCharging-RealizedbytheaggregatorwhomanagesallEVstoconsumeminimumpoweratacertaintransformer
Basedonthisbackgroundwewillnowproceedtounderstandthemodificationsrequiredtothemodeltoimplementascenarioinwhichagentscanchargeusingallofthefirst3chargingscenarios.Themethodologyandstepsfollowedherewerethefollowing:1) Basedontheelectricitytariffsonacertain,asavingspotentialwasidentifiedfor
eachagentineveryagentgroupforthedifferentchargingscenarios.2) The savings potential along with electric vehicle state of charge and energy
requirementsfornexttripformedthebasisofallottingapayoff/weightagetoeachagent.
3) Basedontheaboveweightageassignedtotheuser,theuserdecidestochargeinscenarioA,BorC
4) Theseelectricchargingdemandsareaggregatedateachnodethroughoutthedayandthedifferenceisplottedandinferencesdottedtherein.
5) Additionally, it isdeterminedwhatpercentageofusers inaspecificagentgroupchargeusingacertainscenario.
6) CareisalsotakentotakeintoaccountthatcertainuserinanagentgroupmightnotbeeligibleforScenarioBandCwhichareapplicableforuserswhoonlychargeathomeand/orhaveaccesstoTOUtariffs.- Group1:Residentsofthenetwork:Thisgroupiseligibleforallthreechargingscenariosconsidered
- Group 2: Non-Residents but will charge once their trip is over andwill stopwithinnetwork:Asthesearenon-residentstheywillnotbeabletoavailScenarioBandScenarioC
- Group3:Privatefromthemetropolitan:ThesegroupofAgentsareoutsidetheurbanlimitsandhencecannotavailScenarioBandCeither.
- Group4:Professionalresidentofthenetwork:Thisgroupiseligibleforallthreechargingscenariosconsidered
- Group5:Professionalnon-residentofthenetwork:Asthesearenon-residentstheywillnotbeabletoavailScenarioBandScenarioC
- Group6:Metropolitanareaprofessionals:Thisgroupsinceoutsidethenetworkisnoteligibleforeitherofthethreechargingscenariosconsidered
4.2. Part2:TwoplayergameinasinglehouseholdInthispart,ascenariowasconstructedconsideringanaffluentfamilyhouseholdwithasinglechargingpointwithtypicalmobilitypatternsofcommutetowork,droppingkidsatschool,visitingsupermarkets,gymandrunningerrands.Thiswasdonetosimplifythe

42 MasterThesis
DevMishra
needtomodelmultipleusers inordertoreducethecomplexityof thegame.Thiswillformasimpleexerciseinemployinggametheorytoevaluatehowagentswithinthesamehousehold and access to one charging port will compete and collaborate amongstthemselves to ensure an optimum charging pattern keeping in mind their mobilitypatters.Additionally,itwillalsobeinterestingtonotetheeffectofelectricitypricesandoff-peaktariffsontheirchargingdecisions.Inthefollowingsectionthemajoraspectsofthisscenariowillbehighlighted.
4.2.1. TwoplayerhouseholdgamescenariodescriptionCertainsalientfeaturesofthehouseholdusedtocreatethisscenarioare:1) NumberofOccupants:Itisassumedthatinthehouseholdresidetwoadultswho
formacoupleandtwochildrenagedbetween0-17years;Thiswillbetakenintoaccountwhileconsideringtheenergyconsumptionofthehouseholdirrespectiveoftheelectricvehicles.
2) Major Electric Loads: Themajor electric loads of the house outside the electricvehicle charging are considered to be laundry, dishwashing, refrigeration andwater/space heating. Typical values applicable for a family will be taken intoaccount to generate a typical load profile for a family. Additionally, a randomlydistributedconsumptionoverameanconsumptionwithcertaindeviationwillbeused to account for other smaller electric loads such as lighting, television andcomputersetc.
3) ElectricVehicles:sincetwoelectricvehiclesweretobeselected,twoofthemostcommonandpopularEV’swereselected.Onewithveryhighrangeandotherwithaslightlyreducedrange.TheseEVsareTeslaModelSandNissanLeafrespectively.ThesearehereafterreferredtoasEV1andEV2respectively.
4) MobilityPattern:HereitisassumedthatEV1isusedforcommutetoworkandbackbyoneoftheadultsinthehouseholdandthereafteranothertripismadetothegymormarketorerrands.Similarly,EV2isusedbytheotheradulttopick-upanddropthechildrentoschool/universityandrunanadditionalerrandafewtimesaweek.ThiscoupledwithalongerweekendtriptwiceamonthinEV1isassumedtobethetypicalmobilitypatternforthehouseholdinscenario.
Thesizeofthesetrips(commutetowork,personalandweekendtrip)areestimatedfrompublicationswhich have predicted average commute distances in differentcountriesanddistancesforpersonaltrips.Inthefollowingsection,thenumericaldatausedtobuildthescenariowillbeenlisted.

EstimationofthenetchargingdemandfromprivatelyownedelectricvehiclesusingGameTheory 43
DevMishra
4.2.2. DatausedtobuildthescenarioThe data used in the scenario is sourced from various open public data platforms,publicationsrelatedtopowerconsumptionandmobility,andmanufacturerwebsites.Allsourcesreferencedtoestimatetherequirednumbersforthescenarioarelistedafterthedatasourcedfromthereispresentedinthisreport.Thecharacteristicsofthemajorloadsconsideredincreatingthehouseholdscenarioarelistedinthefollowingtable:
Table5:HouseholdLoadsconsideredforLoadProfile
DishwasherLaundrywithdryer
Refrigerator Heating
No.ofcyclesperday 1 2 Cont. Cont.
No. of time perweek 7 4 Cont. Cont.
Consumptionpercycle(kWh) 1 6.12 4.8/day 4.38/day
Cycle Duration(hours)
2 2 Cont. Cont.
Theabove-mentioneddataonmultipleoccasionsissourcedfromandestimatedbasedon data from countries where a scenario for two electric vehicles is more probableespeciallytheScandinaviancountriesofNorway,andSweden.[20][21][22][23]Thecharacteristicsofthesevehiclesrelevanttothemodelingofthisscenarioarelistedinthefollowingtable:
Table6:EVCharacteristics
NissanLeaf(EV2)TeslaModelS
(EV1)
BatterySize(kWh) 30 70
Range(km) 420 172
Economy(Wh/km) 160 170
Max.Onboardchargingpower(kW) 3.6 10
Hybrid/EV EV EV
Theabovespecificationshavebeensourced frommanufacturerwebsitesandproductinformationbrochures.[24][25]Themobilitydatausedtodefinethelengthoftripsarelistedinthefollowingtable:

44 MasterThesis
DevMishra
Table7:MobilityData
AveragePersonaltripdistance(km) 16.6AverageProfessionalcommutetripdistance(km) 10Averageweekendtripdistance(km) 90Numberoftrips/day(Personal) 2pervehicle(incl.return)Numberoftrips/day(Professional) 2(incl.return)Velocityurban(km/hr) 22.2Velocitymetropolitan(km/hr) 59.3The above data is sourced and estimated from typical data for metropolitan cities.[19][26][27]ElectricitypricesasusedforTime-of-usetariffsisnotlistedhereduetovolumeofthedata, however a sample of the data usedwill be presented in Annexure A. They aresourcedfromRedEléctricadeEspañaasprovidedbyENDESAtoitscustomers.[28]
4.2.3. MethodologyimplementationintheScenarioIn this segment,wediscuss the concepts fromsegment3.3 andhow theyareused insolvingthegiventwo-playergamescenario.Firstly,thescenarioathandismodelledintheformofdailypowerconsumptionofahouseholdoverafixedperiodoftimelikeweek,monthoryear.Thereaftereachdayisdividedintoa5-mintime-stepandatwo-playergameischarging/not-charginggameisplayedbetweenthetwoEV’sinourscenario.Aloadprofileforeachdayiscreatedbasedonthehouseholdappliancedatalistedintheprevioussection.Thisiscoupledwithabaseloadandadditionalfactorsaccountingforoccupant presence in the household and for sleep/night hours. The base load fromlightingandpassiveelectricityusageandaccountingfornooccupantsathomeand/orsleephours isaddedtothecontinuous loadsfromrefrigerationandheating.Thebaseloadismodelledbasedondatafrom[22].Anormaldistributionwithameanof0.2kWandsmallstandarddeviationof0.05thusformthebaseloadonwhichallotherloadsandfactorsaresuperimposedtocreateatypicalloadprofileforthescenario.ItisthenattemptedtoconsiderthegameasasimultaneousmovegamerepresentedasanormalformgameateverysingletimestepduringthedayandanalyzewhereitmakessensefortheEVusertochargetheirvehicle.Thismeansinadaythereare288gamesandforavalidgamethereexistsaNashEquilibrium(purestrategyormixedstrategyequilibria)whichwillensurethatitisthebestresponseforeachEVtotheconditionsofthescenarioaswellastothestrategyofeachEV.
EstimationofthenetchargingdemandfromprivatelyownedelectricvehiclesusingGameTheory 45
DevMishra
ThepayoffsattachedtoeachtimestepforeachuserarebasedonthevehicleSOC,priceofelectricityatthathour,whetherornottheothervehicleischargingandhowcloseitistofulfillingitsmaxcharge.ThesefactorsdeterminetheinclinationofanyEVtochargeandareusedtoensurealogicalpatterntotheneedsofcharging.Thereafter,analgorithmforiteratedeliminationofstrictlydominatedstrategiesisusedtoarriveatpurestrategyNashequilibriaifexistingforeverytimestepintheday.Postthat an algorithm to findmixed strategyNash Equilibria is constructed based on theprobabilityofacertainplayertoplayacertainstrategybetweenchargeandnotchargeandmatchinghisexpectedutilities.Fromtheseequilibria,theonewithhigherutilitywillbepickedastheplayer’smoveandthescenariowillbeupdatedaccordingly.Asmentionedinthesectionexplainingthebackgroundonthegametheorymodelling,thescenarioalthoughtreatedasasimultaneousgameateachtimestep,itisessentiallyareductionofasequentialgametobesolvedasasimultaneousornormalformgame.

46 MasterThesis
DevMishra
5. ResultsandDiscussionInthissection,wewillpresentanddiscusstheresultsobtainedfromthetwopartsofthisproject.Inthefollowingsection,wewillfirstpresenttheresultsobtainedfromemployingweightedstrategiesbasedonpriceofelectricity,SOCandmobilityonthealgorithmfrom[1], and discuss the same while mentioning certain important observations therein.Thereafter, we will proceed to present the findings from the two-player householdscenariogameandtheresultsobtainedfromsolvingthatgame.
5.1. ResultsandDiscussion:Part1In Fig. 16 the original demand at each node is plottedwhich is then followed by themodifieddemandobtainedbygivingweightagetostrategiesasdescribedintheprevioussection.Whileoverallloaddistributionacrossthenodesissimilarthereisareductioninpeak load in some nodes that is observed. This can be attributed to time basedpreferencesintheweightagethatisattributedtodifferentstrategies.
Figure15:OriginalDemandateachnode
Thepeakdemandseeninthepreviousfigureatnodes29and34isabove1200kWhoweverasobservedinthefollowingfigurethepeakdemandatthosenodesisnowwellbelow1200kW.
Figure16:Demandateachnodewithweightedstrategies
0 1 2 3 4 5 6 7 8 9 10 11 12 13 14 15 16 17 18 19 20 21 22 23 24 25 26 27 28 29 30 31 32 33 34 35 36Nodes
0
200
400
600
800
1000
1200
Dem
and
in k
W
0 1 2 3 4 5 6 7 8 9 10 11 12 13 14 15 16 17 18 19 20 21 22 23 24 25 26 27 28 29 30 31 32 33 34 35 36Nodes
0
200
400
600
800
1000
1200
Dem
and
in k
W

EstimationofthenetchargingdemandfromprivatelyownedelectricvehiclesusingGameTheory 47
DevMishra
Letusnow lookat a single agent groupandhow their chargingpatternsareaffectedduringeachtimestepofthedaywiththemodifiedstrategies.Fig.18showstheoriginaldemandfromagentgroup1atevery5-minutetime-stepoftheday.The5-minutetime-stepallowsfor288totaltimestepsin24hoursthusallowingforeasiervisualizationofthedayonahigherresolution.
Figure17:OriginaldemandforeverytimestepforAgentGroup1
InFig.19,weobservethemodifiedenergydemandfromagentsofgroup1.Aspikeindemandisobservedduringlowelectricitypricehoursduringtheearlyhoursofthedayandanetreductioninpeakdemandduringpeakhoursisalsonoticed.Thisaffirmsthataweightedstrategyforthescenariosandgivinguserspayoffbasedonthetimetheychargeamongstotherfactorscanresultinareductionofpeakhourdemandandcanbetostudypeakshiftingandvalleyfillingphenomenon.Although,itwasinitiallyaimedtoachieveresults using game theory and competition, we have only been able to demonstratecertainpatternswhichcanbeexpectedtobeobservedifthisexerciseisextendedtotheimplementationofgametheory.
Figure18:ModifieddemandwithweightedstrategiesforAgentGroup1
Additionally, asmentioned in theprevious section, itwasalsodeterminedas towhatpercentageofusersinacertainagentgrouparecharginginaparticularscenario.Thefindingsfromthesamearetabulatedinthefollowingtable.
0 5 10 15 20 25 30 35 40 45 50 55 60 65 70 75 80 85 90 95 100
105
110
115
120
125
130
135
140
145
150
155
160
165
170
175
180
185
190
195
200
205
210
215
220
225
230
235
240
245
250
255
260
265
270
275
280
285
290
295
300
Time
0
50
100
150
Dem
and
in k
W
0 5 10 15 20 25 30 35 40 45 50 55 60 65 70 75 80 85 90 95 100
105
110
115
120
125
130
135
140
145
150
155
160
165
170
175
180
185
190
195
200
205
210
215
220
225
230
235
240
245
250
255
260
265
270
275
280
285
290
295
300
Time
0
50
100
150
Dem
and
in k
W

48 MasterThesis
DevMishra
Table8:Percentageofagentscharginginascenario
PercentageofuserchargingineachScenario%A B C
AgentGroup1 76 15 9AgentGroup4 75 25 0
As can be observed, the majority of the agents do continue to charge in the mostconvenient intensive charge scenario which allows for charging whenever possible,howeverashifttowardsscenariosBandCarealsoinvolved.Asthispartofthestudywasdonebyasimpleweightedschemeinsteadofagametheoreticoptimizationapproachtechnique,itisdifficulttodrawanystrongconclusionsfromtheaboveresults.LetusnowexploreindetailtheresultsobtainedfromPart2ofthisstudy.
5.2. Results&Discussion:Part2In this section,wewill examine the results from the second part of the studywhichinvolvesaspeciallycreatedscenarioofahouseholdwithtwoelectricvehicles.As a first step,weexamined the results from the scenario foroneday to check if thealgorithmwasbehavingasexpectedandifthefindingsseemedlogical.Itisinterestingtoobservetheequilibriawehaveobtainedwhenthegameissolvedassimultaneousgameateachtimestep.AsexpectedthegameshowsnoequilibriafortheinitialdurationsofthedayandeventuallywhenbothEVsareavailableat the residenceand thepriceofelectricityissimultaneouslylow,bothplayershaveapurestrategyNashequilibriumwiththechargestrategywithpreferencegoing to theplayerwith lowerSOCandwhile thevehiclewithpreferencechargestherecanbenogameuntiltheplayer’sSOCrequirementforsubsequenttripsismet.Thereafter,thesecondEVstartchargingandagainthereisnogameinvolvedtillthesecondEVattainsadesirableSOC.Whilethisseemslogical,thereare other iterationswhich canbe examinedhereinwhereplayer twobelieves he hashigherutilitybychargingwhenplayer1isnotavailabletochargeeventhoughthepriceof electricity is higher, thus essentially not competing in the game. This is based onsubjectiveutilitygiventoconvenienceandfactorsandresultsinashiftinequilibriumtooutsidewhatisobservedearlierintheoff-peakhours.Afterobservingthisonasingulardaythegamewasexpandedtorunforaweekwithadditionaltrips.Justtodemonstratewhatatypical2x2matrixforatimesteplookslike,inthefollowingtablewewillseethefirstequilibriumreachedwhereEV2hasalowSOCanddecidestostartcharging.

EstimationofthenetchargingdemandfromprivatelyownedelectricvehiclesusingGameTheory 49
DevMishra
Table9:TypicalPayoffmatrixasobtainedforCharge/Chargeequilibriumscenario
EV1/EV2 Charge NotCharge
Charge 3,6 1,1
NotCharge 1,1 1,1
Intheabovetable,itisacharge/chargeequilibriumbutinourscenarioonlyoneEVcancharge at a time and itmakes sense to charge the one having a higher payoffwhichincidentallyandbecauseofthedesignonthealgorithmhasahigherpayoffwhichinthiscaseisEV2.Itisalsoessentialtoobservethattheresultinggameisnotazero-sumgameandthusisnotpurelycompetitiveandthustherecanbescopeforco-operationandco-ordination.Inthefollowingsection,wewillseehowtheloadprofilelooksincomparisontopricesandduringwhattimethisequilibriumoccursandwhethertheplayeralsobenefitsfromlowtariffsatthatpointandhowtheprogressionofSOCtakesplacethusindicatingtillwhat time the EV charges. There are efficiency factors which are applied to the EVchargingaswellas tobatterydepletiontoensurethatallprocessesarenotoccurringperfectlyideallyandareinsteadmorerealistic.Thefirstequilibriumisobservedonday4,whenEV2hasahigherpayofftochargeduringalow-pricetimeonday4oftheweek.ThiscanbeobservedinFig.19whereariseinhouseholdloadisobservedaround0900hrs.ThisisafterEV2hascompleteditsfirsttripofdroppingthechildrenatschoolandisbackatthehouseholduntilthenexttripwhichisscheduledtopickupthechildrenfromschool.ThegameresultsinEV2charginginthisdurationuptillapointwherethenormalpricesarehigherthantheoff-peakprices.Thisisensuredbyacorrectconstructionof thepayoffallotting function in thecodeand isverifiedbyobtainingthisresult.ItisalsointerestingtonotethatthegamedecideswhentheEVshouldchargebasedonitmobilityneeds.ItisseeninFig.19thatEV2engagesinchargingforthefirsttimeintheweekonday4basedontheknowledgeofthemobilitypattern for the week. Additional equilibriums with EV2 having higher payoffs areobservedduringtheweekenddependingonthepriceofelectricityandarecontributedtothemobilitypatternforweekendsbeingdifferent,thatistherearefewerornotrips,theweekendchargingallowsforchargingupto100%SOCforEV2onday6thusbeingpreparedforthemobilityrequirementsofthecomingweek.

50 MasterThesis
DevMishra
Figure19:FirstEquilibriumwithEV2chargingonDay4
Postthisthenextequilibrium,thatisobservedisforEV1withhigherutilitybeingobservedforEV1duringtheearlyhoursofday5.ThisisillustratedinFig.20.Here,againthegamedecidesthatthevehicleneedstochargetakingintoaccountuserpreferencesforSOC,whichis inturnbasedonplanstouseEV1overtheweekend.WhiledoingsoitalsotakesintoaccountpayoffrelatedtoSOCandelectricitypricestochargethevehicleinlow-pricehoursfortheoffpeakTOUtariff.EV1owingtothetimewhensystemequilibriumis identifiedchargesupto100%SOCandisthuspreparedforanyweekendtriporadditionaldutiesovertheweekend.It’sagaininterestingtonotethatthechargingheretakesplacewhenthevehicleSOChasdroppedtobelow50%onday5oftheweek.AfurtherequilibriumfavorabletoEV1isobservedonthefinalday7duringoff-peaklowtariffhoursincasetherehasbeenaweekendtripwhichdepletesthebattery.ThisequilibriumagainensuresthatthevehiclehasanSOCof100%beforethenextweekcommences.Itcanbeobservedintheplotthatpostthechargingintheearlyhoursofday5thevehiclecontinueswithitnormalmobilitypatternforday5,andthesameisseenintheSOCdepletionobservedduringthedayhours.TheeffectobservedonthedemandprofileforchargingattheratedmaxhighpowerforEV1showsthatthechargingdurationisshortbutthepeakloadishigherascomparedtoEV1whichhasalowermaxratedchargingpower.Thisassumesthatbothvehiclesareabletochargeattheirmaxratedonboardchargingpower.
020
040
060
080
010
0012
0014
0016
0018
0020
0022
0024
000
1
2C
onsu
mpt
ion
kWh Load Profile
020
040
060
080
010
0012
0014
0016
0018
0020
0022
0024
000
0.05
0.1
0.15
Pric
e (E
uro/
kWh)
Prices of Normal & Offpeak schemes
020
040
060
080
010
0012
0014
0016
0018
0020
0022
0024
00
Time of day
0
50
100
SOC
%
SOC
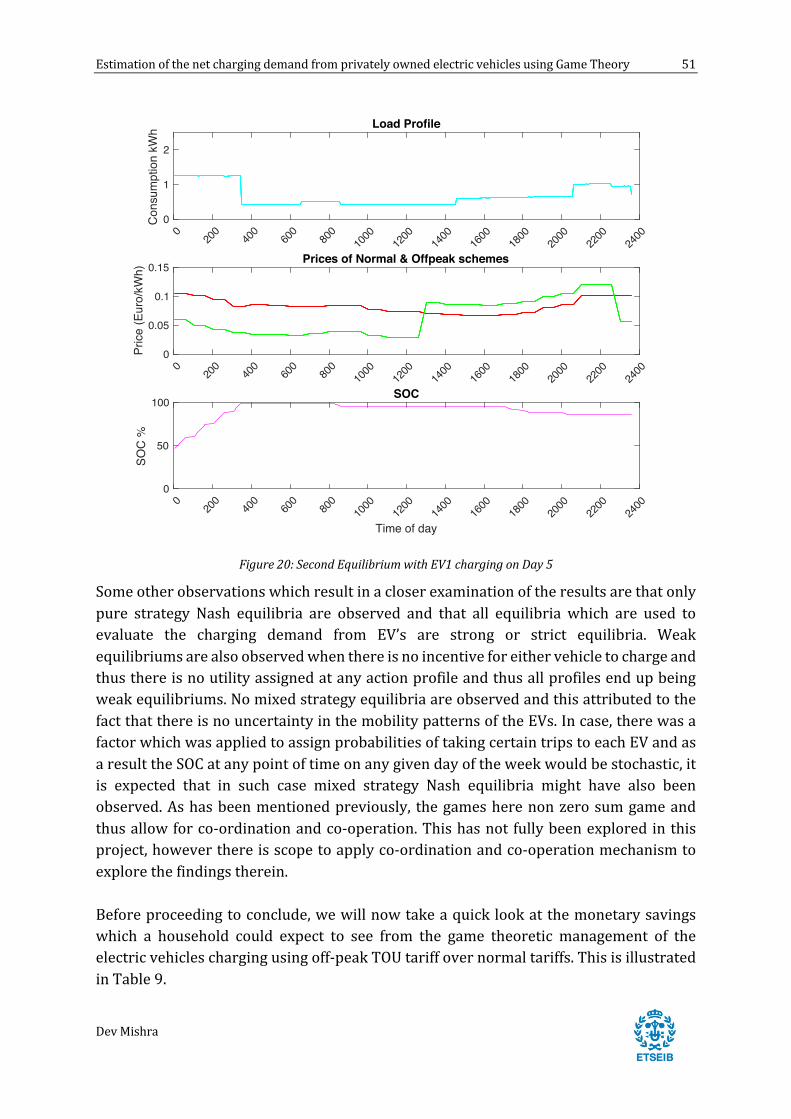
EstimationofthenetchargingdemandfromprivatelyownedelectricvehiclesusingGameTheory 51
DevMishra
Figure20:SecondEquilibriumwithEV1chargingonDay5
Someotherobservationswhichresultinacloserexaminationoftheresultsarethatonlypure strategy Nash equilibria are observed and that all equilibria which are used toevaluate the charging demand from EV’s are strong or strict equilibria. Weakequilibriumsarealsoobservedwhenthereisnoincentiveforeithervehicletochargeandthusthereisnoutilityassignedatanyactionprofileandthusallprofilesendupbeingweakequilibriums.NomixedstrategyequilibriaareobservedandthisattributedtothefactthatthereisnouncertaintyinthemobilitypatternsoftheEVs.Incase,therewasafactorwhichwasappliedtoassignprobabilitiesoftakingcertaintripstoeachEVandasaresulttheSOCatanypointoftimeonanygivendayoftheweekwouldbestochastic,itis expected that in such case mixed strategy Nash equilibria might have also beenobserved.Ashasbeenmentionedpreviously, thegamesherenonzerosumgameandthusallowforco-ordinationandco-operation.Thishasnot fullybeenexploredinthisproject,howeverthereisscopetoapplyco-ordinationandco-operationmechanismtoexplorethefindingstherein.Beforeproceedingtoconclude,wewillnowtakeaquicklookatthemonetarysavingswhich a household could expect to see from the game theoretic management of theelectricvehicleschargingusingoff-peakTOUtariffovernormaltariffs.ThisisillustratedinTable9.
020
040
060
080
010
0012
0014
0016
0018
0020
0022
0024
000
1
2C
onsu
mpt
ion
kWh Load Profile
020
040
060
080
010
0012
0014
0016
0018
0020
0022
0024
000
0.05
0.1
0.15
Pric
e (E
uro/
kWh)
Prices of Normal & Offpeak schemes
020
040
060
080
010
0012
0014
0016
0018
0020
0022
0024
00
Time of day
0
50
100
SOC
%
SOC

52 MasterThesis
DevMishra
Table10:Savingsfromgametheoreticelectricvehiclechargingusingoff-peaktariffs
SavinginEurosYearlySavingsfromEV1 154.3YearlySavingsfromEV2 45.9
NetYearlySavingsforhousehold ~200.0Thus,itcanbeobservedthatthroughthegametheoreticchargingoftheelectricvehiclesusinganoff-peakTOUtariff,netyearlysavingofalmost200Euroscanbeachieved.Whilethisisnotsubstantialforahousehold,itdoesclearlydemonstratehowdemandresponsecanhaveamonetaryimpactonthespendingofahousehold.

EstimationofthenetchargingdemandfromprivatelyownedelectricvehiclesusingGameTheory 53
DevMishra
6. Conclusions Inconclusion, the findings fromthisworkaresummarizedas follows.From includingmultiplechargingscenariossuchasintensivecharging,plugandplay,andoff–peakitisobservedthatdemandfromelectricvehiclesismodified.Importanttrendssuchaspeaksbeingreducedandcertainamountofdemandshiftingisobservedandthushighlightstheimportance of the carrying out an exercise as in part one of thiswork alongwith anoptimizationtechniquesuchthatstrongerconclusionscanbedrawnfromtheworkandbeutilizedtounderstandtheimpactonthegrid.Fromparttwoofthiswork,itispossibletoconcludethatgametheoreticmethodscanbeappliedtooptimizationproblemsinelectricvehiclechargingscenariosaswellhouseholdenergymanagementschemesincludingdemandresponse.Theresultsshowthatgametheorycanbeaversatiletooltoensurethatoptimumresultsareobtainedwhiletakingintoaccountpreferencesfromagentsorplayers.Theresultsshowedthatitwasoptimumtochargethevehicles1-2timesaweek,evenattimesnotupto100%SOCwhilemakinguseofoff-peaktariffstogeneratemonetarysavingsforthehousehold.Theresultsalsodemonstratedcertainaspectsfromagametheoreticpointofview.Theseinvolvedthelack of mixed strategy Nash Equilibria illustrating that the user’s actions were fullydefinedandtherewasnoprobabilityinvolvedbasedonotherfactorswhichcouldbeusedtoattainadditionalequilibria.Anotherimportantconclusionwastheobservation,thatthe game at each time step was a non-zero sum game thus demonstrating that co-operationandco-ordinationbeafactorinsuchscenarios.
6.1. ScopeforAdditionalWorkItisinterestingtonotefromtheabovesections,thattheresultsseemverylogicalwhenbeingpredictedevenwithoutgametheory,howeverthisstudyreinforcesthelogicalityofconceptsinloadmanagementsuchasdemandsidemanagementanddemandresponsewhereitisobservablethatthetendencytoshifttooffpeakhoursformonetarybenefitisthemajorobservabletrendwhileconsideringthatitoptimizesthechargingbehaviorinasinglehousehold.Additionally,itindicatestheoptimumpatterninwhichheavyloadsofelectricvehiclescanbeshiftedtoallowformaximizingtheirutility,whilemaintainuserconvenience.Furtherextensionofthisstudycaninvolveextendingtheshiftingofloadstoallhouseholdappliances.Alternately,thegametheoreticapproachcanbeextendedtoanentireneighborhoodordistrictandthentheimpactonthegridcanbeobservedandpotentialformechanismssuchaspeakshiftingandvalleyfillingcanbeevaluated.Also,as mentioned towards the end of the last section, there is scope to implement co-operationandco-ordinationandthatcanbeaninterestingextensionofthiswork.WiththehigherintegrationofEVsitalsoopensupopportunitiestoutilizeEVsandEVcharging infrastructure in alternateways suchas theVehicle-to-Grid(V2G) concept tosupplement thegridenergyand in turn facilitatehigher integrationof renewables. In

54 MasterThesis
DevMishra
essence,thepowergridhasnegligiblestorage,asaresultofwhichitisaconstantefforttomatchtransmissionandgenerationtomatchtheenduserconsumption.Thisisusuallyachievedbyturningon/offfacilitiesinapowerplant,andrampingupanddown[29].EVsas in the case of other vehicles are designed to deal with fluctuations in powerrequirementasperroadprofileanddrivingbehavior.ThisinEVsisachievedbyhybriddrivetrains,orbatterytechnologywhichareformsofenergystorageandthuscanprovedenergywhenthevehiclesareparked,andwiththerequiredconnectionstothegridcanfeedpower into thegridwhenrequired.This iswhat is termedas theVehicle-to-GridconceptorV2G.ThisisadditionallyaidedbydrivingpatternsofpersonalEVswhereinitcanbeobservedthattheyareusedforonly5-10%percentofalltimefortransportation,and90-95%timeareparked,makingthemavailablefora‘secondaryfunction’suchasV2G[29].Thus,ifamodelforchargingdemandofEVscanbesuccessfullybuilt,itcanbefurtherutilizedtocalculatethepotentialofprivatelyownedEVstosupplyenergybacktothe grid. This requires the study of additional parameters and optimization of thoseparameters to achieve a successful implementationwhich is beyond the scopeof thiswork.Theconcepthasbeenbrieflymentionedhereinordertodemonstratepossibilitiesofadditionalwork.

EstimationofthenetchargingdemandfromprivatelyownedelectricvehiclesusingGameTheory 55
DevMishra
7. Acknowledgements TherealizationofthisthesishasbeenahighlyfruitfulandconstructiveexperienceforwhichIhavemanypeopletothankfor.At CITCEA-UPC, a first and foremost big thank you goes out toRobertoVillafáfila forfirstlyagreeingtoworkwithmeduringthecourseofaninternshipandmasterthesisandhiscontinuedguidance,supervisionandmentoringwithoutwhichthisworkwouldnothavebeenpossible.My heartfelt thanks also go out to Pol Olivella-Rosell, the primary author of [1], foragreeingtosharehiswork,datasourcesandalgorithmswithmeforthepurposesofthisthesisandforbeingavailabletodiscussanyqueriesIhadatanypointoftimeduringthedurationofthisthesis.IwouldliketothankmyfellowInnoenergystudentsandclosefriends,PavlosSchoinasandDanielKuntzforbeingavailabletoworkwithanddiscussvariousaspectsduringthecourseofthisproject.Iwould like toadditionally thankeveryone in the InnoenergyCommUnitywhoatanypointdiscussedwithmeontopicsrelatedtomythesis,asitisthroughthesediscussionsIwasabletogatheradditionalinsightsandideastoimplementinthisthesiswork.IwouldliketothankmyfriendsathomeinIndiaandabroadforbeingthereformeandbeingaconstantsourceofinspirationandoptimismatalltimes.Andfinally,IwouldliketothankmyfamilyfortheirinvaluablesupportandguidanceformychoicesanddecisionwithoutwhichIwouldnothavebeenabletogetthisfar.TheyhavealwaysprovidedmewithmorethanIcouldasfor,andforthatIamthankfulandgrateful.

56 MasterThesis
DevMishra
8. Bibliography
[1] P. Olivella-Rosell, R. Villafafila-Robles, A. Sumper, and J. Bergas-Jané, “ProbabilisticAgent-Based Model of Electric Vehicle Charging Demand to Analyse the Impact onDistributionNetworks,”Energies,vol.8,no.5,pp.4160–4187,May2015.
[2] InternationalEnergyAgency,“GlobalEVOutlook2016:BeyondOneMillionCars.”
[3] J.Y.Yong,V.K.Ramachandaramurthy,K.M.Tan,andN.Mithulananthan,“Areviewonthestate-of-the-arttechnologiesofelectricvehicle,itsimpactsandprospects,”Renew.Sustain.EnergyRev.,vol.49,pp.365–385,Sep.2015.
[4]M. Yilmaz and P. T. Krein, “Review of Battery Charger Topologies, Charging PowerLevels,andInfrastructureforPlug-InElectricandHybridVehicles,”IEEETrans.PowerElectron.,vol.28,no.5,pp.2151–2169,May2013.
[5] C.H.Dharmakeerthi,N.Mithulananthan, andT.K. Saha, “A comprehensiveplanningframeworkforelectricvehiclecharging infrastructuredeployment inthepowergridwithenhancedvoltagestability,”Int.Trans.Electr.EnergySyst.,vol.25,no.6,pp.1022–1040,Jun.2015.
[6] R.Couillet,S.M.Perlaza,H.Tembine,andM.Debbah,“ElectricalVehiclesintheSmartGrid:AMeanFieldGameAnalysis,”IEEEJ.Sel.AreasCommun.,vol.30,no.6,pp.1086–1096,Jul.2012.
[7] J.H.M.Langbroek, J.P.Franklin, andY.O. Susilo, “Theeffectofpolicy incentivesonelectricvehicleadoption,”EnergyPolicy,vol.94,pp.94–103,Jul.2016.
[8] J. Martínez-Lao, F. G. Montoya, M. G. Montoya, and F. Manzano-Agugliaro, “ElectricvehiclesinSpain:Anoverviewofchargingsystems,”Renew.Sustain.EnergyRev.
[9] “Spain - Policies and Legislation - Spain | IA-HEV.” [Online]. Available:http://www.ieahev.org/by-country/spain-policy-and-legislation/. [Accessed: 16-Jun-2017].
[10] “RealDecreto1078/2015,de27denoviembre,porelqueseregula laconcesióndirectadeayudasparalaadquisicióndevehículosdeenergíasalternativas,yparalaimplantacióndepuntosderecargadevehículoseléctricosen2016,MOVEA.,”NoticiasJurídicas. [Online]. Available:http://noticias.juridicas.com/base_datos/Admin/563148-rd-1078-2015-de-27-nov-regula-la-concesion-directa-de-ayudas-para-la-adquisicion.html. [Accessed: 16-Jun-2017].
[11] W.Saad,Z.Han,H.V.Poor,andT.Başar,“GameTheoreticMethodsfortheSmartGrid,”ArXiv12020452CsMath,Feb.2012.
[12] M.J.Osborne,AnIntroductiontoGameTheory.OxfordUniversityPress,2009.

EstimationofthenetchargingdemandfromprivatelyownedelectricvehiclesusingGameTheory 57
DevMishra
[13] B. Gao,W. Zhang, Y. Tang,M. Hu,M. Zhu, andH. Zhan, “Game-Theoretic EnergyManagement for Residential Users with Dischargeable Plug-in Electric Vehicles,”Energies,vol.7,no.11,pp.7499–7518,Nov.2014.
[14] W. Tushar,W. Saad, H. V. Poor, and D. B. Smith, “Economics of Electric VehicleCharging:AGameTheoreticApproach,”IEEETrans.SmartGrid,vol.3,no.4,pp.1767–1778,Dec.2012.
[15] S.BaeandA.Kwasinski,“SpatialandTemporalModelofElectricVehicleChargingDemand,”IEEETrans.SmartGrid,vol.3,no.1,pp.394–403,Mar.2012.
[16] G.LiandX.P.Zhang,“ModelingofPlug-inHybridElectricVehicleChargingDemandinProbabilisticPowerFlowCalculations,”IEEETrans.SmartGrid,vol.3,no.1,pp.492–499,Mar.2012.
[17] K.Qian,C.Zhou,M.Allan,andY.Yuan,“ModelingofLoadDemandDuetoEVBatteryCharginginDistributionSystems,”IEEETrans.PowerSyst.,vol.26,no.2,pp.802–810,May2011.
[18] D. Nau, “Introduction to Game Theory.” [Online]. Available:https://www.cs.umd.edu/users/nau/game-theory/.[Accessed:17-Jun-2017].
[19] “ENQUESTES DE MOBILITAT – IERMB,” ENQUESTES DE MOBILITAT. [Online].Available:https://iermb.uab.cat/ca/enquestes/enquestes-de-mobilitat.[Accessed:18-Jun-2017].
[20] S.Puranik,“DemandSideManagementPotentialinSwedishHouseholds,”CaseStudyDishwasherLaund.WaterHeat.LoadsMastersThesisGöteb.Swed.,2014.
[21] “Washing / drying FTTK 4940 Beko.” [Online]. Available:http://www.elon.se/vitvaror/tvatt-tork/kombinerade-tvatt-tork/cylinda-fttk-4940.[Accessed:18-Jun-2017].
[22] A.deAlmeida,P.Fonseca,B.Schlomann,andN.Feilberg,“Characterizationofthehousehold electricity consumption in the EU, potential energy savings and specificpolicyrecommendations,”EnergyBuild.,vol.43,no.8,pp.1884–1894,Aug.2011.
[23] “Energimyndigheten. (2016). Mätningar av varm- och kallvattenförbruknin.”[Online]. Available: http://www.energimyndigheten.se/statistik/bostader-och-lokaler/forbattrad-energistatistik-i-bebyggelsen-och-industrin/matningar-av-varm--och-kallvattenforbrukning/.[Accessed:18-Jun-2017].
[24] “2017 Nissan LEAF Electric Car Specs,” Nissan USA. [Online]. Available:https://www.nissanusa.com/electric-cars/leaf/versions-specs. [Accessed: 18-Jun-2017].
[25] “Tesla Model S Specifications,” 06-Jan-2015. [Online]. Available:https://www.tesla.com/support/model-s-specifications.[Accessed:18-Jun-2017].
[26] “CommutinginStockholm,GothenburgandMalmö,”TransportAnalysis,Summary

58 MasterThesis
DevMishra
Report2011:3,May2011.
[27] “On the roadSocialaspectsof commuting longdistances towork,”ResearchGate.[Online]. Available:https://www.researchgate.net/publication/268186432_On_the_road_Social_aspects_of_commuting_long_distances_to_work.[Accessed:16-Jun-2017].
[28] “ENDESA: Real-time price of electricity,” Endesa. [Online]. Available: /price-electricity-vpsc.html.[Accessed:03-May-2017].
[29] W.KemptonandJ.Tomić,“Vehicle-to-gridpowerfundamentals:Calculatingcapacityandnetrevenue,”J.PowerSources,vol.144,no.1,pp.268–279,Jun.2005.
[30] E.vanLeeuwenandM.Lijesen,“AgentsplayingHotelling’sgame:anagent-basedapproach toagame theoreticmodel,”AnnRegSci, vol.57,no.2–3,pp.393–411,Nov.2016.[31] B.Chatterjee,“AnoptimizationformulationtocomputeNashequilibriuminfinitegames,” in 2009 Proceeding of International Conference on Methods and Models inComputerScience(ICM2CS),2009,pp.1–5.[32] W.Lee,L.Xiang,R.Schober,andV.W.S.Wong,“ElectricVehicleChargingStationsWithRenewablePowerGenerators:AGameTheoreticalAnalysis,”IEEETransactionsonSmartGrid,vol.6,no.2,pp.608–617,Mar.2015.[33] “Executive Analysis of Global Electric Vehicle Forecast.” [Online]. Available:http://www.frost.com/sublib/display-report.do?id=N9F9-01-00-00-00. [Accessed: 16-Jun-2017].[34] S.SchecterandH.Gintis,GameTheoryinAction:AnIntroductiontoClassicalandEvolutionaryModels.PrincetonUniversityPress,2016.[35] D.Dallinger,S.Gerda,andM.Wietschel, “Integrationof intermittent renewablepower supply using grid-connected vehicles – A 2030 case study for California andGermany,”AppliedEnergy,vol.104,pp.666–682,Apr.2013.[36] “Tesla Model S | Tesla Model S | Electric Car,” Scribd. [Online]. Available:https://www.scribd.com/doc/278866797/Tesla-Model-S.[Accessed:20-Jun-2017].
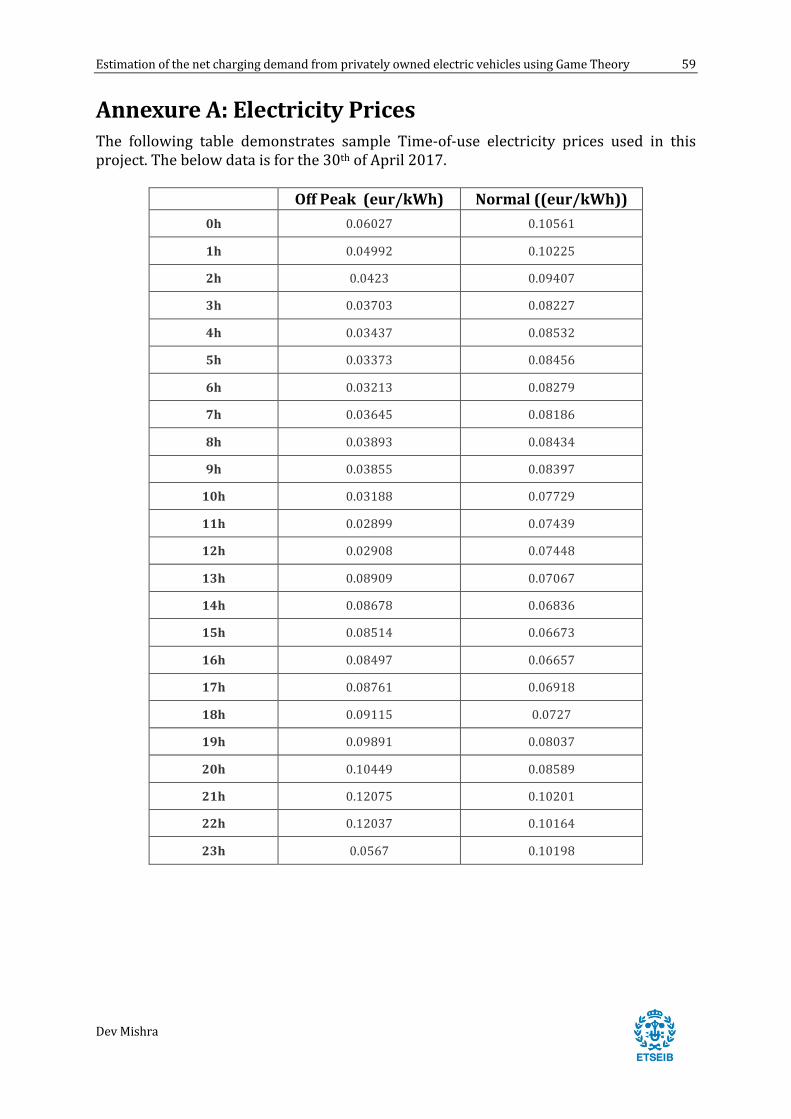
EstimationofthenetchargingdemandfromprivatelyownedelectricvehiclesusingGameTheory 59
DevMishra
AnnexureA:ElectricityPricesThe following table demonstrates sample Time-of-use electricity prices used in thisproject.Thebelowdataisforthe30thofApril2017.
OffPeak(eur/kWh) Normal((eur/kWh))0h 0.06027 0.10561
1h 0.04992 0.10225
2h 0.0423 0.09407
3h 0.03703 0.08227
4h 0.03437 0.08532
5h 0.03373 0.08456
6h 0.03213 0.08279
7h 0.03645 0.08186
8h 0.03893 0.08434
9h 0.03855 0.08397
10h 0.03188 0.07729
11h 0.02899 0.07439
12h 0.02908 0.07448
13h 0.08909 0.07067
14h 0.08678 0.06836
15h 0.08514 0.06673
16h 0.08497 0.06657
17h 0.08761 0.06918
18h 0.09115 0.0727
19h 0.09891 0.08037
20h 0.10449 0.08589
21h 0.12075 0.10201
22h 0.12037 0.10164
23h 0.0567 0.10198
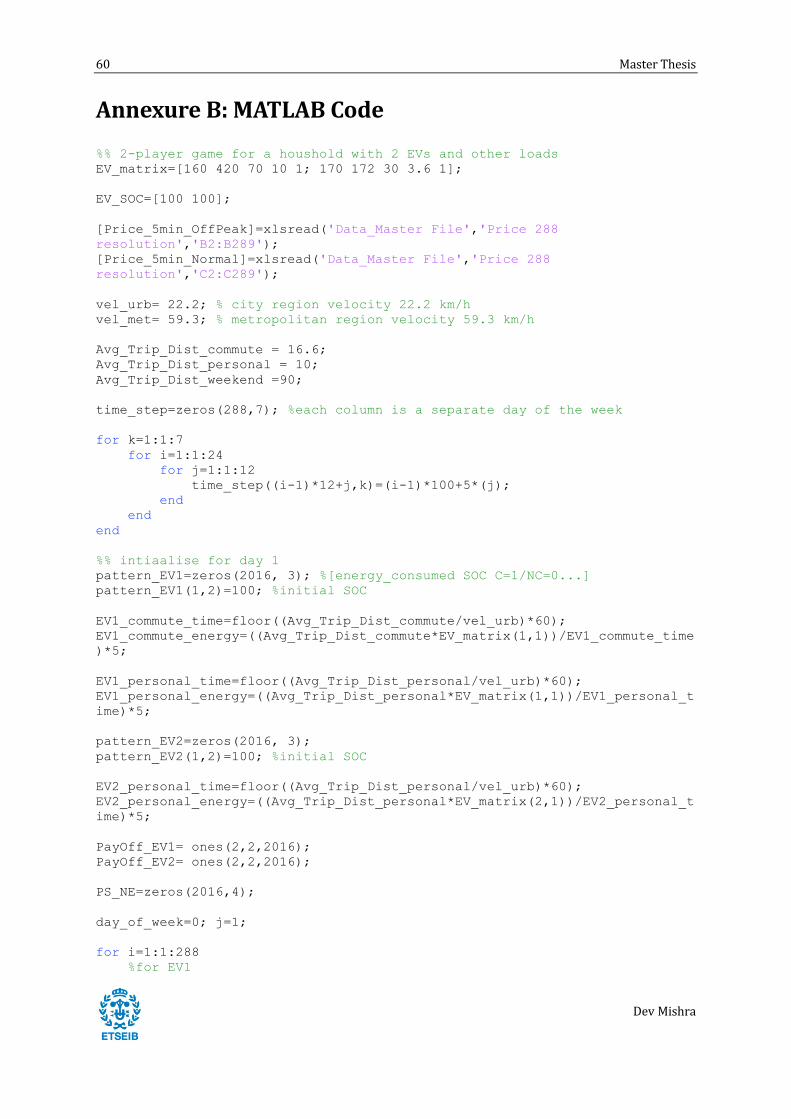
60 MasterThesis
DevMishra
AnnexureB:MATLABCode %% 2-player game for a houshold with 2 EVs and other loads EV_matrix=[160 420 70 10 1; 170 172 30 3.6 1]; EV_SOC=[100 100]; [Price_5min_OffPeak]=xlsread('Data_Master File','Price 288 resolution','B2:B289'); [Price_5min_Normal]=xlsread('Data_Master File','Price 288 resolution','C2:C289'); vel_urb= 22.2; % city region velocity 22.2 km/h vel_met= 59.3; % metropolitan region velocity 59.3 km/h Avg_Trip_Dist_commute = 16.6; Avg_Trip_Dist_personal = 10; Avg_Trip_Dist_weekend =90; time_step=zeros(288,7); %each column is a separate day of the week for k=1:1:7 for i=1:1:24 for j=1:1:12 time_step((i-1)*12+j,k)=(i-1)*100+5*(j); end end end %% intiaalise for day 1 pattern_EV1=zeros(2016, 3); %[energy_consumed SOC C=1/NC=0...] pattern_EV1(1,2)=100; %initial SOC EV1_commute_time=floor((Avg_Trip_Dist_commute/vel_urb)*60); EV1_commute_energy=((Avg_Trip_Dist_commute*EV_matrix(1,1))/EV1_commute_time)*5; EV1_personal_time=floor((Avg_Trip_Dist_personal/vel_urb)*60); EV1_personal_energy=((Avg_Trip_Dist_personal*EV_matrix(1,1))/EV1_personal_time)*5; pattern_EV2=zeros(2016, 3); pattern_EV2(1,2)=100; %initial SOC EV2_personal_time=floor((Avg_Trip_Dist_personal/vel_urb)*60); EV2_personal_energy=((Avg_Trip_Dist_personal*EV_matrix(2,1))/EV2_personal_time)*5; PayOff_EV1= ones(2,2,2016); PayOff_EV2= ones(2,2,2016); PS_NE=zeros(2016,4); day_of_week=0; j=1; for i=1:1:288 %for EV1

EstimationofthenetchargingdemandfromprivatelyownedelectricvehiclesusingGameTheory 61
DevMishra
if(time_step(i,j)>=830 && time_step(i,j)<=830+EV1_commute_time+5) temp=0; while(temp<=round(EV1_commute_time/5)) pattern_EV1(day_of_week*288+i,1)=EV1_commute_energy; temp=temp+1; end end if(time_step(i,j)>=1700 && time_step(i,j)<=1700+EV1_commute_time+5) temp=0; while(temp<=round(EV1_commute_time/5)) pattern_EV1(day_of_week*288+i,1)=EV1_commute_energy; temp=temp+1; end end if(time_step(i,j)>=1800 && time_step(i,j)<=1800+EV1_personal_time+5) temp=0; while(temp<=round(EV1_personal_time/5)) pattern_EV1(day_of_week*288+i,1)=EV1_personal_energy; temp=temp+1; end end if(time_step(i,j)>=2000 && time_step(i,j)<=2000+EV1_personal_time+5) temp=0; while(temp<=round(EV1_personal_time/5)) pattern_EV1(day_of_week*288+i,1)=EV1_personal_energy; temp=temp+1; end end pattern_EV1(day_of_week*288+i+1,2)=pattern_EV1(day_of_week*288+i,2)-((pattern_EV1(day_of_week*288+i,1)/1000)/(0.9*EV_matrix(1,3))*100); if(pattern_EV1(day_of_week*288+i,2)<60 && pattern_EV1(day_of_week*288+i,1)==0) pattern_EV1(day_of_week*288+i,3)=1; else pattern_EV1(day_of_week*288+i,3)=0; end % for EV2 if(time_step(i,j)>=830 && time_step(i,j)<=830+2*EV2_personal_time+5) temp=0; while(temp<=floor((2*EV2_personal_time)/5)) pattern_EV2(day_of_week*288+i,1)=EV2_personal_energy; temp=temp+1; end end if(time_step(i,j)>=1500 && time_step(i,j)<=1500+2*EV2_personal_time+5) temp=0; while(temp<=floor((2*EV2_personal_time)/5)) pattern_EV2(day_of_week*288+i,1)=EV2_personal_energy; temp=temp+1; end end pattern_EV2(day_of_week*288+i+1,2)=pattern_EV2(day_of_week*288+i,2)-((pattern_EV2(day_of_week*288+i,1)/1000)/(0.9*EV_matrix(2,3))*100);

62 MasterThesis
DevMishra
if(pattern_EV2(day_of_week*288+i,2)<60 && pattern_EV2(day_of_week*288+i,1)==0) pattern_EV2(day_of_week*288+i,3)=1; else pattern_EV2(day_of_week*288+i,3)=0; end end [PayOff_EV1,PayOff_EV2]=assign_2P_payoff_1W(PayOff_EV1,PayOff_EV2,pattern_EV1,pattern_EV2,Price_5min_Normal,Price_5min_OffPeak,j-1); [PS_NE]=PS_NE_1W(PayOff_EV1,PayOff_EV2,j-1,PS_NE); day_of_week=day_of_week+1; %% Mobility pattern and energy consumption of EV1 & EV2 % movement pattern of EVs for j=2:1:7 for i=1:1:288 %for EV1 if(time_step(i,j)>=830 && time_step(i,j)<=830+EV1_commute_time+5) temp=0; while(temp<=round(EV1_commute_time/5)) pattern_EV1(day_of_week*288+i,1)=EV1_commute_energy; temp=temp+1; end end if(time_step(i,j)>=1700 && time_step(i,j)<=1700+EV1_commute_time+5) temp=0; while(temp<=round(EV1_commute_time/5)) pattern_EV1(day_of_week*288+i,1)=EV1_commute_energy; temp=temp+1; end end if(time_step(i,j)>=1800 && time_step(i,j)<=1800+EV1_personal_time+5) temp=0; while(temp<=round(EV1_personal_time/5)) pattern_EV1(day_of_week*288+i,1)=EV1_personal_energy; temp=temp+1; end end if(time_step(i,j)>=2000 && time_step(i,j)<=2000+EV1_personal_time+5) temp=0; while(temp<=round(EV1_personal_time/5)) pattern_EV1(day_of_week*288+i,1)=EV1_personal_energy; temp=temp+1; end end pattern_EV1(day_of_week*288+i+1,2)=pattern_EV1(day_of_week*288+i,2)-((pattern_EV1(day_of_week*288+i,1)/1000)/(0.9*EV_matrix(1,3))*100); if(pattern_EV1(day_of_week*288+i,2)<60 && pattern_EV1(day_of_week*288+i,1)==0) pattern_EV1(day_of_week*288+i,3)=1;

EstimationofthenetchargingdemandfromprivatelyownedelectricvehiclesusingGameTheory 63
DevMishra
else pattern_EV1(day_of_week*288+i,3)=0; end % for EV2 if(time_step(i,j)>=830 && time_step(i,j)<=830+2*EV2_personal_time+5) temp=0; while(temp<=floor((2*EV2_personal_time)/5)) pattern_EV2(day_of_week*288+i,1)=EV2_personal_energy; temp=temp+1; end end if(time_step(i,j)>=1500 && time_step(i,j)<=1500+2*EV2_personal_time+5) temp=0; while(temp<=floor((2*EV2_personal_time)/5)) pattern_EV2(day_of_week*288+i,1)=EV2_personal_energy; temp=temp+1; end end pattern_EV2(day_of_week*288+i+1,2)=pattern_EV2(day_of_week*288+i,2)-((pattern_EV2(day_of_week*288+i,1)/1000)/(0.9*EV_matrix(2,3))*100); if(pattern_EV2(day_of_week*288+i,2)<60 && pattern_EV2(day_of_week*288+i,1)==0) pattern_EV2(day_of_week*288+i,3)=1; else pattern_EV2(day_of_week*288+i,3)=0; end end [PayOff_EV1,PayOff_EV2]=assign_2P_payoff_1W(PayOff_EV1,PayOff_EV2,pattern_EV1,pattern_EV2,Price_5min_Normal,Price_5min_OffPeak,j-1); [PS_NE]=PS_NE_1W(PayOff_EV1,PayOff_EV2,j-1,PS_NE); day_of_week=day_of_week+1; end %plotday 4 EV2 charging plot_day_4(4,time_step,EV_matrix,Price_5min_Normal,Price_5min_OffPeak,pattern_EV2,pattern_EV1,EV2_personal_energy); %plotday 5 EV1 charging plot_day_5(5,time_step,EV_matrix,Price_5min_Normal,Price_5min_OffPeak,pattern_EV2,pattern_EV1,EV1_personal_energy,EV1_commute_energy); Code for Load profile: base_load=normrnd(0.2,0.0025,288,1); %0.2 kw with std deviation of 0.05 x=[1:1:288]; load_profile=base_load; ctr=0;

64 MasterThesis
DevMishra
for i=1:1:288 load_profile(i)=load_profile(i)+((2.19*2)/(24*12)+0.2); if floor(i/12)>ctr ctr=ctr+1; end if ctr>=7 && ctr<=8 load_profile(i)=load_profile(i)+i/1000; end if ctr>=15 load_profile(i)=load_profile(i)+i/1000; end if ctr>=21 && ctr <23 load_profile(i)=load_profile(i)+1/12; end if ctr>=21 && ctr <24 load_profile(i)=load_profile(i)+3.06/12; end end Function for Pure Strategy Nash Equilibrium: function [EQM]=PS_NE_1W(PayOff_EV1,PayOff_EV2,day_week,EQM) %EQM =[C,C C,NC NC,NC NC,C] clockwise across the 2x2 grid for i=1:1:288 %decision block every 5 mins if PayOff_EV2(1,1,day_week*288+i) > PayOff_EV2(1,2,day_week*288+i) && PayOff_EV2(1,1,day_week*288+i) > PayOff_EV2(2,1,day_week*288+i) if PayOff_EV1(1,1,day_week*288+i) > PayOff_EV1(1,2,day_week*288+i) && PayOff_EV1(1,1,day_week*288+i) > PayOff_EV1(2,1,day_week*288+i) %if both above statements become true then C,C is a PS_NE EQM(day_week*288+i,1)=1; end elseif PayOff_EV2(2,2,day_week*288+i) > PayOff_EV2(1,2,day_week*288+i) && PayOff_EV2(2,2,day_week*288+i) > PayOff_EV2(2,1,day_week*288+i) if PayOff_EV1(2,2,day_week*288+i) > PayOff_EV1(1,2,day_week*288+i) && PayOff_EV1(2,2,day_week*288+i) > PayOff_EV1(2,1,day_week*288+i) %if both above statements become true then NC, NC is a PS_NE EQM(day_week*288+i,3)=1; end elseif PayOff_EV2(1,2,day_week*288+i) > PayOff_EV2(1,1,day_week*288+i) && PayOff_EV2(1,2,day_week*288+i) > PayOff_EV2(2,2,day_week*288+i) if PayOff_EV1(1,2,day_week*288+i) > PayOff_EV1(1,1,day_week*288+i) && PayOff_EV1(1,2,day_week*288+i) > PayOff_EV1(2,2,day_week*288+i)

EstimationofthenetchargingdemandfromprivatelyownedelectricvehiclesusingGameTheory 65
DevMishra
%if both above statements become true then C, NC is a PS_NE EQM(day_week*288+i,2)=1; end elseif PayOff_EV2(2,1,day_week*288+i) > PayOff_EV2(1,1,day_week*288+i) && PayOff_EV2(2,1,day_week*288+i) > PayOff_EV2(2,2,day_week*288+i) if PayOff_EV1(2,1,day_week*288+i) > PayOff_EV1(1,1,day_week*288+i) && PayOff_EV1(2,1,day_week*288+i) > PayOff_EV1(2,2,day_week*288+i) %if both above statements become true then NC, C is a PS_NE EQM(day_week*288+i,4)=1; end end end end Function for Mixed Strategy Nash Equilibrium: function [Pat_EV1,Pat_EV2]=MS_NE(PayOff_EV1,PayOff_EV2,Pat_EV1,Pat_EV2) for i=1:1:288 %decision block every 5 mins syms sig_u exp_util_l exp_util_r syms sig_l exp_util_u exp_util_d sig_P1=0; sig_P2=0; %player 1 mixed strategy eqn1=exp_util_l==sig_u*PayOff_EV2(1,1,i)+(1-sig_u)*PayOff_EV2(1,2,i); eqn2=exp_util_r==sig_u*PayOff_EV2(2,1,i)+(1-sig_u)*PayOff_EV2(2,2,i); eqn3=exp_util_l==exp_util_r; [A,B] = equationsToMatrix([eqn1, eqn2, eqn3], [sig_u, exp_util_l, exp_util_r]); sol_1 = solve([eqn1, eqn2, eqn3], [sig_u, exp_util_l, exp_util_r]); sig_P1(i,1)=sol_1.sig_u; if sig_P1>0 & sig_P1<1 Pat_EV1(i,5)=sig_P1; end %player 2 mixed strategy eqn4=exp_util_u==sig_l*PayOff_EV1(1,1,i)+(1-sig_l)*PayOff_EV1(1,2,i); eqn5=exp_util_d==sig_l*PayOff_EV1(2,1,i)+(1-sig_l)*PayOff_EV1(2,2,i); eqn6=exp_util_u==exp_util_d; [C,D] = equationsToMatrix([eqn4, eqn5, eqn6], [sig_l, exp_util_u, exp_util_d]); sol_2 = solve([eqn4, eqn5, eqn6], [sig_l, exp_util_u, exp_util_d]);

66 MasterThesis
DevMishra
sig_P2=sol_2.sig_l; if sig_P2>0 & sig_P2<1 Pat_EV2(i,5)=sig_P2; end end end