mapping and analysis of privately-owned coastal structures ... · rpsgroup.com | asascience.com...
TRANSCRIPT

rpsgroup.com | asascience.com
Mapping and Analysis of Privately-Owned Coastal Structures along the Massachusetts Shoreline
Client: Massachusetts Office of Coastal Zone Management
Submitted By: Jeremy Fontenault, Nathan Vinhateiro, Kelly Knee
Date Submitted: 31 March 2013
Project Number: 2012-266 55 Village Square Drive, South Kingstown, RI 02879

Mapping and Analysis of Privately-Owned Structures along the Massachusetts Shoreline March 31, 2013
rpsgroup.com | asascience.com | 122
Page 1 of 5
i
Table of Contents
Table of Contents ............................................................................................................. i
List of Figures .................................................................................................................. iii
List of Tables ................................................................................................................... v
1 Executive Summary .................................................................................................. 1
2 Introduction ............................................................................................................... 3
3 Purpose .................................................................................................................... 4
4 Methodology ............................................................................................................. 4
4.1 Data Sources ............................................................................................................... 4
4.2 Digitization of Structures .............................................................................................11
4.3 Attribution of Structures ..............................................................................................17
4.3.1 Structure Type .....................................................................................................17
4.3.2 Structure Material ................................................................................................21
4.3.3 Structure Length ..................................................................................................22
4.3.4 Structure ID .........................................................................................................23
4.3.5 Structure Elevation ..............................................................................................23
4.3.5.1 Shore-Parallel Structures ..............................................................................25
4.3.5.2 Shore-Perpendicular Structures ....................................................................26
4.3.6 Structure Height ...................................................................................................27
4.3.7 Ownership ...........................................................................................................28
4.3.8 Structure Coordinates ..........................................................................................28
4.3.9 Remaining Attribute Fields ...................................................................................28
4.4 Chapter 91 Licenses ...................................................................................................29
4.4.1 Associating Licenses with Structures ...................................................................29
4.4.2 Chapter 91 Table and Attributes Descriptions ......................................................34
5 Final Database Structure ........................................................................................ 36
6 Results & Discussion .............................................................................................. 39

Mapping and Analysis of Privately-Owned Structures along the Massachusetts Shoreline March 31, 2013
Page 2 of 5
6.1 Statewide Summary ....................................................................................................39
6.2 North Shore ................................................................................................................46
6.3 Boston Harbor .............................................................................................................49
6.4 South Shore ................................................................................................................53
6.5 Cape Cod and Islands ................................................................................................57
6.6 South Coastal .............................................................................................................61
7 Future Considerations ............................................................................................ 65
8 Summary and Conclusion ....................................................................................... 67
9 References ............................................................................................................. 69

Mapping and Analysis of Privately-Owned Structures along the Massachusetts Shoreline March 31, 2013
Page 3 of 5
List of Figures
Figure 1. Ortho imagery tiles used for mapping and attribution of privately-owned coastal
structures. Colors indicate date of acquisition and resolution. ................................................... 6
Figure 2. LiDAR tiles used for attribution of privately-owned coastal structures. Colors indicate
source and date of acquisition. ................................................................................................... 7
Figure 3. MACZM regions used to summarize the project results.............................................. 8
Figure 4. Example of MassDOT oblique imagery in the town of Nahant, MA. ............................ 9
Figure 5. Example of Bing Bird’s Eye imagery in the town of Plymouth, MA. ............................10
Figure 6. Editing template for “heads-up” digitizing of coastal structures. .................................14
Figure 7. Example of a structure that has been rebuilt since the completion of Phase 0. The
previous structure, a combination of a failed revetment and a seawall is shown in (a). The
rebuilt revetment is shown in (b) ...............................................................................................16
Figure 8. Example structure IDs and their individual components. ...........................................23
Figure 9. Example of structures outside of the extent of the LiDAR data coverage. .................24
Figure 10. Invalid profiles due to maximum elevation locations (blue stars) encountered at a
distance greater than 3 meters from the structure location. .......................................................26
Figure 11. Example elevation profile for a groin tied into a perpendicular structure. .................27
Figure 12. Chapter 91 license locations. ..................................................................................30
Figure 13. Map of structure (digitized concrete seawall fronted by a stone revetment) with
matching Chapter 91 license (Figure 14). ..................................................................................32
Figure 14. Engineering plans from Chapter 91 license corresponding to the structures in ........32
Figure 15. Map of structures (bulkhead/seawall, groins, revetment) with matching Chapter 91
license (Figure 16). ...................................................................................................................33
Figure 16. Engineering plans from Chapter 91 license corresponding to the structures in ........34
Figure 17. Privately-owned coastal structures database schema. ............................................37
Figure 18. Using the “Identify” dialog to view structure and corresponding license attributes in
ArcMap. ....................................................................................................................................38
Figure 19. Private coastal structures (by type) along the ocean-facing shoreline of
Massachusetts. .........................................................................................................................43

Mapping and Analysis of Privately-Owned Structures along the Massachusetts Shoreline March 31, 2013
Page 4 of 5
Figure 20. All coastal structures along the ocean-facing shoreline of Massachusetts. ..............44
Figure 21. Distribution of elevations (2 foot bins) for Massachusetts’ privately-owned structures,
statewide. ..................................................................................................................................45
Figure 22. Private .....................................................................................................................48
Figure 23. Distribution of elevations (2 foot bins) for privately-owned structures in the North
Shore region. ............................................................................................................................49
Figure 24. Private coastal structures (by type) for the MACZM Boston Harbor region. .............52
Figure 25. Distribution of elevations (2 foot bins) for privately-owned structures in the Boston
Harbor region. ...........................................................................................................................53
Figure 26. Private coastal structures (by type) for the MACZM South Shore region. ................56
Figure 27. Distribution of elevations (2 foot bins) for privately-owned structures in the South
Shore region. ............................................................................................................................57
Figure 28. Private .....................................................................................................................60
Figure 29. Distribution of elevations (2 foot bins) for privately-owned structures in the Cape Cod
and Islands region. ....................................................................................................................61
Figure 30. Private .....................................................................................................................64
Figure 31. Distribution of elevations (2 foot bins) for privately-owned structures in the South
Coastal region. ..........................................................................................................................65

Mapping and Analysis of Privately-Owned Structures along the Massachusetts Shoreline March 31, 2013
Page 5 of 5
List of Tables
Table 1. Coastal structure types with an example photograph of each type. ............................18
Table 2. Secondary structure type options for each primary structure type. .............................21
Table 3. Structure material options for each structure type.......................................................22
Table 4. Fields not populated in the privately-owned structures database. ...............................29
Table 5. Coastal structures length by MACZM region and statewide. .......................................41
Table 6. Length of shore-perpendicular structures. ..................................................................42
Table 7. Private coastal structure types and materials for the MACZM North Shore region. .....47
Table 8. Private coastal structure types and materials for the MACZM Boston Harbor region. .51
Table 9. Private coastal structure types and materials for the MACZM South Shore region. ....55
Table 10. Private coastal structure types and materials for the MACZM Cape Cod and Islands
region. .......................................................................................................................................59
Table 11. Private coastal structure types and materials for the MACZM South Coastal region. 63
Table 12. Percent of privately-owned coastal structures (summarized by number and total
length) with elevations less than 1, 2, 3, and 6 feet above MHHW. ...........................................66

Mapping and Analysis of Privately-Owned Structures along the Massachusetts Shoreline March 31, 2013
Page 1 of 70
1 Executive Summary
The Massachusetts Executive Office of Energy and Environmental Affairs Office of Coastal
Zone Management (MACZM) contracted Applied Science Associates, Inc., (dba RPS ASA) to
map and analyze privately-owned coastal structures along the Commonwealth’s shoreline. The
work is a continuation of the Massachusetts Coastal Infrastructure Inventory and Assessment
Project. Previous phases of the project, conducted between 2002 and 2009, provided an
inventory and assessment of all publically-owned coastal structures covering approximately 140
miles (225 km) of the Massachusetts shoreline. The addition of privately-owned structures
requested under the current scope of work expands the existing database of structures by
approximately 230 miles (361 km).
RPS ASA’s inventory of privately-owned coastal structures was carried out over a study area
that corresponds with the previous phases and includes the ocean-facing shoreline
(approximately 1,115 miles [1,794 km]) of all five MACZM coastal regions. The ocean-facing
shoreline contains a variety of engineering structures designed for shore protection and
stabilization. Many of these structures were built prior to modern coastal policies and
regulations and until recently, no centralized database of coastal structures existed.
While previous phases included detailed analyses of structure condition, RPS ASA’s
assessment of the privately-owned structures is limited to delineating the structures and
extracting basic information on type, material, length, elevation, and height from remotely
sensed data and available Chapter 91 license documents. The location, length, type, material,
and elevation of each structure were determined using a combination of orthophotography,
oblique aerial imagery, and LiDAR data. Coastal structures considered for this inventory
included shore-parallel features designed to prevent shoreline migration (i.e., seawalls,
bulkheads, revetments, and structural sand bags) as well as shore-perpendicular structures that
restrict the alongshore movement of sediment or provide channel stabilization (i.e., groins and
jetties). The complete database provides fundamental information for coastal management,
including baseline statistics describing the number and type of structures and their frequency on
the Massachusetts coastline.
In total, 6,611 privately-owned coastal structures were mapped. The final inventory includes
2,967 bulkheads/seawalls, 1,660 revetments, 1,969 groins/jetties, and 15 sandbag structures.
Approximately 196 miles (316 km) of shore-parallel structures and 34 miles (55 km) of shore-
perpendicular structures were digitized. When combined with publically-owned structures,
statewide, nearly 27% of the coastline is armored by some form of public or private coastal
protection. The Boston Harbor region has the highest percentage of protected coastline (58%).

Mapping and Analysis of Privately-Owned Structures along the Massachusetts Shoreline March 31, 2013
Page 2 of 70
The Cape Cod and Islands region has the lowest percentage of protected coastline (13%). The
mean (weighted by length) elevation of shore-parallel structures is approximately 12 feet (3.6
meters) NAVD88; shore-perpendicular structures (groins/jetties) average approximately 6 feet
(1.7 meters) NAVD88.

Mapping and Analysis of Privately-Owned Structures along the Massachusetts Shoreline March 31, 2013
Page 3 of 70
2 Introduction
The Massachusetts Executive Office of Energy and Environmental Affairs Office of Coastal
Zone Management (MACZM) contracted Applied Science Associates, Inc., (dba RPS ASA) to
map and analyze privately-owned coastal structures along the Commonwealth’s shoreline. The
work is a continuation of the Massachusetts Coastal Infrastructure Inventory and Assessment
Project. Previous phases of the project were conducted between 2002 and 2009. The initial
phase (Phase 0), consisted of a GPS field survey to collect coordinates and attribute information
for all coastal structures determined to be within “high hazard areas” of the Massachusetts
coastline. High hazard areas included parcels immediately adjacent to coastal embayments or
the Atlantic Ocean, parcels located within coastal flood zones, and parcels immediately adjacent
to intertidal areas. The work was completed between 2002 and 2006. Phases 1 and 2,
completed in 2009, provided an inventory and assessment of all publically-owned coastal
structures, which cover approximately 140 miles (225 km) of the Massachusetts shoreline. The
addition of privately-owned structures requested under the current scope of work expands the
existing database of structures by approximately 230 miles (370 km).
While Phases 1 and 2 included detailed analyses of structure condition, RPS ASA’s assessment
of the privately-owned structures is limited to delineating the structures and extracting basic
information on type, material, length, elevation, and height from remotely sensed data and
available Chapter 91 license documents. Chapter 91 (the Massachusetts Public Waterfront Act)
is a licensing program that allows Massachusetts to protect the public’s interest in waterways of
the Commonwealth. It ensures that the public rights to fish, fowl, and navigate are not
unreasonably restricted. Chapter 91 licenses are required for any structure or structure
alteration in flowed or filled tidelands. The license documents require detailed plans which often
include structure type, material, elevation, and height information.
RPS ASA’s inventory of privately-owned coastal structures was carried out over a study area
that corresponds with the previous phases and includes the ocean-facing shoreline of all five
MACZM coastal regions. The location, length, type, and material of each structure were
determined using a combination of orthophotography and oblique aerial imagery. Elevations
were assigned using LiDAR data. Upon completion of the inventory, all data was imported into
a GIS database of privately-owned structures that is modeled on and compatible with the
databases generated for the previous phases.
The sections below provide an overview of the structure inventory process and a summary of
the project results. The purpose of the study is provided in Section 3. Section 4 provides an
overview of methodology, including a summary of input data sources, approaches for digitizing
and attributing structures, and assumptions and limitations of the study. Section 5 discusses

Mapping and Analysis of Privately-Owned Structures along the Massachusetts Shoreline March 31, 2013
Page 4 of 70
the final database structure in detail and Section 6 provides results, summarized both statewide
and by MACZM region. Section 7 provides a brief summary of structure elevations relative to
predicted sea level rise. Finally, a summary of the project with conclusions is provided in
Section 8.
Note: All geospatial data are provided in the Massachusetts State Plane Coordinate System,
Mainland Zone, NAD83, meters and adhere to FGDC metadata standards. All elevation data
are referenced to NAVD88, meters.
3 Purpose
Massachusetts’ ocean-facing coastline extends over 1,100 miles (1,770 km) and includes a
variety of coastal structures for shore protection and stabilization. Many of these structures
were built prior to modern coastal policies and regulations and until recently, no centralized
database of coastal structures existed. In 2009, the MACZM and Department of Conservation
and Recreation completed a comprehensive inventory of publically-owned coastal infrastructure
to assess the condition of existing structures and assist in prioritization of maintenance and
repairs. The purpose of the current work is to expand this inventory by mapping and
characterizing the remaining coastal structures within the Commonwealth, which are presumed
to be privately owned. The complete database will provide fundamental information for coastal
management, including baseline statistics describing the number and type of structures and
their frequency on the Massachusetts coastline. The dataset also provides a means of
comparing permitted structures with those present on the shoreline. Additionally, because
structures were attributed using high accuracy elevations, the dataset can be used to assess
the potential impacts of coastal flood events or future sea level changes. The database and GIS
files are designed for easy update. The inventory of private structures considered the following:
seawalls, bulkheads, revetments, sandbags, and groins/jetties.
4 Methodology
4.1 Data Sources
A variety of data sources were used to define the scope of work, locate coastal protection
structures, and to determine or generate structure attribution. The list below summarizes the
primary sources of data used for this project.

Mapping and Analysis of Privately-Owned Structures along the Massachusetts Shoreline March 31, 2013
Page 5 of 70
Previous Structures Inventory
The Massachusetts Office of Coastal Zone Management (MACZM) and Department of
Conservation and Recreation have conducted previous statewide mapping of coastal protection
structures through the Massachusetts Coastal Infrastructure Inventory and Assessment Project
(MACZM, 2009). The initial phase of this work (Phase 0) was completed between 2002 and
2006 and consisted of a comprehensive field survey to collect GPS coordinates and attribute
information for all coastal structures determined to be within “high hazard areas” of the
Massachusetts coastline. Phases 1 and 2, completed by teams of consultants between 2006
and 2009, provided an inventory and assessment of publically-owned coastal structures
covering approximately 140 miles (225 km) of the Massachusetts shoreline. The results of this
previous work, including GIS shapefiles, databases, photographs, and summary reports, were
used to mask the project area and identify and classify coastal structures and assign ownership.
All coastal structures not included in previous phases (and thus mapped for this project) were
presumed to be privately-owned. As a result, the inventory may include public structures that
were not included in Phase 1 and 2, or were constructed since the completion of earlier Phases
of the project.
Project Shoreline
Massachusetts’ ocean-facing shoreline was used as the extent of the project area. The ‘ocean-
facing shoreline’ was defined using historical shoreline data, digitized by MACZM and the U.S.
Geological Survey (USGS) as part of the Massachusetts Shoreline Change Mapping and
Analysis Project, 2013 Update (MACZM, 2013). MACZM provided a shoreline change GIS layer
that included vector shorelines (representing the high water line) for the Commonwealth for the
years between 1844 and 2009. The most recent shoreline for each coastal reach was used to
define the overall project scope.
2008/2009 USGS Color Ortho Imagery
Aerial photography for the Commonwealth of Massachusetts is available for download from the
Massachusetts Office of Geographic Information (MassGIS). The most recent data (acquired in
2008 and 2009 by the USGS), were used as a reference layer for digitizing coastal structures,
as well as a source for identifying structures and their attributes. The imagery is orthorectified
and has a pixel resolution of either 15 or 30 cm (MassGIS, 2012b). All tiles covering the
Massachusetts coastal area were downloaded in MrSID format and stored as an ArcGIS mosaic
dataset. The mosaic dataset automatically combines the tiles and preferentially uses the

Mapping and Analysis of Privately-Owned Structures along the Massachusetts Shoreline March 31, 2013
Page 6 of 70
highest resolution. Figure 1 shows the extent of imagery used for this project, as well as the
resolution and year of acquisition.
Figure 1. Ortho imagery tiles used for mapping and attribution of privately-owned coastal
structures. Colors indicate date of acquisition and resolution.
LiDAR
Light Detection and Ranging (LiDAR) terrain data were used to assign elevations to mapped
coastal structures. LiDAR Digital Elevation Models (DEMs) were obtained from the MassGIS
website, which hosts seventeen LiDAR datasets collected between 2002 and 2011 (MassGIS,
2012a). Eight of the datasets available are within the project area and were used for structure
attribution. Figure 2 shows these LiDAR sources and their coverage. The elevation datasets
were combined into an ArcGIS mosaic dataset, which automatically converted all LiDAR tiles to
the same projection and units and preferentially uses the most recent tiles. The LiDAR dataset
was used to assign elevations to structures that were mapped as part of the inventory. A full
description of the individual elevation datasets, mosaicking process, and the methods used to
evaluate coastal structure elevations is included in Appendix A.

Mapping and Analysis of Privately-Owned Structures along the Massachusetts Shoreline March 31, 2013
Page 7 of 70
Figure 2. LiDAR tiles used for attribution of privately-owned coastal structures. Colors indicate
source and date of acquisition.
MACZM Regions
The Massachusetts coastal zone is divided into 5 regions by MACZM for planning and
administrative purposes: North Shore, Boston Harbor, South Shore, Cape Cod & Islands, and
South Coastal. A GIS layer representing the boundaries of the MACZM regions was acquired
from MassGIS and used to summarize the project results at both the statewide and regional
level (MassGIS, 2008). Figure 3 shows the five MACZM regions and the municipal boundaries
within each region.

Mapping and Analysis of Privately-Owned Structures along the Massachusetts Shoreline March 31, 2013
Page 8 of 70
Figure 3. MACZM regions used to summarize the project results.
Massachusetts Oblique Imagery (Pictometry)
The Massachusetts Department of Transportation (MassDOT) hosts a library of low-altitude, 8-
inch pixel resolution, oblique digital images for the state (MassDOT, n.d.). The images, (taken
at an angle of approximately 45°), were collected by Pictometry International in 2008. The
imagery is available for public viewing through a web-based imagery viewer on the MassDOT
website:
https://www.massdot.state.ma.us/planning/Main/MapsDataandReports/Maps/InteractiveMaps/Pi
ctometry.aspx. Figure 4 shows an example of the MassDOT oblique imagery in the town of

Mapping and Analysis of Privately-Owned Structures along the Massachusetts Shoreline March 31, 2013
Page 9 of 70
Nahant, Massachusetts. Because Pictometry images allow coastal features to be viewed at both
oblique angles (approximately 45 degrees) and orthogonally (overhead), and from multiple
perspectives (alongshore and cross-shore), this imagery was a primary reference for identifying
coastal structures and for determining their type and construction material.
Figure 4. Example of MassDOT oblique imagery in the town of Nahant, MA.
BING
Microsoft Bing Maps (http://www.bing.com/maps/) also hosts a comprehensive library of
publically-available, oblique aerial imagery (Microsoft, 2013). Bing’s ‘Bird’s Eye’ imagery can be
viewed at different scales and perspectives depending on the coverage and resolution at the
point of interest. This imagery was used as a secondary source for identifying coastal structures
and determining their type and construction material. An example of the Bing oblique imagery
for the Plymouth coastline is shown in Figure 5.

Mapping and Analysis of Privately-Owned Structures along the Massachusetts Shoreline March 31, 2013
Page 10 of 70
Figure 5. Example of Bing Bird’s Eye imagery in the town of Plymouth, MA.
Tax Assessor’s Parcels
Consistent with previous phases of the inventory, tax parcel data for Massachusetts’ coastal
towns was used to generate unique identification numbers for each coastal structure. Parcel
data were downloaded from MassGIS for each town (with the exception of the town of Newbury,
see Appendix B) (MassGIS, 2010; MassGIS, 2013). All parcels, represented as polygon
features, were merged and a unique ID was generated for each structure based on the parcel
nearest to the midpoint of each linear structure. Appendix B contains specific details about the
parcel data and the processing steps to create and assign structure IDs.
Chapter 91 licenses and points
Massachusetts General Law Chapter 91, the Massachusetts Public Waterfront Act, requires
authorization in order to build or alter structures constructed seaward of the mean high water
line. Chapter 91 authorization is required for a range of engineering structures that are
proposed for Massachusetts tidelands, including piers, wharves, revetments, dams, and

Mapping and Analysis of Privately-Owned Structures along the Massachusetts Shoreline March 31, 2013
Page 11 of 70
bridges. In order to obtain authorization, detailed plans must be submitted for all structure(s);
authorization is granted in the form of a license. The Massachusetts Department of
Environmental Protection (MassDEP) manages Chapter 91 and maintains paper copies of all
licenses at their office. MassDEP also maintains a shapefile of licensed structures, which
includes coordinates of the approximate structure location, as well as information describing the
structure type, applicant, and license date. The shapefile was provided to RPS ASA and was
filtered to identify Chapter 91 licenses potentially relevant to the coastal structures inventory.
Each potentially relevant paper license document was scanned and saved in .PDF format. The
Chapter 91 license documents were primarily used to determine above-ground structure height.
As described in Section 4.4, each license was linked to its corresponding structure manually. A
.PDF file for each license linked to a structure is included in the final structures database as
reference documentation for the corresponding structure.
Baseline
As part of the process of assigning structure elevations, an offshore reference layer was needed
to determine the orientation of each structure with respect to the coastline. MACZM provided a
shore-parallel polyline - a baseline - which was initially developed to calculate shoreline-change
rates as part of the MACZM Shoreline Change Project (MACZM, 2013). The line does not
correspond to any real-world feature; it was created as a reference line for transects cast by the
USGS Digital Shoreline Analysis System software. The baseline is situated offshore and roughly
approximates the shape of the natural coastline, thus it is ideal for the purposes of determining
the orientation of each structure relative to the shoreline. The baseline layer was modified
slightly to ensure that no digitized structures intersected the line.
4.2 Digitization of Structures
Man-made features designed to stabilize the shoreline or reduce coastal storm impacts were
considered for this inventory. Privately-owned coastal structures digitized for this project include
the following (USACE, 2002):
Bulkhead - A shore-parallel vertical structure or partition to retain or prevent sliding of the
land with a secondary purpose to protect the upland environment against damage from
wave action.
Seawall - A shore-parallel vertical structure (often concrete or stone) separating land and
water areas, primarily designed to prevent erosion and other damage by wave action
(typically more massive and capable of resisting greater wave forces than a bulkhead)

Mapping and Analysis of Privately-Owned Structures along the Massachusetts Shoreline March 31, 2013
Page 12 of 70
Revetment - A facing of stone, concrete, or other material used to protect an
embankment or another coastal structure against erosion by wave action or currents.
Groin - A relatively narrow, shore-perpendicular structure built to reduce longshore
currents and trap sediment.
Jetty – A shore-perpendicular structure built to stabilize a channel and prevent buildup of
sediment
Sand Bags – Bags filled with sediment designed to stabilize the shoreline.
Examples of privately-owned structures identified for this inventory are presented in Table 1.
Coastal structures were digitized as polyline features from imagery using a “heads-up”
approach. All geographic features were identified and manually traced in ArcGIS using the
2008/2009 USGS Color Ortho Imagery as a reference dataset. Digitizing was done at a
minimum scale of 1:2,500, but typically at larger scale. A description of the general work flow
follows. All coastal structures were digitized in the Massachusetts State Plane Coordinate
System, Mainland Zone, NAD83, meters.
Typically, structures were identified using a combination of the oblique imagery sources
(MassDOT and Bing). Given their high resolution and oblique perspective, these sources were
also often used to determine structure type and material. The feature was then digitized using
the ortho imagery for reference. For bulkheads and seawalls, the polyline was typically digitized
along the top of the structure. For revetments, the line was digitized at the landward edge of the
structure (presumed to be the highest point). For groins and jetties, a line along the center of
each structure was digitized. Multiple imagery datasets were used to ensure that structures
were digitized at their maximum elevation, however the final location of the structure was always
digitized using the 2008/2009 USGS imagery.
As structures were located and digitized, the primary structure type and its materials were
identified and recorded. For features that consist of multiple structure types and materials (for
example, a bulkhead or seawall with a revetment in front), a secondary structure type and
material was also recorded. For these structures, the landward feature was assigned as the
primary structure and the seaward (typically lower) feature was assigned as the secondary
structure.

Mapping and Analysis of Privately-Owned Structures along the Massachusetts Shoreline March 31, 2013
Page 13 of 70
Structures were digitized into an ArcGIS File Geodatabase (FGDB) polyline feature class. To
ensure data integrity, the database and feature class were created using a subtype and domain
architecture. Subtypes are used to categorize data using an attribute field. For the coastal
structures feature class, a subtype was created for the PrimaryType field. This subtype allowed
only the following values to be assigned as primary type:
1. Bulkhead/Seawall
2. Revetment
3. SandBags
4. Groin/Jetty
For each of the four subtypes defined for the PrimaryType field, default values or domains were
created for the PrimaryMaterial field. For the ‘Bulkhead/Seawall’, ‘Revetment’, and ‘Groin/Jetty’
subtypes, domains with allowable materials for each of those features were created (see
Section 4.3.2). The ‘SandBag’ subtype has a default material of ‘Sandbags’.
The SeconaryType field also contains domains for each PrimaryType subtype; these domains
constrained the type of secondary structure that could be associated with each primary structure
(see Section 4.3.1). The SecondaryMaterial field contained a single domain listing all allowable
materials.
Use of the field domain and subtype approach served two purposes. First, it ensured that only
valid entries were assigned to each field, for example:
only pre-defined structure types could be entered in the StructureType field;
the structure materials were limited based on structure type;
the secondary structure type was limited based on the primary structure type.
In addition, this approach greatly simplified the digitizing process. An editing template was
created, which allowed the GIS analyst to quickly select the primary type/material combination
from a list of features. Based on the selection, the primary type and material attributes were set
automatically as the feature was digitized. Secondary types and materials were selected from
the same predefined lists when encountered. Figure 6 shows an example of the editing
template (lower left corner of the screen shot) with the primary type and material combination
options available for digitizing each feature.
To comply with the database schema of the previous phases, the subtype and domain
architecture was removed from the final FGDB delivered to MACZM.

Mapping and Analysis of Privately-Owned Structures along the Massachusetts Shoreline March 31, 2013
Page 14 of 70
Figure 6. Editing template for “heads-up” digitizing of coastal structures.
The project shoreline provided by MACZM was used to define the extent of the project area.
Structures were only digitized as far into bays, harbors, and coastal ponds as the shoreline file
extended.
Phase 1 and 2 structures were used during the digitization process to determine ownership
(public or private). Mapped structures that were not already included in Phase 1 or 2 were
considered private, regardless of true ownership (which was not determined).
Previous mapping of Phase 0 structures was used in the following way: in the rare cases when
an existing structure aligned well with the 2008/2009 ortho imagery, the feature was simply
copied into the new database and the attributes were set manually. More often, Phase 0
structures were substantially offset from the imagery and required complete re-digitization. The
type and material of all previously mapped structures were set based on existing Phase 0
attributes. However, in several instances, recent imagery indicated that the structure

Mapping and Analysis of Privately-Owned Structures along the Massachusetts Shoreline March 31, 2013
Page 15 of 70
characteristics have changed since the completion of Phase 0. Figure 7 shows a concrete
seawall and failed stone revetment identified in Phase 0, which has since been rebuilt as a
stone revetment. In these cases, structure type or material were updated as necessary.
To ensure consistency throughout the project, all digitizing was completed by a single GIS
analyst. After the initial digitization, the entire dataset was reviewed by a separate data analyst,
ensuring consistency throughout the QAQC process. Any feature still in question after QAQC
was flagged and a shapefile of flagged features was provided to MACZM prior to completion of
the structure database. Each question was resolved by MACZM staff and all validated features
were incorporated into the final structures layer.

Mapping and Analysis of Privately-Owned Structures along the Massachusetts Shoreline March 31, 2013
Page 16 of 70
(a)
(b)
Figure 7. Example of a structure that has been rebuilt since the completion of Phase 0. The
previous structure, a combination of a failed revetment and a seawall is shown in (a). The rebuilt
revetment is shown in (b)

Mapping and Analysis of Privately-Owned Structures along the Massachusetts Shoreline March 31, 2013
Page 17 of 70
4.3 Attribution of Structures
4.3.1 Structure Type
Table 1 lists the coastal structure types that were considered for this project and provides an
example photograph of each type. Primary (landward) and secondary (seaward) types were
mainly identified using the oblique aerial imagery. The primary structure type was stored in the
PrimaryType field and the secondary structure type in the SecondaryType field.
Approximately 6% of all structures digitized included a secondary structure type. Of these, the
most typical combination (95% of occurrences) is a bulkhead/seawall fronted by a revetment.
Table 2 lists the secondary structure types available as options for each primary structure type.
Structure types for previously mapped (Phase 0) features were typically taken from the Phase 0
database. In some cases, recent imagery indicated that the structure characteristics have
changed since the completion of Phase 0 (see Figure 7). In these cases, the structure type was
updated to match the recent imagery. Photos taken during previous field surveys were also
used to verify structure types when aerial imagery was not clear.

Mapping and Analysis of Privately-Owned Structures along the Massachusetts Shoreline March 31, 2013
Page 18 of 70
Table 1. Coastal structure types with an example photograph of each type.
Structure Type Examples
Bulkhead/Seawall:
A generally shore-parallel vertical
structure separating land and
water areas, primarily designed to
prevent erosion and other damage
from wave action
Revetment:
A facing of sloping stone or other
material built to protect an
embankment or another coastal
structure against erosion by
waves.

Mapping and Analysis of Privately-Owned Structures along the Massachusetts Shoreline March 31, 2013
Page 19 of 70
Table 1, cont. Coastal structure types with an example photograph of each type.
Structure Type Examples
Groin:
A relatively narrow, shore-
perpendicular structure built to
reduce longshore currents and
trap sediment.
Jetty:
A shore-perpendicular structure
built to stabilize a channel and
prevent buildup of sediment

Mapping and Analysis of Privately-Owned Structures along the Massachusetts Shoreline March 31, 2013
Page 20 of 70
Table 1, cont. Coastal structure types with an example photograph of each type.
Structure Type Examples
Sand Bags:
Bags filled with sediment to
stabilize the shoreline.

Mapping and Analysis of Privately-Owned Structures along the Massachusetts Shoreline March 31, 2013
Page 21 of 70
Table 2. Secondary structure type options for each primary structure type.
Primary Type
(landward)
Secondary Type
(seaward) Options
Bulkhead/Seawall
Groin/Jetty
Revetment
Sandbags
Revetment
Bulkhead/Seawall
Groin/Jetty
Sandbags
Sandbags
Bulkhead/Seawall
Groin/Jetty
Revetment
4.3.2 Structure Material
The structure material was also primarily determined using the oblique aerial imagery. The
construction material was recorded for the primary structure type and if present the secondary
structure type. The primary structure material was stored in the field named PrimaryMaterial
and the secondary structure material in the SecondaryMaterial field. The pre-defined list of
materials used to classify each type of structure is listed in Table 3.
.

Mapping and Analysis of Privately-Owned Structures along the Massachusetts Shoreline March 31, 2013
Page 22 of 70
Table 3. Structure material options for each structure type.
Structure Type Materials
Bulkhead/Seawall
Brick
Steel
Stone
Wood
Concrete
Groin/Jetty
Concrete
Stone
Wood
Revetment
Concrete
Gabion
Stone
Structural Debris
Sandbags Sandbags
As with structure type, the construction material for Phase 0 structures was typically determined
using the previous database and only modified if more recent imagery indicated that the
structure characteristics have changed since the competition of Phase 0. Photos from previous
field surveys were used to verify structure materials when the aerial imagery was inconclusive.
Determining the material from remotely sensed data was frequently a difficult task. In locations
where the oblique imagery was poorly resolved or coverage was insufficient, it was often difficult
to visually distinguish between the following materials (for structure types listed in parentheses):
concrete and stone (bulkhead/seawalls);
wood and steel (bulkhead/seawalls);
gabion or structural debris and stone (revetments).
Though gabions are an option for revetment construction material, this combination of structure
and material was not encountered.
4.3.3 Structure Length
In FGDBs, ArcGIS automatically stores the length of each polyline feature (in the horizontal
units of the layer’s coordinate system) in a field called Shape_Length. Given the requirement to
use the Massachusetts State Plane Coordinate System, the units of the Shape_Length field are
in meters.
Using the values in the Shape_Length field, each structure’s length in meters was converted to
feet and rounded the nearest foot. This value was stored in the Structure_Length field.

Mapping and Analysis of Privately-Owned Structures along the Massachusetts Shoreline March 31, 2013
Page 23 of 70
4.3.4 Structure ID
Every coastal protection structure received a unique identifier (ID) based on tax parcel data.
The first 12 digits of the ID string correspond to a combination of the town, map, block, and lot
number for the nearest parcel. An additional sequential number was appended to ensure the ID
was unique for cases where multiple structures occur on the same tax parcel. The ID format
matches those from previous phases of the inventory. Each part of the structure ID is separated
by a hyphen (“-“). Additional details on how the structure ID was generated are described in
Appendix B.
As in previous phases, the components of the structure ID are stored in multiple fields
(CommunityNo, MapNo, BlockNo, ParcelNo, StructureNo) and the full structure ID is stored in
two fields, STR_ID and StructureID. The “ID” field simply lists a sequential number for all
structures in the database.
Figure 8 provides examples of the structure IDs and their parts for 12 structures.
Figure 8. Example structure IDs and their individual components.
4.3.5 Structure Elevation
Structure elevations were derived from the LiDAR dataset compiled for the project area (see
more details on the LiDAR DEMs provided in Appendix A). All elevations are in meters relative
to the NAVD88 vertical datum. Elevations are stored in the PositionZ field.
Attribution of structures with a single (maximum) elevation value requires careful consideration
of each data source, its accuracy, and precision. For example:

Mapping and Analysis of Privately-Owned Structures along the Massachusetts Shoreline March 31, 2013
Page 24 of 70
1. Because structures are digitized using ortho imagery as a base layer, the alignment of
these features with LiDAR is limited by the precision between the imagery and elevation
datasets.
2. Most coastal structures do not maintain a consistent elevation for their full length, thus
simply extracting an elevation at a point along the linear feature would not necessarily be
the most representative elevation for the top of the structure.
Prior to developing the methodology to assign elevations, these issues were discussed between
MACZM staff and RPS ASA. As a result, two automated processes were designed to extract the
elevations for each structure. One process was developed to assign elevations to shore-parallel
structures, and another was used for shore-perpendicular structures (groin and jetties). Each
process is described below; Appendix A provides more detailed explanations of each.
All structures were not assigned an elevation. In some areas, the LiDAR data extended only a
short distance from the coast and did not intersect with structures situated at or seaward of the
shoreline. Figure 9 shows an example from Oak Bluffs on Martha’s Vineyard where structures
fall outside of the LiDAR coverage. Areas in grey fall within the DEM tiles, but have no elevation
data. The surrounding area (in white) is outside of the LiDAR tiles entirely.
Figure 9. Example of structures outside of the extent of the LiDAR data coverage.

Mapping and Analysis of Privately-Owned Structures along the Massachusetts Shoreline March 31, 2013
Page 25 of 70
4.3.5.1 Shore-Parallel Structures
For shore-parallel structures, the majority of elevations were generated by creating profile lines
and extracting elevations. A series of profile lines was cast perpendicular to each structure.
Elevations from the corresponding LiDAR dataset were extracted along each of the profile lines.
The maximum elevation of each profile was chosen to represent the structure elevation at that
transect. The profile maximums were then averaged to give the structure elevation. Using this
approach ensured that 1) a representative elevation was chosen for each structure regardless
of any potential misalignment with the DEM, and 2) that the structure elevation value accounted
for variability in elevations along each structure.
For each structure, profile lines were created with variable spacing. The spacing interval was
designed to not exceed 5 meters. Each profile line was automatically extended from 50 meters
in the seaward direction to 2 meters in the landward direction, perpendicular to the structure.
Elevations were extracted along these lines at 1 meter intervals (the minimum resolution of the
LiDAR data), for a total of 53 elevation points per profile line. In cases where some or all of the
elevation points were not covered by the LiDAR DEMs, these points were excluded from
analysis.
Two limits were put in place to exclude potentially invalid data from the analysis:
1. If the maximum elevation along a given profile was not within 3 meters of the location of
the structure, the profile was excluded. As shown in Figure 10, this was done to remove
anomalous elevations that may be introduced from substantial features in the coastal
profile such as docks or piers;
2. Each structure was required to have at least 3 valid profiles for averaging.
Using this approach, 4,248 of the 4,700 shore-parallel structures were successfully assigned an
elevation. The rules above were modified for the remaining 452 structures that had too few or
no valid profile lines. The steps below were performed in order to assign elevations to as many
structures as possible.
1. For each profile, the maximum elevation within 3 meters of the structure was calculated.
This excluded the influence of any natural coastal features and/or infrastructure outside
of the immediate vicinity of the structure.
2. The minimum requirement for number of profiles was removed. Any structure with at
least one profile was assigned an elevation.
Collectively, these two changes produced valid elevations for an additional 382 structures. For
the remaining 70 structures, cross-shore profiles were manually digitized (3 per structure).

Mapping and Analysis of Privately-Owned Structures along the Massachusetts Shoreline March 31, 2013
Page 26 of 70
Elevations were extracted at 1 meter intervals and the maximum elevation of each profile was
averaged to represent the structure. Each profile was manually reviewed to ensure that the
maximum elevation was representative of the coastal structure. An additional 69 structures were
assigned an elevation using this approach.
In total, 4,699 of the 4,700 shore-parallel structures were attributed with an elevation value. The
one remaining structure was entirely outside of the LiDAR extent, and thus was not assigned
any elevation.
Figure 10. Invalid profiles due to maximum elevation locations (blue stars) encountered at a
distance greater than 3 meters from the structure location.
4.3.5.2 Shore-Perpendicular Structures
For all shore-perpendicular structures (groins and jetties), elevations were extracted directly
from the digitized line at 1 meter intervals between the seaward and landward edge of each
structure. The maximum value was chosen to represent the structure elevation. In a majority of
cases, this was the most landward point along the structure.
Of the 1,991 cross-shore structures, 34 were not assigned an elevation. These structures were
located completely outside of the LiDAR data coverage. Another 223 structures were only
partially overlapped by the LiDAR dataset (Figure 9 shows examples of each of these

Mapping and Analysis of Privately-Owned Structures along the Massachusetts Shoreline March 31, 2013
Page 27 of 70
situations). In the case of partial coverage, an elevation was still generated based on the
maximum elevation encountered.
Groins and jetties that are physically tied into a shore-parallel structure (seawall or revetment) at
their landward edge were snapped to the shore-parallel structure during the digitization process
to connect the two features. This may result in some anomalously high elevations for groins
and jetties in the final database, particularly for locations where there are substantial height
differences between the groin/jetty and the seawall or revetment to which it is connected.
Figure 11 shows an example where the maximum elevation point occurs at the top of the
seawall or revetment. This is particularly noticeable in the ~2.5 meter spike in the elevation
profile that occurs at the intersection of the groin/jetty and revetment.
Figure 11. Example elevation profile for a groin tied into a perpendicular structure.
4.3.6 Structure Height
In addition to structure elevation, the above-ground height was estimated for coastal structures.
Because height is measured relative to the true ground surface (as opposed to an orthometric
datum), structure heights were determined from engineering plans and other descriptions that
were included as part of the Chapter 91 license documents, as opposed to LiDAR data. The

Mapping and Analysis of Privately-Owned Structures along the Massachusetts Shoreline March 31, 2013
Page 28 of 70
height of structures was determined by comparing the structure elevation with the ground
surface elevation on the seaward side of the structure. Because of the relative scarcity of this
information, only 5% of digitized structures were attributed with height information. The existing
database schema contained two fields for recording structure heights, PrimaryHeight and
SecondaryHeight.
Following the organization of previous studies, structure heights were typically entered in ranges
of 5 feet, however, some structure plans listed multiple heights that spanned more than one 5-
foot height range. For these cases, the complete range of heights was entered, where the
minimum and maximum values were maintained in multiples of 5 feet (e.g., a structure with a
height range of 3-7 feet would be assigned a height value 0-10 ft).
4.3.7 Ownership
For all structures the PropertyOwnerDesc and StructureOwnerDesc fields were set to “Private”.
The individual owners of structures were not determined. The PropertyOwner and
StructureOwner fields, which store a code for ownership, were all set to “1” (corresponding to
private ownership).
4.3.8 Structure Coordinates
The structure location was saved as an attribute using latitude and longitude fields. The
PositionX field stores the longitude and the PositionY field stores the latitude. Both coordinates
are stored as decimal degrees. The coordinates were calculated using the ArcGIS mid-point
function to calculate the mid-point of each structure, this ensures that the coordinates always fall
on the line, regardless of its shape.
4.3.9 Remaining Attribute Fields
The remaining attribute fields in the structure feature class were not populated for this project,
however, they were kept to maintain the field structure from previous phases. The fields listed
in Table 4 were left empty (null).

Mapping and Analysis of Privately-Owned Structures along the Massachusetts Shoreline March 31, 2013
Page 29 of 70
Table 4. Fields not populated in the privately-owned structures database.
OwnerName SecondaryPriority
Location Repair
YearBuilt EnterBy
BasedOn EnterDate
BasedOnDesc CrewBy
BasedOnComment CrewDate
PrimaryCondition Comments
SecondaryCondition Details
PrimaryPriority
4.4 Chapter 91 Licenses
4.4.1 Associating Licenses with Structures
The license shapefile provided by the Massachusetts Department of Environmental Protection
(MassDEP) contains records for more than 5,600 Chapter 91 licenses that extend throughout
the Commonwealth of Massachusetts. The location of each license is based on a geocoded
address, which may not represent the exact location of the licensed structure. Figure 12 shows
the locations (addresses) of all licenses present in the MassDEP shapefile.

Mapping and Analysis of Privately-Owned Structures along the Massachusetts Shoreline March 31, 2013
Page 30 of 70
Figure 12. Chapter 91 license locations.
To identify licenses within the project area, the following steps were used to filter the data.
1. The shapefile was filtered based on the structure location. Licenses greater than 2 km
from the project shoreline were removed, bringing the number of records to 3,118;
2. The shapefile was filtered based on the type of structures covered. Only licenses for
relevant structure types were retained. Due to the large number of unclassified licenses,
fields that were unfilled or unknown were also saved.
This filtering reduced the total number of valid records to 1,497. Paper copies of each license
were obtained from the MassDEP archive and scanned to .PDF files. A total of 1,399 licenses
were retrieved from the archive; the remaining 98 files were not located in the archive.
Each license was then manually linked to the corresponding digitized structure. By comparing
license plans with tax parcel data, a parcel was identified for each license. Typically the license
point and tax parcel were close to each other, although some were significantly apart. Several
of the licenses covered structures that were outside of the project scope (structures inside bays
and estuaries, and up rivers). These licenses were removed from further consideration.

Mapping and Analysis of Privately-Owned Structures along the Massachusetts Shoreline March 31, 2013
Page 31 of 70
Licenses that were found to correspond to private coastal protection structures within the project
area were reviewed and the following information was recorded for each license:
Structure IDs – a single license frequently included multiple digitized structures. Each
structure present in the plans was recorded. Even if a license only applied to a specific
feature, such as a dock, other relevant structures clearly shown and labeled in the plans
were included.
Elevation(s) – the elevation of each structure (in feet) was recorded when present. If
multiple elevations were listed for a single structure, the full range was recorded. In
some instances the elevation was estimated using a vertical scale bar or other scaled
features. In these cases the elevation was flagged as ‘estimated’.
Datum – the vertical datum was recorded (when listed in the plans).
Height(s) – the height of each structure (above the ground surface) was recorded when
listed or when it could be interpreted from the plans. The exact height was typically not
listed. In most cases, heights were estimated by comparing the elevation at the top and
the base of each structure. In cases where the structure base elevation was not
provided, the base elevation was estimated and the height range was recorded as
estimated. In other cases the height was estimated using the scale bar included with the
plans.
Notes – Any interesting features in the plans were also recorded. Frequently these
notes include any observed discrepancies between the structure type or material listed
in the plans, and what was interpreted during the structure digitization.
The following figures show examples of digitized structures and their corresponding Chapter 91
license plans. Figure 13 shows a digitized concrete seawall (primary type) fronted by a stone
revetment (secondary type). Figure 14 shows engineering plans from the corresponding
Chapter 91 license (#8013), which include the location of the seawall and revetment, its
materials, and the elevation and height of the structures.

Mapping and Analysis of Privately-Owned Structures along the Massachusetts Shoreline March 31, 2013
Page 32 of 70
Figure 13. Map of structure (digitized concrete seawall fronted by a stone revetment) with
matching Chapter 91 license (Figure 14).
Figure 14. Engineering plans from Chapter 91 license corresponding to the structures in Figure
13.

Mapping and Analysis of Privately-Owned Structures along the Massachusetts Shoreline March 31, 2013
Page 33 of 70
Figure 15 shows several digitized structures, all of which are all covered by license #8097.
Drawings included with the license (Figure 16) show the location of the structures, their type and
material, and cross-sections and profiles that were used to determine height and elevation.
Figure 15. Map of structures (bulkhead/seawall, groins, revetment) with matching Chapter 91
license (Figure 16).

Mapping and Analysis of Privately-Owned Structures along the Massachusetts Shoreline March 31, 2013
Page 34 of 70
Figure 16. Engineering plans from Chapter 91 license corresponding to the structures in Figure
15.
4.4.2 Chapter 91 Table and Attributes Descriptions
All information from Chapter 91 licenses and plans was recorded in an ArcGIS FDGB table
(“Chapter 91 License Table”) located in the same database as the structures feature class. The
table includes the following attributes:
LIC_NO – License number.
StructureID – Structure ID of the corresponding digitized structure.
Elev_FT_Recorded – Structure elevation in feet, as it was recorded from the license. If
multiple elevations were listed for a single structure, the range was recorded.

Mapping and Analysis of Privately-Owned Structures along the Massachusetts Shoreline March 31, 2013
Page 35 of 70
Elev_FT_Average – Structure elevation in feet, represented as a single value. If a
range of elevations was recorded, this value represents the mid-point.
Elev_Est – Indicates that the elevation was estimated when the value is “Y”.
Height_FT_Recorded – Structure height (in feet) as recorded from the license. This
can be a range or a single height value. Ranges were used if the exact value was not
given, or when multiple values were listed.
Height_FT_Range – Structure height (in feet) represented as a range where the
minimum and maximum of the range are 5 foot intervals.
Height_Est – Indicates that the height was estimated when the value is “Y”.
Datum – vertical datum used to measure the elevation (MLW = mean low water, MHW =
mean high water, MSL = mean sea level).
ASA_Notes – Notes recorded by RPS ASA personnel about the structure or plans.
Elev_NAVD88_M – Elevation in meters using the NAVD88 vertical datum. This is the
“Elev_FT_Average” value converted to NAVD88 using NOAA’s VDatum tool (NOAA,
2012).
In addition, the following fields were appended directly from the MassDEP Chapter 91 point
shapefile:
FILE_NO
NAME
ADDRESS
TOWN
CH91_TOWN
STATE
ZIP
REGION
APPLICANT
PERMITTYPE
STRUCTYPE
WATERBODY
LIC_ISSUED
LIC_EXPIRE
Because one license may correspond to multiple structures (and vice versa), this table is linked
to the structures layer using a relationship class with one-to-many cardinality. A cardinality of
one-to-many means that an origin record can relate to many destination records. For example, a
given structure may be represented in multiple licenses. While licenses often contain multiple

Mapping and Analysis of Privately-Owned Structures along the Massachusetts Shoreline March 31, 2013
Page 36 of 70
structures, a separate record was created in the Chapter 91 table for each structure in a given
license. This allowed individual properties such as Structure_ID, Height, and Elevation to be
recorded for each structure.
5 Final Database Structure
The final database is provided as an ArcGIS File Geodatabase (FGDB). It includes:
a polyline feature class of the coastal structures;
a table of the Chapter 91 licenses and attributes;
the Chapter 91 licenses (included as attachments);
a relationship class linking the structures to corresponding Chapter 91 licenses, and
a relationship class linking the Chapter 91 license attachments to the Chapter 91 license
table.
Figure 17 illustrates the database design. The Structures feature class uses a datum of North
American Datum (NAD83) registered to the Massachusetts State Plane coordinate system, for
the Mainland zone (FIPS 2001). The horizontal units are in meters. All elevations are
referenced to meters NAVD88.

Mapping and Analysis of Privately-Owned Structures along the Massachusetts Shoreline March 31, 2013
Page 37 of 70
Figure 17. Privately-owned coastal structures database schema.
The simplest method to view the database is to load the structure feature class into ArcMap and
to use the relationship classes to show associated data. When interrogating a structure that has
a corresponding Chapter 91 license, the license record will appear in the “Identify” window tree-
view. By expanding the tree for each structure, the list of associated licenses can be viewed.
By selecting one of the licenses, all the attributes for that license record will be visible. The
“Attachments” drop-down menu at the top of the Identify window will list the scanned document
(PDF) for the selected license. The PDF can be opened by selecting the record from the drop-
down list. An example of the “Identify” dialog tree-view and “Attachments” drop-down menu is
shown Figure 18.

Mapping and Analysis of Privately-Owned Structures along the Massachusetts Shoreline March 31, 2013
Page 38 of 70
Figure 18. Using the “Identify” dialog to view structure and corresponding license attributes in
ArcMap.
The license data can also be accessed directly by adding the standalone Chapter 91 license
table to an ArcMap project or viewing the table directly using ArcCatalog. To open an attached
license PDF, right click on a selected license record and select “Open Attachment Manager”.
Double-clicking the desired record will open the PDF document.

Mapping and Analysis of Privately-Owned Structures along the Massachusetts Shoreline March 31, 2013
Page 39 of 70
6 Results & Discussion
6.1 Statewide Summary
A total of 6,611 privately-owned coastal structures were mapped along Massachusetts’ ocean-
facing shoreline. The complete inventory of coastal structures includes:
2,967 bulkheads/seawalls;
1,660 revetments;
1,969 groins/jetties;
15 sandbag structures.
Figure 19 shows the full extent of mapped structures and their general distribution along the
Massachusetts coastline. The frequency, elevation, and the type of structures are indicative of
the physical processes that shape the coast, the underlying geomorphology, and the history of
coastal development in each region. For example, cross-shore structures (groins) are most
common in the sandy, micro-tidal environments south of Cape Cod, whereas the rocky
headlands and isolated barriers of the North Shore are mainly protected by seawalls. Bulkheads
are more common inside the highly developed Boston Harbor coastline and revetments are
ubiquitous features throughout the Commonwealth, although they are less frequent for coastal
reaches north of Boston. Coastal protection is mostly absent along the south-facing shorelines
of Martha’s Vineyard and Nantucket, the outer Cape, and the barriers north of Rockport. The
highest coastal structures are found in the North Shore, Boston, and South Shore regions,
where tidal range is also highest (Ramsey et. al, 2005). As the tide range decreases along
Cape Cod and the South Coastal region, average structure elevations also decrease. The
smallest tidal ranges, found in Buzzards Bay, correspond to the lowest structures.

Mapping and Analysis of Privately-Owned Structures along the Massachusetts Shoreline March 31, 2013
Page 40 of 70
The Commonwealth’s ocean-facing shoreline, used to define the scope of work, extends for
approximately 1,115 miles (1,794 km) between the border with New Hampshire in Salisbury and
the Rhode Island border in Westport. Nearly 27% of this coastline is armored by some form of
coastal protection1. This includes approximately 196 miles (316 km) of privately-owned coastal
structures, and 103 miles (166 km) of public structures that are all oriented in an alongshore
direction. Additionally, there are 67 miles (109 km) of structures that extend in the cross-shore
direction (33 miles [55 km] of private groins/jetties and 34 miles [54 km] of public groins/jetties).2
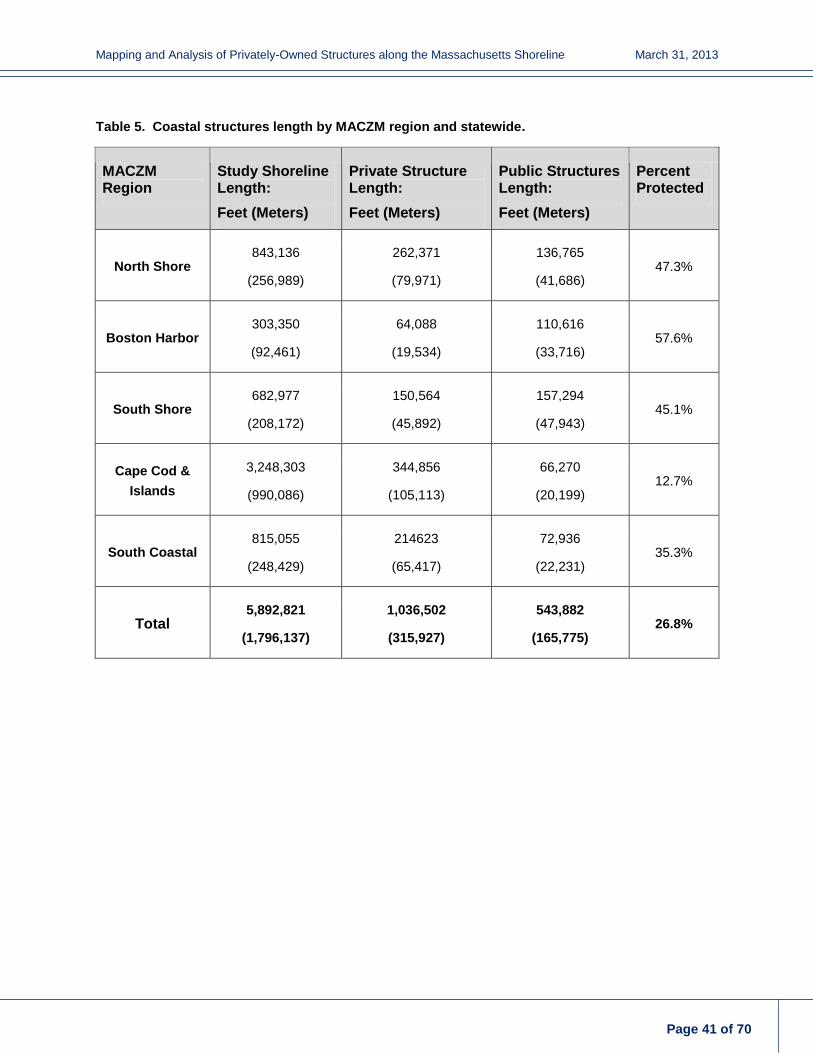
Table 5 provides the length of the ocean-facing shoreline within each MACZM region along with
the breakdown of shore-parallel public and private structure lengths. Also shown is the
percentage of the shoreline that is protected (percent armored by shore-parallel structures).
Statewide statistics are included as the sum of all regions. Table 6 provides the total length of
private and public shore-perpendicular structures by region and statewide.
1 When referring to percentage of shoreline protected both statewide and regionally only the length of shore-parallel
primary structures is considered. 2 Summary statistics for public structures mapped during Phase 1 and Phase 2 exclude features outside scope of the
current (private structures) project, and exclude dunes/beaches that were mapped during previous phases. The total
length of public groins/jetties includes connecting (alongshore) pieces in some areas. Federal structures are included
as public structures.
Mapping and Analysis of Privately-Owned Structures along the Massachusetts Shoreline March 31, 2013
Page 41 of 70
Table 5. Coastal structures length by MACZM region and statewide.
MACZM Region
Study Shoreline Length:
Feet (Meters)
Private Structure Length:
Feet (Meters)
Public Structures Length:
Feet (Meters)
Percent Protected
North Shore 843,136
(256,989)
262,371
(79,971)
136,765
(41,686) 47.3%
Boston Harbor 303,350
(92,461)
64,088
(19,534)
110,616
(33,716) 57.6%
South Shore 682,977
(208,172)
150,564
(45,892)
157,294
(47,943) 45.1%
Cape Cod &
Islands
3,248,303
(990,086)
344,856
(105,113)
66,270
(20,199) 12.7%
South Coastal 815,055
(248,429)
214623
(65,417)
72,936
(22,231) 35.3%
Total 5,892,821
(1,796,137)
1,036,502
(315,927)
543,882
(165,775) 26.8%

Mapping and Analysis of Privately-Owned Structures along the Massachusetts Shoreline March 31, 2013
Page 42 of 70
Table 6. Length of shore-perpendicular structures.
MACZM
Region
Private Structure
Length:
Feet (Meters)
Public Structures
Length:
Feet (Meters)
Total Structure
Length:
Feet (Meters)
North Shore 2,567
(782)
5,592
(1,705)
8,159
(2,487)
Boston Harbor 5,880
(1,792)
24,934
(7,600)
30,814
(9,392)
South Shore 8,906
(2,715)
30,639
(9,339)
39,545
(12,054)
Cape Cod &
Islands
102,940
(31,376)
105,508
(32,159)
208,448
(63,535)
South Coastal 58,616
(17,866)
10,630
(3,240)
69,246
(21,106)
Total 178,909
(54,531)
177,304
(54,043)
356,213
(108,574)

Mapping and Analysis of Privately-Owned Structures along the Massachusetts Shoreline March 31, 2013
Page 43 of 70
Figure 19. Private coastal structures (by type) along the ocean-facing shoreline of Massachusetts.

Mapping and Analysis of Privately-Owned Structures along the Massachusetts Shoreline March 31, 2013
Page 44 of 70
Figure 20. All coastal structures along the ocean-facing shoreline of Massachusetts.

Mapping and Analysis of Privately-Owned Structures along the Massachusetts Shoreline March 31, 2013
Page 45 of 70
For shore-parallel structures identified by this work, the mean (weighted by length)3 elevation
was approximately 12 feet (3.6 meters) above NAVD88; the mean elevation of shore-
perpendicular structures (groins/jetties) was approximately 6 feet (1.7 meters) NAVD88. Figure
21 shows the distribution of elevations (in 2 foot bins) for all privately-owned structures,
statewide. Groins and jetties (most of which extend only short distances onshore) are primarily
in the 0-10 foot elevation range, while seawalls and other shore-parallel structures exhibit a
much wider range of elevations. Elevations for 35 structures (34 groins/jetties, 1 shore-parallel
structures) were not determined as these features are located entirely outside of the LiDAR
coverage.
Figure 21. Distribution of elevations (2 foot bins) for Massachusetts’ privately-owned structures,
statewide.
3 Summary statistics for structure elevations (here and in subsequent discussions) have been normalized
by structure length. Length-weighted averages were presumed to be a better reporting metric given the variability in individual structure lengths. Mean elevation is calculated by multiplying each structure’s elevation by the percentage of protected shoreline that structure represents, and summing the total. Similarly, percentages refer to the percent of total armored shoreline as opposed to the percent of individual structures.

Mapping and Analysis of Privately-Owned Structures along the Massachusetts Shoreline March 31, 2013
Page 46 of 70
6.2 North Shore
The North Shore region extends between the Massachusetts/New Hampshire border (at
Salisbury) and Revere and includes approximately 160 miles (257 km) of ocean-facing
shoreline. Just under 50 miles (80 km) of the coastline in this region is protected by privately-
owned structures, the majority of which are bulkheads and seawalls (Table 7). Another 26 miles
(42 km) are protected by public structures. In total, approximately 47% of the North Shore
region is fronted by some form of coastal protection.
As shown in Figure 22, most of the privately-owned structures in the North Shore region were
mapped in the communities south of Essex. North of Cape Ann the coastline is characterized by
wide, sandy beaches and barriers and the relatively few coastal engineering structures are
organized around inlets, harbors, and back beach environments. This region also contains the
Parker River National Wildlife Refuge, which is predominantly undeveloped coastline. By
contrast, the rocky headlands and pocket beaches that characterize the coastline south of
Essex contain the vast majority of structures in the region (primarily bulkheads and seawalls).
There are relatively few groins/jetties present in the North Shore region.
Figure 23 shows the distribution of structure elevations (in terms of total length) for the North
Shore region. The data indicate that most of the coastal protection in this region occurs at an
elevation above the statewide averages. For the North Shore region:
The mean elevation of shore-parallel structures is 15.7 feet (4.8 meters) above NAVD88;
Shore-perpendicular structures average 5.4 feet (1.6 meters) above NAVD88;
58% of shore-parallel structures (996 structures, 153,290 linear feet) are above the
statewide average of 12 feet (3.6 meters) NAVD88;
52% of shore-perpendicular structures (14 structures, 1,334 linear feet) are above the
statewide average of 6 feet (1.7 meters) NAVD88.

Mapping and Analysis of Privately-Owned Structures along the Massachusetts Shoreline March 31, 2013
Page 47 of 70
Table 7. Private coastal structure types and materials for the MACZM North Shore region.
Primary Structure
Primary Material
Total Structures
Total Length: Feet
(Meters)
Bulkhead/Seawall
Stone 920 149,367 (45,527)
Concrete 281 45,016
(13,721)
Wood 17 2,017 (615)
Steel 15 3,078 (938)
Total 1,233 199,477 (60,801)
Revetment
Stone 289 62,130
(18,937)
Structural Debris
3 764
(233)
Total 292 62,894
(19,170)
Total Shore-Parallel Structures 1,525 262,371 (79,971)
Groin/Jetty
Stone 26 2,254 (687)
Concrete 4 260 (79)
Wood 1 53
(16)
Total Shore-Perpendicular Structures
31 2,567 (782)

Mapping and Analysis of Privately-Owned Structures along the Massachusetts Shoreline March 31, 2013
Page 48 of 70
Figure 22. Private coastal structures (by type) for the MACZM North Shore region.

Mapping and Analysis of Privately-Owned Structures along the Massachusetts Shoreline March 31, 2013
Page 49 of 70
Figure 23. Distribution of elevations (2 foot bins) for privately-owned structures in the North
Shore region.
6.3 Boston Harbor
The Boston Harbor region includes the densely-populated communities between Winthrop and
Weymouth that surround the city of Boston. This region includes approximately 57 miles (92 km)
of ocean-facing coast, of which, about 12 miles (19 km) are protected with privately-owned
coastal structures (Table 8). Another 21 miles (34 km) of the coast are protected with public
structures. The Boston Harbor region shoreline has the highest percentage of coastline fronted
by some form of coastal protection (58%).
Figure 24 shows the location of private structures in the Boston Harbor region, classified by
primary structure type. Given its smaller extent and the amount of public infrastructure that
surrounds Boston Harbor, far fewer private structures were digitized here in comparison to other
MACZM regions. Additionally, many of the interior portions of Boston Harbor fell outside of the
study area. As with the North Shore, a high percentage of structures were identified as
bulkhead/seawalls and revetments. There are relatively few groins/jetties present in this region.

Mapping and Analysis of Privately-Owned Structures along the Massachusetts Shoreline March 31, 2013
Page 50 of 70
Figure 25 shows the distribution of structure elevations in terms of total length for the Boston
Harbor region. The data indicate that most of the coastal protection in this region occurs at an
elevation above the statewide averages. For Boston Harbor:
The mean elevation of shore-parallel structures is 15.1 feet (4.6 meters) above NAVD88;
Shore-perpendicular structures average 7.4 feet (2.3 meters) above NAVD88;
55% of shore-parallel structures (99 structures, 35,307 linear feet) are above the
statewide average of 12 feet (3.6 meters) NAVD88;
69% of shore-perpendicular structures (17 structures, 4,086 linear feet) are above the
statewide average of 6 feet (1.7 meters) NAVD88.

Mapping and Analysis of Privately-Owned Structures along the Massachusetts Shoreline March 31, 2013
Page 51 of 70
Table 8. Private coastal structure types and materials for the MACZM Boston Harbor region.
Primary Structure
Primary Material
Total Structures
Total Length: Feet
(Meters)
Bulkhead/Seawall
Concrete 111 22,571 (6,880)
Stone 38 13,896 (4,235)
Wood 9 1,584 (483)
Steel 3 832
(253)
Total 161 38,882
(11,851)
Revetment Stone 60 25,206 (7,683)
Total Shore-Parallel Structures 221 64,088
(19,534)
Groin/Jetty
Stone 25 4,466
(1,361)
Concrete 4 351
(107)
Wood 4 1,063 (324)
Total Shore-Perpendicular Structures
33 5,880
(1,792)

Mapping and Analysis of Privately-Owned Structures along the Massachusetts Shoreline March 31, 2013
Page 52 of 70
Figure 24. Private coastal structures (by type) for the MACZM Boston Harbor region.

Mapping and Analysis of Privately-Owned Structures along the Massachusetts Shoreline March 31, 2013
Page 53 of 70
Figure 25. Distribution of elevations (2 foot bins) for privately-owned structures in the Boston
Harbor region.
6.4 South Shore
The South Shore region extends from Hingham to Plymouth, and includes nearly 130 miles (209
km) of ocean-facing shoreline. Approximately 29 miles (46 km) of the coastline in this region is
protected by privately-owned structures (Table 9). Another 30 miles (48 km) of the coast are
protected by public structures. In total, 45% of the South Shore region is fronted by some form
of coastal protection.
Most of the South Shore coastline (outside and to the south of Boston Harbor) is characterized
by long, relatively narrow, headland beaches and headland-separated barrier spits. As shown in
Figure 26, the most common structure type in this region is revetments, many of which consist
of stone blocks placed at the base of eroding bluffs along these beaches. Bulkheads and
seawalls are also quite common in the South Shore region. Shore-normal features (groins)
occur more frequently than in the MACZM regions to the north.
Figure 27 shows the distribution of private structure elevations in terms of total length for the
South Shore region. The data indicate that most of the coastal protection in this region occurs
at elevations close to the statewide averages. For the South Shore region:

Mapping and Analysis of Privately-Owned Structures along the Massachusetts Shoreline March 31, 2013
Page 54 of 70
The mean elevation of shore-parallel structures is 14.0 feet (4.3 meters) above NAVD88;
Shore-perpendicular structures average 7.9 feet (2.4 meters) above NAVD88;
48% of shore-parallel structures (362 structures, 72,163 linear feet) are above the
statewide average of 12 feet (3.6 meters) NAVD88;
69% of shore-perpendicular structures (56 structures, 6,132 linear feet) are above the
statewide average of 6 feet (1.7 meters) NAVD88.

Mapping and Analysis of Privately-Owned Structures along the Massachusetts Shoreline March 31, 2013
Page 55 of 70
Table 9. Private coastal structure types and materials for the MACZM South Shore region.
Primary Structure
Primary Material
Total Structures
Total Length: Feet
(Meters)
Bulkhead/Seawall
Concrete 256 40,749
(12,420)
Stone 129 22,951 (6,995)
Wood 26 4,061
(1,238)
Steel 2 673
(205)
Total 413 68,434
(20,859)
Revetment
Stone 322 81,593
(24,870)
Concrete 2 196 (60)
Structural Debris
2 272 (83)
Total 326 82,061
(25,012)
Total Shore-Parallel Structures 739 150,495 (45,871)
Groin/Jetty
Stone 81 7,872
(2,399)
Wood 16 883
(269)
Concrete 2 196 (60)
Total Shore-Perpendicular Structures
99 8,950
(2,728)

Mapping and Analysis of Privately-Owned Structures along the Massachusetts Shoreline March 31, 2013
Page 56 of 70
Figure 26. Private coastal structures (by type) for the MACZM South Shore region.

Mapping and Analysis of Privately-Owned Structures along the Massachusetts Shoreline March 31, 2013
Page 57 of 70
Figure 27. Distribution of elevations (2 foot bins) for privately-owned structures in the South
Shore region.
6.5 Cape Cod and Islands
The Cape Cod and Islands region includes the 15 towns of Barnstable County, extending from
Bourne to Provincetown, as well as Martha’s Vineyard, Nantucket, and the Elizabeth Islands.
This region includes approximately 615 miles (990 km) of ocean-facing shoreline, of which,
about 65 miles (105 km) are fronted by privately-owned coastal structures (Table 10). Another
13 miles (20 km) are protected with public structures. The Cape Cod and Islands region has the
lowest percentage of coastline fronted by some form of coastal protection, approximately 13%.
Figure 28 shows the locations of structures in the Cape Cod and Islands region, classified by
primary structure type. The coastline of this region is geomorphically diverse, which is reflected
in the type and occurrence of coastal structures within each community. For example,
revetments are common along many of the elongated sandy beaches inside of Cape Cod Bay,
while a combination of revetments and groins/jetties is widespread along the barrier spits of the
south-facing coast. A substantial portion of this coastline also lies within the Cape Cod National

Mapping and Analysis of Privately-Owned Structures along the Massachusetts Shoreline March 31, 2013
Page 58 of 70
Seashore, which has almost no privately-owned coastal structures. The undeveloped, south-
facing coastlines of Martha’s Vineyard and Nantucket are equally devoid of coastal protection.
Figure 29 shows the distribution of private structure elevations in terms of total length for the
Cape Cod and Islands region. The data indicate that most of the coastal protection in this
region occurs at an elevation below the statewide averages. For the Cape Cod and Islands
region:
The mean elevation of shore-parallel structures is 10 feet (3.0 meters) above NAVD88;
Shore-perpendicular structures average 5.9 feet (1.8 meters) above NAVD88;
36% of shore-parallel structures (373 structures, 122,500 linear feet) are above the
statewide average of 12 (3.6 meters) feet NAVD88;
39% of shore-perpendicular structures (389 structures, 40,337 linear feet) are above the
statewide average of 6 feet (1.7 meters) NAVD88.

Mapping and Analysis of Privately-Owned Structures along the Massachusetts Shoreline March 31, 2013
Page 59 of 70
Table 10. Private coastal structure types and materials for the MACZM Cape Cod and Islands
region.
Primary Structure
Primary Material
Total Structures
Total Length: Feet
(Meters)
Bulkhead/Seawall
Concrete 328 64,127
(19,546)
Wood 174 40,349
(12,298)
Stone 145 28,929 (8,817)
Steel 34 16,147 (4,922)
Total 681 149,552 (45,583)
Revetment
Stone 599 189,000 (57,607)
Structural Debris
8 3,112 (949)
Concrete 1 262 (80)
Total 608 192,374 (58,636)
Sandbags 15 2,931 (893)
Total Shore-Parallel Structures 1,304 344,856
(105,113)
Groin/Jetty
Stone 1,061 98,314
(29,966)
Wood 102 4,369
(1,332)
Concrete 2 257 (78)
Total Shore-Perpendicular Structures
1,165 102,940 (31,376)

Mapping and Analysis of Privately-Owned Structures along the Massachusetts Shoreline March 31, 2013
Page 60 of 70
Figure 28. Private coastal structures (by type) for the MACZM Cape Cod and Islands region.

Mapping and Analysis of Privately-Owned Structures along the Massachusetts Shoreline March 31, 2013
Page 61 of 70
Figure 29. Distribution of elevations (2 foot bins) for privately-owned structures in the Cape Cod
and Islands region.
6.6 South Coastal
The South Coastal region extends from Wareham to Seekonk, and includes the communities
that make up the north and west coast of Buzzards Bay. This region includes approximately 154
miles (248 km) of ocean-facing shoreline, about 41 miles (65 km) of which are protected with
privately-owned coastal structures (Table 11). Another 14 miles (22 km) of the coast are
protected with public structures. In total, approximately 35% of the South Coastal region is
fronted by some form of coastal protection.
The coastline between Wareham and the Rhode Island/Massachusetts border (shown in Figure
28) is characterized by numerous linear embayments separated by elevated headlands. The
coastline is highly compartmentalized due to the glacial geology of Buzzards Bay (embayments
resulting from drowned outwash channels) with isolated barriers and pocket beaches along the
semi-protected shoreline segments. The region lacks significant sources of mobilized sediment,
which likely accounts for the high percentage of sand trapping structures (groins) that were
identified by this work. Revetments are also common features along this coastline.
Mapping and Analysis of Privately-Owned Structures along the Massachusetts Shoreline March 31, 2013
Page 62 of 70
Figure 31 shows the distribution of private structure elevations in terms of total length for the
South Coastal region. The data indicate that most of the coastal protection in this region occurs
at an elevation below the statewide averages. For the South Coastal region:
The mean elevation of shore-parallel structures is 6.6 feet (2.0 meters) above NAVD88;
Shore-perpendicular structures average 4.3 feet (1.3 meters) above NAVD88;
8% of shore-parallel structures (43 structures, 17,299 linear feet) are above the
statewide average of 12 feet (3.6 meters) NAVD88;
25% of shore-perpendicular structures (139 structures, 14,714 linear feet) are above the
statewide average of 6 feet (1.7 meters) NAVD88.

Mapping and Analysis of Privately-Owned Structures along the Massachusetts Shoreline March 31, 2013
Page 63 of 70
Table 11. Private coastal structure types and materials for the MACZM South Coastal region.
Primary Structure
Primary Material
Total Structures
Total Length: Feet
(Meters)
Bulkhead/Seawall
Concrete 241 45,596
(13,898)
Stone 212 53,057
(16,172)
Wood 15 3,250 (991)
Steel 10 5,167
(1,575)
Brick 1 97
(30)
Total 479 107,168 (32,665)
Revetment
Stone 370 107,079 (32,638)
Structural Debris
4 377
(115)
Total 374 107,456 (32,753)
Total Shore-Parallel Structures 853 214,623 (65,417)
Groin/Jetty
Stone 609 56,963
(17,362)
Concrete 22 1,152 (351)
Wood 9 501
(153)
Total Shore-Perpendicular Structures
640 58,616
(17,866)

Mapping and Analysis of Privately-Owned Structures along the Massachusetts Shoreline March 31, 2013
Page 64 of 70
Figure 30. Private coastal structures (by type) for the MACZM South Coastal region.

Mapping and Analysis of Privately-Owned Structures along the Massachusetts Shoreline March 31, 2013
Page 65 of 70
Figure 31. Distribution of elevations (2 foot bins) for privately-owned structures in the South
Coastal region.
7 Future Considerations
Coastal structures, whether constructed to provide flood protection, maintain navigation
channels, or to prevent shoreline migration, are designed based on specific criteria. The
engineering of coastal structures takes into account the influences of tides, currents, and waves,
which are all dependent on local water levels. As future sea level rise leads to higher global
water levels (Rahmstorf, 2006), the functionality of coastal structures not designed to withstand
these changes could be impacted. In fact, sea level changes along the mid-Atlantic and
Northeast U.S. coastline (including Massachusetts) are increasing at a rate 3-4 times the global
average (Sallenger et al., 2012). The consequences of such changes become acute during
storms, as waves gain access to increasingly higher elevations over time.
To assess the potential for sea level rise to impact coastal structures, the elevation of each
privately-owned coastal structure was compared with four plausible sea level rise scenarios
representing increases in mean higher high water (MHHW) of 1, 2, 3, and 6 feet (0.3, 0.6, 0.9,
and 1.8 m). MHHW represents the average of the highest tide of each tidal day observed over

Mapping and Analysis of Privately-Owned Structures along the Massachusetts Shoreline March 31, 2013
Page 66 of 70
the 19 year National Tidal Datum Epoch. It can be thought of as an elevation that experiences
tidal flooding once per day on average. Structure elevations were converted from NAVD88 to
MHHW using NOAA’s VDATUM tool (NOAA, 2012).
Table 12 summarizes the structures that become inundated by each of the four sea level rise
scenarios. Groins and jetties, designed to trap sediment and stabilize channels, are impacted at
much higher rate when compared with shore parallel structures, which are more typically
constructed for flood protection. Even a very moderate sea level rise of 1 ft (0.3 m) impacts
nearly 30% of groins/jetties, representing over 20% of their total length. The number of
groins/jetties impacted grows quickly with higher sea level rise scenarios, reaching more than
80% if MHHW is increased by 6 ft (0.9 m). Shore parallel structures, which tend to have higher
profiles, are affected to a lesser extent. The number and length of shore parallel structures
impacted is 10% or less for sea level rise scenarios of 1 and 2 ft (0.3 and 0.6 m), but reaches
approximately 15% for 3 ft (0.9 m) of sea level rise and approximately 45% with 6 ft (1.8 m) of
sea level rise.
Table 12. Percent of privately-owned coastal structures (summarized by number and total length)
with elevations less than 1, 2, 3, and 6 feet above MHHW.
Water Level
(ft MHHW)
All Structures Shore Parallel Structures Groins/Jetties
Number Length Number Length Number Length
1 12% 8% 6% 5% 28% 23%
2 20% 13% 10% 9% 43% 36%
3 28% 21% 16% 15% 57% 49%
6 57% 50% 45% 45% 84% 80%

Mapping and Analysis of Privately-Owned Structures along the Massachusetts Shoreline March 31, 2013
Page 67 of 70
8 Summary and Conclusion
The Commonwealth of Massachusetts has approximately 1,115 miles (1,794 km) of ocean-
facing coastline containing a variety of engineering structures designed for shore protection and
stabilization. Many of these were built prior to modern coastal management policies and
regulations and until recently, no centralized database of coastal structures existed. For this
reason, RPS ASA was contracted to develop an inventory of privately-owned coastal
engineering structures for the Commonwealth’s ocean-facing coastline. The work is a
continuation of the Massachusetts Coastal Infrastructure Inventory and Assessment Project,
previous phases of which were conducted between 2002 and 2009. Project tasks included
“heads-up” digitizing of coastal structures, attribution of the mapped data (ownership, type,
materials, length, elevation, and height), and additional research to relate digitized structures to
publically available plans and permits. Coastal structures considered for this inventory included
shore-parallel features designed to prevent shoreline migration (seawalls, bulkheads,
revetments, and sand bags) as well as shore-perpendicular structures that restrict the
alongshore movement of sediment or stabilize channels (groins/jetties). Please note that some
structures identified in this inventory may not be considered functioning coastal engineering
structures under the Massachusetts Wetlands Protection Act regulations and local wetlands
bylaws. In summary:
Structure identification and attribution were completed using a variety of public data
sources. The project scope (extent) corresponds with the area mapped for recent
shoreline change analysis. Data from previous phases of the project were used to mask
the project area. Remotely sensed imagery and LiDAR were then used to identify
remaining coastal structures and assign elevations.
A total of 6,611 coastal structures not included in previous inventories of public
structures were digitized and assumed to be privately owned. This includes
approximately 196 miles (316 km) of shore-parallel structures and 34 miles (54 km) of
shore-perpendicular structures. The inventory of private coastal structures includes
2,967 bulkheads/seawalls; 1,660 revetments; 1,969 groins/jetties; and 15 sandbag
structures.
Mapped structures were compared to Chapter 91 license documents maintained by
MassDEP. Licenses that correspond with private structures were tabulated and linked to
the structures layer using a “many-to-many” relationship class.
All data is organized in a GIS database of privately-owned structures that is modeled on
and compatible with the databases generated for the previous phases.

Mapping and Analysis of Privately-Owned Structures along the Massachusetts Shoreline March 31, 2013
Page 68 of 70
The frequency and type of coastal structures is indicative of the physical processes that
shape the coast, the regional geomorphology, and the history of coastal development.
The Boston Harbor region (57 miles [92 km]) has the fewest structures, yet the highest
percentage of coastline protected (58%). By contrast, the Cape Cod and Islands region
(615 miles [990 km]) has the most structures, and the lowest percentage of coastline
protected (13%).
The mean (weighted by length) elevation of shore-parallel structures is approximately 12
feet (3.6 meters) NAVD88; shore-perpendicular structures (groins/jetties) average
approximately 6 feet (1.7 meters) NAVD88.
Considering both private and publically-owned structures, nearly 27% of Massachusetts’
ocean-facing shoreline is armored with some form of coastal protection. This figure does
not take into account an additional 67 miles (109 km) of structures that extend
perpendicular to the coastline.

Mapping and Analysis of Privately-Owned Structures along the Massachusetts Shoreline March 31, 2013
Page 69 of 70
9 References
Massachusetts Dept. of Transportation (MassDOT). (n.d.). Massachusetts Online Oblique
Imagery Viewer. Retrieved from MassDOT:
http://www.massdot.state.ma.us/planning/Main/MapsDataandReports/Maps/InteractiveM
aps/Pictometry.aspx
Massachusetts Office of Coastal Zone Management (MACZM). (2009). Inventory of Public
Seawalls and Other Structures. Retrieved from Coastal Zone Management:
http://www.mass.gov/czm/stormsmart/mitigation/infrastructure_reports.htm
Massachusetts Office of Coastal Zone Management (MACZM). (2013). Massachusetts
Shoreline Change Project. Retrieved from Coastal Zone Management:
http://www.mass.gov/czm/hazards/shoreline_change/shorelinechangeproject.htm
Massachusetts Office of Coastal Zone Management (MACZM). (n.d.). The MACZM Regional
Offices. Retrieved from Coastal Zone Management:
http://www.mass.gov/czm/regions.htm
MassGIS. (2008). MassGIS Data - Massachusetts Coastal Zone Management Agency
(MACZM) Regions. Retrieved from MassGIS: http://www.mass.gov/anf/research-and-
tech/it-serv-and-support/application-serv/office-of-geographic-information-
massgis/datalayers/regczm.html
MassGIS. (2010). MassGIS Data - Legacy Level 0 and Level 2 Assessors' Parcels. Retrieved
from MassGIS: http://www.mass.gov/anf/research-and-tech/it-serv-and-
support/application-serv/office-of-geographic-information-
massgis/datalayers/parcels.html
MassGIS. (2012). MassGIS Data - LiDAR Terrain Data. Retrieved from MassGIS:
http://www.mass.gov/anf/research-and-tech/it-serv-and-support/application-serv/office-
of-geographic-information-massgis/datalayers/lidar.html
MassGIS. (2013). MassGIS Data - Level 3 Assessors' Parcel Mapping. Retrieved from
MassGIS: http://www.mass.gov/anf/research-and-tech/it-serv-and-support/application-
serv/office-of-geographic-information-massgis/datalayers/l3parcels.html
Microsoft Corporation. (2013). Bing Maps. Retrieved from Bing: http://www.bing.com/maps/
NOAA. (2012). VDatum Version 3.1. Retrieved from NOAA: Vertical Datum Transformation:
http://vdatum.noaa.gov/

Mapping and Analysis of Privately-Owned Structures along the Massachusetts Shoreline March 31, 2013
Page 70 of 70
Rahmstorf, S. (2006). A semi-empirical approach to projecting future sea-level rise. Science,
315, 368-370.
Ramsey, J.S., S.F. Griffee, M.S. Osler, M.R.Byrnes. (2005). South Shore Coastal Hazards
Characterization Atlas Description of Variables.
Sallenger, Asbury H., Doran, Kara S., & Howd, Peter A. (2012). Hotspot of accelerated sea-
level rise on the Atlantic coast of North America. Nature Climate Change, 2(12), 884-
888.
US Army Corps Of Engineers (2002). Coastal Engineering Manual. Washington, DC, (EM 1110-
2-1100).
U.S. Geological Survey (USGS). (2012). MassGIS Data - USGS Color Ortho Imagery
(2008/2009). Retrieved from MassGIS: http://www.mass.gov/anf/research-and-tech/it-
serv-and-support/application-serv/office-of-geographic-information-
massgis/datalayers/colororthos2008.html