building up demand-oriented charging infrastructure for ...€¦ · building up demand-oriented...
TRANSCRIPT

Building Up Demand-Oriented Charging
Infrastructure for Electric Vehicles in Germany
mobil.TUM 2016
6-7 June 2016, Munich, Germany
Tamer Soylu, John Anderson, et al.

LADEN2020
mobil.TUM 2016 • Slide 2
Objective: • Development of a systematically comprehensible and consistent strategy to
build a charging infrastructure for E-Vehicles in Germany.
• Main assumption: 1 Million registered E-Vehicles by 2020.
Projekt Partners: • DLR
• Insitut für Fahrzeugkonzepte (FK) • Institut für Verkehrsforschung (VF)
• KIT • Institute for Transport Studies (IfV)
Funding Institution:
• Federal Ministry for Economic Affairs and Energy

Long-distance travel – Charging infrastructure
mobil.TUM 2016 • Slide 3

Long Distance Travel – Charging Infrastructure:
Methodology
mobil.TUM 2016 • Slide 4
• Usage patterns of conventional
vehicles
• Trip length distributions of long
distance trips by car
• Calculation of different travel
demand levels with respect to
temporal effects (different days of
the week, holidays etc.)
Car use model of conventional vehicles in LD-travel
• Spatial as well as temporal resolution and distribution of travel demand
• Network characteristics
• Assignment of the total demand for charging on the LD-network (no commuting)
Traffic Assigment
on a network model
• Scenarios for the future fleet of electric vehicles (shares of BEVs / PHEVs, etc…)
• Vehicle and charging infrastructure characteristics (ranges, capacities of batteries, charging durations, charging currents, …)
Characteristics of future
Electromobility
Estimation of the
charging demand and spatial
assignment of charging infrastructure

Network and Traffic Model
Data:
• VALIDATE (PTV Group)
fine-scaled zone and network-
model
• about 10.000 traffic zones
• about 2 Mio. nodes
• Demand on workdays
(Tuesday – Thursday)
• ca. 120 Mio. car-trips
• ca. 8 Mio. O-D-relations
Car Usage Patterns and Long Distance Travel Demand

Car Usage Patterns and Long Distance Travel Demand
• Effects of seasonality on travel demand (Weekday vs. Weekend):
0
0,5
1
1,5
2
2,5
3
3,5
4
50 - 100 100 - 150150 - 200200 - 250250 - 300300 - 350350 - 400400 - 500 > 500
VALIDATE (Tu - Th) CUMILE (Fri -Sun)
Input data for Travel Demand Modelling: • Trip Length distributions from:
• VALIDATE, MOP and CUMILE • Different temporal resolution Solution: • Scaling factors for the demand on
weekends and holiday seasons are calculated
Trip Length Distribution on Weekdays and Weekends –
Results of two different data sources
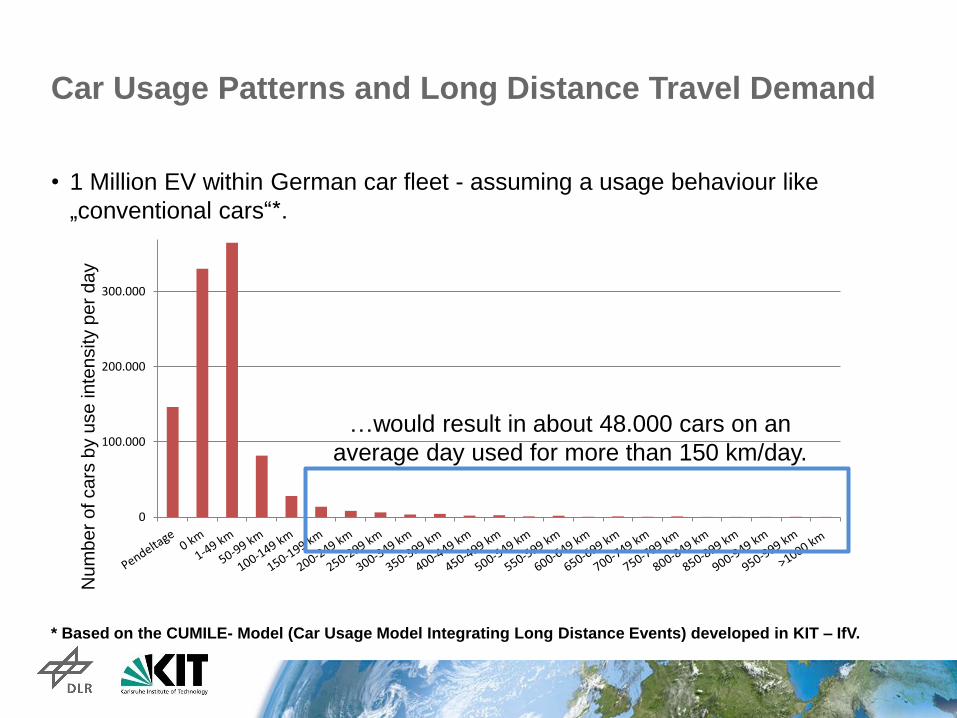
• 1 Million EV within German car fleet - assuming a usage behaviour like
„conventional cars“*.
* Based on the CUMILE- Model (Car Usage Model Integrating Long Distance Events) developed in KIT – IfV.
Car Usage Patterns and Long Distance Travel Demand
0
100.000
200.000
300.000
Nu
mb
er
of ca
rs b
y u
se
in
ten
sity p
er
da
y
…would result in about 48.000 cars on an
average day used for more than 150 km/day.

Determining Charging Demand and Allocation of
Infrastructure
• Input data:
• Assumption: 1 Mio. E-vehicles (1/3 BEV, 2/3 PHEV)
• Assumptions:
• BEV: 200 km range
• PHEV: 40 km electric range
• State of Charge (SOC): 100 % at start
• Recharging required at 20 % SOC
• Fast charging up to 80 % of capacity within 30 minutes
• BEV:
• PHEV:
Combustion Mode Electric Mode
100% 80% 80% 80%
160 km
20% 20% 20%
120 km 120 km
20% 80% 30 km 250 km

Determining Charging Demand and Allocation of
Infrastructure
• Simulation

• Translation of Charging Demand into
Infrastructure Demand:
• Illustration of Charging Events as Charging
Density:
• 𝐶𝐷 = # 𝐶ℎ𝑎𝑟𝑔𝑖𝑛𝑔 𝐸𝑣𝑒𝑛𝑡𝑠
100 𝑘𝑚
Determining Charging Demand and Allocation of
Infrastructure
<0:1
5
<1:0
0
<1:4
5
<2:3
0
<3:1
5
<4:0
0
<4:4
5
<5:3
0
<6:1
5
<7:0
0
<7:4
5
<8:3
0
<9:1
5
<10
:00
<10
:45
<11
:30
<12
:15
<13
:00
<13
:45
<14
:30
<15
:15
<16
:00
<16
:45
<17
:30
<18
:15
<19
:00
<19
:45
<20
:30
<21
:15
<22
:00
<22
:45
<23
:30
Temporal Distribution of Network Utilization and Trip Lengths
Ü50 Ü100 Ü150 Ü200 Ü250 Ü300
Red = Equally distributed demand (share of about 8 %
of daily total demand over a duration of roughly 10
hours)

• Effect of various BEV Ranges on
infrastructure demand:
Determining Charging Demand and Allocation of
Infrastructure
0
5000
10000
15000
20000
25000
30000
35000
150km 200km 250km 300km PHEV
Number of Charging Events on High- and Federalways
(~8% of total daily demand, 3 weighting factors)
VALIDATE F1 (MOP-VALIDATE Tue-Thu)
F2 (MOP-VALIDATE Weekend) F3 (Seldom Events)
• Continuous Count Stations and Annual
Profiles

Daily travel – Charging infrastructure
mobil.TUM 2016 • Slide 12

Daily travel – Charging infrastructure:
Methodology
mobil.TUM 2016 • Slide 13
Assumptions
• Mass market by 2020
• Charging occurs when cars park
• No change in activity and travel patterns

Daily travel – Charging infrastructure:
Methodology
mobil.TUM 2016 • Slide 14
16,000 x ICE
16,000 x BEV
Assumptions
• Mass market by 2020
• Charging occurs when cars park
• No change in activity and travel patterns
(MiD 2008, KiD 2010)
16,000 x PHEV
Vehicle trip diary
Charging algorithm Charging demand Preference, location,
accessibility, speed,
daily travel
1 million EVs

0
50000
100000
150000
200000
250000
300000
350000
400000
Monday Tuesday Wednesday Thursday Friday Saturday Sunday
Home, private
Other, public
Other, semi-public
Other, private
Shopping, public
Shopping, semi-public
Work, semi-public
Work, private
Fast
Results: Occupancy of charging infrastructure by
EVs throughout the week
mobil.TUM 2016 • Slide 15 N
o.
EV
s

0
5000
10000
15000
20000
25000
30000
35000
40000
Monday Tuesday Wednesday Thursday Friday Saturday Sunday
Other, public
Other, semi-public
Other, private
Shopping, public
Shopping, semi-public
Work, semi-public
Work, private
Fast
Results: Occupancy of charging infrastructure by
EVs throughout the week – absent home charging
mobil.TUM 2016 • Slide 16 N
o.
EV
s

mobil.TUM 2016 • Slide 17
Scenario comparison:
Reference scenario and sensitivity analysis
Speed Location Reference Scenario
667,000 BEVs 333,000 PHEVs
Charging at home & work
Range +50%: BEV 300 km PHEV 60 km
Normal Semi-public 22 14 13 17
Normal Public 14 9 69 12
Fast Daily travel 2 4 1 1
Fast Long-distance travel
3 5 3 2
Number of charging points (values in 1,000)

Karlsruhe Institute of Technology
Institute for Transport Studies
German Aerospace Center
Institute of Transport Research
mobil.TUM 2016 • Slide 18